barclays ceo energy/power conference presented by paul...
TRANSCRIPT

1
Barclays CEO Energy/Power ConferencePresented by Paul Hanrahan, President & CEO
September 10, 2009
2
Contains Forward Looking Statements
Safe Harbor Disclosure
Certain statements in the following presentation regarding AES’s business operations may constitute “forward-looking statements.” Such forward-looking statements include, but are not limited to, those related to future earnings growth and financial and operating performance. Forward-looking statements are not intended to be a guarantee of future results, but instead constitute AES’s current expectations based on reasonable assumptions. Forecasted financial information is based on certain material assumptions. These assumptions include, but are not limited to accurate projections of future interest rates, commodity prices and foreign currency pricing, continued normal or better levels of operating performance and electricity demand at our distribution companies and operational performance at our generation businesses consistent with historical levels, as well as achievements of planned productivity improvements and incremental growth from investments at investment levels and rates of return consistent with prior experience. For additional assumptions see the Appendix to this presentation. Actual results could differ materially from those projected in our forward-looking statements due to risks, uncertainties and other factors. Important factors that could affect actual results are discussed in AES’s filings with the Securities and Exchange Commission including but not limited to the risks discussed under Item 1A “Risk Factors” in the Company’s Annual Report on Form 10-K for the year ended December 31, 2008, as well as our other SEC filings. AES undertakes no obligation to update or revise any forward-looking statements, whether as a resultof new information, future events or otherwise.
3
Contains Forward Looking Statements
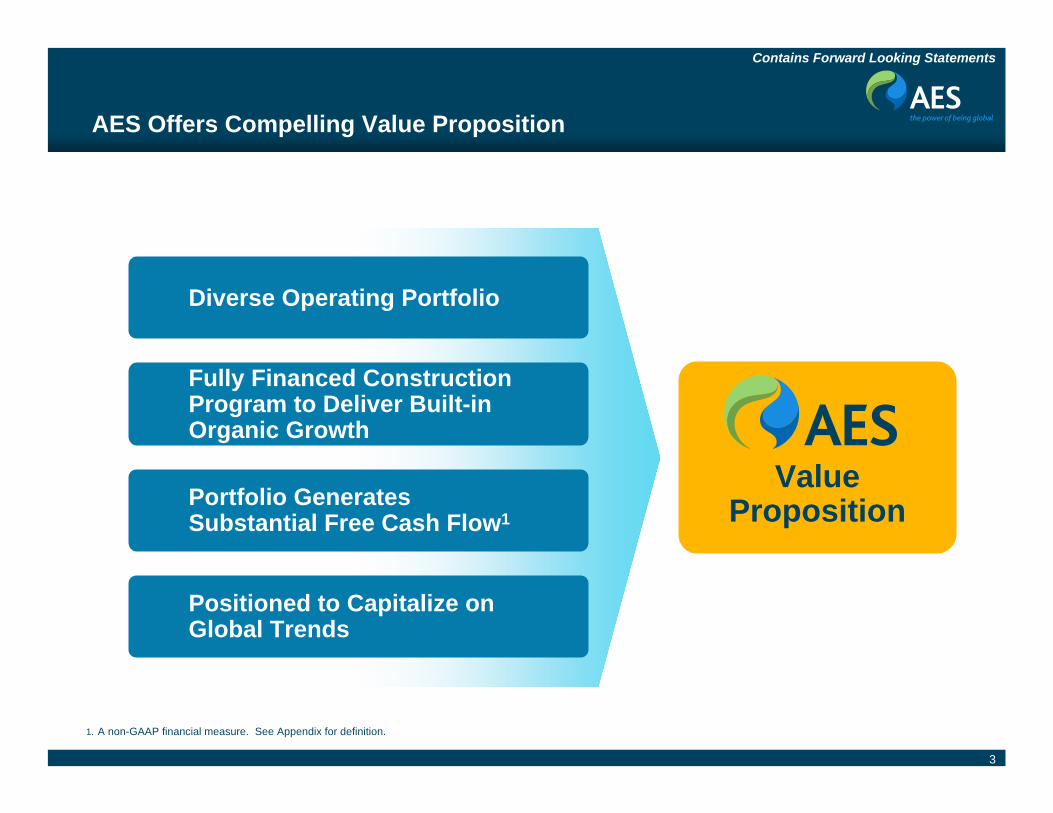
AES Offers Compelling Value Proposition
1. A non-GAAP financial measure. See Appendix for definition.
Diverse Operating Portfolio
Positioned to Capitalize on Global Trends
Fully Financed Construction Program to Deliver Built-in Organic Growth
Portfolio Generates Substantial Free Cash Flow1
Value Proposition

4
Contains Forward Looking Statements
Global Operations, Under Construction & Development
Brazil
Chile
Colombia
Dominican Republic
PanamaEl Salvador
Mexico
France
Argentina
Spain
Bulgaria
TurkeyNetherlands
Hungary
Czech RepublicUkraine
Kazakhstan
NigeriaCameroon
China
Oman
IndiaPakistan
Qatar
Sri Lanka
Philippines
KEY AES PresenceAES Headquarters
U.S.
U.K.

5
Contains Forward Looking Statements
Global Operations, Under Construction & Development
Brazil
Chile
Colombia
Dominican Republic
PanamaEl Salvador
Mexico
France
Argentina
Spain
Bulgaria
TurkeyNetherlands
Hungary
Czech RepublicUkraine
Kazakhstan
NigeriaCameroon
China
Oman
IndiaPakistan
QatarJordan
Sri Lanka
Philippines
KEY AES Presence Facilities Under ConstructionAES Headquarters
U.S.
U.K.

6
Contains Forward Looking Statements
Global Operations, Under Construction & Development
Brazil
Chile
Colombia
Dominican Republic
PanamaEl Salvador
Mexico
France
Argentina
U.K.
Spain
Bulgaria
TurkeyNetherlands
Hungary
Czech RepublicUkraine
Kazakhstan
NigeriaCameroon
China
Oman
IndiaPakistan
QatarJordan
Sri Lanka
Philippines
KEY AES Presence Facilities Under ConstructionAES Headquarters Projects Under Development
U.S.
Vietnam
ItalyGreece
Trinidad & Tobago
Australia

7
Contains Forward Looking Statements
Diverse Operating Portfolio: Geographic & Line of Business Diversification Reduces Risk
2008 Proportional Gross Margin1
($2.3 Billion)
3%
11%
11%
26%
32%
11%
6%Latin America Generation
Latin America Utilities
North AmericaUtilities
Others
North America Generation
Europe Generation
Asia Generation
1. A non-GAAP financial measure. See Appendix for definition and reconciliation.
65%
35%
Generation ($1.5 Billion)
Utilities ($0.8 Billion)
2008 Proportional Gross Margin1
($2.3 Billion)

8
Contains Forward Looking Statements
25%
41%
34%
23%
47%
30%
22%
51%
27%
2009 2010 2011
Utilities Long-Term Contracts Merchant
Diverse Operating Portfolio: High Percentage of Margins From Contracted Businesses and Regulated Utilities
Note: See Appendix for key assumptions and sensitivities.1. A non-GAAP financial measure. See Appendix for definition and reconciliation. 2. A Long-Term Contract Business is defined as having greater than 75% of both its revenue stream and fuel commodity expense substantially hedged under contracts extending for a
minimum of the next 3 years (through December 2011).
2009-2011 Proportional Gross Margin1
70% 73%66%
22
Approximately 70% of proportional gross margin is attributable to long-term contracts and utilities (less commodity sensitive)
Percentage of proportional gross margin from long-term contract businesses increases as projects under construction come on-line
Guidance Given on May 27, 2009
9
Contains Forward Looking Statements
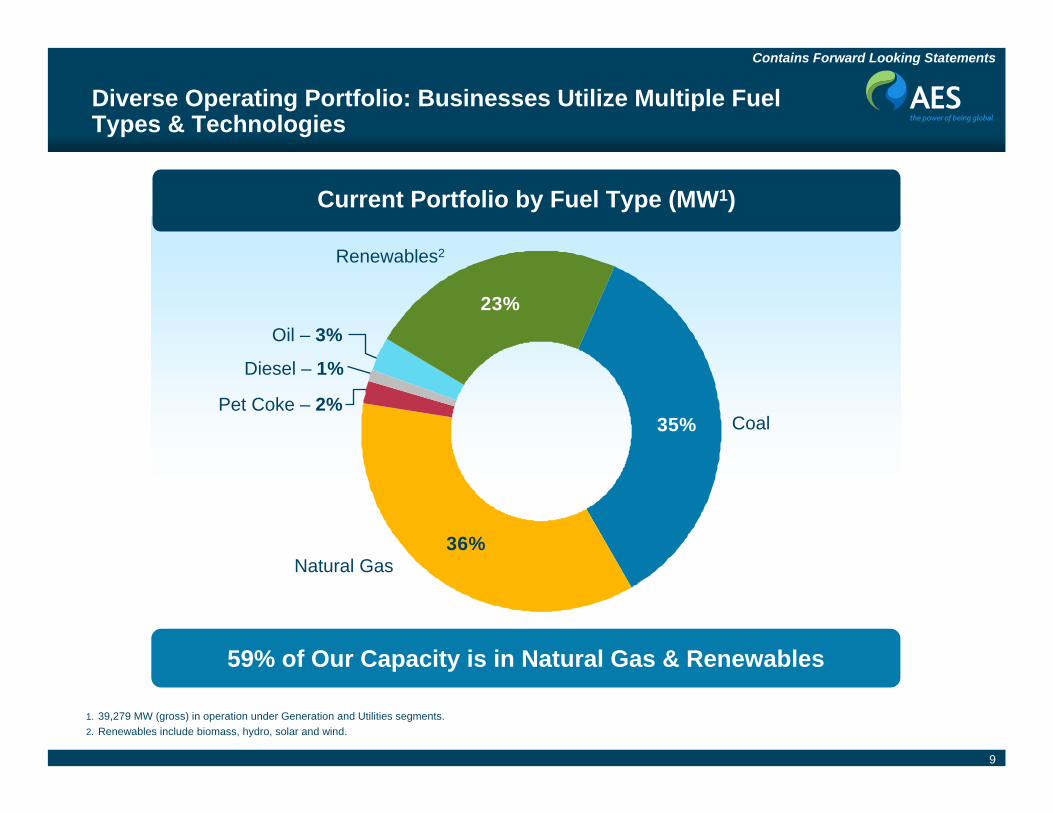
Current Portfolio by Fuel Type (MW1)
Diverse Operating Portfolio: Businesses Utilize Multiple Fuel Types & Technologies
1. 39,279 MW (gross) in operation under Generation and Utilities segments. 2. Renewables include biomass, hydro, solar and wind.
59% of Our Capacity is in Natural Gas & Renewables
35%
36%
23%
Natural Gas
Renewables2
CoalPet Coke – 2%
Diesel – 1%
Oil – 3%

10
Contains Forward Looking Statements
Majority of Utility Businesses Concentrated in Two Countries with Established Regulatory Frameworks
1. A non-GAAP financial measure. See Appendix for definition and reconciliation.
2008 Proportional Gross Margin1
from Utility Segment($0.8 Billion)
9%
28%
32%
31%
IPALCO
Eletropaulo
Others
Regulated businesses primarily with long-term concessions
14 utilities, including 4,419 MW generation capacity
Three largest utilities represent more than 90% of 2008 Utility segment proportional gross margin
Eletropaulo and Sul in Brazil
IPALCO in the U.S.
Sul

11
Contains Forward Looking Statements
Built-in Growth: 3,500 MW1 Construction Program is Fully Financed
4241,057
2,520633
1,463
1,011
2009 2010 2011
MW to be Brought On-Line During the YearCumulative MW On-Line Since May 2009
2,520
3,5311
Additional MW On-Line by Year Construction Program by Geography (MW)
1,057
1. Total includes 270 MW Campiche project in Chile. Construction of this project has been stopped and may not resume until a solution is found to resolve the permitting issue.
Bulgaria, 25%
96% of the Construction Program is Contracted Under Long-Term Contracts
Construction Program to Contribute $0.25 EPS and $300-$400 Million Proportional Free Cash Flow in 2011
Cameroon, 3%
Chile, 37%
China, 6%
France, 2%
Jordan, 12%
Northern Ireland, 2%Panama, 7%
Scotland, 1%Turkey, 2%
U.S. 3%
12
Contains Forward Looking Statements
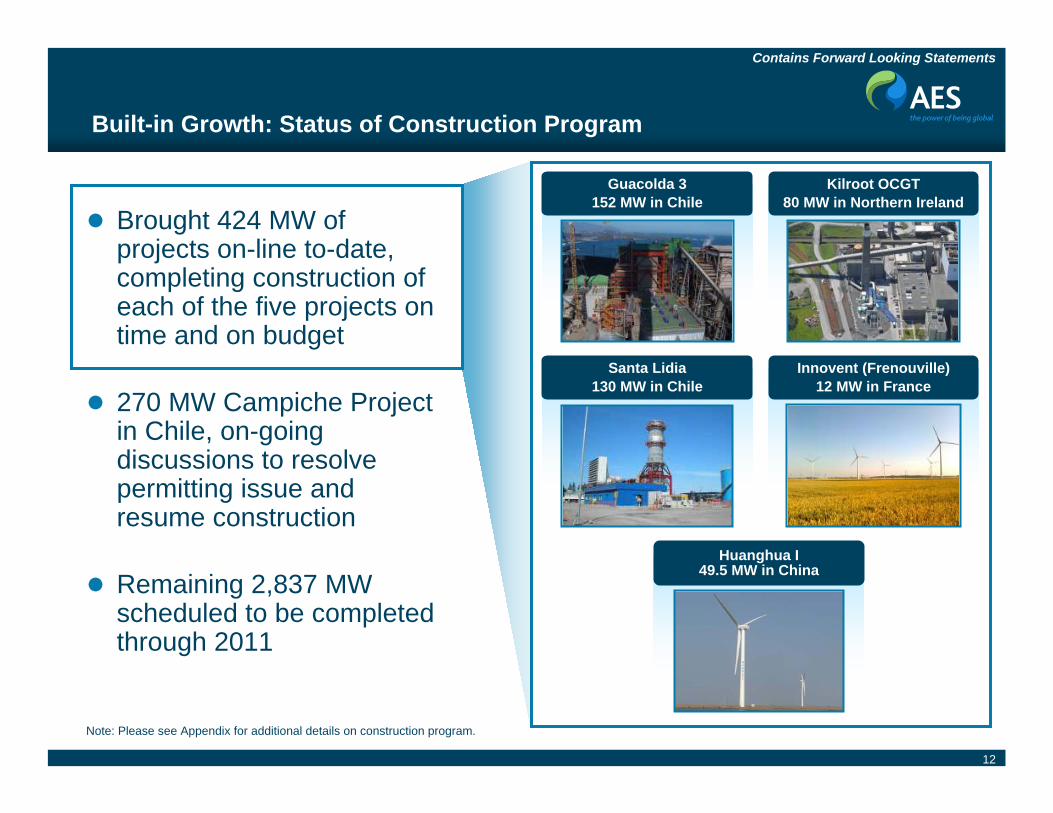
Huanghua I49.5 MW in China
Santa Lidia 130 MW in Chile
Innovent (Frenouville) 12 MW in France
Built-in Growth: Status of Construction Program
Note: Please see Appendix for additional details on construction program.
Guacolda 3 152 MW in Chile
Kilroot OCGT 80 MW in Northern Ireland
Brought 424 MW of projects on-line to-date, completing construction of each of the five projects on time and on budget
270 MW Campiche Project in Chile, on-going discussions to resolve permitting issue and resume construction
Remaining 2,837 MW scheduled to be completed through 2011

13
Contains Forward Looking Statements
$750-$850 $900-$1,100
$1,100-$1,300
2009 2010 2011
1. A non-GAAP financial measure. See Appendix for definition and reconciliation.2. Based on mid-range proportional free cash flow from 2009-2011.3. 2009 guidance updated on August 7, 2009; 2010-2011 guidance given on May 27, 2009.
Portfolio Generates Growing Proportional Free Cash Flow1: 22% CAGR2
Proportional Free Cash Flow1,3
$ in Millions

14
Contains Forward Looking Statements
$1.05-$1.10 $1.05-$1.15$1.20-$1.30
2009 2010 2011
1. A non-GAAP financial measure. See Appendix for definition and reconciliation.2. 2009 guidance updated on August 7, 2009; 2010-2011 guidance given on May 27, 2009.
Adjusted EPS1,2
2010-2011 EPS Projections are Based on Forward FX & Commodity Rates as of March 31, 2009
Earnings Growth is Largely Driven by the Construction Program

15
Contains Forward Looking Statements
Global Trends, Risks & Opportunities
Aging Infrastructure Needs Replacement (OECD)
Rapid Electricity DemandGrowth (Emerging
Economies)
Environmental SustainabilityConcerns
Global Economic Recession
Challenging Capital Markets
Continued Need for Investment in New
Generating Capacity
Government Initiatives for Renewable Energy
Reduced Demand inShort Term
Depressed Commodity and Merchant Power Prices
Challenging Project Finance Markets
Challenging AssetSales Markets

16
Contains Forward Looking Statements
Electricity Demand Growth (2006–2030)
Global Demand for Electricity Projected to Grow: AES Has Presence & Knowledge of Local Power Sector in Regions with Highest Growth
Source: International Energy Agency: World Energy Outlook 2008.
0%
1%
2%
3%
4%
5%
6%
7%
8%
OECD Russia Brazil Africa Middle East China Indonesia India
2006–20152006–2030
Global capacity additions are predicted to grow at a 2.3% CAGR over the next 20 years
Non-OECD generation additions are expected to grow at a 3.3% CAGR
AESPresence

17
Contains Forward Looking Statements
$7 Trillion Investment Projected to Be Made Through 2030
Global Projected Capacity Additions in GW (2007–2030)
1,621
296
1,951
238 150 270
4,528
0
1,000
2,000
3,000
4,000
5,000
OECD E. Europe/Eurasia
Asia Middle East Africa Latin America Total
AESPresence
Source: International Energy Agency: World Energy Outlook 2008.
65% of the additional capacity is expected to be added in non-OECD countries
For example, India is expected to triple its installed capacity by 2017
18
Contains Forward Looking Statements
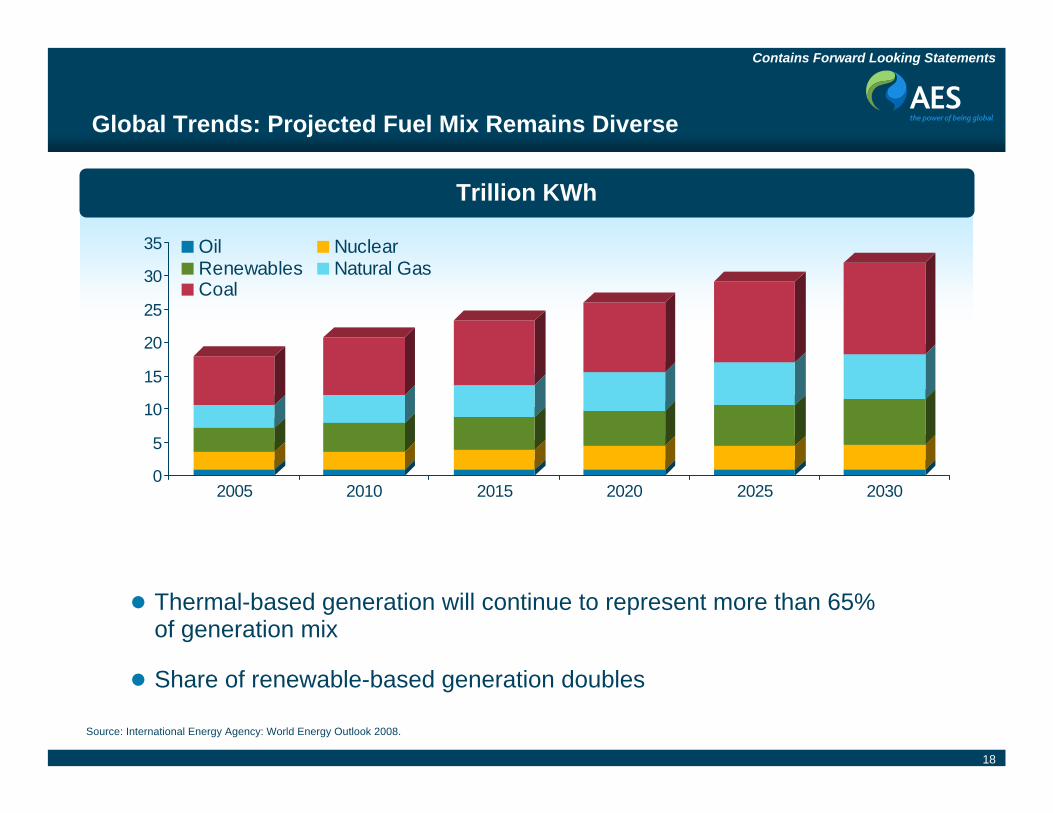
Global Trends: Projected Fuel Mix Remains Diverse
Source: International Energy Agency: World Energy Outlook 2008.
Trillion KWh
0
5
10
15
20
25
30
35
2005 2010 2015 2020 2025 2030
Oil NuclearRenewables Natural GasCoal
Thermal-based generation will continue to represent more than 65% of generation mix
Share of renewable-based generation doubles

19
Contains Forward Looking Statements
American Recovery & Reinvestment Act expands financing options
Introduced Investment Tax Credit (ITC) –Gives option to apply for cash grant
– AES raised $221 million financing for Armenia Mountain wind farm in PA
Introduced Loan Guarantee Program through Department of Energy
Extended Production Tax Credit (PTC) through 2012
American Clean Energy & Security Act by the House in June 2009
Senate to review in fall 2009
Creates potential market for carbon offsets
U.S. Legislation Promotes Renewables & Climate Solutions Business Opportunities

20
Contains Forward Looking Statements
Our Strategy Aligns with Global Trends
SolarWindCore Power
Hydro Climate Solutions
21
Contains Forward Looking Statements
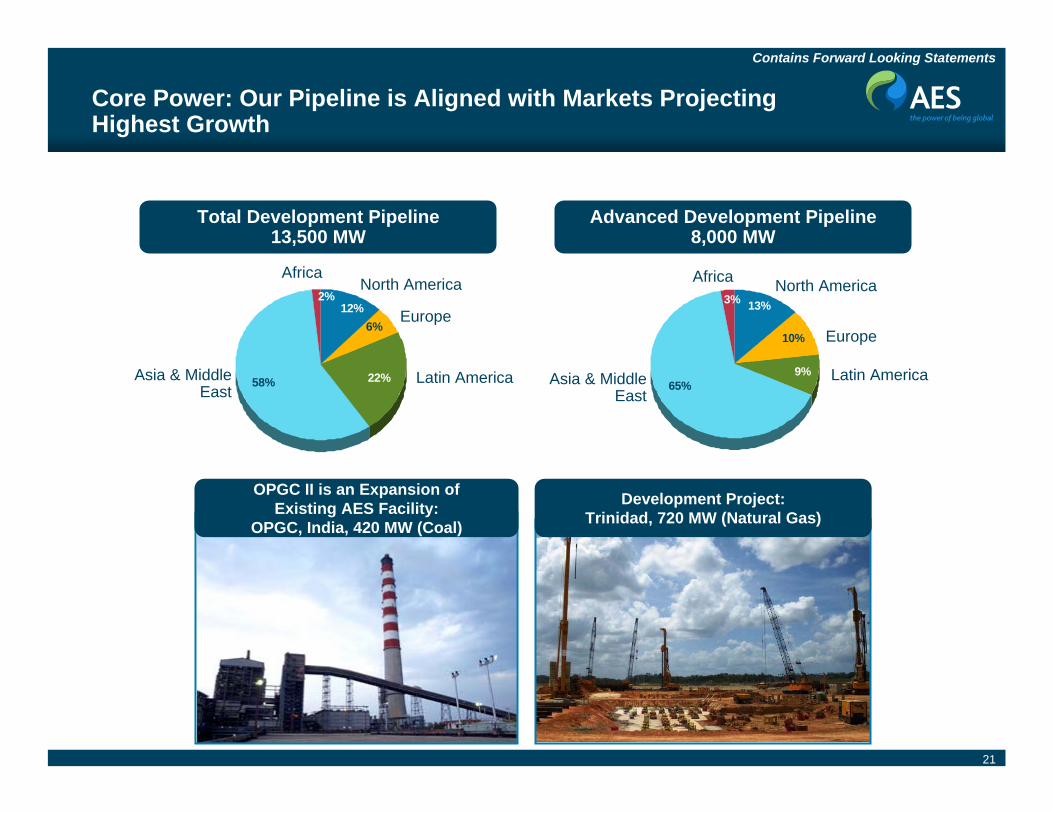
58% 22%
12%6%
2%
Development Project:Trinidad, 720 MW (Natural Gas)
OPGC II is an Expansion ofExisting AES Facility:
OPGC, India, 420 MW (Coal)
Core Power: Our Pipeline is Aligned with Markets Projecting Highest Growth
Total Development Pipeline13,500 MW
9%
13%
10%
3%
65%
Advanced Development Pipeline8,000 MW
North America
Europe
Latin AmericaAsia & Middle East
AfricaNorth America
Europe
Latin AmericaAsia & Middle East
Africa
22
Contains Forward Looking Statements
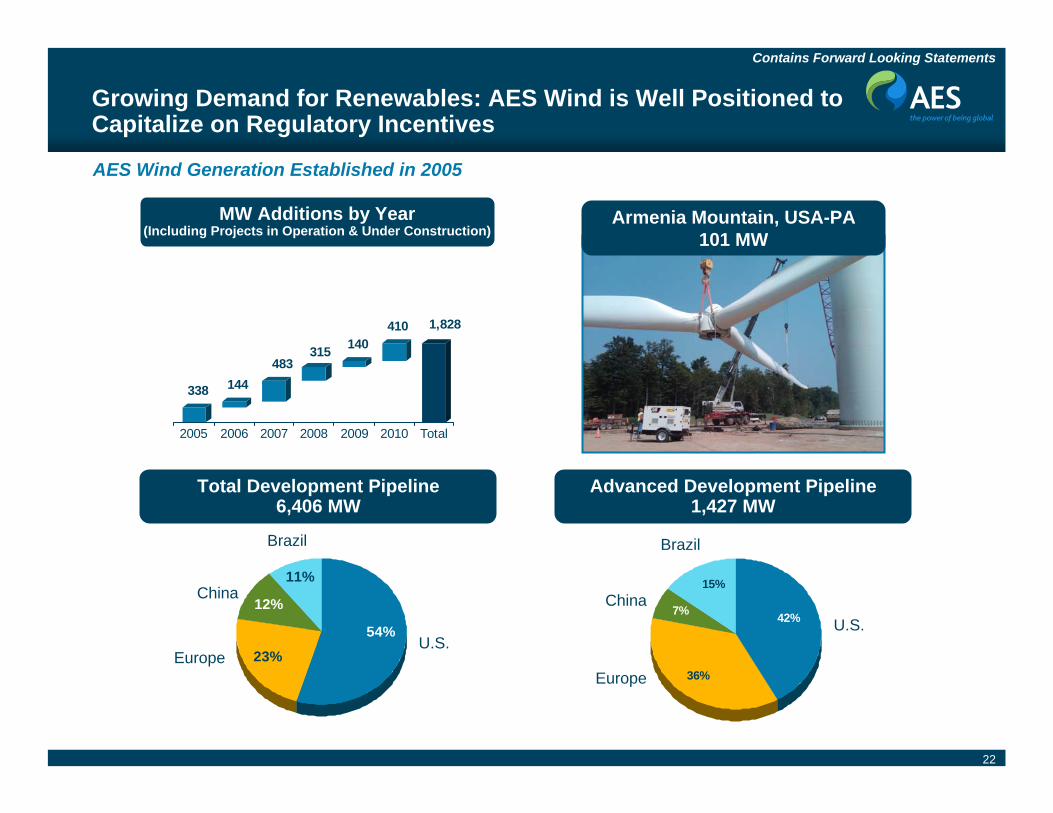
Growing Demand for Renewables: AES Wind is Well Positioned to Capitalize on Regulatory Incentives
AES Wind Generation Established in 2005
23%
12%
11%
54%
Total Development Pipeline6,406 MW
U.S.Europe
China 15%
7%
36%
42%
Advanced Development Pipeline1,427 MW
U.S.
BrazilBrazil
Europe
China
338 144483
315 140410 1,828
2005 2006 2007 2008 2009 2010 Total
MW Additions by Year(Including Projects in Operation & Under Construction)
Armenia Mountain, USA-PA101 MW

23
Contains Forward Looking Statements
Global Solar Based Generation Capacity to Triple in Next Four Years: AES Solar is Focused on Key Growth Markets
Darro, Spain 6 MW
$1 Billion JV with Riverstone 32 MW in operations in Spain
Total Development Pipeline860 MW
Advanced Development Pipeline520 MW
Bulgaria, 22%
France, 6%
Greece, 2%India, 3%Italy, 60%
U.S. , 7% Bulgaria, 14%
India, 1%
Southern Europe, 85%
AES Solar Established in 2008
24
Contains Forward Looking Statements
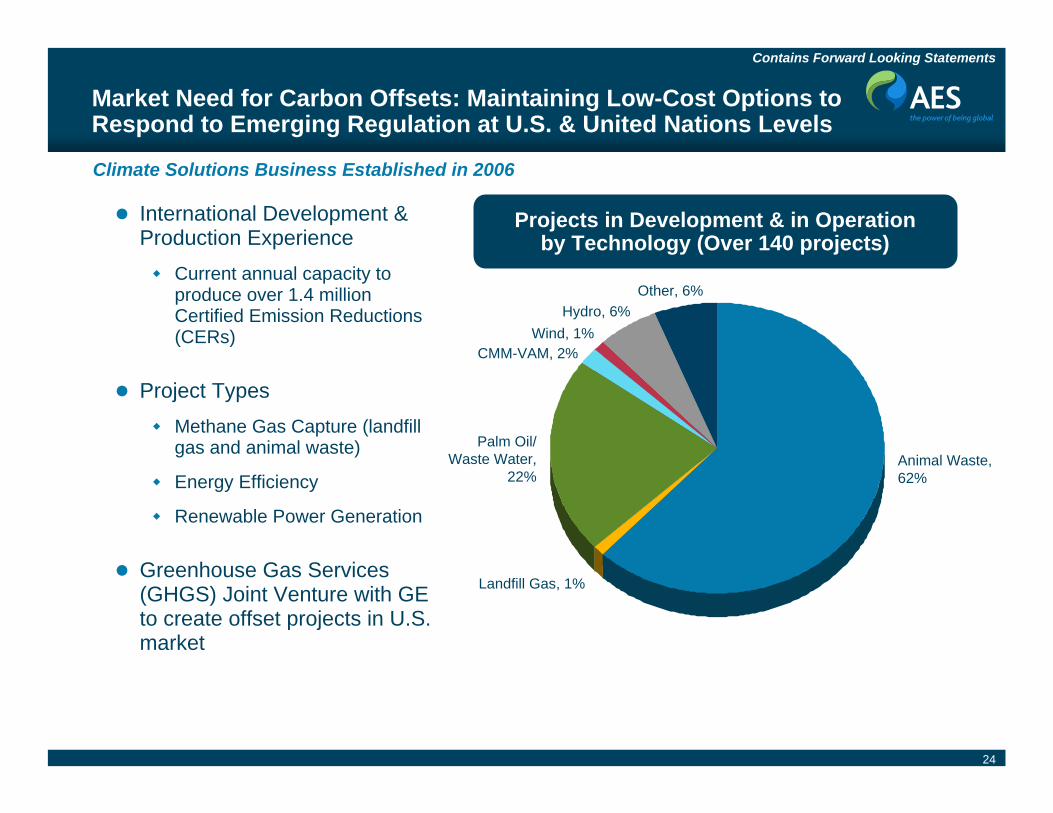
Market Need for Carbon Offsets: Maintaining Low-Cost Options to Respond to Emerging Regulation at U.S. & United Nations Levels
Projects in Development & in Operation by Technology (Over 140 projects)
Animal Waste,62%
Palm Oil/Waste Water,
22%
Other, 6%
Landfill Gas, 1%
CMM-VAM, 2%
Hydro, 6%
International Development & Production Experience
Current annual capacity to produce over 1.4 million Certified Emission Reductions (CERs)
Project TypesMethane Gas Capture (landfill gas and animal waste)
Energy Efficiency
Renewable Power Generation
Greenhouse Gas Services (GHGS) Joint Venture with GE to create offset projects in U.S. market
Wind, 1%
Climate Solutions Business Established in 2006
25
Contains Forward Looking Statements
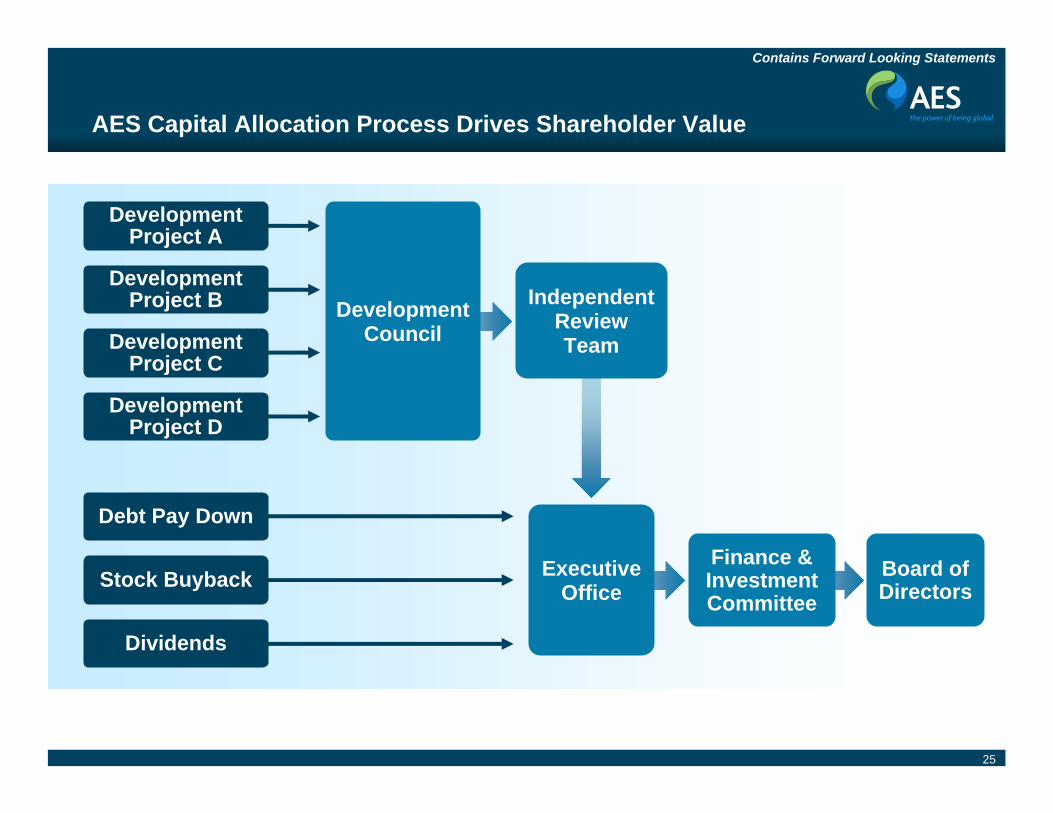
AES Capital Allocation Process Drives Shareholder Value
Development Project A
Development Project B
Development Project C
Development Project D
Independent ReviewTeam
Finance & Investment Committee
ExecutiveOffice
Debt Pay Down
Stock Buyback
Dividends
DevelopmentCouncil
Board of Directors

26
Contains Forward Looking Statements
AES Value Proposition
Diversified Portfolio
Ability to capitalize on platform of multiple geographies and fuel typesMix of regulated Utilities and unregulated Generation businesses
Attractive Growth in Near-Term Earnings and Free Cash Flow
Driven by largely contracted and fully financed construction program
Well Positioned to Benefit From Global Trends
Global presence in key markets Experience in various fuel types and technologies
Core powerRenewablesCarbon offsets

27
Contains Forward Looking Statements
Appendix
Currency & Commodity Sensitivities and Assumptions Slide 28
2009-2011 Guidance Slide 29
Construction Program Slide 30
Non-Recourse Debt Maturities 2009-2011 Slide 31-33
Recourse Debt Maturities 2009-2011 Slide 34
Top 10 Subsidiary Distributions Slide 35
Strong Liquidity & Manageable Debt Profile Slide 36
Reconciliations Slide 37-42
Definitions & Assumptions Slide 43-45

28
Contains Forward Looking Statements
Currency & Commodity Sensitivities and Assumptions
100 bps move in interest rates is equal to change in EPS of approximately $0.01-$0.02Interest Rates
10% appreciation in USD against the following key currencies is equal to the following negative EPS impacts:
Currencies
Commodity Sensitivity
Note: All sensitivities are provided on a standalone basis, assuming no change in the other factors, and reflect the estimated year-to-go impact on 2009 Adjusted EPS. Actual results may differ from the sensitivities provided.1. 2009 guidance is based on currency and commodity forward curves as of 6/30/09. 2. 2010-2011 guidance is based on currency and commodity forward curves as of 3/31/09.
July 2009-December 20091 Full Year 20112
Average Rate Sensitivity Average Rate Sensitivity
Brazilian Real (BRL) 1.96 $0.01 2.46 $0.04
Colombian Peso (COP) 2,144 $0.005 2,852 $0.01
Euro (EUR) 0.71 $0.005 0.75 $0.03
Argentine Peso (ARS) 3.99 $0.005 6.34 $0.02
July 2009-December 20091 Full Year 20112
Average Rate Sensitivity Average Rate SensitivityNewcastle Coal (Sensitivity $10/ton) negative correlation $71/ton
($0.01)$76/ton
($0.07) NYMEX Coal (Sensitivity $10/ton) negative correlation $47/ton $63/ton
NYMEX Crude Oil (Sensitivity $10/barrel) positive correlation $71/barrel $0.01 $67/barrel $0.06
Henry Hub Natural Gas (Sensitivity $1/mmbtu) positive correlation $4.5/mmbtu $0.01 $6.7/mmbtu $0.06
Certified Emission Credits (CERs) ($5/tonne) positive correlation €12/tonne $0.01 €11/tonne $0.01
29
Contains Forward Looking Statements
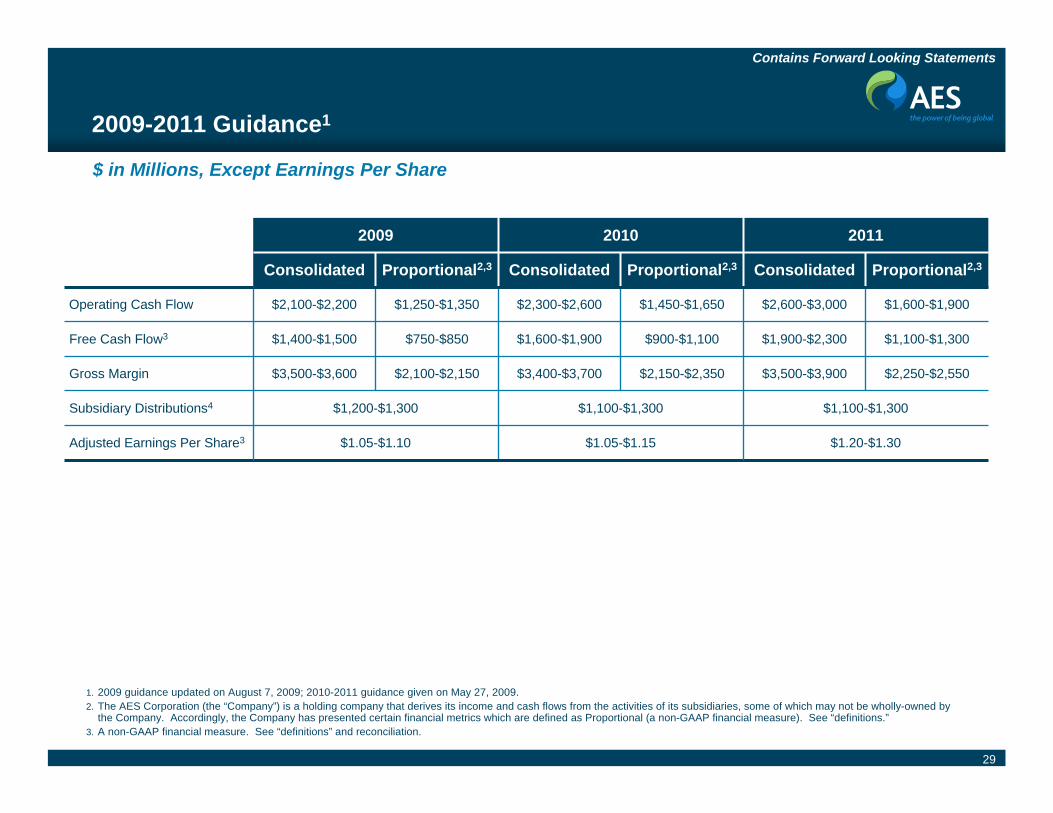
2009-2011 Guidance1
2009 2010 2011
Consolidated Proportional2,3 Consolidated Proportional2,3 Consolidated Proportional2,3
Operating Cash Flow $2,100-$2,200 $1,250-$1,350 $2,300-$2,600 $1,450-$1,650 $2,600-$3,000 $1,600-$1,900
Free Cash Flow3 $1,400-$1,500 $750-$850 $1,600-$1,900 $900-$1,100 $1,900-$2,300 $1,100-$1,300
Gross Margin $3,500-$3,600 $2,100-$2,150 $3,400-$3,700 $2,150-$2,350 $3,500-$3,900 $2,250-$2,550
Subsidiary Distributions4 $1,200-$1,300 $1,100-$1,300 $1,100-$1,300
Adjusted Earnings Per Share3 $1.05-$1.10 $1.05-$1.15 $1.20-$1.30
1. 2009 guidance updated on August 7, 2009; 2010-2011 guidance given on May 27, 2009.2. The AES Corporation (the “Company”) is a holding company that derives its income and cash flows from the activities of its subsidiaries, some of which may not be wholly-owned by
the Company. Accordingly, the Company has presented certain financial metrics which are defined as Proportional (a non-GAAP financial measure). See “definitions.”3. A non-GAAP financial measure. See “definitions” and reconciliation.
$ in Millions, Except Earnings Per Share

30
Contains Forward Looking Statements
3,107 MW Under Construction
1H 2011
223 MW
Hydro
83
Changuinola I
Panama
1H 2010
156 MW
Wind
89
St. Nikola
Bulgaria
2H 2010
62 MW
Hydro
51
I.C. Energy
JV4
Turkey
2009-2010
14.4 MW
Wind
40
Innovent3
France
2010
148.5 MW
Wind
49
GuohuaEnergy
JV2
China
2H 2009
22 MW
Wind
100
North Rhins
Scotland
2H 2009
34.5 MW
Wind
100
St. Patrick
France
2H 2009
100.5 MW
Wind
100
Armenia Mountain
U.S.
Generation (Renewables)
20115
270 MW
Coal
71
Campiche
Chile
2H 2011
518 MW
Coal
71
Angamos
Chile
2H 2010
152 MW
Coal
35
Guacolda 4
Chile
1H 2010
270 MW
Coal
71
Nueva Ventanas
Chile
2H 2010
670 MW
Coal
100
Maritza East
Bulgaria
2H 2009
380 MW
Gas
37
Amman East1
Jordan
Generation (Thermal)
2H 2009
86 MW
Heavy Fuel Oil
56
Dibamba
Cameroon
Utility
% Owned
Project
Type
Gross MW
Expected Commercial Operations Date
1. 247 MW simple-cycle capacity is already in operation.2. Joint Venture with Guohua Energy Investment Co. Ltd. Guohua Energy plants: Huanghua I & II, Chenq Qi and Dong Qi.3. Innovent plants: Audrieu, Bignan, Boisbergues and Eurotunel. 4. Joint Venture with I.C. Energy. I.C. Energy plants: Damlapinar Konya, Kepezkaya Konya and Kumkoy Samsun.5. Construction of this project has been stopped and may not resume until a solution is found to resolve the permitting issue.
All funding secured to complete construction program
More than 90% of capacity is under long-term contacts

31
Contains Forward Looking Statements
Consolidated Non-Recourse Debt Maturities Summary by Segment as of June 30, 2009
Line of Business Country/State Q3–Q4 ’09 2010 2011 2012 2013 Thereafter Total
North America
Merida III Generation Mexico 6 13 14 14 17 14 78
TEG Generation Mexico 3 7 7 8 8 183 216
TEP Generation Mexico 3 8 8 8 9 181 217
Southland Generation USA – California 26 50 51 52 58 201 438
Hawaii Generation USA – Hawaii 10 20 22 23 25 311 411
IPALCO Utilities USA – Indiana 22 – 375 – 110 1,182 1,689
Warrior Run Generation USA – Maryland 14 29 32 35 26 104 240
Red Oak Generation USA – New Jersey 15 15 15 18 18 283 364
Eastern Energy Generation USA – New York 4 8 10 11 11 151 195
Shady Point Generation USA – Oklahoma 6 11 11 11 11 51 101
Condon Wind Power Generation USA – Oregon – 1 1 1 2 21 26
Beaver Valley Generation USA – Pennsylvania – – – – – 3 3
Ironwood Generation USA – Pennsylvania 6 12 14 11 14 212 269
Puerto Rico Generation USA – Puerto Rico 43 39 42 47 54 579 804
Total North America 158 213 602 239 363 3,476 5,051
Note: The above table is unaudited and is for reference purposes only. The table provides debt amortization of the business unit and subsidiary holding company. Any of these amortization schedules could be revised or accelerated for a number of reasons, including events of default, if any. The maturities shown include unamortized discounts used to calculate the book value of debt and may deviate from local GAAP business unit financials for a number of reasons, including capital lease accounting. Certain amounts have been rounded for presentation purposes. For further details on non-recourse debt, please refer to AES Corporation's SEC filings and press releases made from time to time.
US$ in Millions
32
Contains Forward Looking Statements
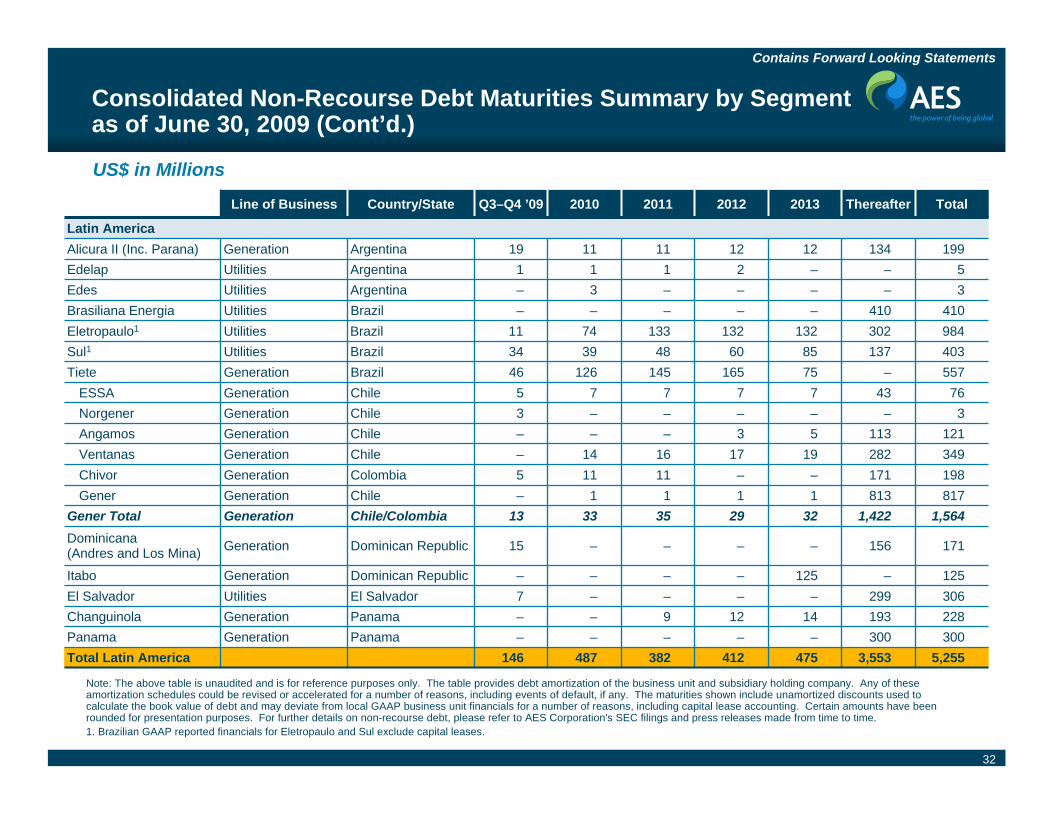
Consolidated Non-Recourse Debt Maturities Summary by Segment as of June 30, 2009 (Cont’d.)
Line of Business Country/State Q3–Q4 ’09 2010 2011 2012 2013 Thereafter Total
Latin AmericaAlicura II (Inc. Parana) Generation Argentina 19 11 11 12 12 134 199Edelap Utilities Argentina 1 1 1 2 – – 5Edes Utilities Argentina – 3 – – – – 3Brasiliana Energia Utilities Brazil – – – – – 410 410Eletropaulo1 Utilities Brazil 11 74 133 132 132 302 984Sul1 Utilities Brazil 34 39 48 60 85 137 403Tiete Generation Brazil 46 126 145 165 75 – 557
ESSA Generation Chile 5 7 7 7 7 43 76Norgener Generation Chile 3 – – – – – 3Angamos Generation Chile – – – 3 5 113 121Ventanas Generation Chile – 14 16 17 19 282 349Chivor Generation Colombia 5 11 11 – – 171 198Gener Generation Chile – 1 1 1 1 813 817
Gener Total Generation Chile/Colombia 13 33 35 29 32 1,422 1,564Dominicana(Andres and Los Mina) Generation Dominican Republic 15 – – – – 156 171
Itabo Generation Dominican Republic – – – – 125 – 125El Salvador Utilities El Salvador 7 – – – – 299 306Changuinola Generation Panama – – 9 12 14 193 228Panama Generation Panama – – – – – 300 300Total Latin America 146 487 382 412 475 3,553 5,255
Note: The above table is unaudited and is for reference purposes only. The table provides debt amortization of the business unit and subsidiary holding company. Any of these amortization schedules could be revised or accelerated for a number of reasons, including events of default, if any. The maturities shown include unamortized discounts used to calculate the book value of debt and may deviate from local GAAP business unit financials for a number of reasons, including capital lease accounting. Certain amounts have been rounded for presentation purposes. For further details on non-recourse debt, please refer to AES Corporation's SEC filings and press releases made from time to time.1. Brazilian GAAP reported financials for Eletropaulo and Sul exclude capital leases.
US$ in Millions

33
Contains Forward Looking Statements
Consolidated Non-Recourse Debt Maturities Summary by Segment as of June 30, 2009 (Cont’d.)
Note: The above table is unaudited and is for reference purposes only. The table provides debt amortization of the business unit and subsidiary holding company. Any of these amortization schedules could be revised or accelerated for a number of reasons, including events of default, if any. The maturities shown include unamortized discounts used to calculate the book value of debt and may deviate from local GAAP business unit financials for a number of reasons, including capital lease accounting. Certain amounts have been rounded for presentation purposes. For further details on non-recourse debt, please refer to AES Corporation's SEC filings and press releases made from time to time.
413022232FranceGenerationSt. Patrick
Line of Business Country/State Q3–Q4 ’09 2010 2011 2012 2013 Thereafter Total
Europe & AfricaKavarna Generation Bulgaria – 35 3 4 4 75 121Maritza East I Generation Bulgaria – 24 45 48 53 714 884SONEL Utilities Cameroon 3 78 33 32 28 141 315
Borsod Generation Hungary 2 4 – – – – 6Tisza II Generation Hungary 14 14 – – – – 28Ebute Generation Nigeria 10 – – – – – 10North Rhins Generation UK – 4 3 3 3 36 49Kilroot Generation UK 72 88 46 – – – 206Kievoblenergo Utilities Ukraine 26 - - - - - 26Rievnoblenergo Utilities Ukraine 13 - - - - - 13Total Europe & Africa 142 250 132 89 90 996 1,699
1----1-VariousVariousOther
Asia & Middle EastCHIGEN Generation China – 103 – – – – 103CHIGEN Subs Generation China 5 – – – – – 5Amman East Generation Jordan – 7 7 8 7 152 181Barka Generation Oman 13 22 26 26 22 147 256Lal Pir Generation Pakistan – 54 – – – – 54Pak Gen Generation Pakistan 1 49 – – – – 50
Oasis Total Generation Jordan, Oman & Pakistan 14 132 33 34 29 299 541
Masinloc Generation Philippines 10 – 36 37 38 486 607Ras Laffan Generation Qatar 27 33 37 37 36 228 398Kelanitissa Generation Sri Lanka 45 – – – – – 45Total Asia & Middle East 101 268 106 108 103 1,013 1,699
Total Non-Recourse Debt 547 1,219 1,222 848 1,031 8,838 13,705
US$ in Millions

34
Contains Forward Looking Statements
$5.5 Billion Recourse Debt & Trust Preferred Scheduled Maturities Summary1 as of June 30, 2009
Note: The above table is unaudited and is for reference purposes only. 1. The table above sets forth the projected remaining debt balances with respect to AES' currently outstanding recourse indebtedness and trust preferred securities as of each date
presented. The table assumes that: (i) AES incurs no other indebtedness, and (ii) that only scheduled repayments are made. While AES may incur other indebtedness and may make additional unscheduled repayments, it is not practicable to project the amount or timing of any such incurrence or repayments and accordingly no reconciliation is provided. Please see AES' SEC filings for further information.
2. Amount drawn as of June 30, 2009. Excludes letters of credit issued under the facilities. Amounts drawn may be repaid at any time. 3. 8.375% Senior Unsecured Notes due 2011 were issued as £135 million. At June 30, 2009, roughly £85 million remained outstanding. The exchange rate as of June 30, 2009 was
approximately US$1.652/£1.00. 4. These balances do not reflect unamortized discounts totaling approximately $5 million that are used to calculate the book value of the debt. Total excludes letters of credit and other
debt guarantees. Certain amounts may vary slightly from other presentations due to rounding.
-----535------9.75% Senior Unsecured Notes due April 2016
2010 2011 2012 2013 2014 2015 2016 2017 2018 2019 2020 2029Senior Secured Term Loan Facility due 2011 - 200 - - - - - - - - - -
Senior Secured Credit Facility due 2010/20112 - - - - - - - - - - - -
Senior Secured Credit Facilities2 - 200 - - - - - - - - - -8.75% Senior Secured Second Priority Notes due May 2013 - - - 690 - - - - - - - -
Second Priority Senior Secured Notes - - - 690 - - - - - - - -Senior Unsecured Credit Facility due 20102 - - - - - - - - - - - -
Senior Unsecured Credit Facilities2 - - - - - - - - - - - -9.375% Senior Unsecured Notes due September 2010 214 - - - - - - - - - - -
8.875% Senior Unsecured Notes due February 2011 - 129 - - - - - - - - - -
8.375% Senior Unsecured Notes due March 20113 - 141 - - - - - - - - - -
7.75% Senior Unsecured Notes due March 2014 - - - - 500 - - - - - - -
7.75% Senior Unsecured Notes due October 2015 - - - - - 500 - - - - - -
8.00% Senior Unsecured Notes due October 2017 - - - - - - - 1,500 - - - -
8.00% Senior Unsecured Notes due June 2020 - - - - - - - - - - 625 -
Senior Unsecured Notes 214 270 - - 500 500 535 1,500 - - 625 -6.75% Trust Preferred III due October 2029 - - - - - - - - - - - 517
Trust Preferreds - - - - - - - - - - - 517Total Recourse Debt Including Trust Preferreds4 214 470 - 690 500 500 535 1,500 625 517
US$ in Millions
35
Contains Forward Looking Statements
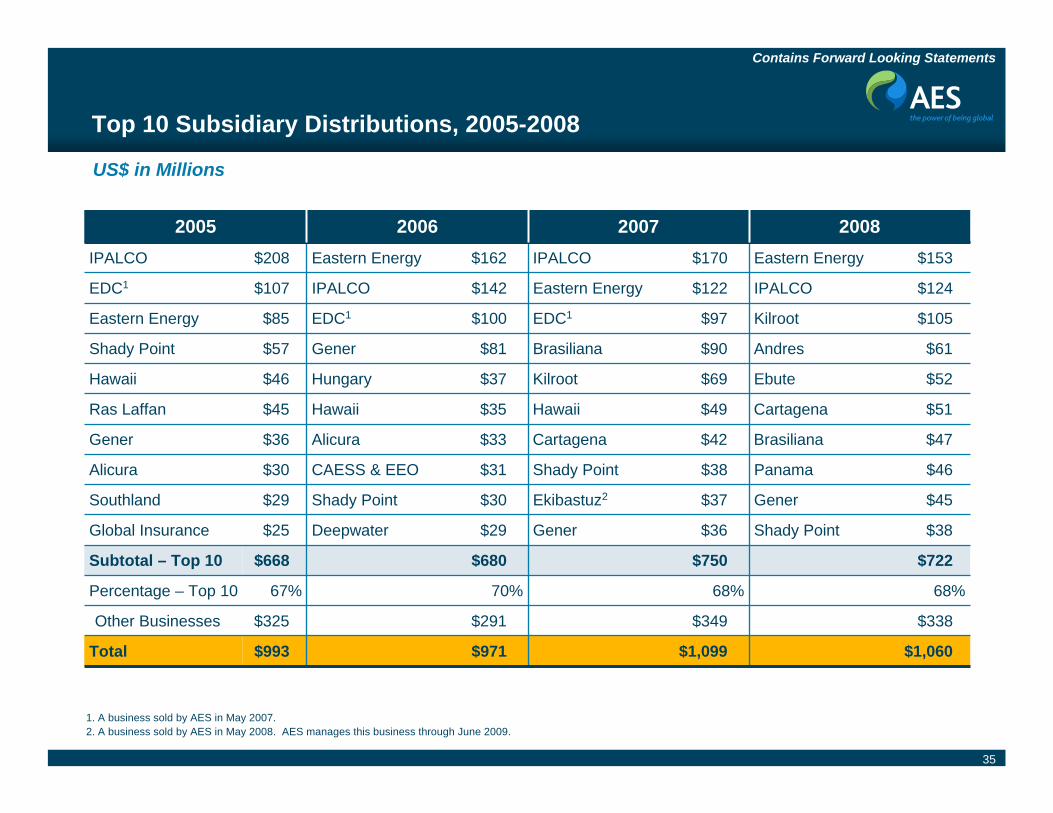
Top 10 Subsidiary Distributions, 2005-2008
68%68%70%67%Percentage – Top 10
2005 2006 2007 2008IPALCO $208 Eastern Energy $162 IPALCO $170 Eastern Energy $153
EDC1 $107 IPALCO $142 Eastern Energy $122 IPALCO $124
Eastern Energy $85 EDC1 $100 EDC1 $97 Kilroot $105
Shady Point $57 Gener $81 Brasiliana $90 Andres $61
Hawaii $46 Hungary $37 Kilroot $69 Ebute $52
Ras Laffan $45 Hawaii $35 Hawaii $49 Cartagena $51
Gener $36 Alicura $33 Cartagena $42 Brasiliana $47
Alicura $30 CAESS & EEO $31 Shady Point $38 Panama $46
Southland $29 Shady Point $30 Ekibastuz2 $37 Gener $45
Global Insurance $25 Deepwater $29 Gener $36 Shady Point $38
Subtotal – Top 10 $668 $680 $750 $722
Other Businesses $325 $291 $349 $338
Total $993 $971 $1,099 $1,060
1. A business sold by AES in May 2007.2. A business sold by AES in May 2008. AES manages this business through June 2009.
US$ in Millions
36
Contains Forward Looking Statements
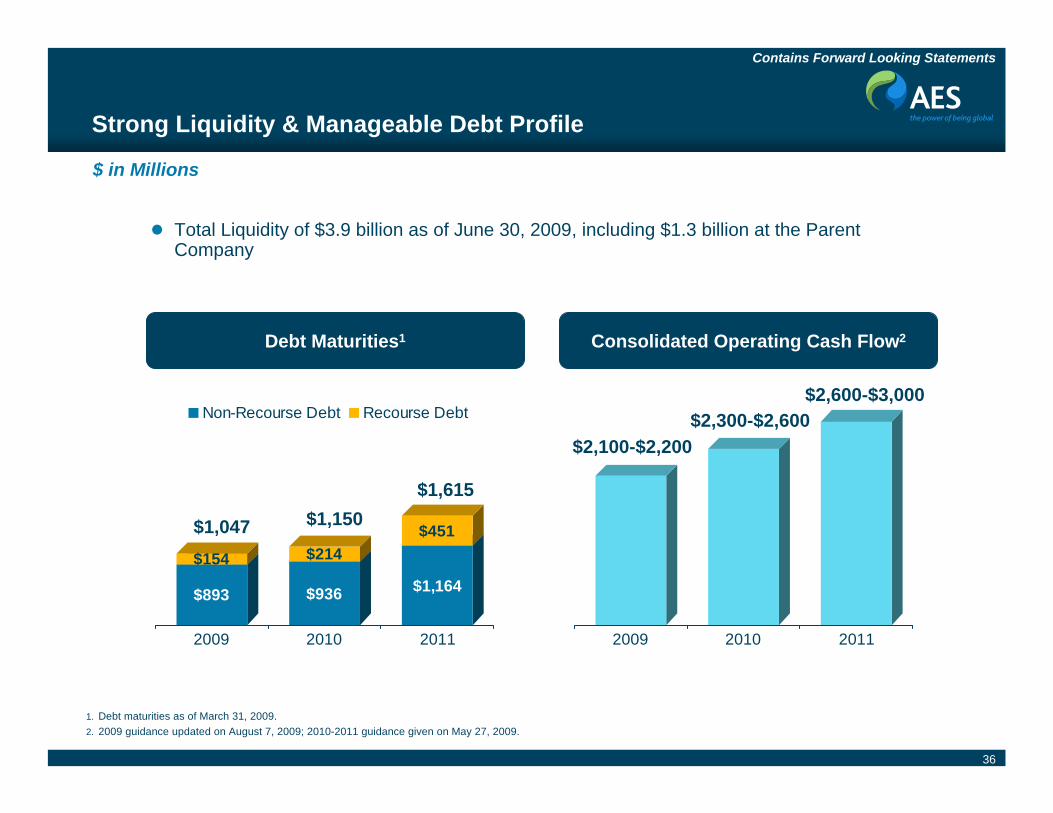
Total Liquidity of $3.9 billion as of June 30, 2009, including $1.3 billion at the Parent Company
Strong Liquidity & Manageable Debt Profile
$ in Millions
$893
$154
$936
$214
$1,164
$451
2009 2010 2011
Non-Recourse Debt Recourse Debt
$1,150$1,615
$1,047
Debt Maturities1 Consolidated Operating Cash Flow2
2009 2010 2011
$2,100-$2,200$2,300-$2,600
$2,600-$3,000
1. Debt maturities as of March 31, 2009. 2. 2009 guidance updated on August 7, 2009; 2010-2011 guidance given on May 27, 2009.
37
Contains Forward Looking Statements
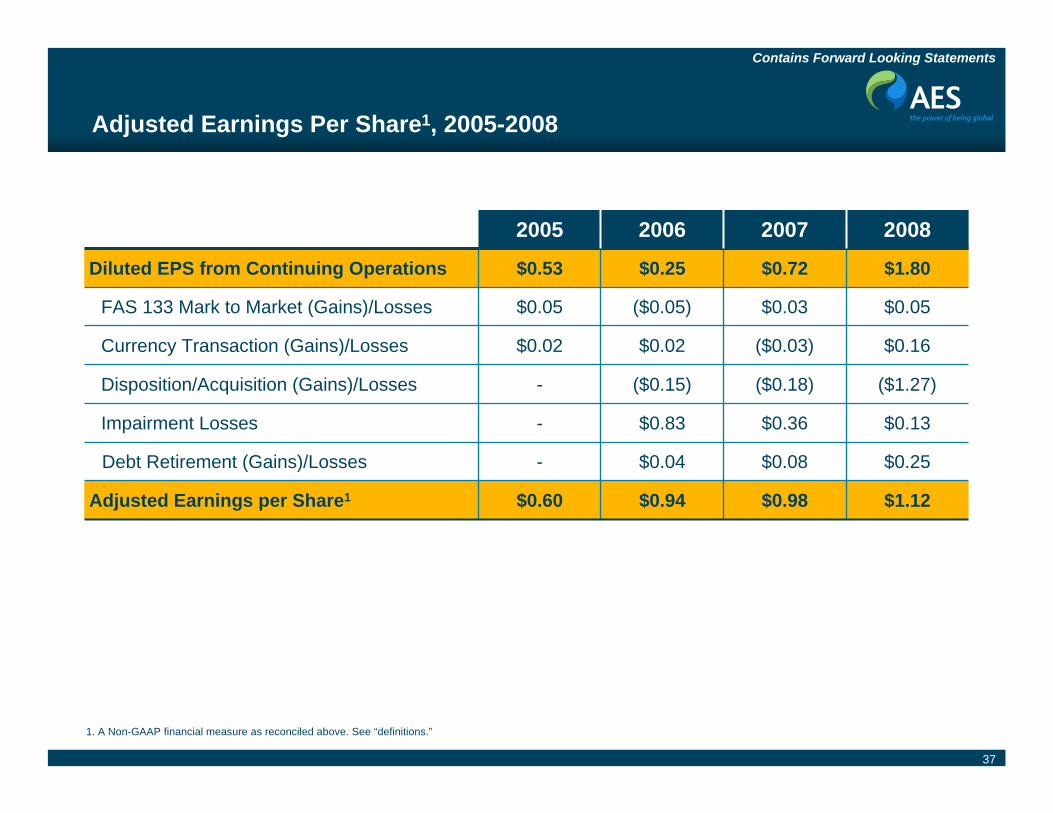
1. A Non-GAAP financial measure as reconciled above. See “definitions.”
Adjusted Earnings Per Share1, 2005-2008
2005 2006 2007 2008
Diluted EPS from Continuing Operations $0.53 $0.25 $0.72 $1.80
FAS 133 Mark to Market (Gains)/Losses $0.05 ($0.05) $0.03 $0.05
Currency Transaction (Gains)/Losses $0.02 $0.02 ($0.03) $0.16
Disposition/Acquisition (Gains)/Losses - ($0.15) ($0.18) ($1.27)
Impairment Losses - $0.83 $0.36 $0.13
Debt Retirement (Gains)/Losses - $0.04 $0.08 $0.25
Adjusted Earnings per Share1 $0.60 $0.94 $0.98 $1.12

38
Contains Forward Looking Statements
Reconciliation of 2009 Guidance1
$1.05-$1.10Adjusted Earnings Per Share3
($0.10)Pro forma Adjustments5
$1.15-$1.20Diluted Earnings Per Share
$1,200-$1,300Subsidiary Distributions4
2009Consolidated Adjustment Factors2 Proportional2,3
Operating Cash Flow $2,100-$2,200 $850 $1,250-$1,350
Operational Capex (a) $600-$650 $175-$200 $425-$450
Environmental Capex (b) $50-$100 $0-$25 $50-$75
Less: Maintenance Capex (a+b) $650-$750 $175-225 $475-$525
Free Cash Flow3 $1,400-$1,500 $650 $750-$850
Gross Margin $3,500-$3,600 $1,400-$1,450 $2,100-$2,150
1. 2009 guidance updated on on August 7, 2009.2. The AES Corporation (the “Company”) is a holding company that derives its income and cash flows from the activities of its subsidiaries, some of which may not be wholly-owned by
the Company. Accordingly, the Company has presented certain financial metrics which are defined as Proportional (a non-GAAP financial measure). See “definitions.”3. A non-GAAP financial measure. See “Definitions.”4. See “Definitions.”5. Reconciliation of Adjusted EPS includes $0.10 of adjustments primarily related to unrealized foreign currency and FAS 133 derivative losses offset by ($0.16) gain on sale of
Northern Kazakhstan businesses. Note: 2009 Guidance is based on expectations for future foreign exchange rates and commodity prices as of June 30, 2009. Actual results may differ.
$ in Millions, Except Earnings Per Share

39
Contains Forward Looking Statements
Reconciliation of 2010 Guidance1
1. Guidance given on May 27, 2009.2. The AES Corporation (the “Company”) is a holding company that derives its income and cash flows from the activities of its subsidiaries, some of which may not be wholly-owned by
the Company. Accordingly, the Company has presented certain financial metrics which are defined as Proportional (a non-GAAP financial measure). See “definitions.”3. A non-GAAP financial measure. See “Definitions.”4. See “Definitions.”5. Primarily unrealized foreign currency and FAS 133 losses.Note: 2010 Guidance is based on expectations for future foreign exchange rates and commodity prices as of March 31, 2009. Actual results may differ.
$ in Millions, Except Earnings Per Share
$1.05-$1.15Adjusted Earnings Per Share3
$0.10Pro forma Adjustments5
$0.95-$1.05Diluted Earnings Per Share
$1,100-$1,300Subsidiary Distributions4
2010Consolidated Adjustment Factors2 Proportional2,3
Operating Cash Flow $2,300-$2,600 $850-$950 $1,450-$1,650
Operational Capex (a) $575-$675 $125-$175 $450-$500
Environmental Capex (b) $50-$100 $10-$20 $40-$80
Less: Maintenance Capex (a+b) $625-$775 $135-$195 $490-$580
Free Cash Flow3 $1,600-$1,900 $700-$800 $900-$1,100
Gross Margin $3,400-$3,700 $1,250-$1,350 $2,150-$2,350

40
Contains Forward Looking Statements
Reconciliation of 2011 Guidance1
1. Guidance given on May 27, 2009.2. The AES Corporation (the “Company”) is a holding company that derives its income and cash flows from the activities of its subsidiaries, some of which may not be wholly-owned by
the Company. Accordingly, the Company has presented certain financial metrics which are defined as Proportional (a non-GAAP financial measure). See “definitions.”3. A non-GAAP financial measure. See “Definitions.”4. See “Definitions.”5. Primarily unrealized foreign currency and FAS 133 losses.Note: 2011 Guidance is based on expectations for future foreign exchange rates and commodity prices as of March 31, 2009. Actual results may differ.
$ in Millions, Except Earnings Per Share
$1.20-$1.30Adjusted Earnings Per Share3
$0.10Pro forma Adjustments5
$1.10-$1.20Diluted Earnings Per Share
$1,100-$1,300Subsidiary Distributions4
2011Consolidated Adjustment Factors2 Proportional2,3
Operating Cash Flow $2,600-$3,000 $1,000-$1,100 $1,600-$1,900
Operational Capex (a) $575-$675 $125-$175 $450-$500
Environmental Capex (b) $50-$100 $5-$10 $45-$90
Less: Maintenance Capex (a+b) $625-$775 $130-$185 $495-$590
Free Cash Flow3 $1,900-$2,300 $800-$1,000 $1,100-$1,300
Gross Margin $3,500-$3,900 $1,250-$1,350 $2,250-$2,550

41
Contains Forward Looking Statements
Reconciliation of 2008 Proportional Gross Margin1
ConsolidatedAdjustment
Factor2 Proportional1,2
Generation Segment Gross Margin $1,528 $25 $1,503
Utility Segment Gross Margin $2,179 $1,368 $811
Total Gross Margin $3,707 $1,393 $2,314
$ in Millions
1. A non-GAAP financial measure. See “definitions.”2. The AES Corporation (the “Company”) is a holding company that derives its income and cash flows from the activities of its subsidiaries, some of which may not be wholly-owned by
the Company. Accordingly, the Company has presented certain financial metrics which are defined as Proportional (a non-GAAP financial measure). See “definitions.”

42
Contains Forward Looking Statements
Parent Company Subsidiaries Total
Cash & Cash Equivalents $603 $1,132 $1,735
Bank Lines of Credit $713 $1,443 $2,156
Total Liquidity $1,3161 $2,5752 $3,891
Restricted Cash – $444 $444
Short-Term Investments – $1,1523 $1,1523
Debt Service Reserve Accounts – $655 $655
Total Liquidity Plus Additional Financial Assets $1,316 $4,826 $6,142
1. This number represents Parent Liquidity (a non-GAAP financial measure) as reconciled above. See “definitions.”2. This number represents Subsidiary Liquidity (a non-GAAP financial measure) as reconciled above. See “definitions.”3. Includes: $1,088 million in Brazil.Note: The numbers presented above are consolidated. Because the Company’s individual subsidiaries rely primarily on non-recourse debt, they may not have access to consolidated liquidity and will instead rely upon their individual ability to manage their obligations. In addition, the Parent Company may not have access to the liquidity at various subsidiaries due to various restrictions.
$ In Millions, as of June 30, 2009
Reconciliation of Parent & Subsidiary Liquidity

43
Contains Forward Looking Statements
Forecasted financial information is based on certain material assumptions. Such assumptions include, but are not limited to: (a) no unforeseen external events such as wars, depressions, or economic or political disruptions occur; (b) businesses continue to operate in a manner consistent with or better than prior operating performance, including achievement of planned productivity improvements including benefits of global sourcing, and in accordance with the provisions of their relevant contracts or concessions; (c) new business opportunities are available to AES in sufficient quantity to achieve its growth objectives; (d) no material disruptions or discontinuities occur in GDP, foreign exchange rates, inflation or interest rates during the forecast period; and (e) material business-specific risks as described in the Company’s SEC filings do not occur individually or cumulatively. In addition, benefits from global sourcing include avoided costs, reduction in capital project costs versus budgetary estimates, and projected savings based on assumed spend volume which may or may not actually be achieved. Also, improvement in certain KPIs such as equivalent forced outage rate and commercial availability may not improve financial performance at all facilities based on commercial terms and conditions. These benefitswill not be fully reflected in the Company’s consolidated financial results.
The cash held at qualifying holding companies (QHCs) represents cash sent to subsidiaries of the Company domiciled outside of the U.S. Such subsidiaries had no contractual restrictions on their ability to send cash to AES, the Parent Company. Cash at those subsidiaries was used for investment and related activities outside of the U.S. These investments included equity investments and loans to other foreign subsidiaries as well as development and general costs and expenses incurred outside the U.S. Since the cash held by these QHCs is available to the Parent, AES uses the combined measure of subsidiary distributions to Parent and QHCs as a useful measure of cash available to the Parent to meet its international liquidity needs. AES believes that unconsolidated parent company liquidity is important to the liquidity position of AES as a parent company because of the non-recourse nature of most ofAES’s indebtedness.
Assumptions

44
Contains Forward Looking Statements
Definitions
Adjusted earnings per share (a non-GAAP financial measure) is defined as diluted earnings per share from continuing operations excluding gains or losses of the consolidated entity due to (a) mark-to-market amounts related to FAS 133 derivative transactions, (b) unrealized foreign currency gains or losses, (c) significant gains or losses due to dispositions and acquisitions of business interests, (d) significant losses due to impairments, and (e) costs due to the early retirement of debt. AES believes that adjusted earnings per share better reflects the underlying business performance of the Company, and is considered in the Company's internal evaluation of financial performance. Factors in this determination include the variability due to mark-to-market gains or losses related to derivative transactions, currency gains or losses, losses due to impairments and strategic decisions to dispose or acquire business interests or retired debt which affect results in a given period or periodsFree cash flow (a non-GAAP financial measure) is defined as net cash from operating activities less maintenance capital expenditures (including environmental capital expenditures). AES believes that free cash flow is a useful measure for evaluating our financial condition because it represents the amount of cash provided by operations less maintenance capital expenditures as defined by our businesses, that may be available for investing or for repaying debt Parent Company Liquidity (a non-GAAP financial measure) is defined as cash at the Parent Company plus availability under corporate revolver plus cash at qualifying holding companies (QHCs). AES believes that unconsolidated Parent Company liquidity is important to the liquidity position of AES as a Parent Company because of the non-recourse nature of most of AES’s indebtednessSubsidiary Liquidity (a non-GAAP financial measure) is defined as cash and cash equivalents and bank lines of credit at various subsidiaries.The AES Corporation (the “Company”) is a holding company that derives its income and cash flows from the activities of its subsidiaries, some of which may not be wholly-owned by the Company. Accordingly, the Company has presented certain financial metrics which are defined as Proportional (a non-GAAP financial measure)Proportional metrics present the Company’s estimate of its share in the economics of the underlying metric. The Company believes that the Proportional metrics are useful to investors because they exclude the economic share in the metric presented that is held by non-AES shareholders. For example, Operating Cash Flow is a GAAP metric which presents the Company’s cash flow from operations on a consolidated basis, including operating cash flow allocable to noncontrolling interests. Proportional Operating Cash Flow removes the share of operating cash flow allocable to noncontrolling interests and therefore may act as an aid in the valuation the Company. Proportional measures are considered in the Company’s internal evaluation of financial performanceProportional metrics are reconciled to the nearest GAAP measure. Certain assumptions have been made to estimate our proportional financial measures. These assumptions include: (i) the Company’s economic interest has been calculated based on a blended rate for each consolidated business when such business represents multiple legal entities; (ii) the Company’s economic interest may differ from the percentage implied by the recorded net income or loss attributable to noncontrolling interests or dividends paid during a given period; (iii) the Company’s economic interest for entities accounted for using the hypothetical liquidation at book value method is 100%; (iv) individual operating performance of the Company’s equity method investments is not reflected and (v) all intercompany amounts have been excluded as applicable
Non-GAAP Financial Measures

45
Contains Forward Looking Statements
Definitions (Cont’d.)
Net debt is defined as total debt less cash and cash equivalents, restricted cash, short-term investments and debt service reserve accountsSubsidiary Distributions should not be construed as an alternative to Net Cash Provided by Operating Activities which are determined in accordance with GAAP. Subsidiary Distributions are important to the Parent Company because the Parent Company is a holding company that does not derive any significant direct revenues from its own activities but instead relies on its subsidiaries’ business activities and the resultant distributions to fund the debt service, investment and other cash needs of the holding company. The reconciliation of difference between the Subsidiary Distributions and Net Cash Provided by Operating Activities consists of cash generated from operating activities that is retained at the subsidiaries for a variety of reasons which are both discretionary and non-discretionary in nature. These factors include, but are not limited to, retention of cash to fund capital expenditures at the subsidiary, cash retention associated with non-recourse debt covenant restrictions and related debt service requirements at the subsidiaries, retention of cash related to sufficiency of local GAAP statutory retained earnings at the subsidiaries, retention of cash for working capital needs at the subsidiaries, and other similar timing differences between when the cash is generated at the subsidiaries and when it reaches the Parent Company and related holding companies