barclays – passive aggression - sec · 2018-01-08 · previously published in the u.s. credit...
TRANSCRIPT

Credit Research
US Credit Focus
Previously published in the US Credit Alpha 17 February 2017
17 February 2017
Passive Aggression
Jeffrey Meli We examine the implications of the shift from active to passive management for
+1 212 412 2127 liquidity in the investment grade and high yield markets We estimate a modest 15-
jeffmelibarclayscom 30 decline in bond turnover directly attributable to assets transitioning from active to
BCI US passive vehicles but a much more significant indirect effect in high yield from
institutional usage of ETFs
Eric Gross Growing passive assets under management (AUM) in high yield reflect not only true
+1 212 412 7997 retail investors who own the funds as part of an investment strategy but also
ericgrossbarclayscom institutional investors who own them primarily for liquidity management True retail
BCI US investors transitioning from active to passive are not a meaningful drag on high yield
liquidity but we believe that institutional ownership leads to a much larger decline in bond
turnover We estimate that this indirect effect reduced high yield bond turnover by 20 in
2016 although it could have been as low as 10 or as high as 30 This is significant
relative to the approximately 140 turnover of high yield and could account for a
substantial portion of the decline in turnover since the crisis Investment grade is not
affected by this indirect drag on liquidity as institutional investors rarely use passive
instruments to manage fund flows
We see limited room for further declines in turnover from shifts into passive
strategies Passive penetration remains low in high yield and could increase as
evidenced by an increasing variety or products including rates-hedged high yield ETFs
fallen angel ETFs and target maturity ETFs However we do not believe that high yield
passive penetration will exceed that in investment grade Even in that scenario the
turnover implications are limited
The size of secondary high yield ETF volumes is striking The four largest high yield ETFs
averaged secondary volumes of $16bn per day on only $37bn of AUM This compares
with $12bn of daily volume in the high yield bond market (using TRACE data) which has a
size of $13trn Our analysis of retail flows suggests that only a small fraction of these flows
can be attributed to retail At the same time the flows exceed the liquidity needs of fund
managers by at least two-to-one indicating that other institutions must be responsible for
much of the secondary activity We believe that some of this comes at the expense of
secondary bond trading but given what we know about the liquidity needs of the different
owners of high yield we believe the use of ETFs to substitute away from secondary bond
trades is likely nearing saturation
FIGURE 1
Secondary Volumes in High Yield ETFs Are Striking Relative to Their Size
Ownership of HY Annual Secondary
Market Turnover
High Yield ETFs 3 107x
Other Owners of High Yield 97 14x
Source Bloomberg MarketAxess Barclays Research
This document is intended for institutional investors and is not subject to all of the independence and disclosure standards applicable to debt
research reports prepared for retail investors under US FINRA Rule 2242 Barclays trades the securities covered in this report for its own account
and on a discretionary basis on behalf of certain clients Such trading interests may be contrary to the recommendations offered in this report PLEASE SEE ANALYST CERTIFICATIONS AND IMPORTANT DISCLOSURES STARTING AFTER PAGE 11
Barclays | Passive Aggression
The Ascent of Passive Management
The shift from active to passive management has been a long-simmering issue in financial
markets It has obvious implications for asset managers who face heightened fee
compression and competition for AUM as money flows into passive strategies We believe it
also has implications for the underlying financial markets along two separate but related
dimensions First as money shifts into passive strategies the remaining active managers
should face less competition improving their chances of outperforming their benchmarks If
true this would help establish an equilibrium split between the two investment styles On
the other hand passive investing generally involves lower turnover (Figure 2) and an
increasing share of passive therefore likely reduces available liquidity If this second effect
dominates it would limit the ability of active managers to capture opportunities for
outperformance it could even make the shift into passive self-reinforcing
We quantify this second effect of the shift from active to passive in the corporate credit
markets There are different implications for investment grade than for high yield We
estimate that the direct effect of the transition from active to passive is a 28 drop in
investment grade turnover compared with 17 in high yield Passive has had a larger
effect on turnover in investment grade owing primarily to higher penetration of passive
funds in that market That said the turnover implications are limited because retail has a
small presence in the investment grade market and more important because passive
instruments are not typically used by institutional funds1 to manage liquidity needs
FIGURE 2
Average Portfolio Turnover for Top 20 Funds by AUM ()
0
20
40
60
80
100
120
140
160
180
200
US Govt Global EM US IG US Loans US HY US Equity US Munis
Active PassiveSource Bloomberg
In high yield the use of passive vehicles by fund managers to manage flows leads to
significant indirect effects on turnover We estimate that this behavior reduced annual
turnover by 20 in 2016 The liquidity implications of reduced turnover are likely more
severe for high yield where some securities are already difficult to trade and institutional
managers have taken steps to manage liquidity risk more actively
State of Passive Strategies across Asset Classes
The flows into passive strategies have not been uniform across asset classes (Figure 3) In
equities US government and US investment grade passive strategies have a significant share
of retail assets While already over 40 the passive share continues to increase in both equity
and government funds In loans and municipals the passive share has remained small likely
1 We use the term ldquoinstitutionalrdquo to distinguish between individuals and professional investment managers Thus ldquoinstitutionalrdquo includes not only pensions endowments and foundations but also fund managers whose end users may be retail investors
17 February 2017 2
Barclays | Passive Aggression
for structural reasons US high yield and emerging markets currently sit between those two
extremes They have seen some growth in passive strategies since the onset of the credit
crisis with the introduction of ETFs a likely catalyst However the shift has been small and we
may be overstating the extent of true retail passive investing as institutional investors use
ETFs to help manage cash needs Clearly in absolute terms high yield has the potential for a
substantial further shift into passive given the gap to the high penetration asset classes
mentioned above
FIGURE 3
Share of Mutual Fund and ETF Assets in Passively Managed Vehicles
0
10
20
30
40
50
09 10 11 12 13 14 15 16
US Govt US IG US HY US Loans
Global EM US Munis US Equity
43
41
35
Grp
1
17
12 Grp
2
5
3 Grp
3
Note Asset class breakdown based on EPFR classification Source EPFR
The Effect of Passive on Investment Grade Turnover
There are three components to this calculation the ownership share of mutual funds in the
investment grade market the share of passive in the funds universe and the difference in
turnover between active and passive funds
1 Ownership of Mutual Funds
We estimate the ownership share of each of the major holders of corporate bonds each year
in our Outlook The most recent estimate was a 16-18 share for mutual funds a slight
increase from previous years This is computed by summing the investment grade
corporate holdings of the investment grade funds database from EPFR This category is
really investment grade core funds and many of those included own more than just
corporates ndash the investment grade aggregate fund is a common benchmark and it also
includes Treasuries and mortgages Therefore we aggregate the underlying corporate
holdings at the fund level to arrive at our estimate
2 Passive Share
Next we estimate the share of passive among this group at 37 The high passive
penetration rate reflects the relatively mature nature of the passive industry in investment
grade the passive share has also been quite stable over the post-crisis period Again this
analysis goes beyond the EPFR investment grade classification which includes non-
corporates to specifically reflect the share of investment grade corporate bonds held in
passive vehicles We arrive at this estimate using the active or passive categorization at the
fund level and then aggregate up the corporate holdings for that fund2
2 In both investment grade and high yield we identified a small group of funds that are categorized as active but have
management fees and turnover statistics that are more akin to passive While the prospectuses for these funds
confirm that they can exercise discretion similar to active managers we believe the funds are effectively passive As a
result we consider funds with management fees less than 30bp and turnover less than 40 as passive
17 February 2017 3
Barclays | Passive Aggression
3 Turnover
Finally we compare turnover for active and passive funds These statistics are reported at
the fund level As mentioned above investment grade core funds often include more than
just corporate bonds and assets such as Treasuries would likely have higher turnover than
corporate bonds Since we cannot apportion turnover by security type we estimate the
corporate turnover by looking only at dedicated corporate funds3 We then assume that the
broader funds have turnover in their corporate positions similar to the dedicated funds4
In addition the turnover rates reported are calculated as the percent of the portfolio that is
replaced in a given year For example a fund that sells 50 of its bonds and replaces them
through market purchases would report a turnover of 50 However the associated trading
volume could be as high as 100 (it could be lower than 100 if some of the purchases were
done through the primary market) Therefore we need to gross up the reported turnover
statistics to translate them into secondary volumes We double the reported numbers
recognizing that this is likely biased slightly upward (although this too is likely mitigated by our
focus on the difference between active and passive funds which participate in the primary
market to a similar extent)
We estimate that active funds trade 112 of their AUM per year and passive funds trade 67
In other words a shift from active to passive reduces secondary volume by 45
Effect of Passive on Turnover
We estimate the total effect of passive management on volumes in investment grade
corporate bonds as the product of ownership passive penetration and the difference in
turnover (Figure 4) The result of 28 is relatively small for an asset class with
approximately 70 annual turnover This is despite the high level of passive penetration
which is balanced by the relatively low ownership of retail
FIGURE 4
Estimating the Direct Effect of a Shift to Passive on Investment Grade Bond Turnover
Source EPFR Bloomberg Barclays Researcht
Other Considerations
It is possible that our retail category misses some passive vehicles ndash such as third-party
money managed by institutional managers that is not in fund form This would show up in
our ldquootherrdquo category of ownership which is roughly 20 of the market Even if the majority
of this category is third-party money (and assuming a similar split between active and
passive) we would estimate the total effect of passive at around 5 in turnover terms
3 We classify investment grade core funds as corporate funds if their portfolios are at least 75 corporate based on
Bloomberg data 4 Many ldquoAggrdquo funds are sub-managed by different teams by product type (ie Treasuries securitized and corporates)
17 February 2017 4
Barclays | Passive Aggression
While more meaningful that is still a small effect relative to the size of the decline in
investment grade turnover
The Effect of Passive on High Yield Turnover
Our first pass at high yield is to run the same calculation
Retail fund ownership at approximately 35 is higher than in investment grade
The passive share of funds is 15 ndash smaller than investment grade and mostly in the
form of ETFs The vast majority of the growth in passive has come since the credit crisis
The active-passive turnover difference is 32 We estimate active turnover at 102 and
passive turnover at 70
We combine these in the same fashion as above in Figure 5 The result is only modestly
higher than in investment grade at 17 The direct effect remains limited because the
lower passive share more than offsets the higher degree of retail ownership
FIGURE 5
Estimating the Direct Effect of a Shift to Passive on High Yield Bond Turnover
Source EPFR Bloomberg Barclays Research
However the effect of passive on high yield turnover is more complicated than this We
believe that a substantial portion of the assets reported as passive does not represent true
retail passive investing in contrast to investment grade Instead it represents institutional
managers using passive vehicles including ETFs to manage their inflows and outflows
Managers trade ETFs to fund outflows or invest inflows and it is likely that at least some of
these flows replace trades in the secondary corporate bond market
In Using ETFs to Mitigate Fund Flows we showed that inflows and outflows are not
perfectly correlated across funds On average 54 of fund flows are ldquodiversifiablerdquo
meaning that portfolio managers can reliably use ETFs instead of trading bonds to satisfy a
significant share of their own fund flows Indeed an analysis of the magnitude of fund flows
at the fund level suggests that approximately 25 of the outstanding float in high yield
ETFs could be held by portfolio managers with daily liquidity needs
Several pieces of evidence support this view (alongside anecdotal evidence from money
managers and ETF traders) The first is the high concentration of assets among passive high
yield funds The top three passive funds represent 68 of passive high yield assets while
the top three passive government and equity funds represent 39 and 16 of passive
assets respectively All of the large passive funds in high yield are ETFs which have the
17 February 2017 5
Barclays | Passive Aggression
benefit of trading in the secondary market High concentration leads to larger secondary
flows which is useful for institutional managers trying to use ETFs to manage inflows and
outflows Without sufficient secondary trading selling of shares is more likely to lead to
share destruction which relies on the liquidity of the underlying market ETFs mitigate
liquidity needs only to the extent that their secondary trading volumes are large relative to
primary volumes (ie share creation and redemption volumes) A large number of thinly
traded ETFs would not be useful to institutional managers Indeed the largest four high
yield ETFs have secondary volumes of 4-8x primary volumes
The second piece of evidence is price The active-passive cost difference for high yield is
much lower than for asset classes with significant passive penetration (Figure 6) In fact it is
larger only than loans where the passive share is de minimis One of the draws of passive
for retail investors is lower fees and we would expect cost savings to be a key selling point
for funds targeted at those investors Given the high concentration there appears to be
room for funds to compete for retail share with lower fees In contrast an institution looking
to ETFs to help manage liquidity is unlikely to be interested in a new lower cost fund that
has less secondary liquidity
FIGURE 6
Average Expense Ratio for Top 20 Funds by AUM (bp)
-30
-38
-40
-46
-74 -77-86
0
10
20
30
40
50
60
70
80
90
US Loans US HY US Munis Global EM US Govt US IG US Equity
Active Passive
Source Bloomberg
Finally the largest high yield ETFs are benchmarked to either a liquid sub-index or a short
duration sub-index with very little style diversity The close link to the benchmark is
important for institutions looking to minimize tracking error but less important for retail-
oriented funds which we would expect to target specific segments of the market Although
there has been some recent movement on this front (more on this below) the largest funds
are surprisingly similar The only differentiation has been the few funds focused on short-
duration assets which is particularly telling given that short-duration bonds are commonly
used as cash substitutes by high yield portfolio managers with daily liquidity needs
Estimating the Indirect Effect on Turnover of Institutions Using ETFs
The passive share of high yield fund AUM can therefore be thought of as comprising two
different types of owners retail investors that own ETFs as part of their investment strategy
and institutions that use them primarily for liquidity management Secondary flows from the
first group are not replacing corporate bond trading ndash they are similar to gross flows for an
open-end mutual fund which are netted at NAV Secondary flows from institutions
however may be replacing trades in the underlying corporate bonds
17 February 2017 6
Barclays | Passive Aggression
This is an important differentiation because the overall flows for high yield ETFs are large
relative to the size of the high yield market despite the relatively small size of the funds
Daily TRACE volumes in high yield bonds averaged $12bn last year Secondary trading in
the four largest high yield ETFs which represent only about 3 of total high yield assets
was $16bn daily in 2016 The contrast in turnover is striking we estimate annual turnover
of about 14x for high yield while the ETF numbers imply annual turnover of 107x
Secondary ETF volumes are so significant that if they were fully substituting away from
secondary corporate activity the implications for bond turnover would be substantial
Figure 7 divides total secondary ETF volume by the size of the high yield market to convert
those volumes into a turnover-equivalent measure
FIGURE 7
ETF Volumes Divided by High Yield Par Outstanding
2 2 4 4 4 5 746
10
1619
1517
29
0
5
10
15
20
25
30
35
40
07 08 09 10 11 12 13 14 15 16
ETF Fund Flows Secondary ETF Volume
Note ETF flows are subtracted from secondary ETF volumes Source Bloomberg
In order to understand the size of the ETF volumes we estimate the potential contribution
from a few possible sources of activity First we estimate how much secondary volume
could be coming from retail owners of ETFs For the overall retail fund universe average
daily gross fund flows have been $731mn over the past 15 months ETFs represent about
9 of retail which would indicate that ETF gross flows from that investor base would be at
most $65mn per day (assuming that retail directly owned 100 of the ETFs outstanding
which we know not to be the case) Even if retail owners were more likely to trade ETFs than
buy or sell open fund vehicles ndash which sounds sensible given the intraday tradability of ETFs
ndash we think it is unlikely that retail owners make up more than 10 of total secondary
volumes in ETFs
That leaves institutional owners to make up the remainder of the secondary flows We can
estimate the possible trading from open-end mutual funds starting with the gross flows
statistic cited above Even if retail fund managers exclusively used ETFs to manage flows
this activity would account for about 46 of secondary ETF volumes This is surely an
overestimate of those institutionsrsquo activity for two reasons First only about 54 of those
flows are diversifiable meaning that ETFs cannot reasonably be used to satisfy every inflow
and outflow Second these managers do not exclusively use ETFs for liquidity management
ndash they also use other portfolio products such as CDX and liquid bonds Unless fund flow
volatility picks up materially we believe that any incremental liquidity effect of retail funds
using ETFs would likely be small
Other institutions (eg institutional asset management mandates pensions endowments
foundations and hedge funds) must therefore be driving a significant share of secondary
17 February 2017 7
Barclays | Passive Aggression
ETF volume Surveys have indeed shown5 that these institutions have consistently increased
their use of fixed income ETFs in recent years At least some of this activity likely comes at
the expense of bond trading Some is also likely from trading that is opportunistic given the
high liquidity of high yield ETFs such that participants are taking shorter-term views on
high yield that would not otherwise be implemented in bonds Given the high daily ETF
volumes and the limited proportion that could be assigned to investors with the most
demand for liquidity we believe the negative effect of passive management on high yield
turnover is likely nearing saturation
Could Passive Have an Even Larger Effect in the Future
Although the indirect channel discussed above is responsible for most of the effects of
passive strategies on turnover today we believe there is relatively little room for it to grow
Institutional holdings are likely near saturation based on our analysis of fund-level flow
volatility ndash absent a change in the nature of fund flows
However the direct channel could grow given the small share of high yield passive
investments The implications for high yield liquidity could increase if the share of passive
management becomes more akin to that of other high-penetration asset classes There are
signs of potential growth in retail-oriented passive as evidenced by a growing variety of
products including rates-hedged high yield ETFs fallen angel ETFs and target maturity
ETFs which are clearly intended to be used as investment strategies rather than liquidity
vehicles Sub-indices can be challenging to track because of low liquidity but funds can
alleviate this problem by judiciously choosing sub-indices with lower turnover such as
specific maturities or fallen angels
To determine the likelihood of meaningful gains in passive share we compare high yield
with other asset classes along two dimensions that we believe contribute to the
attractiveness of passive strategies
The potential for active alpha generation The more sources of systematic and
idiosyncratic risk an asset class is exposed to the more avenues an active manager has
to outperform We stack up high yield versus the high-penetration asset classes
The existence of viable investable passive instruments with limited tracking error and
low transaction costs We assess the potential attractiveness of passive high yield
investments to retail investors
Potential Sources of Alpha
The promise of outperforming a benchmark is increasingly plausible when active managers
have many demonstrable paths to doing so However asset classes are not created equally
with respect to alpha opportunities Asset classes have different sources of systemic or
idiosyncratic risk and those with more sources of risk are more suitable for active
management
We assess the potential for active outperformance incorporating dimensions of risk and
liquidity and market structure (Figure 8) We score market structure and liquidity on a scale
of one to five with higher numbers representing higher liquidity and ease of settlement A
higher score in this section makes a passive instrument easier to create We score potential
sources of alpha also from one to five Higher scores in these areas improve the potential
for alpha in that asset class increasing the ldquoactive scorerdquo We then compute an overall ratio
as the total score for alpha divided by the total score for market structure and liquidity
5 See Institutional Investment in ETFs Versatility Fuels Growth Greenwich Associates Q1 2016
17 February 2017 8
Barclays | Passive Aggression
This approach is admittedly arbitrary but it is telling that the asset classes with the highest
scores have thus far had lower passive penetration and vice versa suggesting that market
structure liquidity and opportunities for alpha are key determinants in the tug of war
between active and passive strategies For example the US government asset class has a
low active score with very high liquidity and few sources of alpha making it an ideal target
for passive management6 US equities have a few more sources of alpha but they are also
quite liquid and some of the most commonly used equity indices have a limited number of
securities relative to fixed income indices At the other extreme US loans and municipals
have high active scores with both structural impediments to passive management and
significant sources of potential alpha
FIGURE 8
Asset Class Scores for Liquidity and Sources of Alpha (1 = Low 5 = High)
US
Govt
US
Equities US IG US HY
Global
EM
US
Loans
US
Munis
Market Structure and Liquidity
Liquidity 5 4 3 3 2 3 1
East of Settlement 5 5 5 5 5 2 5
ExchangeOTC OTC Exch OTC OTC OTC OTC OTC
Systematic Alpha
Market Risk 1 5 2 4 5 4 2
RatesTerm Risk 5 1 4 2 4 1 5
New Issue 1 2 4 4 4 4 3
Idiosyncratic Alpha
Dispersion of Security Returns 1 5 3 5 5 4 2
Number of Securities 1 3 4 3 3 2 5
Number of Issuers 1 3 2 2 2 2 5
Number of Sectors 1 3 3 3 5 3 5
Security Features1 1 1 3 5 3 5 5
Active Score 12 26 31 35 44 50 53
Note Security features include collateral seniority covenants and embedded options Source Barclays Research
The active score for US high yield is in the middle it appears somewhat more amenable to
active management than equities and investment grade credit but less so than other asset
classes with a low passive share This speaks to the possibility of continued gains in passive
ndash certainly this scenario does not appear to be precluded by the nature of the asset class
despite the high level of alpha potential
The Viability of Passive High Yield
In liquid asset classes full index replication is a viable passive strategy However there are
enough small issues in high yield with irregular trading that implementing this strategy is
not practical Instead passive high yield funds are benchmarked against liquid sub-indices
such as the Bloomberg Barclays US HY Very Liquid Index (VLI) These sub-indices are
almost liquid enough to replicate but the funds still utilize sampling US high yield ETFs
typically own about 90 of the members of their liquid sub-index benchmarks This level of
sampling limits tracking error while allowing passive managers to avoid incurring excessive
transaction costs from being forced to trade the least liquid securities
6 The gap to the other asset classes is likely overstated somewhat as government funds likely have sources of alpha
(eg though securities lending) that we do not account for
17 February 2017 9
Barclays | Passive Aggression
The potential downside of using a sub-index is if the characteristics of the sub-index differ
in some material way from the broader index such that the passive funds are structurally
set up to underperform active funds that can invest in the full universe While this was true
to a certain extent at one time changes to the way the VLI and similar indices are
constructed have limited the differences (Figure 9)
FIGURE 9
Comparison of US High Yield and US HY Very Liquid Indices
Yield () OAS (bp) Duration Average Liquidity Cost
(yrs) Rating Score ()
US High Yield Index 575 380 402 B1B2 11
US HY Very Liquid Index (VLI) 565 363 401 B1B2 09
Source Bloomberg
We do not believe that the VLI is likely to systematically underperform or outperform the
overall high yield market and the distribution of liquidity in the underlying bonds is
sufficient for managers to track the performance of the sub-index closely enough As a
result we do not believe that viability poses an impediment to gains in passive share
US high yield does have characteristics that make it amenable to passive management
Furthermore a liquid sub-index can be a viable proxy for the overall market giving passive
managers a solid foothold While the asset class has good potential sources of alpha its
ldquoactive scorerdquo is only marginally better than that of investment grade where 37 of funds
are passively managed compared with 15 in high yield apparently leaving considerable
room for passive strategies to grow
More recent products stand out because of their much lower costs and focus on a broad-
market index rather than a liquid sub-index Those choices imply that these products are
meant for cost-sensitive retail investors rather than liquidity-sensitive institutional
managers Lower costs are indeed a key feature for retail investors Morningstar data show
that funds in the lowest fee quintile have attracted the lionrsquos share of inflows for a long time
and that the other 80 of funds have in aggregate experienced net outflows over the past
decade (Figure 10) This trend has driven continued fee compression across the entire fund
landscape The average management fee for active funds in 2000 was 101bp according to
Morningstar that average had dropped to 78bp by the end of 2015 Even passive funds are
responding to the demand for lower costs with the average fee dropping from 26bp to
18bp over the same period (Figure 11)
FIGURE 10 FIGURE 11
Net Annual Fund Flows by Fee Quintile ($bn) Asset-Weighted Expense Ratios (bp)
-300
-200
-100
0
100
200
300
400
500
600
02 03 04 05 06 07 08 09 10 11 12 13 14 15
Quintile 1 (Passive) Quintile 1 (Active) Q2-Q5 (All)
0
20
40
60
80
100
120
90 92 94 96 98 00 02 04 06 08 10 12 14
Passive Active All
Note Data as of December 31 2015 Source Morningstar Source Morningstar
17 February 2017 10
Barclays | Passive Aggression
The Future of Passive High Yield
We believe not only that passive is viable in high yield but also that its penetration rate is
likely to increase Assuming that half of the current 15 passive share actually represents
institutions using the ETFs for their liquidity and simplicity the true retail passive share of
high yield could increase about 29 before it matches investment grade where passive is
almost entirely a true retail product that scenario would put the passive share of high yield
at about 45 We see that as a cap given that high yield passive should be no more viable
than investment grade passive However the associated decline in high yield turnover under
even a 45 passive penetration rate is only an additional 36 As shown above most of
the adverse effects of passive management on high yield liquidity do not come from true
retail substitution but rather from institutional usage
Thus understanding the growth in institutional usage is the key to determining potential
future liquidity impairment Retail funds already use ETFs for liquidity management and we
believe that barring a meaningful change in fund flow volatility that channel may be
saturated That said institutions such as pensions and endowments could certainly
continue to increase their usage some of which would substitute for bond trading
Importantly this continued shift could lead to a self-reinforcing decline in high yield
liquidity More passive strategies should theoretically make it easier for active managers to
outperform as competition declines However liquidity also deteriorates with more passive
investment making it more difficult to convert alpha opportunities into actual
outperformance If the latter effect dominates the shift to passive could become self-
reinforcing We believe active investors will be grappling with this trade-off for the
foreseeable future particularly in years of low idiosyncratic volatility
17 February 2017 11
Analyst Certification
We Eric Gross and Jeffrey Meli hereby certify (1) that the views expressed in this research report accurately reflect our personal views about any or all of the
subject securities or issuers referred to in this research report and (2) no part of our compensation was is or will be directly or indirectly related to the specific
recommendations or views expressed in this research report
Important Disclosures
Barclays Research is a part of the Investment Bank of Barclays Bank PLC and its affiliates (collectively and each individually Barclays)
All authors contributing to this research report are Research Analysts unless otherwise indicated The publication date at the top of the report reflects the
local time where the report was produced and may differ from the release date provided in GMT
Availability of Disclosures
For current important disclosures regarding any issuers which are the subject of this research report please refer to httpspublicresearchbarclayscom or
alternatively send a written request to Barclays Research Compliance 745 Seventh Avenue 13th Floor New York NY 10019 or call +1-212-526-1072
Barclays Capital Inc andor one of its affiliates does and seeks to do business with companies covered in its research reports As a result investors should be
aware that Barclays may have a conflict of interest that could affect the objectivity of this report Barclays Capital Inc andor one of its affiliates regularly
trades generally deals as principal and generally provides liquidity (as market maker or otherwise) in the debt securities that are the subject of this research
report (and related derivatives thereof) Barclays trading desks may have either a long and or short position in such securities other financial instruments
and or derivatives which may pose a conflict with the interests of investing customers Where permitted and subject to appropriate information barrier
restrictions Barclays fixed income research analysts regularly interact with its trading desk personnel regarding current market conditions and prices
Barclays fixed income research analysts receive compensation based on various factors including but not limited to the quality of their work the overall
performance of the firm (including the profitability of the Investment Banking Department) the profitability and revenues of the Markets business and the
potential interest of the firms investing clients in research with respect to the asset class covered by the analyst To the extent that any historical pricing
information was obtained from Barclays trading desks the firm makes no representation that it is accurate or complete All levels prices and spreads are
historical and do not represent current market levels prices or spreads some or all of which may have changed since the publication of this document The
Investment Banks Research Department produces various types of research including but not limited to fundamental analysis equity-linked analysis
quantitative analysis and trade ideas Recommendations contained in one type of research may differ from recommendations contained in other types of
research whether as a result of differing time horizons methodologies or otherwise In order to access Barclays Statement regarding Research
Dissemination Policies and Procedures please refer to httpspublicresearchbarcapcomstaticS_ResearchDisseminationhtml In order to access Barclays
Research Conflict Management Policy Statement please refer to httpspublicresearchbarcapcomstaticS_ConflictManagementhtml
All pricing information is indicative only Prices are sourced from Thomson Reuters as of the last available closing price at the time of production of the
research report unless another time and source is indicated
Explanation of other types of investment recommendations produced by Barclays FICC Research
Trade ideas contained herein that have been produced by the Credit teams within Barclays Research are valid at current market conditions and may not be
otherwise relied upon
Trade ideas contained herein that have been produced by other research teams within Barclays FICC Research shall remain open until they are subsequently
amended or closed in a future research report
Disclosure of previous investment recommendations produced by Barclays FICC Research
Barclays FICC Research may have published other investment recommendations in respect of the same securitiesinstruments recommended in this
research report during the preceding 12 months To view previous investment recommendations published by Barclays FICC Research in the preceding 12
months please refer to httpslivebarcapcomgoresearchResearchInvestmentRecommendations
Barclays legal entities involved in publishing research
Barclays Bank PLC (Barclays UK)
Barclays Capital Inc (BCI US)
Barclays Securities Japan Limited (BSJL Japan)
Barclays Bank PLC Hong Kong branch (Barclays Bank Hong Kong)
Barclays Capital Canada Inc (BCCI Canada)
Absa Bank Limited (Absa South Africa)
Barclays Bank Mexico SA (BBMX Mexico)
Barclays Securities (India) Private Limited (BSIPL India)
Barclays Bank PLC India branch (Barclays Bank India)
Barclays Bank PLC Singapore branch (Barclays Bank Singapore)
Disclaimer
This publication has been produced by the Investment Bank of Barclays Bank PLC andor one or more of its affiliates (collectively and each individually
Barclays) It has been distributed by one or more Barclays legal entities that are a part of the Investment Bank as provided below It is provided to our clients
for information purposes only and Barclays makes no express or implied warranties and expressly disclaims all warranties of merchantability or fitness for a
particular purpose or use with respect to any data included in this publication To the extent that this publication states on the front page that it is intended
for institutional investors and is not subject to all of the independence and disclosure standards applicable to debt research reports prepared for retail
investors under US FINRA Rule 2242 it is an ldquoinstitutional debt research reportrdquo and distribution to retail investors is strictly prohibited Barclays also
distributes such institutional debt research reports to various issuers regulatory and academic organisations for informational purposes and not for the
purpose of making investment decisions regarding any debt securities Any such recipients that do not want to continue receiving Barclays institutional debt
research reports should contact debtresearchbarclayscom Barclays will not treat unauthorized recipients of this report as its clients and accepts no liability
for use by them of the contents which may not be suitable for their personal use Prices shown are indicative and Barclays is not offering to buy or sell or
soliciting offers to buy or sell any financial instrument
Without limiting any of the foregoing and to the extent permitted by law in no event shall Barclays nor any affiliate nor any of their respective officers
directors partners or employees have any liability for (a) any special punitive indirect or consequential damages or (b) any lost profits lost revenue loss of
anticipated savings or loss of opportunity or other financial loss even if notified of the possibility of such damages arising from any use of this publication or
its contents
Other than disclosures relating to Barclays the information contained in this publication has been obtained from sources that Barclays Research believes to
be reliable but Barclays does not represent or warrant that it is accurate or complete Barclays is not responsible for and makes no warranties whatsoever as
to the information or opinions contained in any written electronic audio or video presentations of third parties that are accessible via a direct hyperlink in
this publication or via a hyperlink to a third-party web site (lsquoThird-Party Contentrsquo) Any such Third-Party Content has not been adopted or endorsed by
Barclays does not represent the views or opinions of Barclays and is not incorporated by reference into this publication Third-Party Content is provided for
information purposes only and Barclays has not independently verified its accuracy or completeness
The views in this publication are those of the author(s) and are subject to change and Barclays has no obligation to update its opinions or the information in
this publication If this publication contains recommendations those recommendations reflect solely and exclusively those of the authoring analyst(s) and
such opinions were prepared independently of any other interests including those of Barclays andor its affiliates This publication does not constitute
personal investment advice or take into account the individual financial circumstances or objectives of the clients who receive it The securities discussed
herein may not be suitable for all investors Barclays recommends that investors independently evaluate each issuer security or instrument discussed herein
and consult any independent advisors they believe necessary The value of and income from any investment may fluctuate from day to day as a result of
changes in relevant economic markets (including changes in market liquidity) The information herein is not intended to predict actual results which may
differ substantially from those reflected Past performance is not necessarily indicative of future results
This document is being distributed (1) only by or with the approval of an authorised person (Barclays Bank PLC) or (2) to and is directed at (a) persons in the
United Kingdom having professional experience in matters relating to investments and who fall within the definition of investment professionals in Article
19(5) of the Financial Services and Markets Act 2000 (Financial Promotion) Order 2005 (the Order) or (b) high net worth companies unincorporated
associations and partnerships and trustees of high value trusts as described in Article 49(2) of the Order or (c) other persons to whom it may otherwise
lawfully be communicated (all such persons being Relevant Persons) Any investment or investment activity to which this communication relates is only
available to and will only be engaged in with Relevant Persons Any other persons who receive this communication should not rely on or act upon it
Barclays Bank PLC is authorised by the Prudential Regulation Authority and regulated by the Financial Conduct Authority and the Prudential Regulation
Authority and is a member of the London Stock Exchange
The Investment Bank of Barclays Bank PLC undertakes US securities business in the name of its wholly owned subsidiary Barclays Capital Inc a FINRA and
SIPC member Barclays Capital Inc a US registered brokerdealer is distributing this material in the United States and in connection therewith accepts
responsibility for its contents Any US person wishing to effect a transaction in any security discussed herein should do so only by contacting a
representative of Barclays Capital Inc in the US at 745 Seventh Avenue New York New York 10019
Non-US persons should contact and execute transactions through a Barclays Bank PLC branch or affiliate in their home jurisdiction unless local regulations
permit otherwise
Barclays Bank PLC Paris Branch (registered in France under Paris RCS number 381 066 281) is regulated by the Autoriteacute des marcheacutes financiers and the
Autoriteacute de controcircle prudentiel Registered office 3436 Avenue de Friedland 75008 Paris
This material is distributed in Canada by Barclays Capital Canada Inc a registered investment dealer a Dealer Member of IIROC (wwwiirocca) and a
Member of the Canadian Investor Protection Fund (CIPF)
Subject to the conditions of this publication as set out above the Corporate amp Investment Banking Division of Absa Bank Limited an authorised financial
services provider (Registration No 198600479406 Registered Credit Provider Reg No NCRCP7) is distributing this material in South Africa Absa Bank
Limited is regulated by the South African Reserve Bank This publication is not nor is it intended to be advice as defined andor contemplated in the (South
African) Financial Advisory and Intermediary Services Act 37 of 2002 or any other financial investment trading tax legal accounting retirement actuarial
or other professional advice or service whatsoever Any South African person or entity wishing to effect a transaction in any security discussed herein should
do so only by contacting a representative of the Corporate amp Investment Banking Division of Absa Bank Limited in South Africa 15 Alice Lane Sandton
Johannesburg Gauteng 2196 Absa Bank Limited is a member of the Barclays group
All research reports are distributed to institutional investors in Japan by Barclays Securities Japan Limited Barclays Securities Japan Limited is a joint-stock
company incorporated in Japan with registered office of 6-10-1 Roppongi Minato-ku Tokyo 106-6131 Japan It is a subsidiary of Barclays Bank PLC and a
registered financial instruments firm regulated by the Financial Services Agency of Japan Registered Number Kanto Zaimukyokucho (kinsho) No 143
Barclays Bank PLC Hong Kong Branch is distributing this material in Hong Kong as an authorised institution regulated by the Hong Kong Monetary Authority
Registered Office 41F Cheung Kong Center 2 Queens Road Central Hong Kong
All Indian securities-related research and other equity research produced by the Investment Bank are distributed in India by Barclays Securities (India) Private
Limited (BSIPL) BSIPL is a company incorporated under the Companies Act 1956 having CIN U67120MH2006PTC161063 BSIPL is registered and regulated
by the Securities and Exchange Board of India (SEBI) as a Research Analyst INH000001519 Portfolio Manager INP000002585 Stock BrokerTrading and
Clearing Member National Stock Exchange of India Limited (NSE) Capital Market INB231292732 NSE Futures amp Options INF231292732 NSE Currency
derivatives INE231450334 Bombay Stock Exchange Limited (BSE) Capital Market INB011292738 BSE Futures amp Options INF011292738 Depository
Participant (DP) with the National Securities amp Depositories Limited (NSDL) DP ID IN-DP-NSDL-299-2008 Investment Adviser INA000000391 The
registered office of BSIPL is at 208 Ceejay House Shivsagar Estate Dr A Besant Road Worli Mumbai ndash 400 018 India Telephone No +91 2267196000 Fax
number +91 22 67196100 Any other reports produced by the Investment Bank are distributed in India by Barclays Bank PLC India Branch an associate of
BSIPL in India that is registered with Reserve Bank of India (RBI) as a Banking Company under the provisions of The Banking Regulation Act 1949 (Regn No
BOM43) and registered with SEBI as Merchant Banker (Regn No INM000002129) and also as Banker to the Issue (Regn No INBI00000950) Barclays
Investments and Loans (India) Limited registered with RBI as Non Banking Financial Company (Regn No RBI CoR-07-00258) and Barclays Wealth Trustees
(India) Private Limited registered with Registrar of Companies (CIN U93000MH2008PTC188438) are associates of BSIPL in India that are not authorised to
distribute any reports produced by the Investment Bank
Barclays Bank PLC Frankfurt Branch distributes this material in Germany under the supervision of Bundesanstalt fuumlr Finanzdienstleistungsaufsicht (BaFin)
This material is distributed in Brazil by Banco Barclays SA
This material is distributed in Mexico by Barclays Bank Mexico SA
Barclays Bank PLC in the Dubai International Financial Centre (Registered No 0060) is regulated by the Dubai Financial Services Authority (DFSA) Principal
place of business in the Dubai International Financial Centre The Gate Village Building 4 Level 4 PO Box 506504 Dubai United Arab Emirates Barclays Bank
PLC-DIFC Branch may only undertake the financial services activities that fall within the scope of its existing DFSA licence Related financial products or
services are only available to Professional Clients as defined by the Dubai Financial Services Authority
Barclays Bank PLC in the UAE is regulated by the Central Bank of the UAE and is licensed to conduct business activities as a branch of a commercial bank
incorporated outside the UAE in Dubai (Licence No 1318442008 Registered Office Building No 6 Burj Dubai Business Hub Sheikh Zayed Road Dubai
City) and Abu Dhabi (Licence No 139522008 Registered Office Al Jazira Towers Hamdan Street PO Box 2734 Abu Dhabi)
Barclays Bank PLC in the Qatar Financial Centre (Registered No 00018) is authorised by the Qatar Financial Centre Regulatory Authority (QFCRA) Barclays
Bank PLC-QFC Branch may only undertake the regulated activities that fall within the scope of its existing QFCRA licence Principal place of business in Qatar
Qatar Financial Centre Office 1002 10th Floor QFC Tower Diplomatic Area West Bay PO Box 15891 Doha Qatar Related financial products or services are
only available to Business Customers as defined by the Qatar Financial Centre Regulatory Authority
This material is distributed in the UAE (including the Dubai International Financial Centre) and Qatar by Barclays Bank PLC
This material is not intended for investors who are not Qualified Investors according to the laws of the Russian Federation as it might contain information
about or description of the features of financial instruments not admitted for public offering andor circulation in the Russian Federation and thus not eligible
for non-Qualified Investors If you are not a Qualified Investor according to the laws of the Russian Federation please dispose of any copy of this material in
your possession
This material is distributed in Singapore by the Singapore branch of Barclays Bank PLC a bank licensed in Singapore by the Monetary Authority of Singapore
For matters in connection with this report recipients in Singapore may contact the Singapore branch of Barclays Bank PLC whose registered address is 10
Marina Boulevard 23-01 Marina Bay Financial Centre Tower 2 Singapore 018983
This material is distributed to persons in Australia by Barclays Bank plc Barclays Bank plc does not hold an Australian financial services licence and instead
relies on an exemption This material is intended to only be distributed to ldquowholesale clientsrdquo as defined by the Australian Corporations Act 2001
IRS Circular 230 Prepared Materials Disclaimer Barclays does not provide tax advice and nothing contained herein should be construed to be tax advice
Please be advised that any discussion of US tax matters contained herein (including any attachments) (i) is not intended or written to be used and cannot
be used by you for the purpose of avoiding US tax-related penalties and (ii) was written to support the promotion or marketing of the transactions or other
matters addressed herein Accordingly you should seek advice based on your particular circumstances from an independent tax advisor
copy Copyright Barclays Bank PLC (2017) All rights reserved No part of this publication may be reproduced or redistributed in any manner without the prior
written permission of Barclays Barclays Bank PLC is registered in England No 1026167 Registered office 1 Churchill Place London E14 5HP Additional
information regarding this publication will be furnished upon request
BRCF2242

Barclays | Passive Aggression
benefit of trading in the secondary market High concentration leads to larger secondary
flows which is useful for institutional managers trying to use ETFs to manage inflows and
outflows Without sufficient secondary trading selling of shares is more likely to lead to
share destruction which relies on the liquidity of the underlying market ETFs mitigate
liquidity needs only to the extent that their secondary trading volumes are large relative to
primary volumes (ie share creation and redemption volumes) A large number of thinly
traded ETFs would not be useful to institutional managers Indeed the largest four high
yield ETFs have secondary volumes of 4-8x primary volumes
The second piece of evidence is price The active-passive cost difference for high yield is
much lower than for asset classes with significant passive penetration (Figure 6) In fact it is
larger only than loans where the passive share is de minimis One of the draws of passive
for retail investors is lower fees and we would expect cost savings to be a key selling point
for funds targeted at those investors Given the high concentration there appears to be
room for funds to compete for retail share with lower fees In contrast an institution looking
to ETFs to help manage liquidity is unlikely to be interested in a new lower cost fund that
has less secondary liquidity
FIGURE 6
Average Expense Ratio for Top 20 Funds by AUM (bp)
-30
-38
-40
-46
-74 -77-86
0
10
20
30
40
50
60
70
80
90
US Loans US HY US Munis Global EM US Govt US IG US Equity
Active Passive
Source Bloomberg
Finally the largest high yield ETFs are benchmarked to either a liquid sub-index or a short
duration sub-index with very little style diversity The close link to the benchmark is
important for institutions looking to minimize tracking error but less important for retail-
oriented funds which we would expect to target specific segments of the market Although
there has been some recent movement on this front (more on this below) the largest funds
are surprisingly similar The only differentiation has been the few funds focused on short-
duration assets which is particularly telling given that short-duration bonds are commonly
used as cash substitutes by high yield portfolio managers with daily liquidity needs
Estimating the Indirect Effect on Turnover of Institutions Using ETFs
The passive share of high yield fund AUM can therefore be thought of as comprising two
different types of owners retail investors that own ETFs as part of their investment strategy
and institutions that use them primarily for liquidity management Secondary flows from the
first group are not replacing corporate bond trading ndash they are similar to gross flows for an
open-end mutual fund which are netted at NAV Secondary flows from institutions
however may be replacing trades in the underlying corporate bonds
17 February 2017 6
Barclays | Passive Aggression
This is an important differentiation because the overall flows for high yield ETFs are large
relative to the size of the high yield market despite the relatively small size of the funds
Daily TRACE volumes in high yield bonds averaged $12bn last year Secondary trading in
the four largest high yield ETFs which represent only about 3 of total high yield assets
was $16bn daily in 2016 The contrast in turnover is striking we estimate annual turnover
of about 14x for high yield while the ETF numbers imply annual turnover of 107x
Secondary ETF volumes are so significant that if they were fully substituting away from
secondary corporate activity the implications for bond turnover would be substantial
Figure 7 divides total secondary ETF volume by the size of the high yield market to convert
those volumes into a turnover-equivalent measure
FIGURE 7
ETF Volumes Divided by High Yield Par Outstanding
2 2 4 4 4 5 746
10
1619
1517
29
0
5
10
15
20
25
30
35
40
07 08 09 10 11 12 13 14 15 16
ETF Fund Flows Secondary ETF Volume
Note ETF flows are subtracted from secondary ETF volumes Source Bloomberg
In order to understand the size of the ETF volumes we estimate the potential contribution
from a few possible sources of activity First we estimate how much secondary volume
could be coming from retail owners of ETFs For the overall retail fund universe average
daily gross fund flows have been $731mn over the past 15 months ETFs represent about
9 of retail which would indicate that ETF gross flows from that investor base would be at
most $65mn per day (assuming that retail directly owned 100 of the ETFs outstanding
which we know not to be the case) Even if retail owners were more likely to trade ETFs than
buy or sell open fund vehicles ndash which sounds sensible given the intraday tradability of ETFs
ndash we think it is unlikely that retail owners make up more than 10 of total secondary
volumes in ETFs
That leaves institutional owners to make up the remainder of the secondary flows We can
estimate the possible trading from open-end mutual funds starting with the gross flows
statistic cited above Even if retail fund managers exclusively used ETFs to manage flows
this activity would account for about 46 of secondary ETF volumes This is surely an
overestimate of those institutionsrsquo activity for two reasons First only about 54 of those
flows are diversifiable meaning that ETFs cannot reasonably be used to satisfy every inflow
and outflow Second these managers do not exclusively use ETFs for liquidity management
ndash they also use other portfolio products such as CDX and liquid bonds Unless fund flow
volatility picks up materially we believe that any incremental liquidity effect of retail funds
using ETFs would likely be small
Other institutions (eg institutional asset management mandates pensions endowments
foundations and hedge funds) must therefore be driving a significant share of secondary
17 February 2017 7
Barclays | Passive Aggression
ETF volume Surveys have indeed shown5 that these institutions have consistently increased
their use of fixed income ETFs in recent years At least some of this activity likely comes at
the expense of bond trading Some is also likely from trading that is opportunistic given the
high liquidity of high yield ETFs such that participants are taking shorter-term views on
high yield that would not otherwise be implemented in bonds Given the high daily ETF
volumes and the limited proportion that could be assigned to investors with the most
demand for liquidity we believe the negative effect of passive management on high yield
turnover is likely nearing saturation
Could Passive Have an Even Larger Effect in the Future
Although the indirect channel discussed above is responsible for most of the effects of
passive strategies on turnover today we believe there is relatively little room for it to grow
Institutional holdings are likely near saturation based on our analysis of fund-level flow
volatility ndash absent a change in the nature of fund flows
However the direct channel could grow given the small share of high yield passive
investments The implications for high yield liquidity could increase if the share of passive
management becomes more akin to that of other high-penetration asset classes There are
signs of potential growth in retail-oriented passive as evidenced by a growing variety of
products including rates-hedged high yield ETFs fallen angel ETFs and target maturity
ETFs which are clearly intended to be used as investment strategies rather than liquidity
vehicles Sub-indices can be challenging to track because of low liquidity but funds can
alleviate this problem by judiciously choosing sub-indices with lower turnover such as
specific maturities or fallen angels
To determine the likelihood of meaningful gains in passive share we compare high yield
with other asset classes along two dimensions that we believe contribute to the
attractiveness of passive strategies
The potential for active alpha generation The more sources of systematic and
idiosyncratic risk an asset class is exposed to the more avenues an active manager has
to outperform We stack up high yield versus the high-penetration asset classes
The existence of viable investable passive instruments with limited tracking error and
low transaction costs We assess the potential attractiveness of passive high yield
investments to retail investors
Potential Sources of Alpha
The promise of outperforming a benchmark is increasingly plausible when active managers
have many demonstrable paths to doing so However asset classes are not created equally
with respect to alpha opportunities Asset classes have different sources of systemic or
idiosyncratic risk and those with more sources of risk are more suitable for active
management
We assess the potential for active outperformance incorporating dimensions of risk and
liquidity and market structure (Figure 8) We score market structure and liquidity on a scale
of one to five with higher numbers representing higher liquidity and ease of settlement A
higher score in this section makes a passive instrument easier to create We score potential
sources of alpha also from one to five Higher scores in these areas improve the potential
for alpha in that asset class increasing the ldquoactive scorerdquo We then compute an overall ratio
as the total score for alpha divided by the total score for market structure and liquidity
5 See Institutional Investment in ETFs Versatility Fuels Growth Greenwich Associates Q1 2016
17 February 2017 8
Barclays | Passive Aggression
This approach is admittedly arbitrary but it is telling that the asset classes with the highest
scores have thus far had lower passive penetration and vice versa suggesting that market
structure liquidity and opportunities for alpha are key determinants in the tug of war
between active and passive strategies For example the US government asset class has a
low active score with very high liquidity and few sources of alpha making it an ideal target
for passive management6 US equities have a few more sources of alpha but they are also
quite liquid and some of the most commonly used equity indices have a limited number of
securities relative to fixed income indices At the other extreme US loans and municipals
have high active scores with both structural impediments to passive management and
significant sources of potential alpha
FIGURE 8
Asset Class Scores for Liquidity and Sources of Alpha (1 = Low 5 = High)
US
Govt
US
Equities US IG US HY
Global
EM
US
Loans
US
Munis
Market Structure and Liquidity
Liquidity 5 4 3 3 2 3 1
East of Settlement 5 5 5 5 5 2 5
ExchangeOTC OTC Exch OTC OTC OTC OTC OTC
Systematic Alpha
Market Risk 1 5 2 4 5 4 2
RatesTerm Risk 5 1 4 2 4 1 5
New Issue 1 2 4 4 4 4 3
Idiosyncratic Alpha
Dispersion of Security Returns 1 5 3 5 5 4 2
Number of Securities 1 3 4 3 3 2 5
Number of Issuers 1 3 2 2 2 2 5
Number of Sectors 1 3 3 3 5 3 5
Security Features1 1 1 3 5 3 5 5
Active Score 12 26 31 35 44 50 53
Note Security features include collateral seniority covenants and embedded options Source Barclays Research
The active score for US high yield is in the middle it appears somewhat more amenable to
active management than equities and investment grade credit but less so than other asset
classes with a low passive share This speaks to the possibility of continued gains in passive
ndash certainly this scenario does not appear to be precluded by the nature of the asset class
despite the high level of alpha potential
The Viability of Passive High Yield
In liquid asset classes full index replication is a viable passive strategy However there are
enough small issues in high yield with irregular trading that implementing this strategy is
not practical Instead passive high yield funds are benchmarked against liquid sub-indices
such as the Bloomberg Barclays US HY Very Liquid Index (VLI) These sub-indices are
almost liquid enough to replicate but the funds still utilize sampling US high yield ETFs
typically own about 90 of the members of their liquid sub-index benchmarks This level of
sampling limits tracking error while allowing passive managers to avoid incurring excessive
transaction costs from being forced to trade the least liquid securities
6 The gap to the other asset classes is likely overstated somewhat as government funds likely have sources of alpha
(eg though securities lending) that we do not account for
17 February 2017 9
Barclays | Passive Aggression
The potential downside of using a sub-index is if the characteristics of the sub-index differ
in some material way from the broader index such that the passive funds are structurally
set up to underperform active funds that can invest in the full universe While this was true
to a certain extent at one time changes to the way the VLI and similar indices are
constructed have limited the differences (Figure 9)
FIGURE 9
Comparison of US High Yield and US HY Very Liquid Indices
Yield () OAS (bp) Duration Average Liquidity Cost
(yrs) Rating Score ()
US High Yield Index 575 380 402 B1B2 11
US HY Very Liquid Index (VLI) 565 363 401 B1B2 09
Source Bloomberg
We do not believe that the VLI is likely to systematically underperform or outperform the
overall high yield market and the distribution of liquidity in the underlying bonds is
sufficient for managers to track the performance of the sub-index closely enough As a
result we do not believe that viability poses an impediment to gains in passive share
US high yield does have characteristics that make it amenable to passive management
Furthermore a liquid sub-index can be a viable proxy for the overall market giving passive
managers a solid foothold While the asset class has good potential sources of alpha its
ldquoactive scorerdquo is only marginally better than that of investment grade where 37 of funds
are passively managed compared with 15 in high yield apparently leaving considerable
room for passive strategies to grow
More recent products stand out because of their much lower costs and focus on a broad-
market index rather than a liquid sub-index Those choices imply that these products are
meant for cost-sensitive retail investors rather than liquidity-sensitive institutional
managers Lower costs are indeed a key feature for retail investors Morningstar data show
that funds in the lowest fee quintile have attracted the lionrsquos share of inflows for a long time
and that the other 80 of funds have in aggregate experienced net outflows over the past
decade (Figure 10) This trend has driven continued fee compression across the entire fund
landscape The average management fee for active funds in 2000 was 101bp according to
Morningstar that average had dropped to 78bp by the end of 2015 Even passive funds are
responding to the demand for lower costs with the average fee dropping from 26bp to
18bp over the same period (Figure 11)
FIGURE 10 FIGURE 11
Net Annual Fund Flows by Fee Quintile ($bn) Asset-Weighted Expense Ratios (bp)
-300
-200
-100
0
100
200
300
400
500
600
02 03 04 05 06 07 08 09 10 11 12 13 14 15
Quintile 1 (Passive) Quintile 1 (Active) Q2-Q5 (All)
0
20
40
60
80
100
120
90 92 94 96 98 00 02 04 06 08 10 12 14
Passive Active All
Note Data as of December 31 2015 Source Morningstar Source Morningstar
17 February 2017 10
Barclays | Passive Aggression
The Future of Passive High Yield
We believe not only that passive is viable in high yield but also that its penetration rate is
likely to increase Assuming that half of the current 15 passive share actually represents
institutions using the ETFs for their liquidity and simplicity the true retail passive share of
high yield could increase about 29 before it matches investment grade where passive is
almost entirely a true retail product that scenario would put the passive share of high yield
at about 45 We see that as a cap given that high yield passive should be no more viable
than investment grade passive However the associated decline in high yield turnover under
even a 45 passive penetration rate is only an additional 36 As shown above most of
the adverse effects of passive management on high yield liquidity do not come from true
retail substitution but rather from institutional usage
Thus understanding the growth in institutional usage is the key to determining potential
future liquidity impairment Retail funds already use ETFs for liquidity management and we
believe that barring a meaningful change in fund flow volatility that channel may be
saturated That said institutions such as pensions and endowments could certainly
continue to increase their usage some of which would substitute for bond trading
Importantly this continued shift could lead to a self-reinforcing decline in high yield
liquidity More passive strategies should theoretically make it easier for active managers to
outperform as competition declines However liquidity also deteriorates with more passive
investment making it more difficult to convert alpha opportunities into actual
outperformance If the latter effect dominates the shift to passive could become self-
reinforcing We believe active investors will be grappling with this trade-off for the
foreseeable future particularly in years of low idiosyncratic volatility
17 February 2017 11
Analyst Certification
We Eric Gross and Jeffrey Meli hereby certify (1) that the views expressed in this research report accurately reflect our personal views about any or all of the
subject securities or issuers referred to in this research report and (2) no part of our compensation was is or will be directly or indirectly related to the specific
recommendations or views expressed in this research report
Important Disclosures
Barclays Research is a part of the Investment Bank of Barclays Bank PLC and its affiliates (collectively and each individually Barclays)
All authors contributing to this research report are Research Analysts unless otherwise indicated The publication date at the top of the report reflects the
local time where the report was produced and may differ from the release date provided in GMT
Availability of Disclosures
For current important disclosures regarding any issuers which are the subject of this research report please refer to httpspublicresearchbarclayscom or
alternatively send a written request to Barclays Research Compliance 745 Seventh Avenue 13th Floor New York NY 10019 or call +1-212-526-1072
Barclays Capital Inc andor one of its affiliates does and seeks to do business with companies covered in its research reports As a result investors should be
aware that Barclays may have a conflict of interest that could affect the objectivity of this report Barclays Capital Inc andor one of its affiliates regularly
trades generally deals as principal and generally provides liquidity (as market maker or otherwise) in the debt securities that are the subject of this research
report (and related derivatives thereof) Barclays trading desks may have either a long and or short position in such securities other financial instruments
and or derivatives which may pose a conflict with the interests of investing customers Where permitted and subject to appropriate information barrier
restrictions Barclays fixed income research analysts regularly interact with its trading desk personnel regarding current market conditions and prices
Barclays fixed income research analysts receive compensation based on various factors including but not limited to the quality of their work the overall
performance of the firm (including the profitability of the Investment Banking Department) the profitability and revenues of the Markets business and the
potential interest of the firms investing clients in research with respect to the asset class covered by the analyst To the extent that any historical pricing
information was obtained from Barclays trading desks the firm makes no representation that it is accurate or complete All levels prices and spreads are
historical and do not represent current market levels prices or spreads some or all of which may have changed since the publication of this document The
Investment Banks Research Department produces various types of research including but not limited to fundamental analysis equity-linked analysis
quantitative analysis and trade ideas Recommendations contained in one type of research may differ from recommendations contained in other types of
research whether as a result of differing time horizons methodologies or otherwise In order to access Barclays Statement regarding Research
Dissemination Policies and Procedures please refer to httpspublicresearchbarcapcomstaticS_ResearchDisseminationhtml In order to access Barclays
Research Conflict Management Policy Statement please refer to httpspublicresearchbarcapcomstaticS_ConflictManagementhtml
All pricing information is indicative only Prices are sourced from Thomson Reuters as of the last available closing price at the time of production of the
research report unless another time and source is indicated
Explanation of other types of investment recommendations produced by Barclays FICC Research
Trade ideas contained herein that have been produced by the Credit teams within Barclays Research are valid at current market conditions and may not be
otherwise relied upon
Trade ideas contained herein that have been produced by other research teams within Barclays FICC Research shall remain open until they are subsequently
amended or closed in a future research report
Disclosure of previous investment recommendations produced by Barclays FICC Research
Barclays FICC Research may have published other investment recommendations in respect of the same securitiesinstruments recommended in this
research report during the preceding 12 months To view previous investment recommendations published by Barclays FICC Research in the preceding 12
months please refer to httpslivebarcapcomgoresearchResearchInvestmentRecommendations
Barclays legal entities involved in publishing research
Barclays Bank PLC (Barclays UK)
Barclays Capital Inc (BCI US)
Barclays Securities Japan Limited (BSJL Japan)
Barclays Bank PLC Hong Kong branch (Barclays Bank Hong Kong)
Barclays Capital Canada Inc (BCCI Canada)
Absa Bank Limited (Absa South Africa)
Barclays Bank Mexico SA (BBMX Mexico)
Barclays Securities (India) Private Limited (BSIPL India)
Barclays Bank PLC India branch (Barclays Bank India)
Barclays Bank PLC Singapore branch (Barclays Bank Singapore)
Disclaimer
This publication has been produced by the Investment Bank of Barclays Bank PLC andor one or more of its affiliates (collectively and each individually
Barclays) It has been distributed by one or more Barclays legal entities that are a part of the Investment Bank as provided below It is provided to our clients
for information purposes only and Barclays makes no express or implied warranties and expressly disclaims all warranties of merchantability or fitness for a
particular purpose or use with respect to any data included in this publication To the extent that this publication states on the front page that it is intended
for institutional investors and is not subject to all of the independence and disclosure standards applicable to debt research reports prepared for retail
investors under US FINRA Rule 2242 it is an ldquoinstitutional debt research reportrdquo and distribution to retail investors is strictly prohibited Barclays also
distributes such institutional debt research reports to various issuers regulatory and academic organisations for informational purposes and not for the
purpose of making investment decisions regarding any debt securities Any such recipients that do not want to continue receiving Barclays institutional debt
research reports should contact debtresearchbarclayscom Barclays will not treat unauthorized recipients of this report as its clients and accepts no liability
for use by them of the contents which may not be suitable for their personal use Prices shown are indicative and Barclays is not offering to buy or sell or
soliciting offers to buy or sell any financial instrument
Without limiting any of the foregoing and to the extent permitted by law in no event shall Barclays nor any affiliate nor any of their respective officers
directors partners or employees have any liability for (a) any special punitive indirect or consequential damages or (b) any lost profits lost revenue loss of
anticipated savings or loss of opportunity or other financial loss even if notified of the possibility of such damages arising from any use of this publication or
its contents
Other than disclosures relating to Barclays the information contained in this publication has been obtained from sources that Barclays Research believes to
be reliable but Barclays does not represent or warrant that it is accurate or complete Barclays is not responsible for and makes no warranties whatsoever as
to the information or opinions contained in any written electronic audio or video presentations of third parties that are accessible via a direct hyperlink in
this publication or via a hyperlink to a third-party web site (lsquoThird-Party Contentrsquo) Any such Third-Party Content has not been adopted or endorsed by
Barclays does not represent the views or opinions of Barclays and is not incorporated by reference into this publication Third-Party Content is provided for
information purposes only and Barclays has not independently verified its accuracy or completeness
The views in this publication are those of the author(s) and are subject to change and Barclays has no obligation to update its opinions or the information in
this publication If this publication contains recommendations those recommendations reflect solely and exclusively those of the authoring analyst(s) and
such opinions were prepared independently of any other interests including those of Barclays andor its affiliates This publication does not constitute
personal investment advice or take into account the individual financial circumstances or objectives of the clients who receive it The securities discussed
herein may not be suitable for all investors Barclays recommends that investors independently evaluate each issuer security or instrument discussed herein
and consult any independent advisors they believe necessary The value of and income from any investment may fluctuate from day to day as a result of
changes in relevant economic markets (including changes in market liquidity) The information herein is not intended to predict actual results which may
differ substantially from those reflected Past performance is not necessarily indicative of future results
This document is being distributed (1) only by or with the approval of an authorised person (Barclays Bank PLC) or (2) to and is directed at (a) persons in the
United Kingdom having professional experience in matters relating to investments and who fall within the definition of investment professionals in Article
19(5) of the Financial Services and Markets Act 2000 (Financial Promotion) Order 2005 (the Order) or (b) high net worth companies unincorporated
associations and partnerships and trustees of high value trusts as described in Article 49(2) of the Order or (c) other persons to whom it may otherwise
lawfully be communicated (all such persons being Relevant Persons) Any investment or investment activity to which this communication relates is only
available to and will only be engaged in with Relevant Persons Any other persons who receive this communication should not rely on or act upon it
Barclays Bank PLC is authorised by the Prudential Regulation Authority and regulated by the Financial Conduct Authority and the Prudential Regulation
Authority and is a member of the London Stock Exchange
The Investment Bank of Barclays Bank PLC undertakes US securities business in the name of its wholly owned subsidiary Barclays Capital Inc a FINRA and
SIPC member Barclays Capital Inc a US registered brokerdealer is distributing this material in the United States and in connection therewith accepts
responsibility for its contents Any US person wishing to effect a transaction in any security discussed herein should do so only by contacting a
representative of Barclays Capital Inc in the US at 745 Seventh Avenue New York New York 10019
Non-US persons should contact and execute transactions through a Barclays Bank PLC branch or affiliate in their home jurisdiction unless local regulations
permit otherwise
Barclays Bank PLC Paris Branch (registered in France under Paris RCS number 381 066 281) is regulated by the Autoriteacute des marcheacutes financiers and the
Autoriteacute de controcircle prudentiel Registered office 3436 Avenue de Friedland 75008 Paris
This material is distributed in Canada by Barclays Capital Canada Inc a registered investment dealer a Dealer Member of IIROC (wwwiirocca) and a
Member of the Canadian Investor Protection Fund (CIPF)
Subject to the conditions of this publication as set out above the Corporate amp Investment Banking Division of Absa Bank Limited an authorised financial
services provider (Registration No 198600479406 Registered Credit Provider Reg No NCRCP7) is distributing this material in South Africa Absa Bank
Limited is regulated by the South African Reserve Bank This publication is not nor is it intended to be advice as defined andor contemplated in the (South
African) Financial Advisory and Intermediary Services Act 37 of 2002 or any other financial investment trading tax legal accounting retirement actuarial
or other professional advice or service whatsoever Any South African person or entity wishing to effect a transaction in any security discussed herein should
do so only by contacting a representative of the Corporate amp Investment Banking Division of Absa Bank Limited in South Africa 15 Alice Lane Sandton
Johannesburg Gauteng 2196 Absa Bank Limited is a member of the Barclays group
All research reports are distributed to institutional investors in Japan by Barclays Securities Japan Limited Barclays Securities Japan Limited is a joint-stock
company incorporated in Japan with registered office of 6-10-1 Roppongi Minato-ku Tokyo 106-6131 Japan It is a subsidiary of Barclays Bank PLC and a
registered financial instruments firm regulated by the Financial Services Agency of Japan Registered Number Kanto Zaimukyokucho (kinsho) No 143
Barclays Bank PLC Hong Kong Branch is distributing this material in Hong Kong as an authorised institution regulated by the Hong Kong Monetary Authority
Registered Office 41F Cheung Kong Center 2 Queens Road Central Hong Kong
All Indian securities-related research and other equity research produced by the Investment Bank are distributed in India by Barclays Securities (India) Private
Limited (BSIPL) BSIPL is a company incorporated under the Companies Act 1956 having CIN U67120MH2006PTC161063 BSIPL is registered and regulated
by the Securities and Exchange Board of India (SEBI) as a Research Analyst INH000001519 Portfolio Manager INP000002585 Stock BrokerTrading and
Clearing Member National Stock Exchange of India Limited (NSE) Capital Market INB231292732 NSE Futures amp Options INF231292732 NSE Currency
derivatives INE231450334 Bombay Stock Exchange Limited (BSE) Capital Market INB011292738 BSE Futures amp Options INF011292738 Depository
Participant (DP) with the National Securities amp Depositories Limited (NSDL) DP ID IN-DP-NSDL-299-2008 Investment Adviser INA000000391 The
registered office of BSIPL is at 208 Ceejay House Shivsagar Estate Dr A Besant Road Worli Mumbai ndash 400 018 India Telephone No +91 2267196000 Fax
number +91 22 67196100 Any other reports produced by the Investment Bank are distributed in India by Barclays Bank PLC India Branch an associate of
BSIPL in India that is registered with Reserve Bank of India (RBI) as a Banking Company under the provisions of The Banking Regulation Act 1949 (Regn No
BOM43) and registered with SEBI as Merchant Banker (Regn No INM000002129) and also as Banker to the Issue (Regn No INBI00000950) Barclays
Investments and Loans (India) Limited registered with RBI as Non Banking Financial Company (Regn No RBI CoR-07-00258) and Barclays Wealth Trustees
(India) Private Limited registered with Registrar of Companies (CIN U93000MH2008PTC188438) are associates of BSIPL in India that are not authorised to
distribute any reports produced by the Investment Bank
Barclays Bank PLC Frankfurt Branch distributes this material in Germany under the supervision of Bundesanstalt fuumlr Finanzdienstleistungsaufsicht (BaFin)
This material is distributed in Brazil by Banco Barclays SA
This material is distributed in Mexico by Barclays Bank Mexico SA
Barclays Bank PLC in the Dubai International Financial Centre (Registered No 0060) is regulated by the Dubai Financial Services Authority (DFSA) Principal
place of business in the Dubai International Financial Centre The Gate Village Building 4 Level 4 PO Box 506504 Dubai United Arab Emirates Barclays Bank
PLC-DIFC Branch may only undertake the financial services activities that fall within the scope of its existing DFSA licence Related financial products or
services are only available to Professional Clients as defined by the Dubai Financial Services Authority
Barclays Bank PLC in the UAE is regulated by the Central Bank of the UAE and is licensed to conduct business activities as a branch of a commercial bank
incorporated outside the UAE in Dubai (Licence No 1318442008 Registered Office Building No 6 Burj Dubai Business Hub Sheikh Zayed Road Dubai
City) and Abu Dhabi (Licence No 139522008 Registered Office Al Jazira Towers Hamdan Street PO Box 2734 Abu Dhabi)
Barclays Bank PLC in the Qatar Financial Centre (Registered No 00018) is authorised by the Qatar Financial Centre Regulatory Authority (QFCRA) Barclays
Bank PLC-QFC Branch may only undertake the regulated activities that fall within the scope of its existing QFCRA licence Principal place of business in Qatar
Qatar Financial Centre Office 1002 10th Floor QFC Tower Diplomatic Area West Bay PO Box 15891 Doha Qatar Related financial products or services are
only available to Business Customers as defined by the Qatar Financial Centre Regulatory Authority
This material is distributed in the UAE (including the Dubai International Financial Centre) and Qatar by Barclays Bank PLC
This material is not intended for investors who are not Qualified Investors according to the laws of the Russian Federation as it might contain information
about or description of the features of financial instruments not admitted for public offering andor circulation in the Russian Federation and thus not eligible
for non-Qualified Investors If you are not a Qualified Investor according to the laws of the Russian Federation please dispose of any copy of this material in
your possession
This material is distributed in Singapore by the Singapore branch of Barclays Bank PLC a bank licensed in Singapore by the Monetary Authority of Singapore
For matters in connection with this report recipients in Singapore may contact the Singapore branch of Barclays Bank PLC whose registered address is 10
Marina Boulevard 23-01 Marina Bay Financial Centre Tower 2 Singapore 018983
This material is distributed to persons in Australia by Barclays Bank plc Barclays Bank plc does not hold an Australian financial services licence and instead
relies on an exemption This material is intended to only be distributed to ldquowholesale clientsrdquo as defined by the Australian Corporations Act 2001
IRS Circular 230 Prepared Materials Disclaimer Barclays does not provide tax advice and nothing contained herein should be construed to be tax advice
Please be advised that any discussion of US tax matters contained herein (including any attachments) (i) is not intended or written to be used and cannot
be used by you for the purpose of avoiding US tax-related penalties and (ii) was written to support the promotion or marketing of the transactions or other
matters addressed herein Accordingly you should seek advice based on your particular circumstances from an independent tax advisor
copy Copyright Barclays Bank PLC (2017) All rights reserved No part of this publication may be reproduced or redistributed in any manner without the prior
written permission of Barclays Barclays Bank PLC is registered in England No 1026167 Registered office 1 Churchill Place London E14 5HP Additional
information regarding this publication will be furnished upon request
BRCF2242
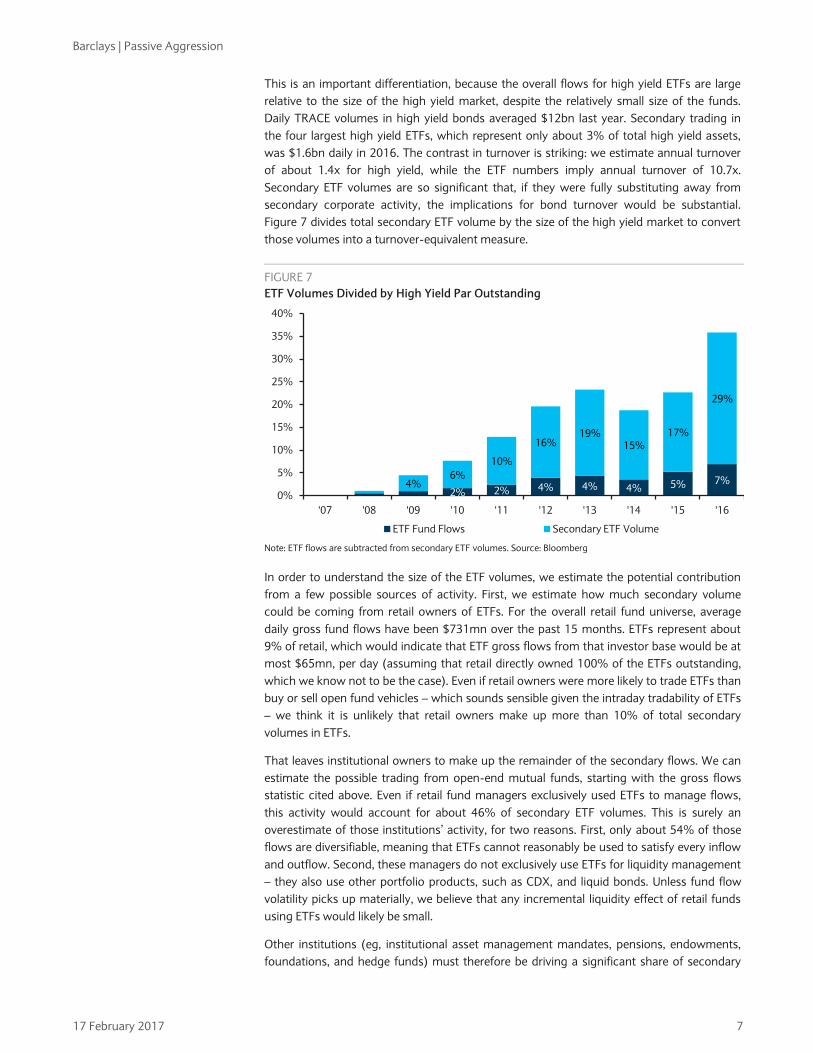
Barclays | Passive Aggression
The Future of Passive High Yield
We believe not only that passive is viable in high yield but also that its penetration rate is
likely to increase Assuming that half of the current 15 passive share actually represents
institutions using the ETFs for their liquidity and simplicity the true retail passive share of
high yield could increase about 29 before it matches investment grade where passive is
almost entirely a true retail product that scenario would put the passive share of high yield
at about 45 We see that as a cap given that high yield passive should be no more viable
than investment grade passive However the associated decline in high yield turnover under
even a 45 passive penetration rate is only an additional 36 As shown above most of
the adverse effects of passive management on high yield liquidity do not come from true
retail substitution but rather from institutional usage
Thus understanding the growth in institutional usage is the key to determining potential
future liquidity impairment Retail funds already use ETFs for liquidity management and we
believe that barring a meaningful change in fund flow volatility that channel may be
saturated That said institutions such as pensions and endowments could certainly
continue to increase their usage some of which would substitute for bond trading
Importantly this continued shift could lead to a self-reinforcing decline in high yield
liquidity More passive strategies should theoretically make it easier for active managers to
outperform as competition declines However liquidity also deteriorates with more passive
investment making it more difficult to convert alpha opportunities into actual
outperformance If the latter effect dominates the shift to passive could become self-
reinforcing We believe active investors will be grappling with this trade-off for the
foreseeable future particularly in years of low idiosyncratic volatility
17 February 2017 11
Analyst Certification
We Eric Gross and Jeffrey Meli hereby certify (1) that the views expressed in this research report accurately reflect our personal views about any or all of the
subject securities or issuers referred to in this research report and (2) no part of our compensation was is or will be directly or indirectly related to the specific
recommendations or views expressed in this research report
Important Disclosures
Barclays Research is a part of the Investment Bank of Barclays Bank PLC and its affiliates (collectively and each individually Barclays)
All authors contributing to this research report are Research Analysts unless otherwise indicated The publication date at the top of the report reflects the
local time where the report was produced and may differ from the release date provided in GMT
Availability of Disclosures
For current important disclosures regarding any issuers which are the subject of this research report please refer to httpspublicresearchbarclayscom or
alternatively send a written request to Barclays Research Compliance 745 Seventh Avenue 13th Floor New York NY 10019 or call +1-212-526-1072
Barclays Capital Inc andor one of its affiliates does and seeks to do business with companies covered in its research reports As a result investors should be
aware that Barclays may have a conflict of interest that could affect the objectivity of this report Barclays Capital Inc andor one of its affiliates regularly
trades generally deals as principal and generally provides liquidity (as market maker or otherwise) in the debt securities that are the subject of this research
report (and related derivatives thereof) Barclays trading desks may have either a long and or short position in such securities other financial instruments
and or derivatives which may pose a conflict with the interests of investing customers Where permitted and subject to appropriate information barrier
restrictions Barclays fixed income research analysts regularly interact with its trading desk personnel regarding current market conditions and prices
Barclays fixed income research analysts receive compensation based on various factors including but not limited to the quality of their work the overall
performance of the firm (including the profitability of the Investment Banking Department) the profitability and revenues of the Markets business and the
potential interest of the firms investing clients in research with respect to the asset class covered by the analyst To the extent that any historical pricing
information was obtained from Barclays trading desks the firm makes no representation that it is accurate or complete All levels prices and spreads are
historical and do not represent current market levels prices or spreads some or all of which may have changed since the publication of this document The
Investment Banks Research Department produces various types of research including but not limited to fundamental analysis equity-linked analysis
quantitative analysis and trade ideas Recommendations contained in one type of research may differ from recommendations contained in other types of
research whether as a result of differing time horizons methodologies or otherwise In order to access Barclays Statement regarding Research
Dissemination Policies and Procedures please refer to httpspublicresearchbarcapcomstaticS_ResearchDisseminationhtml In order to access Barclays
Research Conflict Management Policy Statement please refer to httpspublicresearchbarcapcomstaticS_ConflictManagementhtml
All pricing information is indicative only Prices are sourced from Thomson Reuters as of the last available closing price at the time of production of the
research report unless another time and source is indicated
Explanation of other types of investment recommendations produced by Barclays FICC Research
Trade ideas contained herein that have been produced by the Credit teams within Barclays Research are valid at current market conditions and may not be
otherwise relied upon
Trade ideas contained herein that have been produced by other research teams within Barclays FICC Research shall remain open until they are subsequently
amended or closed in a future research report
Disclosure of previous investment recommendations produced by Barclays FICC Research
Barclays FICC Research may have published other investment recommendations in respect of the same securitiesinstruments recommended in this
research report during the preceding 12 months To view previous investment recommendations published by Barclays FICC Research in the preceding 12
months please refer to httpslivebarcapcomgoresearchResearchInvestmentRecommendations
Barclays legal entities involved in publishing research
Barclays Bank PLC (Barclays UK)
Barclays Capital Inc (BCI US)
Barclays Securities Japan Limited (BSJL Japan)
Barclays Bank PLC Hong Kong branch (Barclays Bank Hong Kong)
Barclays Capital Canada Inc (BCCI Canada)
Absa Bank Limited (Absa South Africa)
Barclays Bank Mexico SA (BBMX Mexico)
Barclays Securities (India) Private Limited (BSIPL India)
Barclays Bank PLC India branch (Barclays Bank India)
Barclays Bank PLC Singapore branch (Barclays Bank Singapore)
Disclaimer
This publication has been produced by the Investment Bank of Barclays Bank PLC andor one or more of its affiliates (collectively and each individually
Barclays) It has been distributed by one or more Barclays legal entities that are a part of the Investment Bank as provided below It is provided to our clients
for information purposes only and Barclays makes no express or implied warranties and expressly disclaims all warranties of merchantability or fitness for a
particular purpose or use with respect to any data included in this publication To the extent that this publication states on the front page that it is intended
for institutional investors and is not subject to all of the independence and disclosure standards applicable to debt research reports prepared for retail
investors under US FINRA Rule 2242 it is an ldquoinstitutional debt research reportrdquo and distribution to retail investors is strictly prohibited Barclays also
distributes such institutional debt research reports to various issuers regulatory and academic organisations for informational purposes and not for the
purpose of making investment decisions regarding any debt securities Any such recipients that do not want to continue receiving Barclays institutional debt
research reports should contact debtresearchbarclayscom Barclays will not treat unauthorized recipients of this report as its clients and accepts no liability
for use by them of the contents which may not be suitable for their personal use Prices shown are indicative and Barclays is not offering to buy or sell or
soliciting offers to buy or sell any financial instrument
Without limiting any of the foregoing and to the extent permitted by law in no event shall Barclays nor any affiliate nor any of their respective officers
directors partners or employees have any liability for (a) any special punitive indirect or consequential damages or (b) any lost profits lost revenue loss of
anticipated savings or loss of opportunity or other financial loss even if notified of the possibility of such damages arising from any use of this publication or
its contents
Other than disclosures relating to Barclays the information contained in this publication has been obtained from sources that Barclays Research believes to
be reliable but Barclays does not represent or warrant that it is accurate or complete Barclays is not responsible for and makes no warranties whatsoever as
to the information or opinions contained in any written electronic audio or video presentations of third parties that are accessible via a direct hyperlink in
this publication or via a hyperlink to a third-party web site (lsquoThird-Party Contentrsquo) Any such Third-Party Content has not been adopted or endorsed by
Barclays does not represent the views or opinions of Barclays and is not incorporated by reference into this publication Third-Party Content is provided for
information purposes only and Barclays has not independently verified its accuracy or completeness
The views in this publication are those of the author(s) and are subject to change and Barclays has no obligation to update its opinions or the information in
this publication If this publication contains recommendations those recommendations reflect solely and exclusively those of the authoring analyst(s) and
such opinions were prepared independently of any other interests including those of Barclays andor its affiliates This publication does not constitute
personal investment advice or take into account the individual financial circumstances or objectives of the clients who receive it The securities discussed
herein may not be suitable for all investors Barclays recommends that investors independently evaluate each issuer security or instrument discussed herein
and consult any independent advisors they believe necessary The value of and income from any investment may fluctuate from day to day as a result of
changes in relevant economic markets (including changes in market liquidity) The information herein is not intended to predict actual results which may
differ substantially from those reflected Past performance is not necessarily indicative of future results
This document is being distributed (1) only by or with the approval of an authorised person (Barclays Bank PLC) or (2) to and is directed at (a) persons in the
United Kingdom having professional experience in matters relating to investments and who fall within the definition of investment professionals in Article
19(5) of the Financial Services and Markets Act 2000 (Financial Promotion) Order 2005 (the Order) or (b) high net worth companies unincorporated
associations and partnerships and trustees of high value trusts as described in Article 49(2) of the Order or (c) other persons to whom it may otherwise
lawfully be communicated (all such persons being Relevant Persons) Any investment or investment activity to which this communication relates is only
available to and will only be engaged in with Relevant Persons Any other persons who receive this communication should not rely on or act upon it
Barclays Bank PLC is authorised by the Prudential Regulation Authority and regulated by the Financial Conduct Authority and the Prudential Regulation
Authority and is a member of the London Stock Exchange
The Investment Bank of Barclays Bank PLC undertakes US securities business in the name of its wholly owned subsidiary Barclays Capital Inc a FINRA and
SIPC member Barclays Capital Inc a US registered brokerdealer is distributing this material in the United States and in connection therewith accepts
responsibility for its contents Any US person wishing to effect a transaction in any security discussed herein should do so only by contacting a
representative of Barclays Capital Inc in the US at 745 Seventh Avenue New York New York 10019
Non-US persons should contact and execute transactions through a Barclays Bank PLC branch or affiliate in their home jurisdiction unless local regulations
permit otherwise
Barclays Bank PLC Paris Branch (registered in France under Paris RCS number 381 066 281) is regulated by the Autoriteacute des marcheacutes financiers and the
Autoriteacute de controcircle prudentiel Registered office 3436 Avenue de Friedland 75008 Paris
This material is distributed in Canada by Barclays Capital Canada Inc a registered investment dealer a Dealer Member of IIROC (wwwiirocca) and a
Member of the Canadian Investor Protection Fund (CIPF)
Subject to the conditions of this publication as set out above the Corporate amp Investment Banking Division of Absa Bank Limited an authorised financial
services provider (Registration No 198600479406 Registered Credit Provider Reg No NCRCP7) is distributing this material in South Africa Absa Bank
Limited is regulated by the South African Reserve Bank This publication is not nor is it intended to be advice as defined andor contemplated in the (South
African) Financial Advisory and Intermediary Services Act 37 of 2002 or any other financial investment trading tax legal accounting retirement actuarial
or other professional advice or service whatsoever Any South African person or entity wishing to effect a transaction in any security discussed herein should
do so only by contacting a representative of the Corporate amp Investment Banking Division of Absa Bank Limited in South Africa 15 Alice Lane Sandton
Johannesburg Gauteng 2196 Absa Bank Limited is a member of the Barclays group
All research reports are distributed to institutional investors in Japan by Barclays Securities Japan Limited Barclays Securities Japan Limited is a joint-stock
company incorporated in Japan with registered office of 6-10-1 Roppongi Minato-ku Tokyo 106-6131 Japan It is a subsidiary of Barclays Bank PLC and a
registered financial instruments firm regulated by the Financial Services Agency of Japan Registered Number Kanto Zaimukyokucho (kinsho) No 143
Barclays Bank PLC Hong Kong Branch is distributing this material in Hong Kong as an authorised institution regulated by the Hong Kong Monetary Authority
Registered Office 41F Cheung Kong Center 2 Queens Road Central Hong Kong
All Indian securities-related research and other equity research produced by the Investment Bank are distributed in India by Barclays Securities (India) Private
Limited (BSIPL) BSIPL is a company incorporated under the Companies Act 1956 having CIN U67120MH2006PTC161063 BSIPL is registered and regulated
by the Securities and Exchange Board of India (SEBI) as a Research Analyst INH000001519 Portfolio Manager INP000002585 Stock BrokerTrading and
Clearing Member National Stock Exchange of India Limited (NSE) Capital Market INB231292732 NSE Futures amp Options INF231292732 NSE Currency
derivatives INE231450334 Bombay Stock Exchange Limited (BSE) Capital Market INB011292738 BSE Futures amp Options INF011292738 Depository
Participant (DP) with the National Securities amp Depositories Limited (NSDL) DP ID IN-DP-NSDL-299-2008 Investment Adviser INA000000391 The
registered office of BSIPL is at 208 Ceejay House Shivsagar Estate Dr A Besant Road Worli Mumbai ndash 400 018 India Telephone No +91 2267196000 Fax
number +91 22 67196100 Any other reports produced by the Investment Bank are distributed in India by Barclays Bank PLC India Branch an associate of
BSIPL in India that is registered with Reserve Bank of India (RBI) as a Banking Company under the provisions of The Banking Regulation Act 1949 (Regn No
BOM43) and registered with SEBI as Merchant Banker (Regn No INM000002129) and also as Banker to the Issue (Regn No INBI00000950) Barclays
Investments and Loans (India) Limited registered with RBI as Non Banking Financial Company (Regn No RBI CoR-07-00258) and Barclays Wealth Trustees
(India) Private Limited registered with Registrar of Companies (CIN U93000MH2008PTC188438) are associates of BSIPL in India that are not authorised to
distribute any reports produced by the Investment Bank
Barclays Bank PLC Frankfurt Branch distributes this material in Germany under the supervision of Bundesanstalt fuumlr Finanzdienstleistungsaufsicht (BaFin)
This material is distributed in Brazil by Banco Barclays SA
This material is distributed in Mexico by Barclays Bank Mexico SA
Barclays Bank PLC in the Dubai International Financial Centre (Registered No 0060) is regulated by the Dubai Financial Services Authority (DFSA) Principal
place of business in the Dubai International Financial Centre The Gate Village Building 4 Level 4 PO Box 506504 Dubai United Arab Emirates Barclays Bank
PLC-DIFC Branch may only undertake the financial services activities that fall within the scope of its existing DFSA licence Related financial products or
services are only available to Professional Clients as defined by the Dubai Financial Services Authority
Barclays Bank PLC in the UAE is regulated by the Central Bank of the UAE and is licensed to conduct business activities as a branch of a commercial bank
incorporated outside the UAE in Dubai (Licence No 1318442008 Registered Office Building No 6 Burj Dubai Business Hub Sheikh Zayed Road Dubai
City) and Abu Dhabi (Licence No 139522008 Registered Office Al Jazira Towers Hamdan Street PO Box 2734 Abu Dhabi)
Barclays Bank PLC in the Qatar Financial Centre (Registered No 00018) is authorised by the Qatar Financial Centre Regulatory Authority (QFCRA) Barclays
Bank PLC-QFC Branch may only undertake the regulated activities that fall within the scope of its existing QFCRA licence Principal place of business in Qatar
Qatar Financial Centre Office 1002 10th Floor QFC Tower Diplomatic Area West Bay PO Box 15891 Doha Qatar Related financial products or services are
only available to Business Customers as defined by the Qatar Financial Centre Regulatory Authority
This material is distributed in the UAE (including the Dubai International Financial Centre) and Qatar by Barclays Bank PLC
This material is not intended for investors who are not Qualified Investors according to the laws of the Russian Federation as it might contain information
about or description of the features of financial instruments not admitted for public offering andor circulation in the Russian Federation and thus not eligible
for non-Qualified Investors If you are not a Qualified Investor according to the laws of the Russian Federation please dispose of any copy of this material in
your possession
This material is distributed in Singapore by the Singapore branch of Barclays Bank PLC a bank licensed in Singapore by the Monetary Authority of Singapore
For matters in connection with this report recipients in Singapore may contact the Singapore branch of Barclays Bank PLC whose registered address is 10
Marina Boulevard 23-01 Marina Bay Financial Centre Tower 2 Singapore 018983
This material is distributed to persons in Australia by Barclays Bank plc Barclays Bank plc does not hold an Australian financial services licence and instead
relies on an exemption This material is intended to only be distributed to ldquowholesale clientsrdquo as defined by the Australian Corporations Act 2001
IRS Circular 230 Prepared Materials Disclaimer Barclays does not provide tax advice and nothing contained herein should be construed to be tax advice
Please be advised that any discussion of US tax matters contained herein (including any attachments) (i) is not intended or written to be used and cannot
be used by you for the purpose of avoiding US tax-related penalties and (ii) was written to support the promotion or marketing of the transactions or other
matters addressed herein Accordingly you should seek advice based on your particular circumstances from an independent tax advisor
copy Copyright Barclays Bank PLC (2017) All rights reserved No part of this publication may be reproduced or redistributed in any manner without the prior
written permission of Barclays Barclays Bank PLC is registered in England No 1026167 Registered office 1 Churchill Place London E14 5HP Additional
information regarding this publication will be furnished upon request
BRCF2242
