baraboo retail market analysis - for your information - university of
TRANSCRIPT


TABLE OF CONTENTS EXECUTIVE SUMMARY
Section 1 INTRODUCTION Purpose and Goals of Study………………………………………………………………………………….. 1 Study Components………………………………………………………………………………………………. 2 Study Team………………………………………………………………………………………………………….. 3 Business Districts Studied…………………………………………………………………………………….. 4
Section 2 TRADE AREA Convenience Trade Area………………………………………………………………………………………. 10
Destination Trade Area………………………………………………………………………………………… 11 Commuter Market……………………………………………………………………………………………….. 12 Non-local and Visitor Markets………………………………………………………………………………. 13 Conclusions…………………………………………………………………………………………………………… 15
Section 3 RESIDENT MARKET Demographic Analysis…………………………………………………………………………………………… 17 Lifestyles………………………………………………………………………………………………………………. 22 Conclusions…………………………………………………………………………………………………………… 24
Section 4 TOURIST AND VISITOR MARKET Area Attractions……………………………………………………………………………………………………. 25 Tourism Activity Sets……………………………………………………………………………………………. 27 Communities that Capture Visitor Spending………………………………………………………… 28 Businesses that Capture Visitor Spending……………………………………………………………. 30 Importance of Branding……………………………………………………………………………………….. 32 Publicity/Advertising……………………………………………………………………………………………. 33 Conclusions………………………………………………………………………………………………………….. 34
Section 5 DOWNTOWN BUSINESS MIX COMPARISON Downtown Baraboo……………………………………………………………………………………………… 35 Comparison to Downtowns in Similar Size Wisconsin Communities……………………. 37 Comparison to Selected Peer Communities…………………………………………………………. 37 Comparison Analysis……………………………………………………………………………………………. 39 Conclusions………………………………………………………………………………………………………….. 41
Section 6 PERSPECTIVES OF BUSINESS OPERATORS Survey Overview………………………………………………………………………………………………….. 42 Background Information on Respondents……………………………………………………………. 43 Businesses to Enhance Retail Vitality……………………………………………………………………. 47 Conclusions………………………………………………………………………………………………………….. 52
Section 7 DEMAND AND SUPPLY ANALYSIS – TRADE AREA RESIDENTS Spending Patterns of Baraboo Households Compared to the U.S. ……………………….. 53 Sales Potential of Baraboo Trade Area Residents…………………………………………………. 54 Estimates of Overall Market Demand and Supply, ESRI………………………………………… 57 Conclusions…………………………………………………………………………………………………………… 59
Section 8 RETAIL STRATEGIES AND ACTION PLAN A. Establish a Retail Retention/Expansion and Recruitment Process…………………. 61 B. Explore Opportunities in Selected Retail Categories………………………………………. 65 C. Guide Retail Development to the Most Appropriate Locations……………………… 66
D. Create Marketing Programs that Increase Retail Spending in Baraboo…………… 67

Baraboo Retail Market Analysis, 2011
Baraboo Economic Development Commission and the University of Wisconsin – Extension Page i
Executive Summary The Baraboo Retail Market Analysis is a community-led research effort that examines business retention, expansion and recruitment opportunities in the retail sector. The analysis was completed in 2011 as a resource to guide the Baraboo Economic Development Commission (BEDC) and business leaders representing each of five distinct retail districts: Downtown, Ringling Riverfront, South Boulevard Corridor, the Route 12 Corridor, and the Route 33 Corridor (east side). The analysis also serves as a resource for existing and prospective entrepreneurs, site selectors, and others seeking a comprehensive analysis to support business decisions. The following are some of the insights on the Baraboo retail market identified in this analysis:
Baraboo has a Convenience Trade Area with a population of almost 30,000 and a Destination Trade Area with a population of almost 93,000. The community also serves both commuters and non-locals, including a significant number of tourists and visitors. See section 2.
Demographic trends in the trade areas (compared to the state of Wisconsin) indicate that Baraboo has a moderately growing population, slightly lower per capita and household incomes, lower levels of college graduation, and higher levels of retail, construction, and public administration occupations. See section 3.
Baraboo’s regional attractions, aesthetic appeal, natural resources, and location can help position the community as an alternative as well as a complement to the Wisconsin Dells (a destination with significant tourist influx). See section 4.
Downtown Baraboo has a higher concentration of businesses in certain retail categories including art dealers, book, gift, personal care services and fitness centers, specialty food, and used merchandise/antiques. These businesses provide potential themes that can help downtown become a retail destination. Downtown Baraboo has a lower concentration in retail categories such as beauty salons, general merchandise, grocery, hardware, home furnishing, optical goods, shoe, sporting goods, and woman’s clothing. These categories may signal the need for further analysis. See section 5.
Baraboo’s retailers are currently challenged by changes in consumer behavior, competition from online sales and an increased business operating costs. Important issues noted by business operators that will impact their future success include Highway 12 improvements, marketing of the Baraboo area to outsiders, state of the economy and taxes, and business restrictions. See section 6.
Household consumer spending potential in the trade areas is lower than the U.S. average in all categories. Using the ESRI Spending Potential Index (whereby U.S. = 100),

Baraboo Retail Market Analysis, 2011
Baraboo Economic Development Commission and the University of Wisconsin – Extension Page ii
the indices for the Destination Trade Area ranges from apparel (lowest at 61) to health care (highest at 96). See section 7.
Estimates provided by ESRI for combined retail, food and drink sales indicate that supply (estimated sales) is 27 percent higher than demand (resident spending potential) for both the Convenience and Destination Trade Areas. This underscores the importance of the tourist market to local businesses. See section 7.
The market analysis concludes with preliminary retail development strategies based on the input of 25 business and community leaders serving on the study team. Their ideas were based on a review of data collected in this market analysis coupled with their insight and perspectives on the community. Strategies are presented in Section 8 as follows: A. Establish a Retail Retention/Expansion and Recruitment Process – a 12 step process that
establishes operating principles for an effective retail development program. Supported by B, C and D
B. Opportunities by Retail Category – interpretation of market analysis data to identify retail opportunities including full-service restaurants, food stores, specialized clothing stores, outdoor recreation stores, and miscellaneous retail categories.
C. Opportunities by District and Location – recommendations of business placement and clustering including: downtown as a place for specialty retail, dining and entertainment in the historic and cultural center; and Ringling Riverfront as a place for specialty retail, residential, public open-space, dining and entertainment.
D. Opportunities to Improve Marketing - recommendations related to increasing market capture through promotion, branding, and tourism development.
These strategies are evolving and serve as work-in-progress. Additional input from users of this market analysis is requested and strongly encouraged. Send additional input to: Jenny Erickson, Community Resource Development Sauk County – UW Extension West Square Administration Building 505 Broadway Baraboo, WI 53913-2404 608-355-3252 [email protected]

Baraboo Retail Market Analysis, 2011
Baraboo Economic Development Commission and the University of Wisconsin – Extension Page 1
Section 1
Introduction This section provides background information on the Baraboo Retail Market Analysis including its purpose and goals, study components, business districts, and the study team. Selected strengths and weaknesses of the local business districts, as reported by study team members at the launched of this study, are also presented.
Purpose and Goals of Study The purpose of this market analysis is to provide the Baraboo Economic Development Commission (BEDC) and other business and community leaders with objective information to guide retail development efforts in Baraboo and its business districts. The study assembles market information to support business retention, expansion and recruitment efforts. This information can be used to identify retail gaps in the community and to fill empty and new commercial space. The study also develops strategies for each district to help them establish a position in the market that is clearly defined and complementary to other districts. Specific goals for retail development in Baraboo include the following: 1. Increase access to retail and service businesses that improve quality of life for residents
and visitors.
2. Improve profitability of existing businesses through increased penetration of the regional retail market.
3. Minimize retail vacancy and encourage in-fill development that supports wise land use
and retail-density in the distinct districts. 4. For the downtown district, build on its unique character, distinctive architecture, and its
role as the physical and cultural center of the community. 5. Build cooperation among business leaders in the five districts. 6. Develop retail as one among numerous economic development strategies, linked to
tourism, outdoor recreation, entertainment, and the cultural arts. This study provides information to guide retail development at the community level. While it does not attempt to provide business-level marketing advice, it can be used to help business operators understand market characteristics in their efforts to reach new customers.

Baraboo Retail Market Analysis, 2011
Baraboo Economic Development Commission and the University of Wisconsin – Extension Page 2
1. Introduction
2. Trade Area
3. Residential Market
4. Tourist and Visitor
Market
5. Downtown Baraboo
Mix Comparison
6. Perspectives of
Business Operators
Market Analysis
A. Establish a
Retail and
Retention,
Expansion,
and
Recruitment
Process
Retail Strategies
and Action Plan
B. Explore Opportunities in
Selected Retail Categories
C. Guide Retail Development
to the Appropriate Locations
D. Create Marketing
Programs that Increase Retail
Spending
7. Demand and Supply
Analysis - Trade Area
Study Components
Tasks involved in this market analysis, as described in individual sections of this report, are listed and illustrated in the diagram below:
Trade Area (Section 2) – analysis of the Convenience Trade Area, Destination Trade Area, non-local market segments (including tourists) and commuters
Resident Market (Section 3) – analysis of demographics, lifestyles, and spending potential
Tourist and Visitor Market (Section 4) –analysis of attractions and purpose of visit
Downtown Business Mix Comparison (Section 5) – a comparison of downtown Baraboo to downtowns in peer communities
Perspectives of Business Operators (Section 6) – survey of a sample of local business operators regarding ways to strengthen the retail heath of the community
Demand and Supply Analysis of Trade Area Residents (Section 7) – analysis of the spending potential of local residents by business category
Retail Strategies and Action Plan (Section 8) – strategies developed by the study group that build on the data collected as well as the study team’s knowledge of the local market

Baraboo Retail Market Analysis, 2011
Baraboo Economic Development Commission and the University of Wisconsin – Extension Page 3
Study Team
This study was completed collaboratively with a local study team working with University of Wisconsin-Extension. The study team provided local insight and was instrumental in developing locally-relevant conclusions from the data collected. Participants are listed below. Core Study Group leading effort:
Sandy Anderson
Musa Ayar
Deb Bauer
Gene Dalhoff
John Kessenich
Liz Nevers
Mike Palm
Walt Smith Others Assisting in the Research:
Heath Anderson
Gaila Gilliland
Kevin Grohskopf
Lori Halverson
Buddy Huffaker
Christine Kortbein
Cindy McVenus
Steve Schmelzer
Bekah Stelling
Nancy Thompson
Todd Wickus Consultants Engaged in the Study
David Scheler, Diversified Tactics & Strategies (guidance on tourism development)
Deborah Ersland, Redevelopment Resources (guidance on retail strategy development)
University of Wisconsin-Extension Research Participants
Jenny Erickson – Community Development Educator, University of Wisconsin-Extension/Sauk County
Bill Ryan – Community Business Development Educator, University of Wisconsin-Extension/Center for Community & Economic Development
Angie Tackaberry – graduate student at the University of Wisconsin-Madison
Jangik Jin –PhD student at the University of Wisconsin-Madison
Glenn Halstead - graduate student at the University of Wisconsin-Madison
Robert Rodriguez – undergraduate student at the University of Wisconsin-Oshkosh

Baraboo Retail Market Analysis, 2011
Baraboo Economic Development Commission and the University of Wisconsin – Extension Page 4
Business Districts Studied The purpose of this analysis is to help the Baraboo Economic Development Commission (BEDC) and business leaders in each of five distinct retail districts understand potential business opportunities and support business retention, expansion and recruitment efforts. These districts are illustrated in the following map:
The following are short descriptions of each business district. Also provided is a brief summary of some of the perceived strengths and weaknesses of these districts as reported by study participants during a focus group session at the beginning of the market analysis process. Perceived strengths and weaknesses of each district are unedited and randomly presented. Downtown The Downtown district represents the traditional and central business district of the community. It is located between Broadway and Ash Street and 2nd and 5th Avenue. County and city government offices including the courthouse are downtown making this area a hub for legal, insurance, real estate and other professional services. Downtown has a number of

Baraboo Retail Market Analysis, 2011
Baraboo Economic Development Commission and the University of Wisconsin – Extension Page 5
independent retail stores that serve both convenience and destination shoppers. It is also the home to a number of restaurants, bars and coffee shops. Its historical character is anchored by the Al. Ringling Theatre. According to the Wisconsin Department of Transportation, annual average daily traffic volume in 2008 in this district was between 9,000 and 15,000 vehicles per day. Perceived strengths and weaknesses of the district as reported by focus group participants are presented below: Strengths: Weaknesses:
Convenience
Variety of retail and business
Culture – Al. Ringling, Summer concerts
Dining
Public social services
Parking
Historic buildings
Unified merchants group
Al. Ringling Theatre
Density of businesses and employees
Banks
Courthouse and Square
Professional services
Unique stores: music, kitchen, drug, furniture, other stores
Antique shops
Garden Party, Jen’s and Little Village
Grainery
Hair salons
Fitness centers
Year-long activities and fairs
Walkable
Long-term stores
Perception of inconvenient parking (4)
Unaware of downtown (2)
No major grocery store (2)
Undeveloped river
Store hours
Distance from Hwy. 12
Inconsistent/no uniform store hours
Shortage of staple items
No family clothing
No deli or fine restaurant
Lodging
Some poorly maintained buildings
Ringling Riverfront The Ringling Riverfront is a half-mile long redevelopment area located four blocks south of the Courthouse Square in Baraboo. It follows both sides of the Baraboo River between Water Street and Lynn Street from Broadway to the Circus World Museum complex. Its river frontage provides character and theme for a mixed-use redevelopment with open public spaces and trails. According to the Wisconsin Department of Transportation, annual average daily traffic volume in 2008 in this district was between 5,000 and 6,000 vehicles per day. Perceived strengths and weaknesses of the district as reported by focus group participants are presented below:

Baraboo Retail Market Analysis, 2011
Baraboo Economic Development Commission and the University of Wisconsin – Extension Page 6
Strengths: Weaknesses:
Circus World Museum (4)
Ice Age Trail/Riverwalk (2)
Riverfront property (2)
Location has potential
Primed and ready
Near downtown
A few salvageable historic buildings
Vacant land
City ownership
Exciting redevelopment potential
Some blighted/shabby properties (2)
No retail there yet
Lack of promotion of river for recreation
Have not reached critical mass for development
Off most traveled corridor
Seasonality in traffic
Distance from Hwy 12
No lodging (major hotel)
Parking
South Boulevard Corridor This 1.3 mile South Boulevard corridor serves as a primary entry way to downtown from Highway 12. The largest store in this corridor is Farm & Fleet. Other uses include service businesses and light manufacturing. Retail uses are limited and mixed at this time. The corridor has high traffic volume and opportunity to connect retail activity downtown with the Route 12 Corridor. According to the Wisconsin Department of Transportation, annual average daily traffic volume in 2008 in this district was between 10,000 and 13,000 vehicles per day. Road improvements are planned for 2014-2015. Perceived strengths and weaknesses of the district as reported by focus group participants are presented below: Strengths: Weaknesses:
Gateway to downtown (3)
High traffic area (2)
Main entry into Devil’s Lake
Large population base
Vacant land for development
Proximity to Devil’s Lake
Interesting business
Building/construction business concentration
Gateway to Farm & Fleet/Wal-Mart/Menards
Mostly transportation route
Rough road/Condition of street (4)
No sidewalks (2)
Question it being eclectic
Old business area
Visual quality
Mostly transportation route
Ugly
Not inviting
No neighborhood feel
Visibility issues
The Route 12 Corridor This 1.6 mile corridor contains most of Baraboo’s national chain retail and is anchored on the south by Menards (Mine Road) and in the north by the Clarion Hotel and Convention Center and the Best Western Baraboo Inn (Berkley Boulevard). In between are a few strip retail centers, some fast food restaurants, and a large manufacturer. Just beyond the north end of the district are a number of lodging establishments. Three of the community’s four grocery stores are located in this corridor. The corridor will be bypassed with the eventual rerouting of U.S. 12, but will remain the most visible and prominent retail district for travelers through the

Baraboo Retail Market Analysis, 2011
Baraboo Economic Development Commission and the University of Wisconsin – Extension Page 7
area. According to the Wisconsin Department of Transportation, annual average daily traffic volume in 2008 in this district was between 14,000 and 20,000 vehicles per day. Perceived strengths and weaknesses of the district as reported by focus group participants are presented below: Strengths: Weaknesses:
Volume of traffic (2)
Easy access by car (2)
By-pass will increase visibility of corridor (2)
Streetscape
Development opportunities
Regional shopping area
Lots of parking
If we don’t develop a unique entry to community, Hwy. 12 could be a weakness
Access to some businesses
Heavy traffic
Cost of doing business (rent)
No neighborhood feel
By-pass influence
Spotty development
The Route 33 Corridor (east side) This half-mile mile corridor stretches along Ringling Boulevard (State Route 33) from Jefferson Street to Taft Avenue. The corridor has underutilized retail space affording many opportunities and a limited number of businesses including restaurants, a grocery store, bank branches and lodging establishments. The corridor has moderate traffic volume and accommodates travelers accessing the interstate to the east. According to the Wisconsin Department of Transportation, annual average daily traffic volume in 2008 in this district was between 11,000 and 15,000 vehicles per day. Perceived strengths and weaknesses of the district as reported by focus group participants are presented below: Strengths: Weaknesses:
Traffic flow/High traffic count (2)
Proximity to hospital and clinic (health care niche opportunity)
Proximity to new housing development
Gateway for Interstate
Available buildings
Viking Store/gas, etc.
County fairgrounds (underutilized)
Easy access by car
Availability of stores
Restaurants
Future development of the 120 acre Jackson Property
Most new residential development with be near the east side.
Lack of activity at fairgrounds (2)
Nothing big to draw
If we don’t develop a unique entry to community, Hwy. 33 could be a weakness
Lack of current activity
Distance from Hwy. 12
Lack of curb appeal
Need housing and community development
Lost businesses
No neighborhood feel
Empty stores look bad

Baraboo Retail Market Analysis, 2011
Baraboo Economic Development Commission and the University of Wisconsin – Extension Page 8
Section 2
Trade Area This section analyzes the extent and shape of Baraboo’s trade areas. The trade area boundaries defined here will serve as the basis for additional analyses throughout this report. Baraboo, Wisconsin is located in south central Wisconsin, 40 miles northwest of Madison and approximately halfway between Milwaukee and La Crosse. The Baraboo area is served by US Highway 12 and State Highways 113, 33, 136 and 123. The area can be reached from Interstates 90/94 via US Highway 12 (9 miles) or State Trunk Highway 33 (13 miles). The trade areas that Baraboo retail businesses serve are influenced by regional shopping in neighboring communities. The following map illustrates the location of Baraboo relative to the large concentration of shopping centers in Madison as well as the distribution of Wal-Mart stores in region. A trade area is the geographic area from which a community generates the majority of its customers. Knowing the size and shape of each trade area is extremely important because its boundaries allow for measurement of the number of potential customers, their demographics, and their spending potential. Each individual business in Baraboo has a unique

Baraboo Retail Market Analysis, 2011
Baraboo Economic Development Commission and the University of Wisconsin – Extension Page 9
trade area. The distinct trade area for an establishment will depend on factors ranging from the type of business to the variety of products and services sold. Certain business types will only attract local customers, while other categories have the potential to draw customers from a broader region. For purposes of this analysis, two types of trade areas are examined: a convenience trade area; and a destination trade area. A convenience trade area is based on the purchase of products and services needed on a regular basis, such as gasoline, groceries, and hair care. Because these purchases are relatively frequent, people usually find it more convenient to buy these products and services from businesses located close to their home or workplace. A grocery store’s trade area can often be used to represent a community’s convenience trade area. A destination trade area is based on the purchase of “major” products and services, such as appliances or furniture, or of products and services that are distinctive in a way, such as deeply discounted products and services. People are willing to travel longer distances to do comparison shopping and purchase these kinds of items. A large discount department store’s trade area can often be used to represent a community’s destination trade area. In addition to differing by types of goods and services, a business district differs in the types of customers who shop there. Three common market segments are:
1. Local residents within the trade area. As they reside locally year-round, they provide the majority of spending potential for most businesses.
2. Daytime employees including those who may live in the trade area and others who commute from other communities. They have the potential to make purchases within the trade area during the workday.
3. Non-locals/visitors can offer a large amount of spending potential. While they are not permanent residents, tourists and other visitors shop while visiting the area.
The maps on the following pages illustrate Baraboo’s local resident trade areas based on store locations, drive-times, and input from the study group.

Baraboo Retail Market Analysis, 2011
Baraboo Economic Development Commission and the University of Wisconsin – Extension Page 10
Convenience Trade Area A Convenience Trade Area map for Baraboo was created using the following information:
The locations of retail grocery stores
Insight from the focus group to create a boundary line
Calculated travel times along streets to grocery stores
An equal competition area showing “as-the-crow-flies” distances
Exhibit 2.1 Convenience Trade Area Map

Baraboo Retail Market Analysis, 2011
Baraboo Economic Development Commission and the University of Wisconsin – Extension Page 11
Destination Trade Area The following map was created for the Destination Trade Area by using the following information and guidelines:
Locations of general merchandise stores
Insight from the focus group to create a boundary line
Calculated travel times along streets to Wal-Mart stores
An equal competition area showing “as-the-crow-flies” distances Exhibit 2.2 Destination Trade Area Map

Baraboo Retail Market Analysis, 2011
Baraboo Economic Development Commission and the University of Wisconsin – Extension Page 12
Commuter Market Another important geographic trend to analyze is the commuter market; both the incoming and outgoing markets for Baraboo. Employees residing outside of the City of Baraboo who spend weekdays working within the area represent a market segment that should be acknowledged as a source of potential external dollars coming into the community. Conversely, Baraboo residents whom work outside of the area could be viewed as a segment potentially leaking local dollars to other jurisdictions (if they shop where they work and not where they live). It is important to acknowledge these patterns and the potential opportunities that may exist to keep local money circulating within the City of Baraboo. A 2009 Job Count on inflows and outflows of workers illustrates the following information:
1,798 people both lived and worked in the City of Baraboo
Approximately 7,500 people lived outside of the city and commuted in to work
Almost 3,800 workers resided within city boundaries but worked elsewhere. Data was also collected from 2002-2009 at the county level, and detailed the below information:
Nearly half, 49 percent, of employed Baraboo residents worked in Sauk County
Almost 10 percent worked in Dane County
The majority of the rest worked in eight other Wisconsin counties Conversely, when examining the same time period’s sample of Baraboo workers, the following is learned:
Slightly over half, 51 percent, resided within Sauk County
Over 16 percent commuted from Dane County
Approximately 11 percent commuted from Columbia County Both the city and county level figures provide a sense of commuter patterns demonstrating the amount of workers entering and leaving both the city and county on a daily basis. The data is important to consider when analyzing comprehensive marketing strategies.
Baraboo Retail Market Analysis, 2011
Baraboo Economic Development Commission and the University of Wisconsin – Extension Page 13
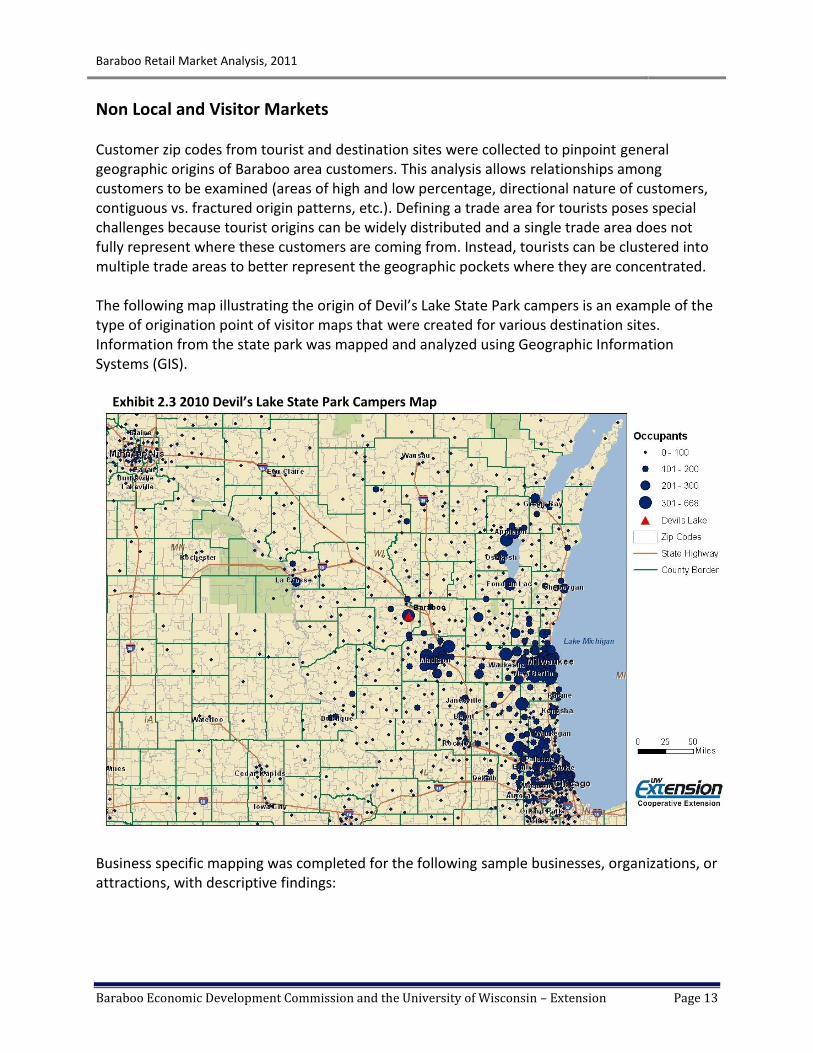
Non Local and Visitor Markets Customer zip codes from tourist and destination sites were collected to pinpoint general geographic origins of Baraboo area customers. This analysis allows relationships among customers to be examined (areas of high and low percentage, directional nature of customers, contiguous vs. fractured origin patterns, etc.). Defining a trade area for tourists poses special challenges because tourist origins can be widely distributed and a single trade area does not fully represent where these customers are coming from. Instead, tourists can be clustered into multiple trade areas to better represent the geographic pockets where they are concentrated. The following map illustrating the origin of Devil’s Lake State Park campers is an example of the type of origination point of visitor maps that were created for various destination sites. Information from the state park was mapped and analyzed using Geographic Information Systems (GIS). Exhibit 2.3 2010 Devil’s Lake State Park Campers Map
Business specific mapping was completed for the following sample businesses, organizations, or attractions, with descriptive findings:

Baraboo Retail Market Analysis, 2011
Baraboo Economic Development Commission and the University of Wisconsin – Extension Page 14
Devil’s Lake State Park-The park draws customers from the large urban centers of Chicago, Milwaukee, and Minneapolis/St. Paul as well as many smaller locales within the state of Wisconsin.
Art Faire on the Square-The pattern of customer origins for this event shows the art fair serves a convenience trade area. The majority of customers came from six surrounding zip codes.
The Grainery Whole Foods & Supplements-Due to the unique product offerings and widely dispersed customer base, this specialized grocery store exists as a destination site.
St. Clare Hospital Radiation Oncology-This health care facility receives clients from a fifty mile radius, resulting in its distinction as a destination site.
Mid-Continent Railway Museum-The museum draws both local and non-local visitors.
Al. Ringling Theater-The theater also draws customers from a variety of locales, appealing to both residents and non-locals.

Baraboo Retail Market Analysis, 2011
Baraboo Economic Development Commission and the University of Wisconsin – Extension Page 15
Conclusions The Baraboo trade areas reflect the potential convenience and destination drawing power of Baraboo’s business districts. However, they do not reflect the exact trade areas of individual businesses. Furthermore, the trade areas reflect future potential, not simply what is captured today. The boundaries of these trade areas are fluid in nature. Specifically, customers within these trade areas will travel to other shopping destinations, while customers from outside the trade areas may shop at Baraboo businesses.
1. Based on previously listed mapping criteria to create a Convenience Trade Area, the
following zip codes were identified as being in the geographic area. This area has a population of almost 30,000 (see Section 3).
Exhibit 2.4 Convenience Trade Area

Baraboo Retail Market Analysis, 2011
Baraboo Economic Development Commission and the University of Wisconsin – Extension Page 16
2. Based on previously listed mapping criteria to create a Destination Trade Area, the following zip codes were identified as being in the geographic area. This area has a population of almost 93,000 (see Section 3).
Exhibit 2.5 Destination Trade Area
3. In addition to these traditional trade areas, Baraboo also serves both commuters and non-locals, including visitors. Due to a substantial number of commuting workers from neighboring jurisdictions and the number of tourist sites in the area attracting visitors from near and far, it is important to consider these two additional trade areas when analyzing Baraboo’s entire market.

Baraboo Retail Market Analysis, 2011
Baraboo Economic Development Commission and the University of Wisconsin – Extension Page 17
Section 3
Resident Market The demographic and lifestyle characteristics of trade area residents provide valuable information for a market analysis. This section will provide information on demographic and lifestyle data.
Demographic Analysis To assist in understanding the characteristics of residents, data was gathered from the Baraboo Convenience Trade Area, the Baraboo Destination Trade Area, and the state of Wisconsin. Comparing demographics of each of these geographic areas helps to differentiate local consumers and may identify potential customer niches. Demographic characteristics are derived from public and private datasets, including Environmental Systems Research Institute Business Information Solutions (ESRI BIS) and the 2000 Decennial Census. The demographics for each geographic area are not mutually exclusive. Population Population data helps quantify both current market size and future market growth, both of which are used to measure consumer demand. Population is defined as all persons living in a geographic area. The City of Baraboo’s 2010 population is 14,275. However, the Convenience and Destination Trade Areas have respective populations of 29,897 and 92,552 respectively. Projected growth for the Convenience Trade Area and the Destination Trade Area are 0.57 percent and 0.58 percent, respectively. Both of these rates are somewhat more than the projected rate for the state of Wisconsin population, which is 0.47 percent, reflecting the area’s dynamic nature. Exhibit 3.1 Population
Baraboo Convenience Trade Area
Baraboo Destination Trade Area State of Wisconsin
2000 Total Population 27,281 84,279 5,363,675
2000 Group Quarters 445 2,116 155,958
2010 Total Population 29,897 92,552 5,741,617
2015 Total Population 30,752 95,273 5,877,143
2010 - 2015 Annual Rate 0.57% 0.58% 0.47% Source: ESRI Market Profile Report
Baraboo Retail Market Analysis, 2011
Baraboo Economic Development Commission and the University of Wisconsin – Extension Page 18
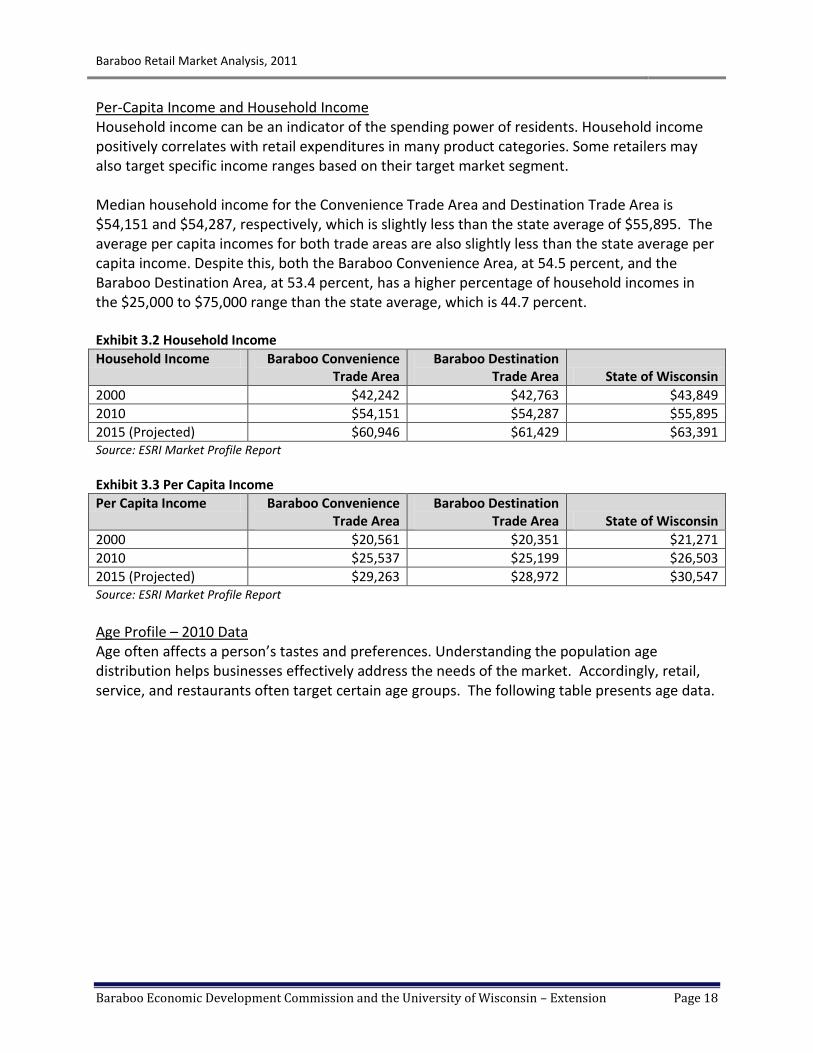
Per-Capita Income and Household Income Household income can be an indicator of the spending power of residents. Household income positively correlates with retail expenditures in many product categories. Some retailers may also target specific income ranges based on their target market segment. Median household income for the Convenience Trade Area and Destination Trade Area is $54,151 and $54,287, respectively, which is slightly less than the state average of $55,895. The average per capita incomes for both trade areas are also slightly less than the state average per capita income. Despite this, both the Baraboo Convenience Area, at 54.5 percent, and the Baraboo Destination Area, at 53.4 percent, has a higher percentage of household incomes in the $25,000 to $75,000 range than the state average, which is 44.7 percent. Exhibit 3.2 Household Income
Household Income Baraboo Convenience Trade Area
Baraboo Destination Trade Area State of Wisconsin
2000 $42,242 $42,763 $43,849
2010 $54,151 $54,287 $55,895
2015 (Projected) $60,946 $61,429 $63,391 Source: ESRI Market Profile Report
Exhibit 3.3 Per Capita Income
Per Capita Income Baraboo Convenience Trade Area
Baraboo Destination Trade Area State of Wisconsin
2000 $20,561 $20,351 $21,271
2010 $25,537 $25,199 $26,503
2015 (Projected) $29,263 $28,972 $30,547 Source: ESRI Market Profile Report
Age Profile – 2010 Data Age often affects a person’s tastes and preferences. Understanding the population age distribution helps businesses effectively address the needs of the market. Accordingly, retail, service, and restaurants often target certain age groups. The following table presents age data.

Baraboo Retail Market Analysis, 2011
Baraboo Economic Development Commission and the University of Wisconsin – Extension Page 19
Exhibit 3.4 Age Profile
Baraboo Convenience Trade Area
Baraboo Destination Trade Area State of Wisconsin
Total 29,897 92,552 5,741,617
Age 0 - 4 6.4% 6.2% 6.4%
Age 5 - 9 6.3% 6.2% 6.4%
Age 10 – 14 6.3% 6.3% 6.4%
Age 15 – 19 6.5% 6.3% 7.1%
Age 20 – 24 6.0% 6.0% 7.2%
Age 25 – 34 11.7% 11.7% 12.7%
Age 35 – 44 13.8% 13.4% 13.0%
Age 45 – 54 15.6% 16.0% 15.2%
Age 55 – 64 13.3% 13.3% 12.2%
Age 65 -74 7.3% 7.6% 6.8%
Age 75 - 84 4.4% 4.8% 4.4%
Age 85+ 2.4% 2.4% 2.2%
Age 18 + 77.7% 77.5% 76.8% Source: ESRI Market Profile Report
Both the Baraboo Convenience Area and the Baraboo Destination Area have a large percentage of their population in the age range of 25 – 74 years old, with approximately 62 percent of the populations in both areas belonging to this age range. Race/Ethnicity - 2010 Spending patterns often differ with ethnicity. Effective market segmentation based on ethnic groups must be authentic and accurate. Understanding the ethnic distribution of a population is the first step to meeting the needs of different ethnic groups. In terms of diversity, the populations of both the Baraboo Convenience Area and the Baraboo Destination Area are less diverse than the state average. The percent of residents living in the Baraboo Convenience Area who identify as White Alone is 95.5, percent and is 95.6 percent in the Baraboo Destination Area, while the state average is 87 percent. The largest minority population group is Hispanic Origin. Specialty stores and restaurants catering to that group have opened in the area in the past few years.

Baraboo Retail Market Analysis, 2011
Baraboo Economic Development Commission and the University of Wisconsin – Extension Page 20
Exhibit 3.5 Race/Ethnicity
Baraboo Convenience Trade Area
Baraboo Destination Trade Area
State of Wisconsin
Total 29,897 92,552 5,741,617
White Alone 95.5% 95.6% 87.0%
Black Alone 0.6% 0.9% 5.8%
American Indian Alone 1.1% 1.2% 1.0%
Asian/Pacific Islander Alone 0.6% 0.5% 2.1%
Some Other Race Alone 1.2% 0.9% 2.4%
Two or More Races 1.0% 1.0% 1.7%
Hispanic Origin 3.4% 2.7% 5.5%
Diversity Index 14.8 13.3 31.8 Source: ESRI Market Profile Report
Education – 2010 (Population 25+ years old by Educational Attainment) Education can be an indicator of the socio-economic status of an area. Not only do education levels affect income, they also impact consumer tastes and preferences. The Baraboo Convenience Area and the Baraboo Destination Area have a slightly lower percentage of residents who have an Associate degree or higher ( 33.7 percent in the Baraboo Convenience Area, 30.7 percent and the Baraboo Destination Area, and 35.9 in Wisconsin). Exhibit 3.6 Educational Attainment
Baraboo Convenience Trade Area
Baraboo Destination Trade Area
State of Wisconsin
Total 20,470 63,978 3,825,131
Less than 9th Grade 3.2% 3.5% 3.6%
9th-12th Grade, No Diploma 7.1% 7.2% 6.7%
High School Graduate 35.3% 37.6% 34.2%
Some College, No Degree 20.6% 21.1% 20.0%
Associate Degree 9.5% 9.8% 9.3%
Bachelor’s Degree 16.6% 14.1% 17.3%
Master’s/Prof/Doctorate 7.6% 6.8% 9.0% Source: ESRI Market Profile Report
Occupations Occupation concentrations of white-collar, blue-collar, or service workers are used as another gauge of a market’s spending patterns. In terms of manufacturing, both the Baraboo Convenience Area, at 13.2 percent, and the Baraboo Destination Area, at 14 percent, have lower percentages of workers in manufacturing than the state average, which is 16.5 percent. The trade areas have higher percentages of workers in the retail trade and construction fields than the state average, as well as in public administration occupations. The reason for the greater percentage of public administration workers could be related to the fact that Baraboo is the county seat.

Baraboo Retail Market Analysis, 2011
Baraboo Economic Development Commission and the University of Wisconsin – Extension Page 21
Exhibit 3.7 Occupations
Baraboo Convenience Trade Area
Baraboo Destination Trade Area
State of Wisconsin
Total 16,142 47,648 2,730,342
White Collar 55.5% 54.9% 59.2%
Management/Business/Financial 13.0% 13.8% 13.5%
Professional 19.5% 17.7% 21.6%
Sales 11.9% 11.1% 10.9%
Administrative Support 11.1% 12.3% 13.3%
Services 21.0% 19.0% 16.3%
Blue Collar 23.4% 26.1% 24.5%
Farming/Forestry/Fishing 1.3% 1.4% 1.1%
Construction/Extraction 5.2% 5.8% 4.3%
Installation/Maintenance/Repair 3.8% 4.1% 3.5%
Production 7.4% 8.3% 9.3%
Transportation/Material Moving 5.8% 6.5% 6.3% Source: ESRI Market Profile Report
Exhibit 3.8 Employment Occupations – 2010 NAICS Business Summary
Baraboo Convenience Trade Area
Baraboo Destination Trade Area
Wisconsin State Average
Total 16,142 47,648 2,730,342
Agriculture/Mining 3.4% 3.7% 2.6%
Construction 6.1% 7.0% 5.2%
Manufacturing 13.2% 14.0% 16.5%
Wholesale Trade 4.0% 3.2% 3.2%
Retail Trade 13.2% 12.9% 11.7%
Transportation/Utilities 3.4% 3.7% 4.1%
Information 1.5% 1.4% 1.9%
Finance/Insurance/Real Estate 4.7% 5.1% 6.5%
Services 46.0% 44.4% 44.6%
Public Administration 4.6% 4.6% 3.7% Source: ESRI Market Profile Report

Baraboo Retail Market Analysis, 2011
Baraboo Economic Development Commission and the University of Wisconsin – Extension Page 22
Lifestyles The Baraboo Trade Area resident lifestyles can also be studied using lifestyle segmentation information. Lifestyle segmentation systems examine the buying habits and preferences of consumers in a geographic area. One lifestyle segmentation system is Tapestry™, by ESRI Business Information Solutions. Consumers are classified into 65 demographic and behaviorally distinct segments. The segments are based on type of neighborhood (urban, suburban, rural); the residents’ socioeconomic status (age, income, occupation, type and value of residence); and their buying behaviors. Tapestry Segmentation can help identify the best markets, find the most profitable consumer types, tailor marketing messages, and define product and service preferences. The top three lifestyle tapestry segments in the Baraboo Convenience area are: “Green Acres,” at 27.3 percent, “Midlife Junction,” at 15.6 percent, and “Crossroads,” at 13.0 percent. Below are descriptions on these three lifestyle tapestry segments, as described by ESRI:
Green Acres The majority of households in Green Acres neighborhoods (71 percent) are married couples with and without children. Educated and hard-working, more than one-fourth of Green Acres residents hold a bachelor’s or graduate degree; more than half have attended college. Although Green Acres neighborhoods are located throughout the country, they are found primarily in the Midwest and South, with the highest concentrations in Michigan, Ohio, and Pennsylvania. Country living describes the lifestyle of Green Acres residents. Green Acres residents are more likely than other segments to ride their mountain bikes and go fishing, canoeing, and kayaking. Other sample characteristics relevant to Baraboo are listed below:
This group likes the outdoors including kayaking and canoeing, especially ties to an established event (i.e. Galena, IL outdoor event tied with their fall wine tasting event)
Many are pet owners
Businesses needed: sporting goods store; pet supply store; home improvement store; garden centers; fabric store; clothing stores for both dress and casual wear
Restaurants frequented: Olive Garden Midlife Junction Midlife Junction residents’ median age is 41.5 years; nearly 20 percent are aged 65 years or older. A third of the Midlife Junction households receive Social Security. Although scattered in suburbs across the country, these Midlife Junction neighborhoods are found more frequently in the South and Midwest. Midlife Junction residents live quiet, settled lives as they move from child-rearing into retirement. To finance their retirement, they own certificates of deposit, savings bonds, and IRAs. Other sample characteristics relevant to Baraboo are listed below:
This group travels and the area sees many in this lifestyle type in the fall

Baraboo Retail Market Analysis, 2011
Baraboo Economic Development Commission and the University of Wisconsin – Extension Page 23
Current events cater to this group (Fall Art Tour, Fall Faire on the Square, Mid-Continent Railway Fall Train Rides)
Businesses needed: Financial planning services; sporting goods store and other outdoor activities (crosses with Green Acres lifestyle)
Restaurants frequented: Full service; specialty Crossroads Crossroads neighborhoods are growing communities in small towns in the South, Midwest, and West. Married couples with and without children and single parents are the primary household types in these areas. Crossroads residents’ median household income is somewhat below the U.S. median. Crossroads residents’ home ownership is 74 percent and the median home value is much lower than the U.S. median. More than half of the housing is mobile homes; 36 percent are single-family dwellings. Most were built after 1969. Crossroads households budget for what they buy and choose selectively where to spend their money. They shop at discount department stores such as Wal-Mart. Crossroads residents watch NASCAR racing and other sports on TV. Typically, they own a satellite dish or subscribe to cable. Other sample characteristics relevant to Baraboo are listed below:
Children are the focus of their lives; this group will spend money as long as it’s on their kids; they tend to live paycheck to paycheck
Family activities; sponsor a children’s event downtown that would draw parents
Businesses needed: Discount stores; children’s products and children’s clothing stores
Restaurants frequented: Ponderosa, buffet-type all-you-can-eat

Baraboo Retail Market Analysis, 2011
Baraboo Economic Development Commission and the University of Wisconsin – Extension Page 24
Conclusions
Based on the demographic, lifestyle, and spending data in the Baraboo trade areas, a number of conclusions can be drawn:
1. Demographic trends in the trade areas (compared to the state of Wisconsin) indicate that Baraboo has:
A moderately growing population, growing at a faster rate than the state
Slightly lower home values
Slightly lower per capita and household incomes
A slightly higher percentage of household income in the $25,000 to $75,000 range
Limited ethnic diversity
Higher level of high school graduation
Lower level of college graduation
High level of retail, construction, and public administration occupations
2. Most of the households in the Baraboo trade areas are described by the ESRI Tapestry segmentation system in the following categories:
Green Acres- Green Acres residents tend to be married couples with and without children, who are hardworking and live primarily in the Midwest and South. These residents prefer living a country lifestyle and enjoying outdoor recreation.
Midlife Junction – Median Junction residents prefer to live in quiet, settled areas, as they transition from the child-rearing phase of life into retirement. Most depend on social security, IRAs, and other savings for livelihood.
Crossroads – Crossroads residents are married couples with or without children with a high level of home ownership rate. These residents are on a budget and are selective regarding their consumer goods.
3. Based on consumer behavior and purchasing patterns of the Baraboo trade areas,
residents have lower purchasing potential per household than the U.S. (as discussed in Section 7).

Baraboo Retail Market Analysis, 2011
Baraboo Economic Development Commission and the University of Wisconsin – Extension Page 25
Section 4
Tourism and Visitor Market The City of Baraboo is uniquely positioned to build on the tourism sector as part of a retail development strategy. This section contains information gathered on local and regional attractions, and describes the size and significance of the tourism and visitor market in Baraboo. Core elements of tourism development are presented as adapted from an April 2011 report provided by David Scheler, Diversified Tactics and Strategies (DTS).
The Benefits of Tourism The benefits of capturing visitor spending in smaller cities such as Baraboo, Wisconsin, can help sustain and help grow many local businesses such as restaurants, some service businesses and retailers. This in turn can also create a higher-quality selection of goods and services for local residents. As a consequence of attracting tourism, more money is earned within the community and can then be retained and re-spent within the community—a win-win situation for businesses and residents alike.
Area Attractions Baraboo has a critical mass of regional tourism attractions. Section two of this document contains maps of the destination trade area as well as tourist origin for selected Baraboo area attractions demonstrating the drawing power of the attractions across the state and region. The following is a list of major Baraboo area attractions including a brief description and the approximate number of annual visitors.

Baraboo Retail Market Analysis, 2011
Baraboo Economic Development Commission and the University of Wisconsin – Extension Page 26
Devil’s Lake State Park: Wisconsin’s Most Popular State Park celebrating its 100th year. (1.8 million annual visitors)
Ho-Chunk Gaming: A hotel and full-service casino with 24-hour slot machines, bingo, blackjack and other games.
Devil’s Head Resort and Convention Center: Mountain resort amenities for Midwest family reunions, business conferences, winter ski vacations, golf vacations, weddings, and summer escapes. (135,000 annual visitors)
Circus World Museum: Aerialists, magic shows, elephants, clowns and a collection of historic circus wagons (65,000 annual visitors)
Mid-Continent Railway Museum: An outdoor living history museum and operating railroad recreating, preserving, and interpreting the small town/short line way of life.
International Crane Foundation: The International Crane Foundation maintains a collection of 15 species of captive cranes, which allows pursuit of two vital techniques for crane preservation: captive breeding and reintroduction into the wild.
Aldo Leopold Foundation/Shack: The Leopold Center garnered more LEED points than any other building in the United States, making it the “greenest” building in the US. The Center fosters land ethics through the legacy of Aldo Leopold. (10,000 annual visitors)
Cascade Mountain: The 460-foot ski hill offers 34 trails, four terrain parks, and two half pipes. (170,000 annual visitors)
Along with the region’s strengths and opportunities, numerous threats and weaknesses need to be addressed. Baraboo in and of itself may not have the financial wherewithal and independent brand recognition to afford the significant investment required for in-depth market penetration as a stand-alone destination in comparison to Wisconsin Dells (see below). However, compared to many Wisconsin communities of a similar population, Baraboo is uniquely positioned to benefit from further promotion as an overnight destination for travelers, and has the potential to capture more of the local and regional tourism economy given the volume of travelers to the Dells and other area attractions. As the volume of travelers increases in Baraboo, an analysis would need to be conducted to determine lodging supply and demand as well as the most appropriate types of lodging for the Baraboo market. It should be noted that with so much to see and do in the Baraboo area, travelers may have motivation to spend one to two nights in Baraboo. Based on information used in the Wisconsin Department of Tourism’s 2009 study, The Economic Impact of Traveler Expenditures on Wisconsin, conducted by Davidson-Peterson and Associates, overnight lodging patrons in resort areas spend significantly more on a per-person per-day basis than those using alternative lodging options. Statewide, visitors using hotels, motels, resorts and B&Bs account for over one-half (51%) of total visitor spending in all expenditure categories while day trips accounted for less than a tenth (7%).

Baraboo Retail Market Analysis, 2011
Baraboo Economic Development Commission and the University of Wisconsin – Extension Page 27
The City of Baraboo is located 12 miles south of the Wisconsin Dells, The Waterpark Capital of the World®, and with nearly three million visitors to the Dells in 2010 it is an obvious source of potential visitors to the Baraboo area. To better understand the size and scope of the Wisconsin Dells tourist market a portion of the 2010 Economic Impact of Expenditures by Travelers on the Wisconsin Dells Area report developed by Davidson-Peterson Associates is summarized below:
The Wisconsin Dells area captured $1.06 billion in traveler expenditures in 2010. Nearly half of this influx (48%) occurred during the summer with 15 percent in the fall, 16 percent in the winter, and 21 percent in the spring. This total represents an increase of nearly three percent from 2009 figures.
Nearly three-quarters (74%) of this money was spent by travelers staying overnight in hotels/resorts/motel and B&Bs. Half of the Wisconsin Dells Area total estimated travel expenditures were spent on shopping and food; 19% on lodging; 23% on recreation (in order of spending: wagering, events, sports, historic, liquor, sightseeing, and 8% on ground transportation.
Baraboo and its retail business community can position itself to serve as an alternative as well as a complement to segments of the Dells’ significant tourist influx, to the numerous visitors drawn by other regional attractions, and to those enjoying the area’s natural resources, particularly those visiting anchor attractions offered by nearby state parks and State Historical Society sites.
Tourism Activity Sets The Baraboo area offers a variety of tourism related activities. The Wisconsin Department of Tourism has determined common linkages between different types of activities by surveying Wisconsin tourists on their spending and recreational behaviors. These activity sets may inform local retailers of potential or growing markets. Below are the activity sets relevant to tourism and recreation in Baraboo and the surrounding area:
People who like gambling also like fishing, downhill skiing, dining, historic sites, indoor water parks, and nightlife.
People who like water parks also like walking/hiking, zoos, dining and gambling.
People who like camping also like hiking, fishing, biking, boating, hunting and cross country skiing.
People who like parks/forests also like historic sites, museums, sightseeing, shopping, dining.
People who like music/arts/theater also liked fairs/festivals, dining, museums.

Baraboo Retail Market Analysis, 2011
Baraboo Economic Development Commission and the University of Wisconsin – Extension Page 28
Communities that Capture Visitor Spending
For a community to effectively capture visitor spending, it must balance natural, historic and cultural resources with the right mix of manufactured attractions including retail. An article in Urban Land provides ideas from successful retail centers located in major North American resort communities. These ideas may be relevant to downtown Baraboo. Successful tourist-based retail centers have some similar characteristics. They typically:
provide an intimate, distinct atmosphere and a strong pedestrian character; offer an experience and increase the lifestyle appeal of the community; have distinctive and consistent design (perhaps based on a historic theme); offer a variety of eating and drinking places that create a social ambiance; lack traditional anchor tenants; include logo or merchandise shops with commemorative or iconic appeal; and offer ongoing special events and activities.
Finding the right mix of businesses to complement these retail centers is difficult as tourism and retail are both sensitive to changing consumer, economic and social trends. The following six principles can help identify the right mix of services, facilities and tenants in a tourist-based retail center: The Retail Center Should Build on the Attributes of the Surrounding Area Tourism destinations depend on the special attributes of their locations. These attributes might include unique natural attractions such as a spectacular river or lake front setting. They can also include unique historic and cultural characteristics of the community. The retail center should build on these special attributes to achieve a unified and authentic theme that complements the surrounding area. Have a Year-Round and Diverse Appeal Successful tourism related retailers appeal to more than one market segment. They look at the various types of visitors by season to identify opportunities to increase year-round sales. For example, a shop that sells and services bicycles in the summer may be able to sell ski equipment in the winter. Successful retailers also try to appeal to a diverse mix of customers including overnight visitors, day trippers, conference attendees, local residents and employees. Cluster Retail Near Town Center The appeal of tourism-based retail is increased when a wide variety of shops are clustered around each other and near local services. Local services can include visitor information, post office, library, medical center, banks, realtors, conference and lodging facilities. These services provide spin-off for local retailers and build a sense of community.

Baraboo Retail Market Analysis, 2011
Baraboo Economic Development Commission and the University of Wisconsin – Extension Page 29
Retail Mix The mix of retail, restaurants and entertainment should reflect the needs and interests of the primary market segments. Today’s tourist destinations provide a variety of retail and services beyond souvenirs and fast food. Examples of specialty retailers found in resort communities include: cheese, skin and health care, jewelry, lifestyle apparel, golf/sports/outdoor equipment, novelty gifts, antiques, home accessories, restaurants, coffee shop, high-tech entertainment, bakery products/cookies, chocolates/candy, heritage/ethnic gifts, art gallery, crafts, t-shirts and clothing, gourmet foods, books, photography, factory outlet products, Christmas items, flowers, toys, wildlife art, cards, liquor and wines and perfumes/soaps. In addition, general merchandise stores that sell drugs, groceries, hardware and convenience items are also important in servicing visitors. The Right Products Many resort retailers sell products related to health, wellness and feeling good. Such products include small indulgences such as specialty coffees, ice cream, cookies and chocolate, toys as well as outdoor accessories such as sunglasses, sweaters and footwear. Locally produced products are also appealing to tourists. Retailers should adjust their merchandise seasonally and carry products that also appeal to the local resident market. Appearance of the Retail District Appearance of the retail district can strengthen the area’s identity and sales. Consistency in signage, shop fronts and merchandising can be achieved through the following:
landscaping (and street-scaping) to clearly define the retail area; building size; pedestrian orientation; signs and icons reflecting local cultural, natural, recreational or historical features; mobile kiosks; colorful storefronts/facades with inviting window displays, entrances, awnings,
umbrellas, banners and signage; and outdoor entertainment.
Retailers should try to stimulate impulse shopping, even for things that the visitor could buy back home. However, it is important not to look too commercial.

Baraboo Retail Market Analysis, 2011
Baraboo Economic Development Commission and the University of Wisconsin – Extension Page 30
Businesses that Capture Visitor Spending To help understand what types of businesses may appeal to Baraboo’s visitor market, research findings from a market study for the Rhinelander, Wisconsin Main Street Program was used. In this study, eight vibrant tourism-oriented downtowns were studied to understand their business mix and overall downtown dynamics. These communities included: Brainerd, MN; Fergus Falls, MN; Gaylord, MI; Petoskey, MI; Traverse City, MI; Galena, IL; Lake Geneva, WI; and Sturgeon Bay, WI. Downtown leaders from each community were asked to identify businesses that make significant contributions to downtown vitality. Interviews were conducted with owners and/or managers from each of these “key” businesses and short case studies were prepared for inclusion in the Innovative Downtown Business Database. The key businesses identified can be grouped into one of five broad categories. These groups are presented below. Destination Restaurant Many of the communities studied had one or more large destination restaurants as key generators of downtown visitation. These restaurants typically have large seating areas split into different rooms with a more intimate feel. Most are in the middle ($12 - $25) price range for dinner entrées and feature live music one or more times per week. Unique/Regional Gift Store Many of the businesses studied were gift stores that offer unique, quality products that are not found in large retail stores. These product offerings are highlighted by items that reflect local/regional culture, such as cherries and wine in Sturgeon Bay, Wisconsin, and Swiss-themed
Ingredients of an Outstanding Destination (National Extension Tourism Conference, 2000) Presented by Rodger Brooks, Destination Development
1. Pedestrian-friendly, intimate setting 2. Locals have to want to hang out there too 3. First impression-a great community and downtown gateway, locate where it looks the best 4. Give shopping districts names 5. Good wayfinding-signage program that matches marketing, also for pedestrians 6. Create gathering places 7. Women account for 80 percent of spending 8. Convenient long term parking 9. Widen sidewalks, narrow streets, good cross walks-lots of greenery 10. Aim for 10 food places, 10 retail shops, and 10 places open after 6 pm in three lineal blocks 11. Consistent hours and days, open late 12. People are drawn to experiences-not cities 13. Activities after 6 pm (70 percent of spending is after 6 pm) 14. Curb appeal-great signage, invitations not rejections-we will be open… 15. Public restrooms 16. Create community branding, development and marketing action plan

Baraboo Retail Market Analysis, 2011
Baraboo Economic Development Commission and the University of Wisconsin – Extension Page 31
products in Gaylord, Michigan. Notable store characteristics are attention to detail, quality products, and superior customer service. Many of the retailers interviewed stressed the need to differentiate themselves from both discount retailers, and from one another. Downtown “Hangout” or Gathering Place Downtown hangouts are businesses that provide a place where local residents socialize in a “public living room.” Many of these establishments are coffee shops, often featuring an outdoor sidewalk or courtyard seating during appropriate weather and offering baked goods that are produced locally. Some coffee shops are integrated or co-located with other businesses, such as book stores. These businesses facilitate downtown vibrancy by providing a place where people gather, and increase foot traffic on the street and in nearby establishments. Entertainment Theaters complement other downtown businesses by drawing crowds of people who then visit nearby establishments. They also promote downtown living by providing residents with easily accessible entertainment options. The State Theatre in Traverse City, MI, and Fergus Theatre in Fergus Falls, MN are examples. They do not compete directly with large movie theatres that show mainstream Hollywood films, but rather feature independent and foreign films, live music and theatre productions, special events (high school film, art exhibitions, film series), and occasionally second-releases of Hollywood Films. Hospitality/Lodging Two hotels were identified in this study: Stone Harbor Resort in Sturgeon Bay, WI, and Stafford’s Perry Hotel, in Petoskey, MI. Each is locally owned and operated. Both provide a steady stream of visitors that patronize other nearby establishments day and night. They also host large meetings, conferences, weddings, and other events that regularly draw additional traffic. Integrated restaurant/bar/grill elements in each hotel serve as an additional draw. It is important to note that both facilities occupy lakefront property, providing a connection between the commercial district and the water. Operating Characteristics A number of operating characteristics contribute to the uniqueness and appeal of these key downtown businesses. These are presented below:
Locally owned and operated - All of the businesses studied are locally owned and operated. Five of the twenty-five businesses have more than one location, either within the same city or region.
Located in historic buildings - Sixty percent of the businesses surveyed are located in buildings listed on national or local historic registries. A number of businesses in recently

Baraboo Retail Market Analysis, 2011
Baraboo Economic Development Commission and the University of Wisconsin – Extension Page 32
renovated buildings indicated that after historical restorations were complete, business significantly improved.
Place-based - In addition to locations in preserved historic structures, successful downtown businesses often feature, complement, and build on local or regional culture.
Active in downtown business community - Owners and managers organize or participate in community events and charities, and work directly with other businesses in their community. Participation in downtown community activities is critical to the success of the individual businesses and to the overall downtown.
In order to co-exist successfully with large chain affiliated businesses, these innovative businesses have adopted and developed techniques to further distinguish themselves.
Customer Service - By focusing on personal customer service, the establishments have built a positive reputation and created repeat customers.
Quality Products and Services - Rather than focusing on low prices, these businesses focus on offering quality products at reasonable prices. Small businesses cannot compete directly with large retailers on price but by offering superior quality products, they can create their own niche.
Unique Product Offerings - Retail establishments have an especially difficult time competing with large store competitors that offer the same products. Businesses in this study offered unique products to distinguish themselves from large retailers – as well as from one another.
Downtowns in tourism communities can attract visitors by including destination restaurants, gift shops, gathering places, entertainment and lodging facilities in the business mix. The successful businesses studied are distinctly different from the chains, build on local character and the environment, and are engaged in the community. They provide an authentic experience for the visitor and reason to come downtown. * from article by Joshua Clements published in the University of Wisconsin newsletter: Community Economics. http://www.uwex.edu/ces/cced/downtowns/ltb/index.cfm
Importance of Branding The Baraboo area already has a wealth of popular attractions. However, it is imperative to the overall success of the City of Baraboo’s business community that the Baraboo area’s rich mix of amenities and attractions is perceived by the traveler as part of the Baraboo brand. Currently, many of the Baraboo area’s tourism attractions have, to some extent, been annexed by the Wisconsin Dells tourism industry. This is particularly evidenced on internet listings for the attractions and the Wisconsin Dells’ website. This is ultimately a benefit, given the Dells’ substantial popularity and marketing budget, rather than a competitive threat. As Baraboo develops its “curb appeal” and lodging infrastructure it can become a stronger destination in and of itself.

Baraboo Retail Market Analysis, 2011
Baraboo Economic Development Commission and the University of Wisconsin – Extension Page 33
The Wisconsin Department of Transportation provides financial assistance with signage through their TOPS and SIS tourism signage programs, which should become extremely important with the development of the bypass around Baraboo. Developing strong brand recognition through public relations efforts, a solid marketing campaign and additional major events will help Baraboo.
Publicity/Advertising If Baraboo’s business community wants to benefit from increased tourism activity, it would be most beneficial for the retail community to have Baraboo become a central point of access to the numerous area attractions. These attractions are already extremely well-publicized both as stand-alone destinations and through the marketing power of Wisconsin Dells and the Wisconsin Department of Tourism. Baraboo needs to consider positioning itself as a key overnight destination in order to maximize the benefits of travel to the area attractions. In supporting this growth through increased travel volume, increased retail business will follow. However, in order for the retail community to maximize the benefits from this potential for growth, Baraboo needs the added marketing exposure to draw in more travelers to the community. In order for a destination to become included in the “consideration set” of possible places to visit and stay overnight, the destination must first be identified as an option: this is the job of marketing and public relations. Once this is accomplished, ease of locating planning information is critical to the overall success.

Baraboo Retail Market Analysis, 2011
Baraboo Economic Development Commission and the University of Wisconsin – Extension Page 34
Conclusions
In order for the Baraboo retail business community to maximize its growth from tourism, a visitor marketing plan should be created that builds on the city’s attractions, aesthetic appeal, and retail product offerings. The plan should also explore Baraboo’s potential to become a more recognized overnight destination.
1. Baraboo and its retail business community can position itself to serve as an alternative as well as a complement to segments of the Dells’ significant tourist influx, to the numerous visitors drawn by other regional attractions, and to those enjoying the area’s natural resources.
2. Finding the right mix of businesses to complement retail centers is difficult as tourism and retail are both sensitive to changing consumer, economic and social trends. The following six principles can help identify the right mix of services, facilities and tenants in a tourist-based retail center:
The Retail Center Should Build on the Attributes of the Surrounding Area
Have a Year-Round and Diverse Appeal
Cluster Retail Near Town Center
Retail Mix
The Right Products
Appearance of the Retail District
3. It is important to foster successful and attractive businesses to create and maintain a vibrant downtown. Based on an analysis of dynamic tourism-oriented downtowns, the following categories of businesses were identified as being significant contributors to downtown vitality:
Destination Restaurant
Unique/Regional Gift Store
Downtown “Hangout” or Gathering Place
Entertainment
Hospitality/Lodging

Baraboo Retail Market Analysis, 2011
Baraboo Economic Development Commission and the University of Wisconsin – Extension Page 35
Section 5
Downtown Business Mix Comparison This section compares the mix of businesses in downtown Baraboo with that of similar size communities in Wisconsin. Comparisons are also made with selected peer communities that serve similar market segments as downtown Baraboo. These comparisons represent one approach useful in identifying potential business opportunities for the downtown district.
Downtown Baraboo While downtown Baraboo is only one of five business districts studied in this market analysis, for many it represents the central place in the community from both a social and economic perspective. Once the primary retail center of the community, the uses of downtown buildings have changed from primarily retail to a variety of specialty retail, services, dining and entertainment. Downtown Baraboo is a vibrant and attractive central business district. It has:
over 100 businesses
over 600 employees
a Business Improvement District (BID) representing the core district (within the .5-mile ring)
commercial buildings within the BID assessed at approximately $31M
combined property taxes in 2010 in the BID of approximately $700,000.
In this section we examine the current business mix in the area formed by a half-mile radius around the middle of downtown Baraboo. A business inventory was completed by a study subcommittee to describe commercial activity within this geographic area (see following page). The downtown Baraboo inventory is then compared to other communities as one approach in identifying potential business opportunities for the downtown district.

Baraboo Retail Market Analysis, 2011
Baraboo Economic Development Commission and the University of Wisconsin – Extension Page 36
Downtown Baraboo Retail and Service Business Inventory Downtown Ameriprise Financial Pete's Glass
First Presbyterian Church Specially Hers Recycled Sally's
Turning Point Studio Ardyth's Sew-N-Shoppe Raven House
Massage Therapy Jen's Alpine Cafe Just Betty's
Rural Insurance Glacier Paint & Decorating Thredz Fashion
Greenwood Appraisal Hill's Gallery and Gifts Mama Mia's Pizza
Badger Insurance Coffee Bean Connection Bananaboat Ad/Graphics
Children Services Society of WI Supreme Awards Mike's Barber Shop
Projected Planning Financial planning Hair on the Square Bekah Kate's
Ash Street Law Office CenturyLink Sand County Contracting
Café of Life Health Center City of Baraboo, Police and Fire All Wisconsin Mortgage
Cenex Gas Station Zachs Tap Tech Monkeys
It's All About You Yoga Thompson's Jewelry Back Door Antiques
Baraboo Office Supply Wells Fargo Bank NA Upscale Boutique LLC
Presbyterian Church Jerry's Hallmark The Grainery
Herman's Machine Shop Corner Drug Store Baraboo Music
Kruse Motor Sales, Ltd. k. walter vintage The Downtowner Bar
Hatz Investments Nichols Philipp Legal & Mediation Services Beckman Promotions
Chucks Tire Topham Photography Spin Shack
Schwarz Insurance Von Klaus Winery Spa Serenity
Johnsen Insurance Village Booksmith Square Market
Premo & Premo Amber Moon LifeLine Books
Midwest Labor Oak Street Antiques and Yarn Tangles Salon
Edward Jones Kut Hut Total Design Salon
McGann's Furniture Baraboo Broadcasting Co. Touch of Your Life Massage Therapy
Nordic Group Elite Bakery Downtown Family Dental of Baraboo
Nature Conservancy Garden Party Cafe & Interlude Lounge Karobyx Promotion Sales
Recover Health Green Room Gifts H&R Block
Fresh Start Legal Services Very Wild Flowers Middle Earth Pizza
Baraboo Range Preservation Little Art Shoppe Sauk County Courthouse & West Square Bldg.
Wells Fargo drive up Bank Boardman, Quale, Hartmann
United First Methodist Church Don Rick Insurance
Smith Oil & A.J's Brakes and Repair Harry Machtan Realty
Imperial Multimedia National Tax Service Ringling Riverfront
Fit With Me Fitness Studio Vodak's Radio Shack Sonsalla Tax & Insurance services
Kwik Wash Laundry Christina Beam Photography Napa Auto Parts
Town & Country Cleaners Farmers Insurance ARO Behavioral Services
Baraboo Public Library Baraboo Perfect Home Sales and Rentals Deppe Enterprises
Elks Club Sam's Barber Shop R&M Body Shop
Gavin Bros. Auctioneer Knead a Rubb Massage The Sewing Room
Conway & Seefeld Attorneys The Jug Saloon Towns & Associates
Baraboo District Ambulance Open Road Tattoo Parker Bros. Used Appliances
Cinderfellas Hair Salon Poor Richards Saloon This That and Everything Re-SaleShop
Land Title Service Oak Street Market Riverside Rental
Fan Faire Costume & Dance Curves Fitness Brazilian Jiu-Jitsu Academy
International Clown Hall of Fame Badger Dry Cleaners Gem City Saloon
Jerry's Cash Register Baraboo School District Administration Office Sun Shades Window Tinting
Smith CPA, LLC Masonic Temple Panache Academy of Beauty
Specially Hers II Baraboo National Drive up Bank Bravo Dance Studio
The Memory Bank Wegner CPA Lake States Railway Historical Society
Gem City Candy Tracey Financial Services Next Gear Spin & Fitness
Pemberton & Englund Krueger & Hernandez Attorneys Baraboo Arts Banquet Hall
Just for Kicks VFW Post Snap Fitness
Monks Bar & Grill American Legion Hall Circus World Museum
Just Imagine Toys Baraboo Surplus Store Inspirations By Boots
Square Tavern Cross, Jenks, Mercer & Maffei Attorneys Raven House
Al Ringling Theatre Curves Fitness Just Betty's
Sauk County Art Assoc. Baraboo National Bank Thredz Fashion
Martinez & Ruby, LLP Sauk County Abstract and Title Mama Mia's Pizza
RE/MAX Grand Area Wide Appliance Bananaboat Ad/Graphics
Screnock & Screnock Ploetz Furniture Mike's Barber Shop
Little Village Cafe Rejuvenations Bekah Kate's
Next Level Communications Viney and Viney Sand County Contracting
Elite Self Defense Burkhalter Travel & Cruise All Wisconsin Mortgage
Cornerstone Gallery McGann Furniture Tech Monkeys
Attic Correctional Services The Service Company Back Door Antiques
Birdie's Cafe South Central Education Association Upscale Boutique LLC

Baraboo Retail Market Analysis, 2011
Baraboo Economic Development Commission and the University of Wisconsin – Extension Page 37
Comparison to Downtowns in Similar Size Wisconsin Communities The first comparison group represents all Wisconsin communities (39 cities and villages) with populations between 10,000 and 25,000. The average number of businesses per downtown in these communities was calculated in a UW-Extension study and is presented in Table 5.1. Communities in this group include: Baraboo Beaver Dam Cedarburg Chippewa Falls Cudahy De Pere Fitchburg Fort Atkinson Germantown Glendale Grafton Hartford Kaukauna Little Chute Marinette Marshfield Menasha Menomonie Mequon Merrill Middleton Monroe Muskego Neenah Oconomowoc Onalaska Pleasant Prairie Plover Port Washington River Falls South Milwaukee Stevens Point Stoughton Sun Prairie Two Rivers Watertown Waupun Whitewater Wisconsin Rapids Note: The results for Baraboo were also included in the cumulative data from the 39 Wisconsin communities. The data for Antigo, Fort Atkinson, and Watertown are also included in the cumulative data for both the seven peer communities and the 39 Wisconsin communities.
Comparison to Selected Peer Communities The study subcommittee also identified seven “peer communities” that have relatively vibrant
downtowns and share market characteristics similar to those of Baraboo. Like Baraboo, many
of these are “Micropolitan Statistical Area” communities as defined by the United States Office
of Management and Budget. Micropolitan Statistical Area communities are urban areas in the
United States based around a core city or town with a population of 10,000 to 49,999. The
average number of businesses, by category, in these seven downtowns is also provided in
Exhibit 5.1.
Antigo, WI Antigo is a city of 8,560 people, and is located in northeastern Wisconsin. Antigo is known for its agriculture, lumber and manufacturing industries. It is a nationally recognized cheese producer and manufactures most of the National Basketball Associations’ hardwood flooring. It is also considered the gateway to Wisconsin’s Northwoods. The city has a historic downtown, which is currently developing new ways to bring in new businesses. In April of 2011, the City had approved plans to construct a new office building to house Wittenberg Wireless and other outside businesses as part of their revitalization plan for the downtown.

Baraboo Retail Market Analysis, 2011
Baraboo Economic Development Commission and the University of Wisconsin – Extension Page 38
Burlington, IA Burlington is a city of 25,663 people, and is located in the southeast corner of Iowa on the Mississippi River. The city is a transportation and manufacturing center for the area, and is also known for its beautiful bluffs along the river. Their downtown is known for its historical buildings and its abundance of church spires that appear on its skyline. The Burlington downtown features a riverfront farmers’ market and summertime live music. Carlsbad, NM Carlsbad is a city of 26,138 people. Located in the southeast corner of New Mexico, the city is situated in the Chihuahuan Desert near the Guadalupe Mountains and Carlsbad Caverns. Their downtown features a museum and art center, a historical walking tour, fall festival and farmers market promoted by their Main Street program. The program provides funding for activities to maintain and improve downtown such as façade improvements, new street signs, and a clean-up effort to attract both tourists and residents to their downtown area. Fort Atkinson, WI Fort Atkinson is a city of 11,621 people located in southeastern Wisconsin. The city is known for the original military fort, as well as its Indian effigy mounds. Their vibrant downtown features many buildings on the National Register of Historic Places, and features many shops, restaurants, and recreation opportunities as well as a newly constructed Riverwalk along the Rock River. Fort Atkinson has a diverse commercial mix in their downtown, making it attractive for both out-of-town visitors and local residents. Granbury, TX Granbury is a city of 5,718 and is located in the center of Texas. The city is known for its historic Granbury Opera House, as well as being the home and resting place of Davy Crockett’s wife Elizabeth. The Granbury historic downtown consists of over 50 shops, two live theaters and a drive-in movie theater and many recreational opportunities along Lake Granbury. The city has gone to great lengths to preserve their unique sense of place and history, and has received many awards on their redevelopment of their courthouse square. The city has recently constructed a large conference center along the boardwalk in downtown Granbury that draws in many weddings, receptions and business events to the downtown. Watertown, WI Watertown is a city of 21,598 and is located in southeast Wisconsin along the Rock River between Madison and Milwaukee. The city is known as home to the first Kindergarten class as well as the Octagon House Museum. Their downtown features historical and diverse mix of museums, shops, and restaurants. Downtown Watertown benefits from having a Main Street program which, along with their day to day downtown assistance, plans large events such as the Fall Festival, Maxwell Street Days and the annual Street Dance to bolster economic activity. Waynesville, OH Waynesville is a village of 2,550 people located in the southwest corner of Ohio and is known for being the “Antiques Capital of the Midwest”. The look of Waynesville’s downtown has been

Baraboo Retail Market Analysis, 2011
Baraboo Economic Development Commission and the University of Wisconsin – Extension Page 39
preserved by the adoption of a historic preservation district, ensuring the character of the downtown is maintained. Over 60 antique and specialty shops, make it a unique place to shop and dine, or take a walking tour of historic “Old Main Street”. The downtown also features art galleries, museums, and is home to the annual Ohio Sauerkraut Festival attracting over 450 vendors and 350,000 visitors.
Comparison Analysis For purposes of this study, retail and service business categories that are typically found on street levels of downtowns were used for the comparison. For each of the comparison groups (“Wisconsin Average” and the “Peer Cities Average”), data from InfoUSA was used to identify the average number of businesses by NAICS code (five digit) within one-half mile of the center of their respective downtowns. This information was then compared to actual data collected for Baraboo’s downtown. The results of the comparison are presented in the exhibit that follows.
Important Notes about the Comparison 1. In some cases, a particular business may offer products or services that fall under multiple NAICS
codes. For this analysis, it is listed under one primary code. For example, a business may be listed as a furniture store but also sell home furnishings.
2. Baraboo is on the lower end of the population range of the “Wisconsin Average” group that was
studied. Accordingly, many of the communities included in the comparison data may have a larger market to support downtown retail.
3. While the raw data may indicate opportunity for a business type within a half mile of the downtown,
other businesses serving those needs may already exist in the Baraboo area outside of the downtown. This could then nullify the opportunity for a new business in that category.
4. As with any statistical sources, there may be inaccuracies in the number of businesses attributed to
a specific NAICS code for any given community. 5. The business mix analysis only measures a count of establishments and does not offer more useful
information such as sales or square feet of space. Further, it does not attempt to measure the competitiveness of the businesses included in the comparison.

Baraboo Retail Market Analysis, 2011
Baraboo Economic Development Commission and the University of Wisconsin – Extension Page 40
Exhibit 5.1 Baraboo Downtown Business Mix Comparison Downtown Wisconsin Peer Cities
NAICS Name Baraboo Average* Average
72210000 Full-service restaurants 4 9.85 11.00
81211200 Beauty salons 4 7.13 6.00
72240000 Drinking places (alcoholic beverages) 6 6.36 4.71
45322000 Gift, novelty, & souvenir stores 6 2.49 5.86
81111000 Automotive mechanical & electrical repair 1 2.31 3.29
71390000 Other amusement (bowling, golf, fitness) 3 2.18 1.29
45330000 Used merchandise stores 6 2.10 4.43
44710000 Gasoline stations 2 1.54 2.43
81211100 Barber shops 3 1.54 1.71
45310000 Florists 1 1.49 1.29
44831000 Jewelry stores 1 1.46 1.57
45111000 Sporting goods stores 1 1.41 0.71
44510000 Grocery stores 0 1.38 1.43
54192000 Photographic services 2 1.38 1.29
72220000 Limited-service eating places 2 1.38 0.86
44311000 Appliance, television, & other electronics stores 1 1.33 1.00
44419000 Specialized building material dealers 0 1.10 0.57
44130000 Automotive parts, accessories, & tire stores 1 1.08 2.14
44520000 Specialty food stores 5 1.03 0.71
44611000 Pharmacies & drug stores 1 0.97 1.29
44812000 Women's clothing stores 1 0.95 1.57
45200000 General merchandise stores 0 0.92 0.71
81211300 Nail salons 1 0.90 1.43
44220000 Home furnishings stores 0 0.79 1.00
45121000 Book stores 3 0.77 1.00
81232000 Dry cleaning & laundry (except coin-operated) 1 0.74 0.71
44210000 Furniture stores 2 0.72 1.43
45112000 Hobby, toy, & game stores 1 0.72 1.14
44819000 Specialized clothing stores (dress, etc.) 1 0.64 0.57
44112000 Used car dealers 1 0.62 1.29
44530000 Beer, wine, & liquor stores 1 0.62 1.00
45392000 Art dealers 2 0.56 0.71
44312000 Computer & software stores 0 0.54 0.86
81291000 Pet care (except veterinary) services 0 0.54 0.43
81141000 Home/garden equipment & appliance repair 1 0.46 0.14
45321000 Office supplies & stationery stores 2 0.44 0.71
44821000 Shoe stores 0 0.41 0.29
44413000 Hardware stores 0 0.38 0.29
45391000 Pet & pet supplies stores 0 0.38 0.43
44420000 Lawn & garden equipment & supplies stores 0 0.36 0.14
45114000 Musical instrument & supplies stores 1 0.36 0.29
44619000 Other health care (vitamin, medical equip) 0 0.33 0.71
45113000 Sewing, needlework, & piece goods stores 1 0.33 0.43
51213000 Motion picture & video exhibition 1 0.31 0.29
44412000 Paint & wallpaper stores 1 0.28 0.14
44613000 Optical goods stores 0 0.26 0.29
44815000 Clothing accessories stores 0 0.26 0.00
44811000 Men's clothing stores 0 0.23 0.14
44813000 Children's & infants' clothing stores 1 0.23 0.14
81143000 Footwear & leather goods repair 0 0.18 0.29
44612000 Cosmetics, beauty supplies, perfume stores 0 0.15 0.14
44814000 Family clothing stores 0 0.15 0.29
53230000 General rental centers 0 0.15 0.57
45122000 Tape, compact disc, & record stores 1 0.13 0.29
81219000 Other personal care services(tattoos, spas, piercing) 3 0.10 0.14
53222000 Formal wear & costume rental 2 0.08 0.00
*Wisconsin. Cities/Villages with 10,000-25,000 Population. Average of 39 Downtowns. Data source: Retail and Service Business Mix Analysis of Wisconsin's Downtowns by Bill Ryan, Beverly Stencel, and Jangik Jin, September 2010. University of Wisconsin-Extension

Baraboo Retail Market Analysis, 2011
Baraboo Economic Development Commission and the University of Wisconsin – Extension Page 41
Conclusions The following conclusions about downtown Baraboo’s business mix can be drawn from this data. Special attention was given to those business categories that are most suitable for downtown storefront location and that were found in many of the comparison downtowns. 1. Downtown Baraboo has a higher concentration of businesses in certain categories as listed
alphabetically below. The clustering of these and related businesses (current and future) may provide an opportunity to create a downtown market niche. Accordingly, while downtown Baraboo may appear to have an adequate supply of these businesses, they provide potential themes that can help build downtown Baraboo as a retail destination.
Art dealers
Book stores
Gift, novelty & souvenir stores
Other personal care services and fitness
Specialty food stores
Used merchandise stores 2. Downtown Baraboo has a lower concentration (or no businesses at all) in the categories
listed alphabetically below. The potential market gap in these categories may signal the need for further analysis to more accurately assess market demand and supply conditions in these categories.
Beauty salons
Full service restaurants
General merchandise stores
Grocery stores
Hardware stores
Home furnishing stores
Optical goods stores
Pet care (other than veterinary) services and supplies
Shoe stores
Sporting goods
Woman’s clothing stores

Baraboo Retail Market Analysis, 2011
Baraboo Economic Development Commission and the University of Wisconsin – Extension Page 42
Section 6
Perspectives of Business Operators This section analyzes information obtained from a business operator survey, created and distributed for the purposes of this market analysis. The survey was not scientific, and the sampling of opinions gathered were merely used in a directional nature to help contribute toward market analysis recommendations.
Survey Overview A web-based business owner survey invited a sample of business owners to share their perspectives regarding the current and future economic health of the retail business districts. Selected business operators within the City of Baraboo were emailed invitations to participate in the online Zoomerang survey in April, 2011. Twenty-nine responses were received. The survey was designed to gather background information from businesses on their needs and opportunities, business characteristics, and market and marketing data. The overall goal of these questions was to learn how to make Baraboo a more profitable place to do business. Survey questions covered the following topics:
Background information on each business
Biggest challenges facing businesses
Programs to improve business
Impact of community events on business
Preferences for new business in the different business districts
Prevailing issues with marketing, taxes, and business restrictions
Aesthetic enhancements to improve the retail environment The survey was based in part on the standardized business operator’s survey developed by the Wisconsin Main Street program and previous business surveys implemented by University of Wisconsin-Extension. The survey was then modified by the study committee to reflect research questions specific to Baraboo. During the month of April, 2011, 88 business operators were emailed an invitation to take part in the online Zoomerang business operator survey. Of the 88, 29 surveys were completed, and two were partially completed. All online survey responses went directly to UW-Extension and were kept confidential. The final rate of return for the survey was 33 percent.

Baraboo Retail Market Analysis, 2011
Baraboo Economic Development Commission and the University of Wisconsin – Extension Page 43
Background Information on Respondents Various questions were asked to better understand general characteristics of the business operators responding to the survey. These questions and responses are as follows: What best describes your business? (Q1) The majority of respondents (84 percent) characterized their business as “retail.” The second most prevalent response was “service business” at 14 percent. Where is your location? (Q2) Nearly half of survey respondents operated businesses in the Downtown Baraboo district (45 percent). The distribution of survey response is as follows:
Downtown-45%
Ringling Riverfront-no respondents
South Boulevard Corridor-no respondents
The Route 12 Corridor-21%
The Route 33 Corridor (east side)-7%
Outside of City-21%
Other areas in City-7% How long has your business been in operation? (Q3) The majority of businesses have been in operation for over 11 years, with 25 percent selecting the 11-20 year category and 46 percent selecting the over 20 year’s category. Do you have any plans to change your business in the coming year? (Q10) 31 percent of participants stated they planned to expand their business in the coming year; 7 percent intended to move locations and about 3 percent stated they would close. An additional 14 percent expressed hopes to see improvements in their business in the coming year. To the best of your knowledge, what are the three busiest and three slowest months of the year for this business? (Q5) Regarding busy times of operation, the most frequently selected month was July (16.3%), followed by August (15.3%), June (11.2%) and December (10.2%). This data suggests that retail activity is linked to the
Exhibit 6.1 Level of Business Activity
Busiest Slowest
January 2.0% 20.0%
February 5.1% 17.6%
March 4.1% 17.6%
April 4.1% 8.2%
May 4.1% 3.5%
June 11.2% 3.5%
July 16.3% 3.5%
August 15.3% 0.0%
September 9.2% 2.4%
October 9.2% 5.9%
November 9.2% 9.4%
December 10.2% 8.2%
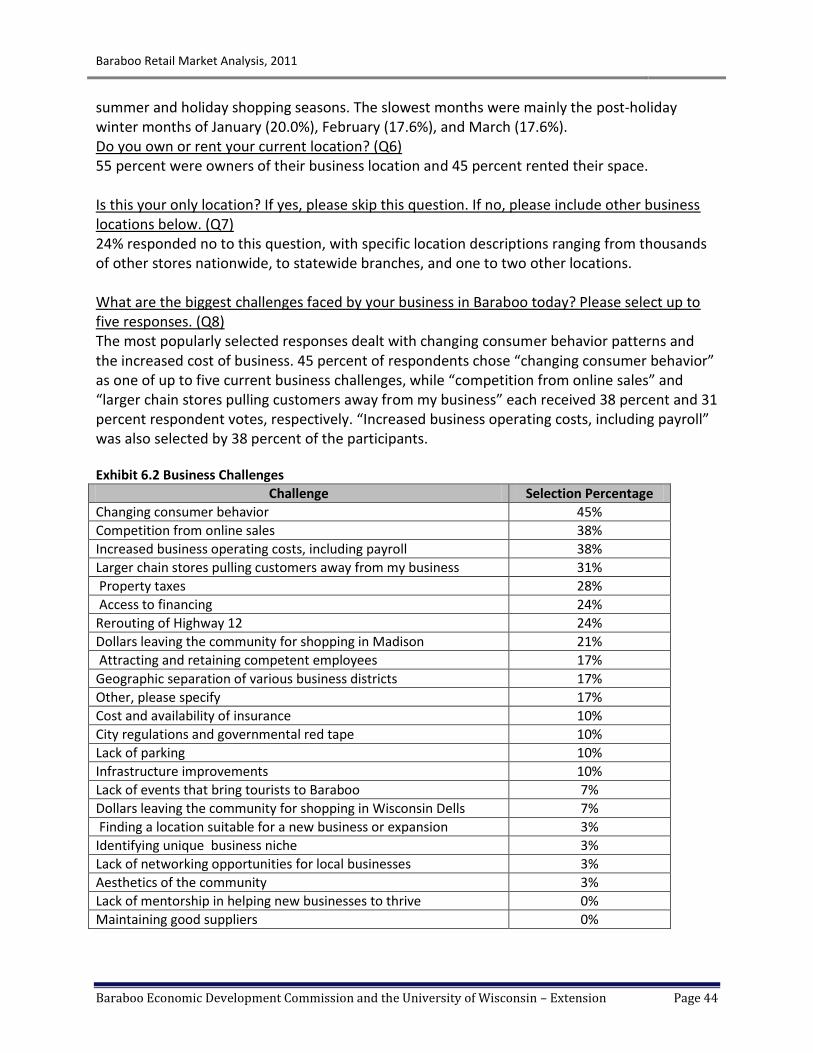
Baraboo Retail Market Analysis, 2011
Baraboo Economic Development Commission and the University of Wisconsin – Extension Page 44
summer and holiday shopping seasons. The slowest months were mainly the post-holiday winter months of January (20.0%), February (17.6%), and March (17.6%). Do you own or rent your current location? (Q6) 55 percent were owners of their business location and 45 percent rented their space. Is this your only location? If yes, please skip this question. If no, please include other business locations below. (Q7) 24% responded no to this question, with specific location descriptions ranging from thousands of other stores nationwide, to statewide branches, and one to two other locations. What are the biggest challenges faced by your business in Baraboo today? Please select up to five responses. (Q8) The most popularly selected responses dealt with changing consumer behavior patterns and the increased cost of business. 45 percent of respondents chose “changing consumer behavior” as one of up to five current business challenges, while “competition from online sales” and “larger chain stores pulling customers away from my business” each received 38 percent and 31 percent respondent votes, respectively. “Increased business operating costs, including payroll” was also selected by 38 percent of the participants. Exhibit 6.2 Business Challenges
Challenge Selection Percentage
Changing consumer behavior 45%
Competition from online sales 38%
Increased business operating costs, including payroll 38%
Larger chain stores pulling customers away from my business 31%
Property taxes 28%
Access to financing 24%
Rerouting of Highway 12 24%
Dollars leaving the community for shopping in Madison 21%
Attracting and retaining competent employees 17%
Geographic separation of various business districts 17%
Other, please specify 17%
Cost and availability of insurance 10%
City regulations and governmental red tape 10%
Lack of parking 10%
Infrastructure improvements 10%
Lack of events that bring tourists to Baraboo 7%
Dollars leaving the community for shopping in Wisconsin Dells 7%
Finding a location suitable for a new business or expansion 3%
Identifying unique business niche 3%
Lack of networking opportunities for local businesses 3%
Aesthetics of the community 3%
Lack of mentorship in helping new businesses to thrive 0%
Maintaining good suppliers 0%
Baraboo Retail Market Analysis, 2011
Baraboo Economic Development Commission and the University of Wisconsin – Extension Page 45
What issues are most important to the future prosperity of your business and to the overall level of retail activity in Baraboo? (Q23) Participants identified four main categories of issues important to the future prosperity and activity of their businesses. These issues included the Highway 12 improvements, marketing of Baraboo, taxes and the current state of the economy, and business restrictions. Specific grievances and suggestions are listed below: Highway 12 Improvements Respondents wished to be better informed on the exact construction dates and expected bypass completion date of Highway 12, and to be kept abreast of progress updates on the project. Having better signage guiding traffic from the new rerouted Highway 12 to the downtown was also suggested. The fact that the rerouting of traffic is taking traffic away from certain businesses was listed as a hindrance to prosperity and retail activity. Marketing Overall, respondents noted the need to enhance marketing efforts, both to locals and tourists, to encourage more people to frequent both the larger area and the downtown. Suggestions ranged from showcasing the natural beauty in and around Baraboo to regional and national markets, to improving infrastructure as a means of elevating civic pride and marketing the area as a “great place to live, work, and play.” The highway 136 area was said to be a destination center, with “nothing to bring people” out to this location. To encourage more people to come downtown, suggestions were made to “fix” South Boulevard and the Riverfront, as well as to encourage more general merchandise and non-specialty shops in the downtown. Encouraging a focus on arts and emphasizing the need to do more local shopping instead of Madison shopping were also suggested.
Economy and Taxes Based on the responses of many participants, it appears that the economic downturn has been and still is an important concern for the Baraboo retail market. Participants reported that their business costs have increased due to the increase in fuel prices, and the compilation of these increases with decreases in consumer spending has hurt business. Conversely, one respondent noticed the increase in fuel prices has helped encourage Baraboo residents to spend money locally, the respondent hopes that this trend can be sustained if/when gas prices fall. Participants also suggested that tax cuts are needed to curtail the economic woes. One participant noted that both real estate and business improvement district (BID) taxes have gotten too high for small businesses in Baraboo. Overall, the need for consumer confidence and spending to improve was noted as an important issue for future prosperity and retail activity.
Business restrictions Several suggestions were made to improve the business atmosphere in Baraboo. Making it easier to open a new business and to lessen restrictions on “building and property expansion” were suggested. Additionally, enforcing the two hour parking limit to ensure that customers

Baraboo Retail Market Analysis, 2011
Baraboo Economic Development Commission and the University of Wisconsin – Extension Page 46
have adequate parking in front of businesses was recommended. Eliminating county employees’ parking was also proposed. Rate the impact on your sales from the following events, either during or following the event (Q11) Respondents were asked to rate the impact of various community events on their businesses and were to select “high impact,” “medium impact,” “low impact,” “no impact,” or “negative impact” for each event listed below. Most of the respondents selected low or no impact for a majority of the events. The selections of “high impact” and “medium impact” were combined to demonstrate the most favorably viewed community events for participating businesses. These percentages are listed below. Exhibit 6.3 Community Event Impacts on Business
Event Combined "high impact" and "medium
impact" response percentage
Faire on the Square (Arts and Crafts) 25%
Summer Art Classic 3 25%
Downtown Baraboo Wine Walks 18%
Old Fashioned Festival 18%
Downtown Baraboo Christmas Light Parade 18%
Fall Art Tour 18%
Badger Steam & Gas Engine Show 15%
Very Merry Holiday Fair 15%
Shop 'Til You Drop 3 15%
Sauk County Fair 14%
Victorian Weekend in Downtown Baraboo 11%
Native American Artifact & Antique Show 8%
Baraboo River Rendezvous 8%
Paws for a Cause Dog Walk & Festival 7%
Fourth of July Fireworks 7%
American Cancer Society Relay for Life 4%
St Joseph Annual Festival 4%
Boo! Fest 4%
Annual Leopold Center Family Day 0%
Zoo Crew Day 0%
Boo! Fest * 21% negative impact
What educational programs or technical assistance could be useful to the Baraboo business community in its efforts to increase retail activity? (Q9) Participants recommended educational training opportunities both for local business owners and for local consumers. Program topics such as small business development, marketing

Baraboo Retail Market Analysis, 2011
Baraboo Economic Development Commission and the University of Wisconsin – Extension Page 47
strategies, an apprenticeship program, small business loans and grants, how to get tax breaks, social networking/social media advertising, and client retention were suggested. Additionally, the need for educating local consumers on the importance of buying local was put forth. Improving networking among local businesses and working together to implement joint promotions was recommended, as well as coming to communal consensus on Baraboo marketing and growth development plans.
Please provide any ideas you may have to enhance aesthetics that would contribute to the retail environment downtown and in other Baraboo business districts. (Q24) Many of the suggestions to improve aesthetics dealt with landscaping and green space issues. Planting more trees and increasing setbacks for parking areas and businesses with perennial plant buffers was recommended. Taking proper care of existing trees, mowing the grass, and removing derelict buildings were specific suggestions for the West Side of Baraboo district. For Downtown Baraboo, removing “eyesore retail stores and bars” and adding parking to keep business owners and employees from parking on the square was suggested. Encouraging activities already in place in the Downtown for areas such as Hwy 136 (West Side?) was recommended as a means to improve the area.
Businesses to Enhance Retail Vitality Participants were asked to select genres of business types that they believed would add to the retail vitality in the five main business districts in Baraboo. These five business districts were identified as Downtown Baraboo, the West Side of Baraboo and Highway 12 Corridor (Menards to Walgreens), the East Side of Baraboo (Fairgrounds/Highway 33), the Ringling Riverfront Area (Broadway to Circus World along the river), and South Boulevard (Highway 12 to Broadway Bridge). For each of these districts, participants were to select up to six business genres from a provided list. This list was compiled from the North American Industry Classification System (NAICS), and is listed below. What additional business types would add to the retail vitality in…? (Q12-Q21) The most selected response for all districts was “full-service restaurants.” Other eating related establishments such as “limited-service eating places” and “drinking places (alcoholic beverages)” were popular in many of the districts as well. This indicates that participants see a lack of dining options within the city as a whole. Downtown Baraboo As noted above, “full-service restaurants” was a popular response for Downtown Baraboo, garnering 64 percent of participants’ votes. This was followed by “clothing” with 50 percent and “grocery” with 43 percent. Participants provided some specific suggestions for restaurant types and other chain and local companies. In terms of restaurants, bar and grills such as the Great Dane Brew Pub, TGI Friday’s, Buffalo Wild Wings and Blue Spoon Restaurant were mentioned. Coffee shops such as Starbucks and Barriques were also suggested, along with an ice cream

Baraboo Retail Market Analysis, 2011
Baraboo Economic Development Commission and the University of Wisconsin – Extension Page 48
parlor or soda shop. For non-food related businesses, Orange Shoe, the North Face Outlet, Staples, Play It Again Sports, and Wildside Adventure Sports were suggested. Exhibit 6.4 Suggested Business Types for Downtown Baraboo
Top Five Responses for Downtown Baraboo (Q12)
Full-service restaurants 64%
Clothing 50%
Grocery 43%
General merchandise department store 29%
Home improvement, hardware and garden 29%
Pet & pet supplies 29%
Specialty food (bakery, meats, cheese, etc.) 29%
Sporting goods 29%
West Side of Baraboo In addition to the popularly selected “full-service restaurants” category, participants also identified a need for a variety of consumer goods, such as appliances, books, and office supplies. Specific suggestions for the West Side included a Payless Shoe Store, large bookstore, Best Buy, Staples, and Kohls. Restaurants suggestions were also supplied and included Great Dane Brew Pub, Applebee’s, the Olive Garden, Chili’s, and Starbucks. Exhibit 6.5 Suggested Business Types for the West Side of Baraboo
Top Five Responses for West Side of Baraboo and Highway 12 Corridor, Menards to Walgreens (Q14)
Full-service restaurants 55%
Drinking places (alcoholic beverages) 32%
Appliance, television, computers, cameras 27%
Specialty food (bakery, meats, cheese, etc.) 27%
Beer, wine & liquor 23%
Books and music 23%
Office Supplies 23%
Pet & pet supplies 23%
East Side of Baraboo The responses for the East Side of Baraboo were more widely dispersed than responses in other districts. The top three selections dealt with food service and retail, with “full-service restaurants” and “limited-service eating places” garnering 40 percent and 35 percent of participant votes, respectively, with “grocery” taking in 35 percent of participant votes. Specific suggestions provided leaned more toward stores like Hobby Lobby, Lowes, Costco, Kohls, and Best Buy. Food service suggestions included Jimmy Johns, Noodles & Company, and Starbucks.
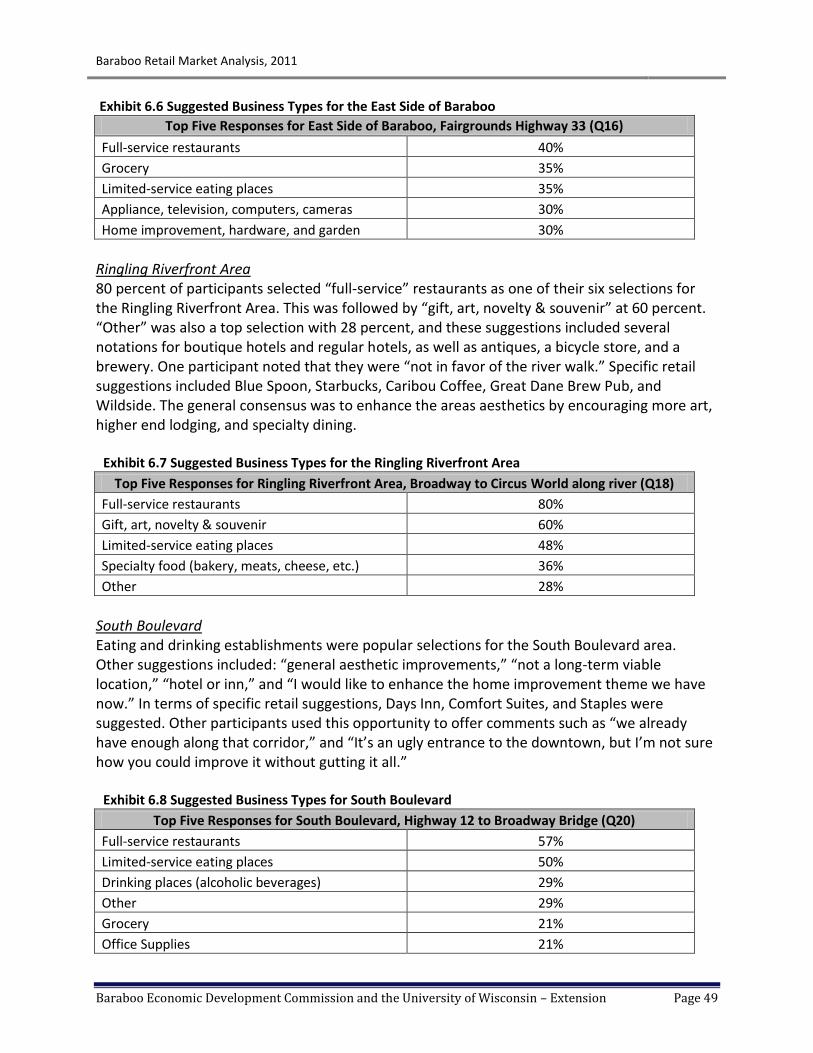
Baraboo Retail Market Analysis, 2011
Baraboo Economic Development Commission and the University of Wisconsin – Extension Page 49
Exhibit 6.6 Suggested Business Types for the East Side of Baraboo
Top Five Responses for East Side of Baraboo, Fairgrounds Highway 33 (Q16)
Full-service restaurants 40%
Grocery 35%
Limited-service eating places 35%
Appliance, television, computers, cameras 30%
Home improvement, hardware, and garden 30%
Ringling Riverfront Area 80 percent of participants selected “full-service” restaurants as one of their six selections for the Ringling Riverfront Area. This was followed by “gift, art, novelty & souvenir” at 60 percent. “Other” was also a top selection with 28 percent, and these suggestions included several notations for boutique hotels and regular hotels, as well as antiques, a bicycle store, and a brewery. One participant noted that they were “not in favor of the river walk.” Specific retail suggestions included Blue Spoon, Starbucks, Caribou Coffee, Great Dane Brew Pub, and Wildside. The general consensus was to enhance the areas aesthetics by encouraging more art, higher end lodging, and specialty dining. Exhibit 6.7 Suggested Business Types for the Ringling Riverfront Area
Top Five Responses for Ringling Riverfront Area, Broadway to Circus World along river (Q18)
Full-service restaurants 80%
Gift, art, novelty & souvenir 60%
Limited-service eating places 48%
Specialty food (bakery, meats, cheese, etc.) 36%
Other 28%
South Boulevard Eating and drinking establishments were popular selections for the South Boulevard area. Other suggestions included: “general aesthetic improvements,” “not a long-term viable location,” “hotel or inn,” and “I would like to enhance the home improvement theme we have now.” In terms of specific retail suggestions, Days Inn, Comfort Suites, and Staples were suggested. Other participants used this opportunity to offer comments such as “we already have enough along that corridor,” and “It’s an ugly entrance to the downtown, but I’m not sure how you could improve it without gutting it all.” Exhibit 6.8 Suggested Business Types for South Boulevard
Top Five Responses for South Boulevard, Highway 12 to Broadway Bridge (Q20)
Full-service restaurants 57%
Limited-service eating places 50%
Drinking places (alcoholic beverages) 29%
Other 29%
Grocery 21%
Office Supplies 21%

Baraboo Retail Market Analysis, 2011
Baraboo Economic Development Commission and the University of Wisconsin – Extension Page 50
What additional restaurant choices would add to the vitality in Baraboo (taking the entire area into consideration, not just specific districts of the city)? (Q22) Participants were asked to select up to six types of restaurants they believe would add Baraboo’s vitality overall (no longer focusing solely on the specific business districts). Out of 33 options, the most highly selected restaurant type was “steakhouse” with 52 percent of respondent selection, followed by “brew pub” with 48 percent. Four options did not receive any votes; those being “donuts,” “fast food,” “Middle Eastern,” and “pizza.” Exhibit 6.9 Suggested Restaurants for Baraboo
Top Responses for Restaurant Choice
Steakhouse 52%
Brew pub 48%
Deli 31%
Italian 31%
American 28%
Seafood 28% *Note: 0% - Donuts, Fast Food, Middle Eastern, Pizza

Baraboo Retail Market Analysis, 2011
Baraboo Economic Development Commission and the University of Wisconsin – Extension Page 51
Consumer Survey – a University of Wisconsin, Milwaukee Graduate Student Project The following survey findings were obtained from the 2011 report: Baraboo Downtown & Riverfront-Promoting Commerce in Baraboo’s Downtown and Riverfront corridors. The work was completed by Heath Anderson, a graduate student in Urban & Regional Planning & GIS at the University of Wisconsin, Milwaukee. It can be used to supplement the information that was generated from the business operators survey. A consumer survey was created to gather insights from Baraboo residents regarding the Baraboo Downtown and Riverfront Area (BDR). The overall goal of the survey was to learn how current BDR residents and visitors perceive the area, and how to make the BDR a more attractive and enjoyable place.
Identify uses that you would like to see incorporated into the BDR.
Identify uses you feel are too prevalent in the BDR.
How often do you visit the BDR?
How would you rate the overall appearance of the BDR? The consumer survey was made available online and advertised in the local paper. 71 online surveys were gathered during the time of availability. Online participants were asked to supply the following information after completing the survey: home zip code, age, gender, occupation, number in household, and annual income. The sample of survey participants who visited the BDR was approximately two-thirds female and one-third male. Most of the females fell in the range of 25 to 74 years of age, while the males had more age variety. Below are a sample of some of the findings gleaned from this survey:
The majority of respondents, 57 percent, stated that they visited the BDR two or more times a week.
Respondents generally felt that the overall appearance of the BDR was in good to fair condition
Many of respondents wished to see eateries such as restaurants and cafes incorporated into the BDR
Common responses to a question regarding issues with the Downtown was that it is "vacant and nothing in the BDR" and "prices are too high with not enough variation."
Survey: http://www.designwake.com/Heath/Baraboo_Survey.html After analyzing the survey results, it is evident that the respondents are in favor of more variety among
business uses in Downtown Baraboo. A larger variety of choices among restaurant types and food
prices would be appreciated. Food is one of the largest drivers attracting people to an area, as seen in
the parking analysis of Baraboo’s Downtown and Riverfront; however, there are other items that
warrant consideration when attempting to energize an area.

Baraboo Retail Market Analysis, 2011
Baraboo Economic Development Commission and the University of Wisconsin – Extension Page 52
Conclusions The following conclusions regarding participant responses can be drawn from analysis on the Baraboo Survey of Retail Operators:
1. The majority of respondents, 71 percent, had been in operation over 11 years. Over 30 percent of participants planned to expand their businesses in the coming year, while 14 percent expressed economic difficulty and hoped for improvements in the next year.
2. The biggest challenge to business success for participating Baraboo retail operators is changing consumer behavior, followed closely by competition from online sales and an increased business operating costs.
3. Important issues noted by participants that contribute to potential future success for Baraboo retail businesses include:
Highway 12 Improvements
Marketing of the Baraboo area to outsiders
State of the economy and taxes
Business restrictions
4. Overall, the most popularly selected type of business to add to each of the five Baraboo business districts was full-service restaurants. The top choices for each district are summarized below:
Downtown Baraboo – full service restaurants; clothing; grocery
West Side of Baraboo – full service restaurants; drinking places; appliance; television, computers, cameras; specialty food
East Side of Baraboo – full service restaurants; grocer; limited service eating places
Ringling Riverfront Area – full service restaurants; gift, art, novelty & souvenir
South Boulevard – full service restaurants; limited service eating places; drinking places
5. Top restaurant choices for the entire City of Baraboo included:
Steakhouse
Brew pub
Deli
Italian
American

Baraboo Retail Market Analysis, 2011
Baraboo Economic Development Commission and the University of Wisconsin – Extension Page 53
Section 7
Demand and Supply Analysis – Trade Area Residents
This section uses demographic information to calculate resident spending potential for specific business categories for both the Convenience and Destination Trade Areas. Demand estimates calculated in this section can be compared with corresponding “supply” estimates (sales or square feet of existing space) to identify potential gaps in the market. For a more complete comparison, potential demand from non-locals (including tourists) can also be included.
Spending Patterns of Baraboo Households Compared to the U.S. Spending is influenced by demographic, economic and geographic factors. Demographic and lifestyle characteristics of the two trade areas help describe the type of consumers residing in these areas, and their likely purchasing preferences and behaviors.1 Compared to the state of Wisconsin, the data indicates that residents of both trade areas have lower home values, a growing elderly population, lower incomes, limited ethnic diversity, lower overall educational attainment, and a high proportion of service based employees. As a general overview of consumer spending by trade area residents, it is helpful to compare local household spending with average U.S. household spending. One method to compare trade area spending with the U.S. is the Spending Potential Index (SPI). The SPI for selected product categories are listed in Exhibit 7.1. Exhibit 7.1 – Spending Potential Index of Baraboo Households in 2010
Convenience Trade Area SPI
Destination Trade Area SPI
Apparel and Services 61 61
Computers and Accessories 89 88
Entertainment and Recreation 92 92
Food at Home 90 90
Food Away from Home 89 88
Health Care 95 96
Household Furnishing and Equipment 78 78
Retail Goods 87 88
TV/Video/Audio 89 89
Source: ESRI Market Profile Report 2010
1 Note: For businesses categories with trade areas different than those identified in Section 2, demographic and lifestyle data can
be assembled with assistance from a private data firm. Online services from providers like ESRI Business Information Solutions and Claritas can help define these trade areas and provide the associated data.

Baraboo Retail Market Analysis, 2011
Baraboo Economic Development Commission and the University of Wisconsin – Extension Page 54
Consumer spending potential in the trade areas is lower than the U.S. average in all categories. The SPI index is lowest for apparel and highest for health care.
Sales Potential of Baraboo Trade Area Residents Opportunities for business expansion and recruitment can be analyzed using estimates of sales potential (demand). These demand estimates can be generated using public and private secondary data sources. Consumer spending does not equal actual business revenue, but rather the potential revenue that trade area residents could generate. Non-resident demand from consumers traveling to or through the community is not included in these estimates. Potential sales by business category in the trade area can be calculated as follows (example presented for grocery store demand in the Convenience Trade Area):
U.S. sales per capita by business category based on the U.S. Economic Census ($1,631)
The ratio of local trade area per capita income to U.S. per capita income ($25,537/$26,739)
Trade area population (29,897)
Multiplication of above figures is equal to the “Potential Sales in Trade Area” ($46 million for grocery stores)
Square foot demand for retail space ($46M/$479 per SF = 96,000 SF)
The following tables (7.2 and 7.3) present the potential sales estimates for the trade areas. These estimates assume that everyone in each trade area only shops in that area; likewise it assumes no one from outside of the trade area shops in that area. Therefore, it does not take into consideration any surplus or leakage in or out of the trade area. Also in the table is a column that estimates an equivalent number of square feet of retail shopping space that could be supported by the sales that have been calculated. These estimates can be used in a demand and supply analysis that measures potential (demand) vs. existing (supply) space by business category. It should be noted that due to the large geography of the Destination Trade Area, some of the potential sales presented here would likely be captured by neighboring (and competing) trade areas including Madison, Wisconsin Dells and Portage. Demand estimates are also complicated by the fact that store categories may not adequately reflect the breadth of sales. For instance, the category “general merchandise stores” includes Wal-Mart, which is nationally one of the largest grocers and one of the largest pharmacies, but which is reported as general merchandise. Thus, when using the following tables, it is important to consider the variety of projects that are sold by Wal-Mart and other large format stores as they complicate traditional store classifications.

Baraboo Retail Market Analysis, 2011
Baraboo Economic Development Commission and the University of Wisconsin – Extension Page 55
Exhibit 7.2 Sales Potential of Baraboo Convenience Trade Area Residents in 2010
The following points should be considered when using these sales potential estimates:
Data in this table (for the Convenience Trade Area) should be used for studying market demand for convenience shopping businesses like hardware, grocery, and drug stores as well as service businesses such as barber shops and beauty salons.
These estimates are based on a Convenience Trade Area population of 30,000.
Spending potential from non-residents including tourists are not captured in the above table.
This data can be used with actual business information (sales estimates or square feet of space) to construct a preliminary “demand-supply analysis.”
Potential Sales Sq. Ft Potential Sales Sq. Ft
in Trade Area Demand in Trade Area Demand
44111 New car dealers 64,379,429 - 45113 Sewing, needlework, & piece goods stores 410,803 2,947
44112 Used car dealers 7,559,686 - 45114 Musical instrument & supplies stores 558,077 -
44121 Recreational vehicle dealers 1,822,792 - 45121 Book Stores 1,729,865 7,500
44122 Motorcycle, boat, & other motor vehicles 4,565,153 - 45122 Tape, compact disc, & record stores 351,277 1,202
44130 Automotive parts, accessories, & tires 7,030,518 40,662 45200 General merchandise stores 54,177,316 387,285
44210 Furniture stores 5,558,105 10,400 45310 Florists 681,225 2,776
44220 Home furnishings stores 4,864,479 17,784 45321 Office supplies & stationery stores 2,176,499 10,756
44311 Appliance, television, & other electronics 8,080,280 22,010 45322 Gift, novelty, & souvenir stores 1,697,226 9,290
44312 Computer & software stores 1,923,367 939 45330 Used merchandise stores 1,041,644 -
44313 Camera & photographic supplies stores 373,471 647 45391 Pet & pet supplies stores 1,113,013 4,736
44411 Home centers 12,632,835 32,504 45392 Art dealers 905,018 1,865
44412 Paint & wallpaper stores 951,979 - 51213 Motion picture & video exhibition 1,189,400 14,335
44413 Hardware stores 1,924,591 13,324 53210 Automotive equipment rental & leasing 4,309,956 -
44419 Specialized building material dealers 11,095,242 - 53222 Formal wear & costume rental 94,397 313
44420 Lawn & garden equipment & supplies 3,474,992 - 53223 Video tape & disc rental 884,369 5,339
44510 Grocery stores 46,043,594 96,086 53230 General rental centers 430,348 847
44520 Specialty food stores 1,751,682 8,195 54192 Photographic services 895,532 2,819
44530 Beer, wine, & liquor stores 3,586,490 9,051 71310 Amusement parks & arcades 1,298,828 16,354
44611 Pharmacies & drug stores 18,937,974 47,347 71390 Other amusement (bowling, golf, fitness) 6,036,719 -
44612 Cosmetics and beauty supplies 1,102,328 3,020 72210 Full-service restaurants 18,373,169 45,670
44613 Optical goods stores 772,371 2,172 72220 Limited-service eating places 17,450,172 51,300
44619 Other health care (vitamin, medical equip)1,412,336 - 72240 Drinking places (alcoholic beverages) 1,870,841 -
44710 Gasoline stations 42,310,600 32,022 81111 Automotive mechanical & electrical repair 4,772,182 -
44811 Men's clothing stores 822,026 3,156 81112 Automotive body, paint, interior, & glass 3,183,178 -
44812 Women's clothing stores 3,776,121 14,797 81119 Other automotive repair & maintenance 1,454,905 -
44813 Children's & infants' clothing stores 899,158 2,850 81141 Home/garden equipment & appliance repair 391,474 -
44814 Family clothing stores 7,920,753 23,354 81142 Reupholstery & furniture repair 177,986 -
44815 Clothing accessories stores 598,171 1,703 81143 Footwear & leather goods repair 28,982 110
44819 Specialized clothing stores (dress, etc) 1,128,521 3,358 81149 Personal goods repair (watch, boat, garment) 844,079 -
44821 Shoe stores 2,511,568 10,115 81211 Barber shops, beauty salons, nail salons 3,637,589 16,464
44831 Jewelry stores 2,905,060 4,682 81219 Other personal care services 759,067 2,464
44832 Luggage & leather goods stores 182,843 619 81231 Coin-operated laundries & drycleaners 397,844 5,276
45111 Sporting goods stores 3,364,736 12,262 81232 Drycleaning & laundry (except coin-operated) 853,664 5,771
45112 Hobby, toy, & game stores 1,539,412 6,688 81291 Pet care (except veterinary) services 341,782 -
81292 Photofinishing 219,864 -
Convenience Trade Area Gap Analysis
Calculations based on U.S. Economic Census (2007), ESRI Market Profile Report (2010), and Urban Land Institute shopping center sales data (2007)
Calculations are provided for the study of economic concepts and should not be used as the sole determinant in business feasibility analysis.
NAICS Store Category NAICS Store Category

Baraboo Retail Market Analysis, 2011
Baraboo Economic Development Commission and the University of Wisconsin – Extension Page 56
Exhibit 7.3 Sales Potential of Baraboo Destination Trade Area Residents in 2010
The following points should be considered when using these sales potential estimates:
Data in this table (for the Destination Trade Area) should be used for studying market demand for destination and comparison shopping businesses like furniture, apparel and jewelry stores.
These estimates are based on a Destination Trade Area population of 93,000, more than three times the number in the Convenience Trade Area.
Spending potential from non-residents including tourists are not captured in the above table.
This data can be used with actual business information (sales estimates or square feet of space) to construct a preliminary “demand-supply analysis.”
Potential Sales Sq. Ft Potential Sales Sq. Ft
in Trade Area Demand in Trade Area Demand
44111 New car dealers 196,661,227 - 45113 Sewing, needlework, & piece goods stores 1,254,888 9,001
44112 Used car dealers 23,092,735 - 45114 Musical instrument & supplies stores 1,704,770 -
44121 Recreational vehicle dealers 5,568,123 - 45121 Book Stores 5,284,256 22,909
44122 Motorcycle, boat, & other motor vehicles 13,945,273 - 45122 Tape, compact disc, & record stores 1,073,053 3,672
44130 Automotive parts, accessories, & tires 21,476,275 124,212 45200 General merchandise stores 165,496,613 1,183,048
44210 Furniture stores 16,978,463 31,770 45310 Florists 2,080,951 8,479
44220 Home furnishings stores 14,859,627 54,326 45321 Office supplies & stationery stores 6,648,599 32,857
44311 Appliance, television, & other electronics 24,683,006 67,233 45322 Gift, novelty, & souvenir stores 5,184,553 28,379
44312 Computer & software stores 5,875,350 2,868 45330 Used merchandise stores 3,181,933 -
44313 Camera & photographic supplies stores 1,140,850 1,976 45391 Pet & pet supplies stores 3,399,946 14,467
44411 Home centers 38,589,793 99,292 45392 Art dealers 2,764,578 5,698
44412 Paint & wallpaper stores 2,908,029 - 51213 Motion picture & video exhibition 3,633,285 43,790
44413 Hardware stores 5,879,088 40,703 53210 Automotive equipment rental & leasing 13,165,715 -
44419 Specialized building material dealers 33,892,875 - 53222 Formal wear & costume rental 288,358 956
44420 Lawn & garden equipment & supplies 10,615,132 - 53223 Video tape & disc rental 2,701,500 16,310
44510 Grocery stores 140,650,359 293,517 53230 General rental centers 1,314,592 2,587
44520 Specialty food stores 5,350,900 25,034 54192 Photographic services 2,735,600 8,611
44530 Beer, wine, & liquor stores 10,955,727 27,647 71310 Amusement parks & arcades 3,967,556 49,957
44611 Pharmacies & drug stores 57,850,236 144,633 71390 Other amusement (bowling, golf, fitness) 18,440,496 -
44612 Cosmetics and beauty supplies 3,367,305 9,225 72210 Full-service restaurants 56,124,916 139,508
44613 Optical goods stores 2,359,380 6,636 72220 Limited-service eating places 53,305,416 156,708
44619 Other health care (vitamin, medical equip)4,314,292 - 72240 Drinking places (alcoholic beverages) 5,714,897 -
44710 Gasoline stations 129,247,101 97,818 81111 Automotive mechanical & electrical repair 14,577,687 -
44811 Men's clothing stores 2,511,060 9,640 81112 Automotive body, paint, interior, & glass 9,723,722 -
44812 Women's clothing stores 11,534,999 45,200 81119 Other automotive repair & maintenance 4,444,329 -
44813 Children's & infants' clothing stores 2,746,677 8,705 81141 Home/garden equipment & appliance repair 1,195,843 -
44814 Family clothing stores 24,195,695 71,341 81142 Reupholstery & furniture repair 543,696 -
44815 Clothing accessories stores 1,827,247 5,203 81143 Footwear & leather goods repair 88,533 335
44819 Specialized clothing stores (dress, etc) 3,447,316 10,257 81149 Personal goods repair (watch, boat, garment)2,578,426 -
44821 Shoe stores 7,672,140 30,897 81211 Barber shops, beauty salons, nail salons 11,111,821 50,293
44831 Jewelry stores 8,874,149 14,301 81219 Other personal care services 2,318,740 7,527
44832 Luggage & leather goods stores 558,533 1,889 81231 Coin-operated laundries & drycleaners 1,215,303 16,116
45111 Sporting goods stores 10,278,330 37,457 81232 Drycleaning & laundry (except coin-operated)2,607,706 17,628
45112 Hobby, toy, & game stores 4,702,476 20,429 81291 Pet care (except veterinary) services 1,044,048 -
81292 Photofinishing 671,622 -
Trade Area Gap Analysis
Calculations based on U.S. Economic Census (2007), ESRI Market Profile Report (2010), and Urban Land Institute shopping center sales data (2007)
Calculations are provided for the study of economic concepts and should not be used as the sole determinant in business feasibility analysis.
NAICS Store Category NAICS Store Category

Baraboo Retail Market Analysis, 2011
Baraboo Economic Development Commission and the University of Wisconsin – Extension Page 57
Estimates of Overall Market Demand and Supply, ESRI Estimates of demand and supply for retail trade (including food and drink) as developed by ESRI are presented in table 7.4. ESRI uses their own methodology to estimate demand and supply. For purposes of this market analysis, only aggregate retail demand and supply data are presented here. The table indicates that retail supply (estimated sales) exceeds retail demand (estimated spending potential) in both the Baraboo Convenience Trade Area and the Baraboo Destination Trade Area. Additional detail, not shown in the table below, suggests that this surplus (sales greater than demand) occurs in many of the specific NAICS retail categories. The overall conclusion is that the Baraboo trade areas are capturing a significant amount of non-resident (tourists and others) spending. Exhibit 7.4 Overall Estimates of Market Demand and Supply, 2010 by ESRI
Data Note: Supply (retai l sales) estimates sales to consumers by establ ishments. Sales to businesses are exc luded. Demand (retail potent ia l) estimates the expected amount spent by consumers at retai l establishments. Supply and demand est imates are in current dol lars.
The following points should be considered when using these demand and supply estimates:
The combined retail, food and drink data reported by ESRI indicates that supply (estimated sales) is 27 percent higher than demand (resident spending potential) for both the Convenience and Destination Trade Areas.
The food and drink estimated sales surplus is even greater. In the Destination Trade Area, food and drink estimate sales are 68 percent higher resident spending potential.
The importance of the tourist market to local businesses is significant.
Demand Supply Retail Gap
(Retail Potential) (Retail Sales) (Demand - Supply)
Convenience Trade Area:
Total Retail Trade and Food & Drink (NAICS 44-45, 722) $300,661,008 $382,277,119 -$81,616,111
Total Retail Trade (NAICS 44-45) $256,479,813 $317,620,130 -$61,140,317
Total Food & Drink (NAICS 722) $44,181,195 $64,656,989 -$20,475,794
Destination Trade Area:
Total Retail Trade and Food & Drink (NAICS 44-45, 722) $916,297,041 $1,165,315,956 -$249,018,915
Total Retail Trade (NAICS 44-45) $784,178,599 $942,770,114 -$158,591,515
Total Food & Drink (NAICS 722) $132,118,442 $222,545,842 -$90,427,400
Source: ESRI Retail MarketPlace Profile, 2010

Baraboo Retail Market Analysis, 2011
Baraboo Economic Development Commission and the University of Wisconsin – Extension Page 58
Selected National Trends Effecting Retail Demand and Supply Economic trends will have a significant impact on near-term retail development in the country, state and local trade areas. The following section describes contemporary trends in the retail industry as contributed by Deborah Ersland of Redevelopment Resources. Ms. Ersland is a real estate consultant hired to assist the Baraboo Market Analysis study team. The economy of recent years has totally changed the face of retailing. For the majority of consumers, buying habits have dramatically shifted away from the “wants” to the “needs”, and from the higher price points to the affordable price points. A good monitor of these trends is to look at which national retailers are opening the most new stores in 2011. The number next to each name is the total number of U.S. stores each retailer anticipates opening domestically sometime in 2011: Dollar General (625), Dunkin Donuts (350), Family Dollar (300), Quizno’s (300), CVS (275), Walgreens (225), Advance Auto Parts (200), Five Guys Burgers and Fries (200), GameStop (200), Uniglo-Casual clothes from Japan (200), Auto Zone (140), and Popeye’s (130). These retailers reflect affordable price points, or do-it-yourself such as Advance Auto Parts and Auto Zone. Entrepreneur Magazine identified 10 franchise categories to watch in 2011. They were services that “people can’t afford to live without, such as child care and healthcare, or luxuries made more affordable through franchising, like fitness and spa services, these are businesses that kept growing right through the recession and show no signs of slowing.” They include: child care, fitness, eco-conscious businesses, health services, moving & storage, pets, sandwiches, senior care, spa services, and tutoring. Other consumer and retail trends to consider: 1. Customers are more connected and in control. By 2015, technology will pervade our living and
shopping experiences. Consumers will have even more instant access to comparison pricing, “deals of the day” websites, and of course the ability to shop the world on-line.
2. The future of retail is selling less of more. With expanded access, consumers will buy less of what’s “popular” and more of what “suits me”. Retailers that can figure out how to deliver what niche markets are looking for will reap the profits.
3. Retailers will need to allow their customers to purchase when and where they want to. That includes traditional in-store commerce, e-commerce, m-commerce (mobile), f-commerce (Facebook), s-commerce (social) and v-commerce (video enabled like YouTube).
4. Vintage retail (secondhand) will continue to be an emerging trend. Used will be huge, it is eco-conscious and affordable.
5. Retailers will define themselves more by the customers they serve, rather than the products they sell. Retailers will grow by positioning themselves as more than just purveyors of “stuff” but also as one-stop purveyors of lifestyles or need states.
6. Shopping centers of the future will shift with the demise of the anchor store as the main draw. The place becomes the destination. Consumers will be attracted to areas that offer the ultimate in simplification and convenience – a “pre-packaged total lifestyle experience” where busy consumers can shop, work, socialize, eat, be entertained and live.
Baraboo Retail Market Analysis, 2011
Baraboo Economic Development Commission and the University of Wisconsin – Extension Page 59
Conclusions Two general conclusions can be drawn from this section:
1. Household consumer spending potential in the trade areas is lower than the U.S. average in all categories. Using the ESRI Spending Potential Index (whereby U.S. = 100), the indices for the Destination Trade Area ranges from apparel (lowest at 61) to health care (highest at 96).
2. Alternative estimates provided by ESRI for combined retail, food and drink sales indicate that supply (estimated sales) is 27 percent higher than demand (resident spending potential) for both the Convenience and Destination Trade Areas. The food and drink estimated sales surplus is even greater. These estimates underscore the importance of the tourist market to local businesses.
Using Demand and Supply Data The tables presented in this section (7.2 and 7.3) provide potential sales estimates for residents of the Convenience Trade Area (population of 30,000) and Destination Trade Area (population of 93,000). These estimates assume that everyone in each trade area only shops in that area; likewise it assumes no one from outside of the trade area shops in that area. Therefore, it does not take into consideration any surplus or leakage in or out of the trade area. This data can be used with actual business information (sales estimates or square feet of space) to construct a preliminary “demand-supply analysis.” It should be noted that due to the large geography of the Destination Trade Area, some of the potential sales presented here would likely be captured by neighboring (and competing) trade areas including Madison, Wisconsin Dells and Portage.
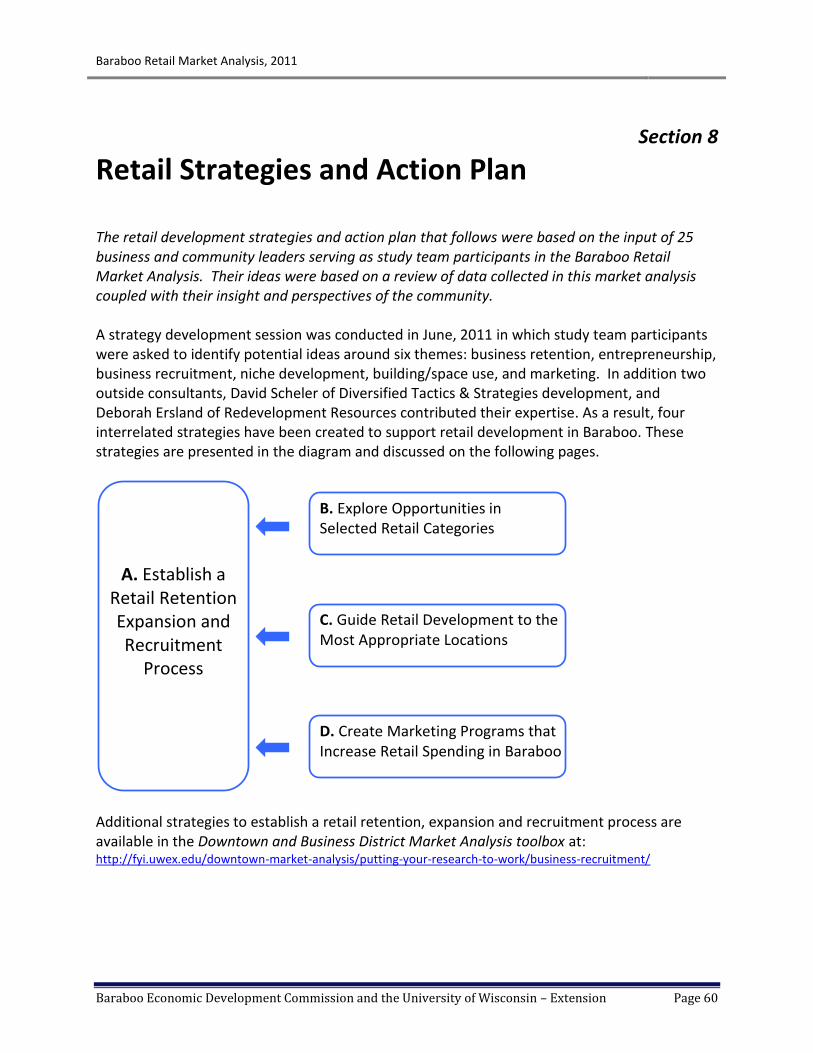
Baraboo Retail Market Analysis, 2011
Baraboo Economic Development Commission and the University of Wisconsin – Extension Page 60
Section 8
Retail Strategies and Action Plan The retail development strategies and action plan that follows were based on the input of 25 business and community leaders serving as study team participants in the Baraboo Retail Market Analysis. Their ideas were based on a review of data collected in this market analysis coupled with their insight and perspectives of the community. A strategy development session was conducted in June, 2011 in which study team participants were asked to identify potential ideas around six themes: business retention, entrepreneurship, business recruitment, niche development, building/space use, and marketing. In addition two outside consultants, David Scheler of Diversified Tactics & Strategies development, and Deborah Ersland of Redevelopment Resources contributed their expertise. As a result, four interrelated strategies have been created to support retail development in Baraboo. These strategies are presented in the diagram and discussed on the following pages.
Additional strategies to establish a retail retention, expansion and recruitment process are available in the Downtown and Business District Market Analysis toolbox at: http://fyi.uwex.edu/downtown-market-analysis/putting-your-research-to-work/business-recruitment/
D. Create Marketing Programs that Increase Retail Spending in Baraboo
C. Guide Retail Development to the Most Appropriate Locations
B. Explore Opportunities in Selected Retail Categories
A. Establish a Retail Retention Expansion and Recruitment
Process

Baraboo Retail Market Analysis, 2011
Baraboo Economic Development Commission and the University of Wisconsin – Extension Page 61
A. Establish a Retail Retention/Expansion and Recruitment Process Create a Retail Retention/Expansion and Recruitment process. A brief outline of steps as summarized by Deborah Ersland of Redevelopment Resources follows. 1. Form a Business Retention/Expansion and Recruitment Committee: The founding
members of this group are extremely important for establishing the enthusiasm, momentum, professionalism and organization that will be needed. The initial impetus for forming this group may involve members of BEDC, Baraboo Area Chamber of Commerce, SBDC, BID, DBI, the CDA and others. The committee should represent a diverse group (i.e. accountants, attorneys, property owners, retailers, realtors) who can represent the community. They need to be problem solvers, and action oriented. This committee and process needs effective leadership to stay on track and organized. Carefully choose a committed and enthusiastic leader. Funding and in-kind services will be important to this committee.
2. Draft a Work Plan: The first step for this group is to start with an initial work plan. All initial
steps should be listed and prioritized. These steps might include the following: gather data about the community from this market analysis; inventory the real estate in the various business districts, particularly the vacant or
underutilized buildings; meet with the property owners of these buildings to garner their support in the process; outline all incentives for business development, create a simple sales package; develop your prospect list, etc.
Realistic timeframes need to be assigned to every step. The right committee member(s) need to be assigned to every step (match skills to tasks). Most importantly, involve the Baraboo community in your work and seek assistance, ideas and contacts through the process. This work plan should be reviewed, updated and modified as needed.
3. Laying the Groundwork for Business Retention/Expansion: Business Retention programs
assist businesses to prevent their relocation, to help them survive in difficult times, and to help them create a retirement/succession plan. Retention programs typically involve partnerships among public and private organizations that assess the assets and opportunities of individual companies through period surveys, interviews and visitations. The purpose is to establish relationships between community businesses and economic developers to strengthen existing companies, establish early warning systems to flag at-risk businesses that require assistance, and ensure that public programs meet local business needs. Baraboo needs to concentrate efforts on ways to keep their healthy businesses strong and to provide necessary support to those that are not. This support might include technical assistance, workshops, speakers, connections and referrals on topics such as:
in store merchandising;
inventory control;
internet sales;

Baraboo Retail Market Analysis, 2011
Baraboo Economic Development Commission and the University of Wisconsin – Extension Page 62
financial planning;
marketing;
customer service;
employee hiring/retention; and
succession planning. Programs that offer financing assistance, joint marketing, promotions or events to build traffic are also helpful.
4. Lay the Groundwork for Business Recruitment: Business recruitment involves selling your
community in the right way, to the right parties.
use the market analysis to present data about Baraboo and its trade areas: size of trade areas, demographics, peer city comparisons, tourist characteristics, business operator perspectives, resident spending potential, etc.;
assemble other information such as available financial incentives, planned improvements, zoning and building code conditions or restrictions;
secure the cooperation of the building owners and the real estate brokers if the property is listed for sale or lease;
survey the business situation: look at the present businesses and why they are working, who are the “anchor” tenants, the previous failures or relocations. Identify all of the national retailers within and around the trade areas; and
study surrounding market areas for ideas on tenant types that may find Baraboo a good match.
All of the data should be analyzed to identify trends or niches that seem apparent, and used to support your community profile and image. Develop a simple sales package that is interesting, informative, honest and current, one that describes Baraboo as a good place to do business.
5. Strengthen Business and Retail Entrepreneurship: Entrepreneurship initiatives are a vital
component of economic and community development. In Baraboo, these initiatives might include:
creating entrepreneurship activities that showcase resources available to entrepreneurs;
building a network of entrepreneurs utilizing various media such as Facebook and Twitter;
identify local investors; provide marketing assistance for emerging entrepreneurs;
provide a single source for local, regional and statewide incentive data;
assist in the business development approval process;
identify and manage current and potential physical and virtual incubators;
develop a co-working arrangement with space to work, meet and connect with a professional creative community (i.e. Milwaukee’s “Bucketworks”); and
consider housing and work space opportunities for artists/craftsmen.

Baraboo Retail Market Analysis, 2011
Baraboo Economic Development Commission and the University of Wisconsin – Extension Page 63
6. Design an Ideal Tenant Mix: This requires using the information on Baraboo’s targeted retail categories (see part 2 of this section) as well as where business in these categories should be physically placed (see part 3 of this section). Compare these categories with available real estate. Ideal businesses will blend with and enhance existing businesses, utilize the available vacant space wisely, create synergy and offer unique merchandise or style. It may be useful to first list your vacancies on paper. Create a lease plan of the business districts and insert all current businesses and note the anchor tenants. Identify the vacancies and acknowledge their size and relationships to other businesses. Test your ideas in the vacant spaces and see if the idea has merit.
7. Identifying Prospective Tenants: For each business category targeted:
research this category online;
purchase business lists;
utilize online telephone directories and city directories;
collect retail merchant lists from other communities;
look for frequent advertisers in local and regional newspapers;
see if there is a trade association for this retail or business category and advertise in their trade publications;
utilize national retail tenant directories;
visit other communities; and
network. Additionally, consider businesses that are currently operating out of homes, expansions of existing businesses, struggling businesses that might benefit from a more appropriate niche strategy, or current store managers that want to start their own business.
8. Making Contact with Prospective Tenants: The first contact one has with a prospective
tenant is important. Whenever possible a personal contact is the best – whether in person or by phone. If the first contact must be via written correspondence, make sure it is well-written letter and ready to garner their attention. Be personal when making a contact, and impress them with your knowledge of their business. You need to express why you feel Baraboo would be an appropriate match for their business. Don’t forget to talk about any incentives, and how your community is prepared and ready to assist a new business. Be patient with your contacts. Provide them with any other information they might need.
9. Getting a Prospect to Say Yes: It is important to make it very simple for the prospect to
work with you. Be prepared to handle their objections, their concerns, and any obstacles that might come up. If they are concerned about financing improvements, take them to see the local banker. If they want outside dining but the zoning doesn’t allow for it, help them work through the process with the City. If they object to some of the lease terms, assist in negotiating with the landlord. It’s important to provide a single contact person responsible for keeping negotiations moving and follow-up on details.

Baraboo Retail Market Analysis, 2011
Baraboo Economic Development Commission and the University of Wisconsin – Extension Page 64
10. Retaining the Businesses You Recruit: Your work is not complete once you have successfully found a new business for your community. It’s important to generate a welcome for this business and make sure that they are settled in and operating according to their plans. Keep up contact with your business in both good times and bad. Involve the new business in community activities and organizations, and by all means, involve them in your future business recruitment efforts! They can speak about the process and what changes could be made to improve it.
11. Develop Your Sales System: During your business retention/recruitment process, you
need to critique your work plan and update it based on the experience you have had. You want to create a repeatable sales process that will work again. Keep all your contact files and sales materials updated. Reevaluate your retention and recruitment criteria for the next situation and modify it as necessary. Don’t forget to get whatever help you need from consultants, realtors, leasing agents, developers, bankers, Wisconsin Department of Development, UW-Extension, merchandising analysts, national demographic firms, etc.
12. Maximize Your Success: When you have been successful in recruiting a new business or
expanding an existing one, all efforts and contributions should be recognized. Celebrate a grand opening with your new business, run a special ad announcing the new business or expansion in your local paper, get the local paper to run a feature article about the business recruitment/retention work and your success, speak at the Rotary, Lions, etc. about your accomplishments. After the “dust has settled” make sure you get testimonials from the new business, their landlord, from elected officials, other businesses, etc. that you can use in your next round of recruitment.

Baraboo Retail Market Analysis, 2011
Baraboo Economic Development Commission and the University of Wisconsin – Extension Page 65
B. Explore Opportunities in Selected Retail Categories The retail retention/expansion and recruitment committee should continue to explore retail categories with high potential for business success. Possible opportunities identified from the market analysis are presented below:
Supported in Study:
NA
ICS
Co
de
Category
Market Opportunities In
itia
l Fo
cus
Gro
up
Re
sid
en
t M
arke
t
Tou
rist
an
d V
isit
ors
Do
wn
tow
n B
us.
Mix
Bu
sin
ess
Su
rve
y
442 Furniture/Furnishings X
443 Electron/Appliance X X
444 Building material and garden equip dealers
Garden store
Hardware store X X X X
445 Food and beverage stores
Grocery store
Specialty food stores (local foods, meats, cheese, wine, etc.)
Convenience store
X X X X X
446 Health and personal care stores
X X
447 Gasoline stations X
448 Clothing and clothing accessories stores
Specialized clothing stores X X X X X
451 Sporting goods, hobby, book, and music stores
Outdoor recreation stores (bicycles, outdoors wear, etc.) X X X X
452 General merchandise stores
Small household merchandise store X X X X
453 Miscellaneous store retailers
Gift shops, incubator and galleries
Office supply store
Pet supply store
X X X X X
722 Eating and Drinking Places
steakhouse, seafood, Italian, brew pub, deli
Coffee shops and other “place-making” businesses (from ice cream to jazz bar)
Fine dining and full-service restaurants
X X X X X
812 Personal services X
Other Pop-up (second location) businesses such as outdoor recreation stores with rentals
Lodging (small hotel, B&B or hostel)
X X
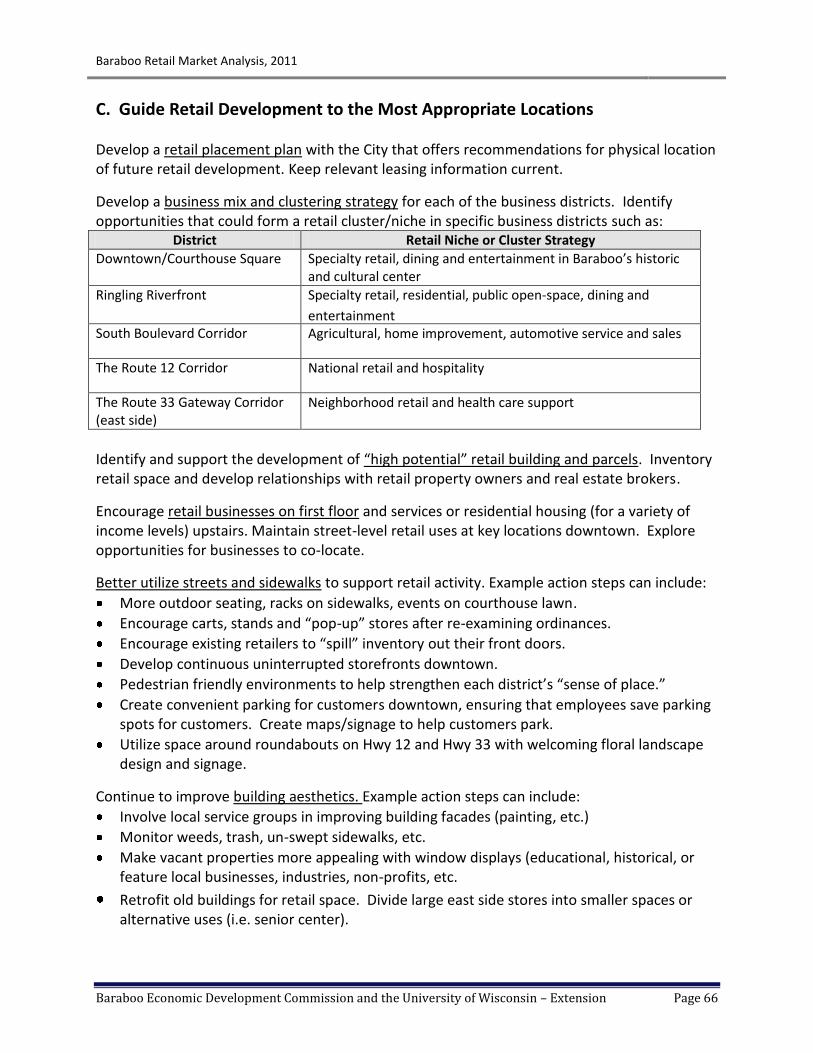
Baraboo Retail Market Analysis, 2011
Baraboo Economic Development Commission and the University of Wisconsin – Extension Page 66
C. Guide Retail Development to the Most Appropriate Locations Develop a retail placement plan with the City that offers recommendations for physical location of future retail development. Keep relevant leasing information current.
Develop a business mix and clustering strategy for each of the business districts. Identify opportunities that could form a retail cluster/niche in specific business districts such as:
District Retail Niche or Cluster Strategy
Downtown/Courthouse Square Specialty retail, dining and entertainment in Baraboo’s historic and cultural center
Ringling Riverfront Specialty retail, residential, public open-space, dining and
entertainment South Boulevard Corridor Agricultural, home improvement, automotive service and sales
The Route 12 Corridor National retail and hospitality
The Route 33 Gateway Corridor (east side)
Neighborhood retail and health care support
Identify and support the development of “high potential” retail building and parcels. Inventory retail space and develop relationships with retail property owners and real estate brokers.
Encourage retail businesses on first floor and services or residential housing (for a variety of income levels) upstairs. Maintain street-level retail uses at key locations downtown. Explore opportunities for businesses to co-locate.
Better utilize streets and sidewalks to support retail activity. Example action steps can include:
More outdoor seating, racks on sidewalks, events on courthouse lawn.
Encourage carts, stands and “pop-up” stores after re-examining ordinances.
Encourage existing retailers to “spill” inventory out their front doors.
Develop continuous uninterrupted storefronts downtown.
Pedestrian friendly environments to help strengthen each district’s “sense of place.”
Create convenient parking for customers downtown, ensuring that employees save parking spots for customers. Create maps/signage to help customers park.
Utilize space around roundabouts on Hwy 12 and Hwy 33 with welcoming floral landscape design and signage.
Continue to improve building aesthetics. Example action steps can include:
Involve local service groups in improving building facades (painting, etc.)
Monitor weeds, trash, un-swept sidewalks, etc.
Make vacant properties more appealing with window displays (educational, historical, or feature local businesses, industries, non-profits, etc.
Retrofit old buildings for retail space. Divide large east side stores into smaller spaces or alternative uses (i.e. senior center).

Baraboo Retail Market Analysis, 2011
Baraboo Economic Development Commission and the University of Wisconsin – Extension Page 67
D. Create Marketing Programs that Increase Retail Spending in Baraboo Establish marketing programs that respond to the shift in consumer behaviors. Example action steps can include:
Demonstrate to the potential consumer the economic benefits and value provided by doing business locally.
Provide hours of operation that are sensitive to the needs of local residents including out-commuters who cannot shop locally on weekdays between 10AM and 6PM.
Help potential customers (and businesses) understand the value of selecting products or services on the bases of local customer service and convenience.
Encourage businesses to adjust their product mix to address consumer buying habits that have shifted away from the “wants” to the “needs” and from the higher price points to the affordable price points.
Encourage businesses to meet consumer shopping needs in terms of selection, hours, value, etc.
Help selected businesses develop an online presence to expand their sales beyond their physical building.
Make placemaking and promotional changes for each district in advance of new consumer travel patterns resulting from the planned U.S. 12 bypass.
Create a unique brand for each retail business district. Example action steps can include:
Utilize a marketing expert to more fully understand what is required to achieve a positive retail image for Baraboo.
Develop a compelling message to distinguish Baraboo’s unique opportunities that set it apart from other communities.
Create a unique brand for each business district. For example, downtown Baraboo is home to local specialty shops and it is an ideal place for strolling.
Develop branding and marketing for all local communities in the region including North Freedom, Merrimac, Reedsburg, Sauk Prairie, etc.
Coordinate branding and logos. Develop better cross-marketing campaigns among businesses. Example action steps can include:
Continue to encourage ways for business owners to get to know other business owners.
Establish a liaison to oversee and communicate activities and events of importance to all local retailers.
Help businesses leverage these events and the potential customer traffic that can be generated.
Facilitate collaboration among business and community leaders representing the different business districts.

Baraboo Retail Market Analysis, 2011
Baraboo Economic Development Commission and the University of Wisconsin – Extension Page 68
Facilitate collaboration with regional tourism entities.
Use social media to connect businesses with businesses (as well as to potential consumers).
Create a Highway 33 East District committee and a South Boulevard District committee. Create a retail and tourism marketing program. Example action steps can include:
Solicit ongoing feedback from tourists like Devil’s Lake State Park campers (and other local area attractions) about what goods/services they would like to purchase.
Create specialized events for tourists and residents (perhaps along riverfront).
Implement system of consistent hours of operation and day(s) with evening hours. Make sure stores are open when tourists are in town (and when residents want to shop) and advertise it with common flags outside each door.
Support future trail connections between Devil’s Lake State Park, downtown and Mirror Lake State Park (Ice Age Trail).
Develop programs to lengthen visitor stays in community.
Provide and promote free downtown wireless internet.
Improve the visitor experience through customer service training, signage, kiosks, and other methods.
Support the Baraboo Chamber of Commerce in efforts to coordinate and implement a comprehensive tourism marketing campaign.

Baraboo Retail Market Analysis, 2011
Baraboo Economic Development Commission and the University of Wisconsin – Extension Page 69
Next Steps-Refining the Strategies and Action Plan Business and community leaders are asked to share additional ideas related to the strategies presented in this section. The study team seeks additional and creative responses to the following four questions:
A. What could be added to the Retail Retention/Expansion and Recruitment Process in Baraboo to ensure its success?
B. What high potential retail categories should be targeted?
C. What are the most appropriate locations for new retail and what are appropriate niches for each district?
D. What additional marketing ideas could be implemented to increase retail spending in
each of Baraboo’s business districts? Send additional input to: Jenny Erickson, Community Resource Development Sauk County – UW Extension West Square Administration Building 505 Broadway Baraboo, WI 53913-2404 608-355-3252 [email protected]