bar course aptitude test (bcat) – five year evaluation
TRANSCRIPT

Bar Course Aptitude Test (BCAT) –Five year evaluation Published September 2021
If you would like this report in an alternative format, please contact the BSB
Research Team on 020 7611 1467 or email [email protected]

2
BCAT - Five year evaluation report
The Bar Standards Board
ContentsContentsExecutive Summary 4Executive Summary 4Introduction 7Introduction 7
The initial BCAT review 8Reliability and validity of the BCAT 9Research aims 9
Methodology 10Methodology 10Approach 10
Datasets 11
Limitations 11
Descriptive Statistics 12Descriptive Statistics 12A. Distribution of BCAT scores 12
Probability and frequency distributions 12Overall BCAT scores by legal year 13By degree classification 14BCAT score distribution: Summary 16
B. BCAT Failure 16Overall BCAT Outcomes 16Impact of the increase in BCAT cut score 16Results of those retaking the BCAT: Are they relatively consistent? 18Proportion of BCAT attempts ending in failure 20BCAT failure: Summary 23
C. The relationship between BCAT and BPTC results 24What proportion of students fail the BPTC? 24BCAT score and BPTC overall outcome 28Relationship between the BCAT and BPTC: Summary 31
Regression Analysis 32Regression Analysis 32A. Linear and Quantile Regression – BCAT score 32
Approach 32Data used 33Model results 33
B. Linear Regression – Relationship between BCAT and BPTC overall score 36
Approach 36Data used 36Model results 37
C. Linear Regression – Relationship between BCAT score and BPTC module scores 39

3
September 2021
Approach 39Data used 39Model results 40
D. Logistic Regression - The relationship between BCAT score and likelihood of enrolling on the BPTC 40
Approach 40Data used 41Model results 41
Conclusions and Discussion 43Conclusions and Discussion 43How is the BCAT performing at filtering out students likely to fail the BPTC? 43Does the information provided by score on the BCAT stay consistent over time? 44Is BCAT score a reliable predictor of attainment on the BPTC? 45
Summary 45

4
BCAT - Five year evaluation report
The Bar Standards Board
Executive SummaryExecutive SummaryThe Bar Course Aptitude Test (BCAT) was introduced in 2012/13 as a mandatory test which must be passed prior to enrolment on the vocational stage of training for qualifica-tion as a barrister in England and Wales. The intended function of the BCAT is to act as a valid and reliable filter to enrolment on vocational training for qualification as a barrister in England and Wales.
This is a report detailing research into how well the BCAT is performing at its intended function following on from changes to the pass mark implemented in 2016. The research involved the analysis of data on BCAT results from the introduction of the test in April 2013 to September 2019. It involved producing descriptive statistics and statistical modelling regarding how well the BCAT is performing on a number of measures.
BackgroundAn initial review of the BCAT was undertaken in 2014/15, which consisted of two strands, including both qualitative and quantitative research:1
• Performance evaluation – testing the validity of the BCAT in terms of its reliability and consistency; and
• Impact evaluation – evaluating the extent to which the BCAT was impacting on stan-dards of entry, learning experience and tutor satisfaction.
The research included analysis of the 2013/14 student cohort, who were the first to be required to sit the BCAT. Key findings and recommendations included that:
• there was found to be a statistically significant positive relationship between BCAT score and overall Bar Professional Training Course (BPTC) score (the average score across BPTC modules);
• doubts were raised in interviews regarding the suitability of the BCAT in fulfilling its objective of filtering out candidates less suited to a career as a barrister;
• group differences in overall BCAT score were found when conducting a regression analysis. Those from minority ethnic backgrounds were found to score lower on the BCAT when controlling for other factors;
• an increase in the cut score for the BCAT was recommended in order to decrease the number of students failing the BPTC: The cut score was subsequently increased from 37 to 45, effective as of the 16/17 BPTC cohort.
Since those changes were introduced, we have been working on this research, which is an updated evaluation of the BCAT, aiming to investigate the extent to which the change to the pass mark of the test has impacted on the performance and impact of the BCAT. In particular, this evaluation seeks to answer the following questions:
• How is the BCAT performing at filtering out students likely to fail the BPTC?
• Is BCAT score a reliable predictor of attainment on the BPTC?
• Does the information provided by score on the BCAT stay consistent over time?
1 Bar Standards Board (2015). Education & Training Committee Paper 8 Appendix 1. BCAT Impact and Performance Evaluation. Accessible online here

5
September 2021
BCAT Evaluation - FindingsThe report highlights a number of areas of concern as to the extent to which the BCAT is performing as we had intended (in particular given the expectations as to failure rates that informed the decision to increase the pass mark to 45). The results throughout this report are representative of the situation for BCAT results as of September 2019; BPTC results as of January 2019; and BPTC enrolment as of September 2019.
The key findings of the evaluation report are listed below.
The BCAT appears to be an ineffective filter for enrolment on vocational train-ing for the Bar
• Overall failure rates on the BCAT were between 1-3 per cent for the first four years of its implementation. The rate of failure increased for 2016/17 when the higher pass mark was introduced to around 8 per cent but had dropped back down to 3 per cent by 2018/19.
• The actual failure rate contrasts significantly from a predicted failure rate of 10 per cent2 upon the introduction of the BCAT (at a pass mark of 37), and a predicted fail-ure rate of 15 per cent3 on the introduction of the revised pass mark of 45.
• A very low proportion of those taking the BCAT fail to pass the test eventually, once retakes are taken into account. Only 89 out of the 12663 candidates who have at-tempted the BCAT since its introduction4 had not yet passed after accounting for retakes (this represents 0.7 per cent of those that have attempted it since 2013).
• The change to the pass mark in 2016/17 seems to have had little impact on failure rates once retakes are considered. Only 51 out of the 5754 candidates who have tak-en the BCAT since the increased pass mark was introduced had not yet passed (this represents 0.9 per cent of those that have attempted it since 2016/7 and compares to 0.5 per cent prior to the new pass mark).
The distribution of BCAT scores has changed quite markedly over time
• The changing failure rates look predominantly to be due to improved performance from students with lower prior attainment. This is also true when controlling for other factors, as shown by regression analysis of BCAT score.
Differences in score for BCAT retakes
• The reliability of the BCAT appears to be quite low, with large jumps in BCAT score between first sit and second sit score for those that fail their first attempt. This is not what we would ideally expect for an aptitude test, although there seems to be little academic consensus as to an ‘acceptable’ level of test-retake reliability for such tests.
The pool of BCAT candidates and BPTC students has changed over time
• The proportion of BCAT candidates and BPTC students with a lower second class degree has shown a downward trend over time, and the proportion of those with a first class degree has shown an upward trend.
• The overall percentage of those that have failed the course, have not yet completed the course, or who have withdrawn decreased every year from 2013/14 to 2016/17
2 Based upon results of the pilot studies for the BCAT3 Based on actual performance of the first BCAT cohorts4 As of September 2019

6
BCAT - Five year evaluation report
The Bar Standards Board
(from 27.2% to 20.0%).5 This trend is seen across all degree class groupings but is particularly pronounced for those with a lower second class degree (decreasing from 47.8% to 38.2%).
• Given the extremely low failure rate of the BCAT itself; the changes in BPTC failure rates and the makeup of BPTC cohorts are most likely not caused by the BCAT act-ing as a filter to enrolment.
• There are a range of other factors beyond the BCAT that could have contributed to the changes observed in the BPTC failure rate and the makeup of students on the course (e.g. more stringent entry standards by BPTC providers, more information available as to likelihood of success on the course, or improvements in teaching on the BPTC).
• It may be that the BCAT is having a deterrent effect by discouraging lower aptitude students from taking the BCAT or attempting to enrol on the BPTC, but the extent of such an effect is impossible to measure with the data available. However, looking at the worst performers on the BCAT (those who fail the test) the propensity to enrol on the BPTC is not markedly different for those who pass the BCAT at the first, second and third attempts. This suggests that poor performance on the BCAT is not acting as a significant deterrent to enrolling on the course for those who fail the test on their first or second attempt.
• As the BCAT was largely designed to filter out candidates more likely to fail voca-tional training for the Bar, and was calibrated at a time when there were more such candidates on the course, the question arises whether the BCAT remains necessary.6
As a predictor of BPTC performance
• When controlling for other factors such as prior educational attainment and BPTC year, BCAT score remains a stable predictor of BPTC performance year on year (al-though it has less predictive value than degree class/institution). Each mark increase in BCAT score is associated with a predicted increase in BPTC overall score of between 0.32 and 0.37 (dependent on legal year) while controlling for other variables.
• However, while this is encouraging in relation to the reliability of the BCAT as a pre-dictor of BPTC performance, the link between BCAT score and BPTC performance is not in itself an argument for the retention of the BCAT. The predictive link between BCAT and BPTC performance does not justify the use of the BCAT unless it is filter-ing out candidates less likely to pass the course, which given the overall failure rate on the BCAT is unlikely to be the case.
5 While we have data for later years, failure rates for the 17/18 and 18/19 cohorts would not be com-parable as students who have not yet passed still have the opportunity to retake modules (and thus pass the BPTC at a later date)6 The review did not seek to answer this question, but the BSB is launching a consultation to seek views on wider questions such as this.

7
September 2021
IntroductionIntroduction1. The Bar Couse Aptitude Test (BCAT) was introduced by the Bar Standards Board
(BSB) in April 2013 as a requirement for all candidates seeking to enrol on the Bar Professional Training Course (BPTC), the vocational stage of training for the Bar in England and Wales from September 2011 to September 2020. The requirement to pass the BCAT prior to enrolment on vocational training for the Bar has remained in place following the replacement of the BPTC with new vocational training courses from September 2020.7
2. The BCAT was introduced following recommendations made by the Neuberger Re-port on Entrance to the Bar (2007, p54)8, and further investigation by the Bar Voca-tional Course Review Group, chaired by Derek Wood QC (2008).9
3. A particular concern for the 2008 Review Group was the volume of students tak-ing the Bar Vocational Course (BVC) (the predecessor to the BPTC) who ended up failing the course, and so the introduction of an examination prior to enrolment on the vocational stage of training for the Bar was recommended.
4. Overall, the aim of the BCAT was to:
• Improve standards on entry to and exit from the BPTC;
• Increase student satisfaction on the BPTC;
• Increase tutor satisfaction in delivering the BPTC;
• Have a positive impact on the first-time failure rate of the BPTC; and
• Become an internationally recognised measure of critical thinking and evalua-tion required to perform to a high standard on the BPTC.10
5. The running of the BCAT is outsourced to an external organisation, which is respon-sible for providing the test at a series of centres in the UK and overseas. The admin-istration of the test and the calibration of it are included as part of the service. The calibration is a rolling process whereby scores are generated using a three parameter Item Response Theory (IRT) model.11 However, there is no check on year to year equivalence.
6. Candidates are allowed to re-take the BCAT any number of times until they pass the test (subject to a fixed interval between retakes). It currently costs £150 to take the BCAT at a testing centre in the UK, and £170 to take the BCAT at a centre outside of
7 See https://www.barstandardsboard.org.uk/training-qualification/becoming-a-barrister/vocation-al-component.html for more information.8 Working Party on Entrance to the Bar (2007) Entry to the Bar; Final Report – Accessed online here 9 Bar Standards Board (2008) Review of the Bar Vocational Course: Report of the Working Group (Wood Report). Accessed online here10 Bar Standards Board (2015). Education & Training Committee Paper 8 Appendix 1. BCAT Impact and Performance Evaluation. Accessed online here 11 The use of Item response theory (IRT) in aptitude tests refers to a mathematical approach that models the probability of achieving a response to an item (question) on a test along some scale measuring a latent (unobserved) trait. IRT is used with the goal of improving test accuracy and reliability at measuring the trait(s) it is intended to measure, particularly where different candidates may receive different sets of ques-tions. Examples of latent traits that such models are designed to measure include; knowledge of an area, personality, aptitude, response to a medical intervention etc. IRT models are commonly used to model tests with binary responses (correct/incorrect, yes/no), but IRT models with non-binary responses also exist.
8
BCAT - Five year evaluation report
The Bar Standards Board
the UK.12
7. The BCAT is designed to measure critical thinking skills only, and does not require those sitting it to have any knowledge of the law in England and Wales. However, the skills it does measure are of direct relevance to a successful career at the Bar and the score achieved on the BCAT has been found to be a valid predictor of perfor-mance on the BPTC.
8. At the time of writing, the BCAT consists of 60 items, and the test score ranges on a scale between 20 and 80. The questions in each sitting of the BCAT are taken from a wider pool of possible questions that are recycled sporadically.
The initial BCAT review
9. An initial review of the BCAT was undertaken in 2014/15, which consisted of two strands, including both qualitative and quantitative research:13
• Performance evaluation – testing the validity of the BCAT in terms of its reliability and consistency; and
• Impact evaluation – evaluating the extent to which the BCAT was impacting on standards of entry, learning experience and tutor satisfaction.
10. The research included analysis of the 2013/14 student cohort, who were the first to be required to sit the BCAT. Key findings and recommendations included that:
• there was found to be a statistically significant positive relationship between BCAT score and overall BPTC score (the weighted average score across BPTC mod-ules);
• doubts were raised in interviews regarding the suitability of the BCAT in fulfilling its objective in filtering out candidates less suited to a career as a barrister;
• group differences in overall BCAT score were found when conducting a regression analysis. Those from minority ethnic backgrounds were found to score lower on the BCAT when controlling for other factors;
• an increase in the cut score for the BCAT was recommended in order to decrease the number of students failing the BPTC: The cut score was subsequently in-creased from 37 to 45.
11. Six years after its introduction, more data are available, and we can build up a more comprehensive picture of whether the BCAT is meeting its objectives, including whether the revised cut-score has been a success at filtering out candidates likely to fail the BPTC.
12. This report aims to assess how well the BCAT is functioning against its aims since its introduction.
12 Cost as of November 2019. More information about the BCAT can be found in the BCAT Handbook on the BSB website: 2019 Handbook: link 13 Bar Standards Board (2015). Education & Training Committee Paper 8 Appendix 1. BCAT Impact and Performance Evaluation. Accessed online here

9
September 2021
Reliability and validity of the BCAT
13. Two of the principal requirements of the BCAT are that it has high validity and reliabil-ity.
14. From a statistical point of view; validity relates to whether the test measures what we want it to measure and reliability relates to how consistent the test is in doing so.14
15. For the BCAT, validity relates to how well it measures the aptitude required for suc-cess at the vocational stage of training for the Bar in England and Wales15. The reliability of the BCAT relates to how consistent the test is in doing this over time and across candidates. This review will only consider these matters using quantitative measures.
16. We can better understand the validity of the BCAT by looking at the relationship between BCAT score and attainment on the BPTC. Measures that may help to better understand the reliability of the BCAT include the consistency of BCAT scores over time, and rates of failure. Ideally BCAT scores would show a positive relationship with BPTC outcomes, and the relationship shown for each given score would stay consistent across years as long as the cohort of students taking the BCAT each year is relatively similar. The BCAT cut score should also reliably filter out students most likely to fail the BPTC on a consistent basis.
Research aims
17. This research was a quantitative analysis of how well the BCAT is meeting its objec-tives. The BCAT was introduced with the aim of helping to ensure that candidates with a high likelihood of failing the BPTC were not able to enrol on the course, this research assessed the BCAT against this objective, both before and after the intro-duction of the new cut score.
18. In addition, the relationship between BCAT scores and BPTC outcomes was as-sessed to help better understand the relationship between the BCAT and the skills selected for at the vocational stage of training for the Bar. The reliability of the BCAT was also analysed in terms of whether results of those re-taking it stayed relatively consistent, and whether there have been changes in the distribution of BCAT results over time.
Research questions:
• How is the BCAT performing at filtering out students likely to fail the BPTC?
• Is BCAT score a reliable predictor of attainment on the BPTC?
• Does the information provided by score on the BCAT stay consistent over time?
14 A simple and brief introduction to reliability and validity in quantitative research is given by: Heale, R. and Twycross, A., 2015. Validity and reliability in quantitative studies. Evidence-based nursing, 18(3), pp.66-67. Accessed online at: https://ebn.bmj.com/content/18/3/6615 Which from 2010/11-2019/20 was the BPTC, but which consists of new courses brought in following the Future Bar Training reforms from 2020 onwards

10
BCAT - Five year evaluation report
The Bar Standards Board
MethodologyMethodologyApproach
19. An exploratory analysis of the relevant data was undertaken, which included produc-ing descriptive statistics on BCAT score, as well as undertaking several regression analyses.
20. The descriptive statistics aim to highlight trends seen in BCAT scores since the intro-duction of the test, with a focus on:
• the distribution of BCAT scores;
• failure on the BCAT; and
• the relationship between BCAT scores and BPTC results.
21. The regression analyses would be undertaken in order to make better inferences regarding the following questions:
• What variables are strongly related to BCAT score?
• Do the relationships differ for different quantiles of the BCAT score distribution?
• Have BCAT scores varied significantly over time?
• What is the estimated relationship between BCAT score and BPTC overall score when controlling for other factors?
• Are there any trends that emerge in the relationship between BCAT score and score in individual BPTC modules?
• What relationship is there between BCAT score and the likelihood of enrolling on the BPTC?
22. Regression analysis is a process that allows us to estimate the relationship between an outcome variable and one or more independent variables. Outcome variables are variables for which we are interested in better understanding what influences their value (eg what variables potentially have an effect on BCAT score) and independent variables are those for which we are trying to better understand whether they poten-tially have an effect on the outcome variable when controlling for other factors (eg whether degree classification shows a relationship with BCAT score when controlling for ethnicity.)
23. Regression analysis allows us to make inferences from questions that cannot be made solely via the presentation of descriptive statistics. Outputs from regression models include values known as coefficients and these coefficients can give us a better idea of the estimated relationship between one variable and another when con-trolling for other independent variables in the model.
24. Where differences or variables are described as ‘statistically significant’, this indi-cates that they have been tested and found to be statistically significant at the 5 per cent significance level or below (the standard significance level for social research). A significance below 5 per cent (or one in 20) would suggest that there is less than a 5 per cent likelihood of observing so extreme a value for the test statistic if there were no relationship between the relevant independent and outcome variable, given the

11
September 2021
data.
25. There are no repeated cases (multiple entries for the same person) in the data used for the regression models.
Datasets
26. The datasets used for the research were taken from the BSB’s data warehouse.
• BCAT data: Data on all BCAT attempts since the introduction of the test. The dataset included BCAT sits from the introduction of the test in April 2013 to Sep-tember 2019.
• BPTC data: Data on all BPTC students provided to the BSB at enrolment, and as part of the Annual Reflective Review process each year. The dataset covered stu-dents enrolled on the BPTC from 2013/14 to 2018/19 legal years.16 At the time of analysis BPTC results data were not yet available for 2018/19 enrolled students.
27. Variables found in both the BCAT and BPTC datasets were amalgamated with the BPTC data taking precedence when collating the two datasets.
28. Information regarding the variables used in the regression models is given for each model later in the report.
Limitations
29. This research does not undertake a qualitative analysis of the BCAT and does not consider the extent to which the factors measured by the BCAT match the skills re-quired in vocational training for the Bar.
30. This research makes use of regression analysis to enable a number of different fac-tors that appear to impact on BCAT score, BPTC score and enrolment on the BPTC to be considered simultaneously. This ensures the analysis can identify which factors have the strongest predictive effect. Regression analysis is a statistical technique that examines the relationship between a single outcome variable and one or more explanatory variables. Regression analysis models the size of any predictive rela-tionship, and its statistical significance, while controlling for the effects of the other explanatory variables. However, it should be noted that the size of the predictive rela-tionships identified are statistical estimates and thus may be over- or under-estimated
31. Another limitation is that this statistical approach can only control for variables which are known – other factors, for which data are not available, could also contribute to BCAT and BPTC scores, and enrolment on the BPTC course. As a result, the analy-sis presented here may present only part of the picture.
32. The analysis undertaken within this research seeks to highlight trends and relation-ships between variables, and attempts to provide answers to the research questions. Understanding how to improve the BCAT’s performance would require further re-search into the area of psychological testing, and is beyond the scope of this report.
16 The academic year for the BPTC broadly coincided with the legal year as it started in October

12
BCAT - Five year evaluation report
The Bar Standards Board
Descriptive StatisticsDescriptive Statistics33. The results throughout this report are representative of the situation for BCAT results
as of September 2019; BPTC results as of January 2019; and BPTC enrolment as of September 2019.
A. Distribution of BCAT scores
Probability and frequency distributions
34. To better explain what follows, this is a very brief background on frequency distribu-tions.
35. A frequency distribution is a description of the number of occurrences of possible outcomes for something being measured, and is appropriate to use when the units of what is being measured are discrete (eg different colours, or different species.)
36. BCAT scores are integer scores only, and so the units are on a discrete scale. Fre-quency distributions can be used to represent such data, including relative frequency distributions, which show the proportion of observations out of the total number of observations that are represented by a certain discrete value (eg 1% of all candidates score 56 on a test).
37. Two measures that can be used to describe a distribution are skewness and kurtosis.
• Skewness relates to the symmetry of a distribution; ie whether one side (tail) of the distribution is longer than the other, and how much it differs from a normal distribution.17 If the left side tail of the distribution spreads out further than would be expected compared to the right side, then the distribution can be said to be left skewed, or negatively skewed, and the opposite scenario would be called a right skewed, or positively skewed, distribution;
• kurtosis relates to how flat or peaked the distribution is around the mean value. A more peaked distribution would suggest it is more common to score closer to the mean value than it is to score relatively higher or lower on the test, and as such the test may be less adept at providing information on those with different aptitudes.
38. A survey of the distributions of 48 different aptitude and achievement tests undertak-en in 1955 by Lord found that the distribution of results for those taking easier tests tended to be more left skewed, and the opposite was the case for those taking more difficult tests.18 A leftwards/negative skew in a distribution in test scores may suggest that the test is relatively easy for the takers of the test overall, with more candidates performing well, and grouped together on the right side of the distribution, and fewer in the long-left tail of the distribution.
39. A review undertaken in 1989 by Micerri found that aptitude tests frequently had one tail heavier than the other in the distribution of test scores (only around 30% of tests assessed had a relatively symmetric distribution and less than 10% altogether had
17 A normal distribution is a bell-shaped distribution symmetric around the mean value, with 68% of values within one standard deviation of the mean, and 95% within two standard deviations18 Lord, F.M., 1955. A Survey of Observed Test-Score Distributions With Respect to Skewness and Kurtosis. Educational and Psychological Measurement, 15(4), pp.383-389.

13
September 2021
tail weights and symmetry approximating that expected from a normal distribution).19 A prevalence of non-normality in the distribution of test scores has also been found by Ho and Yu (2015) who recommended that “distributional descriptive statistics be calculated routinely to inform model selection for large-scale test score data”.
40. Such findings would suggest that we should not expect the BCAT to display a normal distribution of the frequency of scores around the mean, nor indeed should it be con-sidered problematic if the distributions do divert from normality.
41. However, presenting distributions can be incredibly useful for describing data, as there can often be multiple things occurring at differing values for the outcome we are interested in, and the shape of the distributions may point towards how relatively easy or difficult a test is for people taking it, amongst other trends that may be occur-ring.
Overall BCAT scores by legal year
42. If the BCAT is a consistent filter for entry to the BPTC, we may expect the probability of attaining different BCAT scores to stay relatively consistent across years. This as-sumes the aptitude of the students taking it stays consistent across years, which may not be the case.
43. For the purposes of monitoring the effect of the cut score on the BCAT we are prin-cipally concerned with the left side tail of the distribution, and ensuring that the cut score principally affecting those in the left side of the tail is set at an appropriate level.
44. Chart 1 below, displays relative frequency distributions of those taking the BCAT by legal year since 2013.20 21 The distributions of scores by legal year appear to differ by year, and have become increasingly peaked since 2017, with much of the increase seemingly coming from a squeezing of the left hand side of the distributions: this is highlighted by a shift in the 2 per cent, 5 per cent and 10 per cent quantile (percen-tile) scores (the scores at which 2%, 5% and 10% of BCAT candidates per year are below respectively).
19 Micceri, T. 1989. The unicorn, the normal curve, and other improbable creatures. Psychological bulletin, 105(1), p.156.20 The legal year runs from the start of October to the end of September and corresponds with the start of the BPTC as of the time of writing.21 The density on the y-axis for Chart 1 refers to the proportion of BCAT scores along the scale. For example if 10% of BCAT takers got a score of 56 on the test for a given legal year, then the density would be 0.10 on the y-axis.

14
BCAT - Five year evaluation report
The Bar Standards Board
Chart 1. Relative frequency distributions of BCAT scores by legal year since the BCAT was introduced
45. The distributions of scores by legal year appear to differ by year, and have become increasingly peaked since 2017, with much of the increase seemingly coming from a squeezing of the left hand side of the distributions: this is highlighted by a shift in the 2 per cent, 5 per cent and 10 per cent quantile (percentile) scores (the scores at which 2%, 5% and 10% of BCAT candidates per year are below respectively).
46. The scores for these quantiles have gone up by around 5 points from 2013-2019. In comparison, the means and medians have gone up by around 2-3 points over the same period. This may suggest that the calibration of the test scores has shifted, that there are fewer relatively weaker candidates taking the test, that candidates are becoming more practised in the requirements of the test, or a mixture of all three.
47. The shape of the distributions may be due to numerous factors and is potentially affected by differing competencies among those taking the test each year. To better understand this, we can further disaggregate BCAT results by degree classification in order to see whether the distributions differ as markedly on a year to year basis.
By degree classification
48. Table 1 below gives a breakdown of some key summary statistics of the distribution of BCAT scores by legal year for those with an first class, upper second class and lower second class degree The mean (average) scores when broken down by degree

15
September 2021
classification vary quite markedly, as do scores at different quantiles (percentiles).22
Table 1. Summary statistics of BCAT scores by legal yearParam-eter
Degree class Legal Year Change 2012/13
to 2018/19
2012/13 2013/14 2014/15 2015/16 2016/17 2017/18 2018/19
Mean First class 55.6 54.3 54.2 54.9 56.1 57 57.4 1.8
Upper second class 52.3 51.8 51.4 52 52.9 53.8 54.3 2.0
Lower second class 48.3 48.2 48.5 49.0 49.2 49.6 50.1 1.8
Median (50% Quantile)
First class 56 55 56 56 56 57 58 2.0
Upper second class 53 52 51 52 53 53 54 1.0
Lower second class 49 49 49 49 50 50 50 1.0
2% Quan-tile
First class 42 36.5 37.6 41 44.92 45.7 47 5.0
Upper second class 38 37.1 38 39 41 43 46 8.0
Lower second class 35 34 36 38 38 39 41 6.0
5% Quan-tile
First class 45.2 40 41 45 47.3 49 49 3.8
Upper second class 41 40 41 43 44.3 46 47 6.0
Lower second class 38 37 40 39 41 43 42 4.0
10% Quantile
First class 48 45 46 48 49 51 51 3.0
Upper second class 44 42 44 45 47 47 49 5.0
Lower second class 41 41 41 42 43 44.8 45 4.0
90% quantile
First class 62 61.5 61 61 63 64 63.7 1.7
Upper second class 60 59 59 59 59 61 61 1
Lower second class 55 56 55 55 55 55 55 0
Number of BCAT attempts 2,039 1,766 1,637 1,572 1,993 2,072 1,943
49. Table 1 shows that the overall trends shown in Chart 1 across all candidates are also seen when breaking down the distribution of BCAT scores for each degree class pre-sented. From 2012/13 to 2018/19, the mean scores by legal year increased across all degree classifications by just under two points, and the median scores increased by 1-2 points.
50. Notably, the scores for the 2 per cent, 5 per cent and 10 per cent quantiles increased by more than the increase seen for the means and medians. For example, the 10 per cent quantile score went up by:
• three points from 48 to 51 for those with a first class degree;
• five points from 44 to 49 for those with an upper second class degree;
• and by four points from 41 to 45 for those with a lower second class degree.
51. An increase in the score for those scoring at the 10 per cent quantiles has been seen as a general trend across all degree classes from 2015/16 onwards.
52. In addition, the score for the 90 per cent quantile (the score which 90% of respective candidates fall beneath) changed by only;
22 Those with a different degree classification, or who had not yet received their degree result have been taken out, which may skew the results slightly towards being more representative of those that en-rolled on the BPTC, as the record on degree classification for this group is more complete, particularly for the 2017/18 legal year test takers. This is due to the BSB not asking for degree classification or university attended data from BPTC providers upon enrolment prior to the 2019/20 enrolled cohort. For BPTC students from 2013/14 to 2017/18 the record on academic attainment and BPTC results has been returned by provid-ers as part of the Annual Reflective Review process.

16
BCAT - Five year evaluation report
The Bar Standards Board
• 1.7 points for those with a first class degree;
• 1.0 point for those with an upper second class degree;
• and not at all for those with a lower second class degree.
BCAT score distribution: Summary
53. In summary, the analysis presented on the distribution of BCAT scores suggests that:
• BCAT mean scores have increased over time;
• BCAT scores have increased most sharply over time for those scoring relatively low on the scoring scale;
• the distribution of BCAT scores has become more peaked for those with a lower second class degree;
• the scores for those scoring relatively lower on the BCAT have shown a general trend for year on year increases across every degree class from the 2015/16 legal year onwards;
• this has implications for whether providing a raw BCAT score, or an indication of the score range has value as a predictor of success on vocational training, when the average score, and scores for candidates scoring lower on the BCAT in par-ticular, have trended upwards over time. It is possible, however, that this upwards trend has been due to an overall change in the aptitude of those taking the BCAT, and this will be investigated further on in this report via regression modelling.
B. BCAT Failure
Overall BCAT Outcomes
54. Since its introduction, the vast majority of those that have attempted the BCAT have passed it at the first attempt, and the majority of those who failed their first sit have eventually passed the test.
55. Of the 12,663 candidates that have attempted the BCAT since its introduction, 12,574 have passed eventually, and 89 have failed and not yet re-attempted the BCAT (around 0.7%).
Impact of the increase in BCAT cut score
56. It was hoped that the increase in BCAT cut score would go some way to better filter-ing out candidates that are unlikely to pass the BPTC. Overall, the change appears to have had a minimal impact.
57. Around 0.5 per cent (around 1 in 200) of those who had first attempted the BCAT when the cut score was set at 37 have failed the BCAT and not re-attempted it.
58. In comparison, around 0.9 per cent (around 1 in 110) of those who had first attempt-ed the BCAT when the cut score was at the current level of 45 have failed the BCAT and not re-attempted it. However, this figure is skewed higher by those that had failed the BCAT within three months of the time the data for this research were collated,

17
September 2021
and it is likely that most of them would go on to retake and pass the BCAT. When discounting such students, it is estimated that around 0.6 per cent (around 1 in 160) of those that have taken the BCAT since the introduction of the new cut-score have failed it and are less likely to re-attempt it. This is a minimal change from the equiva-lent figure seen for those first attempting the BCAT when the previous cut score was in place.
59. From when the BCAT cut score was raised in 2016/17 until September 2019, 5754 people have sat the BCAT for the first time: Of these:
• 5524 passed and 230 failed their first sit, of which 32 have not yet re-sat the BCAT;
• 154 passed and 42 failed their second sit, of which 9 have not yet re-sat the BCAT;
• 20 passed and 13 failed their third sit, of which 10 have not yet re-sat the BCAT; and
• 2 passed and 1 candidate failed their fourth attempt at the BCAT.
60. This means that since the cut score was raised, a total of 52 individuals have failed the BCAT once multiple retakes are taken into account, as of September 2019.
61. A Sankey diagram of the flow of the pool of BCAT candidates since the cut score was raised to 45 is given below. The size of each coloured bar represents the number of candidates at each stage.
Fig 1. Sankey diagram of overall BCAT outcomes for those sitting the BCAT for the first time following the introduction of the new cut score in 2016/17
62. Of those that passed the BCAT, around 69 per cent have gone on to enrol on the BPTC: When broken down by which BCAT sit was the one which passed, around 69 per cent of those that passed their first sit at the BCAT went on to enrol onto the BPTC, the respective figures are 61 per cent for those that passed at their second sit, and 65 per cent for those that passed at their third sit. This suggests that failing the BCAT and needing to retake the test one or more times is not having a large impact on whether candidates go on to enrol on the BPTC, as poor performance on the

18
BCAT - Five year evaluation report
The Bar Standards Board
BCAT is not acting as a deterrent to enrolling on the course for the majority of those that need more than one attempt to pass the BCAT.
63. The flow of candidates from the BCAT to enrolment onto the BPTC (or not) is repre-sented in the below Sankey diagram, the size of each coloured bar represents the number of candidates at each stage.
Fig.2 Sankey diagram of enrolment on the BPTC for those that passed the BCAT
Results of those retaking the BCAT: Are they relatively consistent?
64. Analysing the results of those that retake the BCAT can help give a better idea of the reliability of the test. From one sitting to the next, we may expect their score to change a bit due to practice effects23, but we would not expect their score to change drastically if the BCAT acts as a relatively stable measure of competence across indi-viduals: such indicators relate to test reliability of the BCAT. 24
65. Figure 3. below shows the flow of BCAT results for those who failed their first sit at the test. Just over two out of three of those who failed their first sit went on to pass their second sit, and around half of those who failed their second sit went on to pass their third sit.
23 Such an effect relates to test takers scoring differently (usually higher) on a test due to having taken the test before. See Miller, L.A. and Lovler, R.L., 2018. Foundations of psychological testing: A practical ap-proach, Chapter 6. Sage Publications 24 Those with a BCAT score of 20 were removed from the data for analysis on reliability, as it was thought candidates scoring the absolute minimum on the test were extreme outliers and possibly had not properly attempted the test.

19
September 2021
Fig 3. Sankey diagram of the progression of those who failed their first sit at the BCAT
66. Chart 2 below displays the difference in BCAT score between Sit 2 and Sit 1 for those who failed the BCAT for their first sit. The mean difference is an increase in BCAT score of around 7.2 points, and the median difference is an increase of around 7 points.
Chart 2. Difference in BCAT score between sit 1 and sit 2 for BCAT takers
67. Chart 2 highlights that those re-sitting the BCAT after failing it at the first attempt frequently achieve a significantly better score for the second sit, and relatively rarely achieve a score worse than that gained for their first attempt.
68. A reliability coefficient can be used for assessing the reliability between one test sitting and another for the same test. This is a score showing the correlation between the results of the two attempts and would be positive and have a value of 1 if the re-sults of two tests were perfectly correlated. The coefficient is calculated via the Pear-son product moment correlation formula and there is no fixed value at which reliability

20
BCAT - Five year evaluation report
The Bar Standards Board
can be assessed as being satisfactory or not.25
69. The reliability coefficient between first sit and second sit scores for those that failed their first sit at the BCAT was around 0.27 (n = 290). This would appear to be a low value for the coefficient, as ideally, if it was measuring a relatively concrete measure of ‘aptitude’, the first sit and second sit results should be more highly correlated.
70. The test-retest reliability coefficient between one sit of a test and another is generally used to refer to a controlled study where two tests designed to measure a trait are taken within a relatively short timeframe (less than a month). A coefficient of 1 would be seen if all test takers achieved exactly the same results upon second attempt, and the literature suggests that coefficients greater than 0.9 would be desirable for a test-retest score “in applied settings where important decisions are made with respect to specific test scores”.26
71. The coefficient for first sit and second sit scores for those that failed their first sit at the BCAT is not a formal test-retest score, but a higher correlation coefficient than that seen would still be expected if the test is a reliable barometer of the aptitude it is designed to measure.
Proportion of BCAT attempts ending in failure
72. While the overall rate of failure per candidate is less than one out of every 100 candi-dates, the proportion of attempts at the BCAT ending in failure for each legal year is higher than this figure.
73. For the BCAT to be a reliable test for filtering out unsuitable candidates for the BPTC, we may also expect the proportion of fails for those taking the BCAT to stay relatively consistent across time given a set cut score, assuming that the profile of test takers remains broadly similar across years. The new cut score was introduced in Decem-ber 2016, so we may expect the failure rate prior to this to stay relatively consistent at a prior level, and the failure rate after this to stay consistent at a new level.
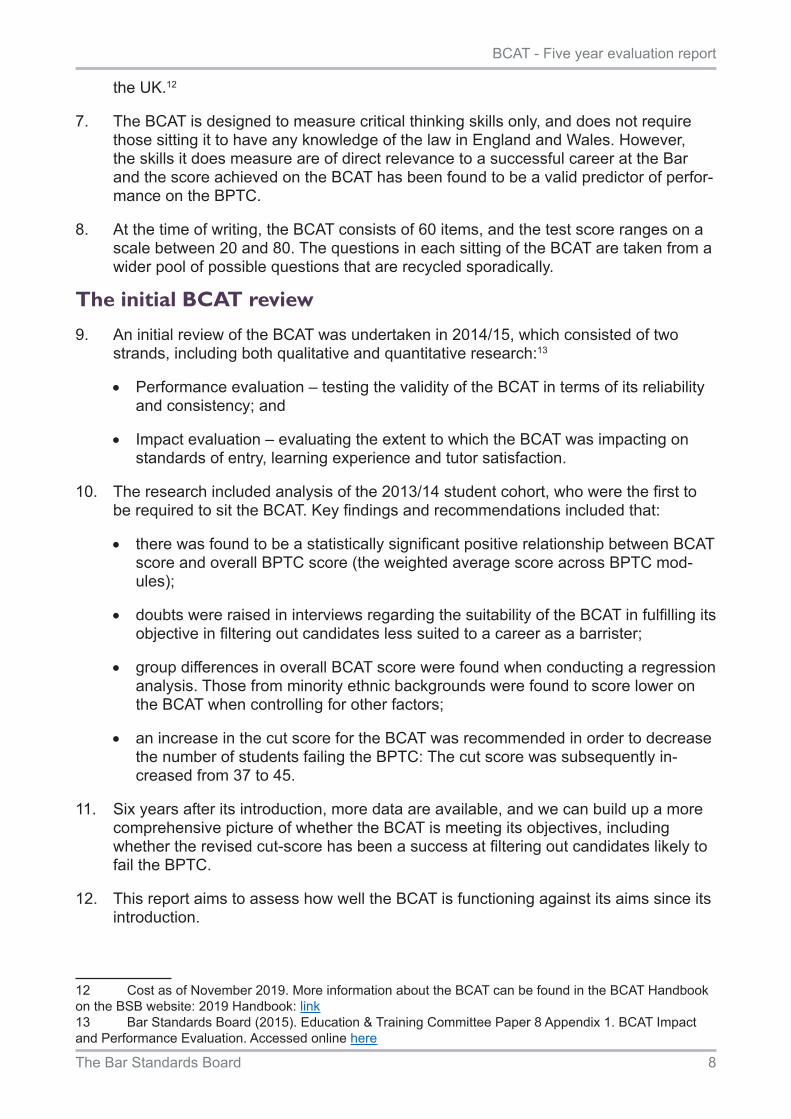
74. Chart 3 below shows the percentage of attempts at the BCAT that resulted in failure by legal year since it was introduced in 2013. There are several things that stand out:
• The proportion of attempts at the BCAT that end in failure is quite low, at around or less than three per cent in five of the last six legal years.
• The failure rate increased in 2016/17 after the introduction of the new cut score, but then decreased markedly in 2017/18 and decreased again in 2018/19.
• The failure rate dropped from 2014/15 to a low of around one per cent in 2015/16, prior to the introduction of the new cut score.
• Overall, the failure rate on the BCAT is not consistent across years at a given cut score level, which could be due to several reasons, but is perhaps not what we would expect from such a test.
25 See Miller, L.A. and Lovler, R.L., 2018. Foundations of psychological testing: A practical approach. Sage Publications, Chapter 6.26 Nunnally, J. C. (1978). Psychometric theory (2nd ed.). New York: McGraw-Hill as referenced in Lance, C.E., Butts, M.M. and Michels, L.C., 2006. The sources of four commonly reported cutoff criteria: What did they really say?. Organizational research methods, 9(2), pp.202-220.
21
September 2021
Chart 3. Percentage of attempts at the BCAT that resulted in failure by legal year
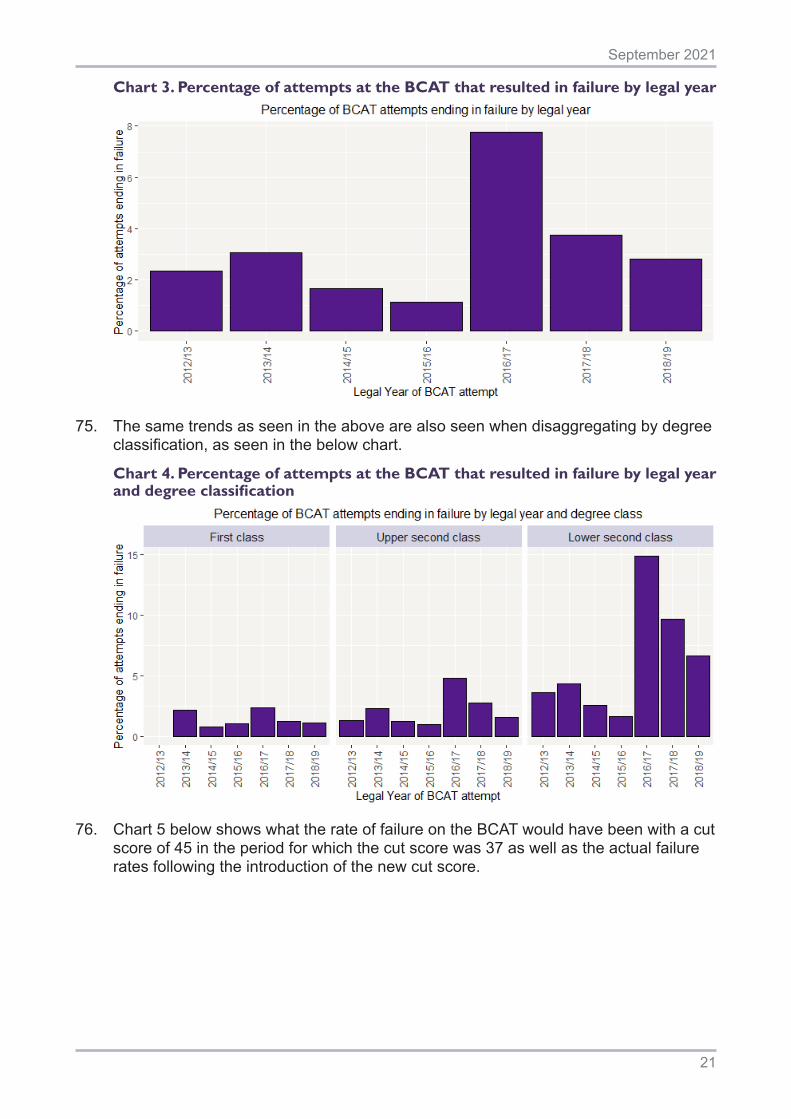
75. The same trends as seen in the above are also seen when disaggregating by degree classification, as seen in the below chart.
Chart 4. Percentage of attempts at the BCAT that resulted in failure by legal year and degree classification
76. Chart 5 below shows what the rate of failure on the BCAT would have been with a cut score of 45 in the period for which the cut score was 37 as well as the actual failure rates following the introduction of the new cut score.

22
BCAT - Five year evaluation report
The Bar Standards Board
Chart 5. BCAT attempts resulting in failure or that would have resulted in failure with a cut score of 45
77. The rate of failure would have been around 16.6 per cent in 2013/14, more than twice as much as that seen in 2016/17, and more than five times greater than that seen in 2018/19. The rate of failure in 2015/16 would have been similar to that seen in 2016/17, which suggests that operation of the test in 2016/17 was in line with that seen in 2015/16. The same cannot be said for the operation of the test in 2017/18 in relation to 2016/17.
78. Similar trends are seen when disaggregating by degree classification as shown in Chart 6 below.
Chart 6. BCAT attempts resulting in failure or that would have resulted in failure with a cut score of 45 by degree classification
23
September 2021
BCAT failure: Summary
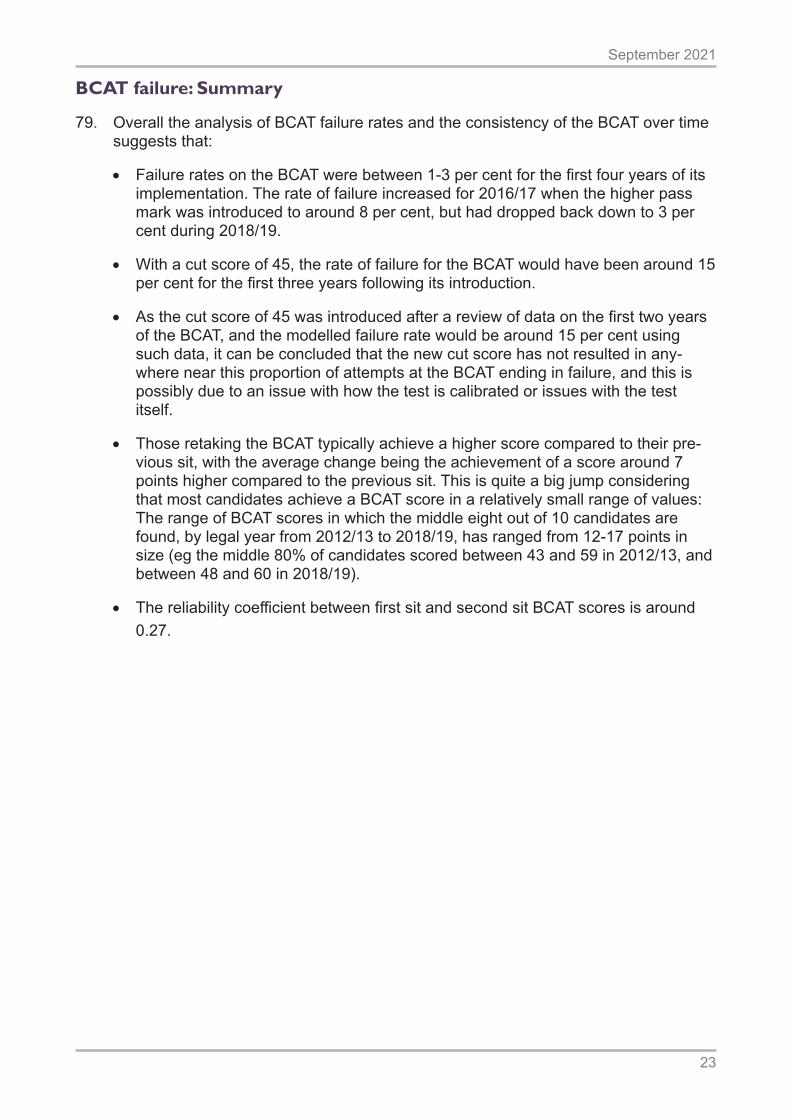
79. Overall the analysis of BCAT failure rates and the consistency of the BCAT over time suggests that:
• Failure rates on the BCAT were between 1-3 per cent for the first four years of its implementation. The rate of failure increased for 2016/17 when the higher pass mark was introduced to around 8 per cent, but had dropped back down to 3 per cent during 2018/19.
• With a cut score of 45, the rate of failure for the BCAT would have been around 15 per cent for the first three years following its introduction.
• As the cut score of 45 was introduced after a review of data on the first two years of the BCAT, and the modelled failure rate would be around 15 per cent using such data, it can be concluded that the new cut score has not resulted in any-where near this proportion of attempts at the BCAT ending in failure, and this is possibly due to an issue with how the test is calibrated or issues with the test itself.
• Those retaking the BCAT typically achieve a higher score compared to their pre-vious sit, with the average change being the achievement of a score around 7 points higher compared to the previous sit. This is quite a big jump considering that most candidates achieve a BCAT score in a relatively small range of values: The range of BCAT scores in which the middle eight out of 10 candidates are found, by legal year from 2012/13 to 2018/19, has ranged from 12-17 points in size (eg the middle 80% of candidates scored between 43 and 59 in 2012/13, and between 48 and 60 in 2018/19).
• The reliability coefficient between first sit and second sit BCAT scores is around 0.27.

24
BCAT - Five year evaluation report
The Bar Standards Board
C. The relationship between BCAT and BPTC results
80. When looking at the relationship between the BCAT and BPTC results the main ques-tion of concern is whether the BCAT cut score is set at the correct level to ensure that those most likely to fail the BPTC do not enter onto the course.
81. There are also a few other questions worthy of investigation, and the following will be explored in this report:
• What proportion of students fail the BPTC and how does this compare to the proportion of candidates failing the BCAT?
• What trends stand out regarding students that fail the BPTC and their BCAT score?
• What do the predictive relationships between BCAT score and BPTC overall score as well as BPTC modular score look like?
82. The first two questions will be explored in this section, whereas the latter question is better explored via the use of regression modelling.
83. At the time of analysis, the BSB had data on student outcomes on the BPTC from the 2011/12-2017/18 legal years. As BPTC students are required to pass the BCAT prior to enrolment, this means that the BCAT data used for looking at the relationship be-tween BCAT scores and BPTC outcomes will be that covering the period from 2013 to September 2017.
What proportion of students fail the BPTC?
84. The table below shows the proportion of students yet to complete the BPTC, as well those who have failed or withdrawn from the course by year of enrolment. It is as-sumed that most of those who enrolled several years ago and are yet to complete the course will most likely not continue their studies. 2017/18 students are not included in the below as they were less likely to have completed the BPTC when the data was collected.
Table 2. Percentage of those failing, withdrawing or yet to complete the BPTC by legal year and degree classDegree class BPTC overall grade 2011/12 2012/13 2013/14 2014/15 2015/16 2016/17Overall Not yet complete 3.1% 5.2% 4.6% 4.0% 6.7% 11.0%
Fail 13.9% 15.2% 20.0% 15.5% 13.7% 6.0%27
Withdrawn 0.9% 1.0% 2.6% 4.0% 2.1% 3.0%Total 17.8% 21.4% 27.2% 23.5% 22.4% 20.0%Count (for above listed categories)
293 363 417 350 316 284
27 From 2016/17 the rules on resitting assessments on the BPTC were changed, which would go some way to explaining why the percentage of those failing the course goes down for 2016/17 and the percentage of those who have not yet completed the course goes up.

25
September 2021
First class Not yet complete 0.5% 2.5% 3.6% 1.5% 2.8% 4.2%Fail 0.5% 3.7% 4.8% 4.9% 2.4% 1.8%Withdrawn 0.0% 0.8% 2.8% 2.2% 0.8% 1.1%Total 0.9% 7.0% 11.2% 8.6% 6.0% 7.0%Count (for above listed categories)
2 17 28 23 15 20
Upper sec-ond class
Not yet complete 1.6% 3.6% 2.7% 3.8% 5.5% 9.6%Fail 9.0% 12.2% 15.8% 11.2% 12.1% 5.2%Withdrawn 0.6% 0.8% 1.7% 4.4% 2.2% 2.9%Total 11.2% 16.6% 20.2% 19.4% 19.8% 17.7%Count (for above listed categories)
92 138 155 154 151 142
Lower sec-ond class
Not yet complete 6.3% 9.0% 7.8% 5.8% 12.5% 21.7%Fail 31.6% 26.8% 37.4% 31.8% 26.3% 12.4%Withdrawn 0.7% 1.8% 2.6% 3.7% 2.0% 4.1%Total 38.6% 37.5% 47.8% 41.4% 40.8% 38.2%Count (for above listed categories)
160 171 202 156 124 102
85. The overall percentage of those that have failed the course, have not yet completed the course, or who have withdrawn, decreased every year from 2013/14 to 2016/17 (from 27.2% to 20.0%). This trend is seen across all degree class groupings but is particularly pronounced for those with a lower second class degree (decreasing from 47.8% to 38.2%). This could be due to fewer candidates with lesser suitability for the BPTC enrolling on the course and/or changes in the course itself (including an in-crease in the number of re-sits at a module allowed from 2016/17).
86. The percentage of those failing, yet to complete the course, or withdrawing from it does vary widely by degree classification, with less than one in ten students with a first class degree, just less than one in five students with an upper second class degree; and around two in five students with a lower second class degree falling into this category over time. The absolute numbers of those in each category since 2011 is given in Chart 7 below.

26
BCAT - Five year evaluation report
The Bar Standards Board
Chart 7. Overall BPTC outcomes for students enrolled on the course during the 2011/12-2017/18 legal years. Not including 2017 enrolled part-time students
*n = 9871
87. Overall, a substantial proportion of students have still gone on to fail, withdraw, or not complete the BPTC since its introduction. It would appear that with the BCAT filtering out just 0.7 per cent of those that take it, failure to pass the BCAT is unlikely to have been a big factor in reducing failure on the BPTC from 2013/14 to 2017/18.
88. A bigger factor overall is likely to be a change in the demographics of those enrolling onto the BPTC. The proportion of BCAT candidates and BPTC students with a lower second class degree has shown a downward trend over time, and the proportion of those with a first class degree has shown an upward trend, as shown in the charts below.
Chart 8. Degree class of the pool of BCAT candidates by legal year of first BCAT attempt. Not including where degree class information has not been provided or is pending

27
September 2021
Chart 9. Degree class of BPTC students by year of BPTC enrolment. Not includ-ing where degree class information has not been provided
89. As those with a lower second class degree appear to be more likely to fail the BPTC, and those with a first class degree appear to be less likely to fail the course, this de-mographic change is likely to have had some impact on failure rates on the BPTC.
90. This is highlighted by the chart below, which breaks down the proportion of all stu-dents with a first class, upper second class, or lower second class degree who have failed, withdrawn or have not yet completed the BPTC by year of enrolment.
Chart 10. Proportion of BPTC students with a first class, upper second class or lower second class degree who have withdrawn, failed, or who have not yet com-pletedthe BPTC by year of enrolment: Broken down by degree classification and domicile prior to BPTC enrolment

28
BCAT - Five year evaluation report
The Bar Standards Board
91. Chart 10 shows a substantial reduction in the proportion of such students with a lower second class degree for both overseas domiciled and UK domiciled students from 14 per cent of students enrolled in 2013 to around 7.5 per cent enrolled in 2016. As already noted, this is partly related to improved outcomes on the BPTC and partly related to a reduction in enrolment numbers of such students.
92. This change in demographics also has implications for the expected level of failure on the BCAT. The second BCAT pilot was tested on 1500 students on the BPTC in 2010/11, and so the sample would likely have had proportionately more students with a lower second class degree, many of whom would have fallen beneath the cut score: The same can be said for the subset of students enrolled on the BPTC when the BCAT cut score review was undertaken. Some of the apparent lack of impact of the new cut score may be due to this demographic change in the pool of BCAT candi-dates over time.
93. It is also possible that BCAT results have acted as a deterrent to enrolment upon the BPTC, alongside other factors such as more stringent entry standards by BPTC providers.
94. It would be difficult to determine the extent to which variables that appear to show a relationship with BPTC enrolment are actually the cause of candidates enrolling or not enrolling on the course.28, However, a regression model presented later in the report may help us better understand the relationship the likelihood of enrolling on the BPTC has with some of the variables available.
BCAT score and BPTC overall outcome
95. When displaying the relationship between BCAT scores and BPTC outcomes, the simplest approach is to group all students together across years. However, as shown in the section on the distribution of BCAT scores, the distribution of BCAT scores has shifted over time, meaning that for us to be more certain that the relationship present-ed in this section is a truer reflection of the one in existence, then BCAT scores need to be standardised to account for the change over time in some way. This can be done by putting the BCAT score into groups based on their relative rank within each legal year, and enables easier plotting of the data.
96. The below chart shows the proportion of BPTC outcomes by the BCAT score achieved, with those in the first group scoring highest on the BCAT within the legal year in which the test was taken, and those in the fifteenth group scoring the lowest. It suggests there is a relatively strong relationship between BCAT score and BPTC outcome.
28 Particularly as we lack data on many variables that may have some link with the likelihood of enroll-ing onto the BPTC. Many such variables would also be difficult to quantify (eg a candidates financial situa-tion, or level of motivation to have a career at the Bar).

29
September 2021
Chart 11. BPTC outcomes by BCAT score groupings per legal year in which BCAT was passed
97. Chart 12 below shows the relationship between BCAT score and the percentage of BPTC students failing the course, or having not yet completed it (as of January 2019) when scores are grouped within each legal year, and then per each degree class.
98. As in Chart 11, Chart 12 shows that as BCAT score decreases (goes from Group 1 to Group 15), the proportion of those failing or having not yet completed the BPTC in-creases. The groupings of most concern in terms of the likelihood of failing or not yet completing the BCAT are those scoring lowest on the BCAT within each degree class grouping, with those with a lower second class degree of particular note.
99. Chart 12 suggests that those with a lower second class degree who get a relatively low score on the BCAT compared to others with the same degree class are far more likely to fail the BPTC or not yet have completed the BPTC, and of those that pass the course, they are far more likely to have gained a Competent overall grade, com-pared to a Very Competent or Outstanding overall grade.29 Similar trends are seen for those with an upper second class or first class degree, but such trends are not as pronounced in comparison to those with a lower second class degree.
29 Both degree class and BPTC grade have shown to be strongly related to the likelihood of gaining pupillage. For information see Part 4 of the BPTC Key Statistics Report (BSB 2020) and Exploring differential attainment at BPTC and Pupillage (BSB 2017), accessed online here.

30
BCAT - Five year evaluation report
The Bar Standards Board
Chart 12. Proportion of those achieving each outcome on the BPTC by BCAT score grouping30
100. The above chart suggests that the BCAT does appear to have some suitability as a tool for identifying those most at risk of not passing or completing vocational training for the Bar, particularly when combined with degree classification.
101. Groups at particular risk would appear to be those with a lower second class degree scoring lower on the BCAT within each legal year, and those with an upper second class degree who are in the bottom third of their BCAT score groupings (groups 11-15).
30 Scores are grouped by legal year, and degree class into 15 groupings, with 1 containing the highest scoring students on the BCAT by legal year per degree class, and 15 including the lowest scoring students on the BCAT by legal year per degree class. For those with a first class and lower second class degree, there are only 14 groupings, owing to the way the data is cut using the qcut() function in the Pandas package in Python.

31
September 2021
Relationship between the BCAT and BPTC: Summary
• The data suggest that BCAT score appears to show a relatively strong positive rela-tionship with overall BPTC outcomes independent of degree class. As BCAT score increases, the proportion of those passing the BPTC increases, and so does the pro-portion of those gaining ‘Outstanding’ and ‘Very Competent’ overall BPTC grades.
• Degree classification appears to have a relatively strong relationship with BPTC scores independent of BCAT score.
• If those taking the BCAT are being provided with their BCAT score as an indicator of likely success in vocational training for the Bar, then the influence of degree classifi-cation is an important point to remember.
• The BCAT does appear to have some suitability as a tool for identifying those most at risk of not passing or completing vocational training for the Bar. Groups at partic-ular risk would appear to be those with a lower second class degree in the bottom two thirds of their distribution for BCAT score, and those with an upper second class degree who are in the bottom third of their BCAT score distribution.

32
BCAT - Five year evaluation report
The Bar Standards Board
Regression Analysis Regression Analysis 102. Model summaries for the regression models detailed in this section can be found in
the appendices.
A. Linear and Quantile Regression – BCAT score
Approach
103. For the overall model, it was thought that a multiple linear regression model would be suited for providing a better idea of the effect of the variables in the model on BCAT score. Regression models produce coefficients from the data input into the model that are estimates of the actual effect of individual variables on the outcome variable when controlling for the other variables in the model. The type of regression model used was an Ordinary Least Squares (OLS) one.31
104. In addition, a series of quantile regressions were undertaken in order to display po-tentially differing relationships between the independent variables and BCAT score for different quantiles (percentiles) of the population of those taking the BCAT. The re-sults from these can highlight whether some variables may have a more pronounced relationship with BCAT score at differing quantiles for the population of BCAT takers.
105. The regression model included variables thought to be of most relevance to predict-ing BCAT score based on the model used in the previous review of the BCAT32, and the variables available. Also taken into consideration for inclusion was how much data were missing for each variable, in order to ensure that inclusion of a variable did not lead to a deletion of thousands of cases if they were included in the model.33
106. Variables likely to covary alongside other independent variables in the model (such as religion alongside ethnicity) were not included, when it was thought that including only one of the variables would be more useful for model interpretation and better ensure the completeness of the data used in the model across cases.
107. Gender was not included in the model as an independent variable, as it was found to be disproportionately missing from the BCAT data for the legal years from 2012/13 to 2014/15, and so its inclusion would lead to bias in the model. It was included in a separate model run for BCATs taken during the 2015/16-2018/19 legal years and was found to be a significant variable with a small effect size. Males were found to score around 0.3 points higher on the BCAT than females when controlling for the other variables in the model, a minimal difference.
31 The coefficients in OLS represent the mean effect of a given independent variable. The significance of an effect in the models presented in this report signify the probability that the variable has no effect on the outcome variable given the data.32 Variables used in the previous model were: Degree Class, Degree Institution, English as a first lan-guage, Ethnicity, Gender, Law Degree or GDL, Nationality, Parental Degree, and Religion of Belief. See page 29 in Bar Standards Board (2015). Education & Training Committee Paper 8 Appendix 1. BCAT Impact and Performance Evaluation. Accessed online here33 Cases with missing data in any of the fields would have automatically been deleted in the calcula-tion of the model by the stats package

33
September 2021
Data used Table 3. Variables used in the regression model on BCAT scoreVariable Additional detailsBCAT score The response variable. An integer value measured on a scale from 20-80.Ethnicity Amalgamated from BCAT application form and data on BPTC students.English as a first language
Data on whether English was a candidate’s first language. Gathered from the BCAT application form (Question in BCAT application form: Is English your first language?)
First degree classifi-cation
Amalgamated from BCAT application form and data on BPTC students.Only those with first class, upper second class, or lower second class de-grees were included in the regression model.
Legal year of BCAT examination
The legal year runs from October-September.
Student domicile status
Question in BCAT application form: Are you a UK, EU or International stu-dent?
University attended Data amalgamated from BCAT application form and data on BPTC studentsUniversities were grouped using the following methodology
• Oxbridge
• Russell Group
• Other UK university
• Candidates that were classified as studying for another degree over-seas, and candidates that took international programmes as their legal qualification in other groupings.
108. Data were only included for the final (most recent) attempt at the BCAT for each can-didate. There were 9,327 candidates included in the model.
Model results
109. There were significant predictive relationships between BCAT score and the indepen-dent variables included in the model. The coefficients indicating the magnitude of the of the predictive relationship between each variable and BCAT score differed quite widely, however. All variables included in the model had at least one grouping within them found to be significant at the p <0.05 level.
110. The proportion of variation in BCAT score explained by model (adjusted R-squared value) was 0.36.34 There were records for 9,327 people who had attempted the BCAT included in the regression model.
111. In alphabetical order, a summary of the modelled relationships between independent variables in the model and BCAT score when controlling for the other variables in the model is given as follow:
• English as a first language: English as a first language is a significant predictor with a small effect size: Those for whom English is not their first language were predicted to score around 0.4 points lower on the BCAT than those with another language as their first.
34 The adjusted R-squared value is a value between (0-1) which is inferred to be the amount of varia-tion in BCAT score that the variance in the variables of the regression model is responsible for when adjust-ing for the number of independent variables in the model.

34
BCAT - Five year evaluation report
The Bar Standards Board
• Ethnicity: Compared to those from White ethnic groups the regression model predicts:
o Asian/Asian British candidates to score around 2.7 points lower on the BCAT;
o Black/Black British candidates to score around 3.1 points lower on the BCAT;
o Mixed/Multiple ethnic group candidates to score around 1.2 points lower on the BCAT; and
o Candidates from Other ethnic groups to score around 2.1 points lower on the BCAT.
• First degree classification: Compared to those with a lower second class de-gree, the regression model predicts:
o candidates with an upper second class degree to score around 1.5 points higher on the BCAT; and
o candidates with a first class degree to score around 2.7 points higher on the BCAT.
• Legal year of BCAT exam: Compared to those that took the BCAT in the 2012/13 legal year:
o the 2013/14 and 2014/15 legal years are not statistically significant predictors of BCAT score;
o the legal years of 2015/16, 2016/17, 2017/18 and 2018/19 are all statistically significant predictors of BCAT score.
o the coefficient for legal year increases from around 0.5 in 2015/16 to 1.9 in 2016/2017, and then to 2.1 in 2017/18 and 2.5 in 2018/19. This means that when controlling for other factors, a candidate taking the BCAT in 2018/19 would be predicted to score around 2.5 points higher on the BCAT than a candidate taking the BCAT in 2012/13.
• Student domicile: Compared to UK domiciled students, students domiciled outside the UK and EU area prior to the BCAT were predicted to score around 0.6 points lower on the test. There was no statistically significant difference between UK and EU students in BCAT score.
• University attended: Compared to students who did not attend a UK Russell Group university, the regression model predicts:
o those that attended an Oxbridge university to score around 5.7 points higher on the BCAT;
o those that attended a Russell Group university (not including Oxbridge) to score around 2.8 points higher on the BCAT;
o those that qualified for the BPTC via an international law conversion pro-gramme to score around 1.3 points higher on the BCAT; and
o those that attended other overseas universities to score around 2.6 points

35
September 2021
higher on the BCAT.
Variables with strongest predictive value
112. To get a better idea of the relative importance of the variables in the model, variables were dropped from the model one by one on a sequential basis, and measures of model fit for each nested model were calculated.
113. Of the variables in the model, the variable that caused the adjusted R-squared value to decline the most when removed from the model was ‘University attended’. The second ranked variable on this measure was the legal year of the BCAT exam.
114. Overall, the effect of exam legal year on BCAT score is not one which is desired, as it further supports the descriptive analysis earlier in the report in suggesting that out-comes for those taking the BCAT are not stable across time even when controlling for several factors significantly related to BCAT score outcome. It also would mean that using BCAT scores as an indicator for competence may not be a stable indicator over time unless they were somehow standardised with in line with the results of those who took the BCAT during the same legal year, or other comparative period, or as a better alternative, recalibrated annually in order to ensure that average scores across years are more consistent and that the upward drift in scores over time observed in this analysis is avoided.
115. In addition, the relatively large predictive relationship between ethnicity and BCAT scores is also not one which is desired. It is a relationship that has been present since the pilot of the BCAT, and a factor that has been taken into account in setting of the pass mark, in order to avoid disproportionately impacting candidates from minori-ty ethnic backgrounds in terms of selection ratios.35
Quantile regression:
116. Results of the quantile regression showed that from 2015/16 onwards, the effect of legal year is greater for those in lower quantiles. The trend begins in 2015/16, and becomes far more pronounced from 2016/17. The quantile regression results sug-gest that the disproportionate increase in BCAT scores for those scoring lower on the test compared to those attaining higher scores seen over time, is still present when controlling for the other variables in the model.
BCAT score model summary
117. Results of the modelling undertaken on BCAT score suggest that, when controlling for the variables in the model:
• Legal year of BCAT exam has a significant predictive relationship with BCAT score, and the effect size increased every year from 2015/16 to 2018/19. The pre-dictive effect of legal year on BCAT score is greater for those scoring lower on the BCAT from 2015/16 onwards.
• University attended appears to have the strongest predictive relationship with BCAT score, with first degree classification and ethnicity also important variables in the model.
35 See section on Adverse impact analysis in: Bar Standards Board (2015). Education & Training Com-mittee Paper 8 Appendix 1. BCAT Impact and Performance Evaluation.
36
BCAT - Five year evaluation report
The Bar Standards Board
B. Linear Regression – Relationship between BCAT and BPTC overall score
Approach
118. The model developed was intended to give an idea of the relationship between BCAT score and BPTC score averaged across the raw scores for modules for those that had attempted all 10 non-options modules on the BPTC.36 For this purpose an OLS multiple linear regression was undertaken.
119. Given the relationship between BCAT score and the legal year in which the BCAT was taken it was decided that BCAT score and legal year should be included in any model developed as an interaction term. This means that in the model the relation-ship between BCAT score and BPTC score is calculated separately for each year’s BCAT cohort. This enables the model to determine if the relationship between BCAT score and BPTC outcome varies depending on the year the BCAT was sat.
120. Another important consideration in the model is average BPTC scores varying over time. This is not ideally what would be seen, but the data showed that there was some variation in BPTC score by the year in which students enrolled on the course, ranging from an average of 71.5 for 2017/18 students to 74.0 for 2015/16 students in the dataset used for the regression model (2017/18 students likely score lower on average as many students would not yet have had their final attempt at passing a module).
121. In addition, the demographics of BPTC students may change depending on what re-cords are eliminated from the model due to not having yet sat all modules, which may affect average scores on the BPTC when controlling for other factors.
Data used
122. The model used the same variables as that used for the BCAT model except for the addition of BPTC score as the response variable, the inclusion of BPTC enrolment year as an independent variable and changing BCAT score to an independent vari-able.
123. BCAT score was also transformed by subtracting 20 points from it for all candidates: As the minimum score possible to get on the BCAT is 20, subtracting 20 points from it would make the scale start at 0, with the aim of making the model easier to interpret.
36 The BPTC consisted of 12 mandatory modules, 10 of which are the same for all students, and two of which are options modules that can vary between students.

37
September 2021
Table 4. Variables used in the regression model on overall BPTC scoreVariable Additional detailsBPTC average score
The response variable. A weighted average calculated from the 10 core modules on the BPTC course. Calculated on a scale of 0-100, and weighted using the methodology outlined for calculating BPTC score in the September 2019 BPTC handbook.37 The weighting was scaled up owing to the options modules not being included in the analysis.Only those current and former BPTC students that had sat and received a score in all 10 modules were included in the analysis.
BCAT score and Legal Year
An interaction term between legal year of final BCAT sit, and score for final BCAT sit.BCAT score was transformed by subtracting 20 from the recorded score, as the minimum score on the BCAT is 20 points. This means that the intercept for the model shows the status for a candidate that scored the absolute minimum of 20 points on the BCAT when controlling for the other variables in the model.
Gender The data on gender for those taking the BPTC was not missing at random, and so it could be included in a model using data on those that studied the BPTC.
Other variables Ethnicity; English as a first language; First degree classification; Student domi-cile status; and University attended. See Table 3 for more details.
124. There were 5,612 BPTC students included in the model.
Model results
125. All of the variables included in the model except for “English as a first language” were found to have a statistically significant relationship38 with BPTC score for at least one of the categories within them. Effect sizes differed widely by variable and were largest for ‘First degree classification’, ‘University attended’ and ‘BCAT score’.
126. The proportion of variation in BPTC score explained by the model (adjusted R-squared value) was 0.52. There were records for 5,612 BPTC students included in the regression model.
127. A brief summary of the model is given below:
• Degree classification: Compared to those with a lower second class degree, the model predicted:
o those with a first class degree to score around 6.7 points higher on the BPTC;
o those with an upper second class degree to score around 3.6 points higher on the BPTC.
• Ethnicity: Compared to those from White ethnic groups, the model predicted:
o Asian/Asian British students to score around 2.6 points lower on the BPTC;
o Black/Black British students to score around 3.9 points lower on the BPTC;
o Mixed/Multiple ethnic group students to score around 1.9 points lower on the
37 Can be accessed online at: https://www.barstandardsboard.org.uk/resources/resource-library/bptc-handbook-september-2019-pdf.html38 Where the p-value was less than 0.05

38
BCAT - Five year evaluation report
The Bar Standards Board
BPTC;o those from other ethnic groups to score around 2.5 points lower on the
BPTC.
• Gender: Compared to female students the model predicted male students to score around 0.3 points lower on the BPTC.
• Student domicile: Compared to students domiciled in the UK prior to the BPTC, the model predicted:
o EU students to score around 1.3 points lower on the BPTC;
o International students to score around 0.4 points higher on the BPTC.
• University attended: Compared to students who did not attend a UK Russell Group university, the model predicted:
o those who attended Oxbridge to score around 5.8 points higher on the BPTC.
o those who attended a Russell Group university (not including Oxbridge) to score around 3.3 points higher on the BPTC.
o those who attended an Overseas university to score around 1.8 points higher on the BPTC.
o those who undertook an international law conversion programme to qualify for the BPTC to score around 3.0 points higher on the BPTC.
• Year Student Commenced BPTC study: The model predicted those who had enrolled on the BCAT in 2016 and 2017 to score lower on the BPTC than those who enrolled in 2013, 2014 and 2015. This is possibly related to students having less time to complete the course at the time of analysis, and thus having more failed attempts contributing to lowering their average overall score.
Variables with strongest predictive value
128. To get a better idea of the relative importance of the variables in the model, indepen-dent variables were dropped from the model one at a time, and measures of model fit for each nested model were calculated.
129. Of the variables in the model, the variable that caused the adjusted R-squared value to decline the most when removed from the model was ‘First degree classification’, followed by ‘University attended’, and then the interaction term of legal year and BCAT score.
130. All other variables except for ethnicity did not cause the adjusted R-squared value to drop by more than 0.002 points when they were removed from the model, and so have a much weaker relationship with BPTC overall score.
Predictive relationship between BCAT score and BPTC score
131. The interaction term between BCAT score and legal year of BCAT sit was a signifi-cant predictor for BPTC average score, with the coefficients varying very slightly by

39
September 2021
legal year.39 The average coefficient of BCAT score and legal year of BCAT across years was 0.34
132. What this suggests is that for every one point increase in BCAT score, BPTC average score would be estimated to increase by around 0.34 points.
133. From the coefficients for BCAT score and legal year, we can calculate the modelled average effect of BCAT on BPTC for someone scoring relatively low on the BCAT in comparison to someone scoring relatively high. For example, if a candidate took the BCAT in 2016/17 and got a score of 55, then if all of their other characteristics were the same as the reference level variables, they would be predicted to get a score on he BPTC around 3.4 points (3.1 – 3.8 points with a 95% confidence interval)40 higher than someone who achieved the cut score of 45 on the BCAT.41
134. The model therefore shows that BCAT score is potentially related to a large variation in predicted BPTC average score, although it should be noted that most candidates score somewhere within a narrower range of BCAT scores and so the effect size of BCAT score between candidates would typically be smaller.
135. In addition, the model shows that the relationship between BCAT score and BPTC score has stayed relatively stable over time, which is something we would hope to be the case, meaning that BCAT score for the average candidate for each legal year could be said to have a relatively reliable relationship with BPTC average score.
136. However, it also appears to have less predictive value when it comes to BPTC aver-age score than first degree classification or university attended, but it is still a useful indicator of student aptitude for those entering onto the BPTC. In the original evalu-ation of the BCAT, the score achieved on the test was a stronger predictor than first degree classification or first degree institution.42
C. Linear Regression – Relationship between BCAT score and BPTC module scores
Approach
137. Ten OLS multiple linear regression models with the outcome variable being raw BPTC module score on each module were developed, using the same independent variables and same set of cases as the regression model on overall BPTC score. The modules were 10 of the 12 BPTC modules (all modules except for the options mod-ules).
Data used
138. The same cases were used as those used in the model for average BPTC score for the individual regression models for all modules.
39 The standard deviation of the coefficients for BCAT score across legal years was 0.016.40 A confidence interval is a range within which our population parameter (eg mean BCAT score value) is predicted to be found, given a certain level of confidence (level of probability).41 Calculated by subtracting 45 from 52 = 10, and then multiplying 10 by the coefficient for the BCAT score for the 2016/17 legal year, which was 0.34.42 Bar Standards Board (2015). Education & Training Committee Paper 8 Appendix 1. BCAT Im-pact and Performance Evaluation, paragraph 6.4.4: “An inspection of individual predictors revealed that all variables were significant predictors of BPTC overall score with BCAT score providing the biggest unique contribution and Law degree or GDL providing the lowest unique contribution”

40
BCAT - Five year evaluation report
The Bar Standards Board
Model results
139. There were records for 5,612 BPTC students included in the regression models. The influence of other independent variables in the models varied markedly by module. For the sake of brevity, and as the influence of the BCAT is of most interest, this sec-tion will focus on the relationship between BCAT score and module score only.
140. When controlling for the other variables in the model, the modules for which the coef-ficients for BCAT score showed the strongest predictive relationship with BPTC score were “Resolution of Disputes out of Court” (ReDoC), “Criminal Litigation”, “Civil Litiga-tion” and “Professional Ethics”.
141. The predictive relationship for BCAT score would appear to be greater for modules with either a multiple choice format for the exam (Civil Litigation and Criminal Liti-gation) or a short answer question format (Professional Ethics), or a mixture of both depending upon the provider of the course in the case of ReDoC. The predictive rela-tionships between BCAT score and BPTC score by module also appear to be weaker for the advocacy modules and for “Conference Skills”, all modules with a larger focus on oral skills.
142. The modules of Opinion Writing and Drafting lay somewhere in between regarding the strength of the predictive relationship between BCAT and module score. The as-sessment format for these modules is a written assessment which does not involve a multiple choice or short answer question format.
143. Overall, the predictive relationship between BCAT score and score by BPTC module varies widely. Compared to someone achieving the cut score of 45 for the BCAT for 2016/17, the model would predict that someone achieving a BCAT score of 55 would score around 5 points higher for ReDoC and Civil litigation, just over 4 points higher for Criminal Litigation, and 4 points higher for Professional Ethics. This compares to a predicted difference of two points for ‘Advocacy 2’43, the module with the lowest coefficient for BCAT score for those taking the BCAT in 2016/17.
144. These results may suggest that the skills the BCAT measures are more strongly related to the assessment formats of some modules on the BPTC in comparison to others, with a particularly strong relationship between BCAT score and modules as-sessed via a multiple choice or short answer question format.
D. Logistic Regression - The relationship between BCAT score and likelihood of enrolling on the BPTC
Approach
145. Logistic regression is a commonly used technique when the outcome variable can be modelled as a binary one (eg a ‘Yes’ or ‘No’ outcome), and there are potentially mul-tiple explanatory variables. The binary outcome in the model was whether someone that passed the BCAT did or did not enrol on the BPTC.
146. The model can be used to show the relationships between the independent variables in the model and enrolment onto the BPTC, but this does not mean the relationships presented are causal ones. Missing from the model are variables on the decisions
43 There were three components to the assessment of advocacy skills on the BPTC; these were re-ferred to as Advocacy 1, Advocacy 2 and Advocacy 3.

41
September 2021
made at the application stage for providers of the BPTC, and a multitude of other factors that may be of relevance.
147. Gender was not included in the model as an independent variable as it was found to be disproportionately missing from the BCAT data for the legal years from 2012/13 to 2014/15, and so its inclusion would lead to bias in the model. It was included in a separate model run for BCATs taken during the 2015/16-2018/19 legal years and was found to be a non-significant variable with a small effect size.
Data usedTable 5. Data used in the regression model on the likelihood of enrolling on the BPTCVariable Additional detailsEnrolment onto the BPTC
The response variable: A binary variable indicating whether a student did or did not enrol onto the BPTC after passing the BCAT.
Age range when taking the BCAT
It was thought that age may be a factor in the decision on whether or not to enrol on the BPTC.
Attended state or fee-paying school
Data collected when candidates register to take the BCAT. It was thought that it may be useful as a proxy for socio-economic background.
Whether candidate has failed the BCAT at least once
A binary variable indicating whether a candidate that eventually passed the BCAT had failed it on a previous attempt or not.
Other variables BCAT score and Legal year interaction term; Ethnicity; First degree classifi-cation; Student domicile status; and University attended. See Tables 3 and 4 for further details.
Model results
148. There were records for 8,990 people who had attempted the BCAT included in the regression model. Variables in the model that were found to be statistically significant when controlling for other factors were:
• Variables associated with lesser likelihood of enrolling on the BPTC:
• Age: o Compared to those aged under 25: 25-34 year olds were around two times
(100%) less likely to enrol on the BPTC; 35-44 year olds were around 2.3 times (130%) less likely to enrol on the BPTC; and those aged 45+ were around 2.6 times (160%) less likely to enrol on the BPTC after passing the BCAT.
• First degree classification: o Compared to those with a lower second class degree: those with an upper
second class degree were around 1.8 times (80%), and those with a first class degree were predicted to be around 2.1 times (110%), more likely to enrol onto the BPTC after passing the BCAT. Those with a third class degree were around 32 times less likely to enrol after passing the BCAT.
• Variables associated with greater likelihood of enrolling on the BPTC:
• University attended:

42
BCAT - Five year evaluation report
The Bar Standards Board
o Compared to students that attended a non-Russell Group UK university: those that attended an Oxbridge university were 1.6 times (60%), and those that attended a non-Oxbridge Russell Group university were predicted to be 1.4 times (40%), more likely to enrol on the BPTC after passing the BCAT. Those that qualified for the BPTC via international law conversion pro-grammes were around 1.2 times (20%) less likely to enrol onto the course after passing the BCAT.
o All students that attended overseas universities (and not international law conversion programmes) enrolled onto the BPTC after passing the BCAT.
• BCAT score:
o The interaction term between BCAT score and legal year was found to be statistically significant for those taking the BCAT from legal years 2012/13 to 2016/17.44 The coefficients remained relatively stable over time for these years, ranging from 1.027 for 2016/17 to 1.041 for 2015/16.
o What this means for 2016/17 for example, is that for every 1 point increase in BCAT score, the likelihood of having enrolled onto the BPTC increases by 2.7%. For someone with a score on the BCAT of 55 compared to someone with a score of 45, the coefficient would suggest that the person with the higher BCAT score is 1.3 times (30%) more likely to enrol onto the BPTC.45
o Overall, there does appear to be some link between BCAT score and the likelihood of enrolling onto the BPTC.
149. Variables that were almost statistically significant:
• Having a previous BCAT fail:
o Those that had failed the BCAT at least once prior to passing it were around 1.5 times (50%) less likely to subsequently enrol upon the BPTC.
• Internationally domiciled students:
o International students (Students domiciled outside of the UK or EU when taking the BCAT) were around 1.2 times (20%) less likely than UK domiciled students to enrol onto the BPTC after passing the BCAT.
44 It is possible that the data for more recent years was biased by the BCAT being taken more recently, and there being fewer candidates who have passed it to be in a position to enrol onto the BPTC.45 Calculation is 55 - 45 = 10, and then raise the coefficient to the power of 10, 1.02710 = 1.305.

43
September 2021
Conclusions and DiscussionConclusions and Discussion150. The three main research questions were:
• How is the BCAT performing at filtering out students likely to fail the BPTC?
• Is BCAT score a reliable predictor of attainment on the BPTC?
• Does the information provided by score on the BCAT stay consistent over time?
151. This section will attempt to summarise and discuss the main points from the research undertaken regarding these questions.
How is the BCAT performing at filtering out students likely to fail the BPTC?
152. The available evidence would suggest that so far the BCAT has not effectively direct-ly filtered out candidates from being able to enrol onto the BPTC, with only around 1 in 150 candidates who have taken it failing to pass the test and having not yet re-sat it as of September 2019.
153. The BCAT may act as a deterrent to taking the BPTC for those who fail in an attempt at it, or score relatively close to the cut score on it, but determining a causal link between the two is not possible given the data available. However, looking at the worst performers on the BCAT (those who fail the test), the propensity to enrol on the BPTC is not markedly different for those who pass the BCAT at the first, second and third attempts. This suggests that poor performance on the BCAT is not acting as a significant deterrent to enrolling on the course for those who fail the test on their first or second attempt.
154. The BCAT appears not to have been performing as intended since the test was intro-duced. In the pilot sample prior to the introduction of the BCAT, a cut score of 37 was 2.06 standard deviations46 below the mean score of 50.9. For the 2013 sample ana-lysed in the initial review of the BCAT, a cut score of 37 fell 2.61 standard deviations below the mean of 52.3, meaning that upon implementation it was already a far less likely occurrence that someone taking the BCAT in 2013 would score below the cut score in comparison to those in the pilot study.47 This suggests that the assumptions around what represented a poor score made during the piloting of the test were not borne out during its actual operation.
155. A failure rate of 10 per cent was predicted upon the introduction of the BCAT based upon results of the pilot studies.48 The only legal year for which the percentage of attempts at the BCAT ending in failure has been above 5 per cent was 2015/16.
156. It is possible that the aptitude of students taking the pilot studies was lower than that of the pool of actual BCAT takers (the pilot studies consisted of around 200 BVC
46 A standard deviation is a measure of the spread of observations (in this case BCAT scores) around the mean score observed. If a score is located further from the mean relative to other scores, then the number of standard deviations between the mean and the relevant score will be greater (as such standard deviations can be used a rough measure of the rarity of a score). 47 See paragraph 6.6.3 in Bar Standards Board (2015). Education & Training Committee Paper 8 Ap-pendix 1. BCAT Impact and Performance Evaluation. Accessed online here48 See table on page 9 in Bar Standards Board (2015). Education & Training Committee Paper 8 Ap-pendix 1. BCAT Impact and Performance Evaluation. Accessed online here

44
BCAT - Five year evaluation report
The Bar Standards Board
students for the first pilot, and around 1500 BPTC students for the second pilot), and indeed this may be the case, at least in terms of the trends seen in degree classifica-tions of those on the BPTC compared to the pool of those taking the BCAT in more recent years: This is likely to explain some of the reduction in the percentage of at-tempts at the BCAT ending in failure from 2013/14 to 2015/16, and then from 2016/17 to 2018/19 after the cut score was raised.
157. However, this would not explain all of the discrepancy seen between the results of the pilot studies and the results seen once the BCAT was implemented, particularly in the early years of its implementation, and when controlling for degree class. It also does not explain the upward trend over time for the coefficients of legal year in the regression models on BCAT overall score.
158. Overall, this suggests that some of the reduction in failure rates on the BCAT com-pared to the pilot studies could be explained by a reduction in those of lower aptitude taking the BCAT in more recent years, and some of the reduction in failure rates may be related to the operation of the test itself.
159. While the percentage of attempts at the BCAT that ended in failure was tested in the pilot studies, it does not appear to be the case that the reliability with regards to the consistency of results of those retaking the BCAT was tested, and this appears to have been an oversight. Candidates re-taking the BCAT typically score around 7 points higher on the test at the second attempt, and given that BCAT scores are typically grouped within a relatively narrow range, this represents a relatively big jump in scores from one sitting to the next. The relatively low consistency in test scores for those retaking the BCAT contributes to the low percentage of people that do not eventually pass the BCAT.
160. However, results of the regression model on the likelihood of enrolment onto the BPTC following on from the BCAT suggest that there is a statistically significant relationship between the BCAT score and the likelihood of enrolling, and an almost statistically significant link between having failed at least one attempt at the BCAT before passing it and then subsequently enrolling onto the BPTC. It cannot be said that these are causal links as there are many factors involved regarding enrolment on the BPTC that we currently lack data on.
161. It would be of interest to find out more regarding the factors that have influenced students with lower second class degrees and those scoring lower on the BCAT to enrol onto the BPTC in lower numbers over time in order to determine how much of a factor the introduction of the BCAT has been in this process.
Does the information provided by score on the BCAT stay consistent over time?
162. The answer to this question varies depending upon where in the distribution of BCAT scores a candidate falls. Overall the distributions of BCAT scores have changed over time, with an increase in the average scores for those taking the BCAT, and a particu-larly pronounced change for lower scoring candidates.
163. Overall, when controlling for other factors, it appears that the information provided by BCAT score has changed over time, as average scores have increased, and the increase has been particularly pronounced from the 2016/17 legal year onwards. The predictive effect of legal year is particularly large from 2016/17 for those in lower

45
September 2021
quantiles in the BCAT score range.
164. In addition, the consistency in BCAT scores for those taking second sits at the test appears to be relatively low, with a first sit-second sit score coefficient of just 0.27. So, the score individual candidates get does not appear to be a consistent measure of candidate aptitude when candidates take the test again.
165. This has implications for providing lower scoring candidates with their BCAT score as an indicator to how well they will perform in vocational study for the Bar, particularly if the same trend continues in future. In addition, providing such information without taking into consideration other factors of greater predictive value regarding potential success in vocational training to become a barrister may be of more limited value.
Is BCAT score a reliable predictor of attainment on the BPTC?
166. Overall, the regression model developed with overall BPTC score as the outcome variable suggests that BCAT score is a relatively stable predictor of overall BPTC score over time.
167. However, the strength of the predictive relationship given by the regression models suggests that BCAT is not as strong as predictor for BPTC overall score as first de-gree classification or university attended. It was found to be the independent variable with the third strongest predictive value for BPTC overall score, which is something to bear in mind when using BCAT score as a potential indicator of future success in training for the Bar.
168. Further regression models developed suggest that BCAT score shows a stronger predictive relationship with raw scores on some modules in comparison to others. Knowledge based modules with a multiple choice or short answer format showed a particularly strong relationship with BCAT score. Modules where the assessment was largely based around oral skills showed a weaker relationship with BCAT score when controlling for other variables in the model.
SummaryThe BCAT appears to be an ineffective filter to enrolment on vocational train-ing for the Bar
• A very low proportion of those that take the BCAT do not eventually end up passing the test. Only 89 out of the 12663 people who have attempted the BCAT as of Sep-tember 2019 had not yet ended up passing the test (0.7 per cent of those that have attempted it since 2013).
• The low proportion of attempts at the BCAT that result in failure represents a consid-erable mismatch with those predicted when the test was introduced, and also when the pass mark was raised to 45. This raises questions as to whether BCAT is propor-tionate/worthwhile.
The Failure Rate on the BCAT has varied significantly over time
• Failure rates on the BCAT were between 1-3 per cent for the first four years of its implementation. The rate of failure increased for 2016/17 when the higher pass mark was introduced, to around 8 per cent, but had dropped back down to 3 per cent during 2018/19. With a cut score of 45, the rate of failure for the BCAT would have

46
BCAT - Five year evaluation report
The Bar Standards Board
been around 15 per cent for the first three years following its introduction.
The distribution of BCAT scores has changed quite markedly over time
• The changing failure rates of the BCAT look predominantly to be due to improved performance from students with lower prior attainment. This is true when controlling for other factors, as is shown by the results of regression models analysing BCAT score.
Differences in score for BCAT retakes
• The reliability of the BCAT appears to be quite low, with large jumps in BCAT score between first sit and second sit score for those that fail their first attempt at the BCAT. This is not what we would ideally expect for an aptitude test.
The pool of BCAT takers and BPTC students has changed over time
• The initial calibration of the BCAT undertaken for the pilot studies and following on from the changing of the cut score was undertaken on quite a different population to the one seen taking the BCAT and enrolling on the BPTC in more recent years. There were greater numbers of students with lower second class degrees, and fewer with first class degrees.
• As the BCAT was largely designed to filter out candidates more likely to fail voca-tional training for the Bar, and was calibrated at a time when there were more such candidates on the course, the question of whether the BCAT is as necessary as it was regarding filtering out candidates upon its introduction is raised.
• It will be important to see whether the trend of fewer candidates with lower second class degrees enrolling upon vocational training for the Bar continues following on from the Future Bar Training reforms implemented from 2020/21.
The BCAT as a predictor of BPTC performance
• BCAT score remains a stable predictor of BPTC performance (although it has less predictive value than degree class/institution, in contrast to the original evaluation which found BCAT to be a stronger predictor than both).
The BCAT as a tool in predicting modular outcomes
• The BCAT also may have particular value in predicting outcomes on modules involv-ing assessment via Multiple Choice Questions (MCQs) and Short Answer Questions (SAQs).
169. Overall, it seems clear that the BCAT has not had the intended effect in filtering out candidates from enrolling on the BPTC since it was first introduced in 2013. While the change in the cut score/pass mark in 16/17 initially lead to an increase in the failure rate of the test, the failure rate then dropped again to similar levels as those seen under the initial pass mark of 37.
170. In addition, the majority of those that fail the test retake and then pass, so the BCAT itself is only excluding a very small number of students from the BPTC. Although overall attainment on the course has risen since the BCAT was introduced, this seems unlikely to have been due to a direct impact of the BCAT excluding students with less chance of passing the course, as was the objective of its original introduc-

47
September 2021
tion and the increase of the pass mark in 2016/17.
171. As a result, this evaluation suggests that the future of the BCAT be reviewed, in order to determine if it is still a proportionate policy response to require students to pass the test before enrolment on the BPTC.

48
BCAT - Five year evaluation report
The Bar Standards Board
Contacting usWe are committed to providing a high standard of service and dealing with everyone in a way that is fair, transparent, and proportionate. We welcome your feedback on our services, particularly where the level of service has exceeded or fallen below your expectations. Your comments and suggestions are important to us as they will help us to meet our obligations to you and to improve our perfor-mance.
Write to usBar Standards Board
289-293 High Holborn
London WC1V 7HZ
Tel: 020 7611 1444
www.barstandardsboard.org.uk
Twitter: @barstandards
www.linkedin.com/company/the-bar-standards-board
In addition, If you would like this report in an alternative format, please contact the BSB
Research Team on 020 7611 1467 or email [email protected]