bar code technologyt ~~~a(111111111111111111111111111111 *82c3* the 3 of 9 bar code is of...
TRANSCRIPT
r.ENERAl ACCOUNTI G OffiCE II SRAItt ~, ".1
AUG 1...9 lOll?
BAR CODE TECHNOLOGyt ~~~A"(
111111111111 . '"
141020 010201
A MEANS TO IM.PROVE OPERATIONAL EFFICIENCY AND
INTERNAL CONTROL
May 1982
GAO JOINT FINANCIAL MANAGEMENT IMPROVEMENT PROGRAM TA 1650 . B37

WHAT IS JFMIP ?
The Joint Financial Management Improvement Program (JFMIP) is a joint and cooperative undertaking of the Office of Management and Budget, the General Accounting Office, the Department of the Treasury , and the Office of Personnel Management, working in cooperation with each other and with operating agencies to improve finan cial management practices . The Program was initiated in 1948 by the Secretary of the Treasury , the Director of the Bureau of the Budget, and the Comptroller General, and was given statutory authorization in the Budget and Accounting Procedures Act of 1950 .
The overall objective of JFMIP is to improve and coordinate financial management policies and practices throughout the Government so that they will contribute significantly t o the effective and efficient planning and operation of governmental programs. Activities aimed at achieving this objective include :
--Reviewing and coordinating central agencies ' activities and policy promulgations to avo id possible conflict, inco nsistency, duplication and confusion.
--Acting as a clearinghouse f o r sharing and disseminating financial management information about good financial management techniques and technologies.
--Reviewing the financial management efforts of the operating agencies and serving as a cata lyst for further impro vements .
--Undertaking special pro jects o f a Governlnent wide nature to reso lve spec i fic problems.
--Pro viding advis o ry services in dealing with specific financial management problems.
The JFMIP play s a ke y role in mobilizing res o urces and coord inat ing coo pe ra t i ve e fforts in the improvement of financial management practices, and r e lies o n the active participati o n o f Federal agencies t o be successfu 1.
BAR CODE TECHNOLOGY
A MEANS TO IMPROVE OPERATIONAL EFFICIENCY
AND INTERNAL CONTROL
May 1982
Joint Flnancial Management Improvement Program

/S ;r cD
GAO iAI&;60 .837
----- ---- --------------------------------------------~
FOREWORD
During the course of our recent work on property accounting systems, we became aware of a trend among Federal agencies to utilize electronically readable markings, primarily bar codes, and reading devices for identification and control of property. Because of their apparent potential for improving productivity and strengthening internal control, we expanded our review in this area. We found that some agencies were considering, or had implemented, bar code applications outside the area of property management as well. Paramount among the many benefits realized or anticipated from all applications are increased accuracy of data input, increased speed and efficiency of operations, and the attendant dollar savings from reduced personnel expense.
In light of the increasing interest in the utilization of electronically readable markings and reading devices, the resources being expended on the development of related automated systems, and the potential benefits to be derived from such systems, we undertook a study of the fundamentals of bar code technology, including the current and planned applications of the technology by Government agencies. Th~ study results are in this booklet.
Today's Federal manager is being asked to increase productivity while operating under tight budget constraints. Further, under OMB's Circular A-123, Internal Control Systems, managers are to be held personally responsible and accountable for the proper management of all resources under their control. Our study results indicate that the application of bar code technology in certain agency operations is a viable means to safeguard these resources, assure the accuracy and reliability of management information, and to promote operational economy and efficiency.
We hope that this booklet will be useful as a primer to bar code technology and applications and a guide to knowledgeable contacts in the Federal Government.
- i -
Susumu Uyeda Executive Director May 1982


TABLE OF CONTENTS
Foreword. . . . . . . . . . . . . . . . . . . . . . . . . . CHAPTER
I INTRODUCTION •••••••
II TECHNOLOGY AND EQUIPMENT.
A. Optical Character Recognition (OCR)
B. Bar Codes . . .
1. Examples of Various Bar Codes 2. "3 of 9" Bar Code •
C. Hardware.
l. 2. 3. 4.
Readers Labels/Adhesives. Costs . . . . • • Other Equipment and
Considerations .
• Service . . .
III BAR CODE APPLICATIONS AND SYSTEMS
A. Matrix Overview of 10 Bar Code Systems.
•
•
i
1
3
3
4
4 6
6
7 9 9
10
• 1 1
12
B. General Procedures for Inventory ••••••• 14
C. Individual Agency Systems · · 14
l. Department of Agriculture 14 2. Department of Defense · · • 16 3. Department of Energy. · · • • 20 4. Patent and Trademark Office • 23 5. U.S. Postal Service • .24 6. Department of State . · · • 26

CHAPTER I
INTRODUCTION
In the early 1960's, supermarkets and their suppliers began to utilize bar codes for item identification and bar code readers for in-store automatic check-out and inventory control. Since that time, bar codes and other machine readable symbols have been appearing on material components, finished goods, shipping containers, warehouse bins, bills of lading and other distribution documentation. Optical scanners are being used at an eVerincreasing rate to track the movement of goods in factories and warehouses.
This technology can and is being applied by Government agencies in a variety of operations. However, there does not appear to be, at the moment, any Governmentwide policy, standards or focal point for expertise on the use of electronic markings by Federal agencies. Consequently, except in the Department of Defense, our impression was that systems are being developed independently within agencies with some guidance from outside contractors, but with very little awareness of substantial and related efforts going on in other agencies.
In Chapter II of this booklet, we discuss the technology involved in optical scanning and machine readable symbols, focusing on bar codes, which is the symbology being used in the agency applications included in our study. Also in Chapter II, we describe the equipment being used by these agencies to test and implement their bar code systems as well as the current procurement costs.
Our study covered ten different agencies with bar code systems in place, either in a test status or fully operational. These ten agencies, their bar code applications and scope, and the status of the systems are outlined in the matrix in Chapter III. Included in the matrix are the names and telephone numbers of individuals who are involved in the development, implementation or ma i ntenance of these bar code systems and who have indicated they are willing to share their experience and knowledge with interested parties. Also in Chapter III are detailed descriptions of six bar code systems in different stages of development, representative of a variety of applications and with unique system features.
This booklet is not intended to be a highly technical document, nor is it meant to be a comprehensive report of Governmentwide use of bar codes. Rather, we have attempted to provide enough basic information to take the "mystery" out of the subject of electronic markings and related reading devices and to generate additional interest in the subject among agencies so that others might consider applying bar code technology to one or more of their operations. While reference is made herein to bar code
- 1 -

"systems,· the reader should keep in mind that automated data entry is an enhancement to an existing automatic data processing system and does not constitute a separate system in itself.
As discussed in the booklet, the potential applications for the technology are many, and the equipment needed is readily available and is not expensive. All users have indicated that they are confident that they will more than recover the costs of development and implementation through in creased productivity within a very short time.
- 2 -
~ I

CHAPTER II
TECHNOLOGY AND EQUIPMENT
Optical scanning of machine readable symbols is an information processing technology which converts data into an acceptable medium for computer input. Optical scanning differs from card punching or magnetic ink character recognition (MICR) in that it is based upon reflected light as opposed to holes or magn e tism for identification of information for use by the computer. The two basic type s of optically scannable symbols that are most commonly used today are optical character recognition (OCR) symbols and bar codes.
This booklet is concerned primarily with the use of bar codes for a variety of applications, but we have provided in this Chapter general information on OCR symbology as well so that the reader will be able to differentiate between the two types of symbols a nd understand why bar coding, at the moment, is more widely used for Federal sector applications.
A. Optical Character Recogn ition (OCR) 0123456789
ABCDEFGHIJKLMNOPQRSTUVWXYZ {}%?&"*+$, .-/'= 1;:1
OCR is the technique of reading with an electronic device the same character symbols which can also be read by the human eye. An OCR scanning device measures the relative quantity of light reflected from a printed surface and converts this information to an electrical impulse. It is this impulse that is recognized by the scanning device as a certain alpha or numeric character, and these data are transmitted to the computer.
OCR-A is one of the most commonly used styles of OCR and the one f or which there is a Federal Information Processing Standard avai l able. However, off-the-shelf, full alphanumeric OCR-A equipment is not currentl y a vailable in a fixed mode that will read symbols on material as it moves on mechanized conveyors or in a porta ble mode that uses a portable scanner. Therefore, this prese ntly precludes use of OCR-A in Government automated material handling systems, inventory, and field logistics applications. For o ther applications, where either OCR or bar codes could be used , bar codes are being chosen over OCR, because the bar codes are more visible, easier to scan and more accurate than OCR and requ i re less expensive equipment.
- 3 -
B. Bar Codes
IIUIIIIUIIIII 400000 003n1
Most bar codes are horizontal codes consisting of alternating vertical dark bars and light spaces. Information is encoded into the bars and spaces by varying their individual widths . There is no interpretive information in the height of the bars and spaces . Since a bar code cannot be read if the path of the scanning device falls outside the barred area, bar heights are chosen to maximize the probability of a successful scan. Longer bar-coded messages generally use bars of greater height. Each bar code has a set of given dimensions pertaining to the specific widths of the bars and spaces and permissible tolerances.
Currently there is no Federal standard related to the use of bar codes. The Department of Defense is working with the American National Standards Institute to develop a voluntary national standard on the use of bar codes in distribution and transportation systems. When this standard is published by the Institute, efforts will then be made to have it coordinated with the National Bureau of Standards and adopted as a Federal Information Processing Standard for Governmentwide use.
1. Examples of Various Bar Codes
Examples of a variety of bar codes that are available for use are provided on page 5.
- 4 -

EXAMPLES OF VARIOUS BAR CODES
'"
BUllSEYE
BINARY CODED DECIMAL (BCD)
DISTRIBUTION CODE (DC) UNIVERSAL PRODUCT CODE (UPC)
DIGITAL
INTERLEAVED "lWO-Of·FIVE" PERIODIC BINARY
BI·LEVEl
"THREE..oF·NINE"
, • 5 - ' , o ,
--, DECIMAL
BINARY
GEOMETRIC
'"/W()..OF·FIVE"

Among the systems included in our study, the most common bar code being used is the "3 of 9" code. This same code in some systems is referred to as ·Code 39." After more than two years of study of the state of the art of optical scanning, the Department of Defense has chosen the 3 of 9 code as the standard symbology to be used on items, unit packs, outer containers, and documents in all Defense logistics functions. The 3 of 9 bar code is discussed in detail below.
2. "3 of 9" Bar Code (or Code 39)
111111111111111111111111111111
*82C3* The 3 of 9 bar code is of variable-length, bidirectional,
discrete, self-checking, and alphanumeric. Its data character set contains 43 characters: zero through nine, A through Z, dollar sign, slash, plus, period, dash, percent, and space. Each character is composed of nine elements: five bars and four intervening spaces. Each character contains some combination of two wide bars and three narrow bars separated by some other combination of one wide space and three narrow spaces. The narrow bars and spaces represent a binary zero and the wide bars and spaces represent a binary one. Spaces between characters are not significant. An asterisk character (*) is used exclusively for both the start and stop codes and allows for bidirectional scanning. Since the 3 of 9 bar code is a -discrete, self-checking code, it does not require a check digit in normal applications. An optional check digit is available for those infrequent applications in which a substitution error could have serious consequences.
C. Hardware
The basic hardware required for a bar code system includes the optical code reader and bar-coded labels. This booklet will not deal in detail with the variety of support equipment, e.g., bar code label printers, battery chargers, field recorders, display terminals and line printers, which are available on the market, but in most cases are optional to a system's operation. Nor will it cover remote, stand alone, fixed beam and moving beam scanners that are being used in automated storage and retrieval systems and in applications where parts or products are moved automatically along a conveyor. Rather, it will focus on the code readers most appropriate for use in Government operations.
- 6 -
1. Readers
The optical code reader, also referred to as a terminal or a scanner, is a mini-computer which records, calculates, stores and transmits coded data to the main computer. The reader employs a wand or lignt-pen to focus a beam of light on bar-coded surfaces and to sense reflections from them. The tip of the wand is kept in cpntact with the entire length of the coded surface while it is moved to read a message. As coded surfaces tend to be somewhat abrasive, most wands have very hard jewel tips (either ruby or sapphire) designed to minimize wear of both the tip and the barcoded message.
Readers may be either stationary or portable. The stationary reader is generally connected to a display device, such as a cathode ray tube (CRT), in order to 'visually display the barcoded data being scanned or the record being updated. The reader consists of a wand wired to a decoder, which provides a computercompatible output. These readers are termed on-line devices, because they are usually interfaced directly to a computer or terminal for on-line data collection.
The portable reader is a battery- operated terminal containing a wand and a keyboard and/or scanboard for data input. Data are stored in solid state memory within the unit for later transmittal to the computer through an interface device or over telephone lines.
The basic . readers range in price from $',000 to $',800. Readers and optional support equipment are available from a variety of manufacturers, in a number of sizes and styles, each with different capabilities and specifications, accessories, and hardware/software options. Representative costs for readers and other basic hardware are provided on page 9.
The nature of the bar code application is of primary importance in the selection of equipment. For inventory and property control applications, we found the most widely-used reader to be the portable, hand-held model. The other applications/systems included in our study are using stationary, desk top readers as illustrated on page 8.
- 7 -
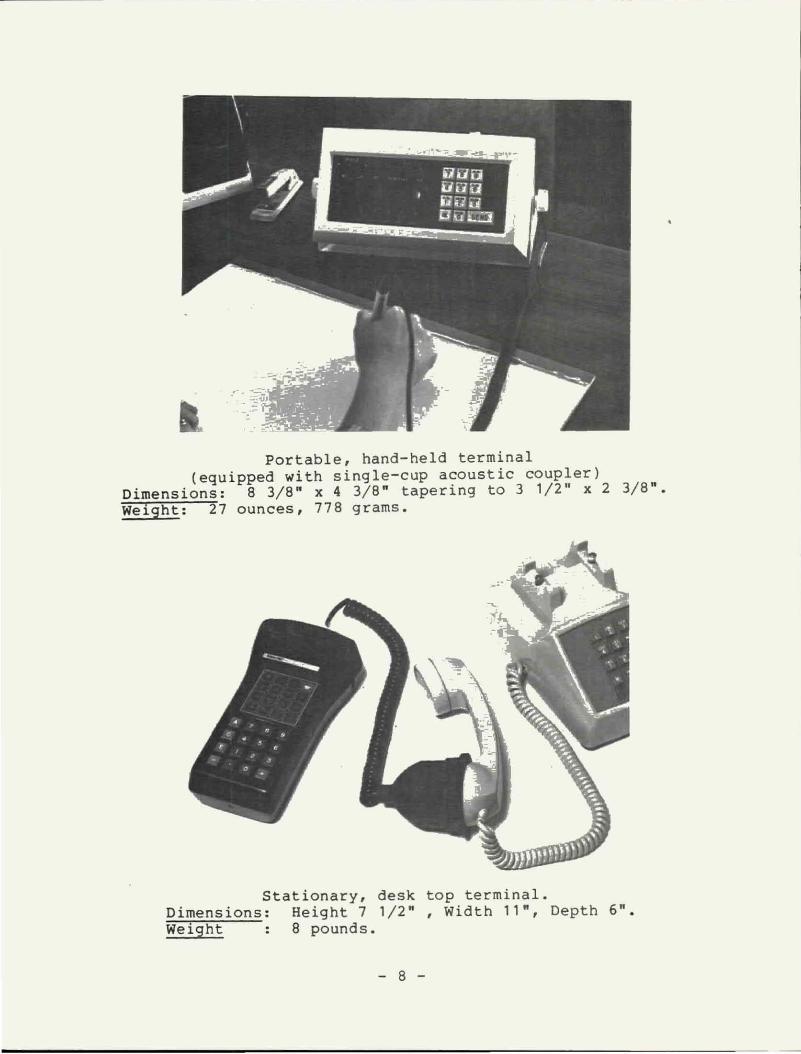
Portable, hand-held terminal (equipped with single-cup acoustic coupler)
Dimensions: 8 3/8" x 4 3/8" tapering to 3 1/2" x 2 3/8". Weight: 27 ounces, 778 grams.
Stationary, desk top terminal. Dimensions: Height 7 1/2" , Width 11", Depth 6". Weight 8 pounds.
- 8 -

2. Labels/Adhesives
When requirements exist in an application for large quantities of sequentially numbered bar code labels, e.g . , when converting current inventory to a bar code system using unique identification numbers, the purchase of preprinted labels from a manufacturer will, in most cases, prove to be most economical. However, in applications where there is an on-going need on a daily basis for significant numbers of new, additional labels, it is usually more cost efficient for the user to purchase a label printer to generate its own supply of labels.
Of primary concern when purchasing preprinted labels or label stock are readability, durability and adhesive quality . The market for labels is very broad with many firms producing labels made of paper, vinyl, mylar, etc. Also available are a wide variety of adhesives. For each adhesive, the vendor will rate its acceptability for a wide variety of surfaces. Thorough environmental testing of the products available is necessary for applications where the labeled items will be subjected to extreme temperatures or rough handling, or where the labels must adhere to surfaces such as draperies, glass, carpeting, etc.
3. Costs
One of the most significant facets of automated marking and reading technology over the past few years has been the significant decr.ease in the cost of the equipment required both to print and to read bar codes and the cost of vendor preprinted labels. Costs of portable, hand-held readers have decreased 73 percent, from approximately $5,500 per unit in 1978 to approximately $1,500 per unit in 1981. The price of nonportable readers, preprinted bar code labels and label printers have also decreased significantly. Representative 1981 prices for the equipment being used by the agencies included in our study are shown below:
a. Portable, hand-held readers - $1,200 to $1,800 per unit. Price includes terminal, wand, modem for transmission to CPU, and battery charger.
b. Stationary, desk top readers - $1,000 eer unit. Price includes preprogrammed functIon buttons to suit user's application, 10 digit numeric keyboard, data display panel, and wand.
c. Wands - $150 each .
d. Portable field recorder/ printers - $2,000 to $4,000 per unit. ----Used for applications where it is not feasible
to dump data directly to the host computer immediately after collection. Accepts multiple
- 9 -

dumps onto one cassette cartridge for subsequent forwarding to the central processing center via telephone lines or mail.
e. Display terminals or line printers - $1,300 to $1,800 per unit. ----Displays or prints hard copy listings of data
collected for on-the-spot audit check.
f. Bar code label printers - $7,000 - $11,000 per unit.
g. Preprinted labels - 1/2¢ a piece for unprotected paper labels to 8¢ a piece for mylar coated, vinyl labe+s.
4. Other Equipment and Service Considerations
Another item of equipment which is available, but which is not being used at this time by any of the agencies included in our study, is an off - line receiver that costs from $6,000 to $20,000. Data may be transmitted from terminals via telephone lines to a centrally located off - line receiver. This receiver stores the transmitted data on magnetic tape or a floppy disk, which may be removed at an appropriate time and brought to a data center for processing. Such a configuration allows a simpler and less expensive communications program than direct-to-computer data transmission, since there is no necessity to compete for on-line computer time. Also, with an off-line receiver, field recorders are not necessary.
In addition to manufacturing individual components, most manufacturers offer expertise in designing complete systems to meet a customer's requirements. The code readers' standard operating systems allow use of vendor application software or special application programs designed by the customer. Costs for customized programming of the terminal by the vendor to meet user's specifications can range from $3,000 to $15,000.
- 10 -

CHAPTER III
BAR CODE APPLICATIONS AND SYSTEMS
Any application where faster and more accurate data entry into an automated system will result in increased operational effectiveness is a candidate for the use of bar codes.
Of the 10 Federal agency bar code systems that we focused on during our study, 6 are inventory control applications. However, the diversity of additional applications outside the area of property management is great. Listed below are some of the more common bar code applications being used today in both the public and private sectors:
--Forms Management --Document Sortation - -Work-in-process Tracking and Locating --Production Control --Order Processing and Automatic Billing --Quality Control Inspection - -Distribution or Warehouse Control - -Mail Operations, Sorting and Tracking --Motor Vehicle Accountability and Maintenance --Productivity Measurement --"Job Shops" for Billing Purposes --Libraries/Central Files to Record Accountability - - Security, to Control Access to Restricted Areas --Shipping and Receiving Control
This Chapter includes a matrix (Section A) that provides an overview of key information on the 10 Federal agency bar code systems included in our study. The six systems for inventory control are similar in the way that the coded data are "read" and transmitted to central processing units for verification, reconciliation, or updating of records in the master files. These general procedures for capturing and trans~itting bar-coded data are described in Section B. The procedures for other applications, as well as detailed descriptions of three of the inventory control applications, are described in the individual agency writeups in Section C.
The individual agency writeups describe six systems in different stages of development, representing a variety of applications and with unique system features and procedures. Of these six systems, the Department of Defense is particularly unique because of its centralized approach to the development and implementation of all automated marking and reading applications in Defense logistics activities. Under the guidance of a Joint Steering Group, a standard symbology for Departmentwide use has been established, and the use of bar codes has been tested successfully in seven different logistics functional areas.
- 11-
A. Matrix Overview of 10 Bar Code Systems
AGENCY/ODE
AGRICULWRE/ 3 of 9 (See Page 14)
CENSrn BURFAU/3 of 9
DEFEl'ISEj3 of 9 (See Page 16)
ENERGY/upc-A (See Page 20)
APPLICATION/SCOPE
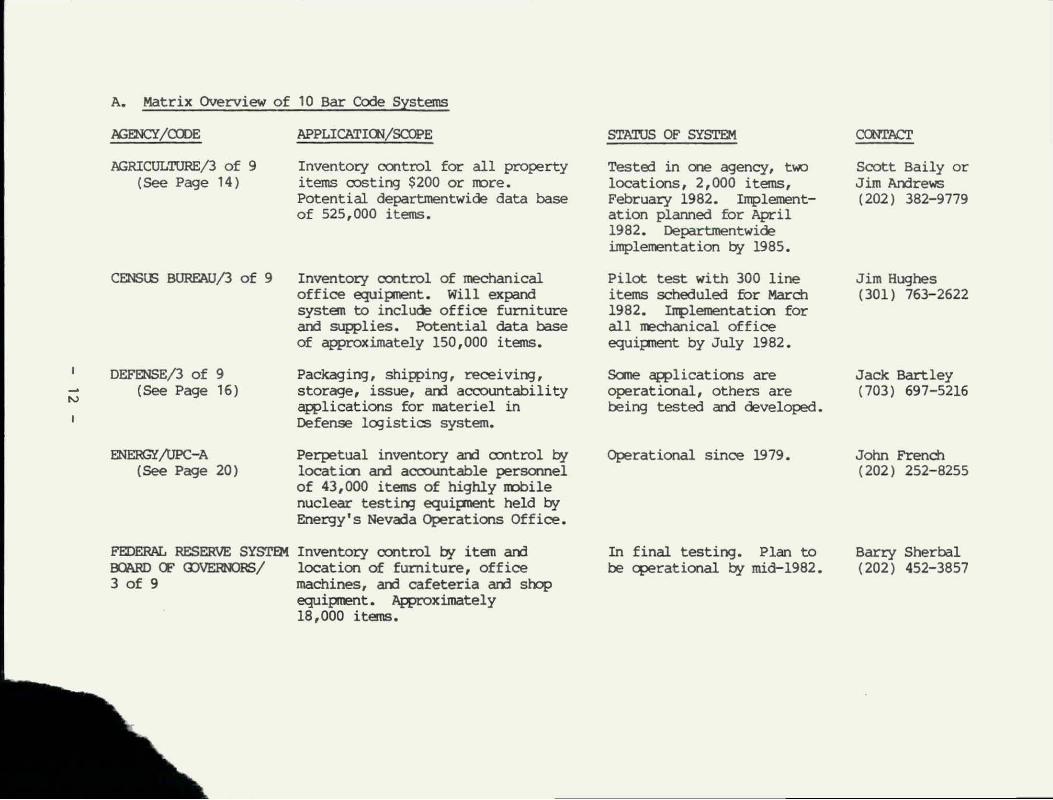
Inventory control for all property items costing $200 or more. Potential departmentwide data base of 525,000 items.
Inventory control of mechanical office equipnent. Will expand system to i nclude office furniture arxl supplies. Potential data base of approximately 150,000 items.
Packaging, shipping, receiving, storage, issue, arxl accountability applications for materiel in Defense logistics system.
Perpetual inventory arxl control by locaticn and accountable personnel of 43,000 items of highly mobile nuclear testing equipnent held by Energy's Nevada Operations Office.
FEDERAL RESERVE SYSTEM Inventory control by item arxl 0Cl!'.RD CF CDVERNJRS/ location of furniture, office 3 of 9 machines, and cafeteria and shop
equipment. ~ximately 18,000 items.
STATUS OF SYSTEM
Testoo in one agency, two locations, 2,000 items, February 1982. Implementation plannoo for April 1982. Department wide implementation by 1985.
Pilot test with 300 line items scheduled for March 1982. Implementaticn for all JreChanical office equipment by July 1982.
sane applications are operational, others are being testoo and developed.
Operational since 1979.
In final testing. Plan to be operational by mid-1982.
CONTACI'
Scott Baily or Jim Andrews (202) 382-9779
Jim Hughes (301) 763-2622
Jack Bartley (703) 697-5216
John French (202) 252-8255
Barry Sherbal (202) 452-3857

N:iFN:i/CfDE
NOCLEAR~ CCfoMISSIOO(3 of 9
PASSPORr PGEOCYjUPC
PATENI' AN) TRADD1ARK OFFICE/CfDE 39
(See Page 23)
POOTAL SERVICE/ODE 39 (See Page 24)
STATE IEPAImoIENl'/ MQ:lIFIED PLESSY (See Page 26)
APPLICATIOO/SOJPE
Inventory control of office furniture, equipnent aOO supplies (85-90 peroent of Commission's $155 million inventory). Property located in 17 different NRC office locations aOO with numerous Department of Energy contractors and grantees.
Identification, tracking aOO locati~ passport applications as they rrove through the various work stations in the issuance process. Washington, D.C., data base, SOO,OOO items. Chicagl data base, 250,000 items.
Identification, tracki~ aOO updating of patent applications. Data base in excess of 600,000 items.
Identification, routing aOO tracki~ of registered mail as it lIDITes through postal system. Approximately 12,000 of the 38,000 post offices will use system.
Inventory CDI'ltrol of office furniture, equipnent aOO SUWlies, as well as all personal property in elItlassies, residences aOO chanceries for 50 of the 200 Foreign Service posts, 70,000 line items.
STATUS OF SYSTEM
Testi~ to be completed by May 30, 1982. Plan to be operational by July 1982.
~rational in Washington and Chicagl offices since June 1981. Will expand to remaining 11 Passport Agency offices by 1985. Will undergo acceptance testing in Los Angeles in April-May 1982.
~rational since 1980.
Being developed.
Implemented in Prague in 1978. Plan to implement in 22 additional posts by mid-1983.
Grover Estep (301) 492-8293
Sheldon It:lsen (202) 632-6338
Don LeCrone (703) 557-8174
Bob Overholt (301) 443-6216
Doug Stevens (202) 632-{)060
B. General Procedures for Inventory
Each property item to be accounted for and controlled by a bar code system will have a bar-coded label affixed to it. The bar code may be entirely numeric, entirely alpha, or a combination of alpha and numeric characters. At a minimum, the bar code represents the item's assigned identification number as it appears in the system's master files. Depending on the type of bar code chosen for the system and the length of each identification number, the label may include other coded data such as references to subcategories of property items or the Divisions and Offices accountable for the item. (See sample labels appearing with individual agency writeups.) The bar-coded data will appear on the label in human readable form as well as in the machine readable bar code.
The most practical reader for inventory purposes is the portable, hand- held model . Prior to initiation of an inventory, the system requires the user to identify the task to be performed and to input on the terminal certain control data elements, unique to each agency's system. Edits are built into the system to control access to the system, to prevent the input of invalid data and to reduce the potential for error. To "read" the label(s) the user passes an optical scanning wand, which is attached to the terminal, over the surface of the label. The numbers/letters "read" will appear immediately in the visual display panel of the terminal. When a label cannot be ·read" or is not reachable with the wand, the numbers/letters represented by the bar code on the label are key entered on the terminal. Most terminals sound an audible beep to indicate a correct entry. The beep also signals that the unit is ready for the next scan.
The captured data are stored in the terminal's memory. When the memory is filled or the inventory is completed, the data are transmitted via a terminal/telephone data link to the central processing unit for collection, reformating, and interchange with the computer. The system will automatically compare the transmitted data to the master file(s) or, depending on the system, update the master file, and generate a report, if appropriate. The format and content of the output are unique to each system.
c. Individual Agency Systems
1. Department of Agriculture--3 of 9 Code
The Department has developed a bar code system that, when implemented Departmentwide, will identify and control approximately 525,000 personal property items. In February 1982, the system was tested in one of the Department's twenty agencies, the Foreign Agriculture Service, using 2,000 items in two locations, Washington, D. C. and Houston, Texas. Full scale implementation at the test sites will take place in April 1982. Departmentwlde implementation is anticipated by 1985 . Following is a brief description of how the system will work.
- 14 -

At the time of requisition, each accountable property item costing more than $200 is assigned a unique 6-10 digit identification number by the Department's National Finance Center located in New Orleans, Louisiana. A permanent detail record is then established for the item in the master inventory file. Upon notification of receipt of the item, the National Finance Center issues a label bearing the unique identification number in bar code and human readable form. The label also bears other visually displayed data as outlined below. The label is forwarded to the appropriate accountable office to be affixed to the item.
CAlOfNZA CONT Sl 10 .. "
250805
, .. The label is made up of three lines of human readable data and one line of bar-coded data • The first line is a truncated description of the property item not to exceed 20 characters and an agency identifier not to exceed 5 characters. The second line shows the property item's agency
assigned property number or serial number. The third line is the National Finance Center assigned property identification number in bar code 3 of 9 format. The fourth line is the same identification number in human readable form.
When performing a physical inventory, the individual performing the operation key enters on a portable hand-held terminal (64K memory) his/her initials, the accountable officer's identification number (which indicates the inventory location), and the current date. All items being accounted for are then input to the system by scanning the bar-coded labels with an optical scanning wand or by key entry of the identification number where necessary. Upon completion of the inventory, the data are transmitted to the central processing unit in the National Finance Center over telephone lines where they are automatically compared to the records in the master inventory file. The system generates a report showing (a) the items accounted .for but not in the master inventory and (b) items in the master inventory but not accounted for. Those items on the report for which identification numbers could not be "read" by the optical scanning wand and had to be key entered are highlighted.
In this system, immediate feedback of inventory results is not provided. Rather, within ten days of the inventory, a report showing overages and shortages is mailed from the National Finance Center to the accountable officer for reconciliation and initiation of any necessary investigations.
The Department expects many benefits from uSing this system:
--More accurate physical inventories, since automation eliminates the opportunities of human error;
--The ability to perform more frequent inventories, because less time and resources are required; and
- 15 -

--Possible reduction in loss of property due to increased frequency of physical inventories.
2. Department of Defense-- 3 of 9 Code
In 1976 a Joint Steering Group for Logistics Applications of Automated Harking and Reading Symbols (LOGHARS) was chartered by the Office of the Assistant Secretary of Defense to establish a standard machine- readable symbology to be marked by commercial vendors and Department of Defense activities on items, unit packs, outer containers, and selected documentation, and to establish procedures for use of the symbology throughout the Department. The project was undertaken to avoid proliferation of symbologies within the Department of Defense and duplication of effort in implementing automated marking and reading. The long-range objective was to improve productivity, timeliness, and accuracy in Defense logistics and thereby reduce costs.
The 3 of 9 code has been approved as the Defense standard symbology. Defense components are encouraged to proceed with the development and implementation of logistics applications of ·automated marking and reading technology and are required to submit requests to proceed with new applications to the Joint Steering Group. Approval of the requests will be based on the following:
a. Utilization of the 3 of 9 bar code,
b. Proposed costs, benefits and implementation schedules, and
c. No significant duplication or conflict with planned or current logistics applications.
Prototypes of 3 of 9 bar code applications have been tested in the functional areas of wholesale shipping, wholesale receiving, wholesale inventory and location survey, ammunition segregation and inventory, retail receiving, service store issue, and maintenance parts tracking. The following is a test by test summation of the results of the prototype test program.
a. Wholesale Shipping. The use of a bar-coded, special purpose document was tested in the packing and shipping operations at the Defense Depot in Ogden and involved items being shipped to the Warner Robins Air Logistics Center. The special purpose document was comprised of three separable parts: (I) a bar-coded "pick tag" used in picking and packing the items to be shipped and which, when scanned, automatically generated a packing list; (2) a bar-coded 'customer receipt card" identifying the material being shipped and providing the receiv i ng activity with machine readable receipt data; and (3) a
- 16 -

shipment unit number which identif i es the container and its contents during subsequent processing. The test proved that bar-coded documents can be used to effect shipping and receipt transactions and can accompany materiel through shipping and transportation systems to be successfully scanned by the receiving activity . Use of bar code scanning in the shipping funct i on alone resulted in an overall 9.5 percent improvement in processing time.
SPECIAL PURPOSE DOCUMENT (SPD)
PICK TAG CUSTOMER RECEIPT T~~ - . '-~7 -~~ r .T j~~~ rD20'~1.B2.~7)
I ,,.. -•• -m -.-" : i 11111111 111 11 1111 1IIIIIIijIIIIII IIIIIIIIIIIIIIIIII t s[n:xc:olofo I I
I : i 11111111111111111111111111111111 11111111 I IiSII - - - ~' ==-c=== .. ---'
\' 111111111111111111 11 111111111111 11 1111111111111111 i i liimlil l l~i~~ililil-li~ili~IIMil lllll lll ,! llI lI l lmlll lllllllll~~I I I I ~ !I
stated in paragraph a. above. Direct receipts from vendors were simulated by producing bar-coded labels when the materiel was received and attaching them (as though the vendors had done so) to the Material Inspection and Receiving Report for subsequent scanning. The receipts information for both depot and vendor shipments was then scanned on-line and the data transmitted to the host computer to be matched against prepositioned data files. Test results indicated no major problems were encountered with the readability of the bar-coded labels. Productivity was increased and the cost per transaction to process receipts was reduced by 38 percent.
c. Retail Receiving. The application of bar code technology to processing retail receipts was tested at an Army warehouse in Europe. A bar- coded label containing the required receipt data was produced at the New Cumberland Army Depot and affixed to each unit pack destined for the test site in Germany. At the test site, the bar-coded label on each unit pack was scanned and receipt information transmitted to an on-site computer for entry into the retail receipts processing system. Test results indicated that the use of bar-coded labels proved to be a fast and reliable means of processing and posting retail receipts. Also, the test equipment proved to be durable and reliable in an adverse warehouse environment, and no equipment downtime was recorded during the test. It was recommended that bar code scanning be adopted as a means of data entry for posting receipts at all Army retail activities.
d. Inventory and Location Survey. The use of portable bar code scanners for physical inventory and location surveys was tested at the Defense Depot in Ogden. The portable scanners were preloaded with data on proper storage locations and were used in lieu of cards or listings. Bar-coded labels on the locations, a "menu· scan board, and key entry on the portable scanner provided the means of capturing inventory and location data. Three thousand storage locations at the depot, consisting of bin, rack, bulk, and outside storage, were included in the test. Benefits identified as a result of testing included improved data accuracy, decreased processing time for data reconciliation and a 6 percent productivity improvement in data collection.
e. Ammunition Segregation/Inventory. A test of the use of bar codes for taking wall-to wall inventory for ammunition was conducted at the Concord Naval Weapons Station. All ammunition in storage was labeled with a 3 of 9 bar code. The inventory was performed by scanning magazine by magazine from one end of the storage area to the other. This created a complete inventory file, which was
- 18 -
then used to update the inventory records without having to prepare punched data cards. Test results indicated that optical scanning of bar-coded data was a practical and economical method of conducting physical inventories of conventional ammunition. It was determined that, on the average, physical inventory could be conducted using ba'r code scanning at 80 percent less than the cost of conducting a conventional inventory of the same materiel.
f. Service Store Issue. The test was conducted in the Base Service Store at the Ogden Air Logistics . Center and necessitated the installation of electronic point-of-sale equipment. All items were marked with 3 of 9 bar code labels to be scanned when received at the Base Service Store and when issued to the customer. The electronic point-of-sale equipment includes an on-line integrated transaction processor to accommodate accounting, sales, inventory, back orders, and receipt transactions. Therefore, it eliminates the need for sales cards and the key-in entry of transactions. Test results have indicated that scanning equipment can be interfaced with the store computer and used to reduce processing time. The test is being expanded with the goal of establishing a fully implemented system for issuing and inventory activities at all Base Service Stores.
g. Depot Level Maintenance. The test was conducted at the San Antonio Air Logistics Center and involved tracking the flow of items being worked on through depot maintenance processes. Items were accompanied by a bar-coded work control document which was scanned when the item entered and left each work center. The scanning updated the computer data base and provided information on location and status of each item. Test results indicated that the accuracy of management information data due to scanner input increased significantly compared to the manual system. Based on this test, this type of system is being implemented within all Air Force Logistics Command depot level maintenance functions.
Results of all the prototype tests indicated that a minimal amount of difficulty was experienced in integrating automated marking and reading equipment into the current automated system. None of the test managers reported any system downtime due to scanning equipment or software failure that adversely affected the tests. The success of the equipment is best illustrated by the fact that all but one of the test operations have been accepted for permanent implementation.
Total annual savings identified to date from use of bar code scanning, instead of conventional methods of data entry, are estimated by Defense to be $113.9 million. It is anticipated that
- , 9 -

greater savings will be identified as bar code scanning is implemented further throughout the Department. Other benefits that will accrue through use of bar code technology include greater accuracy, reduced order and ship time, improvement of production flow, increased asset visibility, reduction in documentation requirements, fewer training requirements, better control and accountability, reduced pipeline time, and reduced stockage investment levels.
The content of this Section, for the most part, has been excerpted and paraphrased from the Final Report of the Joint Steering Group for Logistics Applications of Automated Marking and Reading Symbols, 1 September 1981.
3. Department of Energy--UPC-A Code
In 1979 and 1980, the Department's Nevada Operations Office implemented a bar code asset management system to control some 43,000 property items, primarily scientific instruments and nuclear test equipment. The equipment is located in eight different facilities throughout the country and moves frequently, as needed, from site to site within a facility, as well as from one facility to another. The system tracks the equipment's movement, thereby providing a perpetual inventory showing current location and accountable personnel.
The system minimizes the potential for human error by maximizing the degree of automated data capture. There are three primary label types used in the system: (a) personnel identification labels with a unique bar code which identifies the individual performing a particular operation or task, (b) location labels coded with location data and affixed to specific rooms or trailers for identification of locations within a facility, and (c) item number labels utilized for tagging individual pieces of equipment.
The system utilizes the Universal Product Code, nAn version. UPC-A is a fully numeric code made up of 12 digits. The bar code structure allows for great versatility, as explained below and as illustrated in the sample labels provided (see page 22).
The first digit, using 0 thru 9, may be assigned to denote if the label is used for primary location, secondary location, accountable property, special projects equi~ment, employee number, etc.
On the item identification labels, digits 2 and 3 permit up to 99 different locations or offices within the Department. Digits 4 and 5 permit up to 99 contractors to be included in the property accounting system at each of the 99 field locations. Digits 6 thru 12 permit up to 9,999,999 accountable property items to be recorded with each of 99 contractors at each of the 99 field offices. Similar versatility is built into the structure for the location and personnel labels as well.
- 20

Additional bar-coded labels used in the system are for leased and borrowed items. They have a unique color and numbering system as well as a special adhesive for removal without defacing equipment.
When performing an inventory or recording an equipment location change, a hand-held portable terminal with a full numeric keyboard and a separate detachable optical scanning wand is' used. The user passes the wand over his/her personnel identification bar code label, then over the bar code label identifying the location, and lastly over the bar code label on each piece of equipment for which the location is to be updated or which is being inventoried. When recording a location change, the bar code label at the new locat i on is also scanned.
The data are stored in the terminal's memory and subsequently transmitted via a terminal/telephone data link to the host computer, located in Las Vegas. The system provides for immediate feedback on comparisons of the transmitted data to the master property inventory file, enabling on- the- spot reconciliations to be performed in a matter of minutes when errors, ommissions or other discrepancies exist.
The Department reports a 60- 80 percent reduction in the time required to perform physical inventories, and the number of personnel needed to perform an inventory has been cut in half. Accuracy has been dramatically improved. Because of the high percentage of automated data capture, the few errors that do occur are attributable to incorrect numbers being manually keyed into the terminal. The Department believes that the improved control and accountability for ~roperty achieved through this system has greatly reduced the potential for pilferage or loss of highly sensitive and valuable equipment. Also, the system provides managers with timely and accurate inventory information.
- 21 -

ITEM IDENTIFICATION LABEL
DOE/NV U.S. GOVT. PROPERTY
_ C OlOR COOED LABEL HEADQUARTERS OFFICE, RESEAR FEDERAl REGIO
OPERATION CH CENTERS, NS, ETC.
FOR EACH
DIGIT AVAILABLE "FREE" USE BY ORGANIZATION
.. 12 34
3 ~I~~ II ~ IJ I 1 I I 1 8
567890
Actual Bar Coded Number - 312345678908 Actual Property Number - 5678908
LOCATION LABEL
EG&G LOCATION
II 111111111111111111111 1 2599810014 5
TRAILER NO. 9881
NYE COUNTY, NEV
PERSONNEL LABEL
~IIIIIIIIII 111111111 400000 003771
- 22 -
C ONTRACTOR RGANIZATION 0
~ HECK DIGIT
PR OPERTY NUMBER
CHECK DIGIT
ROW 001.

4. Patent a nd Trademark Office--Code 39
Since 1980, t he Patent and Trademark Office of the Department of Commerce has used a bar code system to identify and track patent applications . The current data base is in excess of 600,000 items -- 400,000 patented or abandoned applications and 200,000 pending applications in different stages of processing.
Patent applications are received by the Office at a rate of approximately 400 a day. Each application is immediately reviewed upon receipt and, if accepted as legal and proper, an eight-digit unique identification number (referred to in the system as the seria l number) is assigned sequentially. A label bear ing the serial number in bar code and human readable form is affixed to the file folder and a data base record is initialized by a scan of the label. The Office prints its own labels on red stock which cannot be reproduced. The adhesive used is acrylic glue, and the label will destruct if an attempt is made to remove it from the file folder.
Descriptive information (i.e., inventor's name, title of the invention, etc.) for each new application is entered into the system in batch mode. However, subsequent updating of the data base is on-line. This updating occurs as the application moves from work station to work station during the various stages of application processing . The Office processes - 25,000 transactions each day. Of these, 15,000 are bar code transactions which update the data base; the remainder are retrieval only. One hundred and eighty five stationary readers with numeric keyboards, 16-character display and optical scanning wands are utilized throughout the pipeline. In addition, CRTs are used for retrieval and some types of updates.
Each application is referred to one of sixteen technical (examining) areas and then assigned to a particular examiner for thorough review and action. The application's assignment to an examiner is entered into the data base by scanning the examiner's bar-coded identification number and then scanning the serial number label on the file folder.
During the course of processing an application, additional information is recorded in the data base by (a) key entering or scanning a transaction number, (b) key entering or scanning any variable data, and (c) scanning the application folder's bar-coded serial number. The scanning of the bar-coded serial number causes the data to be t ransmitted to the computer, where each transaction is subjected to a series of logic checks. A double beep signal and associated display on the terminal indicate to the user that the transaction has been validated and accepted into t he data base. Transmission of the data and the audible signal of acceptance take only a few seconds. If a transaction is not accepted
- 23 -
by the system, a colored light on the terminal indicates an error and a numeric code indicating the nature of the error is displayed.
When the examiner takes an action requiring correspondence, the correspondence is prepared exclusive of the header information. The correspondence is then inserted into an on-line printer and, when the application's bar-coded serial number is scanned, the header information is automatically printed. The header includes such key information as name and address, serial number, filing date, and title of invention. When the purpose of the correspondence is to provide notice that a patent will be issued, the system automatically calculates and prints on the correspondence the fees due. This computer controlled addressing process also ensures that the mailing date printed on the document and that maintained in the data base for aging purposes are identical.
The entire system is designed around the high degree of accuracy provided by bar code scanning. In order to maintain the integrity of the system, it is of primary importance that transactions update the proper data base record, that transactions for each application be performed in the proper sequence, and that correspondence be properly prepared and forwarded.
Implementation of the bar code system for patent applications was planned to take place in three phases: (a) building the data base structure and loading on the bibliographic information for each application, (b) implementing on-line input of information on location, status and examiner's actions, and (c) providing for more detailed application status reporting. The last phase is currently being developed. Planned enhancements to the system include more refined productivity measurement, automated monitoring of workflow in order to identify where backlogs begin to form, and automatic scheduling of examiner workload. As time and resources permit, the Office will extend the system to include identification and tracking of trademark applications.
Due to the efficiencies of this automation project utilizing bar code technology, there have been 27 staff years eliminated to date.
5. U. S. Postal Service--Code 39
The Research and Development Center of the U. S. Postal Service is developing a bar code system for identifying, routing and tracking registered mail as it moves through the Postal Service system. Based on the volumes of registered mail processed at each of the 38,000 post offices, it is anticipated that approximately 12,000 post offices would use this system.
The system will use Code 39. Clerks at the participating post offices will be provided a supply of sequentially numbered bar-coded labels. The Postal Service has purchased a label
- 24 -

printer and will generate its own supply of labels. The system utilizes a two-part label for each item of registered mail. Part one is a label showing a 14 character unique identification number in bar code and human readable form, as illustrated below:
LABEL - PART 1 m ~check digit
~Ly-1V/" seqUen~al z'irf code of post office
item number where mail is originating
Part two is a label bearing the 14 character identification number in human readable form only:
LABEL - PART 2 00000032085295
Immediately upon receipt of an item to be registered, the clerk will affix a bar-coded label (Part 1 above) to the item and one of the corresponding labels (Part 2 above) to the customer's receipt and one to the clerk's receipt. Prior to forwarding the registered mail items to the next work station, the clerk scans the bar-coded labels on each item. After all registered mail is scanned, a manifest is automatically generated and forwarded on with the registered mail. This manifest is a list of each item's ident i fication number in bar code as well as human readable form. Upon receipt at the next station, the bar codes listed on the manifest and the labels on the accompanying items are scanned and a comparison is automatically made to ensure that all registered mail t hat was forwarded was received.
The system also utilizes a bar-coded label that has been affixed to the individual sorting bins for each destination postal facil i ty. This label bears the zip code, in bar code and human readable form, for each destination postal facility.
At the sorting operation, a clerk inserts the mail into the proper destination bin. When mail bags are being prepared for forwarding mail to its next postal facility, the label on the bin is scanned and this identification becomes the header record for another manifest that will be automatically generated by scanning all registered mail items that are put into the mail bag. This manife st is generated in triplicate. Two copies go inside the mail bag and one is retained by the sending postal facility.
At the receiving postal facility, the bar codes on the registered mail are scanned as the items are removed from the mail
- 25 -

bag and the accompanying manifest is scanned, item by item. The system automatically compares the items received to the items listed on the manifest. The system will detect any discrepancies and signal an error message. Items received, but not appearing on the manifest, and vice versa, will be investigated with the originating postal facility.
It is anticipated that implementation of this system will result in a 50 percent savings in staff hours for receiving and processing registered mail at the originating post offices and a 30 percent savings in the overall process from receipt to delivery. In addition, the system will greatly enhance operational efficiency and accountability by providing a complete audit trail for each item being tracked.
6. Department of State--Modified Plessy Code
The Department of State has developed a "Post Property System," designed to automate the existing, mostly manual property system and to standardize personal property accountability and control procedures at the Department's 200 Foreign Service posts. The system will be installed in conjunction with the major, Departmental effort to acquire and install mini-computers at posts overseas. An integral element in the system, for approximately 50 of the 200 posts, is the use of bar codes for property identification and physical inventories.
A prototype of the bar code application was tested and implemented in Prague in 1978. The Department plans to expand the use of bar codes to 22 additional posts by July 1983. Of all the subsystems of the Post Property System that have been or are being tested, the bar code application for property identification has been the most readily accepted and the most cost effective.
The data base for the system contains approximately 70,000 individual records for office and household furnishings, equipment and supplies; virtually all of these items will be identified by bar-coded labels. For nonexpendable property, the label will show a unique property number for each item; for expendable supplies, the label will show the stock number.
Unique property identification numbers are sequentially assigned upon receipt of each nonexpendable item, and an individual locator inventory record is created. A label, showing the identification number in bar code and human readable form, is issued and affixed to the item. For expendable supplies and equipment, a bar-coded stock number label is issued when the very first quantity of that type of item is received at a location. The stock number label is affixed to the shelf or bin where the items will be stored.
- 26 -
The bar code used in the system is Modified Plessy. Port able, hand- held terminals with optical scanning wands are used for data capture. The most significant problem experienced in purchasing the hardware for the bar code application was finding a label and adhesive that would stick to practically any surface (draperies, glass, etc.).
When conducting a physical inventory, the data on each bar-coded label are "read" with the optical scanning wand attached to the terminal . Additional related data, such as location, condition, and quantity (for expendable supplies) must be key entered on the terminal. The data are stored in the terminal and subsequently transmitted, over telephone lines, to the Post Property System file. The system will automatically check the transmitted data against the data currently in the file and will produce a report of data discrepancies.
The application of bar code technology to the inventory process has greatly reduced the time and resources required to satisfy the annual inventory requirement, and the Department believes it will be instrumental in reducing the frequency of theft by making more frequent inventories possible.
- 27 -
JOINT FINANCIAL MANAGEMENT IMPROVEMENT PROGRAM
666 ELEVENTH STREET, N.W. SUITE 705
WASIUNGTON, D.C. 20001
OFFICIAL BUSINESS PENALTY FOR PRIVATE USE SlOO
.. m............. (tJ V.S . g!lN E""'" ACCOUNTING O ...... IC I[
US.MAIL.