bantleon anleihenfonds
TRANSCRIPT

BANTLEON ANLEIHENFONDS
Annual report
as of 30 November 2020
A multiple compartment or umbrella investment fund (fonds commun de placement à compartiments multiples) according to part I of the Luxembourg Law
of 17 December 2010 on Undertakings for Collective Investment.
R.C.S. Lux K 785

BANTLEON ANLEIHENFONDS
Contents
Organisation structure 4
Notes to the report 5 - 6
Derivative exposure 7
Risk Measures 7 - 8
Remuneration policy of the capital management company 9
Remuneration policy of the investment manager 9
Report of the capital management company 10 - 11
Notes to the statement of assets 12 - 17
Consolidated statement of assets 18
Consolidated statement of operations 19
Consolidated statement of changes in net assets 20
BANTLEON ANLEIHENFONDS - Bantleon Return
Balance sheet 21
Statement of assets 22 - 25
Derivatives 26
Statement of operations 27
Statement of changes in net assets 28
Comparison with the last three financial years 29 - 32
BANTLEON ANLEIHENFONDS - Bantleon Yield
Balance sheet 33
Statement of assets 34 - 40
Derivatives 41
Statement of operations 42
Statement of changes in net assets 43
Comparison with the last three financial years 44 - 46
BANTLEON ANLEIHENFONDS - Bantleon Yield Plus
Balance sheet 47
Statement of assets 48 - 53
Derivatives 54
Statement of operations 55
Statement of changes in net assets 56
Comparison with the last three financial years 57 - 59
Page 2

BANTLEON ANLEIHENFONDS
Contents
BANTLEON ANLEIHENFONDS - Bantleon Diversified Duration (liquidated)
Statement of operations 60
Statement of changes in net assets 61
Comparison with the last three financial years 62 - 63
Report by the Réviseur d'Entreprises agréé 64 - 65
Page 3

BANTLEON ANLEIHENFONDS
Organisation structure
Capital management company Paying agencies Cabinet de révision agréé
BANTLEON AG Grand Duchy of Luxembourg KPMG Luxembourg, Société coopérative
Aegidientorplatz 2a, D - 30159 Hanover 39, avenue John F. Kennedy, L - 1855 Luxembourg
UBS Europe SE, Luxembourg Branch
Supervisory Board of the capital management company 33A, avenue John F. Kennedy, L - 1855 Luxembourg
Dr Harald Preissler (Chairman) (from 1 October 2020) Federal Republic of Germany Jörg Bantleon (Chairman) (until 30 September 2020)
Werner A. Schubiger (until 31 December 2019) UBS Europe SE
Marcel Rösch (from 1 January 2020) Bockenheimer Landstrasse 2-4, D - 60306 Frankfurt am Main
Werner Kellner
AustriaBoard of Directors of the capital management company
Erste Bank der österreichischen Sparkassen AG
Jörg Schubert Graben 21, A - 1010 Vienna
Marcel Rösch (until 31 December 2019)
Sebastian Finke (from 1 January 2020) Switzerland
Custodian UBS Switzerland AG
Bahnhofstrasse 45, CH - 8001 Zurich
UBS Europe SE, Luxembourg Branch and its offices in Switzerland
33A, avenue John F. Kennedy, L - 1855 Luxembourg
Distributors
Central Administration Office
Federal Republic of Germany Universal-Investment-Luxembourg S.A.,
15 rue de Flaxweiler, L - 6776 Grevenmacher BANTLEON AG
Aegidientorplatz 2a, D - 30159 Hanover
Register and transfer office
AustriaEuropean Fund Administration S.A.,
2, rue d'Alsace, L - 1122 Luxembourg Erste Bank der österreichischen Sparkassen AG
Graben 21, A - 1010 Vienna
Investment Manager
SwitzerlandBANTLEON BANK AG
Bahnhofstrasse 2, CH - 6300 Zug BANTLEON BANK AG
Bahnhofstrasse 2, CH - 6300 Zug
Page 4

BANTLEON ANLEIHENFONDS
Notes to the report
Dear Sir/Madam,
We are pleased to present the annual report of the BANTLEON ANLEIHENFONDS with its sub-funds Bantleon Return, Bantleon Yield, Bantleon Yield Plus and Bantleon Diversified Duration (liquidated).
The report covers the period from 1 December 2019 to 30 November 2020.
The BANTLEON ANLEIHENFONDS ("the Fund") was established on 1 March 2000 for an indefinite period as a mutual fund in the legal form of a Fonds Commun de Placement (FCP), in accordance with part I of the Luxembourg Law of
30 March 1988 on Undertakings for Collective Investment. It is designed as an umbrella fund. Since 1 July 2011, it has been subject to part I of the Luxembourg Law of 17 December 2010 on Undertakings for Collective Investment (the "Law of
17 December 2010"). The Fund and its sub-funds comply with Directive 2009/65/EC of the European Parliament and of the Council (the "UCITS Directive").
Different sub-funds are offered to investors under the same Fund. The capital management company has the right to add further sub-funds or to liqudate and merge existing sub-funds.
The Fund is a legally dependent investment fund comprising interest-bearing securities, receivables from credit institutions and derivatives, which is administered by the capital management company in compliance with the principle of
risk spreading.
The sub-funds are legally and economically independent of each other. With respect to third parties and in particular creditors, each sub-fund is only liable for its own obligations. The sub-funds are admitted for public distribution in Luxembourg,
Germany and Austria. The Bantleon Return, Bantleon Yield and Bantleon Yield Plus sub-funds are also approved for public distribution in Switzerland. In addition, Bantleon Yield is admitted for public distribution in Spain.
The Bantleon Diversified Duration sub-fund (liquidated) was liquidated as of 4 September 2020.
Universal-Investment-Luxembourg S.A., as the central administration agent, is responsible for the general administrative tasks that are necessary within the framework of fund management and prescribed by Luxembourg law. These services
mainly include the accounting of the sub-funds, valuation of the sub-fund's assets, calculation of the net asset value and preparation of the annual and semi-annual reports as well as other central administration activities required by Luxembourg
law.
Page 5

BANTLEON ANLEIHENFONDS
Sub-fund ISIN Fund assets in EUR Price development in %
BANTLEON ANLEIHENFONDS - Bantleon Return IA LU0109659770 162,908,155.70 0.22
BANTLEON ANLEIHENFONDS - Bantleon Return IT LU0524467833 1,160,045.03 0.22
BANTLEON ANLEIHENFONDS - Bantleon Return PA LU0430091412 5,029,992.22 -0.13
BANTLEON ANLEIHENFONDS - Bantleon Return PT LU0524467676 1,976,691.38 -0.11
BANTLEON ANLEIHENFONDS - Bantleon Yield IA LU0261192784 388,539,409.30 1.16
BANTLEON ANLEIHENFONDS - Bantleon Yield PA LU0261193329 26,499,509.74 0.75
BANTLEON ANLEIHENFONDS - Bantleon Yield PT LU0524467916 3,638,774.37 0.74
BANTLEON ANLEIHENFONDS - Bantleon Yield Plus IA LU0973990855 41,525,650.80 1.33
BANTLEON ANLEIHENFONDS - Bantleon Yield Plus IT LU0973993016 42,438,995.82 1.32
BANTLEON ANLEIHENFONDS - Bantleon Yield Plus PA LU0973995813 1,813,678.81 0.88
LU0150854106 13,812,525.56 -2.64
LU0524468211 972.68 -2.60
BANTLEON ANLEIHENFONDS - Bantleon Return IA EUR 0.651400 per unit
BANTLEON ANLEIHENFONDS - Bantleon Return PA EUR 0.601100 per unit
BANTLEON ANLEIHENFONDS - Bantleon Yield IA EUR 1.053300 per unit
BANTLEON ANLEIHENFONDS - Bantleon Yield PA EUR 1.038900 per unit
BANTLEON ANLEIHENFONDS - Bantleon Yield Plus IA EUR 1.518600 per unit
BANTLEON ANLEIHENFONDS - Bantleon Yield Plus PA EUR 1.515800 per unit
BANTLEON ANLEIHENFONDS - Bantleon Diversified Duration (liquidated) IA EUR 0.974900 per unit
BANTLEON ANLEIHENFONDS - Bantleon Return IA EUR 0.547000 per unit
BANTLEON ANLEIHENFONDS - Bantleon Return PA EUR 0.503000 per unit
BANTLEON ANLEIHENFONDS - Bantleon Yield IA EUR 0.812100 per unit
BANTLEON ANLEIHENFONDS - Bantleon Yield PA EUR 0.797300 per unit
BANTLEON ANLEIHENFONDS - Bantleon Yield Plus IA EUR 1.144100 per unit
BANTLEON ANLEIHENFONDS - Bantleon Yield Plus PA EUR 1.137000 per unit
As at 30 November 2020, the Fund's assets and the performance of the Fund in the period under review are as follows:
Distribution as of 9 December 2020 (value date 16 December 2020)
BANTLEON ANLEIHENFONDS - Bantleon Diversified Duration (liquidated) IA (until 4 September 2020)
BANTLEON ANLEIHENFONDS - Bantleon Diversified Duration (liquidated) IT (until 4 September 2020)
Distribution as of 12 December 2019
Page 6

BANTLEON ANLEIHENFONDS
Bantleon Return 0.00%
Bantleon Yield 0.00%
Bantleon Yield Plus 0.16%
Key risk figures (unaudited)
Bantleon Return and Bantleon Yield
Bantleon Yield Plus
Method for determining the overall risk
Derivative-free comparative assets: 100.00% ICE BofA EMU Broad Market Total Return
The following utilisation of the VaR limit was determined in the reporting period:
Lowest utilisation: 0.24%
Highest utilisation: 1.12%
Average utilisation: 0.78%
The commitment approach (simple approach) was used to monitor all derivative positions for Bantleon Return and Bantleon Yield. Accordingly, the total amount of derivative positions may not exceed 100% of the net asset value.
During the reporting period, the average leverage effect calculated was 1.14 using the gross method and 1.06 using the commitment method.
The value-at-risk calculation of the fund was carried out using historical simulation on the basis of individual securities. An observation period of one year, a confidence interval of 99% and a holding period of one day was chosen for the
calculation.
The calculations are in accordance with the risk management procedure of the capital management company, which involves the description of all framework conditions, processes, measures, activities and structures that are necessary for the
efficient and effective implementation and further development of the risk management and risk reporting system.
Overall risk was monitored using the relative value-at-risk approach from 1 December 2019 to 31 January 2020 and using the absolute value-at-risk approach from 1 February 2020 to 30 November 2020. Under the absolute VaR approach, the
VaR (99% confidence level, 20 day holding period, 1 year observation period) of the Fund may not exceed more than 20.00% of Fund assets.
Leverage is calculated using the Sum of Notionals method as defined in the CESR/10-788 Directive, without taking into account any netting or hedging effects. In this context, a leverage of 100% should be understood as an unleveraged portfolio.
As of 30 November 2020, the exposure for derivatives was:
Derivative exposure (unaudited)
Page 7

BANTLEON ANLEIHENFONDS
Key risk figures (unaudited)
Bantleon Diversified Duration (liquidated)
Method for determining the overall risk
The following utilisation of the VaR limit was determined in the reporting period:
Lowest utilisation: 0.00%
Highest utilisation: 0.76%
Average utilisation: 0.34%
In the reporting period, the average leverage effect calculated was1.52 using the gross method and the commitment method.
The value-at-risk calculation of the fund was carried out using historical simulation on the basis of individual securities. An observation period of one year, a confidence interval of 99% and a holding period of one day was chosen for the
calculation.
The calculations are in accordance with the risk management procedure of the capital management company, which involves the description of all framework conditions, processes, measures, activities and structures that are necessary for the
efficient and effective implementation and further development of the risk management and risk reporting system.
In the period from 1 December 2019 to 4 September 2020, the absolute value-at-risk approach was used to monitor the overall risk. Under the absolute VaR approach, the VaR (99% confidence level, 20 day holding period, 1 year observation
period) of the Fund may not exceed more than 20.00% of Fund assets.
Leverage is calculated using the Sum of Notionals method as defined in the CESR/10-788 Directive, without taking into account any netting or hedging effects. In this context, a leverage of 100% should be understood as an unleveraged portfolio.
Page 8

BANTLEON ANLEIHENFONDS
Remuneration policy of the capital management company (unaudited)
Total employee remuneration paid by the company in the past financial year: EUR 2,886,011.91
- of which fixed salary EUR 2,504,209.51
- of which variable compensation EUR 381,802.40
Number of employees at the company 18 full-time equivalents
Amount of carried interest paid n/a
Total remuneration paid to risk takers by the company in the past financial year: EUR 1,377,042.28
- Of which, managing directors EUR 315,804.24
- Of which other risk carriers EUR 839,884.13
- Of which employees with controlling roles EUR 221,353.91
Remuneration policy of the investment manager (unaudited)
Total employee remuneration paid by the company in the past financial year: EUR 1,964,440.29
- of which fixed salary EUR 1,605,115.46
- of which variable compensation EUR 359,324.83
Number of employees at the company 26 full-time equivalents
Amount of carried interest paid n/a
Total remuneration paid to risk takers by the company in the past financial year: EUR 1,216,863.05
- Of which, managing directors EUR 264,129.65
- Of which other risk carriers EUR 627,021.49
- Of which employees with controlling roles EUR 108,655.24
- Of which employees in the same salary bracket EUR 217,056.67
Information on employee compensation (as of 31 December 2019) is provided below:
The figures are pro-rated values calculated in accordance with the ESMA requirements in Q & A, Application of the UCITS Directive, Section IX, question 1
Information on employee compensation (as of 31 December 2019) is provided below:
The Board of Directors of the capital management company has adopted principles for remuneration, the aim of which is to ensure that the remuneration complies with the applicable regulatory requirements, specifically the regulations
according to (i) Section 37 of the German Investment Code (KAGB), (ii) UCITS Directive 2014/91/EU and (iii) the ESMA final report on a sound remuneration policy according to the UCITS Directive announced on 31 March 2016. These
remuneration principles are reviewed at least once a year. This review has not given rise to any objections.
The remuneration of the employees of the capital management company consists of a fixed and a variable component. Both components are proportionate and do not provide incentives to take risks that are incompatible with the risk profiles
and investment conditions of funds managed by the capital management company. The fixed component is high enough to enable a flexible policy regarding the variable component up to complete waiver.
All relevant information is given in accordance with the provisions of UCITS Directive 2014/91/EU. Investors can find further information about the remuneration principles, including a description of the method of calculation of remuneration
and fringe benefits, the details of the persons responsible for the allocation of remuneration and fringe benefits, etc. at www.bantleon.com.
The remuneration principles promote a sound and effective risk management environment, are consistent with the interests of investors and discourage the assumption of risks that are not consistent with the risk profiles, fund rules or
statutes of the funds managed by the capital management company. The remuneration principles are consistent with the business strategy, objectives, values and interests of the capital management company and the funds it manages or
the investors in such funds, and also include measures to avoid conflicts of interest.
Page 9

BANTLEON ANLEIHENFONDS
The financial markets began 2020 with great confidence. There were signs of a ceasefire (phase 1 deal) in the trade dispute between the US and China, and in the UK, Boris Johnson's clear victory ended the confusion surrounding Brexit – at
least temporarily. At the same time, many leading economic indicators turned upwards. The foundation was laid for a global economic upswing.
Overall, the financial markets once again inspired hope and faith in an economic turnaround. In addition, evidence was growing that the number of new infections was declining. From the end of March onwards, the stabilisation on the stock
exchanges thus quickly evolved into a dynamic recovery. At the same time, risk spreads on bond markets began to narrow again. Many observers were initially sceptical about the price upswing. There was frequent talk of a "bull trap". However,
there was no longer any stopping the move towards risk-on. The upward trend on equity markets (or the narrowing in spreads) eventually continued – with occasional fluctuations – until the end of November.
Report of the capital management company as of 30 November 2020
But the economic data also fuelled risk assets in the second half of the year. What few thought possible actually happened: the global economic recovery was V-shaped. The historic economic downturn in the second quarter was followed by an
equally spectacular resurgence in the third.
Monetary and fiscal policy stimuli repeatedly provided a tailwind. The agreement on a EUR 750 billion reconstruction fund marked a downright historic decision by the EU in July. For the first time, the European countries have jointly taken on a
large amount of debt, distributing the funds mainly to Southern and Eastern Europe.
The risk-on sentiment was, however, spread very unevenly across sectors and regions. The US stock exchanges, and especially the NASDAQ, spearheaded the surge. The technology companies listed on these markets benefited not only from
the upturn, but also from the digitalisation trend. As a result, the NASDAQ reached its first all-time high in June. The S&P500 followed in August. European stock exchanges and the emerging markets, on the other hand, lagged significantly
behind.
This only changed somewhat when Joe Biden was elected the new President of the United States on 3 November. Although the victor was not immediately certain, Donald Trump's anticipated departure was greeted with great relief in Europe and
Asia. Overall, once the US elections were over and with the prospect of vaccines becoming available soon, a weight seemed to fall from the markets. November 2020 subsequently became one of the best stock market months of recent decades.
The MSCI World gained around 13%, and the EuroStoxx50 as much as 18%.
This positive environment provided lasting stimulus to equity markets. In mid-February, numerous stock market barometers marked new cyclical or even record highs. Investors were not initially alarmed by the first reports of a novel coronavirus
that was wreaking havoc in the Chinese mega-city of Wuhan. Like the SARS virus, they hoped it would remain confined to China and Asia, causing at best a temporary dip in global growth.
However, this proved to be a fallacy by the end of February at the latest. The virus had arrived in Italy with a vengeance and led the government there to impose a lockdown. But it did not end there. Around the globe, the economy was shut down
to stop the spread of the virus. This global lockdown caused the worst economic collapse since World War II. Quarter on quarter, GDP slumped by almost 12% in the eurozone and by just under 8% in the US in Q2.
When it became clear that SARS-CoV-2 was a global pandemic rather than a local epidemic, panic spread in the stock markets. Between 20 February and 23 March, stock exchanges around the world fell by 35% measured against the MSCI
World. This was the biggest stock market crash since the financial crisis. Back then, however, the downward trend was even stronger (60%) and the bear market duration was considerably longer, lasting one and a half years.
In addition to shares, other risk assets also came under pressure. For example, the risk premiums for EUR high yields soared from around 300 bp to 865 bp within a month, marking an eight-year high.
After this look into the abyss, however, the situation stabilised unexpectedly quickly thanks to concerted unprecedented monetary and fiscal policy measures. For example, on 23 March, the Fed made a promise to buy unlimited government
bonds, and then acquired securities worth more than USD 2 trillion in the space of a few weeks. The US government also adopted several fiscal packages of roughly the same size to prop up consumer demand and protect companies from
bankruptcy. Not to be outdone, the ECB launched an emergency programme (PEPP) worth EUR 750 billion (which ultimately rose to EUR 1,850 billion) that allowed it the greatest possible flexibility when purchasing securities. Finally, the German
Federal Government also gave up on the "black zero" policy and pledged unlimited loans for the economy.
Page 10

BANTLEON ANLEIHENFONDS
However, the massive intervention by central banks put an end to the surge in yields. In particular the Fed's promise to buy as many government bonds as needed (see above) prompted a trend reversal. From the end of March onwards, yields
started trending downwards, which in the case of federal bonds continued more or less until the end of the reporting period. On 30 November, 10-year federal bonds were yielding around 0.60%. The ECB remained key to developments,
absorbing most of the newly issued federal bonds in 2020. In view of this, federal bonds were able to resist the risk-on-sentiment in November.
That was not the case with US Treasuries where the downwards yield trend ended in July and gradually moved to a flat upward trend, leading 10-year yields from +0.50% to +0.97% in early November.
Out of nowhere, however, yields suddenly began to rise sharply. By 19 March, 10-year federal yields had jumped to -0.14%. Their US counterparts climbed from +0.31% to +1.27%. It was therefore one of the sharpest increases in yields in recent
years. This was partly due to the ECB refraining from cutting interest rates at its meeting on 12 March, thereby disappointing market expectations. On the other hand, many investors were facing such liquidity problems that they simply had to sell
all assets – including safe havens.
Despite Europe racing to catch up at the end of the reporting period, the basic distribution of performance on the stock exchanges did not change. The clear winner over the past 12 months was the NASDAQ with its total return of 42% (in USD);
Chinese stocks stood at 32% and the S&P500 at 17%. By contrast, the EuroStoxx50 was still in the red (-3%).
Government bond markets did not experience as volatile a roller-coaster ride as the stock exchanges. Risk-off began here in mid-January as the signs of a pandemic increased. Starting from -0.16%, yields on 10-year federal bonds gradually fell.
At the high point of the crisis, they finally reached -0.91%. This was partly due to the implosion of the oil price, which even slipped into negative territory on occasion (WTI).
Report of the capital management company as of 30 November 2020
Nevertheless, the risk-on-sentiment, which had been increasingly prominent since April, also affected the bond markets. Risk spreads narrowed in all market segments. This was particularly true of European high-yields, whose yield advantage
(compared to government bonds) slipped from 865 bp to 376 bp. In addition, investment grade corporate bonds also rallied. The risk premiums here declined from 240 bp to 94 bp. The trend was similar for Italian government bonds, whose
average yield advantage decreased from 267 bp to 91 bp. Even European covered bonds rode the wave of success with interest rate premiums falling from 57 bp to 30 bp. Overall over the past 12 months, the individual bond segments performed
very similarly. German bunds, EUR corporate bonds, EUR high yields and EUR covered bonds all generated a return of between 1% and 3%.
All the sub-funds of the BANTLEON ANLEIHENFONDS were able to participate in the positive developments of the European bond markets during the reporting period (29 November 2019 to 30 November 2020). Positive returns were achieved
without exception, despite extremely low or largely negative interest rates.
On 11 March 2020, the World Health Organization declared the COVID-19 outbreak a pandemic. Persistent concerns about the impact of the virus on the global economy and – as a result – the uncertainty regarding the valuation of investments
in this report could therefore lead to significant deviations from the actual value if the investments were to be sold now. Significant market corrections as well as increased volatility in recent months may have a significant impact on the Fund in
terms of future investment valuation. The relevant bodies will closely monitor the further developments at national and international level, particularly with regard to the economic impact on the Fund.
Page 11

BANTLEON ANLEIHENFONDS
a)
b)
c)
d)
e)
f)
g)
h)
Notes to the statement of assets and liabilities as at 30 November 2020
Significant accounting policies
The value of a unit ("unit value") is denominated in the currency specified in the prospectus ("Fund currency"). It is calculated by the management company under the supervision of the custodian for each full banking day which is a trading day in
both Luxembourg and Frankfurt am Main ("valuation date"). The calculation is performed by dividing the sub-fund's assets by the number of units of the sub-fund in circulation on the valuation day. In order to counter the practices of Late Trading
and Market Timing, the calculation will take place after the deadline for the acceptance of subscription and/or redemption requests, as specified in the Prospectus.
The value of the net assets of the Fund is calculated according to the following principles:
The Fund and reporting currency is the euro (EUR). The currency of all sub-funds is the euro (EUR).
The financial statements have been prepared in accordance with the legal provisions and regulations applicable in Luxembourg concerning the preparation and presentation of financial statements and on an on-going concern principle.
General information
The financial year begins on 1 December and ends on 30 November of the following year.
The BANTLEON ANLEIHENFONDS ("the Fund") was established on 1 March 2000 for an indefinite period as a mutual fund in the legal form of a Fonds Commun de Placement (FCP), in accordance with part I of the Luxembourg Law of 30 March
1988 on Undertakings for Collective Investment. It is designed as an umbrella fund. Since 1 July 2011, it has been subject to part I of the Luxembourg Law of 17 December 2010 on Undertakings for Collective Investment (the "Law of
17 December 2010"). The Fund and its sub-funds comply with Directive 2009/65/EC of the European Parliament and of the Council (the "UCITS Directive").
Bantleon Return, Bantleon Yield and Bantleon Yield Plus are sub-funds of the BANTLEON ANLEIHENFONDS. The sub-funds are aimed at both institutional investors and retail investors who wish to participate in the specialisation of BANTLEON.
The Bantleon Diversified Duration sub-fund (liquidated) was liquidated as of 4 September 2020.
The investment manager of the BANTLEON ANLEIHENFONDS is BANTLEON BANK AG, which specialises in institutional investments with a focus on capital preservation. Administration is the responsibility of BANTLEON AG, a subsidiary of
BANTLEON BANK AG. The Fund assets are held in custody as separate assets and are therefore economically separate from the custodian and the investment manager. The custodian is UBS Europe SE, Luxembourg Branch.
Bantleon Return is based on BANTLEON's immunisation strategy, optimising the yield of high-quality bonds along the entire yield curve. It aims to fully exploit earnings potential through close integration of duration adjustment, yield curve
management, spread management and inflation indexation.
Within BANTLEON's immunisation strategy, Bantleon Yield is focusing increasingly on maximising interest income and spread management. Investments are made in bonds along the entire yield curve.
Within BANTLEON's immunisation strategy, Bantleon Yield Plus is focusing increasingly on maximising interest income and spread management. Investments are made in a broad range of bonds – including non-investment-grade bonds – along
the entire yield curve, and in funds with an investment focus in this area.
Listed bonds are valued at the last available paid price.
Bonds from issues which are not listed on a stock exchange but which are traded on a regulated market are valued at a price which may not be lower than the bid price and may not be higher than the ask price at the valuation date and
which the capital management company considers to be the best possible price at which the bonds can be sold. If the prices referred to in (a) and (b) above are not in line with market conditions or the bonds are from new issues that have
not yet been listed on a stock exchange and are not yet traded on another regulated market, the corresponding bonds are measured at their respective market value. The market value is determined by the capital management company in
good faith and in accordance with generally accepted valuation rules that can be verified by auditors.
Units in UCITS or UCIs are generally valued at the last redemption price established prior to the valuation date or at the last available price which ensures a reliable valuation. If the redemption of investment units is suspended or no
redemption prices are fixed, these units, as well as all other assets, are valued at the respective market value as determined by the capital management company in good faith in accordance with generally accepted and verifiable valuation
rules.
Listed interest rate derivatives and currencies are valued at the last known market prices.
Credit default swaps and total return swaps are measured at their current value taking all cash flows into account. The valuation is carried out by the custodian and in consultation with the counterparty.
Cash and cash equivalents are measured at nominal value plus accrued interest.
All commissions and costs, with the exception of the issuing surcharge, are deferred from the Fund inventory on each valuation date and deducted from the respective unit value.
Currency futures are measured consistently at the last available value in accordance with the guidelines laid down by the Supervisory Board.
Page 12

BANTLEON ANLEIHENFONDS
Notes to the statement of assets and liabilities as at 30 November 2020
BANTLEON ANLEIHENFONDS - Bantleon Return IT
Price
1.6229
1.5498
1.0828
0.8958
24.1063
10.5926
1.7014
91.4837
1.1961
BANTLEON ANLEIHENFONDS - Bantleon Diversified Duration (liquidated) IA (until 4 September 2020)
BANTLEON ANLEIHENFONDS - Bantleon Diversified Duration (liquidated) IT (until 4 September 2020)
The following sub-funds use the swing pricing procedure:
BANTLEON ANLEIHENFONDS - Bantleon Return IA
BANTLEON ANLEIHENFONDS - Bantleon Return PA
BANTLEON ANLEIHENFONDS - Bantleon Return PT
BANTLEON ANLEIHENFONDS - Bantleon Yield Plus PA
BANTLEON ANLEIHENFONDS - Bantleon Yield IA
BANTLEON ANLEIHENFONDS - Bantleon Yield PA
BANTLEON ANLEIHENFONDS - Bantleon Yield PT
BANTLEON ANLEIHENFONDS - Bantleon Yield Plus IA
BANTLEON ANLEIHENFONDS - Bantleon Yield Plus IT
Exchange rates
As at 30 November 2020, foreign currency positions were valued at the following exchange rates:
Currency
EUR - USD
EUR - AUD
EUR - CAD
EUR - GBP
EUR - MXN
EUR - NOK
EUR - CHF
EUR - NZD
EUR - RUB
A sub-fund may suffer a dilution of the net asset value per unit as a result of investors buying or selling units in a sub-fund at a price which does not reflect trading costs and other expenses incurred as a result of the investment manager entering
into securities transactions to account for cash inflows and/or outflows. In order to counteract this dilution effect and to safeguard the interests of the unitholders, a so-called "swing pricing procedure" is applied in relation to the sub-funds of the
capital management company. This procedure works as follows:
If, on a valuation date, the total net inflows or outflows of a sub-fund exceed a predetermined threshold, the net asset value per unit may be adjusted upwards or downwards to reflect the anticipated costs. The limit is regularly reviewed for each
sub-fund and adjusted if necessary. The amount of the respective net inflows and outflows is calculated on the basis of the most recent information available at the time the net asset value is calculated. The amount of the price adjustment is
determined based on the sub-fund’s trading costs and other costs. Such adjustment may vary from one sub-fund to another and will not exceed up to 2% of the original net asset value per unit. The price adjustment applicable to a particular sub-
fund is available upon request from the capital management company.
Information on the swing pricing procedure
Page 13

BANTLEON ANLEIHENFONDS
Notes to the statement of assets and liabilities as at 30 November 2020
All-in fee
Bantleon Return IA 0.20% p.a.
Bantleon Return IT 0.20% p.a.
Bantleon Return PA 0.50% p.a.
Bantleon Return PT 0.50% p.a.
Bantleon Yield IA 0.33% p.a.
Bantleon Yield PA 0.70% p.a.
Bantleon Yield PT 0.70% p.a.
Bantleon Yield Plus IA 0.40% p.a.
Bantleon Yield Plus IT 0.40% p.a.
Bantleon Yield Plus PA 0.80% p.a.
Bantleon Diversified Duration (liquidated) IA (until 4 September 2020) 0.20% p.a.
Bantleon Diversified Duration (liquidated) IT (until 4 September 2020) 0.20% p.a.
Bantleon Diversified Duration (liquidated)
Bantleon Return, Bantleon Yield and Bantleon Yield Plus
No performance fee
Performance fee
A performance fee of no more than 10% of increases in the unit performance exceeding the benchmark (1-month Euribor, at least 0%) ("hurdle rate") is charged in relation to the net asset value. The assessment period is the period from the
introduction of the performance fee to the end of the next financial year, after which it corresponds to the period from the end of one financial year to the end of the following financial year. The "high water mark" principle applies from the time the
performance fee is introduced.
Further, performance-oriented additional remuneration (performance fee) may also be charged if provided for in the special regulations of the sales prospectus of the sub-fund.
Commission and costs
The flat-rate commission includes all costs incurred by the custodian, the management and transfer office, the capital management company, the distributor, notification and registration with the supervisory authorities, the audit company, the
preparation and distribution of annual and semi-annual reports, the preparation and distribution of all other reports and documentation, sales documents and prospectuses, accounting, determination of the unit price on each exchange trading day
and its publication, legal advice to the capital management company, preparation and filing of the administrative regulations and KIID.
The following flat-rate commission was charged to the sub-funds:
Sub-fund
A commission is charged to the sub-fund in accordance with the respective special regulations of the sales prospectus (all-in fee).
Page 14

BANTLEON ANLEIHENFONDS
Notes to the statement of assets and liabilities as at 30 November 2020
Transaction costs in EUR
Bantleon Return 824.23
Bantleon Yield 1,770.77
Bantleon Yield Plus 4,042.45
Bantleon Diversified Duration (liquidated) (until 4 September 2020) 2,941.50
TOR (%)
(1 December 2019 - 30 November 2020)
Bantleon Return 95.69
Bantleon Yield 50.48
Bantleon Yield Plus 127.39
Bantleon Diversified Duration (liquidated) (until 4 September 2020) 100.37
During the reporting period:
Sub-fund
The absolute portfolio turnover rate (TOR) is the ratio between securities purchases and sales, cash inflows and outflows, and average Fund assets for the reporting period above.
Portfolio turnover rate (TOR)
Transaction costs
For the reporting period ending on 30 November 2020, the following transaction costs were incurred by BANTLEON ANLEIHENFONDS and its sub-funds in connection with the purchase and sale of securities, money market papers, derivatives or
other assets:
Transaction costs include, in particular, broker and agent commissions, clearing fees and third-party fees (e.g. exchange fees, local taxes and fees, registration and transfer fees).
Sub-fund
Page 15

BANTLEON ANLEIHENFONDS
Notes to the statement of assets and liabilities as at 30 November 2020
OGC (%) **) OGC (%)
Bantleon Return IA 0.21 0.21
Bantleon Return IT 0.21 0.21
Bantleon Return PA 0.55 0.55
Bantleon Return PT 0.55 0.55
Bantleon Yield IA 0.35 0.35
Bantleon Yield PA 0.76 0.76
Bantleon Yield PT 0.76 0.76
Bantleon Yield Plus IA 0.46 0.46
Bantleon Yield Plus IT 0.45 0.45
Bantleon Yield Plus PA 0.90 0.90
Bantleon Diversified Duration (liquidated) IA (until 4 September 2020) 0.25 0.25
Bantleon Diversified Duration (liquidated) IT (until 4 September 2020) 0.21 0.21
Information in accordance to Regulation (EU) 2015/2365 on transparency of securities financing transactions and of reuse and amending Regulation (EU) No 648/2012 - disclosure according to Section A
In Luxembourg, the sub-funds must pay a capital tax ("subscription tax") on their respective net assets at a rate of 0.01% p.a. for units of classes with registered share capital "IA" and "IT" (institutional investors) and 0.05% p.a. for units of classes
with registered share capital "PA" and "PT" (private investors) and "FA", "FT", "RA" and "RT". Interest income on net assets is not subject to any separate taxation in Luxembourg.
The tax mentioned is payable quarterly on the net fund assets reported at the end of each quarter.
Publications
The issue and redemption prices of each sub-fund are available for information purposes at the registered office of the capital management company, the custodian and the paying agents of the Fund abroad and are published in accordance with
the legal provisions of each country in which the units are authorised for public distribution and on the website of the capital management company (www.bantleon.com). The net asset value of each sub-fund can be obtained from the registered
office of the capital management company and is also published on the capital management company's website.
Changes in the securities portfolio
Other publications or notices addressed to unitholders will be published in at least one Luxembourg daily newspaper and in accordance with the laws of each country in which the units are authorised for public distribution.
***) In the event of a shortened financial year, the OGC are annualised.
**) Excluding ongoing fees of target funds.
*) If the Fund invests at least 20% of its assets in target funds, composite OGC are calculated.
Effective total cost burden (ongoing charges (OGC)) *) ***)
During the reporting period:
Sub-fund
During the reporting period, there were no securities financing transactions and total return swaps in accordance with the above-mentioned legal provision.
The changes in the securities portfolio during the reporting period are available, free of charge, at the registered office of the capital management company, through the custodian and through any paying agent.
Taxation
Page 16

BANTLEON ANLEIHENFONDS
Notes to the statement of assets and liabilities as at 30 November 2020
No
No
No
No
No
No
Are there any plans to wind up individual sub-funds?
Have there been or are there any operational difficulties?
Have there been massive outflows of funds?
Have payments been disrupted?
Events after the balance sheet date
In connection with the coronavirus pandemic, it is possible that special events may occur, such as a suspension of unit certificate transactions or unit price calculations, or massive cash outflows with subsequent liquidity bottlenecks, after the
balance sheet date.
An analysis at (sub-) fund level after the balance sheet date up to the date of the audit certificate produced the following findings:
Have there been any suspensions in the Fund price calculation or in unit certificate transactions?
Are there liquidity problems?
Page 17

BANTLEON ANLEIHENFONDS
Consolidated statement of assets as at 30/11/2020
Daily value
in EUR
% share
of fund assets *)
Assets
Bonds 668,437,620.67 98.95
Derivatives 90,511.68 0.01
Bank balances 4,682,260.15 0.69
Other assets 3,418,486.42 0.51
Total assets 676,628,878.92 100.16
Equity and liabilities
Interest payable -33,801.98 -0.01
All-in fee liabilities -924,340.13 -0.14
Subscription tax (taxe d'abonnement) liabilities -139,833.63 -0.02
Total liabilities -1,097,975.74 -0.16
Fund assets 675,530,903.18 100.00
*) As the per cent holding is rounded off for purposes of calculation, marginal rounding differences can occur.
The consolidated statement of assets, the consolidated statement of operations and the consolidated statement of changes in
net assets are made up of the total of all sub-funds.
The notes to the statement of assets are an integral part of the annual report. Page 18

BANTLEON ANLEIHENFONDS
Consolidated statement of operations (including income equalisation)
for the period from 01/12/2019 to 30/11/2020Total
I. Income
- Interest from securities EUR 7,387,020.11
- Interest from liquidity investments *) EUR -42,249.16
- Other income EUR 4,931.70
Total income EUR 7,349,702.65
II. Expenses
- Interest from short-term borrowing EUR -14,457.45
- All-in fee EUR -2,234,033.18
- Taxe d`abonnement EUR -83,735.48
- Foreign withholding tax EUR -29,268.62
- Compensation of expenses EUR 16,382.39
- Other expenses EUR -84,839.52
Total expenses EUR -2,429,951.87
III. Ordinary net result EUR 4,919,750.79
IV. Disposals
1. Realised gains from EUR 6,327,927.28
- Securities transactions EUR 3,788,681.74
- Forward exchange transactions EUR 451,886.61
- Financial futures contracts EUR 1,793,090.69
- Swaps EUR 258,896.63
- Foreign exchange EUR 35,371.62
2. Realised losses from EUR -9,381,453.60
- Securities transactions EUR -5,862,551.64
- Forward exchange transactions EUR -400,007.13
- Financial futures contracts EUR -2,448,099.85
- Swaps EUR -472,879.64
- Foreign exchange EUR -197,915.33
3. Realised result on subscriptions/redemptions **) 23,462.56
Realised result EUR -3,030,063.76
V. Net change in unrealised gains/losses
- Net change in unrealised gains EUR 4,020,691.79
- Net change in unrealised losses EUR -495,814.28
Net change in unrealised profits EUR 3,524,877.51
VI. Result of the reporting period EUR 5,414,564.54
*) The "Interest from liquidity investments" includes negative credit interest in the amount of EUR 46,086.30.
**) The item realised result from subscriptions/redemptions shows effects of swing pricing. More detailed information on swing pricing can be found in the notes.
The notes to the statement of assets are an integral part of the annual report. Page 19

BANTLEON ANLEIHENFONDS
Consolidated statement of changes in net assets 2019/2020I. Value of the Fund at the beginning of the reporting period EUR 696,277,907.80
1. Distribution for the previous year EUR -5,838,646.10
2. Interim distributions EUR 0.00
3. Inflow/outflow of funds (net) EUR -20,294,092.26
a) Cash inflows from unit certificate sales EUR 74,617,768.92
b) Cash outflows from unit certificate redemptions *) EUR -94,911,861.17
4. Income/expense equalisation EUR -28,830.80
5. Result of the reporting period **) EUR 5,414,564.54
II. Net asset value at the end of the financial year EUR 675,530,903.18
*) Cash outflows from unit certificate redemptions includes the Fund assets of the BANTLEON ANLEIHENFONDS - Bantleon Diversified Duration (liquidated) sub-fund,
which has been wound up as of the last valuation date 04/09/2020, in the amount of EUR 13,813,498.24.
**) This amount includes the effects of swing pricing for subscriptions and redemptions. More detailed information on swing pricing can be found in the notes.
The notes to the statement of assets are an integral part of the annual report. Page 20

BANTLEON ANLEIHENFONDS - Bantleon Return
Balance sheet as at 30/11/2020
Investment focus
Daily value
in EUR
% share
of Fund assets *)
I. Assets 171,265,994.91 100.11
1. Bonds 169,918,137.08 99.32
2. Derivatives -9,240.00 -0.01
3. Bank balances 574,213.69 0.34
4. Other assets 782,884.14 0.46
II. Liabilities -191,110.59 -0.11
III. Fund assets 171,074,884.32 100.00
*) As the per cent holding is rounded off for purposes of calculation, marginal rounding differences can occur.
Page 21

BANTLEON ANLEIHENFONDS - Bantleon Return
Statement of assets as at 30/11/2020
Description ISIN Quantity or Holdings Currency Price Market value %
Shares or 30/11/2020 in EUR of the Fund
% in 1,000 assets *)
Portfolio holdings EUR 169,918,137.08 99.32
Exchange-traded securities EUR 169,918,137.08 99.32
Interest-bearing securities EUR 169,918,137.08 99.32
0.0100 % AXA Bank Europe SCF EO-Med.-Term Obl.Fonc.2020(27) FR0013478047 % 400 EUR 102.410 409,640.00 0.24
0.1250 % BPCE SFH EO-Med.-T.Obl.Fin.Hab.2020(25) FR0013505096 % 1,000 EUR 102.693 1,026,930.00 0.60
6.5000 % Bundesrep.Deutschland Anl.v.1997 (2027) DE0001135044 % 1,200 EUR 149.146 1,789,752.00 1.05
5.6250 % Bundesrep.Deutschland Anl.v.1998 (2028) DE0001135069 % 2,400 EUR 146.343 3,512,232.00 2.05
4.7500 % Bundesrep.Deutschland Anl.v.1998(2028) II.Ausgabe DE0001135085 % 2,000 EUR 142.730 2,854,600.00 1.67
6.2500 % Bundesrep.Deutschland Anl.v.2000(2030) DE0001135143 % 1,100 EUR 164.807 1,812,877.00 1.06
2.0000 % Bundesrep.Deutschland Anl.v.2013 (2023) DE0001102325 % 2,000 EUR 107.625 2,152,500.00 1.26
1.7500 % Bundesrep.Deutschland Anl.v.2014 (2024) DE0001102333 % 4,300 EUR 108.254 4,654,922.00 2.72
1.5000 % Bundesrep.Deutschland Anl.v.2014 (2024) DE0001102358 % 4,300 EUR 108.004 4,644,172.00 2.71
1.0000 % Bundesrep.Deutschland Anl.v.2014 (2024) DE0001102366 % 3,900 EUR 106.714 4,161,846.00 2.43
1.0000 % Bundesrep.Deutschland Anl.v.2015 (2025) DE0001102382 % 4,000 EUR 108.486 4,339,440.00 2.54
0.5000 % Bundesrep.Deutschland Anl.v.2015 (2025) DE0001102374 % 4,900 EUR 105.475 5,168,275.00 3.02
0.0000 % Bundesrep.Deutschland Anl.v.2016 (2026) **) DE0001102408 % 2,000 EUR 104.380 2,087,600.00 1.22
0.5000 % Bundesrep.Deutschland Anl.v.2017 (2027) DE0001102424 % 4,600 EUR 108.418 4,987,228.00 2.92
0.2500 % Bundesrep.Deutschland Anl.v.2017 (2027) DE0001102416 % 4,700 EUR 106.291 4,995,677.00 2.92
0.2500 % Bundesrep.Deutschland Anl.v.2018 (2028) DE0001102457 % 4,800 EUR 107.378 5,154,144.00 3.01
0.5000 % Bundesrep.Deutschland Anl.v.2018 (2028) DE0001102440 % 4,400 EUR 108.900 4,791,600.00 2.80
0.0000 % Bundesrep.Deutschland Anl.v.2019 (2029) DE0001102473 % 5,900 EUR 105.688 6,235,592.00 3.64
0.2500 % Bundesrep.Deutschland Anl.v.2019 (2029) DE0001102465 % 4,900 EUR 107.689 5,276,761.00 3.08
0.0000 % Bundesrep.Deutschland Anl.v.2020 (2027) DE0001102523 % 2,600 EUR 104.935 2,728,310.00 1.59
0.0000 % Bundesrep.Deutschland Anl.v.2020 (2030) DE0001102507 % 4,000 EUR 105.717 4,228,680.00 2.47
0.0000 % Bundesrep.Deutschland Anl.v.2020 (2030) DE0001102499 % 4,500 EUR 105.729 4,757,805.00 2.78
0.0000 % Bundesrep.Deutschland Anl.v.2020 (2030) DE0001030708 % 1,600 EUR 105.969 1,695,504.00 0.99
0.0000 % Bundesrep.Deutschland Bundesobl.Ser.177 v.2018(23) DE0001141778 % 2,000 EUR 101.844 2,036,880.00 1.19
0.0000 % Bundesrep.Deutschland Bundesobl.Ser.178 v.2018(23) DE0001141786 % 2,000 EUR 102.275 2,045,500.00 1.20
0.0000 % Bundesrep.Deutschland Bundesobl.Ser.179 v.2019(24) DE0001141794 % 2,200 EUR 102.640 2,258,080.00 1.32
0.0000 % Bundesrep.Deutschland Bundesobl.Ser.180 v.2019(24) DE0001141802 % 4,600 EUR 103.024 4,739,104.00 2.77
0.0000 % Bundesrep.Deutschland Bundesobl.Ser.181 v.2020(25) DE0001141810 % 3,700 EUR 103.385 3,825,245.00 2.24
0.0000 % Bundesrep.Deutschland Bundesobl.Ser.182 v.2020(25) DE0001141828 % 1,500 EUR 103.748 1,556,220.00 0.91
0.5000 % Bundesrep.Deutschland Inflationsindex. Anl.v.14(30) DE0001030559 % 1,400 EUR 126.607 1,772,501.98 1.04
0.1000 % Bundesrep.Deutschland Inflationsindex. Anl.v.15(26) DE0001030567 % 1,600 EUR 114.087 1,825,386.10 1.07
0.2000 % Cie de Financement Foncier EO-Med.-T. Obl.Fonc. 2017(22) FR0013256427 % 3,000 EUR 101.279 3,038,370.00 1.78
0.7500 % Cie de Financement Foncier EO-Med.-T. Obl.Fonc. 2018(26) FR0013336286 % 1,200 EUR 106.502 1,278,024.00 0.75
0.2500 % Cie de Financement Foncier EO-Med.-T.Obl.Fonc. 2016(22) FR0013135282 % 1,500 EUR 100.985 1,514,775.00 0.89
0.6250 % Cie de Financement Foncier EO-Med.-T.Obl.Fonc.2014(21) FR0012299394 % 2,000 EUR 101.074 2,021,480.00 1.18
The notes to the statement of assets are an integral part of the annual report. Page 22

BANTLEON ANLEIHENFONDS - Bantleon Return
Statement of assets as at 30/11/2020
Description ISIN Quantity or Holdings Currency Price Market value %
Shares or 30/11/2020 in EUR of the Fund
% in 1,000 assets *)
4.1250 % CIF Euromortgage EO-Med.-T.Obl.Foncières 11(22) FR0011053255 % 1,000 EUR 105.220 1,052,200.00 0.62
0.5000 % Crédit Agricole Home Loan SFH EO-Med.-T.Obl.Fin.Hab.2018(26) FR0013310059 % 2,000 EUR 104.952 2,099,040.00 1.23
0.5000 % Crédit Mutuel Home Loan SFH SA EO-Med.-T.Obl.Fin.Hab.2015(22) FR0012452217 % 1,000 EUR 101.174 1,011,740.00 0.59
0.0500 % Deutsche Pfandbriefbank AG MTN-HPF Reihe 15272 v.17(22) DE000A2E4ZE9 % 2,000 EUR 100.990 2,019,800.00 1.18
0.2500 % Deutsche Pfandbriefbank AG MTN-HPF Reihe 15277 v.18(23) DE000A2GSLF9 % 1,000 EUR 101.737 1,017,370.00 0.59
0.6250 % Deutsche Pfandbriefbank AG MTN-HPF Reihe 15283 v.18(27) DE000A2GSLV6 % 2,500 EUR 106.741 2,668,525.00 1.56
2.3750 % Deutsche Pfandbriefbank AG MTN-OPF R25059 v.13(28) DE000A1R06C5 % 1,500 EUR 120.477 1,807,155.00 1.06
0.6250 % Dexia Crédit Local S.A. EO-Medium-Term Notes 2015(22) XS1169977896 % 2,000 EUR 101.337 2,026,740.00 1.18
0.7500 % Dexia Crédit Local S.A. EO-Medium-Term Notes 2016(23) XS1348774644 % 1,000 EUR 102.689 1,026,890.00 0.60
0.6250 % Dexia Crédit Local S.A. EO-Medium-Term Notes 2019(26) XS1936137139 % 1,000 EUR 104.698 1,046,980.00 0.61
0.3750 % DZ HYP AG MTN-Hyp.Pfbr.377 16(25) [WL] DE000A2AASB4 % 2,700 EUR 103.867 2,804,409.00 1.64
3.5000 % Erste Group Bank AG EO-MT. Hyp.Pf. 2012(22) 1075 XS0743547183 % 5,000 EUR 104.776 5,238,800.00 3.06
0.7500 % Hamburg Commercial Bank AG HYPF v.14(21)TR.A DIP S.2234 DE000HSH4UX4 % 2,000 EUR 101.054 2,021,080.00 1.18
0.7500 % Hamburg Commercial Bank AG HYPF v.15(22)TR.A DIP S.2419 DE000HSH40E5 % 3,000 EUR 101.910 3,057,300.00 1.79
0.3750 % Hamburg Commercial Bank AG HYPF v.18(23) SER.2693 DE000HSH6K16 % 1,500 EUR 102.204 1,533,060.00 0.90
0.0100 % HYPO TIROL BANK AG EO-Med.-T.Hyp.Pf.-Br. 2019(26) AT0000A2AYL3 % 1,000 EUR 102.143 1,021,430.00 0.60
1.6250 % KA Finanz AG EO-Medium-Term Notes 2014(21) XS1033673440 % 2,000 EUR 100.450 2,009,000.00 1.17
1.5000 % Kreditanst.f.Wiederaufbau Anl.v.2014 (2024) DE000A1R0709 % 500 EUR 107.623 538,115.00 0.31
0.1750 % NATIXIS Pfandbriefbank AG MTN-HPF Ser.30 v.16(26) DE000A14J0H9 % 1,000 EUR 103.166 1,031,660.00 0.60
0.3750 % NATIXIS Pfandbriefbank AG MTN-HPF Ser.32 v.18(23) DE000A14J0K3 % 2,000 EUR 102.007 2,040,140.00 1.19
0.5000 % Niedersachsen, Land Landessch.v.16(26) Ausg.863 DE000A2AAWN1 % 1,500 EUR 105.609 1,584,135.00 0.93
0.3750 % Niedersachsen, Land Landessch.v.18(26) Ausg.878 DE000A2G9G15 % 1,000 EUR 104.614 1,046,140.00 0.61
0.2500 % Nordea Mortgage Bank PLC EO-Med.-Term Cov. Bds 2016(23) XS1522968277 % 1,000 EUR 102.406 1,024,060.00 0.60
0.0250 % Nordea Mortgage Bank PLC EO-Med.-Term Cov. Bds 2017(22) XS1554271590 % 1,500 EUR 100.689 1,510,335.00 0.88
0.2500 % OP-Asuntoluottopankki Oyj EO-Cov. Med.-Term Nts 2016(23) XS1408380803 % 1,500 EUR 102.018 1,530,270.00 0.89
0.3750 % Raiffeisenl.Niederöst.-Wien AG EO-Medium-Term Notes 2017(24) XS1681119167 % 3,000 EUR 103.257 3,097,710.00 1.81
0.1250 % Sp Mortgage Bank PLC EO-Med.-Term Cov. Bds 2017(22) XS1705691563 % 4,000 EUR 101.152 4,046,080.00 2.37
0.0500 % Sp Mortgage Bank PLC EO-Med.-Term Cov. Bds 2019(26) XS2014370915 % 500 EUR 102.308 511,540.00 0.30
0.2500 % SpareBank 1 Boligkreditt AS EO-M.-T. Mortg.Cov.Bds 16(26) XS1482554075 % 1,000 EUR 103.662 1,036,620.00 0.61
0.2750 % Van Lanschot Kempen W.M. NV EO-MT Covered Bonds 2015(22) XS1224002474 % 3,500 EUR 101.016 3,535,560.00 2.07
0.3750 % Van Lanschot Kempen W.M. NV EO-MT Covered Bonds 2016(23) XS1387192435 % 2,500 EUR 101.864 2,546,600.00 1.49
Total securities assets EUR 169,918,137.08 99.32
Derivatives EUR -9,240.00 -0.01
The notes to the statement of assets are an integral part of the annual report. Page 23

BANTLEON ANLEIHENFONDS - Bantleon Return
Statement of assets as at 30/11/2020
Description ISIN Quantity or Holdings Currency Price Market value %
Shares or 30/11/2020 in EUR of the Fund
% in 1,000 assets *)
Bank balances, non-securitised money market instruments and money market funds EUR 574,213.69 0.34
Bank balances EUR 574,213.69 0.34
Balances with UBS Europe SE
Balances in the Fund currency
568,753.69 EUR 568,753.69 0.33
Balances in the Fund currency (Variation Margin)
5,460.00 EUR 5,460.00 0.00
Other assets EUR 782,884.14 0.46
Interest claims 782,884.14 EUR 782,884.14 0.46
Liabilities EUR -191,110.59 -0.11
All-in fee -155,940.53 EUR -155,940.53 -0.09
Taxe d’abonnement -35,170.06 EUR -35,170.06 -0.02
Fund assets EUR 171,074,884.32 100.00
Bantleon Return IA
Unit value EUR 109.93
Issuing price 1)
EUR 109.93
Redemption price 1)
EUR 109.93
Units in circulation Quantity 1,481,973.815
Bantleon Return IT
Unit value EUR 117.32
Issuing price 1)
EUR 117.32
Redemption price 1)
EUR 117.32
Units in circulation Quantity 9,888.000
Bantleon Return PA
Unit value EUR 100.76
Issuing price 1)
EUR 100.76
Redemption price 1)
EUR 100.76
Units in circulation Quantity 49,919.762
The notes to the statement of assets are an integral part of the annual report. Page 24

BANTLEON ANLEIHENFONDS - Bantleon Return
Statement of assets as at 30/11/2020
Description ISIN Quantity or Holdings Currency Price Market value %
Shares or 30/11/2020 in EUR of the Fund
% in 1,000 assets *)
Bantleon Return PT
Unit value EUR 112.97
Issuing price 1)
EUR 112.97
Redemption price 1)
EUR 112.97
Units in circulation Quantity 17,497.843
1) The issue and redemption prices shown are swing prices. More detailed information on swing pricing can be found in the notes.
*) As the per cent holding is rounded off for purposes of calculation, marginal rounding differences can occur.
**) Of which 1,000 have been provided as collateral
The notes to the statement of assets are an integral part of the annual report. Page 25

BANTLEON ANLEIHENFONDS - Bantleon Return
Derivatives as of 30/11/2020
Financial futures contracts as of 30/11/2020 Acquisition
Name Maturity Quantity Currency price Price Daily rate Liability Unrealised Results
in currency in currency in EUR in EUR
FUTURE EURO-BUND 12/20 EUREX 12.08.2020 -27.00 EUR 175.0465 175.3900 4,735,530.00 -9,240.00
Total financial futures contracts -9,240.00
Total derivatives -9,240.00
Page 26

BANTLEON ANLEIHENFONDS - Bantleon Return
Statement of operations (including income equalisation)
for the period from 01/12/2019 to 30/11/2020Total
I. Income
- Interest from securities EUR 1,236,870.63
- Interest from liquidity investments *) EUR -2,090.48
Total income EUR 1,234,780.15
II. Expenses
- Interest from short-term borrowing EUR -1,943.46
- All-in fee EUR -372,081.72
- Taxe d`abonnement EUR -20,839.86
- Compensation of expenses EUR 9,355.94
- Other expenses EUR -47.87
Total expenses EUR -385,556.97
III. Ordinary net result EUR 849,223.18
IV. Disposals
1. Realised gains from EUR 1,186,379.50
- Securities transactions EUR 962,411.59
- Financial futures contracts EUR 223,967.47
- Foreign exchange EUR 0.44
2. Realised losses from EUR -1,704,241.02
- Securities transactions EUR -1,346,273.22
- Financial futures contracts EUR -357,967.80
3. Realised result on subscriptions/redemptions **) 1,847.04
Realised result EUR -516,014.48
V. Net change in unrealised gains/losses
- Net change in unrealised gains EUR -228,197.29
- Net change in unrealised losses EUR 287,497.93
Net change in unrealised profits EUR 59,300.64
VI. Result of the reporting period EUR 392,509.33
*) The "Interest from liquidity investments" includes negative credit interest in the amount of EUR 2,090.48.
**) The item realised result from subscriptions/redemptions shows effects of swing pricing. More detailed information on swing pricing can be found in the notes.
The notes to the statement of assets are an integral part of the annual report. Page 27
BANTLEON ANLEIHENFONDS - Bantleon Return
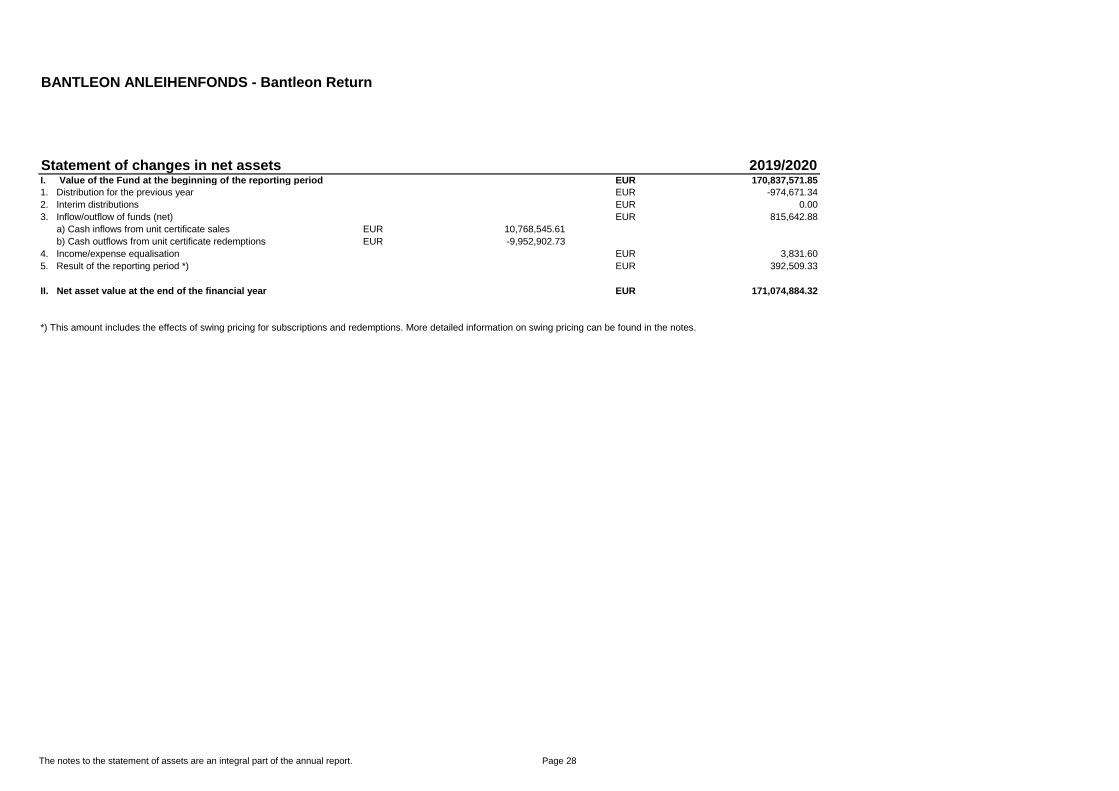
Statement of changes in net assets 2019/2020I. Value of the Fund at the beginning of the reporting period EUR 170,837,571.85
1. Distribution for the previous year EUR -974,671.34
2. Interim distributions EUR 0.00
3. Inflow/outflow of funds (net) EUR 815,642.88
a) Cash inflows from unit certificate sales EUR 10,768,545.61
b) Cash outflows from unit certificate redemptions EUR -9,952,902.73
4. Income/expense equalisation EUR 3,831.60
5. Result of the reporting period *) EUR 392,509.33
II. Net asset value at the end of the financial year EUR 171,074,884.32
*) This amount includes the effects of swing pricing for subscriptions and redemptions. More detailed information on swing pricing can be found in the notes.
The notes to the statement of assets are an integral part of the annual report. Page 28

BANTLEON ANLEIHENFONDS - Bantleon Return
Bantleon Return IA
Comparison with the last three financial years
Financial year Units in circulation at the Fund assets at the Unit value at the
end of the financial year end of the financial year end of the financial year
30/11/2018 Quantity 1,447,375.746 EUR 158,610,747.59 EUR 109.59
31/05/2019 Quantity 1,446,755.116 EUR 159,529,475.25 EUR 110.27
30/11/2019 Quantity 1,444,709.815 EUR 159,408,360.78 EUR 110.34
30/11/2020 Quantity 1,481,973.815 EUR 162,908,155.68 EUR 109.93
Change in the number of units in circulation in the reporting period Quantity
Units in circulation at the beginning of the reporting period 1,444,709.815
Units issued 73,968.000
Units redeemed -36,704.000
Units in circulation in the end of the reporting period 1,481,973.815
Page 29

BANTLEON ANLEIHENFONDS - Bantleon Return
Bantleon Return IT
Comparison with the last three financial years
Financial year Units in circulation at the Fund assets at the Unit value at the
end of the financial year end of the financial year end of the financial year
30/11/2018 Quantity 57,865.020 EUR 6,660,702.70 EUR 115.11
31/05/2019 Quantity 18,755.020 EUR 2,194,094.99 EUR 116.99
30/11/2019 Quantity 21,162.000 EUR 2,477,303.43 EUR 117.06
30/11/2020 Quantity 9,888.000 EUR 1,160,045.03 EUR 117.32
Change in the number of units in circulation in the reporting period Quantity
Units in circulation at the beginning of the reporting period 21,162.000
Units issued 10,390.000
Units redeemed -21,664.000
Units in circulation in the end of the reporting period 9,888.000
Page 30

BANTLEON ANLEIHENFONDS - Bantleon Return
Bantleon Return PA
Comparison with the last three financial years
Financial year Units in circulation at the Fund assets at the Unit value at the
end of the financial year end of the financial year end of the financial year
30/11/2018 Quantity 111,072.647 EUR 11,199,480.09 EUR 100.83
31/05/2019 Quantity 121,654.821 EUR 12,358,674.07 EUR 101.59
30/11/2019 Quantity 55,634.122 EUR 5,646,157.89 EUR 101.49
30/11/2020 Quantity 49,919.762 EUR 5,029,992.22 EUR 100.76
Change in the number of units in circulation in the reporting period Quantity
Units in circulation at the beginning of the reporting period 55,634.122
Units issued 14,587.990
Units redeemed -20,302.350
Units in circulation in the end of the reporting period 49,919.762
Page 31

BANTLEON ANLEIHENFONDS - Bantleon Return
Bantleon Return PT
Comparison with the last three financial years
Financial year Units in circulation at the Fund assets at the Unit value at the
end of the financial year end of the financial year end of the financial year
30/11/2018 Quantity 25,768.843 EUR 2,875,526.47 EUR 111.59
31/05/2019 Quantity 22,803.843 EUR 2,581,892.04 EUR 113.22
30/11/2019 Quantity 29,227.843 EUR 3,305,749.75 EUR 113.10
30/11/2020 Quantity 17,497.843 EUR 1,976,691.38 EUR 112.97
Change in the number of units in circulation in the reporting period Quantity
Units in circulation at the beginning of the reporting period 29,227.843
Units issued 0.000
Units redeemed -11,730.000
Units in circulation in the end of the reporting period 17,497.843
Page 32

BANTLEON ANLEIHENFONDS - Bantleon Yield
Balance sheet as at 30/11/2020
Investment focus
Daily value
in EUR
% share
of Fund assets *)
I. Assets 419,378,295.17 100.17
1. Bonds 415,026,354.24 99.13
2. Derivatives -33,700.00 -0.01
3. Bank balances 2,269,321.06 0.54
4. Other assets 2,116,319.87 0.51
II. Liabilities -700,601.74 -0.17
III. Fund assets 418,677,693.43 100.00
*) As the per cent holding is rounded off for purposes of calculation, marginal rounding differences can occur.
Page 33

BANTLEON ANLEIHENFONDS - Bantleon Yield
Statement of assets as at 30/11/2020
Description ISIN Quantity or Holdings Currency Price Market value %
Shares or 30/11/2020 in EUR of the Fund
% in 1,000 assets *)
Portfolio holdings EUR 415,026,354.24 99.13
Exchange-traded securities EUR 401,930,831.74 96.00
Interest-bearing securities EUR 401,930,831.74 96.00
1.6080 % 2i Rete Gas S.p.A. EO-Med.-Term Notes 2017(17/27) XS1709374497 % 500 EUR 108.496 542,480.00 0.13
1.3750 % AbbVie Inc. EO-Notes 2016(16/24) XS1520899532 % 3,800 EUR 104.628 3,975,864.00 0.95
0.7500 % AbbVie Inc. EO-Notes 2019(19/27) XS2055646918 % 400 EUR 104.089 416,356.00 0.10
0.5000 % ACEA S.p.A. EO-Medium-Term Nts 2020(20/29) XS2113700921 % 1,000 EUR 100.610 1,006,100.00 0.24
0.3750 % Achmea Bank N.V. EO-M.-T.Mortg.Cov.Bds 2017(24) XS1722558258 % 4,000 EUR 103.084 4,123,360.00 0.98
0.5000 % Achmea Bank N.V. EO-M.-T.Mortg.Cov.Bds 2019(26) XS1953778807 % 4,000 EUR 104.386 4,175,440.00 1.00
0.0000 % adidas AG Anleihe v.2020(2020/2024) XS2224621347 % 500 EUR 100.895 504,475.00 0.12
0.2500 % Aegon Bank N.V. EO-Med.-Term Cov.Bds 2016(23)2 XS1418849482 % 1,300 EUR 101.709 1,322,217.00 0.32
1.0000 % Aéroports de Paris S.A. EO-Obl. 2020(20/29) FR0013522133 % 900 EUR 106.001 954,009.00 0.23
0.8750 % AIB Mortgage Bank Unlimited Co EO-Mortg.Cov. MTN 2016(23) XS1357663050 % 1,800 EUR 102.994 1,853,892.00 0.44
2.2000 % Altria Group Inc. EO-Notes 2019(19/27) XS1843443190 % 1,400 EUR 109.252 1,529,528.00 0.37
1.1250 % Anheuser-Busch InBev S.A./N.V. EO-Medium-Term Nts 2019(19/27) BE6312821612 % 2,300 EUR 107.106 2,463,438.00 0.59
0.1250 % APRR EO-Medium-Term Nts 2020(20/29) FR0013534278 % 1,700 EUR 101.084 1,718,428.00 0.41
1.5000 % Arkema S.A. EO-Med.-Term Notes 2015(15/25) FR0012452191 % 1,100 EUR 106.766 1,174,426.00 0.28
0.5410 % Asahi Group Holdings Ltd. EO-Notes 2020(20/28) XS2242747348 % 2,700 EUR 101.456 2,739,312.00 0.65
3.3750 % ASTM S.p.A. EO-Medium-Term Notes 2014(24) XS1032529205 % 2,000 EUR 108.529 2,170,580.00 0.52
2.4000 % AT & T Inc. EO-Notes 2014(14/24) XS1076018131 % 3,000 EUR 107.621 3,228,630.00 0.77
3.1250 % Aurizon Network Pty Ltd. EO-Med.-Term Nts 2016(16/26) XS1418788599 % 1,850 EUR 115.013 2,127,740.50 0.51
2.0000 % Aurizon Network Pty Ltd. EO-Medium-Term Nts 2014(24) XS1111428402 % 1,300 EUR 107.347 1,395,511.00 0.33
0.1000 % Autobahnen-Schnellstr.-Fin.-AG EO-Medium-Term Notes 2019(29) XS2024602240 % 450 EUR 103.598 466,191.00 0.11
0.0100 % AXA Bank Europe SCF EO-Med.-Term Obl.Fonc.2020(27) FR0013478047 % 1,000 EUR 102.410 1,024,100.00 0.24
1.1250 % Bayer AG EO-Anleihe v.20(20/30) XS2199266268 % 800 EUR 105.253 842,024.00 0.20
1.5000 % Bayer Capital Corp. B.V. EO-Notes 2018(18/26) XS1840618059 % 1,500 EUR 107.412 1,611,180.00 0.38
0.7500 % Bayerische Landesbank Öff.Pfandbr.v.19(29) DE000BLB6JH4 % 1,500 EUR 108.820 1,632,300.00 0.39
2.8750 % Bca Monte dei Paschi di Siena EO-Mortg.Covered MTN 2014(24) IT0005038283 % 4,000 EUR 111.183 4,447,320.00 1.06
1.2500 % Bca Monte dei Paschi di Siena EO-Mortg.Covered MTN 2015(22) IT0005140188 % 1,000 EUR 101.657 1,016,570.00 0.24
0.8750 % Bca Monte dei Paschi di Siena EO-Mortg.Covered MTN 2019(26) IT0005386922 % 1,000 EUR 105.194 1,051,940.00 0.25
0.7500 % Belfius Bank S.A. EO-Cov.Med.-Term Nts 2015(25) BE0002483585 % 2,000 EUR 105.112 2,102,240.00 0.50
0.2500 % Belfius Bank S.A. EO-Cov.Med.-Term Nts 2016(22) BE0002499748 % 1,000 EUR 100.955 1,009,550.00 0.24
0.1250 % Belfius Bank S.A. EO-M.-T.Mortg.Pandbr. 2020(30) BE0002682632 % 1,000 EUR 103.557 1,035,570.00 0.25
2.2500 % Belgien, Königreich EO-Obl. Lin. 2013(23) Ser.68 BE0000328378 % 1,000 EUR 107.684 1,076,840.00 0.26
2.6000 % Belgien, Königreich EO-Obl. Lin. 2014(24) Ser. 72 BE0000332412 % 1,000 EUR 111.902 1,119,020.00 0.27
0.8000 % Belgien, Königreich EO-Obl. Lin. 2015(25) Ser. 74 BE0000334434 % 1,000 EUR 106.779 1,067,790.00 0.26
0.2000 % Belgien, Königreich EO-Obl. Lin. 2016(23) Ser. 79 BE0000339482 % 3,000 EUR 102.640 3,079,200.00 0.74
0.8000 % Belgien, Königreich EO-Obl. Lin. 2017(27) Ser. 81 BE0000341504 % 1,800 EUR 109.132 1,964,376.00 0.47
0.8000 % Belgien, Königreich EO-Obl. Lin. 2018(28) Ser. 85 BE0000345547 % 1,000 EUR 110.108 1,101,080.00 0.26
The notes to the statement of assets are an integral part of the annual report. Page 34

BANTLEON ANLEIHENFONDS - Bantleon Yield
Statement of assets as at 30/11/2020
Description ISIN Quantity or Holdings Currency Price Market value %
Shares or 30/11/2020 in EUR of the Fund
% in 1,000 assets *)
0.9000 % Belgien, Königreich EO-Obl. Lin. 2019(29) BE0000347568 % 500 EUR 111.729 558,645.00 0.13
0.0100 % Berlin Hyp AG Hyp.-Pfandbr. v.20(28) DE000BHY0GD1 % 2,300 EUR 102.793 2,364,239.00 0.56
2.3750 % Booking Holdings Inc. EO-Notes 2014(14/24) XS1112850125 % 3,700 EUR 108.201 4,003,437.00 0.96
0.8310 % BP Capital Markets PLC EO-Medium-Term Nts 2019(27) XS1992931508 % 2,000 EUR 104.645 2,092,900.00 0.50
1.7500 % BPCE SFH EO-Med.-T.Obl.Fin.Hab.2014(24) FR0011993518 % 3,000 EUR 108.107 3,243,210.00 0.77
0.0100 % BPCE SFH EO-Med.-T.Obl.Fin.Hab.2019(26) FR0013459047 % 1,100 EUR 102.529 1,127,819.00 0.27
2.0000 % BRISA-Concessao Rodoviaria. SA EO-Medium-Term Notes 2016(23) PTBSSJOM0014 % 1,500 EUR 104.550 1,568,250.00 0.37
1.7500 % British Telecommunications PLC EO-Med.-Term Notes 2016(16/26) XS1377679961 % 1,500 EUR 108.508 1,627,620.00 0.39
0.5000 % Bundesrep.Deutschland Anl.v.2015 (2025) DE0001102374 % 300 EUR 105.475 316,425.00 0.08
0.2500 % Bundesrep.Deutschland Anl.v.2018 (2028) DE0001102457 % 1,500 EUR 107.378 1,610,670.00 0.38
0.5000 % Bundesrep.Deutschland Anl.v.2018 (2028) DE0001102440 % 1,000 EUR 108.900 1,089,000.00 0.26
0.5000 % Bundesrep.Deutschland Inflationsindex. Anl.v.14(30) DE0001030559 % 3,300 EUR 126.607 4,178,040.38 1.00
0.1000 % Bundesrep.Deutschland Inflationsindex. Anl.v.15(26) DE0001030567 % 3,700 EUR 114.087 4,221,205.36 1.01
2.5000 % Carlsberg Breweries A/S EO-Medium-Term Nts 2014(24/24) XS1071713470 % 2,000 EUR 108.665 2,173,300.00 0.52
0.6250 % Carlsberg Breweries A/S EO-Medium-Term Nts 2020(29/30) XS2133071774 % 600 EUR 102.189 613,134.00 0.15
0.7500 % Carrefour S.A. EO-Med.-Term Notes 2016(16/24) XS1401331753 % 300 EUR 102.827 308,481.00 0.07
0.8750 % Cie de Financement Foncier EO-Med.-T. Obl.Fonc. 2018(28) FR0013358843 % 2,000 EUR 109.503 2,190,060.00 0.52
4.0000 % Cie de Financement Foncier EO-Med.-T.Obl.Foncières 10(25) FR0010913749 % 2,000 EUR 122.027 2,440,540.00 0.58
4.2500 % Cie de Financement Foncier EO-Med.-T.Obl.Foncières 12(22) FR0011181171 % 500 EUR 105.427 527,135.00 0.13
0.7500 % CK Hutchison Grp Tele.Fin. SA EO-Notes 2019(26/26) XS2057069093 % 1,000 EUR 103.320 1,033,200.00 0.25
0.1250 % Coca-Cola Co., The EO-Notes 2020(20/29) XS2233154538 % 1,200 EUR 100.781 1,209,372.00 0.29
0.5000 % Crédit Agricole Home Loan SFH EO-Med.-T.Obl.Fin.Hab.2018(26) FR0013310059 % 3,000 EUR 104.952 3,148,560.00 0.75
0.8750 % Credito Emiliano S.p.A. EO-Mortg.Covered Bds 2014(21) IT0005066763 % 5,000 EUR 101.165 5,058,250.00 1.21
0.3750 % Daimler AG Medium Term Notes v.19(26) DE000A2YNZW8 % 1,500 EUR 101.271 1,519,065.00 0.36
0.6250 % Daimler Intl Finance B.V. EO-Medium-Term Notes 2019(27) DE000A2R9ZU9 % 1,200 EUR 102.432 1,229,184.00 0.29
0.7500 % De Volksbank N.V. EO-M.-T. Mortg.Cov.Bds 17(27) XS1614202049 % 1,000 EUR 107.329 1,073,290.00 0.26
0.5000 % De Volksbank N.V. EO-M.-T. Mortg.Cov.Bds 19(26) XS1943455185 % 2,000 EUR 104.794 2,095,880.00 0.50
0.2500 % Deutsche Pfandbriefbank AG MTN-HPF Reihe 15277 v.18(23) DE000A2GSLF9 % 4,000 EUR 101.737 4,069,480.00 0.97
0.6250 % Deutsche Pfandbriefbank AG MTN-HPF Reihe 15283 v.18(27) DE000A2GSLV6 % 3,000 EUR 106.741 3,202,230.00 0.76
0.6250 % Dexia Crédit Local S.A. EO-Medium-Term Notes 2017(24) XS1559352437 % 1,000 EUR 103.465 1,034,650.00 0.25
0.3750 % DZ HYP AG MTN-Hyp.Pfbr.377 16(25) [WL] DE000A2AASB4 % 2,500 EUR 103.867 2,596,675.00 0.62
0.3750 % E.ON SE Medium Term Notes v.20(27/27) XS2103014291 % 1,500 EUR 102.924 1,543,860.00 0.37
1.8750 % Edenred S.A. EO-Notes 2017(17/27) FR0013247202 % 2,000 EUR 111.347 2,226,940.00 0.53
1.1250 % EDP Finance B.V. EO-Medium-Term Notes 2016(24) XS1471646965 % 1,500 EUR 103.767 1,556,505.00 0.37
0.3750 % ENEL Finance Intl N.V. EO-Med.-Term Notes 2019(19/27) XS2066706909 % 1,500 EUR 102.073 1,531,095.00 0.37
0.6250 % Erste Group Bank AG EO-Med.-T. HPF 2017(27) 1544 XS1550203183 % 500 EUR 106.393 531,965.00 0.13
3.5000 % Erste Group Bank AG EO-MT. Hyp.Pf. 2012(22) 1075 XS0743547183 % 1,700 EUR 104.776 1,781,192.00 0.43
2.2500 % Frankreich EO-OAT 2011(22) FR0011337880 % 1,000 EUR 105.689 1,056,890.00 0.25
2.7500 % Frankreich EO-OAT 2012(27) FR0011317783 % 1,000 EUR 123.248 1,232,480.00 0.29
1.7500 % Frankreich EO-OAT 2013(23) FR0011486067 % 3,000 EUR 106.179 3,185,370.00 0.76
2.2500 % Frankreich EO-OAT 2013(24) FR0011619436 % 5,000 EUR 110.396 5,519,800.00 1.32
1.7500 % Frankreich EO-OAT 2014(24) FR0011962398 % 1,000 EUR 109.845 1,098,450.00 0.26
The notes to the statement of assets are an integral part of the annual report. Page 35

BANTLEON ANLEIHENFONDS - Bantleon Yield
Statement of assets as at 30/11/2020
Description ISIN Quantity or Holdings Currency Price Market value %
Shares or 30/11/2020 in EUR of the Fund
% in 1,000 assets *)
1.0000 % Frankreich EO-OAT 2015(25) FR0012938116 % 2,000 EUR 108.325 2,166,500.00 0.52
0.5000 % Frankreich EO-OAT 2015(25) FR0012517027 % 5,000 EUR 105.270 5,263,500.00 1.26
0.2500 % Frankreich EO-OAT 2016(26) **) FR0013200813 % 5,700 EUR 105.101 5,990,757.00 1.43
0.0000 % Frankreich EO-OAT 2017(23) FR0013283686 % 3,000 EUR 101.650 3,049,500.00 0.73
1.0000 % Frankreich EO-OAT 2017(27) FR0013250560 % 2,500 EUR 110.304 2,757,600.00 0.66
0.7500 % Frankreich EO-OAT 2017(28) FR0013286192 % 1,500 EUR 109.576 1,643,640.00 0.39
0.7500 % Frankreich EO-OAT 2018(28) FR0013341682 % 2,000 EUR 110.008 2,200,160.00 0.53
0.0000 % Frankreich EO-OAT 2019(29) FR0013451507 % 2,000 EUR 103.671 2,073,420.00 0.50
0.5000 % Frankreich EO-OAT 2019(29) FR0013407236 % 1,100 EUR 108.153 1,189,683.00 0.28
0.7500 % Hamburg Commercial Bank AG HYPF v.15(22)TR.A DIP S.2419 DE000HSH40E5 % 4,000 EUR 101.910 4,076,400.00 0.97
0.3750 % Hamburg Commercial Bank AG HYPF v.18(23) SER.2693 DE000HSH6K16 % 1,000 EUR 102.204 1,022,040.00 0.24
1.5000 % HeidelbergCement AG Medium Term Notes v.16(16/25) XS1529515584 % 3,750 EUR 105.792 3,967,200.00 0.95
0.0100 % HYPO NOE LB f. Nied.u.Wien AG EO-Publ.Covered MTN 2019(26) XS2057917366 % 2,100 EUR 102.375 2,149,875.00 0.51
0.0100 % HYPO TIROL BANK AG EO-Med.-T.Hyp.Pf.-Br. 2019(26) AT0000A2AYL3 % 2,000 EUR 102.143 2,042,860.00 0.49
0.3750 % Hypo Vorarlberg Bank AG EO-M.-T.Hyp.-Pfandbr.2017(24) XS1613238457 % 2,000 EUR 102.937 2,058,740.00 0.49
1.1250 % Iberdrola International B.V. EO-Medium-Term Notes 2016(26) XS1398476793 % 2,000 EUR 106.570 2,131,400.00 0.51
1.3750 % Imperial Brands Finance PLC EO-Med.-Term Notes 2017(17/25) XS1558013360 % 3,500 EUR 104.388 3,653,580.00 0.87
1.8750 % ING Bank N.V. EO-Med.-Term Cov. Bds 2013(23) XS0935034651 % 2,700 EUR 105.977 2,861,379.00 0.68
1.7500 % Intl Flavors & Fragrances Inc. EO-Notes 2016(16/24) XS1319817323 % 650 EUR 105.763 687,459.50 0.16
0.8750 % Iren S.p.A. EO-Medium-Term Notes 2016(24) XS1511781467 % 2,500 EUR 103.272 2,581,800.00 0.62
1.0000 % Irland EO-Treasury Bonds 2016(26) IE00BV8C9418 % 2,300 EUR 108.594 2,497,662.00 0.60
2.1250 % ISS Global A/S EO-Med.-Term Notes 2014(14/24) XS1145526825 % 1,400 EUR 105.559 1,477,826.00 0.35
3.7500 % Italien, Republik EO-B.T.P. 2014(24) IT0005001547 % 2,500 EUR 114.733 2,868,325.00 0.69
1.4500 % Italien, Republik EO-B.T.P. 2015(22) IT0005135840 % 3,500 EUR 103.382 3,618,370.00 0.86
2.0000 % Italien, Republik EO-B.T.P. 2015(25) IT0005127086 % 5,500 EUR 110.091 6,055,005.00 1.45
0.9500 % Italien, Republik EO-B.T.P. 2016(23) IT0005172322 % 4,500 EUR 103.027 4,636,215.00 1.11
0.6500 % Italien, Republik EO-B.T.P. 2016(23) IT0005215246 % 2,000 EUR 102.796 2,055,920.00 0.49
2.2000 % Italien, Republik EO-B.T.P. 2017(27) IT0005240830 % 4,000 EUR 112.822 4,512,880.00 1.08
2.0500 % Italien, Republik EO-B.T.P. 2017(27) IT0005274805 % 2,500 EUR 112.023 2,800,575.00 0.67
1.4500 % Italien, Republik EO-B.T.P. 2018(25) IT0005327306 % 3,000 EUR 106.822 3,204,660.00 0.77
2.8000 % Italien, Republik EO-B.T.P. 2018(28) IT0005340929 % 1,600 EUR 119.118 1,905,888.00 0.46
2.0000 % Italien, Republik EO-B.T.P. 2018(28) IT0005323032 % 1,300 EUR 112.133 1,457,729.00 0.35
1.0000 % Italien, Republik EO-B.T.P. 2019(22) IT0005366007 % 4,500 EUR 102.376 4,606,920.00 1.10
0.0500 % Italien, Republik EO-B.T.P. 2019(23) IT0005384497 % 500 EUR 100.959 504,795.00 0.12
0.3500 % Italien, Republik EO-B.T.P. 2019(25) IT0005386245 % 3,500 EUR 102.003 3,570,105.00 0.85
2.1000 % Italien, Republik EO-B.T.P. 2019(26) IT0005370306 % 3,500 EUR 111.271 3,894,485.00 0.93
3.0000 % Italien, Republik EO-B.T.P. 2019(29) IT0005365165 % 2,500 EUR 121.789 3,044,725.00 0.73
1.3500 % Italien, Republik EO-B.T.P. 2019(30) IT0005383309 % 1,000 EUR 107.680 1,076,800.00 0.26
0.5000 % Italien, Republik EO-B.T.P. 2020(26) IT0005419848 % 1,000 EUR 102.372 1,023,720.00 0.24
1.6250 % KA Finanz AG EO-Medium-Term Notes 2014(21) XS1033673440 % 3,000 EUR 100.450 3,013,500.00 0.72
0.3750 % KBC Bank N.V. EO-Med.-T.Mortg.Cov.Bds 16(22) BE0002498732 % 1,800 EUR 101.583 1,828,494.00 0.44
0.7500 % Kering S.A. EO-Med.-Term Notes 2020(20/28) FR0013512407 % 500 EUR 105.430 527,150.00 0.13
The notes to the statement of assets are an integral part of the annual report. Page 36

BANTLEON ANLEIHENFONDS - Bantleon Yield
Statement of assets as at 30/11/2020
Description ISIN Quantity or Holdings Currency Price Market value %
Shares or 30/11/2020 in EUR of the Fund
% in 1,000 assets *)
0.2500 % Landesbank Baden-Württemberg MTN-Pfandbr.Ser.791 v.18(25) DE000LB1M2X2 % 500 EUR 103.058 515,290.00 0.12
0.1250 % LVMH Moët Henn. L. Vuitton SE EO-Medium-Term Notes 20(20/28) FR0013482833 % 1,700 EUR 101.274 1,721,658.00 0.41
1.5000 % McKesson Corp. EO-Notes 2017(17/25) XS1567174286 % 3,500 EUR 106.428 3,724,980.00 0.89
0.3750 % Merck Financial Services GmbH MTN v. 2019(2019/2027) XS2023644201 % 900 EUR 103.334 930,006.00 0.22
2.6250 % MOL Magyar Olaj-és Gázipa.Nyrt. EUR note 2016(23) XS1401114811 % 2,500 EUR 105.637 2,640,925.00 0.63
1.5000 % Mondi Finance PLC EO-Med.-Term Notes 2016(24/24) XS1395010397 % 2,000 EUR 105.153 2,103,060.00 0.50
0.1750 % NATIXIS Pfandbriefbank AG MTN-HPF Ser.30 v.16(26) DE000A14J0H9 % 1,000 EUR 103.166 1,031,660.00 0.25
1.3750 % Naturgy Finance B.V. EO-Medium-Term Nts 2017(17/27) XS1551446880 % 600 EUR 107.577 645,462.00 0.15
0.7500 % Naturgy Finance B.V. EO-Medium-Term Nts 2019(19/29) XS2083976139 % 600 EUR 104.349 626,094.00 0.15
1.0000 % NIBC Bank N.V. EO-M.-T. Mortg.Cov.Bds 18(28) XS1753809141 % 1,000 EUR 108.909 1,089,090.00 0.26
0.6250 % NIBC Bank N.V. EO-Mortg. Cov. MTN 2016(26) XS1423753463 % 1,000 EUR 105.366 1,053,660.00 0.25
3.7500 % Niederlande EO-Anl. 2006(23) NL0000102275 % 1,000 EUR 109.593 1,095,930.00 0.26
0.2500 % Niederlande EO-Anl. 2015(25) NL0011220108 % 2,500 EUR 104.474 2,611,850.00 0.62
0.5000 % Niederlande EO-Anl. 2016(26) NL0011819040 % 1,000 EUR 106.702 1,067,020.00 0.25
0.7500 % Niederlande EO-Anl. 2017(27) NL0012171458 % 2,000 EUR 109.319 2,186,380.00 0.52
0.3750 % Niedersachsen. Land Landessch.v.18(26) Ausg.878 DE000A2G9G15 % 1,500 EUR 104.614 1,569,210.00 0.37
0.3750 % Nord/LB Lux.S.A. Cov.Bond Bk. EO-M.-T.Lett.d.Ga.Publ. 16(23) XS1432510631 % 5,500 EUR 101.775 5,597,625.00 1.34
0.3750 % Nord/LB Lux.S.A. Cov.Bond Bk. EO-M.-T.Lett.d.Ga.Publ. 19(24) XS1959949196 % 5,000 EUR 102.232 5,111,600.00 1.22
0.0500 % Nord/LB Lux.S.A. Cov.Bond Bk. EO-M.-T.Lett.d.Ga.Publ. 20(25) XS2079316753 % 2,200 EUR 101.216 2,226,752.00 0.53
0.0100 % Nord/LB Lux.S.A. Cov.Bond Bk. EO-M.-T.Lett.d.Ga.Publ. 20(27) XS2186093410 % 1,900 EUR 101.188 1,922,572.00 0.46
0.2500 % Nordea Mortgage Bank PLC EO-Med.-Term Cov. Bds 2016(23) XS1522968277 % 1,500 EUR 102.406 1,536,090.00 0.37
0.0250 % Nordea Mortgage Bank PLC EO-Med.-Term Cov. Bds 2017(22) XS1554271590 % 500 EUR 100.689 503,445.00 0.12
0.6250 % NRW.BANK Inh.-Schv.A.17Y v.17(27) DE000NWB17Y4 % 1,000 EUR 107.066 1,070,660.00 0.26
0.2500 % OP-Asuntoluottopankki Oyj EO-Cov. Med.-Term Nts 2016(23) XS1408380803 % 2,000 EUR 102.018 2,040,360.00 0.49
2.0000 % Orange S.A. EO-Medium-Term Nts 2019(19/29) FR0013396520 % 1,500 EUR 115.864 1,737,960.00 0.42
1.6500 % Österreich, Republik EO-Bundesanl. 2014(24) AT0000A185T1 % 1,500 EUR 109.301 1,639,515.00 0.39
0.7500 % Österreich, Republik EO-Medium-Term Notes 2018(28) AT0000A1ZGE4 % 2,000 EUR 109.643 2,192,860.00 0.52
0.1250 % Philip Morris Internat. Inc. EO-Notes 2019(19/26) XS2035473748 % 1,400 EUR 99.923 1,398,922.00 0.33
4.1250 % Portugal, Republik EO-Obr. 2017(27) PTOTEUOE0019 % 4,200 EUR 128.574 5,400,108.00 1.29
0.7000 % Portugal, Republik EO-Obr. 2020(27) PTOTEMOE0035 % 1,000 EUR 106.569 1,065,690.00 0.25
0.3750 % Raiffeisenl.Niederöst.-Wien AG EO-Medium-Term Notes 2017(24) XS1681119167 % 3,000 EUR 103.257 3,097,710.00 0.74
0.8750 % Raiffeisenl.Niederöst.-Wien AG EO-Medium-Term Notes 2019(29) XS1942629061 % 1,500 EUR 109.629 1,644,435.00 0.39
0.2500 % Repsol Intl Finance B.V. EO-Medium-Term Nts 2019(19/27) XS2035620710 % 1,100 EUR 100.686 1,107,546.00 0.26
2.3750 % Royal Mail PLC EO-Notes 2014(14/24) XS1091654761 % 1,400 EUR 107.869 1,510,166.00 0.36
0.0000 % RTE Réseau de Transp.d'Electr. EO-Medium-Term Nts 2019(19/27) FR0013445137 % 1,100 EUR 100.469 1,105,159.00 0.26
0.2500 % Schlumberger Finance B.V. EO-Notes 2019(19/27) XS2010045198 % 2,300 EUR 101.603 2,336,869.00 0.56
0.0500 % Sp Mortgage Bank PLC EO-Med.-Term Cov. Bds 2019(26) XS2014370915 % 1,000 EUR 102.308 1,023,080.00 0.24
1.6000 % Spanien EO-Bonos 2015(25) ES00000126Z1 % 2,900 EUR 109.199 3,166,771.00 0.76
1.4000 % Spanien EO-Bonos 2018(28) ES0000012B39 % 4,900 EUR 111.670 5,471,830.00 1.31
0.2500 % Spanien EO-Bonos 2019(24) ES0000012E85 % 4,000 EUR 102.868 4,114,720.00 0.98
0.6000 % Spanien EO-Bonos 2019(29) ES0000012F43 % 1,400 EUR 105.623 1,478,722.00 0.35
0.0000 % Spanien EO-Bonos 2020(23) ES0000012F84 % 4,400 EUR 101.377 4,460,588.00 1.07
The notes to the statement of assets are an integral part of the annual report. Page 37

BANTLEON ANLEIHENFONDS - Bantleon Yield
Statement of assets as at 30/11/2020
Description ISIN Quantity or Holdings Currency Price Market value %
Shares or 30/11/2020 in EUR of the Fund
% in 1,000 assets *)
1.9500 % Spanien EO-Obligaciones 2016(26) ES00000127Z9 % 4,800 EUR 112.700 5,409,600.00 1.29
0.4000 % Spanien EO-Obligaciones 2017(22) ES00000128O1 % 2,000 EUR 101.413 2,028,260.00 0.48
0.8000 % Spanien EO-Obligaciones 2020(27) ES0000012G26 % 1,500 EUR 106.928 1,603,920.00 0.38
0.5000 % Spanien EO-Obligaciones 2020(30) ES0000012F76 % 3,300 EUR 104.544 3,449,952.00 0.82
2.6250 % SPP Infrastructure Fing B.V. EO-Notes 2015(25) XS1185941850 % 3,000 EUR 110.120 3,303,600.00 0.79
2.6250 % SPP-Distribucia, A.S. EO-Notes 2014(21) XS1077088984 % 2,650 EUR 101.558 2,691,287.00 0.64
0.7500 % Stryker Corp. EO-Notes 2019(19/29) XS2087639626 % 400 EUR 103.862 415,448.00 0.10
1.2500 % Suez S.A. EO-Medium-Term Nts 2020(20/27) FR0013505542 % 300 EUR 107.242 321,726.00 0.08
0.8750 % Swedish Match AB EO-Medium-Term Nts 2020(26/27) XS2125123039 % 300 EUR 100.248 300,744.00 0.07
1.4600 % Telefonica Emisiones S.A.U. EO Medium Term Notes 2016(26) XS1394764689 % 1,600 EUR 107.982 1,727,712.00 0.41
0.2500 % Telenor ASA EO-Medium-Term Nts 2020(20/28) XS2117452156 % 450 EUR 101.606 457,227.00 0.11
0.3750 % Terna Rete Elettrica Nazio.SpA EO-Medium-Term Nts 2020(30/30) XS2237901355 % 600 EUR 102.086 612,516.00 0.15
1.4910 % Total Capital Intl S.A. EO-Medium-Term Nts 2020(20/27) XS2153406868 % 500 EUR 109.866 549,330.00 0.13
0.5000 % UniCredit Bank AG HVB MTN-HPF S.1893 v.17(26) DE000HV2AMT6 % 1,000 EUR 105.005 1,050,050.00 0.25
0.6250 % UniCredit Bank AG HVB MTN-HPF S.2029 v.18(25) DE000HV2ART5 % 3,500 EUR 105.327 3,686,445.00 0.88
1.3750 % UniCredit Bank Austria AG EO-Öff. M.-T. Pfandbr.2014(21) AT000B049507 % 1,500 EUR 100.906 1,513,590.00 0.36
1.1250 % Unilever N.V. EO Medium Term Notes 2018(27) XS1769090991 % 2,000 EUR 108.023 2,160,460.00 0.52
1.0000 % Unio.di Banche Italiane S.p.A. EO-Mortg.Cov. MTN 2019(25) IT0005364663 % 2,000 EUR 106.677 2,133,540.00 0.51
0.2500 % V.F. Corp. EO-Notes 2020(20/28) XS2123970167 % 800 EUR 101.143 809,144.00 0.19
0.3750 % Van Lanschot Kempen W.M. NV EO-MT Covered Bonds 2016(23) XS1387192435 % 1,500 EUR 101.864 1,527,960.00 0.36
1.3750 % Verizon Communications Inc. EO-Notes 2017(17/26) XS1708161291 % 2,500 EUR 108.175 2,704,375.00 0.65
0.0000 % VINCI S.A. EO-Med.-Term Notes 2020(20/28) FR0014000PF1 % 800 EUR 100.469 803,752.00 0.19
1.5000 % Vodafone Group PLC EO-Med.-Term Notes 2017(27) XS1652855815 % 1,300 EUR 109.001 1,417,013.00 0.34
0.3750 % Volksbank Wien AG EO-Schuldverschr. 2019(26) AT000B122031 % 3,000 EUR 104.122 3,123,660.00 0.75
0.8750 % Volkswagen Intl Finance N.V. EO Medium Term Notes 2015(23) XS1167644407 % 2,500 EUR 102.098 2,552,450.00 0.61
2.6250 % Volkswagen Intl Finance N.V. EO-Notes 2018(27) XS1910948162 % 800 EUR 116.319 930,552.00 0.22
1.2500 % Vonovia Finance B.V. EO-Medium-Term Nts 2016(16/24) DE000A189ZX0 % 1,500 EUR 105.725 1,585,875.00 0.38
2.2500 % Xylem Inc. EO-Notes 2016(16/23) XS1378780891 % 2,750 EUR 104.720 2,879,800.00 0.69
Securities admitted to or included in organised markets EUR 12,348,260.00 2.95
Interest-bearing securities EUR 12,348,260.00 2.95
1.6250 % Albemarle New Holding GmbH Bonds v.19(19/28)Reg.S XS2083147343 % 1,000 EUR 104.798 1,047,980.00 0.25
1.6980 % EP Infrastructure a.s. EO-Notes 2019(19/26) XS2034622048 % 3,100 EUR 102.754 3,185,374.00 0.76
0.6250 % Illinois Tool Works Inc. EO-Notes 2019(19/27) XS1843435170 % 2,000 EUR 104.577 2,091,540.00 0.50
1.0000 % JT Intl. Finl. Services B.V EO-Medium-Term Nts 2019(19/29) XS2082472122 % 1,500 EUR 105.295 1,579,425.00 0.38
0.6250 % Kerry Group Financial Services EO-Notes 2019(19/29) XS2042667944 % 900 EUR 103.231 929,079.00 0.22
0.0500 % Santander Consumer Bank AG Pfandbr. MTN v.2020(2030) XS2114143758 % 1,000 EUR 102.659 1,026,590.00 0.25
1.8750 % Sky Ltd. EO-Medium-Term Notes 2014(23) XS1141969912 % 1,200 EUR 106.151 1,273,812.00 0.30
0.4520 % Wintershall Dea Finance B.V. EO-Notes 2019(19/23) XS2054209320 % 1,000 EUR 100.964 1,009,640.00 0.24
1.3320 % Wintershall Dea Finance B.V. EO-Notes 2019(19/28) XS2054210252 % 200 EUR 102.410 204,820.00 0.05
The notes to the statement of assets are an integral part of the annual report. Page 38
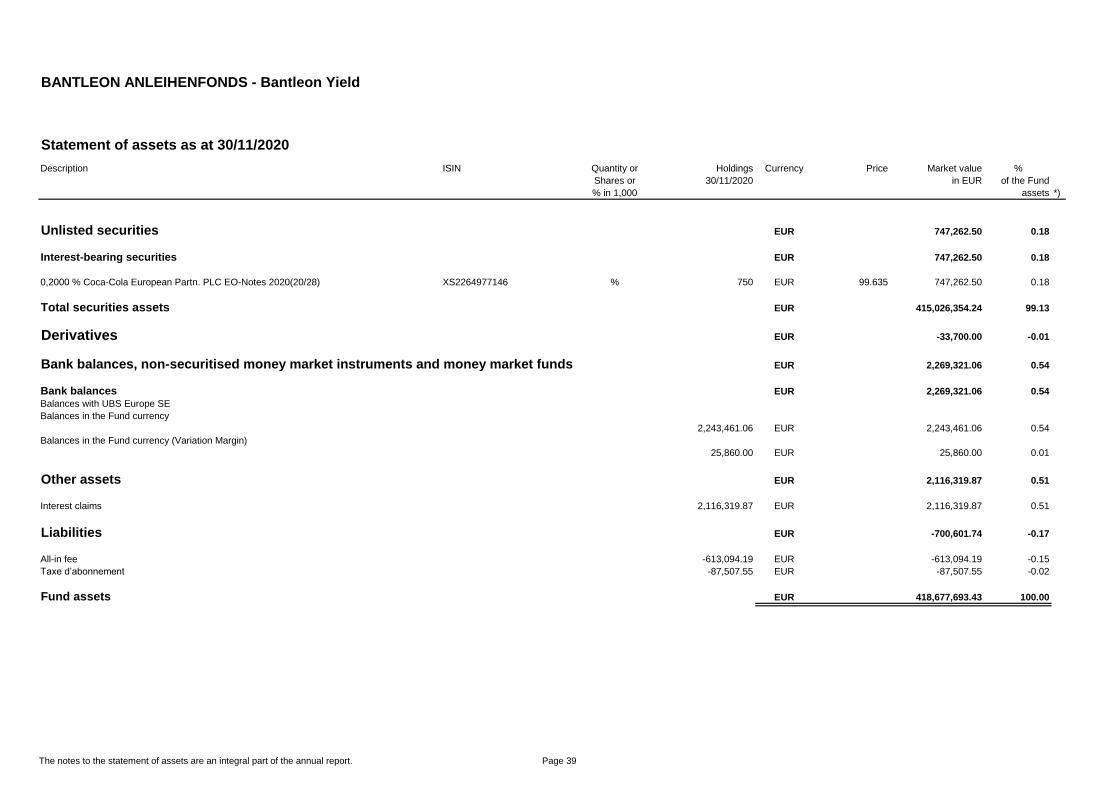
BANTLEON ANLEIHENFONDS - Bantleon Yield
Statement of assets as at 30/11/2020
Description ISIN Quantity or Holdings Currency Price Market value %
Shares or 30/11/2020 in EUR of the Fund
% in 1,000 assets *)
Unlisted securities EUR 747,262.50 0.18
Interest-bearing securities EUR 747,262.50 0.18
0,2000 % Coca-Cola European Partn. PLC EO-Notes 2020(20/28) XS2264977146 % 750 EUR 99.635 747,262.50 0.18
Total securities assets EUR 415,026,354.24 99.13
Derivatives EUR -33,700.00 -0.01
Bank balances, non-securitised money market instruments and money market funds EUR 2,269,321.06 0.54
Bank balances EUR 2,269,321.06 0.54
Balances with UBS Europe SE
Balances in the Fund currency
2,243,461.06 EUR 2,243,461.06 0.54
Balances in the Fund currency (Variation Margin)
25,860.00 EUR 25,860.00 0.01
Other assets EUR 2,116,319.87 0.51
Interest claims 2,116,319.87 EUR 2,116,319.87 0.51
Liabilities EUR -700,601.74 -0.17
All-in fee -613,094.19 EUR -613,094.19 -0.15
Taxe d’abonnement -87,507.55 EUR -87,507.55 -0.02
Fund assets EUR 418,677,693.43 100.00
The notes to the statement of assets are an integral part of the annual report. Page 39

BANTLEON ANLEIHENFONDS - Bantleon Yield
Statement of assets as at 30/11/2020
Description ISIN Quantity or Holdings Currency Price Market value %
Shares or 30/11/2020 in EUR of the Fund
% in 1,000 assets *)
Bantleon Yield IA
Unit value EUR 109.66
Issuing price 1)
EUR 109.68
Redemption price 1)
EUR 109.68
Units in circulation Quantity 3,543,040.592
Bantleon Yield PA
Unit value EUR 107.25
Issuing price 1)
EUR 107.27
Redemption price 1)
EUR 107.27
Units in circulation Quantity 247,079.414
Bantleon Yield PT
Unit value EUR 127.25
Issuing price 1)
EUR 127.28
Redemption price 1)
EUR 127.28
Units in circulation Quantity 28,594.971
1) The issue and redemption prices shown are swing prices. More detailed information on swing pricing can be found in the notes.
*) As the per cent holding is rounded off for purposes of calculation, marginal rounding differences can occur.
**) Of which 1,500 have been provided as collateral
The notes to the statement of assets are an integral part of the annual report. Page 40

BANTLEON ANLEIHENFONDS - Bantleon Yield
Derivatives as of 30/11/2020
Financial futures contracts as of 30/11/2020 Acquisition
Name Maturity Quantity Currency price Price Daily rate Liability Unrealised Results
in currency in currency in EUR in EUR
FUTURE EURO-BUND 12/20 EUREX 12.08.2020 -56.00 EUR 174.7869 175.3900 9,821,840.00 -33,700.00
Total financial futures contracts -33,700.00
Total derivatives -33,700.00
Page 41

BANTLEON ANLEIHENFONDS - Bantleon Yield
Statement of operations (including income equalisation)
for the period from 01/12/2019 to 30/11/2020Total
I. Income
- Interest from securities EUR 4,659,960.03
- Interest from liquidity investments *) EUR -23,887.54
- Other income EUR 1,018.39
Total income EUR 4,637,090.89
II. Expenses
- Interest from short-term borrowing EUR -3,285.57
- All-in fee EUR -1,453,954.40
- Taxe d`abonnement EUR -52,205.65
- Foreign withholding tax EUR -13,587.27
- Compensation of expenses EUR -37,139.59
- Other expenses EUR -43,598.77
Total expenses EUR -1,603,771.25
III. Ordinary net result EUR 3,033,319.63
IV. Disposals
1. Realised gains from EUR 2,368,606.25
- Securities transactions EUR 1,756,010.06
- Financial futures contracts EUR 612,593.48
- Foreign exchange EUR 2.71
2. Realised losses from EUR -3,600,765.64
- Securities transactions EUR -2,569,305.89
- Financial futures contracts EUR -1,031,459.75
3. Realised result on subscriptions/redemptions **) 9,855.50
Realised result EUR -1,222,303.89
V. Net change in unrealised gains/losses
- Net change in unrealised gains EUR 3,196,495.24
- Net change in unrealised losses EUR -339,632.91
Net change in unrealised profits EUR 2,856,862.33
VI. Result of the reporting period EUR 4,667,878.08
*) The "Interest from liquidity investments" includes negative credit interest in the amount of EUR 23,887.54.
**) The item realised result from subscriptions/redemptions shows effects of swing pricing. More detailed information on swing pricing can be found in the notes.
The notes to the statement of assets are an integral part of the annual report. Page 42
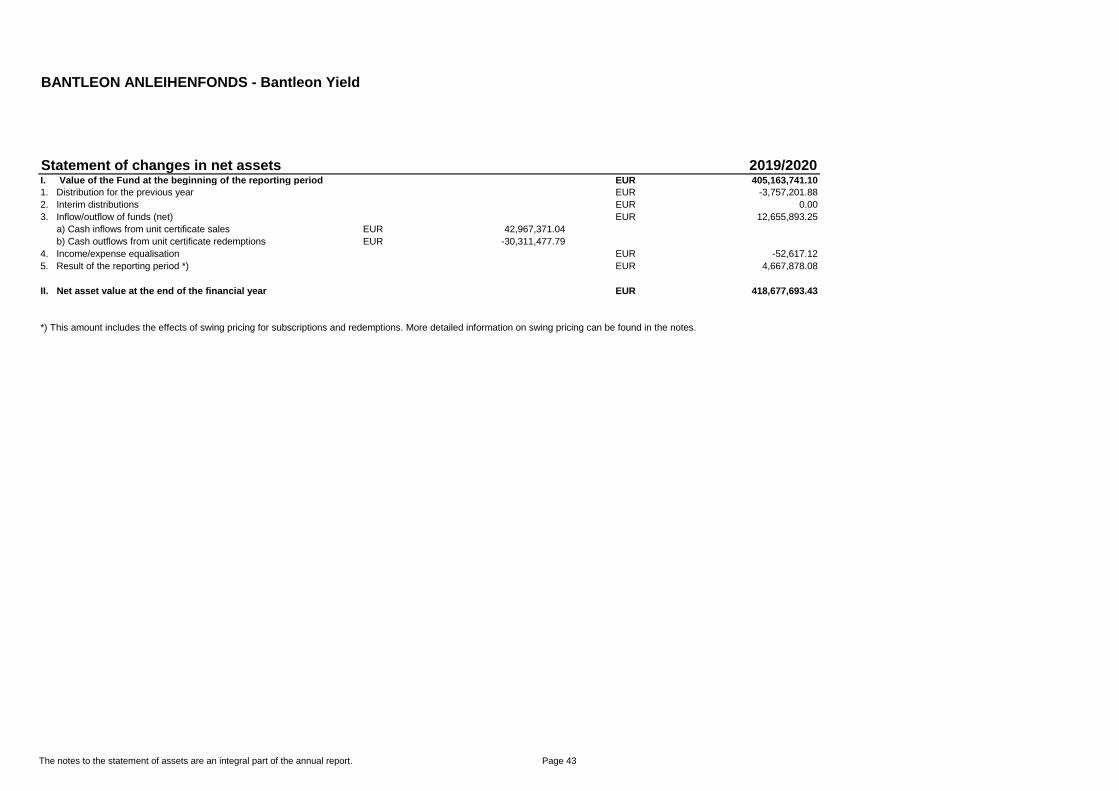
BANTLEON ANLEIHENFONDS - Bantleon Yield
Statement of changes in net assets 2019/2020I. Value of the Fund at the beginning of the reporting period EUR 405,163,741.10
1. Distribution for the previous year EUR -3,757,201.88
2. Interim distributions EUR 0.00
3. Inflow/outflow of funds (net) EUR 12,655,893.25
a) Cash inflows from unit certificate sales EUR 42,967,371.04
b) Cash outflows from unit certificate redemptions EUR -30,311,477.79
4. Income/expense equalisation EUR -52,617.12
5. Result of the reporting period *) EUR 4,667,878.08
II. Net asset value at the end of the financial year EUR 418,677,693.43
*) This amount includes the effects of swing pricing for subscriptions and redemptions. More detailed information on swing pricing can be found in the notes.
The notes to the statement of assets are an integral part of the annual report. Page 43

BANTLEON ANLEIHENFONDS - Bantleon Yield
Bantleon Yield IA
Comparison with the last three financial years
Financial year Units in circulation at the Fund assets at the Unit value at the
end of the financial year end of the financial year end of the financial year
30/11/2018 Quantity 4,067,139.469 EUR 432,426,135.58 EUR 106.32
31/05/2019 Quantity 3,708,405.469 EUR 400,569,730.85 EUR 108.02
30/11/2019 Quantity 3,416,630.469 EUR 373,982,932.12 EUR 109.45
30/11/2020 Quantity 3,543,040.592 EUR 388,539,409.32 EUR 109.68
Change in the number of units in circulation in the reporting period Quantity
Units in circulation at the beginning of the reporting period 3,416,630.469
Units issued 378,004.222
Units redeemed -251,594.099
Units in circulation in the end of the reporting period 3,543,040.592
Page 44

BANTLEON ANLEIHENFONDS - Bantleon Yield
Bantleon Yield PA
Comparison with the last three financial years
Financial year Units in circulation at the Fund assets at the Unit value at the
end of the financial year end of the financial year end of the financial year
30/11/2018 Quantity 175,883.189 EUR 18,378,033.22 EUR 104.49
31/05/2019 Quantity 184,200.188 EUR 19,586,696.10 EUR 106.33
30/11/2019 Quantity 246,028.622 EUR 26,446,436.56 EUR 107.48
30/11/2020 Quantity 247,079.414 EUR 26,499,509.74 EUR 107.27
Change in the number of units in circulation in the reporting period Quantity
Units in circulation at the beginning of the reporting period 246,028.622
Units issued 18,806.525
Units redeemed -17,755.733
Units in circulation in the end of the reporting period 247,079.414
Page 45

BANTLEON ANLEIHENFONDS - Bantleon Yield
Bantleon Yield PT
Comparison with the last three financial years
Financial year Units in circulation at the Fund assets at the Unit value at the
end of the financial year end of the financial year end of the financial year
30/11/2018 Quantity 41,223.125 EUR 5,027,263.13 EUR 121.95
31/05/2019 Quantity 39,741.137 EUR 4,963,664.88 EUR 124.90
30/11/2019 Quantity 37,482.775 EUR 4,734,372.42 EUR 126.30
30/11/2020 Quantity 28,594.971 EUR 3,638,774.37 EUR 127.28
Change in the number of units in circulation in the reporting period Quantity
Units in circulation at the beginning of the reporting period 37,482.775
Units issued 305.840
Units redeemed -9,193.644
Units in circulation in the end of the reporting period 28,594.971
Page 46

BANTLEON ANLEIHENFONDS - Bantleon Yield Plus
Balance sheet as at 30/11/2020
Investment focus
Daily value
in EUR
% share
of Fund assets *)
I. Assets 85,984,588.84 100.25
1. Bonds 83,493,129.35 97.34
2. Derivatives 133,451.68 0.16
3. Bank balances 1,838,725.40 2.14
4. Other assets 519,282.41 0.61
II. Liabilities -206,263.41 -0.25
III. Fund assets 85,778,325.43 100.00
*) As the per cent holding is rounded off for purposes of calculation, marginal rounding differences can occur.
Page 47

BANTLEON ANLEIHENFONDS - Bantleon Yield Plus
Statement of assets as at 30/11/2020
Description ISIN Quantity or Holdings Currency Price Market value %
Shares or 30/11/2020 in EUR of the Fund
% in 1,000 assets *)
Portfolio holdings EUR 83,493,129.35 97.34
Exchange-traded securities EUR 72,963,304.23 85.06
Interest-bearing securities EUR 72,963,304.23 85.06
0.3750 % Achmea Bank N.V. EO-M.-T.Mortg.Cov.Bds 2017(24) XS1722558258 % 1,500 EUR 103.084 1,546,260.00 1.80
1.7500 % Akelius Residential Property EO-Med.-Term Notes 2017(17/25) XS1622421722 % 400 EUR 105.632 422,528.00 0.49
1.6250 % Alliander N.V. EO-FLR Securit. 2018(25/Und.) XS1757377400 % 300 EUR 105.161 315,483.00 0.37
0.1250 % APRR EO-Medium-Term Nts 2020(20/29) FR0013534278 % 500 EUR 101.084 505,420.00 0.59
1.8750 % Aroundtown SA EO-Med.-Term Nts 2017(17/26) XS1649193403 % 600 EUR 107.527 645,162.00 0.75
3.1250 % Aurizon Network Pty Ltd. EO-Med.-Term Nts 2016(16/26) XS1418788599 % 500 EUR 115.013 575,065.00 0.67
0.0100 % AXA Bank Europe SCF EO-Med.-Term Obl.Fonc.2020(27) FR0013478047 % 600 EUR 102.410 614,460.00 0.72
0.0500 % AXA Home Loan SFH EO-M.-T.Obl.Fin.Hab. 2019(27) FR0013432069 % 800 EUR 102.696 821,568.00 0.96
1.0000 % Banco BPM S.p.A. EO-M.-T.Mortg.Cov.Bds 2018(25) IT0005321663 % 800 EUR 105.603 844,824.00 0.98
0.7500 % BAWAG P.S.K. EO-Medium-Term Bonds 2017(27) XS1551294926 % 500 EUR 107.115 535,575.00 0.62
2.3750 % Bayer AG FLR-Sub.Anl.v.2019(2025/2079) XS2077670003 % 300 EUR 100.998 302,994.00 0.35
2.8750 % Bca Monte dei Paschi di Siena EO-Mortg.Covered MTN 2014(24) IT0005038283 % 800 EUR 111.183 889,464.00 1.04
5.5000 % Belgien, Königreich EO-Obl. Lin. 1998(28) Ser. 31 BE0000291972 % 500 EUR 145.086 725,430.00 0.85
0.8000 % Belgien, Königreich EO-Obl. Lin. 2015(25) Ser. 74 BE0000334434 % 500 EUR 106.779 533,895.00 0.62
0.5000 % Belgien, Königreich EO-Obl. Lin. 2017(24) Ser. 82 BE0000342510 % 500 EUR 104.693 523,465.00 0.61
0.0100 % Berlin Hyp AG Hyp.-Pfandbr. v.20(28) DE000BHY0GD1 % 1,000 EUR 102.793 1,027,930.00 1.20
0.8750 % BNG Bank N.V. EO Medium Term Notes 2016(36) XS1508377584 % 200 EUR 113.219 226,438.00 0.26
0.5000 % British Telecommunications PLC EO-Med.-Term Notes 2019(19/25) XS2051494222 % 250 EUR 101.924 254,810.00 0.30
1.2000 % Brown-Forman Corp. EO-Notes 2016(16/26) XS1441773550 % 500 EUR 106.233 531,165.00 0.62
4.8750 % Bulgarian Energy Holding EAD EO-Bonds 2016(16/21) Reg.S XS1405778041 % 200 EUR 102.517 205,034.00 0.24
0.5000 % Bundesrep.Deutschland Anl.v.2016 (2026) **) DE0001102390 % 2,100 EUR 106.702 2,240,742.00 2.61
0.5000 % Bundesrep.Deutschland Anl.v.2017 (2027) DE0001102424 % 1,350 EUR 108.418 1,463,643.00 1.71
0.2500 % Bundesrep.Deutschland Anl.v.2018 (2028) DE0001102457 % 1,550 EUR 107.378 1,664,359.00 1.94
0.0000 % Bundesrep.Deutschland Anl.v.2020 (2030) DE0001102499 % 1,100 EUR 105.729 1,163,019.00 1.36
2.5000 % Carlsberg Breweries A/S EO-Medium-Term Nts 2014(24/24) XS1071713470 % 400 EUR 108.665 434,660.00 0.51
1.0000 % Cassa Depositi e Prestiti SpA EO-Medium-Term Notes 2020(28) IT0005422032 % 400 EUR 103.138 412,552.00 0.48
1.0000 % Cellnex Telecom S.A. EO-Med.-Term Notes 2020(20/27) XS2102934697 % 200 EUR 98.666 197,332.00 0.23
0.2500 % Daimler Intl Finance B.V. EO-Medium-Term Notes 2019(23) DE000A2R9ZT1 % 500 EUR 100.796 503,980.00 0.59
0.4500 % DH Europe Finance II S.à r.L. EO-Notes 2019(19/28) XS2050404800 % 400 EUR 101.907 407,628.00 0.48
1.7000 % EDP - Energias de Portugal SA EO-FLR Securities 2020(25/80) PTEDPLOM0017 % 300 EUR 99.500 298,500.00 0.35
2.0450 % EP Infrastructure a.s. EO-Notes 2019(19/28) XS2062490649 % 300 EUR 103.371 310,113.00 0.36
3.7500 % Eurofins Scientific S.E. EO-Bonds 2020(20/26) XS2167595672 % 400 EUR 117.737 470,948.00 0.55
3.5000 % Frankreich EO-OAT 2010(26) FR0010916924 % 1,450 EUR 122.668 1,778,686.00 2.07
1.7500 % Frankreich EO-OAT 2014(24) FR0011962398 % 1,150 EUR 109.845 1,263,217.50 1.47
0.5000 % Frankreich EO-OAT 2015(25) FR0012517027 % 1,350 EUR 105.270 1,421,145.00 1.66
1.0000 % Frankreich EO-OAT 2015(25) FR0012938116 % 1,400 EUR 108.325 1,516,550.00 1.77
The notes to the statement of assets are an integral part of the annual report. Page 48

BANTLEON ANLEIHENFONDS - Bantleon Yield Plus
Statement of assets as at 30/11/2020
Description ISIN Quantity or Holdings Currency Price Market value %
Shares or 30/11/2020 in EUR of the Fund
% in 1,000 assets *)
1.5000 % Frankreich EO-OAT 2015(31) FR0012993103 % 350 EUR 119.364 417,774.00 0.49
0.2500 % Frankreich EO-OAT 2016(26) FR0013200813 % 1,200 EUR 105.101 1,261,212.00 1.47
1.0000 % Frankreich EO-OAT 2017(27) FR0013250560 % 1,000 EUR 110.304 1,103,040.00 1.29
0.7500 % Frankreich EO-OAT 2018(28) FR0013341682 % 950 EUR 110.008 1,045,076.00 1.22
2.1250 % Fresenius Finance Ireland PLC EO-Med.-Term Nts 2017(17/27) 3 XS1554373677 % 400 EUR 111.723 446,892.00 0.52
1.1250 % Glencore Capital Finance DAC EO-Medium-Term Nts 2020(20/28) XS2228892860 % 300 EUR 102.053 306,159.00 0.36
1.6250 % Holding d'Infrastr. de Transp. EO-Med.-Term Notes 2020(20/29) XS2231183646 % 200 EUR 106.075 212,150.00 0.25
0.0100 % HYPO NOE LB f. Nied.u.Wien AG EO-Publ.Covered MTN 2019(26) XS2057917366 % 500 EUR 102.375 511,875.00 0.60
0.0100 % HYPO TIROL BANK AG EO-Med.-T.Hyp.Pf.-Br. 2019(26) AT0000A2AYL3 % 1,000 EUR 102.143 1,021,430.00 1.19
1.3750 % Imperial Brands Finance PLC EO-Med.-Term Notes 2017(17/25) XS1558013360 % 600 EUR 104.388 626,328.00 0.73
2.6250 % Indonesien. Republik EO-Med.-T. Nts 2016(23) Reg.S XS1432493879 % 700 EUR 106.020 742,140.00 0.87
1.7500 % Intl Business Machines Corp. EO-Notes 2019(19/31) XS1945110861 % 100 EUR 114.825 114,825.00 0.13
6.5000 % Italien, Republik EO-B.T.P. 1997(27) IT0001174611 % 1,000 EUR 142.568 1,425,680.00 1.66
4.7500 % Italien, Republik EO-B.T.P. 2013(28) IT0004889033 % 900 EUR 133.490 1,201,410.00 1.40
3.5000 % Italien, Republik EO-B.T.P. 2014(30) IT0005024234 % 400 EUR 127.149 508,596.00 0.59
0.6500 % Italien, Republik EO-B.T.P. 2016(23) IT0005215246 % 1,200 EUR 102.796 1,233,552.00 1.44
1.4500 % Italien, Republik EO-B.T.P. 2017(24) IT0005282527 % 1,400 EUR 106.402 1,489,628.00 1.74
1.4500 % Italien, Republik EO-B.T.P. 2018(25) IT0005327306 % 1,100 EUR 106.822 1,175,042.00 1.37
3.0000 % Italien, Republik EO-B.T.P. 2019(29) IT0005365165 % 700 EUR 121.789 852,523.00 0.99
1.6250 % KKR Group Finance Co. V LLC EO-Notes 2019(19/29) Reg.S XS1998904921 % 400 EUR 108.633 434,532.00 0.51
2.8750 % Merck KGaA FLR-Sub.Anl. v.2019(2029/2079) XS2011260705 % 500 EUR 109.423 547,115.00 0.64
2.6250 % MOL Magyar Olaj-és Gázipa.Nyrt. EUR note 2016(23) XS1401114811 % 300 EUR 105.637 316,911.00 0.37
0.3750 % NATIXIS Pfandbriefbank AG MTN-HPF Ser.32 v.18(23) DE000A14J0K3 % 500 EUR 102.007 510,035.00 0.59
0.6250 % NIBC Bank N.V. EO-Mortg. Cov. MTN 2016(26) XS1423753463 % 1,200 EUR 105.366 1,264,392.00 1.47
0.3750 % Nord/LB Lux.S.A. Cov.Bond Bk. EO-M.-T.Lett.d.Ga.Publ. 16(23) XS1432510631 % 2,000 EUR 101.775 2,035,500.00 2.37
0.0500 % Nord/LB Lux.S.A. Cov.Bond Bk. EO-M.-T.Lett.d.Ga.Publ. 20(25) XS2079316753 % 300 EUR 101.216 303,648.00 0.35
2.8750 % OMV AG EO-FLR Notes 2018(24/Und.) XS1713462403 % 300 EUR 104.134 312,402.00 0.36
2.3750 % Orange S.A. EO-FLR Med.-T. Nts 19(25/Und.) FR0013413887 % 300 EUR 105.131 315,393.00 0.37
1.7500 % Orsted A/S EO-FLR Cap.Secs 2019(27/3019) XS2010036874 % 200 EUR 101.873 203,746.00 0.24
1.6500 % Österreich, Republik EO-Bundesanl. 2014(24) AT0000A185T1 % 500 EUR 109.301 546,505.00 0.64
0.5000 % Österreich, Republik EO-Bundesanl. 2017(27) AT0000A1VGK0 % 500 EUR 107.206 536,030.00 0.62
0.5000 % Österreich, Republik EO-Medium-Term Notes 2019(29) AT0000A269M8 % 500 EUR 108.396 541,980.00 0.63
0.1250 % Philip Morris Internat. Inc. EO-Notes 2019(19/26) XS2035473748 % 500 EUR 99.923 499,615.00 0.58
0.6250 % PKO Bank Hipoteczny S.A. EO-Mortg. Covered MTN 2017(23) XS1588411188 % 600 EUR 102.039 612,234.00 0.71
3.8750 % Portugal, Republik EO-Obr. 2014(30) PTOTEROE0014 % 500 EUR 136.110 680,550.00 0.79
4.1250 % Portugal, Republik EO-Obr. 2017(27) PTOTEUOE0019 % 450 EUR 128.574 578,583.00 0.67
2.1250 % Portugal, Republik EO-Obr. 2018(28) PTOTEVOE0018 % 700 EUR 118.337 828,359.00 0.97
0.6250 % RTE Réseau de Transp.d'Electr. EO-Medium-Term Nts 2020(20/32) FR0013522695 % 500 EUR 104.521 522,605.00 0.61
2.8750 % Rumänien EO-Medium-Term Notes 2014(24) XS1129788524 % 750 EUR 109.256 819,420.00 0.96
0.5000 % Santander UK PLC EO-Med.-Term Cov. Bds 2018(25) XS1748479919 % 2,000 EUR 103.439 2,068,780.00 2.41
0.3750 % SAP SE Inh.-Schuldv.v.2020(2029/2029) XS2176715667 % 600 EUR 103.342 620,052.00 0.72
The notes to the statement of assets are an integral part of the annual report. Page 49
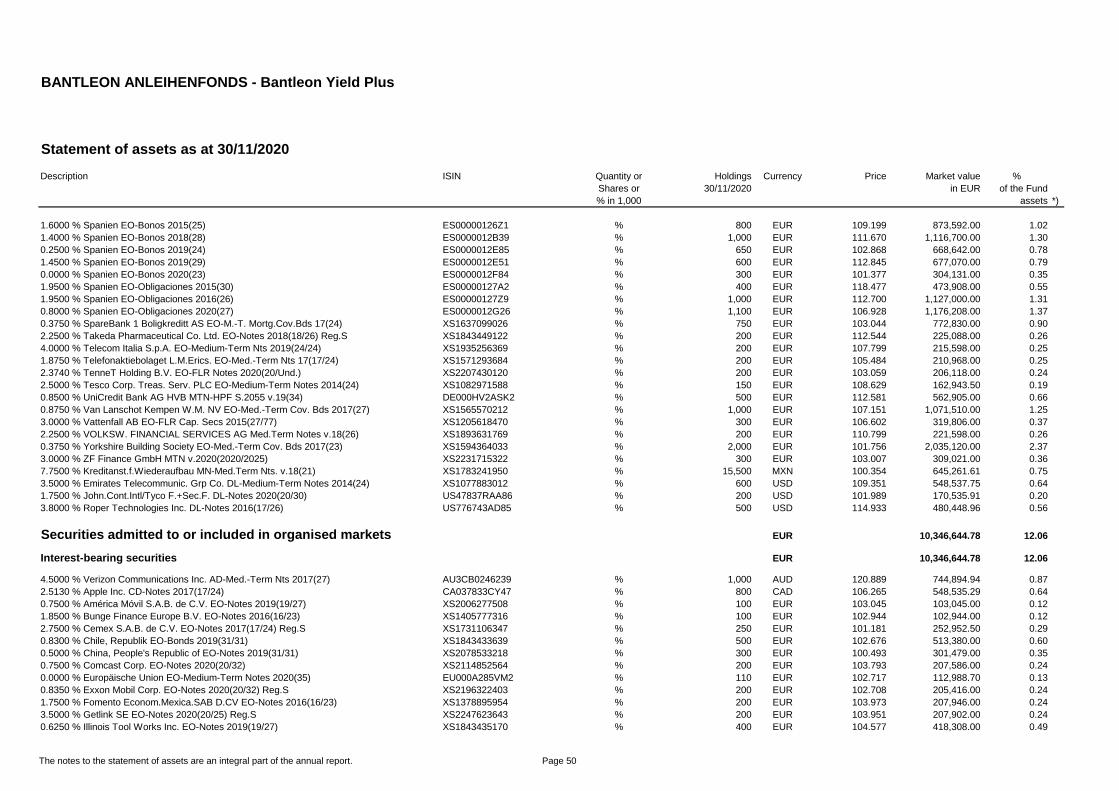
BANTLEON ANLEIHENFONDS - Bantleon Yield Plus
Statement of assets as at 30/11/2020
Description ISIN Quantity or Holdings Currency Price Market value %
Shares or 30/11/2020 in EUR of the Fund
% in 1,000 assets *)
1.6000 % Spanien EO-Bonos 2015(25) ES00000126Z1 % 800 EUR 109.199 873,592.00 1.02
1.4000 % Spanien EO-Bonos 2018(28) ES0000012B39 % 1,000 EUR 111.670 1,116,700.00 1.30
0.2500 % Spanien EO-Bonos 2019(24) ES0000012E85 % 650 EUR 102.868 668,642.00 0.78
1.4500 % Spanien EO-Bonos 2019(29) ES0000012E51 % 600 EUR 112.845 677,070.00 0.79
0.0000 % Spanien EO-Bonos 2020(23) ES0000012F84 % 300 EUR 101.377 304,131.00 0.35
1.9500 % Spanien EO-Obligaciones 2015(30) ES00000127A2 % 400 EUR 118.477 473,908.00 0.55
1.9500 % Spanien EO-Obligaciones 2016(26) ES00000127Z9 % 1,000 EUR 112.700 1,127,000.00 1.31
0.8000 % Spanien EO-Obligaciones 2020(27) ES0000012G26 % 1,100 EUR 106.928 1,176,208.00 1.37
0.3750 % SpareBank 1 Boligkreditt AS EO-M.-T. Mortg.Cov.Bds 17(24) XS1637099026 % 750 EUR 103.044 772,830.00 0.90
2.2500 % Takeda Pharmaceutical Co. Ltd. EO-Notes 2018(18/26) Reg.S XS1843449122 % 200 EUR 112.544 225,088.00 0.26
4.0000 % Telecom Italia S.p.A. EO-Medium-Term Nts 2019(24/24) XS1935256369 % 200 EUR 107.799 215,598.00 0.25
1.8750 % Telefonaktiebolaget L.M.Erics. EO-Med.-Term Nts 17(17/24) XS1571293684 % 200 EUR 105.484 210,968.00 0.25
2.3740 % TenneT Holding B.V. EO-FLR Notes 2020(20/Und.) XS2207430120 % 200 EUR 103.059 206,118.00 0.24
2.5000 % Tesco Corp. Treas. Serv. PLC EO-Medium-Term Notes 2014(24) XS1082971588 % 150 EUR 108.629 162,943.50 0.19
0.8500 % UniCredit Bank AG HVB MTN-HPF S.2055 v.19(34) DE000HV2ASK2 % 500 EUR 112.581 562,905.00 0.66
0.8750 % Van Lanschot Kempen W.M. NV EO-Med.-Term Cov. Bds 2017(27) XS1565570212 % 1,000 EUR 107.151 1,071,510.00 1.25
3.0000 % Vattenfall AB EO-FLR Cap. Secs 2015(27/77) XS1205618470 % 300 EUR 106.602 319,806.00 0.37
2.2500 % VOLKSW. FINANCIAL SERVICES AG Med.Term Notes v.18(26) XS1893631769 % 200 EUR 110.799 221,598.00 0.26
0.3750 % Yorkshire Building Society EO-Med.-Term Cov. Bds 2017(23) XS1594364033 % 2,000 EUR 101.756 2,035,120.00 2.37
3.0000 % ZF Finance GmbH MTN v.2020(2020/2025) XS2231715322 % 300 EUR 103.007 309,021.00 0.36
7.7500 % Kreditanst.f.Wiederaufbau MN-Med.Term Nts. v.18(21) XS1783241950 % 15,500 MXN 100.354 645,261.61 0.75
3.5000 % Emirates Telecommunic. Grp Co. DL-Medium-Term Notes 2014(24) XS1077883012 % 600 USD 109.351 548,537.75 0.64
1.7500 % John.Cont.Intl/Tyco F.+Sec.F. DL-Notes 2020(20/30) US47837RAA86 % 200 USD 101.989 170,535.91 0.20
3.8000 % Roper Technologies Inc. DL-Notes 2016(17/26) US776743AD85 % 500 USD 114.933 480,448.96 0.56
Securities admitted to or included in organised markets EUR 10,346,644.78 12.06
Interest-bearing securities EUR 10,346,644.78 12.06
4.5000 % Verizon Communications Inc. AD-Med.-Term Nts 2017(27) AU3CB0246239 % 1,000 AUD 120.889 744,894.94 0.87
2.5130 % Apple Inc. CD-Notes 2017(17/24) CA037833CY47 % 800 CAD 106.265 548,535.29 0.64
0.7500 % América Móvil S.A.B. de C.V. EO-Notes 2019(19/27) XS2006277508 % 100 EUR 103.045 103,045.00 0.12
1.8500 % Bunge Finance Europe B.V. EO-Notes 2016(16/23) XS1405777316 % 100 EUR 102.944 102,944.00 0.12
2.7500 % Cemex S.A.B. de C.V. EO-Notes 2017(17/24) Reg.S XS1731106347 % 250 EUR 101.181 252,952.50 0.29
0.8300 % Chile, Republik EO-Bonds 2019(31/31) XS1843433639 % 500 EUR 102.676 513,380.00 0.60
0.5000 % China, People's Republic of EO-Notes 2019(31/31) XS2078533218 % 300 EUR 100.493 301,479.00 0.35
0.7500 % Comcast Corp. EO-Notes 2020(20/32) XS2114852564 % 200 EUR 103.793 207,586.00 0.24
0.0000 % Europäische Union EO-Medium-Term Notes 2020(35) EU000A285VM2 % 110 EUR 102.717 112,988.70 0.13
0.8350 % Exxon Mobil Corp. EO-Notes 2020(20/32) Reg.S XS2196322403 % 200 EUR 102.708 205,416.00 0.24
1.7500 % Fomento Econom.Mexica.SAB D.CV EO-Notes 2016(16/23) XS1378895954 % 200 EUR 103.973 207,946.00 0.24
3.5000 % Getlink SE EO-Notes 2020(20/25) Reg.S XS2247623643 % 200 EUR 103.951 207,902.00 0.24
0.6250 % Illinois Tool Works Inc. EO-Notes 2019(19/27) XS1843435170 % 400 EUR 104.577 418,308.00 0.49
The notes to the statement of assets are an integral part of the annual report. Page 50

BANTLEON ANLEIHENFONDS - Bantleon Yield Plus
Statement of assets as at 30/11/2020
Description ISIN Quantity or Holdings Currency Price Market value %
Shares or 30/11/2020 in EUR of the Fund
% in 1,000 assets *)
2.2500 % IQVIA Inc. EO-Notes 2019(19/28) Reg.S XS2036798150 % 400 EUR 100.922 403,688.00 0.47
1.6250 % Mexiko EO-Medium-Term Nts 2015(15/24) XS1198102052 % 400 EUR 104.033 416,132.00 0.49
1.6250 % Mexiko EO-Medium-Term Nts 2019(19/26) XS1974394675 % 600 EUR 103.182 619,092.00 0.72
3.1250 % Mylan N.V. EO-Notes 2016(16/28) XS1492458044 % 200 EUR 119.148 238,296.00 0.28
3.6250 % PVH Corp. EO-Notes 2016(16/24) Reg.S XS1435229460 % 100 EUR 108.381 108,381.00 0.13
1.3500 % WPC Eurobond B.V. EO-Notes 2019(19/28) XS2052968596 % 400 EUR 103.647 414,588.00 0.48
6.4500 % América Móvil S.A.B. de C.V. MN-Notes 2012(22) XS0860706935 % 6,000 MXN 101.530 252,705.72 0.29
4.8750 % Com. Federal de Electr. (CFE) DL-Notes 2011(11/21) Reg.S USP30179AJ79 % 600 USD 101.938 511,351.89 0.60
5.8500 % Devon Energy Corp. DL-Notes 2015(15/25) US25179MAV54 % 100 USD 114.914 96,073.91 0.11
3.8000 % Eastman Chemical Co. DL-Notes 2014(14/25) US277432AR19 % 500 USD 110.355 461,311.76 0.54
3.8000 % Halliburton Co. DL-Notes 2015(15/25) US406216BG59 % 400 USD 110.598 369,862.05 0.43
2.7000 % Honeywell International Inc. DL-Notes 2019(19/29) US438516BU93 % 200 USD 111.955 187,200.07 0.22
4.0000 % MSCI Inc. DL-Notes 2019(19/29) Reg.S USU5521TAE20 % 400 USD 106.878 357,421.62 0.42
3.1250 % Telstra Corp. Ltd. DL-Notes 2015(15/25) Reg.S USQ8940FAA23 % 500 USD 109.493 457,708.39 0.53
2.1250 % United States of America DL-Inflation-Prot. Secs 10(40) US912810QF84 % 500 USD 185.140 773,931.80 0.90
0.1250 % United States of America DL-Inflation-Prot. Secs 20(30) US912828ZZ63 % 800 USD 112.362 751,523.14 0.88
Unlisted securities EUR 183,180.34 0.21
Interest-bearing securities EUR 183,180.34 0.21
2.9500% ITC Holdings Corp. DL-Notes 2020(20/30) 144A US465685AQ80 % 200 USD 109.551 183,180.34 0.21
Total securities assets EUR 83,493,129.35 97.34
Derivatives EUR 133,451.68 0.16
The notes to the statement of assets are an integral part of the annual report. Page 51

BANTLEON ANLEIHENFONDS - Bantleon Yield Plus
Statement of assets as at 30/11/2020
Description ISIN Quantity or Holdings Currency Price Market value %
Shares or 30/11/2020 in EUR of the Fund
% in 1,000 assets *)
Bank balances, non-securitised money market instruments and money market funds EUR 1,838,725.40 2.14
Bank balances EUR 1,838,725.40 2.14
Balances with UBS Europe SE
Balances in the Fund currency
1,208,333.15 EUR 1,208,333.15 1.41
Balances in other EU/EEA currencies
833.31 NOK 78.67 0.00
Balances in non-EU/EEA currencies
55,795.61 AUD 34,380.19 0.04
24,450.87 CAD 15,776.79 0.02
75,313.90 CHF 69,554.77 0.08
2,058.97 GBP 2,298.47 0.00
1,869,784.48 MXN 77,564.14 0.09
92.09 NZD 54.13 0.00
185,956.10 RUB 2,032.67 0.00
495,179.77 USD 413,995.30 0.48
Credit balances in non-EU/EEA currencies (variation margin)
17,531.38 USD 14,657.12 0.02
Other assets EUR 519,282.41 0.61
Interest claims 515,091.83 EUR 515,091.83 0.60
Other receivables 4,190.58 EUR 4,190.58 0.01
Liabilities EUR -206,263.41 -0.25
Interest payable -33,801.98 EUR -33,801.98 -0.04
All-in fee -155,305.41 EUR -155,305.41 -0.18
Taxe d’abonnement -17,156.02 EUR -17,156.02 -0.02
Fund assets EUR 85,778,325.43 100.00
The notes to the statement of assets are an integral part of the annual report. Page 52

BANTLEON ANLEIHENFONDS - Bantleon Yield Plus
Statement of assets as at 30/11/2020
Description ISIN Quantity or Holdings Currency Price Market value %
Shares or 30/11/2020 in EUR of the Fund
% in 1,000 assets *)
Bantleon Yield Plus IA
Unit value EUR 105.46
Issuing price 1)
EUR 105.46
Redemption price 1)
EUR 105.46
Units in circulation Quantity 393,759.000
Bantleon Yield Plus IT
Unit value EUR 113.53
Issuing price 1)
EUR 113.53
Redemption price 1)
EUR 113.53
Units in circulation Quantity 373,826.893
Bantleon Yield Plus PA
Unit value EUR 104.35
Issuing price 1)
EUR 104.35
Redemption price 1)
EUR 104.35
Units in circulation Quantity 17,380.565
1) The issue and redemption prices shown are swing prices. More detailed information on swing pricing can be found in the notes.
*) As the per cent holding is rounded off for purposes of calculation, marginal rounding differences can occur.
**) Of which 1,000 have been provided as collateral
The notes to the statement of assets are an integral part of the annual report. Page 53

BANTLEON ANLEIHENFONDS - Bantleon Yield Plus
Derivatives as of 30/11/2020
Financial futures contracts as of 30/11/2020 Acquisition Unrealised
Name Maturity Quantity Currency price Price Daily rate Liability Results
in currency in currency in EUR in EUR
FUTURE 10Y TREASURY NOTE (SYNTH.) 03/21 CBOT 22.03.2021 -20.00 USD 137.9116 138.1563 2,310,112.03 -4,056.18
FUTURE ULTRA 10Y TREAS.NOTE 03/21 CBOT 22.03.2021 -20.00 USD 156.7015 157.0469 2,625,982.36 -5,741.31
FUTURE US LONG BOND (SYNTH.) 03/21 CBOT 22.03.2021 -7.00 USD 174.3417 174.7500 1,022,698.77 -2,377.52
Total financial futures contracts -12,175.01
Foreign exchange futures contracts as of 30/11/2020
Currency Amount Currency Amount Liability Maturity Unrealised Results Counterparty
in EUR in EUR
Sales CAD -800,000.00 Purchases EUR 517,874.44 516,195.64 15.12.2020 1,833.65 State Street Bank International GmbH
Sales MXN -15,000,000.00 Purchases EUR 616,639.98 622,243.98 15.12.2020 -4,456.87 State Street Bank International GmbH
Purchases MXN 8,000,000.00 Sales EUR -334,116.00 331,863.45 15.12.2020 -2,864.34 State Street Bank International GmbH
Purchases MXN 7,000,000.00 Sales EUR -293,913.39 290,380.52 15.12.2020 -4,068.19 State Street Bank International GmbH
Sales USD -6,600,000.00 Purchases EUR 5,584,030.35 5,517,933.28 15.12.2020 68,067.09 Nomura Financial Products Europe
GmbH - Frankfurt
Total foreign exchange futures contracts 58,511.34
Swaps as at 30/11/2020
Name Maturity Currency Nominal Dividend Coupon Liability Unrealised Results Counterparty
in % in EUR in EUR
Credit default swaps
Eastman Chemical Co. DL-Debts 1997(27) 22/06/2020 / 20/06/2025 20.06.2025 USD 500,000 1.0000 544,574.03 -9,686.14 JP Morgan Securities plc London
ITraxx Europe Crossover Ser.34 Index (5 year) 21/09/2020 / 20/12/2025 20.12.2025 EUR 3,600,000 5.0000 3,600,000.00 *) 392,104.70 JP Morgan Securities plc (OTC) London
CDX NA HY Series 35 V1 Index (5 Years) 21/09/2020 / 20/12/2025 20.12.2025 USD 4,000,000 5.0000 3,344,201.99 *) -295,303.21 JP Morgan Securities plc (OTC) London
Total of swaps 87,115.35
Total derivatives 133,451.68
*) There is no current reference value for these swaps. In this case, therefore, the notional is used to calculate the obligation as recommended in CESR guideline 10-788.
Page 54

BANTLEON ANLEIHENFONDS - Bantleon Yield Plus
Statement of operations (including income equalisation)
for the period from 01/12/2019 to 30/11/2020Total
I. Income
- Interest from securities EUR 1,228,021.08
- Interest from liquidity investments *) EUR -12,386.43
- Other income EUR 3,211.78
Total income EUR 1,218,846.43
II. Expenses
- Interest from short-term borrowing EUR -2,098.04
- All-in fee EUR -380,612.11
- Taxe d`abonnement EUR -9,671.86
- Foreign withholding tax EUR -15,681.35
- Compensation of expenses EUR 40,956.52
- Other expenses EUR -41,192.88
Total expenses EUR -408,299.72
III. Ordinary net result EUR 810,546.71
IV. Disposals
1. Realised gains from EUR 2,514,936.27
- Securities transactions EUR 1,069,936.98
- Forward exchange transactions EUR 451,886.61
- Financial futures contracts EUR 699,380.04
- Swaps EUR 258,896.63
- Foreign exchange EUR 34,836.03
2. Realised losses from EUR -3,037,319.96
- Securities transactions EUR -1,450,858.99
- Forward exchange transactions EUR -400,007.13
- Financial futures contracts EUR -526,481.20
- Swaps EUR -472,879.64
- Foreign exchange EUR -187,093.00
3. Realised result on subscriptions/redemptions **) 10,633.60
Realised result EUR -511,750.09
V. Net change in unrealised gains/losses
- Net change in unrealised gains EUR 1,070,431.95
- Net change in unrealised losses EUR -641,427.07
Net change in unrealised profits EUR 429,004.88
VI. Result of the reporting period EUR 727,801.50
*) The "Interest from liquidity investments" includes negative credit interest in the amount of EUR 15,556.43.
**) The item realised result from subscriptions/redemptions shows effects of swing pricing. More detailed information on swing pricing can be found in the notes.
The notes to the statement of assets are an integral part of the annual report. Page 55

BANTLEON ANLEIHENFONDS - Bantleon Yield Plus
Statement of changes in net assets 2019/2020I. Value of the Fund at the beginning of the reporting period EUR 100,330,695.97
1. Distribution for the previous year EUR -907,524.29
2. Interim distributions EUR 0.00
3. Inflow/outflow of funds (net) EUR -14,418,460.00
a) Cash inflows from unit certificate sales EUR 20,770,761.45
b) Cash outflows from unit certificate redemptions EUR -35,189,221.45
4. Income/expense equalisation EUR 45,812.25
5. Result of the reporting period *) EUR 727,801.50
II. Net asset value at the end of the financial year EUR 85,778,325.43
*) This amount includes the effects of swing pricing for subscriptions and redemptions. More detailed information on swing pricing can be found in the notes.
The notes to the statement of assets are an integral part of the annual report. Page 56

BANTLEON ANLEIHENFONDS - Bantleon Yield Plus
Bantleon Yield Plus IA
Comparison with the last three financial years
Financial year Units in circulation at the Fund assets at the Unit value at the
end of the financial year end of the financial year end of the financial year
30/11/2018 Quantity 722,949.000 EUR 74,593,683.71 EUR 103.18
31/05/2019 Quantity 622,955.000 EUR 64,817,476.27 EUR 104.05
30/11/2019 Quantity 577,205.000 EUR 60,954,123.55 EUR 105.60
30/11/2020 Quantity 393,759.000 EUR 41,525,650.80 EUR 105.46
Change in the number of units in circulation in the reporting period Quantity
Units in circulation at the beginning of the reporting period 577,205.000
Units issued 3,860.000
Units redeemed -187,306.000
Units in circulation in the end of the reporting period 393,759.000
Page 57

BANTLEON ANLEIHENFONDS - Bantleon Yield Plus
Bantleon Yield Plus IT
Comparison with the last three financial years
Financial year Units in circulation at the Fund assets at the Unit value at the
end of the financial year end of the financial year end of the financial year
30/11/2018 Quantity 221,291.716 EUR 23,739,731.39 EUR 107.28
31/05/2019 Quantity 308,054.328 EUR 34,011,656.56 EUR 110.41
30/11/2019 Quantity 331,416.180 EUR 37,134,510.73 EUR 112.05
30/11/2020 Quantity 373,826.893 EUR 42,438,995.82 EUR 113.53
Change in the number of units in circulation in the reporting period Quantity
Units in circulation at the beginning of the reporting period 331,416.180
Units issued 176,541.857
Units redeemed -134,131.144
Units in circulation in the end of the reporting period 373,826.893
Page 58

BANTLEON ANLEIHENFONDS - Bantleon Yield Plus
Bantleon Yield Plus PA
Comparison with the last three financial years
Financial year Units in circulation at the Fund assets at the Unit value at the
end of the financial year end of the financial year end of the financial year
30/11/2018 Quantity 21,690.000 EUR 2,225,118.84 EUR 102.59
31/05/2019 Quantity 22,920.176 EUR 2,375,483.22 EUR 103.64
30/11/2019 Quantity 21,361.565 EUR 2,242,061.68 EUR 104.96
30/11/2020 Quantity 17,380.565 EUR 1,813,678.81 EUR 104.35
Change in the number of units in circulation in the reporting period Quantity
Units in circulation at the beginning of the reporting period 21,361.565
Units issued 5,357.000
Units redeemed -9,338.000
Units in circulation in the end of the reporting period 17,380.565
Page 59

BANTLEON ANLEIHENFONDS - Bantleon Diversified Duration (liquidated)
Statement of operations (including income equalisation)
for the period from 01/12/2019 to 04/09/2020Total
I. Income
- Interest from securities EUR 262,168.37
- Interest from liquidity investments *) EUR -3,884.71
- Other income EUR 701.52
Total income EUR 258,985.19
II. Expenses
- Interest from short-term borrowing EUR -7,130.38
- All-in fee EUR -27,384.95
- Taxe d`abonnement EUR -1,018.11
- Compensation of expenses EUR 3,209.52
Total expenses EUR -32,323.92
III. Ordinary net result EUR 226,661.27
IV. Disposals
1. Realised gains from EUR 258,005.26
- Securities transactions EUR 323.12
- Financial futures contracts EUR 257,149.70
- Foreign exchange EUR 532.44
2. Realised losses from EUR -1,039,126.98
- Securities transactions EUR -496,113.54
- Financial futures contracts EUR -532,191.10
- Foreign exchange EUR -10,822.34
3. Realised result on subscriptions/redemptions **) 1,126.42
Realised result EUR -779,995.30
V. Net change in unrealised gains/losses
- Net change in unrealised gains EUR -18,038.11
- Net change in unrealised losses EUR 197,747.77
Net change in unrealised profits EUR 179,709.66
VI. Result of the reporting period EUR -373,624.37
*) The "Interest from liquidity investments" includes negative credit interest in the amount of EUR 4,551.85.
**) The item realised result from subscriptions/redemptions shows effects of swing pricing. More detailed information on swing pricing can be found in the notes.
The notes to the statement of assets are an integral part of the annual report. Page 60

BANTLEON ANLEIHENFONDS - Bantleon Diversified Duration (liquidated)
Statement of changes in net assets 2019/2020I. Value of the Fund at the beginning of the reporting period EUR 19,945,898.88
1. Distribution for the previous year EUR -199,248.59
2. Interim distributions EUR 0.00
3. Inflow/outflow of funds (net) EUR -19,347,168.38
a) Cash inflows from unit certificate sales EUR 111,090.82
b) Cash outflows from unit certificate redemptions *) EUR -19,458,259.20
4. Income/expense equalisation EUR -25,857.53
5. Result of the reporting period **) EUR -373,624.37
II. Net asset value at the end of the financial year EUR 0.00
*) Cash outflows from unit certificate redemptions includes the Fund assets of the BANTLEON ANLEIHENFONDS - Bantleon Diversified Duration (liquidated) sub-fund,
which has been wound up as of the last valuation date 04/09/2020, in the amount of EUR 13,813,498.24.
**) This amount includes the effects of swing pricing for subscriptions and redemptions. More detailed information on swing pricing can be found in the notes.
The notes to the statement of assets are an integral part of the annual report. Page 61

BANTLEON ANLEIHENFONDS - Bantleon Diversified Duration (liquidated)
Bantleon Diversified Duration (liquidated) IA
Comparison with the last three financial years
Financial year Units in circulation at the Fund assets at the Unit value at the
end of the financial year end of the financial year end of the financial year
30/11/2018 Quantity 350,656.028 EUR 34,479,990.81 EUR 98.33
31/05/2019 Quantity 365,620.947 EUR 35,419,354.28 EUR 96.87
30/11/2019 Quantity 204,378.495 EUR 19,944,900.18 EUR 97.59
04/09/2020 (wind up) Quantity 146,828.127 EUR 13,812,525.56 EUR 94.07
Change in the number of units in circulation in the reporting period Quantity
Units in circulation at the beginning of the reporting period 204,378.495
Units issued 1,169.632
Units redeemed -205,548.127 *)
Units in circulation in the end of the reporting period 0.000
*) includes units redeemed due to winding up
Page 62

BANTLEON ANLEIHENFONDS - Bantleon Diversified Duration (liquidated)
Bantleon Diversified Duration (liquidated) IT
Comparative overview since inception
Financial year Units in circulation at the Fund assets at the Unit value at the
end of the financial year end of the financial year end of the financial year
30/11/2018 *) Quantity 10.000 EUR 996.92 EUR 99.69
31/05/2019 Quantity 10.000 EUR 991.59 EUR 99.16
30/11/2019 Quantity 10.000 EUR 998.70 EUR 99.87
04/09/2020 (wind up) Quantity 10.000 EUR 972.68 EUR 97.27
*) Date of issue 03/08/2018
Change in the number of units in circulation in the reporting period Quantity
Units in circulation at the beginning of the reporting period 10.000
Units issued 0.000
Units redeemed -10.000 **)
Units in circulation in the end of the reporting period 0.000
**) includes units redeemed due to winding up
Page 63

KPMG Luxembourg, Société coopérative Tel.: +352 22 51 51 1
39, Avenue John F. Kennedy Fax: +352 22 51 71
L-1855 Luxembourg E-mail: [email protected]
Internet: www.kpmg.lu
To the Unitholders of BANTLEON ANLEIHENFONDS
Basis for opinion
We conducted our audit in accordance with the Law of 23 July 2016 on the audit profession (“Law of 23 July 2016”) and with International Standards on Auditing (“ISAs”) as adopted for Luxembourg by the Commission de Surveillance du Secteur
Financier (“CSSF”). Our responsibilities under the Law of 23 July 2016 and ISAs as adopted for Luxembourg by the CSSF are further described in the «Responsibilities of “réviseur d’entreprises agréé” for the Audit of the Financial Statements»
section of our report. We are also independent of the Fund in accordance with the International Code of Ethics for Professional Accountants, including International Independence Standards, issued by the International Ethics Standards Board for
Accountants (“IESBA Code”) as adopted for Luxembourg by the CSSF together with the ethical requirements that are relevant to our audit of the financial statements, and have fulfilled our other ethical responsibilities under those ethical
requirements. We believe that the audit evidence we have obtained is sufficient and appropriate to provide a basis for our opinion.
Other information
The Management Board of the Fund’s Management Company is responsible for the other information. The other information comprises the information stated in the annual report but does not include the financial statements and our report of
“réviseur d’entreprises agréé” thereon.
Our opinion on the financial statements does not cover the other information and we do not express any form of assurance conclusion thereon.
In connection with our audit of the financial statements, our responsibility is to read the other information and, in doing so, consider whether the other information is materially inconsistent with the financial statements or our knowledge obtained in
the audit or otherwise appears to be materially misstated. If, based on the work we have performed, we conclude that there is a material misstatement of this other information, we are required to report this fact. We have nothing to report in this
regard.
REPORT OF THE REVISEUR D’ENTREPRISES AGREE
Report on the audit of the financial statements
Opinion
We have audited the financial statements of BANTLEON ANLEIHENFONDS and each of its sub-funds (“the Fund”), which comprise the statement of net assets as at 30 November 2020 and the statement of operations and the statement of
changes in net assets for the year then ended, and notes to the financial statements, including a summary of significant accounting policies.
In our opinion, the accompanying financial statements give a true and fair view of the financial position of BANTLEON ANLEIHENFONDS and each of its sub-funds as at 30 November 2020, and of the results of their operations and changes in
their net assets for the year then ended in accordance with Luxembourg legal and regulatory requirements relating to the preparation and presentation of the financial statements.
Page 64

•
•
•
•
•
Luxembourg, KPMG Luxembourg, Société coopérative
Cabinet de révision agréé
S. Kraiker
Conclude on the appropriateness of the Management Board of the Fund’s Management Company use of the going concern basis of accounting and, based on the audit evidence obtained, whether a material uncertainty exists related to events
or conditions that may cast significant doubt on the Fund’s or any of its sub-funds’ ability to continue as a going concern. If we conclude that a material uncertainty exists, we are required to draw attention in our report of the “réviseur
d’entreprises agréé” to the related disclosures in the financial statements or, if such disclosures are inadequate, to modify our opinion. Our conclusions are based on the audit evidence obtained up to the date of our report of the “réviseur
d’entreprises agréé”. However, future events or conditions may cause the Fund or any of its sub-funds to cease to continue as a going concern.
Evaluate the overall presentation, structure and content of the financial statements, including the disclosures, and whether the financial statements represent the underlying transactions and events in a manner that achieves fair presentation.
We communicate with those charged with governance regarding, among other matters, the planned scope and timing of the audit and significant audit findings, including any significant deficiencies in internal control that we identify during our audit.
The audited financial statements of BANTLEON ANLEIHENFONDS and each of its sub-funds as at 30 November 2020 including the audit report in English are a free translation, only the German version of the financial statements
has been audited by the Réviseur d’Entreprises Agréé and only the German version of the financial statements including the audit report are binding.
Responsibilities of the “réviseur d’entreprises agréé” for the audit of the financial statements
The objectives of our audit are to obtain reasonable assurance about whether the financial statements as a whole are free from material misstatement, whether due to fraud or error, and to issue a report of “réviseur d’entreprises agréé” that
includes our opinion. Reasonable assurance is a high level of assurance, but is not a guarantee that an audit conducted in accordance with the Law of 23 July 2016 and with ISAs as adopted for Luxembourg by the CSSF will always detect a
material misstatement when it exists. Misstatements can arise from fraud or error and are considered material if, individually or in the aggregate, they could reasonably be expected to influence the economic decisions of users taken on the basis of
these financial statements.
As part of an audit in accordance with the Law of 23 July 2016 and with ISAs as adopted for Luxembourg by the CSSF, we exercise professional judgment and maintain professional skepticism throughout the audit. We also:
Identify and assess the risks of material misstatement of the financial statements, whether due to fraud or error, design and perform audit procedures responsive to those risks, and obtain audit evidence that is sufficient and appropriate to
provide a basis for our opinion. The risk of not detecting a material misstatement resulting from fraud is higher than for one resulting from error, as fraud may involve collusion, forgery, intentional omissions, misrepresentations, or the override
of internal control.
Obtain an understanding of internal control relevant to the audit in order to design audit procedures that are appropriate in the circumstances, but not for the purpose of expressing an opinion on the effectiveness of the Fund’s internal control.
Evaluate the appropriateness of accounting policies used and the reasonableness of accounting estimates and related disclosures made by the Management Board of the Fund’s Management Company.
Responsibilities of the Management Board of the Fund’s Management Company and Those Charged with Governance for the financial statements
The Management Board of the Fund’s Management Company is responsible for the preparation and fair presentation of these financial statements in accordance with Luxembourg legal and regulatory requirements relating to the preparation and
presentation of the financial statements, and for such internal control as the Management Board of the Fund’s Management Company determines is necessary to enable the preparation of financial statements that are free from material
misstatement, whether due to fraud or error.
In preparing the financial statements, the Management Board of the Fund’s Management Company is responsible for assessing the Fund’s and each of its sub-funds’ ability to continue as a going concern, disclosing, as applicable, matters related
to going concern and using the going concern basis of accounting unless the Management Board of the Fund’s Management Company either intends to liquidate the Fund or any of its sub-funds or to cease operations, or has no realistic alternative
but to do so.
Those charged with governance are responsible for overseeing the Fund’s financial reporting process.
Page 65