banking structure and regulation in 1993 and · pdf filejune 2014 banking structure and...
TRANSCRIPT
June 2014
BANKING STRUCTURE AND REGULATION IN1993 AND 2013A Cross-Country Comparison
James R. Barth, Daniel E. Nolle, and Apanard (Penny) Prabha

James R. Barth, Daniel E. Nolle, and Apanard (Penny) Prabha
June 2014
BANKING STRUCTURE AND REGULATION IN1993 AND 2013A Cross-Country Comparison

ABOUT THE MILKEN INSTITUTEA nonprofit, nonpartisan economic think tank, the Milken Institute works to improve lives around the world by advancing innovative economic and policy solutions that create jobs, widen access to capital, and enhance health. We produce rigorous, independent economic research—and maximize its impact by convening global leaders from the worlds of business, finance, government, and philanthropy. By fostering collaboration between the public and private sectors, we transform great ideas into action.
© 2014 Milken InstituteThis work is made available under the terms of the Creative Commons Attribution-NonCommercial-NoDerivs 3.0 Unported License, available at creativecommons.org/licenses/by-nc-nd/3.0/

TABLE OF CONTENTS
EXECUTIVE SUMMARY ........................................................................ 1
INTRODUCTION.................................................................................... 3
1. INTERTEMPORAL CROSS-COUNTRY DATA SET ............................. 5
2. THE CHANGING CHARACTERISTICS OF BANKING INDUSTRY STRUCTURE ................................................ 9
3. BANKING REGULATION OVER TWO TURBULENT DECADES .......................................................................13
4. BANKING SUPERVISION ................................................................ 29
5. SUMMARY AND CONCLUSIONS ......................................................31
APPENDIX .......................................................................................... 33
ABOUT THE AUTHORS ....................................................................... 39
1
EXECUTIVE SUMMARY
After two decades of extreme turbulence in banking and financial markets around the world, it is reasonable to ask about the current status of banking regulation and supervision. Our unique starting point for answering that question comes from the fact that 20 years ago we developed the first detailed, multi-country database on banking regulation and supervision. We now compare that 1993 data–the oldest of its kind available–for 19 developed market economies to similar data from the most recent (2011-2012) World Bank survey on banking supervision and regulation. Key observations emerging from our intertemporal cross-country analysis include the following: (1) The very largest banks retain the same kind of dominance in 2011 as they did 20 years ago (before the continued occurrence of ever-more serious financial crises). (2) In the case of some basic banking activities, including funding practices, the nature of systemic risks seems to have remained the same, if not worsened, over time. (3) In at least one respect–scope of coverage–deposit insurance schemes have changed in a way that encourages moral hazard behavior. These observations suggest that there is much more work to be done to address banking risks, starting with the collection and analysis of additional data to help us understand how well banking policies and practices are succeeding around the world.*
*The opinions expressed in this paper are the authors’ alone and should not be interpreted as representing those of the Office of the Comptroller of the Currency or the Treasury Department of the United States.

3
INTRODUCTION
The global financial crisis of 2008-2009 generated a flurry of policy responses, at the national and international levels, to reform financial markets. To date, the primary focus has been on reforming the operations of the banking industry, particularly by strengthening regulation and supervision. In contrast to the somewhat uneven progress on policy measures targeting nonbank financial institutions and markets, many banking system reforms have been fully implemented, or are in the process of being implemented. Given these circumstances and the timing—it has been well over five years since the full eruption of the global financial crisis in fall 2008—we pose this question: “What is the status of banking regulatory and supervisory policies around the world now?” A corollary question immediately arises: “Current status, as compared to what?”
The purpose of this paper is to answer those two questions, exploiting our unique vantage point: Two decades ago, two of us (along with a third co-author) constructed the first detailed and wide-ranging cross-country data set on banking structure, regulation, and supervision, and established the “prototype” pattern for analyzing such data.1 Since then, subsequent data collection efforts in this vein have appeared, the most substantial of which are the four surveys of banking supervisory authorities in roughly 180 countries undertaken and published by the World Bank.2 Studies using the World Bank’s Bank Supervision and Regulation Survey (“World Bank survey”) data continue to proliferate, and we follow in their footsteps here by using the most recent survey data (focusing mostly on 2011) in combination with other relevant data from 2013 to paint a fairly contemporary landscape. However, because our original data set covered 1993 (with, as noted below, a few exceptions), we are able to span an approximately 20-year “then vs. now” time period, which is at least half a decade longer than any other comparable study can cover. Our greater span of time is conceptually meaningful in that our starting point, 1993, is representative of the last broadly stable period–the early 1990s–in financial markets. Indeed, one could argue that the subsequent 20 years constitute the two most turbulent decades in financial markets history.3
The article is organized as follows:
Section I describes the nature of our data set, focusing on key facets of its two major components. Our “then” component is the 1993 data, drawn from our original Barth, Nolle, and Rice (1997a) study (henceforth, “BNR”) of banking structure, regulation, and supervision in 19 developed market economies. Our “now” data set centers on 2011-2013, and is primarily drawn from the most recent World Bank survey.
1. We originally published the results of those efforts in Barth, James R., Daniel E. Nolle, and Tara N. Rice (1997a) “Commercial Banking Structure, Regulation, and Performance: An International Comparison,” Economics Working Paper 97-6, Office of the Comptroller of the Currency (March). A shorter version of this paper was published, “Commercial Banking Structure, Regulation, and Performance: An International Comparison,” Managerial Finance, 23(11), 1997b.
2. Section I of the current paper summarizes the nature of, and includes a link to the World Bank’s Bank Supervision and Survey; especially in the cases of the earlier surveys, much of the work was directly undertaken or heavily influenced by one of this article’s current authors, James R. Barth, in cooperation with Gerard Caprio Jr. and Ross Levine.
3. Beginning in the mid-1990s and carrying on to the present, large-scale–and in a number of cases global–financial crises succeeded one another in rapid succession (including especially the East Asian crisis, the dot-com bubble and bust, the global mortgage market bubble and bust that generated the 2008-2009 global financial market crisis, and the European sovereign debt crisis).

BANKING STRUCTURE AND REGULATION IN 1993 AND 2013
4
Section II briefly highlights several basic changes in banking system structure revealed by comparing the 1993 and 2011-2013 data.
Section III presents information on banking regulation across countries and over time, focusing on three broad areas: 1) “banking powers,” by which we mean the degree to which regulations (and laws) allow banks to engage in activities beyond their “traditional” deposit-taking and lending; 2) capital requirements; and 3) deposit insurance schemes.
Section IV considers several key supervisory practices, including the nature of bank examinations, consumer protection measures, and reliance on market discipline in the form of external auditing.
Section V summarizes and concludes.
5
1. INTERTEMPORAL CROSS-COUNTRY DATA SET
When we undertook our original research in the mid-1990s, cross-country comparisons of any aspect of banking were relatively rare, and those that existed were limited in scope in two basic ways. First, with the exception of the United States and a few other countries, publicly available data on a national basis describing not only banking regulation and supervision, but even basic banking structure such as the number of banks, measures of bank size, and concentration in the banking industry were difficult and expensive to come by. Second, as a consequence of this, the international comparisons that appeared from time to time covered a small number of countries–typically, six or fewer.4 This section begins by briefly summarizing how we (i.e., Barth and Nolle, for the BNR work) responded to this situation by constructing the first “modern” cross-country data set on banking structure, regulation, and supervision, across a wide range of countries. It is that original data that we draw upon for the “then” (mostly 1993) component of the data set used in this article. Subsection I.B. summarizes the nature of the “now” (2011-2013) component of the data set, briefly explaining its direct connection to our original 1993 work.
1.A. OUR “THEN” (1993) DATA: GENESIS, CONSTRUCTION, CONTENTS
Facing the paucity of readily usable data outlined above, we took action on two fronts, ultimately combining the resultant data into the largest integrated cross-country data set at the time. First, we explored the contents and mastered the use of a private-sector data set covering basic structure, balance sheet, and income statement data—on a bank-specific basis—for (most) publicly traded banks in a wide range of countries. Up to that point, this BankScope data had been used almost exclusively to construct analyses of peer groups of competing banking companies for such purposes as furthering the business interests and market share of clients subscribing to the company’s database.5 We realized that, subject to careful filtering and other measures, we could build a country-by-country bank-specific data set to describe in a systematic and comparable way the banking system landscape for selected countries.
We also needed country-specific data on regulatory and supervisory practices. No such database existed, nor could a wide-ranging one be built by scouring country-specific sources. Under these circumstances we obtained the permission of the relevant authorities at the U.S. Office of the Comptroller of the Currency (OCC), where all three authors (Barth, Nolle, and Rice) were at that time employed, to ask bank regulatory authorities in selected countries for relevant bank structure, regulatory, and supervisory information.6 To do so necessitated the construction of a carefully designed survey instrument, and the composition of the appropriate
4. See Barth, Nolle, and Rice (1997a) for discussion and citations of the representative literature at that time.5. In the mid-1990s, the BankScope database was owned and maintained by Bureau van Dijk, IBCA.6. When the Barth, Nolle, and Rice (1997a) paper was produced, James R. Barth was a visiting scholar at the OCC; Daniel E. Nolle was (and remains) a senior financial
economist at the OCC; and, at that time, Tara N. Rice was a research assistant in the Economics Department of the OCC.
BANKING STRUCTURE AND REGULATION IN 1993 AND 2013
6
official letters of inquiry. It also required what to this day we remain most grateful for: expert, cooperative responses to the survey from supervisory authorities in 18 foreign countries (the U.S. data we were able to provide ourselves).
The regulatory and supervisory information for 1993 (and, in some cases, 1995) presented in the remainder of this article is from the original BNR data set which, it should be noted, covered more dimensions of regulation and supervision than are addressed in the current article. Our “then” component also includes country-specific data on the macroeconomy and size and composition of the financial services industry.
1.B. OUR “NOW” (2011-2013) DATA AND ITS COMPARABILITY WITH OUR “THEN” DATA
To date, the World Bank has collected detailed information on the banking systems by administering four surveys filled out by supervisory authorities in roughly 180 countries. Each subsequent survey has additional questions, refining the existing material in an effort to elicit standardized, closely comparable information from respondents and enhance the analytic utility of the data collected.7 Our “now” (2011-2013) component draws on selected aspects of World Bank survey IV, adding to that recent macroeconomic and financial system size and composition data from other sources, as noted in the tables below.
For the combined data set, several observations warrant special attention. First, there are direct, significant links between the World Bank surveys and the original BNR work. The most important of those links is a personal connection: Not long after completing his term as a visiting scholar at the OCC, Barth accepted a visiting position at the World Bank. While there, Barth became one of the three main architects of the first World Bank survey, along with Gerard Caprio Jr. (who at the time was employed at the World Bank) and Ross Levine (who at the time was a visiting scholar at the World Bank). Barth also continued to contribute to the construction of subsequent surveys. The three were also instrumental in creating and systematizing empirical methods for interpreting and analyzing survey results. In addition, Barth was able to use data he and Nolle collected by re-surveying their original set of countries in 1997 and 1998 to augment and filter data collected in the first World Bank survey.
The above discussion shows the strong conceptual and empirical connection between the two parts of the data set used in the current study. Nevertheless, it is important to note that in some cases it is not possible to make direct comparisons between the 1993 and 2013 data sets. Although the two components cover the same topics, the underlying definitions are different and/or the level of detail differs in some cases. Difficulties with comparability across time are noted in Sections II, III, and IV.
1.C. COUNTRY COVERAGE
The World Bank surveys cover roughly 180 countries, while the BNR data covers a much smaller group of 19 countries, which define the “cross-country” dimension of our current study. Table 1 lists the specific countries. BNR considered several factors in the selection of countries. Each country in the original study was included because its national banking system was large, and/or because it was a member of at least one of the international groups regarded
7. The first World Bank’s Bank Regulation and Supervision Survey, covering the 1998-2000 period, included 175 questions and was completed by 107 countries; the second survey, covering 2003, expanded coverage in two dimensions by asking 275 questions that were completed by 152 countries; Survey III, covering 2006, completed by 142 countries, contained more than 300 questions; and Survey IV surveyed 180 countries and was fully completed by 2012 by more than 125 countries. The current article draws on Survey IV. For full details of the surveys, see James R. Barth, Gerard Caprio Jr., and Ross Levine: “Bank Regulation and Supervision in 180 Countries from 1999 to 2011,” Journal of Financial Economic Policy, Volume 5, Issue 2, pp. 111-220, 2013. Also, the survey data are available at the World Bank website: http://econ.worldbank.org/WBSITE/EXTERNAL/EXTDEC/EXTRESEARCH/0,,contentMDK:20345037~pagePK:64214825~piPK:64214943~theSitePK:469382,00.html.
7
INTERTEMPORAL CROSS-COUNTRY DATA SET
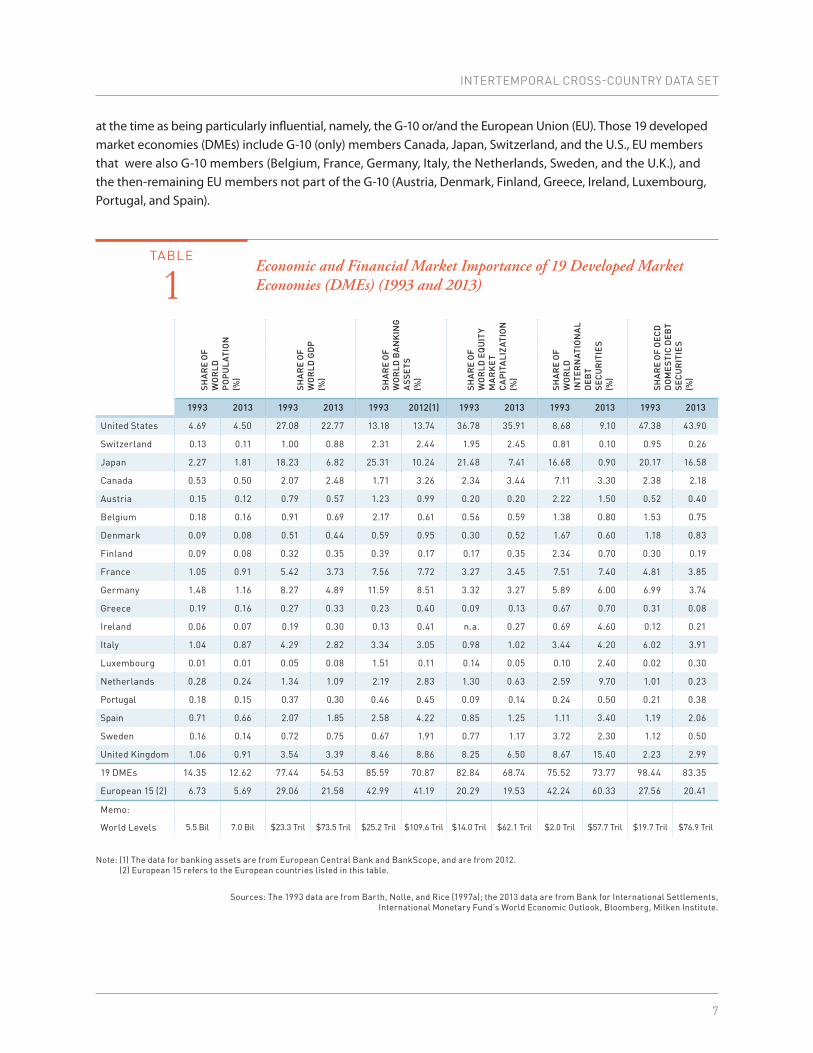
at the time as being particularly influential, namely, the G-10 or/and the European Union (EU). Those 19 developed market economies (DMEs) include G-10 (only) members Canada, Japan, Switzerland, and the U.S., EU members that were also G-10 members (Belgium, France, Germany, Italy, the Netherlands, Sweden, and the U.K.), and the then-remaining EU members not part of the G-10 (Austria, Denmark, Finland, Greece, Ireland, Luxembourg, Portugal, and Spain).
TABLE
1Economic and Financial Market Importance of 19 Developed Market Economies (DMEs) (1993 and 2013)
Note: (1) The data for banking assets are from European Central Bank and BankScope, and are from 2012. (2) European 15 refers to the European countries listed in this table.
Sources: The 1993 data are from Barth, Nolle, and Rice (1997a); the 2013 data are from Bank for International Settlements, International Monetary Fund’s World Economic Outlook, Bloomberg, Milken Institute.
SHA
RE
OF
WO
RLD
P
OP
UL
ATIO
N
(%)
SHA
RE
OF
WO
RLD
GD
P
(%)
SHA
RE
OF
WO
RLD
BA
NK
ING
A
SSE
TS
(%)
SHA
RE
OF
WO
RLD
EQ
UIT
Y M
AR
KE
T C
AP
ITA
LIZA
TIO
N
(%)
SHA
RE
OF
WO
RLD
IN
TER
NAT
ION
AL
DE
BT
SEC
UR
ITIE
S (%
)
SHA
RE
OF
OE
CD
D
OM
ES
TIC
DE
BT
SEC
UR
ITIE
S (%
)
1993 2013 1993 2013 1993 2012(1) 1993 2013 1993 2013 1993 2013
United States 4.69 4.50 27.08 22.77 13.18 13.74 36.78 35.91 8.68 9.10 47.38 43.90
Switzerland 0.13 0.11 1.00 0.88 2.31 2.44 1.95 2.45 0.81 0.10 0.95 0.26
Japan 2.27 1.81 18.23 6.82 25.31 10.24 21.48 7.41 16.68 0.90 20.17 16.58
Canada 0.53 0.50 2.07 2.48 1.71 3.26 2.34 3.44 7.11 3.30 2.38 2.18
Austria 0.15 0.12 0.79 0.57 1.23 0.99 0.20 0.20 2.22 1.50 0.52 0.40
Belgium 0.18 0.16 0.91 0.69 2.17 0.61 0.56 0.59 1.38 0.80 1.53 0.75
Denmark 0.09 0.08 0.51 0.44 0.59 0.95 0.30 0.52 1.67 0.60 1.18 0.83
Finland 0.09 0.08 0.32 0.35 0.39 0.17 0.17 0.35 2.34 0.70 0.30 0.19
France 1.05 0.91 5.42 3.73 7.56 7.72 3.27 3.45 7.51 7.40 4.81 3.85
Germany 1.48 1.16 8.27 4.89 11.59 8.51 3.32 3.27 5.89 6.00 6.99 3.74
Greece 0.19 0.16 0.27 0.33 0.23 0.40 0.09 0.13 0.67 0.70 0.31 0.08
Ireland 0.06 0.07 0.19 0.30 0.13 0.41 n.a. 0.27 0.69 4.60 0.12 0.21
Italy 1.04 0.87 4.29 2.82 3.34 3.05 0.98 1.02 3.44 4.20 6.02 3.91
Luxembourg 0.01 0.01 0.05 0.08 1.51 0.11 0.14 0.05 0.10 2.40 0.02 0.30
Netherlands 0.28 0.24 1.34 1.09 2.19 2.83 1.30 0.63 2.59 9.70 1.01 0.23
Portugal 0.18 0.15 0.37 0.30 0.46 0.45 0.09 0.14 0.24 0.50 0.21 0.38
Spain 0.71 0.66 2.07 1.85 2.58 4.22 0.85 1.25 1.11 3.40 1.19 2.06
Sweden 0.16 0.14 0.72 0.75 0.67 1.91 0.77 1.17 3.72 2.30 1.12 0.50
United Kingdom 1.06 0.91 3.54 3.39 8.46 8.86 8.25 6.50 8.67 15.40 2.23 2.99
19 DMEs 14.35 12.62 77.44 54.53 85.59 70.87 82.84 68.74 75.52 73.77 98.44 83.35
European 15 (2) 6.73 5.69 29.06 21.58 42.99 41.19 20.29 19.53 42.24 60.33 27.56 20.41
Memo:
World Levels 5.5 Bil 7.0 Bil $23.3 Tril $73.5 Tril $25.2 Tril $109.6 Tril $14.0 Tril $62.1 Tril $2.0 Tril $57.7 Tril $19.7 Tril $76.9 Tril
BANKING STRUCTURE AND REGULATION IN 1993 AND 2013
8
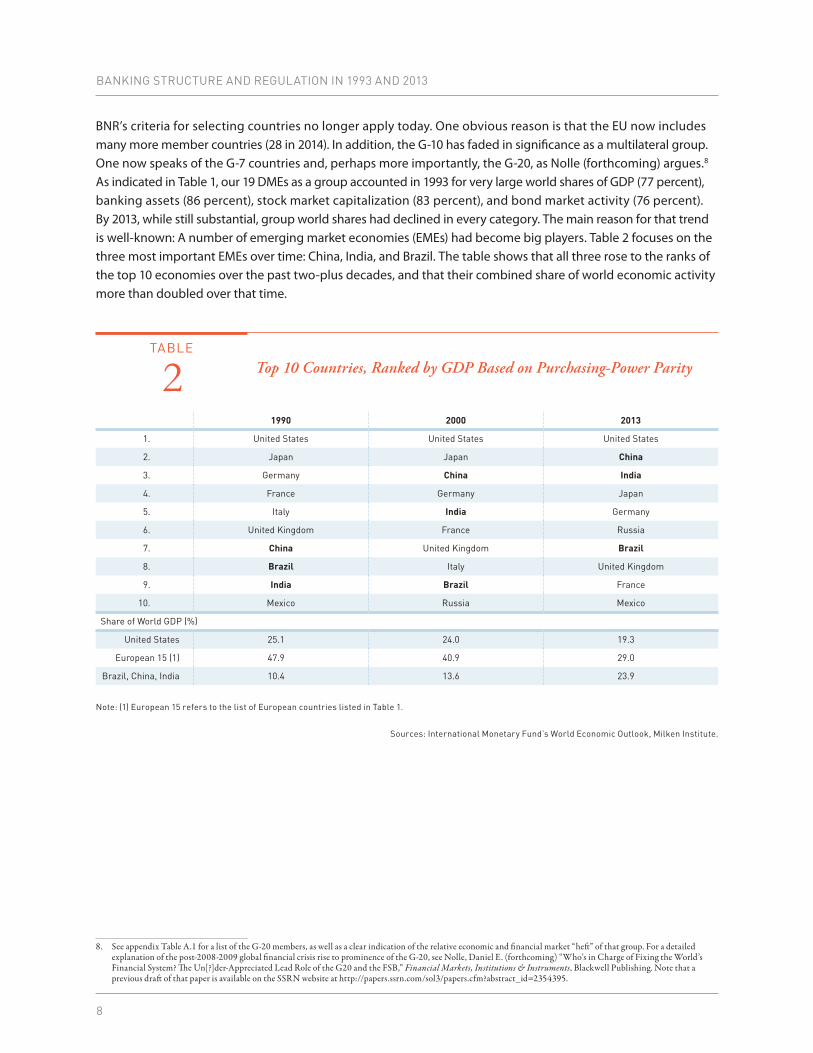
BNR’s criteria for selecting countries no longer apply today. One obvious reason is that the EU now includes many more member countries (28 in 2014). In addition, the G-10 has faded in significance as a multilateral group. One now speaks of the G-7 countries and, perhaps more importantly, the G-20, as Nolle (forthcoming) argues.8 As indicated in Table 1, our 19 DMEs as a group accounted in 1993 for very large world shares of GDP (77 percent), banking assets (86 percent), stock market capitalization (83 percent), and bond market activity (76 percent). By 2013, while still substantial, group world shares had declined in every category. The main reason for that trend is well-known: A number of emerging market economies (EMEs) had become big players. Table 2 focuses on the three most important EMEs over time: China, India, and Brazil. The table shows that all three rose to the ranks of the top 10 economies over the past two-plus decades, and that their combined share of world economic activity more than doubled over that time.
TABLE
2 Top 10 Countries, Ranked by GDP Based on Purchasing-Power Parity
Note: (1) European 15 refers to the list of European countries listed in Table 1.
Sources: International Monetary Fund’s World Economic Outlook, Milken Institute.
1990 2000 2013
1. United States United States United States
2. Japan Japan China
3. Germany China India
4. France Germany Japan
5. Italy India Germany
6. United Kingdom France Russia
7. China United Kingdom Brazil
8. Brazil Italy United Kingdom
9. India Brazil France
10. Mexico Russia Mexico
Share of World GDP (%)
United States 25.1 24.0 19.3
European 15 (1) 47.9 40.9 29.0
Brazil, China, India 10.4 13.6 23.9
8. See appendix Table A.1 for a list of the G-20 members, as well as a clear indication of the relative economic and financial market “heft” of that group. For a detailed explanation of the post-2008-2009 global financial crisis rise to prominence of the G-20, see Nolle, Daniel E. (forthcoming) “Who’s in Charge of Fixing the World’s Financial System? The Un[?]der-Appreciated Lead Role of the G20 and the FSB,” Financial Markets, Institutions & Instruments, Blackwell Publishing. Note that a previous draft of that paper is available on the SSRN website at http://papers.ssrn.com/sol3/papers.cfm?abstract_id=2354395.

9
2. THE CHANGING CHARACTERISTICS OF BANKING INDUSTRY STRUCTURE
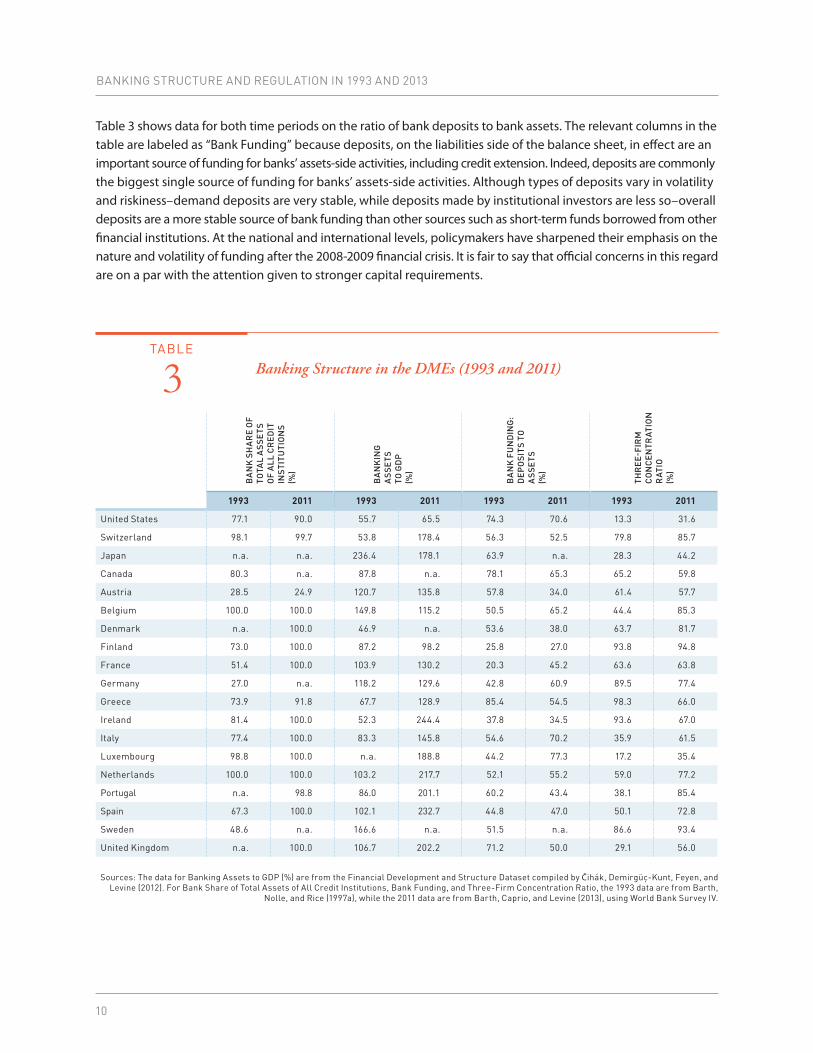
Following the framework of the discussion in BNR, in this section we present and discuss cross-country data on several basic characteristics of banking industry structure in 1993 and in 2013. Table 3 focuses on various gauges of banking industry size and concentration. Notably, the two data components use different definitions of the term “bank.” The respective underlying data sets (i.e., BNR and World Bank survey) can be consulted for complete details, but what we highlight here is that the BNR definition is narrower, for most countries, than that used by the World Bank surveys. The first left-hand column heading in Table 3 makes this clear. Banks, as narrowly defined for the 1993-based data collected by BNR, accounted in many countries for less than 100 percent of bank-like depository institutions; in the 2011 World Bank data, banks comprised most, or all, of what the World Bank survey terms bank-like “credit institutions.”9 Interestingly, even with a somewhat wider definition in the 2013 data, in one country, Austria, banks made up a smaller portion of all credit institutions in 2013 than in 1993.
The banking-assets-to-GDP columns in Table 3 provide a measure of the relative economic importance of countries’ banking industries. This standard metric compares a stock concept–bank assets–to a flow, GDP, but even so the intuition behind the measure is useful, especially when comparing the figures across countries. Focusing first on comparisons for a single time period, one can say, for example, that in 1993 the banking system of France, whose assets totaled about 104 percent of GDP, was about twice as big relative to that country’s economy as was the banking industry in the U.S., which accounted for about 56 percent of U.S. GDP.
Even though the two time periods differ in their definitions of what constitutes a bank, looking across the two time periods yields insight. Several points stand out when one ranks the countries in each time period from biggest to smallest in terms of the size of their banking systems relative to GDP (ranking not shown in the table). Country rankings vary considerably between the two time periods, with some countries moving up, and some moving down in 2011 compared to their rank in 1993. However, about half (eight) of the countries for which there is data in both time periods show roughly the same assets-to-GDP size in both time periods, an indication that banking industry growth was roughly in line with growth of the economy. Five countries show about a doubling in the banking-assets-to-GDP ratio in 2011 compared to 1993, and for these it is not possible on the basis of this information alone to say how much of the difference in ratios was due to definitional differences between the periods, and how much was due to differences in the growth of the banking industry compared to economic growth overall. Only two countries, Switzerland and Ireland, show a ratio in 2011 multiple times that in 1993; the factors at work in those cases bear additional investigation, but that is beyond the scope of the current article.
9. Basically, BNR asked countries to respond about depository institutions that are roughly equivalent to the U.S. concept of commercial banks.
BANKING STRUCTURE AND REGULATION IN 1993 AND 2013
10
Table 3 shows data for both time periods on the ratio of bank deposits to bank assets. The relevant columns in the table are labeled as “Bank Funding” because deposits, on the liabilities side of the balance sheet, in effect are an important source of funding for banks’ assets-side activities, including credit extension. Indeed, deposits are commonly the biggest single source of funding for banks’ assets-side activities. Although types of deposits vary in volatility and riskiness–demand deposits are very stable, while deposits made by institutional investors are less so–overall deposits are a more stable source of bank funding than other sources such as short-term funds borrowed from other financial institutions. At the national and international levels, policymakers have sharpened their emphasis on the nature and volatility of funding after the 2008-2009 financial crisis. It is fair to say that official concerns in this regard are on a par with the attention given to stronger capital requirements.
TABLE
3 Banking Structure in the DMEs (1993 and 2011)
Sources: The data for Banking Assets to GDP (%) are from the Financial Development and Structure Dataset compiled by Čihák, Demirgüç-Kunt, Feyen, and Levine (2012). For Bank Share of Total Assets of All Credit Institutions, Bank Funding, and Three-Firm Concentration Ratio, the 1993 data are from Barth,
Nolle, and Rice (1997a), while the 2011 data are from Barth, Caprio, and Levine (2013), using World Bank Survey IV.
BA
NK
SH
AR
E O
FTO
TAL
AS
SETS
O
F A
LL C
RE
DIT
IN
STI
TUTI
ON
S (%
)
BA
NK
ING
A
SSE
TSTO
GD
P(%
)
BA
NK
FU
ND
ING
:D
EP
OSI
TS T
O
AS
SETS
(%)
THR
EE-
FIR
MC
ON
CE
NTR
ATIO
N
RAT
IO(%
)
1993 2011 1993 2011 1993 2011 1993 2011
United States 77.1 90.0 55.7 65.5 74.3 70.6 13.3 31.6
Switzerland 98.1 99.7 53.8 178.4 56.3 52.5 79.8 85.7
Japan n.a. n.a. 236.4 178.1 63.9 n.a. 28.3 44.2
Canada 80.3 n.a. 87.8 n.a. 78.1 65.3 65.2 59.8
Austria 28.5 24.9 120.7 135.8 57.8 34.0 61.4 57.7
Belgium 100.0 100.0 149.8 115.2 50.5 65.2 44.4 85.3
Denmark n.a. 100.0 46.9 n.a. 53.6 38.0 63.7 81.7
Finland 73.0 100.0 87.2 98.2 25.8 27.0 93.8 94.8
France 51.4 100.0 103.9 130.2 20.3 45.2 63.6 63.8
Germany 27.0 n.a. 118.2 129.6 42.8 60.9 89.5 77.4
Greece 73.9 91.8 67.7 128.9 85.4 54.5 98.3 66.0
Ireland 81.4 100.0 52.3 244.4 37.8 34.5 93.6 67.0
Italy 77.4 100.0 83.3 145.8 54.6 70.2 35.9 61.5
Luxembourg 98.8 100.0 n.a. 188.8 44.2 77.3 17.2 35.4
Netherlands 100.0 100.0 103.2 217.7 52.1 55.2 59.0 77.2
Portugal n.a. 98.8 86.0 201.1 60.2 43.4 38.1 85.4
Spain 67.3 100.0 102.1 232.7 44.8 47.0 50.1 72.8
Sweden 48.6 n.a. 166.6 n.a. 51.5 n.a. 86.6 93.4
United Kingdom n.a. 100.0 106.7 202.2 71.2 50.0 29.1 56.0

11
THE CHANGING CHARACTERISTICS OF BANKING INDUSTRY STRUCTURE
In that context, several observations about the data in Table 3 bear consideration. First, as the table shows, in five of the 19 countries in 1993 (the U.S., Japan, Canada, Greece, and the U.K.), deposits funded two-thirds or more of banking assets, while in the rest, the deposits-to-assets ratio was below that, sometimes substantially so. By 2011, for five of the 17 countries for which we have the relevant data, deposits-to-assets ratios were at or above the two-thirds of assets level; and of those, only the U.S. and Canada crossed that threshold in both time periods. Second, in 2011, nine countries out of the 17 saw their bank deposits-to-assets funding ratios drop. Finally, in 1993, when far less attention was devoted to funding issues, 13 of the 19 countries (68 percent) relied on deposits for a little over half, or less, of banking industry funding. However, by 2011, despite the sea change in the emphasis that supervisors and policymakers worldwide place on bank funding volatility and stability, nearly the same proportion of countries– 65 percent–revealed this funding pattern.
The far right-hand columns in Table 3 add a final perspective on banking industry structure. Specifically, the three- firm concentration ratio shows the percentage of all banking system assets accounted for by the biggest three banks in a country. For the majority of countries, in both time periods, the three-firm concentration ratio is above 50 percent, generally substantially so. Furthermore, broadly speaking, the change in that ratio, for a given country, is not particularly large for the more narrowly focused definition of “banking” in 1993 compared to 2011. The larger point is this: In most countries, including the clear majority of the 19 where the banking industry has a large role in the overall economy, the very largest banks dominated the banking industry 20 years ago, and continue to do so now. Under those circumstances, the post-2008-2009 financial crisis emphasis, at the national and international levels, placed on policy measures to mitigate risks posed by systemically important banks (SIBs) seems well-justified.10
10. See Barth, James R., Chris Brummer, Tong Li, and Daniel E. Nolle. “Systemically Important Banks (SIBs) in the Post-Crisis Era: The Global Response, and Responses Around the Globe for 135 Countries,” Milken Institute Research Report, September 2013, for a detailed discussion of global policies to address SIBs. For a comprehensive discussion of the role of the Basel Committee on Banking Supervision, the G-20, and Financial Stability Board in this issue see Nolle (forthcoming); an earlier draft of that work is available at http://papers.ssrn.com/sol3/papers.cfm?abstract_id=2354395.
13
3. BANKING REGULATION OVER TWO TURBULENT DECADES
There are many dimensions to bank regulation. As the development of succeeding generations of the World Bank’s survey illustrates, it is challenging to comprehensively identify all relevant areas of regulation and supervision, much less figure out precisely how to measure them. That challenge is magnified by another challenge: constructing and administering a survey mechanism that faithfully reflects concepts and metrics. With that in mind, we note that our original data collection and research efforts were animated by the thought that more information, even if less than comprehensive, is better than less information. The result, in concrete terms, was our selection at that time of what we judged to be a useful start, wherein we focused on three major dimensions of regulation: “banking powers” (i.e., the nature and degree of limitations or restrictions on banks in engaging in activities and ownership opportunities considered to be nontraditional for commercial banks); capital requirements; and deposit insurance schemes. The current article follows our original research in focusing on these three important aspects of regulation.
3.A. BANKING REGULATION: BANKING POWERS
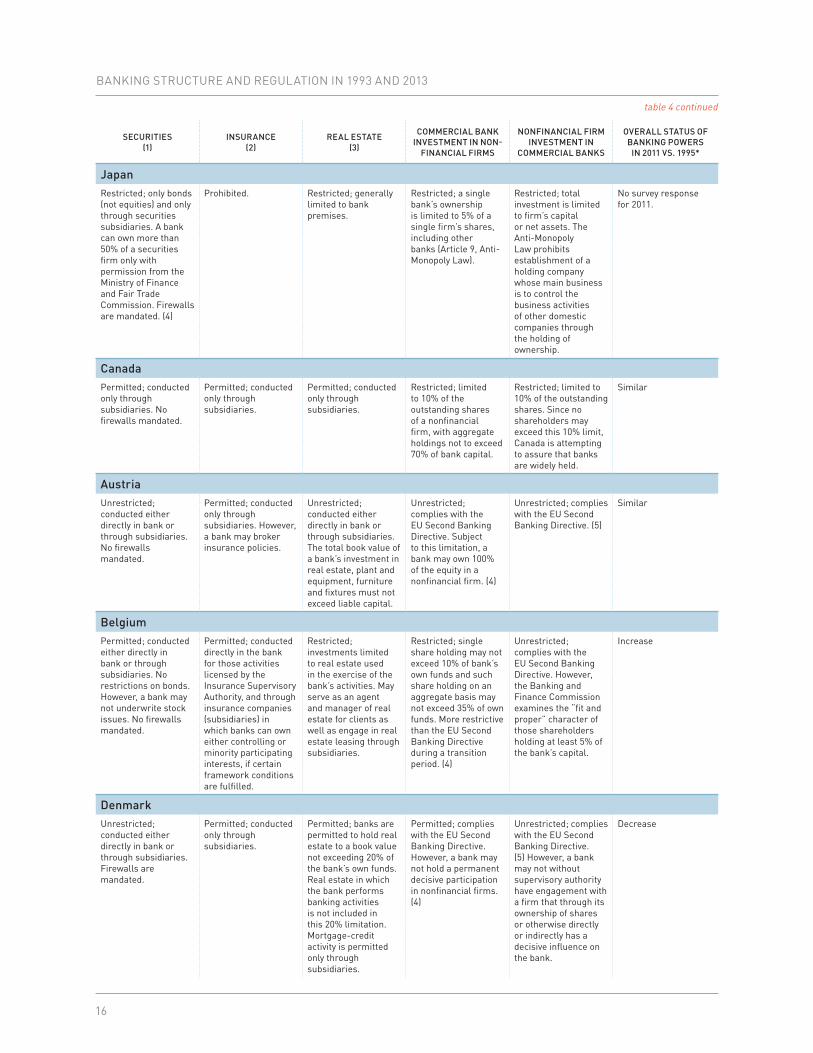
Our original BNR research explains that an important indicator of the nature of the regulatory regime in a country is the degree to which banks are allowed to engage in financial activities beyond the traditional banking functions of taking deposits and making loans. Table 4 presents a summary of the detailed information BNR collected from national regulatory and supervisory authorities (as of 1995) on “banking powers.” Specifically, that term covers banks’ powers to offer securities (stock market) services (including sales and underwriting), insurance services, and real estate services to their customers as well as the degree to which the integration of banking and commerce was permitted in the 19 DMEs.
Our first-ever data collection and analysis efforts in this respect guided important parts of the construction and interpretation of World Bank survey work, and as a result, there is strong commonality, conceptually, between the original BNR work and subsequent World Bank work. However, there are substantial differences between the two data sources. Broadly speaking, our original survey was viewed by us and the respondents as a one-time exercise. Consequently, we asked for a degree of narrative detail that would be inappropriately burdensome to seek in a regularly repeated survey such as the World Bank’s. On the other hand, as a result of the World Bank’s process of continually refining the nature and number of questions on regulation and supervision it asks on its survey, its data covers an increasingly wide range of information.
In the end, because the two data sets differ substantially in structure and their qualitative nature, we have chosen, as the construction of Table 4 reveals, to deviate from the kind of straightforward now-and-then presentation used in many of the other tables in this article. Table 4 includes, for each of the 19 DMEs, “mini-narratives”
BANKING STRUCTURE AND REGULATION IN 1993 AND 2013
14
summarizing the information BNR collected from national authorities for each ofthe five “banking powers.” And, although it was not possible to configure relevant World Bank survey data similarly, we include in the far right-hand column an overall assessment of how the World Bank Survey IV data compares with the detailed data for 1995.
As BNR originally observed, the degree of variation across countries in permissible banking activities and ownership options is wide enough to make generalizations about what constitutes “standard practice” difficult, with the one (rough) exception that no country had a “split personality” with respect to banking powers. That is, it was never the case that any country was very restrictive on some powers and at the same time very liberal on the remaining powers. Rather, a country was either fairly restrictive in varying degrees or not across the board. As a consequence, BNR explain their method for categorizing countries into several different groups, based on the at least rough similarity among group members in the degree of restrictiveness they impose on banks engaging in the five nontraditional “powers.”
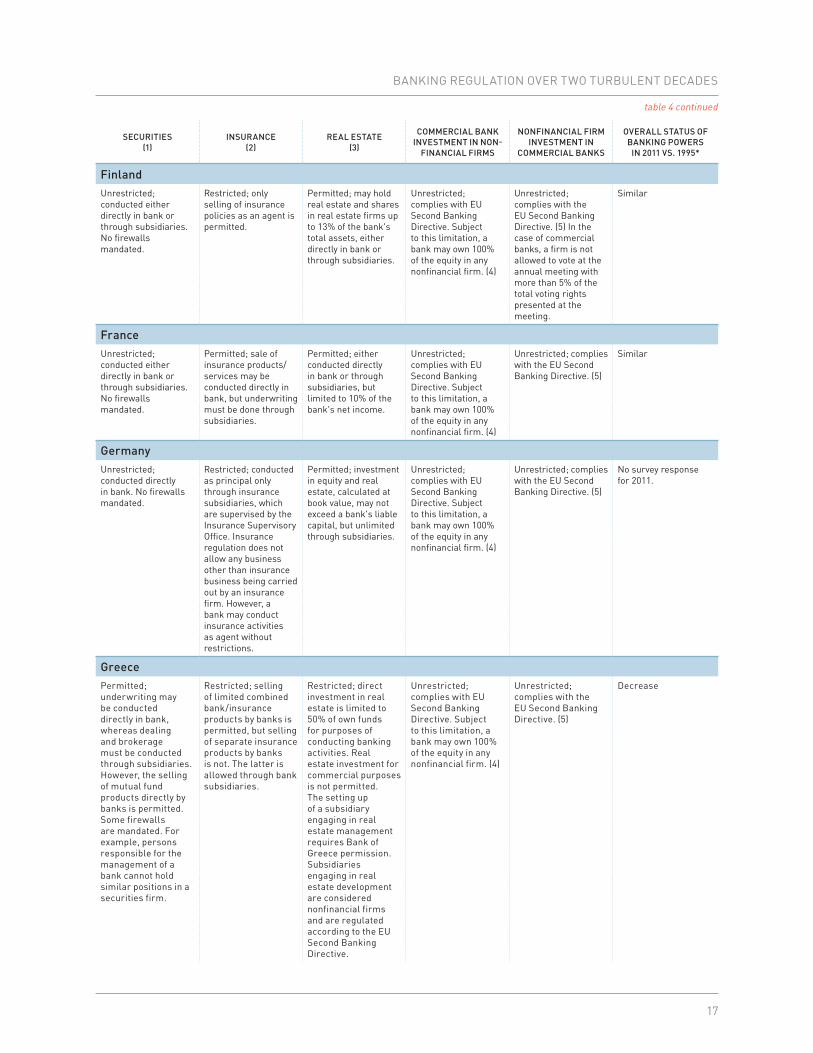
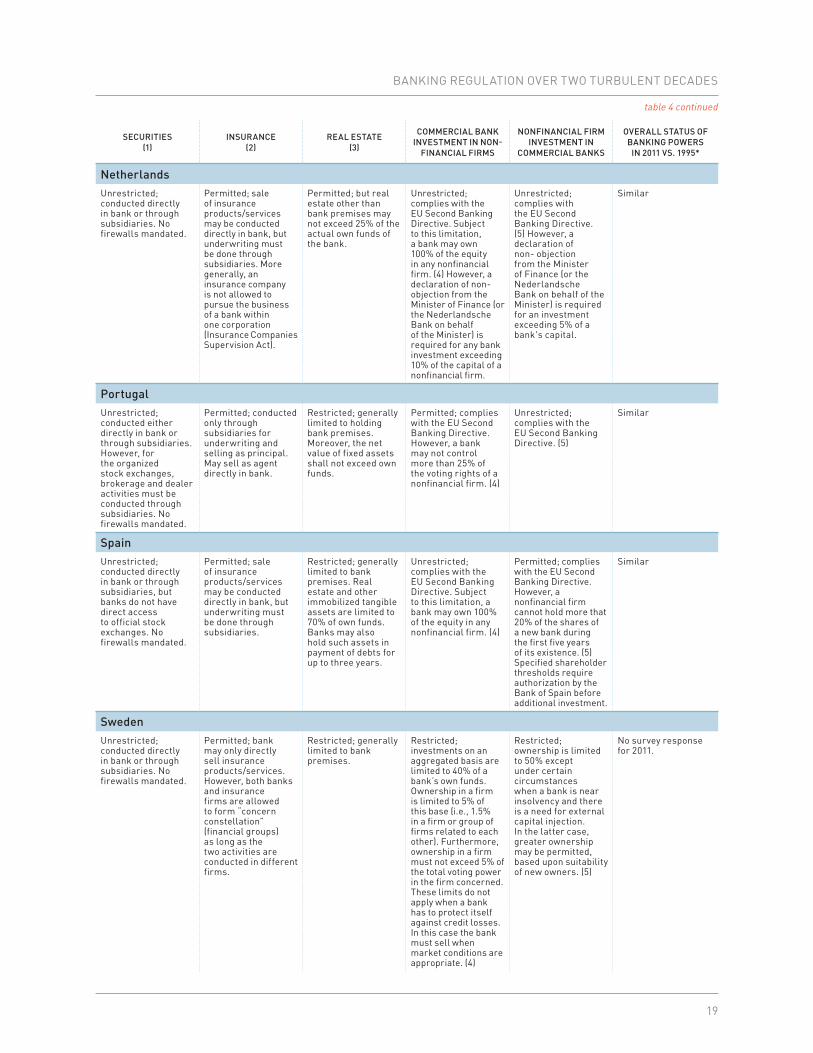
For the purposes of the current article, the following discussion consolidates BNR’s groupings into two basic categories, based on the BNR groupings and the existence of relevant data for 2011. The two groupings for this article, for the 16 countries for which we have 2011 data, are (1) countries with, overall, somewhat narrower powers (Italy, Belgium, Canada, Greece, and the U.S.) and (2) countries with, overall, somewhat wider (or at least less restrictive) powers (the remaining 11 countries). The remainder of this section focuses on how countries were evaluated on the overall nature of the change between their 1995 “powers” status and our assessment of their 2011 status, as summarized in the far right-hand column of Table 4.
It is difficult to justify a firm a priori expectation for any given country, or for all 19 DMEs as a group, with respect to the nature of the change in banking powers regulation between 1995 and 2011. On the one hand, astounding advancements in information technology and financial engineering, combined with increasing emphasis (pre-2008-2009 financial crisis) on the benefits of less restrictive banking and financial markets, argue for an overall trend of greater banking powers liberalization, regardless of a given country’s banking powers status 20 years ago. On the other hand, by 2011, policymakers had begun to implement measures aimed at mitigating systemic risk; hence, one could expect to see, overall, a tightening of the range of activities and ownership opportunities in which banks can engage, relative to an earlier era.
In the event, the information in Table 4 justifies neither presumption. Among the 11 countries with relatively wide banking powers in 1995, nine (Austria, Switzerland, U.K., France, Netherlands, Finland, Ireland, Portugal, and Spain) retained a similar degree of “wide-ish” banking powers in 2011, while only two (Denmark and Luxembourg) decreased banking powers somewhat. Under those circumstances, it is hard to conclude that the trend in banking powers was toward either greater liberalization or more restrictiveness.
The conclusion for the five countries with rather narrow or more restrictive banking powers in 1995 is, if anything, even less clear. Two countries in the formerly “narrower powers” group, Belgium and the U.S., increased banking powers by 2011 compared to 1995. In the case of the U.S., and despite recent measures implemented under the post-crisis enactment of the Dodd-Frank Act, that posture derived, in part, from two factors: (1) the enactment of the Gramm-Leach-Bliley Act of 1999 allowing for greater integration of banking and commerce; and (2) the decades-long movement toward wider powers at the bank holding company level as compared to the individual bank level. Even so, this evidence partially supporting the a priori expectation that, at least for the formerly more restrictive countries, the trend will be toward wider banking powers is contradicted by the fact that two of the narrower powers countries, Italy and Greece, decreased banking powers by 2011.

15
BANKING REGULATION OVER TWO TURBULENT DECADES
TABLE
4Banking Regulation in the DMEs: Restrictions on Activities and Ownership (1995 and 2011)
SECURITIES(1)
INSURANCE(2)
REAL ESTATE(3)
COMMERCIAL BANK INVESTMENT IN NON-
FINANCIAL FIRMS
NONFINANCIAL FIRM INVESTMENT IN
COMMERCIAL BANKS
OVERALL STATUS OF BANKING POWERS
IN 2011 VS. 1995*
United StatesRestricted; national and state member banks generally are prohibited from underwriting or dealing in corporate debt and equity instruments or securities.They may, however, engage in discount and full-service brokerage as well as serve as agent for issues in privately placing securities. State non-member banks are subject to the same restriction as national banks, unless the FDIC determines the activity would not pose a significant risk to the deposit insurance fund.Bank holding companies may, on a case-by-case basis, be permitted to underwrite and deal in corporate debt and equity securities through a Section 20 subsidiary so long as the subsidiary’s revenues for these activities do not exceed 10 percent of total gross revenues. Firewalls are mandated.
Restricted; banks generally may engage in credit life and disability insurance underwriting and agency activities. National banks, in addition, may engage in general insurance agency activities in towns with less than 5,000 in population.
Restricted; banks generally are restricted to investment in premises or that which is necessary for the transaction of their business.
Restricted; national and state member banks generally are prohibited from making direct equity investment in voting or nonvoting stock. State nonmember banks generally are limited to investments that are permissible for national banks. Bank holding companies are limited to an investment not to exceed 25 percent of a nonfinancial firm’s capital.
Restricted; a nonfinancial firm may make equity investments in banks and bank holding companies. However, the investment must not exceed 25 percent of the bank’s capital to avoid becoming a bank holding company. In other words, banks may be acquired only by companies that limit their activities to those deemed closely related to banking by the Federal Reserve Board.
Increase
SwitzerlandUnrestricted; conducted either directly in bank or through subsidiaries. No firewalls mandated.
Permitted; conducted only through subsidiaries.
Unrestricted; investments in a single real estate project are limited to the equivalent of 20% of the bank’s capital. However, the Swiss Federal Banking Commission can allow this limit to be exceeded.
Unrestricted; a single participation is limited to the equivalent of 20% of the bank’s capital. However, the Swiss Federal Banking Commission can allow this limit to be exceeded.
Unrestricted; a nonfinancial firm may own 100% of the equity in a bank.
Similar
BANKING STRUCTURE AND REGULATION IN 1993 AND 2013
16
SECURITIES(1)
INSURANCE(2)
REAL ESTATE(3)
COMMERCIAL BANK INVESTMENT IN NON-
FINANCIAL FIRMS
NONFINANCIAL FIRM INVESTMENT IN
COMMERCIAL BANKS
OVERALL STATUS OF BANKING POWERS
IN 2011 VS. 1995*
JapanRestricted; only bonds (not equities) and only through securities subsidiaries. A bank can own more than 50% of a securities firm only with permission from the Ministry of Finance and Fair Trade Commission. Firewalls are mandated. (4)
Prohibited. Restricted; generally limited to bank premises.
Restricted; a single bank’s ownership is limited to 5% of a single firm’s shares, including other banks (Article 9, Anti-Monopoly Law).
Restricted; total investment is limited to firm’s capital or net assets. The Anti-Monopoly Law prohibits establishment of a holding company whose main business is to control the business activities of other domestic companies through the holding of ownership.
No survey response for 2011.
CanadaPermitted; conducted only through subsidiaries. No firewalls mandated.
Permitted; conducted only through subsidiaries.
Permitted; conducted only through subsidiaries.
Restricted; limited to 10% of the outstanding shares of a nonfinancial firm, with aggregate holdings not to exceed 70% of bank capital.
Restricted; limited to 10% of the outstanding shares. Since no shareholders may exceed this 10% limit, Canada is attempting to assure that banks are widely held.
Similar
AustriaUnrestricted; conducted either directly in bank or through subsidiaries. No firewalls mandated.
Permitted; conducted only through subsidiaries. However, a bank may broker insurance policies.
Unrestricted; conducted either directly in bank or through subsidiaries. The total book value of a bank’s investment in real estate, plant and equipment, furniture and fixtures must not exceed liable capital.
Unrestricted; complies with the EU Second Banking Directive. Subject to this limitation, a bank may own 100% of the equity in a nonfinancial firm. (4)
Unrestricted; complies with the EU Second Banking Directive. (5)
Similar
BelgiumPermitted; conducted either directly in bank or through subsidiaries. No restrictions on bonds. However, a bank may not underwrite stock issues. No firewalls mandated.
Permitted; conducted directly in the bank for those activities licensed by the Insurance Supervisory Authority, and through insurance companies (subsidiaries) in which banks can own either controlling or minority participating interests, if certain framework conditions are fulfilled.
Restricted; investments limited to real estate used in the exercise of the bank’s activities. May serve as an agent and manager of real estate for clients as well as engage in real estate leasing through subsidiaries.
Restricted; single share holding may not exceed 10% of bank’s own funds and such share holding on an aggregate basis may not exceed 35% of own funds. More restrictive than the EU Second Banking Directive during a transition period. (4)
Unrestricted; complies with the EU Second Banking Directive. However, the Banking and Finance Commission examines the “fit and proper” character of those shareholders holding at least 5% of the bank’s capital.
Increase
DenmarkUnrestricted; conducted either directly in bank or through subsidiaries. Firewalls are mandated.
Permitted; conducted only through subsidiaries.
Permitted; banks are permitted to hold real estate to a book value not exceeding 20% of the bank’s own funds. Real estate in which the bank performs banking activities is not included in this 20% limitation. Mortgage-credit activity is permitted only through subsidiaries.
Permitted; complies with the EU Second Banking Directive. However, a bank may not hold a permanent decisive participation in nonfinancial firms. (4)
Unrestricted; complies with the EU Second Banking Directive. (5) However, a bank may not without supervisory authority have engagement with a firm that through its ownership of shares or otherwise directly or indirectly has a decisive influence on the bank.
Decrease
table 4 continued
17
BANKING REGULATION OVER TWO TURBULENT DECADES
SECURITIES(1)
INSURANCE(2)
REAL ESTATE(3)
COMMERCIAL BANK INVESTMENT IN NON-
FINANCIAL FIRMS
NONFINANCIAL FIRM INVESTMENT IN
COMMERCIAL BANKS
OVERALL STATUS OF BANKING POWERS
IN 2011 VS. 1995*
FinlandUnrestricted; conducted either directly in bank or through subsidiaries. No firewalls mandated.
Restricted; only selling of insurance policies as an agent is permitted.
Permitted; may hold real estate and shares in real estate firms up to 13% of the bank's total assets, either directly in bank or through subsidiaries.
Unrestricted; complies with EU Second Banking Directive. Subject to this limitation, a bank may own 100% of the equity in any nonfinancial firm. (4)
Unrestricted; complies with the EU Second Banking Directive. (5) In the case of commercial banks, a firm is not allowed to vote at the annual meeting with more than 5% of the total voting rights presented at the meeting.
Similar
FranceUnrestricted; conducted either directly in bank or through subsidiaries. No firewalls mandated.
Permitted; sale of insurance products/services may be conducted directly in bank, but underwriting must be done through subsidiaries.
Permitted; either conducted directly in bank or through subsidiaries, but limited to 10% of the bank's net income.
Unrestricted; complies with EU Second Banking Directive. Subject to this limitation, a bank may own 100% of the equity in any nonfinancial firm. (4)
Unrestricted; complies with the EU Second Banking Directive. (5)
Similar
GermanyUnrestricted; conducted directly in bank. No firewalls mandated.
Restricted; conducted as principal only through insurance subsidiaries, which are supervised by the Insurance Supervisory Office. Insurance regulation does not allow any business other than insurance business being carried out by an insurance firm. However, a bank may conduct insurance activities as agent without restrictions.
Permitted; investment in equity and real estate, calculated at book value, may not exceed a bank's liable capital, but unlimited through subsidiaries.
Unrestricted; complies with EU Second Banking Directive. Subject to this limitation, a bank may own 100% of the equity in any nonfinancial firm. (4)
Unrestricted; complies with the EU Second Banking Directive. (5)
No survey response for 2011.
GreecePermitted; underwriting may be conducted directly in bank, whereas dealing and brokerage must be conducted through subsidiaries. However, the selling of mutual fund products directly by banks is permitted. Some firewalls are mandated. For example, persons responsible for the management of a bank cannot hold similar positions in a securities firm.
Restricted; selling of limited combined bank/insurance products by banks is permitted, but selling of separate insurance products by banks is not. The latter is allowed through bank subsidiaries.
Restricted; direct investment in real estate is limited to 50% of own funds for purposes of conducting banking activities. Real estate investment for commercial purposes is not permitted. The setting up of a subsidiary engaging in real estate management requires Bank of Greece permission. Subsidiaries engaging in real estate development are considered nonfinancial firms and are regulated according to the EU Second Banking Directive.
Unrestricted; complies with EU Second Banking Directive. Subject to this limitation, a bank may own 100% of the equity in any nonfinancial firm. (4)
Unrestricted; complies with the EU Second Banking Directive. (5)
Decrease
table 4 continued

BANKING STRUCTURE AND REGULATION IN 1993 AND 2013
18
SECURITIES(1)
INSURANCE(2)
REAL ESTATE(3)
COMMERCIAL BANK INVESTMENT IN NON-
FINANCIAL FIRMS
NONFINANCIAL FIRM INVESTMENT IN
COMMERCIAL BANKS
OVERALL STATUS OF BANKING POWERS
IN 2011 VS. 1995*
IrelandUnrestricted; conducted directly in bank or through subsidiaries. No firewalls are mandated.
Prohibited. (6) Unrestricted. Unrestricted; complies with the EU Second Banking Directive. Subject to these limitations, a bank may own 100% of the equity in a nonfinancial firm. (4)
Unrestricted. However, advance notification is required for any application of more than 5% of the voting rights in a bank, and prior approval is required for any acquisition of 10% or more of the total shares or voting rights or any holding or interest that confers a right to appoint or remove directors. (5)
Similar
ItalyUnrestricted; conducted either directly in bank or through subsidiaries. However, for brokering and dealing securities listed on an Italian exchange other than Italian government and government-guaranteed securities, conducted only through a special subsidiary. Firewalls are mandated.
Permitted; sale of insurance products/services may be conducted directly in bank, but underwriting must be done through subsidiaries.
Restricted; generally limited to bank premises.
Restricted; more restrictive than the EU Second Banking Directive. Most banks are subject to an overall investment limit of 15% of own funds (7.5% in the case of unlisted firms) and to a concentration limit of 3% of own funds in each holding in nonfinancial firms or groups. Some banks, due to their size and proven stability, are subject to less stringent limits (overall and concentration limits of respectively 50% and 6% for leading banks, and 60% and 15% for specialized banks). Consistency with the principle of separation between banking and commerce is ensured by a further investment limit of 15% of invested firms’ capital for all banks. (4)
Restricted; more restrictive than the EU Second Banking Directive. Persons who engage in significant business activity in sectors other than banking and finance are forbidden from acquiring an equity stake which, when added to those already held, would result in a holding exceeding 15% of the voting capital of a bank or in control of the bank. (5)
Decrease
LuxembourgUnrestricted; conducted either directly in bank or through subsidiaries. No firewalls mandated.
Permitted; bank employees may obtain an insurance license and thereby sell insurance products/services as an agent of insurance firms within the bank. However, a bank is allowed to carry out insurance activities through a subsidiary or by taking an equity stake in an insurance firm, with prior approval.
Unrestricted; conducted either directly in bank or through subsidiaries.
Unrestricted; complies with EU Second Banking Directive. Subject to this limitation, a bank may own 100% of the equity in any nonfinancial firm. (4)
Restricted; nonfinancial firms may legally be the majority shareholders in banks. However, general policy is to discourage nonfinancial groups or private persons from being major shareholders in banks.
Decrease
table 4 continued
19
BANKING REGULATION OVER TWO TURBULENT DECADES
SECURITIES(1)
INSURANCE(2)
REAL ESTATE(3)
COMMERCIAL BANK INVESTMENT IN NON-
FINANCIAL FIRMS
NONFINANCIAL FIRM INVESTMENT IN
COMMERCIAL BANKS
OVERALL STATUS OF BANKING POWERS
IN 2011 VS. 1995*
NetherlandsUnrestricted; conducted directly in bank or through subsidiaries. No firewalls mandated.
Permitted; sale of insurance products/services may be conducted directly in bank, but underwriting must be done through subsidiaries. More generally, an insurance company is not allowed to pursue the business of a bank within one corporation (Insurance Companies Supervision Act).
Permitted; but real estate other than bank premises may not exceed 25% of the actual own funds of the bank.
Unrestricted; complies with the EU Second Banking Directive. Subject to this limitation, a bank may own 100% of the equity in any nonfinancial firm. (4) However, a declaration of non-objection from the Minister of Finance (or the Nederlandsche Bank on behalf of the Minister) is required for any bank investment exceeding 10% of the capital of a nonfinancial firm.
Unrestricted; complies with the EU Second Banking Directive. (5) However, a declaration of non- objection from the Minister of Finance (or the Nederlandsche Bank on behalf of the Minister) is required for an investment exceeding 5% of a bank's capital.
Similar
PortugalUnrestricted; conducted either directly in bank or through subsidiaries. However, for the organized stock exchanges, brokerage and dealer activities must be conducted through subsidiaries. No firewalls mandated.
Permitted; conducted only through subsidiaries for underwriting and selling as principal. May sell as agent directly in bank.
Restricted; generally limited to holding bank premises. Moreover, the net value of fixed assets shall not exceed own funds.
Permitted; complies with the EU Second Banking Directive. However, a bank may not control more than 25% of the voting rights of a nonfinancial firm. (4)
Unrestricted; complies with the EU Second Banking Directive. (5)
Similar
SpainUnrestricted; conducted directly in bank or through subsidiaries, but banks do not have direct access to official stock exchanges. No firewalls mandated.
Permitted; sale of insurance products/services may be conducted directly in bank, but underwriting must be done through subsidiaries.
Restricted; generally limited to bank premises. Real estate and other immobilized tangible assets are limited to 70% of own funds. Banks may also hold such assets in payment of debts for up to three years.
Unrestricted; complies with the EU Second Banking Directive. Subject to this limitation, a bank may own 100% of the equity in any nonfinancial firm. (4)
Permitted; complies with the EU Second Banking Directive. However, a nonfinancial firm cannot hold more that 20% of the shares of a new bank during the first five years of its existence. (5) Specified shareholder thresholds require authorization by the Bank of Spain before additional investment.
Similar
SwedenUnrestricted; conducted directly in bank or through subsidiaries. No firewalls mandated.
Permitted; bank may only directly sell insurance products/services. However, both banks and insurance firms are allowed to form “concern constellation” (financial groups) as long as the two activities are conducted in different firms.
Restricted; generally limited to bank premises.
Restricted; investments on an aggregated basis are limited to 40% of a bank’s own funds. Ownership in a firm is limited to 5% of this base (i.e., 1.5% in a firm or group of firms related to each other). Furthermore, ownership in a firm must not exceed 5% of the total voting power in the firm concerned. These limits do not apply when a bank has to protect itself against credit losses. In this case the bank must sell when market conditions are appropriate. (4)
Restricted; ownership is limited to 50% except under certain circumstances when a bank is near insolvency and there is a need for external capital injection. In the latter case, greater ownership may be permitted, based upon suitability of new owners. (5)
No survey response for 2011.
table 4 continued

BANKING STRUCTURE AND REGULATION IN 1993 AND 2013
20
SECURITIES(1)
INSURANCE(2)
REAL ESTATE(3)
COMMERCIAL BANK INVESTMENT IN NON-
FINANCIAL FIRMS
NONFINANCIAL FIRM INVESTMENT IN
COMMERCIAL BANKS
OVERALL STATUS OF BANKING POWERS
IN 2011 VS. 1995*
United KingdomUnrestricted; conducted either directly in bank or through subsidiaries. However, gilt-edged market making must be conducted through a subsidiary. No firewalls mandated.
Permitted; sales of insurance products/services may be conducted directly in bank, but underwriting only through subsidiaries. However, the bank’s investment in the subsidiary must be deducted from the bank’s capital when calculating its capital adequacy if the bank ownership share in the subsidiary exceeds 20%.
Unrestricted; conducted either directly in bank or through subsidiaries.
Unrestricted; complies with the EU Second Banking Directive. Subject to this limitation, a bank may own 100% of the equity in any nonfinancial firm. However, an ownership share of more than 20% requires that the investment be deducted from the bank’s capital when calculating its capital adequacy on a risk basis. Otherwise, the investment is treated as a commercial loan for the risk-based calculation.
Unrestricted; complies with the EU Second Banking Directive. However, a firm would have to make application to the Bank of England to become a shareholder controller and receive the bank’s non-objection.
Similar
table 4 continued
Note: (1) Securities activities include underwriting, dealing, and brokering all kinds of securities and all aspects of the mutual fund business. (2) Insurance activities include underwriting and selling insurance products/services as principal and as agent.(3) Real estate activities include investment, development, and management.(4) The EU Second Banking Directive (Article 12) limits “qualifying investments” to no more than 15% of a bank’s own funds for investments in a single nonfinancial firm and to no more than 60% for aggregate investments in nonfinancial firms. In exceptional circumstances these limits may be exceeded, but the amount by which the limits are exceeded must be covered by a bank’s own funds and these own funds may not be included in the solvency ratio calculation. A qualifying investment is defined as a direct or indirect holding in an undertaking equal to at least 10% of its capital or voting rights or permitting the exercise of significant influence over its management.(5) The EU Second Banking Directive (Article 11) subjects qualifying investments to regulatory consent based only on the suitability of shareholders. (6) However, three commercial banks are authorized to engage in assurance activities.Definitions: Unrestricted- A full range of activities in the given category can be conducted directly in the bank.Permitted- A full range of activities can be conducted, but all or some must be conducted in subsidiaries. Restricted- Less than a full range of activities can be conducted in the bank or subsidiaries.Prohibited- The activity cannot be conducted in either the bank or subsidiaries.
Sources: 1995 information from Barth, Nolle, and Rice (1997a). *Source for Characterization of Overall Status of Banking Powers in 2011 vs. 1995: authors’ judgment, using information in Barth, Caprio, and Levine (2013) and World Bank Survey IV.

21
BANKING REGULATION OVER TWO TURBULENT DECADES
3.B. BANKING REGULATION: CAPITAL REQUIREMENTS
Capital regulations have long been important in the banking industry so as to limit the extent to which individual banks are able to leverage. Higher capital requirements lead to lower leverage so that it takes larger losses to wipe out the equity of a bank. Setting minimum capital requirements is therefore a way to provide a cushion to lessen the likelihood of insolvency of a bank due to losses. The Basel Committee on Banking Supervision (BCBS) in 1988 issued guidelines calling for a minimum capital requirement of 8 percent of risk-weighted assets, known as Basel I. Most countries adopted this proposed requirement for banks.
However, the composition of capital satisfying this requirement varied among countries. This is clear from the information for the 19 DMEs in Table 5a. All the countries allowed subordinated term debt to be included as a component of regulatory capital in 1995, while only three countries allowed for the inclusion of investment in the capital of other banks and financial institutions. In the case of the other 10 potential components of capital, there was substantial variation among the 19 countries as to which of them were allowable. This means that although all the countries may have reported that banks met the minimum capital requirement, the degree of leverage allowed still could have differed fairly widely due to the variation in the items that were allowed to satisfy this requirement.
In 2004, the BCBS proposed Basel II as an improvement upon Basel I. Most countries had implemented Basel II by 2011, although the United States had not due to the global financial crisis that fully emerged in September 2008. Then, as a result of the crisis, Basel III was proposed in 2010-2011 to be implemented in phases over the period 2013-2018. We can therefore still compare differences in the allowable components of regulatory capital under Basel I and Basel II. This is done using the information in Table 5a for 1995 and Table 5b for 2011. Based on available information, one finds that in contrast to some variation among countries as to whether goodwill and other intangibles are allowable components of regulatory capital in 1995, all of the countries exclude these items in 2011. Regarding whether the other items are allowable components of capital, the degree of variation among the countries has remained roughly constant over the 15-year period.
TABLE
5a Banking Regulation in the DMEs: Capital Requirements (1995)
NO
NC
UM
UL
ATIV
E P
ER
PE
TUA
L P
RE
FER
RE
D
STO
CK
CU
RR
EN
T YE
AR
PR
OFI
T-A
DD
ED
(OR
LO
SS
DE
DU
CTE
D)
INTA
NG
IBLE
AS
SETS
OTH
ER
TH
AN
GO
OD
WIL
L
GO
OD
WIL
L (1
)
UN
DIS
CLO
SED
RE
SER
VES
(2)
HYB
RID
CA
PIT
AL
INS
TRU
ME
NTS
(IN
CLU
DIN
G
CU
MU
LAT
IVE
PE
RP
ETU
AL
PR
EFE
RR
ED
STO
CK
) (3)
SUB
OR
DIN
ATE
D T
ER
M
DE
BT
(4)
LIM
ITE
D L
IFE
RE
DE
EM
AB
LE
PR
EFE
RE
NC
E SH
AR
ES
(5)
FIXE
D A
SSE
T R
EVA
LUAT
ION
R
ESE
RVE
S (6
)
LAT
EN
T, O
R H
IDD
EN
, R
EVA
LUAT
ION
RE
SER
VES
(7)
GE
NE
RA
L LO
AN
LO
SS
RE
SER
VES
(8)
INVE
STM
EN
T IN
TH
E C
AP
ITA
L O
F O
THE
R
BA
NK
S A
ND
FIN
AN
CIA
L IN
STI
TUTI
ON
S
United States Yes Yes No, with limited
exceptions
No No Yes, but limits
Yes, but limits
Yes, but limits
No No Yes, but limits
No
Switzerland Yes, no limits
Yes No No Yes, but limits
Yes, but limits
and not including
cumulative perpetual preferred
stock
Yes, but limits
No Yes, but limits
Yes, but limits
Yes, no limits
No

BANKING STRUCTURE AND REGULATION IN 1993 AND 2013
22
NO
NC
UM
UL
ATIV
E P
ER
PE
TUA
L P
RE
FER
RE
D
STO
CK
CU
RR
EN
T YE
AR
PR
OFI
T-A
DD
ED
(OR
LO
SS
DE
DU
CTE
D)
INTA
NG
IBLE
AS
SETS
OTH
ER
TH
AN
GO
OD
WIL
L
GO
OD
WIL
L (1
)
UN
DIS
CLO
SED
RE
SER
VES
(2)
HYB
RID
CA
PIT
AL
INS
TRU
ME
NTS
(IN
CLU
DIN
G
CU
MU
LAT
IVE
PE
RP
ETU
AL
PR
EFE
RR
ED
STO
CK
) (3)
SUB
OR
DIN
ATE
D T
ER
M
DE
BT
(4)
LIM
ITE
D L
IFE
RE
DE
EM
AB
LE
PR
EFE
RE
NC
E SH
AR
ES
(5)
FIXE
D A
SSE
T R
EVA
LUAT
ION
R
ESE
RVE
S (6
)
LAT
EN
T, O
R H
IDD
EN
, R
EVA
LUAT
ION
RE
SER
VES
(7)
GE
NE
RA
L LO
AN
LO
SS
RE
SER
VES
(8)
INVE
STM
EN
T IN
TH
E C
AP
ITA
L O
F O
THE
R
BA
NK
S A
ND
FIN
AN
CIA
L IN
STI
TUTI
ON
S
Japan Yes Yes Yes No No Yes, but not prevalent
Yes Yes, but not issued
No Yes Yes No, if sole purpose
is to raise capital ratio
Canada Yes Yes Yes No No Yes Yes Yes No No No Yes, but back-
to- back issues are deducted
Austria Yes Yes No No Yes, but limits
Yes, but limits
Yes, but limits
No Yes, but limits
No Yes No
Belgium Yes Yes No No Yes, but limits
Yes, but limits
Yes, but limits
Yes, but limits
Yes, but limits
No Yes No
Denmark No, does not exist
Yes No No No information
No, does not exist
Yes No, does not exist
No, does not exist
No, does not exist
No, does not exist
No
Finland Yes Yes No No No Yes Yes Not applicable
Yes No Yes No
France No, issues not permitted
in domestic market
Yes No, except for lease renewal
rights
No No Yes Yes Yes, but not issued
Yes No Yes Yes, but limits
Germany Yes No No No Yes, but limits
Yes, but limits
Yes, but limits
No No Yes, but limits
Yes, but limits
No
Greece Yes Yes Yes Yes No Yes, but limits
Yes, but limits
Yes, but not utilized at present
Yes, but limits
No Yes No
Ireland Yes, no limits
Yes No No No Yes, but limits
Yes, but limits
Yes, but limits
Yes, but limits
No Yes, but limits
No
Italy Yes, but limits
Yes Yes Yes No Yes, but limits
Yes, but limits
No, does not exist
Yes, but limits
No Yes, but limits
No
Luxembourg Yes Yes No No Yes Yes Yes Yes No No Yes No
Netherlands Yes Yes Yes Yes Yes Yes Yes Yes Yes Yes Yes Yes
Portugal Yes Yes Yes Yes No information
Yes Yes, but limits
No information
Yes No information
Yes No
Spain Yes No No No No Yes, but limits
Yes, but limits
Yes, but limits
Yes, but limits
No No No
Sweden Yes Yes No No No Yes, with approval
Yes No Yes, with approval
No No No
United Kingdom Yes Yes No No Not applicable
Yes, but limits
Yes, but limits
Yes Yes, with caution
Not applicable
Yes, but limits
No
%Yes 89% 89% 32% 21% 38% 95% 100% 65% 68% 24% 79% 16%
table 5a continued
Note: (1) Goodwill is an intangible asset.(2) Undisclosed reserves are portions of accumulated after-tax retained earnings not identified in the published balance sheet or otherwise disclosed, except to banking supervisors.(3) Hybrid-capital instruments including cumulative preferred stock are instruments that combine the characteristics of equity capital and of debt, and should meet the following requirements: unsecured, subordinated, and fully paid up; not redeemable at the request of the holder or without prior consent of supervisory authority; available to participate in losses without the bank being obliged to cease trading (unlike conventional subordinated debt); and all service obligations to be deferred where the financial condition of the bank does not support payment.(4) Subordinated term debt is normally not available to participate in losses of a bank that continues operating (included in capital only if minimum original maturity of five years). (5) Limited life redeemable preference shares are the same as immediately above.(6) Fixed asset revaluation reserves represent a formal revaluation, carried through to the balance sheet, of a bank’s own premises.(7) Latent, or hidden, revaluation reserves are the difference between the market value and historic cost book value of long-term holdings of equity securities.(8) General loan loss reserves are reserves that are held against future and presently unidentified losses and are freely available to meet losses that may subsequently materialize.
Source: Barth, Nolle, and Rice (1997a).

23
BANKING REGULATION OVER TWO TURBULENT DECADES
3.C. BANKING REGULATION: DEPOSIT INSURANCE SCHEMES
To reduce, if not completely eliminate, widespread runs on banks, many countries have established deposit insurance schemes over time. The United States was the first such country to do so in 1933. Of course, a deposit insurance scheme creates more hazard problems. Depositors who are protected in case a bank suffers losses have no incentive to monitor the risk-taking behavior of that bank. This may provide an incentive to the bank to engage in excessively risky activity. Of course, countries may design a deposit insurance scheme with features so as to limit its generosity, and thereby more hazard. We have rich data on three main dimensions of deposit insurance schemes: administration of scheme, coverage, and funding.
TABLE
5bBanking Regulation in the DMEs: Capital Requirements Under Basel II (2011)
WHICH OF THE FOLLOWING ITEMS ARE ALLOWED AS PART
OF TIER 1 CAPITAL?
WHICH OF THE FOLLOWING ITEMS ARE ALLOWED AS PART OF TIER 2 CAPITAL?
ARE THE FOLLOWING ITEMS DEDUCTED FROM REGULATORY CAPITAL?
NO
NC
UM
UL
ATIV
E P
ER
PE
TUA
L P
RE
FER
RE
D
STO
CK
CU
RR
EN
T YE
AR
PR
OFI
T-A
DD
ED
(OR
LO
SS
DE
DU
CTE
D)
INTA
NG
IBLE
AS
SETS
OTH
ER
TH
AN
GO
OD
WIL
L
GO
OD
WIL
L (1
)
UN
DIS
CLO
SED
RE
SER
VES
(2)
HYB
RID
CA
PIT
AL
INS
TRU
ME
NTS
(IN
CLU
DIN
G
CU
MU
LAT
IVE
PE
RP
ETU
AL
PR
EFE
RR
ED
STO
CK
) (3)
SUB
OR
DIN
ATE
D T
ER
M D
EB
T (4
)
LIM
ITE
D L
IFE
RE
DE
EM
AB
LE
PR
EFE
RE
NC
E SH
AR
ES
(5)
FIXE
D A
SSE
T R
EVA
LUAT
ION
R
ESE
RVE
S (6
)
LAT
EN
T, O
R H
IDD
EN
, R
EVA
LUAT
ION
RE
SER
VES
(7)
GE
NE
RA
L LO
AN
LO
SS
RE
SER
VES
(8)
United States No No No Yes Yes Yes Yes Yes Yes Yes Yes
Switzerland Yes No No Yes Yes Yes Yes Yes No Yes Yes
Japan n.a. n.a. n.a. n.a. n.a. n.a. n.a. n.a. n.a. n.a. n.a.
Canada Yes No No Yes Yes No Yes Yes No Yes Yes
Austria Yes No No No No Yes Yes Yes No Yes No
Belgium Yes No No Yes Yes Yes Yes Yes Yes Yes Yes
Denmark n.a. n.a. n.a. n.a. n.a. n.a. n.a. n.a. Yes Yes n.a.
Finland Yes Yes No Yes No Yes Yes Yes Yes Yes Yes
France Yes No No Yes Yes Yes Yes Yes No Yes Yes
Germany Yes No No n.a. n.a. n.a. n.a. Yes No Yes Yes
Greece Yes No No No No No Yes Yes No Yes Yes
Ireland Yes No No Yes Yes Yes Yes Yes Yes Yes Yes
Italy Yes No No Yes No Yes Yes Yes No Yes Yes
Luxembourg Yes No No Yes Yes Yes Yes Yes Yes Yes Yes
Netherlands Yes Yes Yes Yes No Yes Yes Yes No Yes Yes
Portugal Yes Yes n.a. Yes Yes Yes n.a. Yes No Yes No
Spain Yes No No Yes Yes Yes Yes Yes No Yes Yes
Sweden n.a. n.a. n.a. n.a. n.a. n.a. n.a. n.a. n.a. n.a. n.a.
United Kingdom Yes No No Yes Yes Yes Yes Yes No Yes No
%Yes 94% 19% 7% 87% 67% 87% 100% 100% 35% 100% 81%
Sources: Barth, Caprio, and Levine (2013) and the World Bank Survey IV.

BANKING STRUCTURE AND REGULATION IN 1993 AND 2013
24
Table 6 provides information on the administration and membership of the deposit insurance schemes for the 19 DMEs for 1995 and 2011. All of the schemes were established during the past eight decades and about two-thirds were administered by the government or jointly by the government and industry in 1995. In all but four of the countries, membership in the scheme was compulsory in that same year. In contrast, there was a slight increase in the administration of the system by the private sector and membership was compulsory for all domestic banks and foreign bank subsidiaries in 2011. Information on membership by foreign bank branches was also available in 2011 but not in 1995. In this case, membership was nearly equally divided between compulsory and voluntary for these branches among the deposit insurance schemes.
TABLE
6Banking Regulation in the DMEs: Capital Requirements Under Basel II (1995 and 2011)
NA
ME
OF
GU
AR
AN
TEE
/IN
SU
RA
NC
E S
YSTE
M
YEA
R F
IRS
T E
STA
BLI
SH
ED
AG
EN
CY
RE
SP
ON
SIB
LE
FOR
AD
MIN
ISTE
RIN
G
SYS
TEM
1995 2011
AD
MIN
ISTR
ATIO
N
OF
SYS
TEM
: G
OVE
RN
ME
NT
OR
IN
DU
STR
Y
ME
MB
ER
SH
IP:
VOLU
NTA
RY
OR
C
OM
PU
LS
OR
Y
AD
MIN
ISTR
ATIO
N
OF
SYS
TEM
: G
OVE
RN
ME
NT
OR
IN
DU
STR
Y
MEMBERSHIP: VOLUNTARY OR COMPULSORY
DO
ME
STI
C
BA
NK
S
FOR
EIG
N
BA
NK
S
UB
SID
IAR
IES
FOR
EIG
N
BA
NK
B
RA
NC
HE
S
United States Bank Insurance Fund
1933 Federal Deposit Insurance
Corporation
Government Compulsory Public sector Compulsory Compulsory Voluntary
Switzerland Deposit Guarantee
Scheme
1982 Swiss Bankers Association
Industry Voluntary Private sector Compulsory Compulsory Compulsory
Japan Deposit Insurance
Corporation
1971 Deposit Insurance
Corporation
Government/Industry - joint
Compulsory n.a. n.a. n.a. n.a.
Canada Canada Deposit Insurance
System
1967 Canada Deposit Insurance
Corporation
Government (Crown
Corporation)
Compulsory Public sector Compulsory Compulsory Voluntary
Austria Deposit Guarantee
System
1979 Sectoral Associations
Industry Compulsory Private sector Compulsory Compulsory Voluntary
Belgium Guarantee Scheme for
Deposits with Credit Institutions
1974 Herdiscon-tering-en
Waarborginsti-tuut-Institut de Reescompte et
de Garantie
Government/Industry - joint
Compulsory Jointly by private/public
officials
Compulsory Compulsory Voluntary
Denmark Deposit Insurance Fund
1987 Deposit Insurance Fund
Government Compulsory Jointly by private/public
officials
Compulsory Compulsory Voluntary
Finland Guarantee Fund of Commercial
Banks and Postipankki
Ltd.
1966 Quarantee Fund of Commercial
Banks and Postipankki
Ltd.
Industry Compulsory Private sector Compulsory Compulsory Voluntary
France Deposit Guarantee
Fund
1980 French Bankers Association
Industry Compulsory Private sector Compulsory Compulsory Compulsory
Germany Deposit Protection Fund of the Federal Association of German Banks
1966 Federal Association of German Banks
Industry Voluntary Private sector Compulsory Compulsory Compulsory
Greece Deposit Guarantee
Fund
1995 2 Deposit Guarantee
Fund
Government/Industry - joint
Compulsory Jointly by private/public
officials
Compulsory Compulsory Compulsory

25
BANKING REGULATION OVER TWO TURBULENT DECADES
NA
ME
OF
GU
AR
AN
TEE
/IN
SU
RA
NC
E S
YSTE
M
YEA
R F
IRS
T E
STA
BLI
SH
ED
AG
EN
CY
RE
SP
ON
SIB
LE
FOR
AD
MIN
ISTE
RIN
G
SYS
TEM
1995 2011
AD
MIN
ISTR
ATIO
N
OF
SYS
TEM
: G
OVE
RN
ME
NT
OR
IN
DU
STR
Y
ME
MB
ER
SH
IP:
VOLU
NTA
RY
OR
C
OM
PU
LS
OR
Y
AD
MIN
ISTR
ATIO
N
OF
SYS
TEM
: G
OVE
RN
ME
NT
OR
IN
DU
STR
Y
MEMBERSHIP: VOLUNTARY OR COMPULSORY
DO
ME
STI
C
BA
NK
S
FOR
EIG
N
BA
NK
S
UB
SID
IAR
IES
FOR
EIG
N
BA
NK
B
RA
NC
HE
S
Ireland Deposit Protection
Account (Central Bank)
1989 Central Bank of Ireland
Government Compulsory Public sector Compulsory Compulsory Compulsory
Italy Fondo Interbancario Di Tutela Dei
Depositi
1987 Independently Administered
Industry Voluntary Private sector Compulsory Compulsory Compulsory
Luxembourg Association pour la Garantie
des Depots, Luxembourg
(AGDL)
1989 AGDL Industry Compulsory Private sector Compulsory Compulsory Voluntary
Netherlands Collective Guarantee
System
1979 De Nederlandsche
Bank N.V.
Government/Industry - joint
Compulsory Public sector Compulsory Compulsory Voluntary
Portugal Deposit Guarantee Fund
1992 Deposit Guarantee Fund
Government Compulsory Jointly by private/public
officials
Compulsory Compulsory Compulsory
Spain Deposit Guarantee Fund
1977 Fondo de Garantia de Depositos
Government/Industry - joint
Compulsory Jointly by private/public
officials
Compulsory Compulsory Compulsory
Sweden Swedish Deposit-
Guarantee Scheme
1974 The Bank Support
Authority
Government Compulsory n.a. n.a. n.a. n.a.
United Kingdom Deposit Protection
Fund
1982 Deposit Protection
Board
Government Compulsory Private sector Compulsory Compulsory Voluntary
% Compulsory 84% 100% 100% 47%
Sources: The 1995 data are from Barth, Nolle, and Rice (1997a). The 2011 data are from Barth, Caprio, and Levine (2013) and the World Bank Survey IV.
Information on the coverage protection of the deposit insurance schemes is provided in Table 7. There was substantial variation in the extent or the amount of coverage in 1995 compared with 2011. Many more countries provided the same amount of coverage in the later year because of the formation of the European Union: Member countries eventually agreed to provide the same level of coverage. Moreover, in 1995, every country but one excluded interbank deposits from coverage, whereas in 2011 these deposits were offered protection in all but five countries. Another major difference between the two years is that all but two countries provided coverage protection for foreign-currency denominated deposits in 1995. However, in 2011, only four countries offered such protection for these deposits. Information available in 2011 but not in 1995 also indicates that more than 80 percent of the countries provide coverage protection for the deposits of foreign subsidiaries. Clearly, not all countries provide the same amount or scope of coverage protection.
table 6 continued
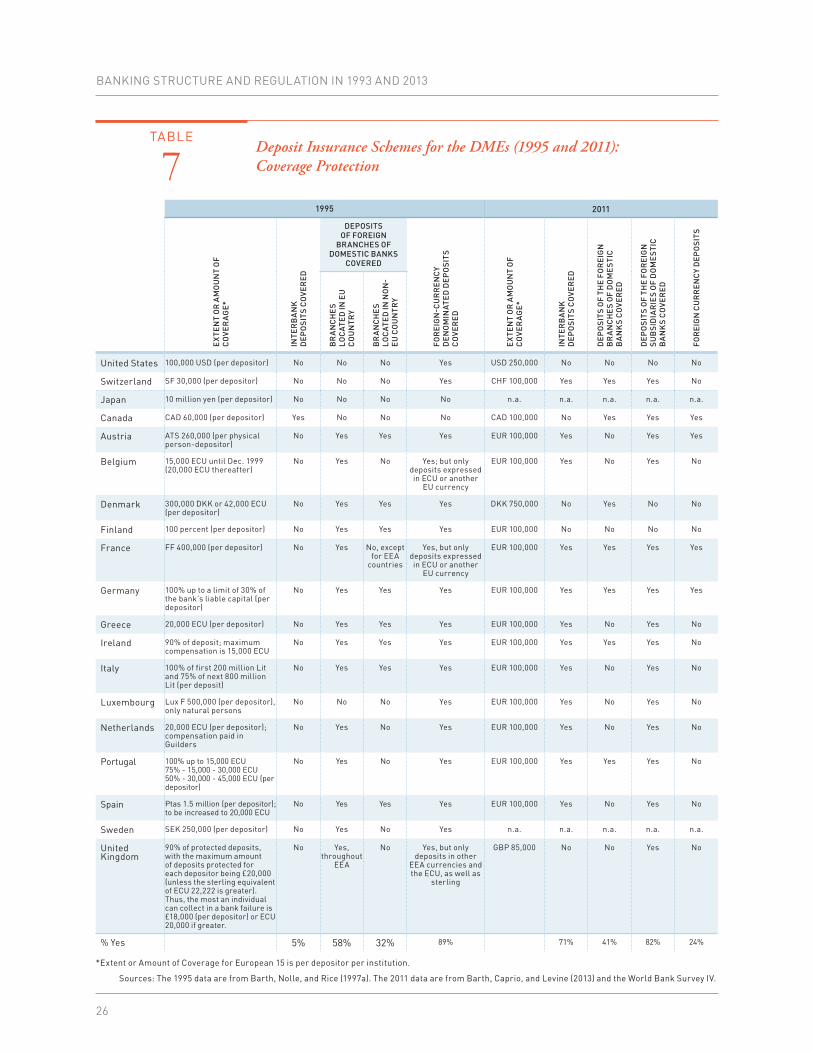
BANKING STRUCTURE AND REGULATION IN 1993 AND 2013
26
TABLE
7Deposit Insurance Schemes for the DMEs (1995 and 2011): Coverage Protection
1995 2011E
XTE
NT
OR
AM
OU
NT
OF
CO
VER
AG
E*
INTE
RB
AN
KD
EP
OSI
TS C
OVE
RE
D
DEPOSITS OF FOREIGN
BRANCHES OF DOMESTIC BANKS
COVERED
FOR
EIG
N-C
UR
RE
NC
Y D
EN
OM
INAT
ED
DE
PO
SITS
C
OVE
RE
D
EX
TEN
T O
R A
MO
UN
T O
F C
OVE
RA
GE
*
INTE
RB
AN
KD
EP
OSI
TS C
OVE
RE
D
DE
PO
SITS
OF
THE
FOR
EIG
N
BR
AN
CH
ES
OF
DO
ME
STI
C
BA
NK
S C
OVE
RE
D
DE
PO
SITS
OF
THE
FOR
EIG
N
SUB
SID
IAR
IES
OF
DO
ME
STI
C
BA
NK
S C
OVE
RE
D
FOR
EIG
N C
UR
RE
NC
Y D
EP
OSI
TS
BR
AN
CH
ES
LOC
ATE
D IN
EU
C
OU
NTR
Y
BR
AN
CH
ES
LOC
ATE
D IN
NO
N-
EU
CO
UN
TRY
United States 100,000 USD (per depositor) No No No Yes USD 250,000 No No No No
Switzerland SF 30,000 (per depositor) No No No Yes CHF 100,000 Yes Yes Yes No
Japan 10 million yen (per depositor) No No No No n.a. n.a. n.a. n.a. n.a.
Canada CAD 60,000 (per depositor) Yes No No No CAD 100,000 No Yes Yes Yes
Austria ATS 260,000 (per physical person-depositor)
No Yes Yes Yes EUR 100,000 Yes No Yes Yes
Belgium 15,000 ECU until Dec. 1999 (20,000 ECU thereafter)
No Yes No Yes; but only deposits expressed in ECU or another
EU currency
EUR 100,000 Yes No Yes No
Denmark 300,000 DKK or 42,000 ECU (per depositor)
No Yes Yes Yes DKK 750,000 No Yes No No
Finland 100 percent (per depositor) No Yes Yes Yes EUR 100,000 No No No No
France FF 400,000 (per depositor) No Yes No, except for EEA
countries
Yes, but only deposits expressed in ECU or another
EU currency
EUR 100,000 Yes Yes Yes Yes
Germany 100% up to a limit of 30% of the bank’s liable capital (per depositor)
No Yes Yes Yes EUR 100,000 Yes Yes Yes Yes
Greece 20,000 ECU (per depositor) No Yes Yes Yes EUR 100,000 Yes No Yes No
Ireland 90% of deposit; maximum compensation is 15,000 ECU
No Yes Yes Yes EUR 100,000 Yes Yes Yes No
Italy 100% of first 200 million Lit and 75% of next 800 million Lit (per deposit)
No Yes Yes Yes EUR 100,000 Yes No Yes No
Luxembourg Lux F 500,000 (per depositor), only natural persons
No No No Yes EUR 100,000 Yes No Yes No
Netherlands 20,000 ECU (per depositor); compensation paid in Guilders
No Yes No Yes EUR 100,000 Yes No Yes No
Portugal 100% up to 15,000 ECU75% - 15,000 - 30,000 ECU50% - 30,000 - 45,000 ECU (per depositor)
No Yes No Yes EUR 100,000 Yes Yes Yes No
Spain Ptas 1.5 million (per depositor); to be increased to 20,000 ECU
No Yes Yes Yes EUR 100,000 Yes No Yes No
Sweden SEK 250,000 (per depositor) No Yes No Yes n.a. n.a. n.a. n.a. n.a.
United Kingdom
90% of protected deposits, with the maximum amount of deposits protected for each depositor being £20,000 (unless the sterling equivalent of ECU 22,222 is greater). Thus, the most an individual can collect in a bank failure is £18,000 (per depositor) or ECU 20,000 if greater.
No Yes, throughout
EEA
No Yes, but only deposits in other
EEA currencies and the ECU, as well as
sterling
GBP 85,000 No No Yes No
% Yes 5% 58% 32% 89% 71% 41% 82% 24%
*Extent or Amount of Coverage for European 15 is per depositor per institution.
Sources: The 1995 data are from Barth, Nolle, and Rice (1997a). The 2011 data are from Barth, Caprio, and Levine (2013) and the World Bank Survey IV.

27
BANKING REGULATION OVER TWO TURBULENT DECADES
The third dimension of deposit insurance schemes is funding (Table 8). The schemes may be funded ex-ante and ex-post. For 1995 and 2011, the number of schemes funded either ex-ante or ex-post was about the same, with roughly two-thirds funded ex-ante. There were differences among the deposit insurance schemes with respect to the base on which premiums were levied, typically being either insured deposits or total deposits for both years. Interestingly enough, the percentage of schemes with risk-based premiums in 1995 doubled by 2011. Yet, in the latter year, only about half of the schemes included risk-based premiums.
TABLE
8 Deposit Insurance Schemes for DMEs (1995 and 2011): Funding
1995 2011
EX
AN
TE O
R E
X P
OS
T FU
ND
ING
BA
SE F
OR
PR
EM
IUM
RIS
K-B
ASE
D P
RE
MIU
MS
IS T
HE
RE
AN
EX
AN
TE
FUN
D/R
ESE
RVE
TO
CO
VER
DE
PO
SIT
INSU
RA
NC
E C
LA
IMS
IN T
HE
EVE
NT
OF
THE
FAIL
UR
E O
F A
ME
MB
ER
B
AN
K?
IS THE PREMIUM ASSESSED ON A PARTICIPATING
BANK’S ….?
DO
DE
PO
SIT
INSU
RA
NC
E FE
ES/
PR
EM
IUM
S C
HA
RG
ED
TO
BA
NK
S VA
RY
BA
SED
ON
SO
ME
AS
SES
SME
NT
OF
RIS
K?
INSU
RE
D
DE
PO
SITS
TOTA
L D
EP
OSI
TS
TOTA
L A
SSE
TS
United States Ex ante Domestic deposits Yes Ex ante No No No Yes
Switzerland Ex post Two components: fixed fee in relation to gross profit; variable fee depending on share of total protected deposits of an individual bank.
n.a. Ex ante No No No No
Japan Ex ante Insured deposits No n.a. n.a. n.a. n.a. n.a.
Canada Ex ante Insured deposits No Ex ante Yes No No Yes
Austria Ex post, system organized as an incident-related guarantee facility
The deposit guarantee system shall obligate its member institutions, in case of paying-out of guaranteed deposits, to pay without delay pro rata amounts that shall be computed according to the share of the remaining member institution at the preceding balance sheet date as compared to the sum of such guaranteed deposits of the deposit guarantee system.
n.a. Ex post No No No No
Belgium Ex ante, but in case of insufficient reserves, banks may be asked to pay, each year if necessary, an exceptional additional contribution up to 0.04 percent
Total amount of customers’ deposits that qualify for reimbursement and that are expressed either in BEF, ECU, or another EU currency.
No Ex ante Yes No No No
Denmark Ex ante Deposits No Ex ante No No No No
Finland Ex ante Total assets No Ex ante No No No Yes
France Ex post Contribution consists of two parts: 1. A fixed part, irrespective of the size of the bank, equal to 0.1% of any claim settled and with a FFR 200,000 ceiling; 2. A proportional part, varying according to a regressive scale relative to the size of the bank contributing, based on deposits and one-third credits.
n.a. Ex ante Yes No No Yes
Germany Ex ante; however, additional assessments may be made if necessary to discharge the fund’s responsibilities. These contributions are limited to twice the annual contribution
Balance sheet item “Liabilities to Customers.”
No Ex ante No No No Yes

BANKING STRUCTURE AND REGULATION IN 1993 AND 2013
28
1995 2011
EX
AN
TE O
R E
X P
OS
T FU
ND
ING
BA
SE F
OR
PR
EM
IUM
RIS
K-B
ASE
D P
RE
MIU
MS
IS T
HE
RE
AN
EX
AN
TE
FUN
D/R
ESE
RVE
TO
CO
VER
DE
PO
SIT
INSU
RA
NC
E C
LA
IMS
IN T
HE
EVE
NT
OF
THE
FAIL
UR
E O
F A
ME
MB
ER
B
AN
K?
IS THE PREMIUM ASSESSED ON A PARTICIPATING
BANK’S ….?
DO
DE
PO
SIT
INSU
RA
NC
E FE
ES/
PR
EM
IUM
S C
HA
RG
ED
TO
BA
NK
S VA
RY
BA
SED
ON
SO
ME
AS
SES
SME
NT
OF
RIS
K?
INSU
RE
D
DE
PO
SITS
TOTA
L D
EP
OSI
TS
TOTA
L A
SSE
TS
Greece Ex ante Total deposits No Ex ante No No No Yes
Ireland Ex ante Total deposits excluding interbank deposits and deposits represented by Negotiable Certificates of Deposit.
No Ex ante No Yes No No
Italy Ex post; banks commit ex ante, however contributions are ex post.
Maximum limit for funding the whole system: 4,000 billion lire. Contributions are distributed among participants on the basis of: (Deposits + Loans – Own Funds) with a correction mechanism linked to deposit growth.
n.a. Ex post Yes No No Yes
Luxembourg Ex post Banks’ premiums based on percentage of loss to be met.
n.a. Ex post Yes No No No
Netherlands Ex post Amount repaid in compensation to insured is apportioned among participating institutions. However, the contribution in any one year shall not exceed 5% per an institution’s own funds and per all institutions’ own funds.
n.a. Ex post No No No No
Portugal Ex ante. However, the payment of the annual contributions may be partly replaced, with a legal maximum of 75%, by the commitment to deliver the amount due to the fund, at any moment it proves necessary.
Guaranteed deposits Yes Ex ante Yes No No Yes
Spain Ex ante Deposits No Ex ante No No No No
Sweden Ex ante Covered deposits Yes n.a. n.a. n.a. n.a. n.a.
United Kingdom Ex ante; banks make initial contributions of £10,000 when a bank is first authorized, further contributions if the fund falls below £3 million, not exceeding £300,000 per bank based on the insured deposit base of the banks involved, and special contributions, again based on the insured deposit base of the banks involved, but with no contribution limit.
All deposits in EEA currencies less deposits by credit institutions; financial institutions, insurance undertakings, directors, controllers and managers, secured deposits, CDS, deposits by other group companies and deposits that are part of the bank’s own funds.
No Ex post Yes No No No
% Yes 23% 41% 6% 0% 47%
Sources: The 1995 data are from Barth, Nolle, and Rice (1997a). The 2011 data are from Barth, Caprio, and Levine (2013) and the World Bank Survey IV.
table 8 continued
29
4. BANKING SUPERVISION
The two data sets (especially the World Bank survey data) from which our current data is drawn cover more dimensions of banking supervision than our current combined data set does. This is because of a substantial degree of incomparability between the underlying data sets on this topic. Nevertheless, there are two key dimensions of banking supervision in which we can make some headway, including consumer protection regulations and emphasis on market discipline via external auditing.
Table 9 shows that roughly two-thirds of the countries providing information indicate that there were consumer protection laws in existence or the bank regulatory agency had powers relating to consumer protection laws in 1993 and 2011. Some countries answered “Yes” in one year but then answered “No” in the other year, including Belgium, Canada, Greece, Netherlands, Switzerland, and the United Kingdom. However, the questions for the two years are worded differently, which may have led to answers that are not directly comparable. For example, France indicates that consumer protection laws exist, but not specifically for banks. It may therefore be the case that consumer protection laws exist even in those countries indicating the lack of a bank regulatory agency to take actions based on such laws.
External audits are deemed to be quite important for banks as indicated in the information in Table 9. All of the countries providing information required external audits in 1993. However, Italy required them only in the case of banks quoted on the stock exchange and the United States excluded audits for banks with less than $500 million in assets. In 2011, all of the countries providing information also required external audits, but none indicated any qualifications.
Much more information regarding audits was available in 2011 than in 1993. One important piece of information concerns whether the audit is conducted in accordance with International Standards on Auditing (ISA). In two-thirds of the countries, this is the case. However, the United States does not require auditors to comply with ISA. This difference means that the balance sheets of banks in countries using different standards of auditing are not directly comparable. The other three important pieces of information regarding audits relate to whether auditors are required to report information on the nature of their opinions, the safety and soundness of a bank, and illegalities of officers or directors to the supervisory agency. In more than 80 percent of the countries in each of these areas, such information was indeed required to be reported. The United States, however, does not require auditors to inform bank supervisors when they intend to issue qualified opinions on the accounts of a bank.
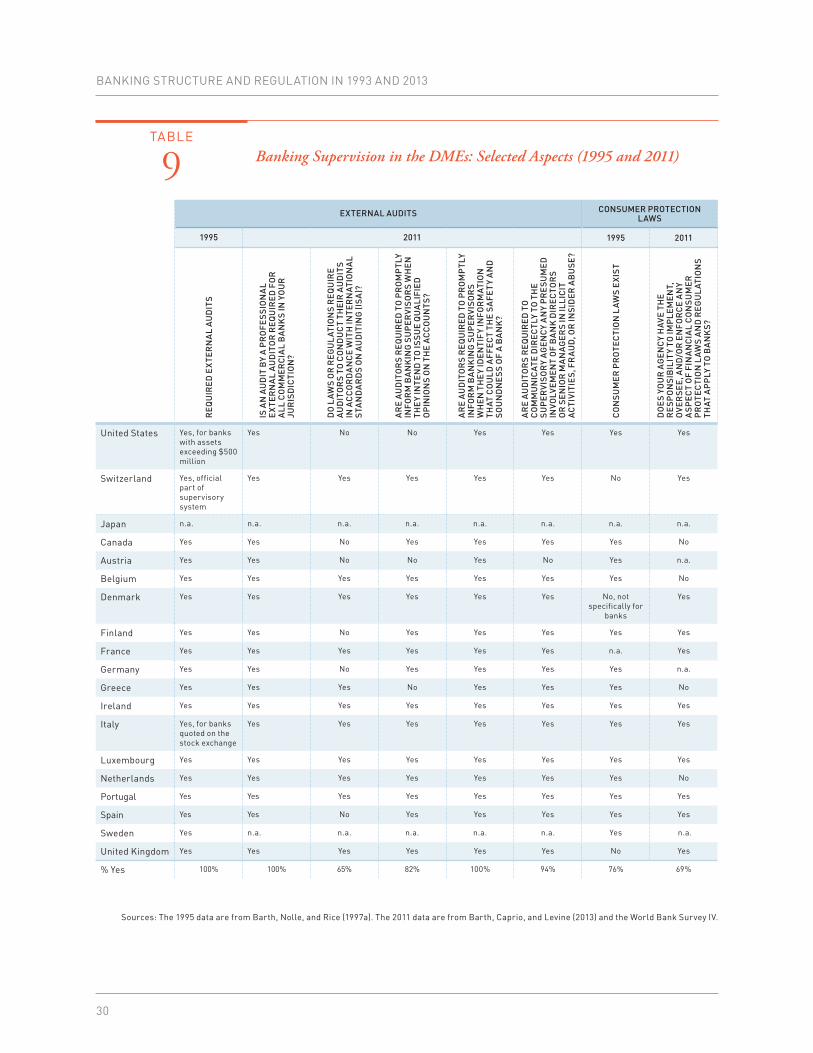
BANKING STRUCTURE AND REGULATION IN 1993 AND 2013
30
TABLE
9 Banking Supervision in the DMEs: Selected Aspects (1995 and 2011)
EXTERNAL AUDITS CONSUMER PROTECTION LAWS
1995 2011 1995 2011
RE
QU
IRE
D E
XTE
RN
AL
AU
DIT
S
IS A
N A
UD
IT B
Y A
PR
OFE
SSI
ON
AL
EX
TER
NA
L A
UD
ITO
R R
EQ
UIR
ED
FO
R
ALL
CO
MM
ER
CIA
L B
AN
KS
IN Y
OU
R
JUR
ISD
ICTI
ON
?
DO
LA
WS
OR
RE
GU
LAT
ION
S R
EQ
UIR
E A
UD
ITO
RS
TO C
ON
DU
CT
THE
IR A
UD
ITS
IN A
CC
OR
DA
NC
E W
ITH
INTE
RN
ATIO
NA
L S
TAN
DA
RD
S O
N A
UD
ITIN
G (I
SA
)?
AR
E A
UD
ITO
RS
RE
QU
IRE
D T
O P
RO
MP
TLY
INFO
RM
BA
NK
ING
SU
PE
RVI
SO
RS
WH
EN
TH
EY
INTE
ND
TO
ISSU
E Q
UA
LIFI
ED
O
PIN
ION
S O
N T
HE
AC
CO
UN
TS?
AR
E A
UD
ITO
RS
RE
QU
IRE
D T
O P
RO
MP
TLY
INFO
RM
BA
NK
ING
SU
PE
RVI
SO
RS
WH
EN
TH
EY
IDE
NTI
FY
INFO
RM
ATIO
N
THAT
CO
ULD
AFF
EC
T TH
E S
AFE
TY
AN
D
SO
UN
DN
ES
S O
F A
BA
NK
?
AR
E A
UD
ITO
RS
RE
QU
IRE
D T
O
CO
MM
UN
ICAT
E D
IRE
CTL
Y TO
TH
E SU
PE
RVI
SO
RY
AG
EN
CY
AN
Y P
RE
SUM
ED
IN
VOLV
EM
EN
T O
F B
AN
K D
IRE
CTO
RS
OR
SE
NIO
R M
AN
AG
ER
S IN
ILLI
CIT
A
CTI
VITI
ES,
FR
AU
D, O
R IN
SID
ER
AB
USE
?
CO
NSU
ME
R P
RO
TEC
TIO
N L
AW
S E
XIS
T
DO
ES
YOU
R A
GE
NC
Y H
AVE
THE
RE
SPO
NSI
BIL
ITY
TO IM
PLE
ME
NT,
O
VER
SEE
, AN
D/O
R E
NFO
RC
E A
NY
ASP
EC
T O
F FI
NA
NC
IAL
CO
NSU
ME
R
PR
OTE
CTI
ON
LA
WS
AN
D R
EG
UL
ATIO
NS
THAT
AP
PLY
TO
BA
NK
S?
United States Yes, for banks with assets exceeding $500 million
Yes No No Yes Yes Yes Yes
Switzerland Yes, official part of supervisory system
Yes Yes Yes Yes Yes No Yes
Japan n.a. n.a. n.a. n.a. n.a. n.a. n.a. n.a.
Canada Yes Yes No Yes Yes Yes Yes No
Austria Yes Yes No No Yes No Yes n.a.
Belgium Yes Yes Yes Yes Yes Yes Yes No
Denmark Yes Yes Yes Yes Yes Yes No, not specifically for
banks
Yes
Finland Yes Yes No Yes Yes Yes Yes Yes
France Yes Yes Yes Yes Yes Yes n.a. Yes
Germany Yes Yes No Yes Yes Yes Yes n.a.
Greece Yes Yes Yes No Yes Yes Yes No
Ireland Yes Yes Yes Yes Yes Yes Yes Yes
Italy Yes, for banks quoted on the stock exchange
Yes Yes Yes Yes Yes Yes Yes
Luxembourg Yes Yes Yes Yes Yes Yes Yes Yes
Netherlands Yes Yes Yes Yes Yes Yes Yes No
Portugal Yes Yes Yes Yes Yes Yes Yes Yes
Spain Yes Yes No Yes Yes Yes Yes Yes
Sweden Yes n.a. n.a. n.a. n.a. n.a. Yes n.a.
United Kingdom Yes Yes Yes Yes Yes Yes No Yes
% Yes 100% 100% 65% 82% 100% 94% 76% 69%
Sources: The 1995 data are from Barth, Nolle, and Rice (1997a). The 2011 data are from Barth, Caprio, and Levine (2013) and the World Bank Survey IV.

31
5. SUMMARY AND CONCLUSIONS
We began this report by observing that it is reasonable to ask, after two decades of extreme turbulence in banking and financial markets around the world, what is the status of banking regulation and supervision. As we explained in Section I, our unique starting point for answering that question comes from the fact that two of us developed and analyzed the first, and therefore the oldest, detailed, multi-country database on banking regulation and supervision. We explain the nature of the 20-year (1993-2013) perspective that data gives us, combined with the most recent World Bank survey data, in a series of tables highlighting major aspects of banking regulation and supervision across the 19 developed market economies originally examined by Barth, Nolle, and Rice (1997a and b). We showed that, although the ascendance of several emerging market economies–including in particular China–over the past 20 years diminished the share of world banking “heft” of those 19 DMEs, they as a group still account for the majority of world banking and financial activity.
Our review of key aspects of banking market structure yielded the big-picture conclusion that the business of banking has gotten riskier in at least two systemic ways, amid a continuing sequence of regional and banking crises, and despite the inevitable flurry of policy responses to the perceived causes of those crises. First, our data on banking concentration ratios show that the very largest banks continue to dominate the industry in almost all of the 19 countries; further, that data, combined with our data on the huge size of the banking industry relative to overall economic activity, shows the particularly crucial role played by a handful of the very largest banks in most of the countries.
Our examination of banking industry structure over the two time periods points to a second way in which banking has grown riskier. Despite repeated policy initiatives to address negative systemic impacts of banking activities gone awry, deposits-to-assets ratios indicate that, in most of the 19 DMEs, the stability of bank funding practices in 2011 remains much as it was two decades ago.
Whether improvements in regulation and supervision can offset these and other factors remains to be seen. Sections III and IV contribute to taking the necessary first step in addressing that question by describing key aspects of the bank regulation and supervision landscape. Section III focuses on three dimensions of bank regulation: banking powers, capital requirements, and deposit insurance schemes. The first part of Section III looked at data from both 1995 and 2011 on “banking powers”—i.e., how much the 19 DMEs restrict the extent to which banks can engage in securities, insurance, and real estate services, as well as the degree to which the integration of banking and commerce is restricted by ownership options. We found no clear-cut trend across the 19 DMEs over time of either increased liberalization or increased restrictiveness of banking powers. That finding is somewhat surprising, given the substantial energy devoted by national and international policymakers to mitigate systemic risk, especially after the global financial crisis of 2008-2009.

BANKING STRUCTURE AND REGULATION IN 1993 AND 2013
32
Our brief review of the nature of capital requirements across countries and over time in Section III did not yield the same kind of surprise, but offers food for thought. The 19 DMEs clearly all agree that upgrades in capital requirements, as embodied in Basel II (and, by inference, Basel III), are crucial. However, the key takeaway from the data in Tables 5a and 5b is that countries vary widely–perhaps too widely–in how they implement higher capital requirements. Section III ends by considering a wealth of details on deposit insurance schemes in 1995 and 2011. A basic conclusion is that there has been a broad trend to increase the scope of these schemes. Section IV highlights several elements of banking supervision across the 19 DMEs. Perhaps most importantly, the data show that most countries have beefed up their commitment to market discipline, at least via external audit requirements.
Our data allow us to paint a useful landscape of banking around the world. Furthermore, our two-decade time frame provides a context for reflecting on long-run trends. One possible train of thought to follow starts with the well-known fact, as empirically shown in our analysis, that there are substantial differences across countries in the composition of internationally agreed upon capital requirements. Move on then to our conclusions that the very largest banks retain the same kind of dominance in 2011 that they did 20 years ago (before the continued occurrence of ever-more serious financial crises) and that in the case of some basic banking activities such as funding practices, the nature of systemic risks seems to have remained the same, if not worsened, over time. Consider, too, the fact that in at least one respect–scope of coverage–deposit insurance schemes have changed in a way that encourages moral hazard behavior. The final observation, based on trends in external auditing requirements, is that there is evidence countries are placing more emphasis on market discipline. Taken together, these observations indicate that the banking industry still faces the same serious risks that existed before the global financial crisis. Much more work needs to be done to address these risks, starting with collecting additional data on banking policies and practices around the world to determine how well they are working.
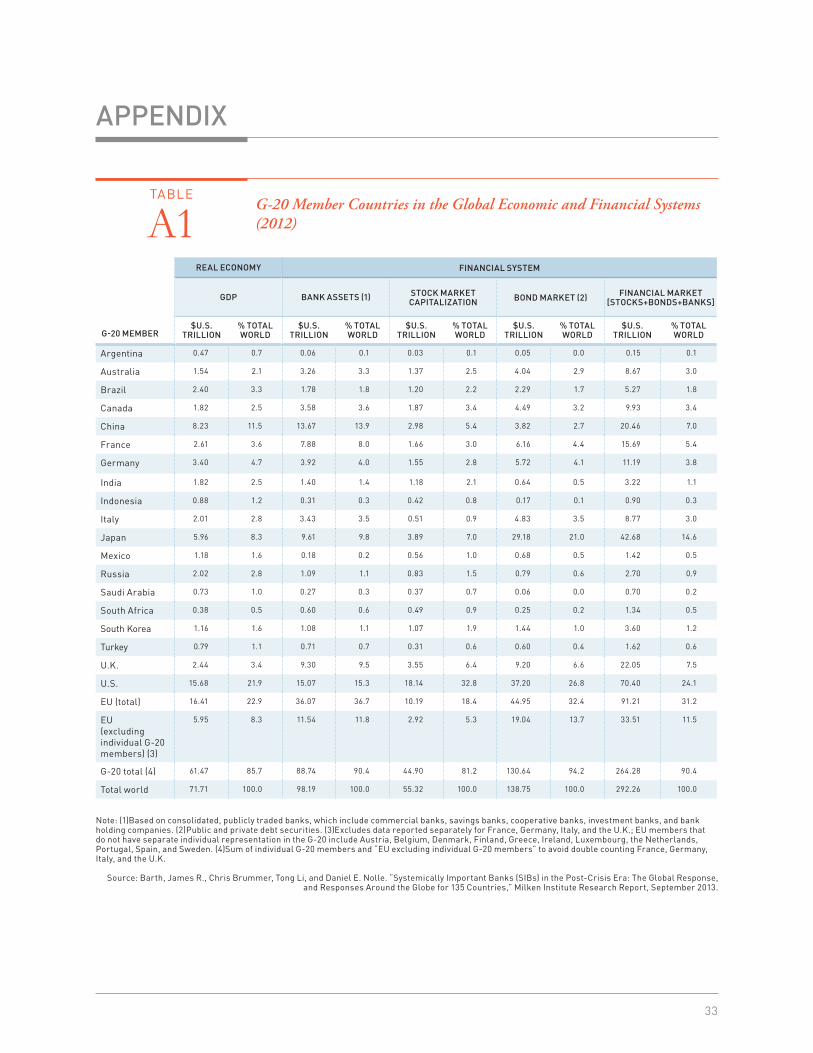
33
APPENDIX
TABLE
A1G-20 Member Countries in the Global Economic and Financial Systems (2012)
G-20 MEMBER
REAL ECONOMY FINANCIAL SYSTEM
GDP BANK ASSETS (1) STOCK MARKET CAPITALIZATION BOND MARKET (2) FINANCIAL MARKET
[STOCKS+BONDS+BANKS]
$U.S. TRILLION
% TOTAL WORLD
$U.S. TRILLION
% TOTAL WORLD
$U.S. TRILLION
% TOTAL WORLD
$U.S. TRILLION
% TOTAL WORLD
$U.S. TRILLION
% TOTAL WORLD
Argentina 0.47 0.7 0.06 0.1 0.03 0.1 0.05 0.0 0.15 0.1
Australia 1.54 2.1 3.26 3.3 1.37 2.5 4.04 2.9 8.67 3.0
Brazil 2.40 3.3 1.78 1.8 1.20 2.2 2.29 1.7 5.27 1.8
Canada 1.82 2.5 3.58 3.6 1.87 3.4 4.49 3.2 9.93 3.4
China 8.23 11.5 13.67 13.9 2.98 5.4 3.82 2.7 20.46 7.0
France 2.61 3.6 7.88 8.0 1.66 3.0 6.16 4.4 15.69 5.4
Germany 3.40 4.7 3.92 4.0 1.55 2.8 5.72 4.1 11.19 3.8
India 1.82 2.5 1.40 1.4 1.18 2.1 0.64 0.5 3.22 1.1
Indonesia 0.88 1.2 0.31 0.3 0.42 0.8 0.17 0.1 0.90 0.3
Italy 2.01 2.8 3.43 3.5 0.51 0.9 4.83 3.5 8.77 3.0
Japan 5.96 8.3 9.61 9.8 3.89 7.0 29.18 21.0 42.68 14.6
Mexico 1.18 1.6 0.18 0.2 0.56 1.0 0.68 0.5 1.42 0.5
Russia 2.02 2.8 1.09 1.1 0.83 1.5 0.79 0.6 2.70 0.9
Saudi Arabia 0.73 1.0 0.27 0.3 0.37 0.7 0.06 0.0 0.70 0.2
South Africa 0.38 0.5 0.60 0.6 0.49 0.9 0.25 0.2 1.34 0.5
South Korea 1.16 1.6 1.08 1.1 1.07 1.9 1.44 1.0 3.60 1.2
Turkey 0.79 1.1 0.71 0.7 0.31 0.6 0.60 0.4 1.62 0.6
U.K. 2.44 3.4 9.30 9.5 3.55 6.4 9.20 6.6 22.05 7.5
U.S. 15.68 21.9 15.07 15.3 18.14 32.8 37.20 26.8 70.40 24.1
EU (total) 16.41 22.9 36.07 36.7 10.19 18.4 44.95 32.4 91.21 31.2
EU(excluding individual G-20 members) (3)
5.95 8.3 11.54 11.8 2.92 5.3 19.04 13.7 33.51 11.5
G-20 total (4) 61.47 85.7 88.74 90.4 44.90 81.2 130.64 94.2 264.28 90.4
Total world 71.71 100.0 98.19 100.0 55.32 100.0 138.75 100.0 292.26 100.0
Note: (1) Based on consolidated, publicly traded banks, which include commercial banks, savings banks, cooperative banks, investment banks, and bank holding companies. (2)Public and private debt securities. (3) Excludes data reported separately for France, Germany, Italy, and the U.K.; EU members that do not have separate individual representation in the G-20 include Austria, Belgium, Denmark, Finland, Greece, Ireland, Luxembourg, the Netherlands, Portugal, Spain, and Sweden. (4) Sum of individual G-20 members and “EU excluding individual G-20 members” to avoid double counting France, Germany, Italy, and the U.K.
Source: Barth, James R., Chris Brummer, Tong Li, and Daniel E. Nolle. “Systemically Important Banks (SIBs) in the Post-Crisis Era: The Global Response, and Responses Around the Globe for 135 Countries,” Milken Institute Research Report, September 2013.

BANKING STRUCTURE AND REGULATION IN 1993 AND 2013
34
TABLE
A2 The World’s 50 Biggest Banks
BANK COUNTRY TOTAL ASSETS(US$ MILLIONS)
(a) 19901 Dai-ichi Kangyo Bank Japan 426,855
2 Mitsubishi Bank Japan 412,783
3 Sumitomo Bank Japan 407,907
4 Mitsui Taiyo Kobe Bank Japan 407,502
5 Sanwa Bank Japan 401,465
6 Fuji Bank Japan 398,321
7 Credit Agricole Japan 302,983
8 Banque Nationale de Paris France 289,747
9 Industrial Bank of Japan Japan 289,179
10 Credit Lyonnais France 285,238
11 Deutsche Bank Germany 267,702
12 Barclays Bank United Kingdom 260,048
13 Tokai Bank Japan 248,986
14 Norinchukin Bank Japan 248,901
15 National Westminster Bank United Kingdom 233,468
16 ABN-AMRO Bank Netherlands 232,694
17 Bank of Tokyo Japan 222,501
18 Citicorp United States 214,821
19 Societe Generale France 204,485
20 Long-Term Credit Bank of Japan Japan 200,064
21 Dresdner Bank Germany 189,500
22 Compagnie Financiere de Paribas France 184,232
23 Union Bank of Switzerland Switzerland 180,612
24 Groupe des Caisses d'Epargne Ecureuil France 174,030
25 Bank of China China 164,515
26 Swiss Bank Corp. Switzerland 148,926
27 Hong Kong Bank Hong Kong 148,582
28 Commerzbank Germany 144,501
29 Bayerische Vereinsbank Germany 137,723
30 Westdeutsche Landesbank Girozentrale Germany 137,279
31 DG Bank Germany 136,450
32 Istituto Bancario San Paolo di Torino Italy 133,156
33 Banca Nazionale del Labvoro Italy 132,122
34 Nippon Credit Bank Japan 130,961
35 Mitsubishi Trust & Banking Corporation Japan 130,764
36 Rabobank Nederland Netherlands 119,469
37 Daiwa Bank Japan 118,583
38 Bayerische Hypotheken & Wechsel-Bank Germany 116,772
39 Credit Suisse Switzerland 115,535

35
APPENDIX
BANK COUNTRY TOTAL ASSETS(US$ MILLIONS)
(a) 1990 (cont.)
40 Midland Bank United States 114,972
41 Sumitomo Trust & Banking Japan 113,600
42 Kyowa Bank Japan 112,500
43 BankAmerica Corp. United States 109,089
44 Lloyds Bank United Kingdom 106,424
45 Saitama Bank Japan 106,146
46 Bayerische Landesbank Germany 103,720
47 NMB Postbank Group Netherlands 102,672
48 Shoko Chukin Bank Japan 102,358
49 Cariplo (Cassa di Risparmio delle P.Lombarde) Italy 99,698
50 People's Construction Bank of China China 99,163
Source: The Banker, 1990.
(b) 20131 Industrial & Commercial Bank of China China 2,789,083
2 HSBC Holdings Plc United Kingdom 2,692,538
3 Deutsche Bank AG Germany 2,655,138
4 BNP Paribas France 2,516,546
5 Crédit Agricole S.A. France 2,430,876
6 JPMorgan Chase & Co. United States 2,415,689
7 Mitsubishi UFJ Financial Group Inc. Japan 2,407,111
8 Barclays Plc United Kingdom 2,351,777
9 China Construction Bank Corporation China 2,221,577
10 Agricultural Bank of China Limited China 2,105,753
11 Bank of America Corporation United States 2,102,273
12 The Royal Bank of Scotland Group Plc United Kingdom 2,070,846
13 Bank of China Limited China 2,016,124
14 Citigroup Inc. United States 1,880,617
15 Mizuho Financial Group Japan 1,839,478
16 Banco Santander SA Spain 1,675,192
17 Société Générale France 1,650,212
18 Sumitomo Mitsui Financial Group, Inc. Japan 1,572,041
19 ING Groep NV Netherlands 1,541,934
20 Wells Fargo & Company United States 1,527,015
21 BPCE Group France 1,514,080
22 Lloyds Banking Group Plc United Kingdom 1,458,974
23 UBS AG Switzerland 1,373,808
24 UniCredit SpA Italy 1,222,889
25 Credit Suisse Group AG Switzerland 1,008,379
26 Rabobank Nederland-Rabobank Group Netherlands 992,756
27 Goldman Sachs Group, Inc. United States 938,555
28 Nordea Bank AB (publ) Sweden 893,665
29 Intesa Sanpaolo Italy 888,603
table A2 continued

BANKING STRUCTURE AND REGULATION IN 1993 AND 2013
36
BANK COUNTRY TOTAL ASSETS(US$ MILLIONS)
(b) 2013 (cont.)
30 Banco Bilbao Vizcaya Argentaria SA Spain 841,516
31 Commerzbank AG Germany 839,000
32 Bank of Communications Co. Ltd. China 838,428
33 Toronto Dominion Bank Canada 824,916
34 Royal Bank of Canada RBC Canada 823,278
35 Metlife, Inc. United States 799,625
36 Morgan Stanley United States 780,960
37 National Australia Bank Limited Australia 752,585
38 Bank of Nova Scotia Canada 711,350
39 Commonwealth Bank of Australia Australia 698,745
40 Fédération du Crédit Mutuel France 658,698
41 Australia and New Zealand Banking Group Australia 654,432
42 Westpac Banking Corporation Australia 648,485
43 Standard Chartered Plc United Kingdom 636,518
44 Danske Bank Denmark 615,854
45 Banco do Brasil S.A. Brazil 561,679
46 China Merchants Bank Co. Ltd. China 541,882
47 Industrial Bank Co. Ltd. China 516,881
48 Bank of Montreal-Banque de Montreal Canada 513,867
49 China Minsheng Banking Corporation China 510,684
50 Shanghai Pudong Development Bank China 500,144
Note: The data are from the latest quarter available in 2013 (accessed 1/27/2014).
Source: BankScope.
table A2 continued

37
APPENDIX
TABLE
A3 Headquarters of the World’s 50 Biggest Banks: 1990 and 2013
Note: The list of top 50 banks is in Appendix Table A2.
Sources: The Banker, BankScope, Milken Institute.
1990 2013
NUMBER OF BANKS IN
TOP 50
COMBINED TOTAL
ASSETS($ BILLIONS)
SHARE OF WORLD
BANKING ASSETS
(%)
NUMBER OF BANKS IN
TOP 50
COMBINED TOTAL
ASSETS($ BILLIONS)
SHARE OF WORLD
BANKING ASSETS
(%)
Countries listed in Table 1 Countries listed in Table 1
France 5 1,138 4.5 Canada 4 2,873 2.6
Germany 8 1,234 4.9 Denmark 1 616 0.6
Italy 3 365 1.4 France 5 8,770 7.9
Japan 19 4,782 19.0 Germany 2 3,494 3.2
Netherlands 3 455 1.8 Italy 2 2,111 1.9
Switzerland 3 445 1.8 Japan 3 5,819 5.3
United Kingdom 4 715 2.8 Netherlands 2 2,535 2.3
United States 2 324 1.3 Spain 2 2,517 2.3
Sweden 1 894 0.8
Switzerland 2 2,382 2.1
United Kingdom 5 9,211 8.3
United States 7 10,445 9.4
Other Countries Other Countries
China 2 264 1.0 Australia 4 2,754 2.5
Hong Kong 1 149 0.6 Brazil 1 562 0.5
China 9 12,041 10.9
Total 50 biggest banks 9,869.7 39.2 Total 50
biggest banks 67,023 60.5

39
ABOUT THE AUTHORS
JAMES R. BARTH is the Lowder eminent scholar in finance at Auburn University, senior finance fellow at the Milken Institute, and a fellow of the Wharton Financial Institutions Center. He has served as leader of an international team advising the People’s Bank of China on banking reform and lectured on bank regulatory issues in China, India, Russia, and Egypt for the U.S. State Department. Barth was an appointee of Presidents Ronald Reagan and George H.W. Bush as chief economist of the Office of Thrift Supervision and previously the Federal Home Loan Bank Board. He has also been a professor of economics at George Washington University; associate director of the economics program at the National Science Foundation; Shaw Foundation professor of banking and finance at Nanyang Technological University; and a visiting scholar at the U.S. Congressional Budget Office, Federal Reserve Bank of Atlanta, Office of the Comptroller of the Currency, and the World Bank. Barth has recently co-authored Guardians of Finance: Making Regulators Work for Us; Fixing the Housing Market: Financial Innovations for the Future; The Rise and Fall of the U.S. Mortgage and Credit Markets: A Comprehensive Analysis of the Market Meltdown; China’s Emerging Financial Markets: Challenges and Opportunities; Rethinking Bank Regulation: Till Angels Govern; and Research Handbook on International Banking and Governance. He is also the co-editor of the Journal of Financial Economic Policy and overseas associate editor of The Chinese Banker.
DANIEL E. NOLLE is a senior financial economist in the Economics Department at the Office of the Comptroller of the Currency (OCC). Nolle’s fields of research and policy analysis include the structure of the U.S. banking industry, foreign banking in the U.S., U.S. and global financial regulatory system reform, cross-country comparisons of banking systems and financial regulation, technological innovation in banking and payments, and consumer financial protection. Before joining the OCC in 1991, Nolle was an economist at the Federal Reserve Bank of New York and an assistant professor at Middlebury College. He received his doctorate in economics from Johns Hopkins University and his bachelor’s degree in economics from the University of Missouri-St. Louis.
APANARD (PENNY) PRABHA is a senior economist at the Milken Institute. Her research expertise is in the areas of financial institutions and international finance. Prabha’s recent Milken Institute publications tackle current banking and monetary policy issues relating to the causes and consequences of the global financial crisis. Her recent Institute studies include “Breaking (Banks) Up Is Hard to Do: New Perspective on ‘Too Big to Fail’ ” and “The Fed’s Rough Road Ahead.” Her research work has also been published in many peer-reviewed scholarly journals and presented at international economic and finance conferences. Her recent publications include “Implicit Guarantees, Business Models and Banks’ Risk-Taking Through the Crisis: Global and European Perspectives” in Journal of Economics and Business and “An Analysis of Resolving Too-Big-to-Fail Banks Throughout the Various Regions of the United States” in Journal of Regional Analysis and Policy. Prior to joining the Institute, Prabha was an assistant professor of economics at the University of Illinois at Springfield. While completing her Ph.D. at Claremont Graduate University, she also was a visiting scholar at the Claremont Institute for Economic Policy Studies and the Freeman Program in Asian Political Economy at the Claremont Colleges as well as a lecturer of economics at Pitzer College and the University of Redlands.

1250 Fourth StreetSanta Monica, CA 90401Phone: 310-570-4600
E-mail: [email protected] • www.milkeninstitute.org
1101 New York Avenue NW, Suite 620Washington, DC 20005Phone: 202-336-8930
137 Market Street #10-02Singapore 048944Phone: 65-9457-0212