banking in the new normal -...
TRANSCRIPT

Banking in the new normalAustria & CEE non-performing assets overview 2013
www.pwc.at
Financial Services Publications
September 2014

Foreword
Dear reader,
the CEE non-performing assets market is steadily opening up, with strong and proven investor interest from both regional and large, international names.
While some of the well known global names are already engaged in various deals across the region, more have expressed their interest in the area and have engaged in bidding, with positive impact on the processes’ quality.
Encouraged by an increasing successful track record of NPL sales, banks in the region are rapidly gaining confidence, with several sizeable deals announced or in progress, both in secured and unsecured space.
Further, with increased capital optimization pressure expected from new regulations (e.g. CDR IV/ CRR, BRRD) and comprehen-sive assessment (including AQR and Stress Test), banks are more often deciding in favour of (quick) clean-ups of their non-core portfolios through market disposals.
Last but not least, there is a sensible regulatory and fiscal framework improvement in the region, with national regulators being supportive of non-core assets disposals coupled with favorable fiscal regimes.
I hope you will enjoy discovering the opportunities of the Austrian & CEE region through this already 3rd edition of our annual non-performing assets report and wish you a pleasant reading.
With best regards,Bernhard
Bernhard EngelPartner Leader FS DealsPwC Austria

3PwC Banking in the new normal
Highlights
Mid to long term, CEE is expected to continue its catching up race, with a GDP growth rate roughly double that of Western Europe’s. Nonetheless, structural imbalan-ces remain in some territories.
NPL volume continues its growth, with close to EUR 180b NPL ex-pected at year end 2014 for Austria & CEE region. NPL ratios remain stable at 7%for CEE and 3% for Austria. Romania, Kazakhstan, Hungary, Bul-
garia and Croatia make-up the regi-onal Top 5 by NPL ratio and volume growth at year-end 2013. Conversely, provisions coverage varies widely, with CEE regional average at 67%.
Lending growth remains a key NPL driver, while regionally in CEE there are positives signs indicating a yoy loans to customers growth (+10%) twice the size of the NPL volume.
45% of the loan books belon-ging to Austria’s largest 6 CEE banking groups are amassed in this region.
NPL ratio reached 12% for the 6 banks group – well above CEE’s 7% average, while NPL Coverage median stood at 59%.
Deleveraging to continue, with NPL disposals expected to accelerate in Romania, Bulgaria, Croatia and Slovenia.

4PwC Banking in the new normal
Macro economic snapshot
CEE optimismWith modest growth expected for Austria and the wider Euro area, CEE is seen to continue its ecomonic catching up race, with a growth rate roughly double that of W. Europe’s.
Conversely, with a public debt ratio to GDP ca. half of Eurozone’s, CEE is set to benefit from a higher flexibility in its growth model.
Unemployment rate is expected to drop, prompted by the Eurozone’s, to which is closely related as the area’s “production yard“.
GDP Growth (%, ’12-’19F)
Unemployment (%, ’12-’19F)
Government Debt / GDP (%, ’12-’19F)
-1,0%
-0,5%
0,0%
0,5%
1,0%
1,5%
2,0%
2,5%
3,0%
3,5%
4,0%
'12 '13 '14F '15F '16F '17F '18F '19F
CEE
EURO
AT
2%
4%
6%
8%
10%
12%
14%
'12 '13 '14F '15F '16F '17F '18F '19F
CEE
EURO
AT
30%
40%
50%
60%
70%
80%
90%
100%
'12 '13 '14F '15F '16F '17F '18F '19F
CEE
EURO
AT
Source: IMF, PwC Analysis.
• Positive mid to long term expectations• Structural imbalances remain in some of CEE’s territories
5PwC Banking in the new normal
-5%
15%
35%
55%
75%
95%
HU SI PL SK CZ LT LV UA KZ RU RS HR RO TR BG Euro AT CEE
Gov't. Debt / GDP GDP Growth Unemployment
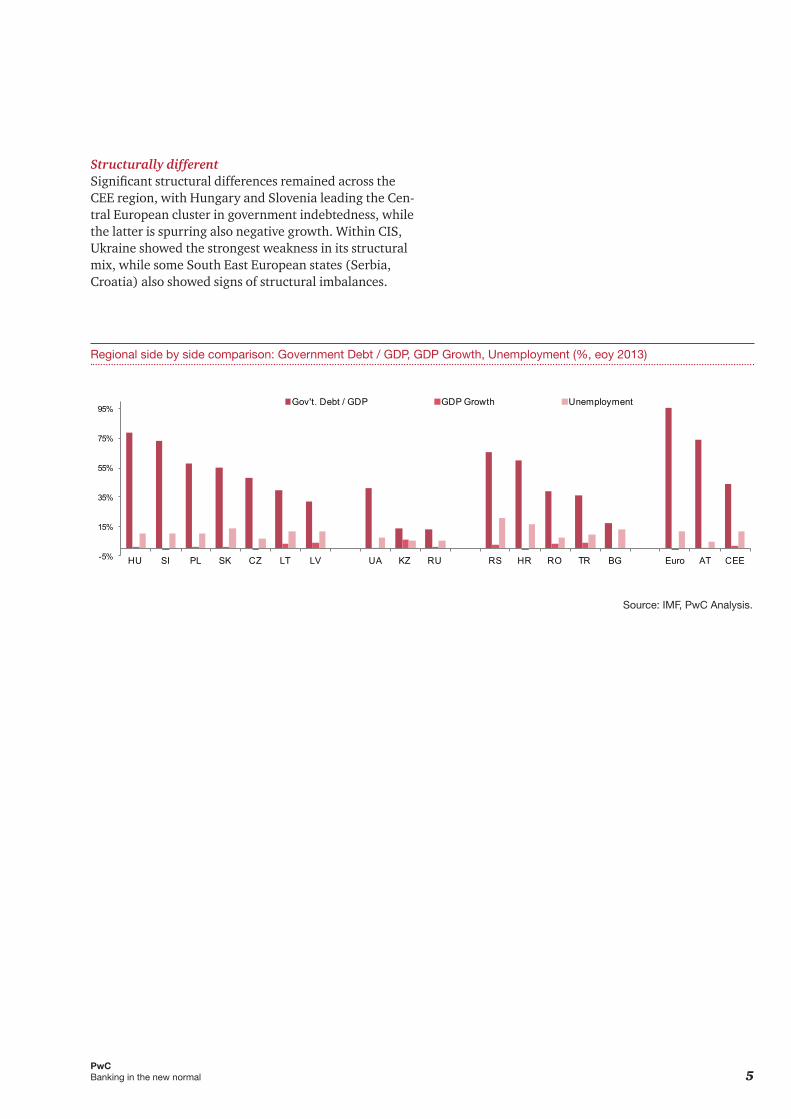
Structurally differentSignificant structural differences remained across the CEE region, with Hungary and Slovenia leading the Cen-tral European cluster in government indebtedness, while the latter is spurring also negative growth. Within CIS, Ukraine showed the strongest weakness in its structural mix, while some South East European states (Serbia, Croatia) also showed signs of structural imbalances.
Regional side by side comparison: Government Debt / GDP, GDP Growth, Unemployment (%, eoy 2013)
Source: IMF, PwC Analysis.

6PwC Banking in the new normal
23%19%
17% 17% 15% 15% 13% 13% 12% 12% 11%7% 7% 6% 5% 5% 5% 4% 3% 3%
RO KZ HU BG HR BiH SI UA MD LT FYRM LV CEE RU PL CZ SK BY AT TR
+50
+1 0 +2 -2 -4 -3 -3 +1-2 0 0 0 0 0 -1 0 0
∆yoypp
Source: IMF, PwC Analysis.
+2
Market overview at year end 2013
NPL volume poised for further growthNPL volumes has continued its ascent across the CEE, with aprox. EUR 157b NPL for year end 2013 (+5% yoy), while registering a slight decrease in Austria (down to EUR19.9b).
For both Austria and CEE, the NPL volume is ex-pected to reach EUR 180b at year end 2014.Russia, Ukraine and Poland continued to sum-up more than half of CEE’s NPL volume.
Nevertheless, Russia lost 6pp regional share (down to 36%), on a background of increased shares of Romania, Hungary and Croatia.
* Serbia not included due to lack of data;
** less than 1% regional share; Source: IMF, PwC Analysis.
Source: IMF, PwC Analysis.
• Austria‘s and CEE NPL volume reach EUR 180b at eoy 2014• Regional distribution changed due to volume advances in Romania,
Hungary and Croatia
Territory 2012 2013 2014FShare in CEE
eoy 2013Austria 20,5 19,9 19,7 -CEE* 150 157 160 100%Russia 52,3 58,1 56,2 36,2%Ukraine 16,5 14,2 15,4 9,9%Poland 12,5 13,1 14,4 9,3%Romania 8,5 10,6 12,9 8,3%Kazakhstan 9,7 10,6 10,5 6,8%Turkey 10,2 11,7 10,1 6,5%Hungary 8,9 8,8 9,6 6,2%Croatia 5,3 5,9 6,6 4,3%Czech Rep. 5,9 5,9 5,8 3,7%Slovenia 6,5 4,9 5,0 3,5%Bulgaria 4,8 4,9 5,0 3,1%Slovakia 2,0 2,1 2,1 1,3%Belarus 0,9 1,0 1,6 1,0%Other** 5,8 5,2 4,6 3%
NPL ratio rather stableRomania registered the highest yearly NPL ratio jump with ca. 5pp to almost 23%, while Kazakhstan, Hungary and Bulgaria enjoyed fair-ly stable ratios but still increasing volumes.
With a 15% NPL ratio and almost EUR 6b volume for end of2013, Croatia made a strong entrance in the regional growth Top 5. Signs of changing winds come from Slovenia, which saw a decrease both in NPL volume and ratio.
Alas, the CEE regional NPL ratio stood at 7% (a modest -0,3% yoy), while Austria’s same ratio hovered at close to 3%, virtually unchanged year on year.
NPL Ratio (%, pp ∆yoy, 2013)
∆yoypp
NPL Volume (BEUR)

7PwC Banking in the new normal
Markets overview at year end 2013
New lending as key driver of NPL dynamicsSubdued lending growth remains the main driver be-hind NPL ratio dynamics, as countries showing highest NPL ratio growth (e.g. Romania, Bosnia, Croatia) show an NPL volume growth yoy 2013 backed by an almost null improvement in Loans to Customers (LtC) for the
same period. Notwithstanding, region wide there are positive signs, with CEE’s LtC growth (+10%) almost double that of its NPL volume.
Provisions paint a different pictureWith over 90% NPL coverage ratio1 and ca. 7x more capital than remaining uncovered NPL, Romania is set to benefit from a swift clean-up of its NPL stock.
Similarly positive position enjoy countries such as Bulgaria or Kazakhstan. Conversely, countries such as Hungary or Croatia are lagging behind the regional average of 67% coverage.
Yearly growth NPL Volume vs. Loans to Customers (%, 2012/13)
NPL Coverage ratio vs Net NPL to Regulatory Capital (%, eoy 2013)
Source for all above graphics: IMF, PwC Analysis.
25%19%
15% 15% 12% 11% 10% 9%5% 5% 3% 3%
0% -1% -1% -3%
-14% -15%-21% -24%
-42%
0%
6%
22%
6%0%
12%
36%
8% 10%5% 5%
1% 2%
22%
-8% -5%
10%6%
-4%
-14%
3%
RO BiH TR FYRM HR RU BY KZ CEE PL SK BG CZ MD HU AT UA LT LV SI EE
NPL VolumeLoans to Customers
91%
80% 78% 75%71% 67% 67% 67% 66% 66% 62% 62% 58% 55% 52% 51%
46%39% 35%
29% 28%
16%12%
7% 3%10%
18%13% 13%
34% 36%
22%29%
52%
18%
39%
21%
45%
14%
61%
9%
52%
RO FYRM AT TR RU LV CEE PL KZ BG MD UA SI SK HU CZ HR BY BiH EE LT
NPL Coverage Ratio
Net NPL / Regulatory Capital
• Growth of lending remains the key driver behind NPL ratio change• Provisions coverage varies widely, with the CEE regional
NPL coverage ratio at ca. 67%
1 Includes prudential filter as per Romania’s national bank regulation - see Glossary for details
1

8PwC Banking in the new normal
Markets overview at year end 2013
Deleveraging to continueSpurring a combination of high NPL ratio on a back-ground of sizeable provisioning an relatively large volu-me, a number of countries are poised for deleveraging in the period to come.
Backed by a friendly regulatory environment, supportive of NPL resolution, we expect market disposals, usually in the form of portfolio sales, to continue and accelerate in countries such as Romania, Bulgaria, Slovenia and Croatia.
Source: IMF, PwC Analysis.
NPL Ratio, Coverage and Volume (%, BEUR, eoy 2013)
AT
BiHBY
CZ
EE
FYRM
HR
HU
KZ
LT
LV
MD
PL
RO
RU
SISK
TR
UA
20%
30%
40%
50%
60%
70%
80%
90%
100%
0 0,05 0,1 0,15 0,2 0,25CEE
CEE
NPL Ratio
NPL Coverage Bubble Size - Volume
BG
• High NPL ratio combined with sizeable provisions coverage and sufficient volumes to provide the right combination for a quick deleveraging
• NPL disposals expected to continue and accelerate in Romania, Bulgaria, Croatia and Slovenia

9PwC Banking in the new normal
Close to EUR 400b of loans held by Austria’s 6 largest banks with CEE presence (CEE-6)• UniCredit Bank Austria (BA) continues to lead the
CEE-6 group with ca. EUR 136b loans to customers on its books, closely followed by Erste Group (EG) and Raiffeisen Bank International (RBI); Hypo Alpe Adria (HAA), Sberbank Europe (SBEU) and Österreichische Volksbanken (VBAG) come further down the list
• In terms of CEE concentration, the highest volume is held by BA, with almost EUR 70b loans amassed in the region, while proportionally, RBI takes the lead with 54% of its loan book stemming from the CEE
More than EUR 44b NPL volume, with an weighted average ratio of ca. 12%• EG and BA hold together more than half of CEE-6 NPL
volume• HAA leads substantially in terms on NPL ratio, with
33% group-wide• All 6 Austrian bank groups track above CEE’s average
NPL ratio (7%), with an weighted average NPL ratio for CEE-6 of 12%
Top 6 Austrian banking franchises in CEE at year end 2013
Total Group vs. CEE Customers Loans (BEUR, eoy 2013)
NPL Volume & Ratio (BEUR, %, eoy 2013)
136 128
81
19 8 7
69
45 44
6 - -
51%
36%
54%
33%
BA EG RBI HAA SBEU VBAG
Group
CEE
CEE %
12,311,4
9,3 8,8
1,2 1,2
10% 8%
33%
11%
17%15%
EG BA HAA RBI VBAG SBEU
NPL Volume
NPL Ratio
• 45% of Austria’s largest CEE present banking groups loans are amassed in this region
• NPL ratio reached 12% for the 6 banks group – above CEE’s 7% average, while NPL Coverage median stood at 59%
1 Refers to SEE Group2 No data available3 Refers to impaired loans volume & ratio4 Refers to loans to customers and credit institutions
3 4
1 2 2
Source: Annual Reports 2013, PwC Analysis.

10PwC Banking in the new normal
NPL coverage ratios reveal differences• With 86%, HAA leads the CEE-6 group also in terms of
provisioning for its NLP stock• RBI and EG are in line with CEE regional average
(67%) while BA, VBAG and SBEU sit at the other end of the spectrum, with the latter’s coverage ratio rea-ching 40%
• Median ratio for the CEE-6 stands at 59%
Source: Annual Reports 2013, PwC Analysis.
3 Refers to impaired loans volume & ratio4 Refers to loans to customers and credit institutions
Coverage Ratio vs. Net NPL / Own Funds (%, eoy 2013)
86%
64% 63%55%
49%40%
47%
25% 28% 32% 29%
66%
HAA RBI EG BA VBAG SBEU
Coverage RatioNet NPL / Own funds
3 4

11PwC Banking in the new normal
• Opposite to BA, EG’s loan book decreased with 3% by eoy 2013, while its NPL volume increased slightly with 2%, prompting an NPL ratio increase of close to 1pp.
• Positively, the coverage ratio increased with 1pp, reaching 63%, which is 4pp above its peer group median.
Erste Group
Bank Austria
• A growing loan book backed by a substantial decrease in NPL volu-me, improved BA’s NPL ratio with 1.2pp, down to 8% at eoy 2013.
• Conversely, the coverage ratio increased with 7pp, reaching 55% for the same period, still below its peer group median of 59%.
∆ LTC '13 ∆ NPL Vol. '13 ∆ NPL % '13 ∆ CR '13
+3% -11% -1.2pp +7pp
∆ LTC '13 ∆ NPL Vol. '13 ∆ NPL % '13 ∆ CR 13
+3% +2% +0.8pp +1pp
Top 6 Austrian banking franchises in CEEat year end 2013
• Decreasing loan books yoy combined with higher NPL volumes prompt increases in NPL ratios
• Coverage ratio change varies across the CEE-6, on a background of generalized restructuring measures
• RBI registered a slight decrease of its loan book, marked by a 7% increase in its NPL volume and 1pp hike in NPL ratio.
• RBI‘s NPL coverage ratio decreased with almost 4pp, standing at 63%, above its peer group median.
∆ LTC '13 ∆ NPL Vol. '13 ∆ NPL % '13 ∆ CR '13
-2% +7% +0.9pp -3.9pp
Raiffeisen Bank International
Source: Annual Reports 2013, PwC Analysis.

12PwC Banking in the new normal
Hypo-Alpe-Adria Group
• In spite of a substantial decrease in its loan book (-21% by eoy 2013), HAA NPL volume decreased only with 3%, pegged by an increase in NPL ratio of 6pp, mostly as a result of the sale of HBA and overall asset reduction.
• Coverage ratio further grew during 2013, reaching 86% at year’s end, well above regional average and peers’ median.
• According to the Bank, the struc-ture of the future Asset Resolution Wind Down unit is clarified, as “previous years restructuring (…) provide sound basis for swift imple-mentation of government plans”.
• In line with its re-focusing stra-tegy, VBAG loan book reduced significantly during 2013 to reach ca. EUR 7b at year’s end, down 30 from the previous period.
• In spite of the NPL volume’s size-able drop of almost 30%, the NPL ratio jumped ca. 7pp, paralleled by an increase in the coverage ratio of only 1pp.
• Loan growth of 15% yoy substan-tially above NPL volume growth, leading to a reduction of the NPL ratio by ca. 1pp.
• NPL coverage ratio decreased 2.5pp, due to “improved restructu-ring and collection activities”.
∆ LTC '13 ∆ NPL Vol. '13 ∆ NPL % '13 ∆ CR '13
-21% -3% +6pp +7pp
∆ LTC '13 ∆ NPL Vol. '13 ∆ NPL % '13 ∆ CR '13
-30% -29% +6.6pp +1pp
∆ LTC '13 ∆ NPL Vol. '13 ∆ NPL % '13 ∆ CR '13
+15% -9% -0.8pp -2.5pp
Österreichische Volksbanken-AG
Sberbank Europe
Source: Annual Reports 2013, PwC Analysis.

13PwC Banking in the new normal
Our specialists are fully conversant with the Austrian & CEE non-core & non-performing markets
Deep technical know-how, regional under-standing coupled with strong transactional experience enable us to accompany our clients, advising and providing them with active support across the full value chain of non-performing / non-core assets value extraction.
Comprehensive impact analysis of various NPL management solutions on financial, accounting, legal, regulatory and tax levels
Defining non-performing asset portfolios work-out and capital optimization strate-gies
Channels for restructuring, run-off or dis-posal of non-performing / non-core assets such as SPVs, external / internal bad-banks NPL platforms
Investor sounding, accounting, financial, tax, legal and regulatory structuring, valu-ation, negotiation and closing support
Options analysis
Work-out optimization
Dedicated structures
Transactions advice
1.
2.
3.
4.
Your Contacts in PwC Austria
Jens RönnbergPartner Leader Financial [email protected]+43 676 833 771 103
Bernhard EngelPartnerLeader Financial Services – Deals [email protected]+43 676 833 771 160

14PwC Banking in the new normal
AnnexDefinition, glossary, disclaimer
Term DefinitionNPL according to IMF’s interpre-tation
Loan where payments of interest and/or principal are past due by 90 days or more, or interest payments of 90 days or more have been capitalized, refinanced, or delayed by agreement, or payments are less than 90 days overdue, but there are other good reasons – such as a debtor filing for bankruptcy – to doubt that payments will be made in full.
After a loan is classified as non-performing, it (and/or any replacement loans(s)) should remain classified as such until written off or payments of interest and/or principal are received on this or subsequent loans that replace the original.
Banks might have different approaches on how to measure NPL. The-refore the comparability of the provided NPL figures might be slightly reduced.
NPL according to Erste Group One or more of the default criteria under Basel II are met: full repay-ment unlikely, interest or principal payments on a material exposure more than 90 days past due, restructuring resulting in a loss to the lender, realisation of a loan loss, or initiation of bankruptcy procee-dings.
NPL according to Bank Austria Formally impaired loans, being exposure to insolvent borrowers, even if the insolvency has not been recognised in a court of law, or borro-wers in a similar situation.
NPL according to RBI Event where a specific debtor is unlikely to pay its credit obligations to the bank in full, or the debtor is overdue more than 90 days on any material credit obligation.
NPL according to HAA Loans assigned to risk category 5 based on the reason for default, namely borrowers are past due by more than 90 days.
NPL according to VBAG Loans past due by more than 90 days or debtor is classified as unlike-ly to pay its credit obligations
NPL ratio Non-performing loans divided to total gross loans
Prudential filter in Romania For financial stability analysis purposes, starting with 2012, the central bank of Romania uses the coverage ratio of non-performing loans with IFRS provisions and prudential filters for NPLs in order to assessprovisioning adequacy. Including prudential filters in the calculation of the indicator, along with the IFRS provisions registered in the balan-ce sheet, is justified by the fact that the prudential filter represents an amount deducted from own funds with a view to increasing their capacity of absorbing credit risk losses. The central bank decided to further use in 2013 the prudential filters introduced in 2012 along with the implementation of IFRS and to gradually phase them out during 2014-2018.
RWA Risk Weighted Assets: Assets or off-balance sheet exposures of a bank, weighted according to their underlying risk.
TGL Total Gross Loans: Sum of loans to all non-bank customers

15PwC Banking in the new normal
Abbrev. DescriptionAT Austria
BA Bosnia and Herzegovina
BAG Bank Austria Group
BG Bulgaria
bn Billion
BY Belarus
CAGR Compound annual growth rate
CE Central Europe: CZ, HU, LV, LT, PL, SI, SK
CEE Central and Eastern Europe
CR Coverage Ratio
CIS Commonwealth of Independent States: KZ, RU, UA
CZ Czech Republic
EE Estonia
EG Erste Group
EUR Euro
eoy End of Year
F Forecast
FYRM Former Yugoslav Republic of Mazedonia
GDP Gross Domestic Product
HAA Hypo-Alpe-Adria Group
HBA Hypo Alpe-Adria-Bank AG
HR Croatia
HU Hungary
IMF International Monetary Found
KZ Kazakhstan
Abbrev. DescriptionLTC Loan to Costumer
LV Latvia
LT Lithuania
m Million
MD Moldova
NPL Non-performing loan
PL Poland
PLN Polish Zloty
pp Percentage points
Q Quarter
qoq quarter-on-quarter
RBI Raiffeisen Bank International
RO Romania
RON Romanian New Leu
RS Serbia
RU Russia
RWA Risk-weighted assets
SEE South Eastern Europe: BG, HR, RO, RS, TR
SI Slovenia
SK Slovakia
TCR Total Capital Ratio
TGL Total gross loans
tn Trillion
TR Turkey
UA Ukraine
VBAG Österreichische Volksbanken-AG
yoy year-on-year

PwC refers to the PwC network and/or one or more of its member firms, each of which is a separate legal entity. Please see www.pwc.com/structure for further details.
Copyright and Publisher: PwC Österreich GmbH Wirtschaftsprüfungsgesellschaft, Erdbergstraße 200, 1030 Wien
Editor-in-chief: Bernhard Engel
Editor: Bogdan Popa
Analysis and support: Jozefina Mickova, Ana Baias, Tomasz Zaluska, Dimitri Kudrnofski, Moritz Natmessnig
The above information is intended to provide general guidance only. It should not be used as a substitute for professional advice or as the basis for decisions or actions without prior consultation with your advisors. While every care has been taken in the preparation of the publication, no liability is accepted for any statement, option, error or omission.