bank of the philippine islands€¦ · bank of the philippine islands financial statements ......
TRANSCRIPT

Bank of thePhilippine IslandsFinancial StatementsAs at December 31, 2016 and 2015 and for each of the three
years in the period ended December 31, 2016


(2)
Details of income attributable to insurance operations before income tax and minority interest for the years endedDecember 31 are as follows:
2016 2015 2014
(In Millions of Pesos)Premiums earned and related income 3,356 3,071 2,868Investment and other income 959 801 423
4,315 3,872 3,291
Benefits, claims and maturities 2,025 1,655 1,363Decrease in actuarial reserve liabilities (462) (159) (162)Management and general expenses 656 575 515Commissions 726 681 554Other expenses 10 11 14
2,955 2,763 2,284
Income before income tax and minority interest 1,360 1,109 1,007
Note 3 - Business Segments
Operating segments are reported in accordance with the internal reporting provided to the chief executive officer, whois responsible for allocating resources to the reportable segments and assessing their performance. All operatingsegments used by the BPI Group meet the definition of a reportable segment under PFRS 8, Operating Segments.
The BPI Group has determined the operating segments based on the nature of the services provided and the differentmarkets served representing a strategic business unit.
The BPI Group’s main operating business segments follow:
Consumer banking - this segment addresses the individual and retail markets. It covers deposit taking andservicing, consumer lending such as home mortgages, auto loans and credit card finance as well as the remittancebusiness. It includes the entire transaction processing and service delivery infrastructure consisting of the BPIand BPI Family Bank network of branches and ATMs as well as phone and internet-based banking platforms.
Corporate banking - this segment consists of the entire lending, leasing, trade and cash management servicesprovided by the BPI Group to corporate and institutional customers. These customers include both high-endcorporations as well as various middle market clients.
Investment banking - this segment includes the various business groups operating in the investment markets anddealing in activities other than lending and deposit taking. These services cover corporate finance, securitiesdistribution, asset management, trust and fiduciary services as well as proprietary trading and investmentactivities.
The performance of the Parent Bank is assessed as a single unit using financial information presented in the separateor Parent only financial statements. Likewise, the chief executive officer assesses the performance of its insurancebusiness as a separate segment from its banking and allied financial undertakings. Information on the assets,liabilities and results of operations of the insurance business is fully disclosed in Note 2.
The BPI Group and the Parent Bank mainly derive revenue (more than 90%) within the Philippines, accordingly,no geographical segment is presented.
Revenues of the BPI Group’s segment operations are derived from interest (net interest income). The segment reportforms part of management’s assessment of the performance of the segment, among other performance indicators.

(3)
There were no changes in the reportable segments during the year. Transactions between the business segments arecarried out at arm’s length. Funds are ordinarily allocated between segments, resulting in funding cost transfersdisclosed in inter-segment net interest income. Interest charged for these funds is based on the BPI Group’s cost ofcapital. The funds transfer pricing (FTP) prior to 2014 was computed on a gross basis. In 2014, the manner ofreporting has changed, in which interest income and interest expense are no longer presented separately, consideringthat the calculation of FTP shifted from gross to net. In addition, majority of the segment’s revenues are from interestand the chief executive officer relies primarily on net interest income to assess the performance of the segments andto make decisions concerning the segments.
Internal charges and transfer pricing adjustments have been reflected in the performance of each business. Revenue-sharing agreements are used to allocate external customer revenues to a business segment on a reasonable basis.Inter-segment revenues however, are deemed insignificant for financial reporting purposes, thus, not reported insegment analysis below.
The BPI Group’s management reporting is based on a measure of operating profit comprising net interest income,impairment charge, fees and commission income, other income and operating expenses.
Segment assets and liabilities comprise majority of operating assets and liabilities, measured in a manner consistentwith that shown in the statement of condition, but exclude items such as taxation.
The segment assets, liabilities and results of operations of the reportable segments of the BPI Group as at and for theyears ended December 31 are as follows:
2016
Consumerbanking
Corporatebanking
Investmentbanking
Total permanagement
reporting
(In Millions of Pesos)
Net interest income 29,225 9,724 6,374 45,323
Impairment charge 3,072 1,692 7 4,771
Net interest income after impairment charge 26,153 8,032 6,367 40,552
Fees and commission income 5,986 851 1,326 8,163
Other income 5,072 1,667 9,423 16,162
Gross receipts tax (724) (72) (630) (1,426)
Other income, net 10,334 2,446 10,119 22,899
Compensation and fringe benefits 9,133 1,279 1,035 11,447
Occupancy and equipment - related expenses 4,146 1,135 55 5,336
Other operating expenses 12,056 1,535 1,477 15,068
Total operating expenses 25,335 3,949 2,567 31,851
Operating profit 11,152 6,529 13,919 31,600
Share in net income of associates 814
Provision for income tax 4,535
Total assets 536,231 770,413 386,550 1,693,194
Total liabilities 1,459,741 14,587 61,326 1,535,654

(4)
2015
Consumerbanking
Corporatebanking
Investmentbanking
Total permanagement
reporting
(In Millions of Pesos)
Net interest income 22,487 5,982 12,091 40,560
Impairment charge 2,552 1,195 72 3,819
Net interest income after impairment charge 19,935 4,787 12,019 36,741
Fees and commission income 6,026 582 1,135 7,743
Other income 6,657 1,616 5,330 13,603
Gross receipts tax (834) (58) (488) (1,380)
Other income, net 11,849 2,140 5,977 19,966
Compensation and fringe benefits 8,733 1,116 905 10,754
Occupancy and equipment - related expenses 4,435 1,170 80 5,685
Other operating expenses 9,826 2,239 1,312 13,377
Total operating expenses 22,994 4,525 2,297 29,816
Operating profit 8,790 2,402 15,699 26,891
Share in net income of associates 627
Provision for income tax 5,138
Total assets 506,593 634,840 348,058 1,489,491
Total liabilities 1,304,298 14,163 23,578 1,342,039
2014
Consumerbanking
Corporatebanking
Investmentbanking
Total permanagement
reporting
(In Millions of Pesos)
Net interest income 21,984 7,242 5,956 35,182
Impairment charge 2,047 755 - 2,802
Net interest income after impairment charge 19,937 6,487 5,956 32,380
Fees and commission income 5,294 649 1,677 7,620
Other income 6,632 1,958 4,673 13,263
Gross receipts tax (775) (44) (502) (1,321)
Other income, net 11,151 2,563 5,848 19,562
Compensation and fringe benefits 8,122 1,041 904 10,067
Occupancy and equipment - related expenses 4,392 1,174 132 5,698
Other operating expenses 7,031 4,147 1,402 12,580
Total operating expenses 19,545 6,362 2,438 28,345
Operating profit 11,543 2,688 9,366 23,597
Share in net income of associates 257
Provision for income tax 4,958
Total assets 463,989 598,184 361,061 1,423,234
Total liabilities 1,205,684 10,168 70,255 1,286,107

(5)
Reconciliation of segment results to consolidated results of operations:
2016
Total permanagement
reporting
Consolidationadjustments/
Others
Total perconsolidated
financialstatements
(In Millions of Pesos)
Net interest income 45,323 (2,946) 42,377
Impairment charge 4,771 29 4,800
Net interest income after impairment charge 40,552 (2,975) 37,577
Fees and commission income 8,163 (165) 7,998
Other income 16,162 1,504 17,666
Gross receipts tax (1,426) (64) (1,490)
Other income, net 22,899 1,275 24,174
Compensation and fringe benefits 11,447 2,016 13,463
Occupancy and equipment - related expenses 5,336 4,820 10,156
Other operating expenses 15,068 (3,746) 11,322
Total operating expenses 31,851 3,090 34,941
Operating profit 31,600 (4,790) 26,810
Share in net income of associates (included in Other income) 814 - 814
Provision for income tax 4,535 - 4,535
Total assets 1,693,194 32,502 1,725,696
Total liabilities 1,535,654 22,358 1,558,012
2015
Total permanagement
reporting
Consolidationadjustments/
Others
Total perconsolidated
financialstatements
(In Millions of Pesos)
Net interest income 40,560 (1,919) 38,641
Impairment charge 3,819 157 3,976
Net interest income after impairment charge 36,741 (2,076) 34,665
Fees and commission income 7,743 (213) 7,530
Other income 13,603 1,012 14,615Gross receipts tax (1,380) (47) (1,427)
Other income, net 19,966 752 20,718
Compensation and fringe benefits 10,754 1,709 12,463Occupancy and equipment - related expenses 5,685 3,509 9,194
Other operating expenses 13,377 (3,164) 10,213
Total operating expenses 29,816 2,054 31,870
Operating profit 26,891 (3,378) 23,513
Share in net income of associates (included in Other income) 627 - 627
Provision for income tax 5,138 - 5,138
Total assets 1,489,491 26,865 1,516,356
Total liabilities 1,342,039 21,587 1,363,626

(6)
2014
Total permanagement
reporting
Consolidationadjustments/
Others
Total perconsolidated
financialstatements
(In Millions of Pesos)
Net interest income 35,182 (374) 34,808
Impairment charge 2,802 5 2,807
Net interest income after impairment charge 32,380 (379) 32,001
Fees and commission income 7,620 (250) 7,370
Other income 13,263 1,781 15,044Gross receipts tax (1,321) (114) (1,435)
Other income, net 19,562 1,417 20,979
Compensation and fringe benefits 10,067 1,783 11,850Occupancy and equipment - related expenses 5,698 3,319 9,017
Other operating expenses 12,580 (3,487) 9,093
Total operating expenses 28,345 1,615 29,960
Operating profit 23,597 (577) 23,020
Share in net income of associates (included in Other income) 257 - 257
Provision for income tax 4,958 - 4,958
Total assets 1,423,234 26,963 1,450,197
Total liabilities 1,286,107 17,411 1,303,518
“Consolidation adjustments/Others” pertain to balances of insurance operations, support units and inter-segmentelimination in accordance with the BPI Group’s internal reporting.
Note 4 - Cash and Cash Equivalents
The account at December 31 consists of:
Consolidated Parent
2016 2015 2016 2015
(In Millions of Pesos)Cash and other cash items 35,692 35,681 34,855 34,797Due from Bangko Sentral ng Pilipinas (BSP) 239,514 214,960 203,743 174,370Due from other banks 23,037 22,238 20,558 17,181Interbank loans receivable and securities
purchased under agreementsto resell (Note 5) 12,381 8,566 7,300 2,033
Cash and cash equivalents attributable toinsurance operations (Note 2) 122 306 - -
310,746 281,751 266,456 228,381
Cash and cash equivalents are classified as current.

(7)
Note 5 - Interbank Loans Receivable and Securities Purchased under Agreements to Resell (SPAR)
The account at December 31 consists of transactions with:
Consolidated Parent
2016 2015 2016 2015
(In Millions of Pesos)BSP 4,576 6,513 - -Other banks 10,651 6,365 9,042 6,141
15,227 12,878 9,042 6,141Accrued interest receivable 9 24 7 22
15,236 12,902 9,049 6,163
As at December 31, 2016, Interbank loans receivable and SPAR maturing within 90 days from the date ofacquisition amounting to P12,381 million (2015 - P8,566 million) for BPI Group and P7,300 million(2015 - P2,033) for the Parent Bank are classified as cash equivalents in the statement of cash flows (Note 4).
Consolidated Parent
2016 2015 2016 2015
(In Millions of Pesos)Current 14,721 12,332 8,688 5,767Non-current 515 570 361 396
15,236 12,902 9,049 6,163
Government bonds are pledged by the BSP as collateral under reverse repurchase agreements. The face value ofsecurities pledged is equivalent to the total balance of outstanding placements as at reporting date. All collateralagreements mature within 12 months.
The range of average interest rates (%) of interbank loans receivable for the years ended December 31 follows:
Consolidated Parent
2016 2015 2016 2015
Peso-denominated 3.32 - 4.14 3.93 - 4.23 3.29 - 4.41 3.91 - 4.22US dollar-denominated 0.13 - 1.76 1.21 - 2.83 0.13 - 1.76 1.21 - 2.83
Note 6 - Derivative Financial Instruments
Derivatives held by the BPI Group for non-hedging purposes mainly consist of the following:
Foreign exchange forwards represent commitments to purchase or sell one currency against another at anagreed forward rate on a specified date in the future. Settlement can be made via full delivery of forwardproceeds or via payment of the difference (non-deliverable forward) between the contracted forward rate andthe prevailing market rate on maturity.
Foreign exchange swaps refer to spot purchase or sale of one currency against another with an agreement tosell or purchase the same currency at an agreed forward rate in the future.
Interest rate swaps refer to agreement to exchange fixed rate versus floating interest payments (or vice versa)on a reference notional amount over an agreed period of time.
Cross currency swaps refer to spot exchange of notional amounts on two currencies at a given exchange rateand with an agreement to re-exchange the same notional amounts at a specified maturity date based on theoriginal exchange rate. Parties on the transaction agree to pay a stated interest rate on the borrowed notionalamount and receive a stated interest rate on the lent notional amount, payable or receivable periodically overthe term of the transaction.

(8)
Credit-Linked Notes (CLNs) are structured notes whose value is derived from the creditworthiness of anunderlying reference entity. A CLN may be viewed as a bundled note that consists of a bond and a credit defaultswap, allowing the issuer to transfer the credit risk of a reference entity to the investor during the referenceperiod.
The BPI Group’s credit risk represents the potential cost to replace the swap contracts if counterparties fail to fulfilltheir obligation. This risk is monitored on an ongoing basis with reference to the current fair value, a proportion ofthe notional amount of the contracts and the liquidity of the market. To control the level of credit risk taken, theBPI Group assesses counterparties using the same techniques as for its lending activities.
The notional amounts of certain types of financial instruments provide a basis for comparison with instrumentsrecognized on the statement of condition. They do not necessarily represent the amounts of future cash flowsinvolved or the current fair values of the instruments and therefore are not indicative of the BPI Group’s exposureto credit or price risks. The derivative instruments become favorable (assets) or unfavorable (liabilities) as a resultof fluctuations in market interest rates or foreign exchange rates relative to their terms. The aggregate contractualor notional amount of derivative financial instruments on hand and the extent at which the instruments canbecome favorable or unfavorable in fair values can fluctuate significantly from time to time.
The contract/notional amount and fair values of derivative instruments held for trading as at December 31 are setout below:
Consolidated and Parent
Contract/ Fair Values
Notional Amount Assets Liabilities
2016 2015 2016 2015 2016 2015
(In Millions of Pesos)Free-standing derivatives
Foreign exchange derivativesCurrency swaps 101,378 120,182 926 1,377 826 513Currency forwards 103,040 266,663 963 2,519 1,037 1,480
Interest rate swaps 148,432 111,796 1,032 564 1,243 1,211Credit default swaps 994 1,411 - - 6 12
Embedded credit derivatives - - 72 69 - -
Total 353,844 500,052 2,993 4,529 3,112 3,216
Note 7 - Trading Securities
The account at December 31 consists of:
Consolidated Parent
2016 2015 2016 2015
(In Millions of Pesos)Debt securities
Government securities 9,162 7,672 5,372 5,425Commercial papers of private companies 5,286 71 4,914 -
14,448 7,743 10,286 5,425Accrued interest receivable 31 19 28 17
14,479 7,762 10,314 5,442Equity securities - listed 124 322 - -
14,603 8,084 10,314 5,442
All trading securities are classified as current.

(9)
Note 8 - Available-for-Sale Securities
The account at December 31 consists of:
Consolidated Parent
2016 2015 2016 2015
Debt securities (In Millions of Pesos)Government securities 2,205 26,254 1,965 25,072Commercial papers of private companies 19,688 14,218 17,259 11,212
21,893 40,472 19,224 36,284Accrued interest receivable 69 162 63 126
21,962 40,634 19,287 36,410
Equity securitiesListed 2,144 1,490 399 367Unlisted 516 493 126 126
2,660 1,983 525 493
24,622 42,617 19,812 36,903Allowance for impairment (321) (330) (209) (218)
24,301 42,287 19,603 36,685
Consolidated Parent
2016 2015 2016 2015
(In Millions of Pesos)Current 13,507 24,039 12,836 23,253Non-current 11,115 18,578 6,976 13,650
24,622 42,617 19,812 36,903
The reconciliation of the allowance for impairment at December 31 is summarized as follows:
Consolidated Parent
2016 2015 2016 2015
(In Millions of Pesos)At January 1 330 324 218 218(Reversal of) provision for impairment losses (9) 6 (9) -
At December 31 321 330 209 218
The range of average interest rates (%) of available-for-sale debt securities for the years ended December 31follows:
Consolidated Parent
2016 2015 2016 2015
Peso-denominated 0.98 - 1.42 2.67 - 3.06 2.14 - 2.60 3.48 - 3.74Foreign currency-denominated 1.03 - 1.53 1.80 - 2.47 1.00 - 1.52 1.85 - 2.85

(10)
The movement in available-for-sale securities is summarized as follows:
Consolidated Parent
2016 2015 2016 2015
(In Millions of Pesos)At January 1 42,287 51,309 36,685 41,866Additions 51,831 68,847 50,237 58,274Disposals and maturities (70,231) (70,310) (67,401) (56,302)Reclassification to held-to-maturity securities - (6,928) - (6,928)Amortization of (premium) discount, net (154) 624 (81) 577Fair value adjustments 517 (910) 124 (526)Exchange differences 135 131 93 130Net change in allowance for impairment 9 (6) 9 -Net change in accrued interest receivable (93) (470) (63) (406)
At December 31 24,301 42,287 19,603 36,685
On November 11, 2015, the BPI Group reclassified certain available-for-sale securities aggregating P6.9 billion toheld-to-maturity category. The reclassification was triggered by management’s change in intention over thesecurities in the light of volatile market prices due to rising interest rate environment. Management believes thatdespite the market uncertainties, the BPI Group has the capability to hold those reclassified securities untilmaturity dates.
The aggregate fair value loss of those securities at reclassification date that was recognized in Accumulated othercomprehensive income (under Capital funds), and which will be amortized over the remaining lives of theinstruments using the effective interest rate method amounts to P505 million. Unamortized fair value loss as atDecember 31, 2016 amounts to P486 million (2015 - P502 million). The net change in fair value reserve that wouldhave been recognized in other comprehensive income if the available-for-sale securities had not been reclassifiedamounts to P421 million loss for the year ended December 31, 2016 (2015 - fair value loss of P224 million). Thereare no other gains or losses recognized in profit or loss apart from the amortization of fair value loss on securities.
On January 9, 2014, the BPI Group reclassified certain available-for-sale securities aggregating P63.5 billion toheld-to-maturity category. The reclassification was triggered by management’s change in intention over thesecurities in the light of volatile market prices due to rising interest rate environment. Management believes thatdespite the market uncertainties, the BPI Group has the capability to hold those reclassified securities untilmaturity dates.
The aggregate fair value loss of those securities at reclassification date that was recognized in Accumulated othercomprehensive income (under Capital funds), and which will be amortized over the remaining lives of theinstruments using the effective interest rate method amounts to P4,534 million. Unamortized fair value loss as atDecember 31, 2016 amounts to P3,471 million (2015 - P3,712 million). The net change in fair value reserve thatwould have been recognized in other comprehensive income if the available-for-sale securities had not beenreclassified amounts to P2,529 million loss for the year ended December 31, 2016 (2015 - fair value loss ofP1,264 million). There are no other gains or losses recognized in profit or loss apart from the amortization of fairvalue loss on securities.
On October 22, 2008, the BPI Group reclassified certain available-for-sale securities aggregating P19.1 billion toheld-to-maturity category. Likewise, on November 12, 2008, an additional portfolio of US dollar-denominatedavailable-for-sale securities totaling US$171.6 million (or peso equivalent of P9.2 billion) was further reclassifiedfrom available-for-sale to held-to-maturity. The reclassification was triggered by management’s change inintention over the securities in the light of volatile market prices due to global economic downturn. Managementbelieves that despite the market uncertainties, the BPI Group has the capability to hold those reclassified securitiesuntil maturity dates.

(11)
The aggregate fair value loss of those securities at reclassification dates that was recognized in Accumulated othercomprehensive income (under Capital funds), and which will be amortized over the remaining lives of theinstruments using the effective interest rate method amounts to P1,757 million. Unamortized fair value loss as atDecember 31, 2016 amounts to P28 million (2015 - P188 million). The net change in fair value reserve that wouldhave been recognized in other comprehensive income if the available-for-sale securities had not been reclassifiedamounts to P149 million gain for the year ended December 31, 2016 (2015 - P94 million loss). There are no othergains or losses recognized in profit or loss apart from the amortization of fair value loss on securities.
Note 9 - Held-to-Maturity Securities
The account at December 31 consists of:
Consolidated Parent
2016 2015 2016 2015
(In Millions of Pesos)Government securities 196,210 211,152 176,528 193,911Commercial papers of private companies 68,741 29,924 66,247 27,785
264,951 241,076 242,775 221,696Accrued interest receivable 3,532 3,733 3,146 3,381
268,483 244,809 245,921 225,077
Consolidated Parent
2016 2015 2016 2015
(In Millions of Pesos)Current 30,722 23,305 29,235 22,581Non-current 237,761 221,504 216,686 202,496
268,483 244,809 245,921 225,077
The range of average interest rates (%) of held-to-maturity securities for the years ended December 31 follows:
Consolidated Parent
2016 2015 2016 2015
Peso-denominated 3.68 - 3.88 3.89 - 4.19 3.65 - 3.85 3.86 - 4.16Foreign currency-denominated 3.10 - 3.61 3.75 - 4.16 3.15 - 3.73 3.86 - 4.26
The movement in held-to-maturity securities is summarized as follows:
Consolidated Parent
2016 2015 2016 2015
(In Millions of Pesos)At January 1 244,809 209,409 225,077 193,001Additions 116,942 53,347 113,151 46,968Maturities/disposals (90,396) (16,551) (89,564) (13,505)Amortization of premium, net (3,012) (1,971) (2,894) (1,893)Exchange differences 341 171 386 151Net change in accrued interest receivable (201) 404 (235) 355
At December 31 268,483 244,809 245,921 225,077

(12)
In June 2016, the BPI Group sold certain held-to-maturity securities aggregating P65.4 billion. The sale wastriggered by the need to strengthen the capital position of the BPI Group in view of more stringent capitalrequirements by the BSP.
Note 10 - Loans and Advances
Major classifications of this account at December 31 are as follows:
Consolidated Parent
2016 2015 2016 2015
Corporate entities (In Millions of Pesos)Large corporate customers 760,558 607,083 743,926 581,216Small and medium enterprise 83,516 94,659 44,672 54,148
Retail customersCredit cards 39,995 35,879 39,137 35,313Real estate mortgages 116,079 99,519 83 107Auto loans 53,485 45,911 - -Others 4,545 5,473 4,407 3,743
1,058,178 888,524 832,225 674,527Accrued interest receivable 4,475 3,278 3,321 2,312Unearned discount/income (3,257) (2,579) (2,273) (1,596)
1,059,396 889,223 833,273 675,243Allowance for impairment (18,676) (16,362) (11,728) (10,624)
1,040,720 872,861 821,545 664,619
The Parent balances above include amounts due from related parties (Note 27). The Consolidated balances abovealso include amounts due from related parties (Note 27) except for accounts considered as intercompany transactions.
Consolidated Parent
2016 2015 2016 2015
(In Millions of Pesos)Current 454,072 390,363 426,403 357,996Non-current 605,324 498,860 406,870 317,247
1,059,396 889,223 833,273 675,243
The current loan and advances balances are those which are expected to be realized within 12 months after reportingdate while the non-current balances pertain to those expected to be collected beyond 12 months after reporting date.
The amount of loans and advances above includes finance lease receivables as follows:
Consolidated
2016 2015
(In Millions of Pesos)Total future minimum lease collections 7,982 7,179Unearned finance income (910) (807)
Present value of future minimum lease collections 7,072 6,372Allowance for impairment (213) (182)
6,859 6,190

(13)
Details of future minimum lease collections follow:
Consolidated
2016 2015
(In Millions of Pesos)Not later than one year 2,944 1,441Later than one year but not later than five years 5,038 5,738
7,982 7,179Unearned finance income (910) (807)
7,072 6,372
The BPI Group, through BPI Century Tokyo Lease and Finance Corporation, mainly leases out vehicle andequipment under various finance lease agreements which typically run for a non-cancellable period of two to fiveyears. The contracts generally include an option to purchase the leased asset after the lease period at a price thatgenerally lies between 5% to 20% of the fair value of the asset at the inception of the lease. In the event that theresidual value of the leased asset exceeds the guaranteed deposit liability at the end of the lease term, the BPIGroup receives additional payment from the lessee prior to the transfer of the leased asset. On the other hand, theBPI Group sets up a liability to the lessee for any excess of the guaranteed deposit liability over residual value ofthe leased asset.
The Parent Bank has no finance lease receivables as at December 31, 2016 and 2015.
There is no contingent rent recognized as income during the years ended December 31, 2016 and 2015.
Details of the loans and advances portfolio of the BPI Group at December 31 are as follows:
1) As to industry/economic sector (in %)
Consolidated Parent
2016 2015 2016 2015
Real estate, renting and other relatedactivities 23.06 22.03 15.25 12.62
Manufacturing 15.93 19.07 19.48 24.20Wholesale and retail trade 11.53 12.54 12.61 14.67Financial institutions 9.48 12.20 11.85 15.80Consumer 9.21 9.75 5.08 5.66Agriculture and forestry 4.03 1.82 5.04 2.28Others 26.76 22.59 30.69 24.77
100.00 100.00 100.00 100.00
2) As to collateral
Consolidated Parent
2016 2015 2016 2015
(In Millions of Pesos)Secured loans
Real estate mortgage 241,363 232,433 103,191 103,326Chattel mortgage 61,484 54,230 178 136Others 334,039 261,390 324,056 251,611
636,886 548,053 427,425 355,073Unsecured loans 418,035 337,892 402,527 317,858
1,054,921 885,945 829,952 672,931
Other collaterals include hold-out deposits, mortgage trust indentures, government securities and bonds,quedan/warehouse receipts, standby letters of credit, trust receipts, and deposit substitutes.

(14)
Loans and advances aggregating P312 million (2015 - P393 million) and P280 million (2015 - P319 million) areused as security for bills payable (Note 17) of the BPI Group and the Parent Bank, respectively.
The range of average interest rates (%) of loans and advances for the years ended December 31 follows:
Consolidated Parent
2016 2015 2016 2015
Commercial loansPeso-denominated loans 4.11 - 4.16 4.12 - 4.23 3.88 - 3.94 3.82 - 3.97Foreign currency-denominated loans 2.66 - 2.84 2.50 - 2.78 2.66 - 2.84 2.50 - 2.78
Real estate mortgages 6.75 - 6.97 7.10 - 7.52 5.72 - 8.00 4.75 - 13.75Auto loans 9.51 - 9.68 9.80 - 9.90 - -
Non-performing accounts (over 30 days past due) of the BPI Group and the Parent Bank, net of specific allowancefor credit losses, following BSP Circular 772 are as follows:
Consolidated Parent
2016 2015 2016 2015
(In Millions of Pesos)Non-performing accounts (NPL 30) 15,792 14,727 7,654 8,023Specific allowance for credit losses 10,070 9,368 5,033 5,382
Net NPL 30 5,722 5,359 2,621 2,641
Reconciliation of allowance for impairment by class at December 31 follows:
Consolidated
2016
Corporate entities Retail customers
Largecorporatecustomers
Small andmedium
enterprisesCreditcards
Realestate
mortgagesAutoloans Others Total
(In Millions of Pesos)At January 1 6,406 3,039 2,751 1,791 2,010 365 16,362
Provision for impairmentlosses 1,066 940 1,448 143 1,185 173 4,955
Write-off/disposal (168) (168) (1,618) (28) (177) (94) (2,253)Unwind of discount (134) (56) - - - - (190)
Transfers 111 (68) 2 (68) (174) (1) (198)
At December 31 7,281 3,687 2,583 1,838 2,844 443 18,676
2015
Corporate entities Retail customers
Largecorporatecustomers
Small andmedium
enterprisesCreditcards
Realestate
mortgagesAutoloans Others Total
(In Millions of Pesos)At January 1 5,581 2,316 2,292 1,533 1,702 282 13,706Provision for impairment
losses 975 829 1,230 345 526 194 4,099Write-off/disposal (8) (33) (771) (1) (102) (95) (1,010)Unwind of discount (216) - - - - - (216)Transfers 74 (73) - (86) (116) (16) (217)
At December 31 6,406 3,039 2,751 1,791 2,010 365 16,362

(15)
Parent
2016
Corporate entities Retail customers
Largecorporatecustomers
Small andmedium
enterprisesCreditcards
Realestate
mortgagesAutoloans Others Total
(In Millions of Pesos)At January 1 5,406 2,228 2,711 24 - 255 10,624Provision for impairment
losses 1,267 417 1,391 17 - 142 3,234
Write-off/disposal (159) (85) (1,581) (18) - (94) (1,937)Unwind of discount (134) (56) - - - - (190)
Transfers 53 (47) 2 (10) - (1) (3)
At December 31 6,433 2,457 2,523 13 - 302 11,728
2015
Corporate entities Retail customers
Largecorporatecustomers
Small andmedium
enterprisesCreditcards
Realestate
mortgagesAutoloans Others Total
(In Millions of Pesos)At January 1 4,698 1,963 2,279 25 - 213 9,178Provision for impairment
losses 839 413 1,197 (1) - 138 2,586Write-off/disposal (8) (32) (765) - - (95) (900)Unwind of discount (216) - - - - - (216)Transfers 93 (116) - - - (1) (24)
At December 31 5,406 2,228 2,711 24 - 255 10,624
Transfers pertain to reclassification of allowance for impairment between accounts.

(16)
Note 11 - Bank Premises, Furniture, Fixtures and Equipment
The account at December 31 consists of:
Consolidated
2016
Land
Buildings andleasehold
improvements
Furnitureand
equipmentEquipmentfor lease Total
(In Millions of Pesos)Cost
January 1, 2016 3,070 6,564 13,961 4,721 28,316Additions 3 572 2,540 2,099 5,214
Disposals (8) (6) (2,144) (1,968) (4,126)
Amortization - (185) - - (185)
Transfers 10 (35) - - (25)
December 31, 2016 3,075 6,910 14,357 4,852 29,194
Accumulated depreciationJanuary 1, 2016 - 2,784 10,994 1,712 15,490
Depreciation - 327 1,552 1,063 2,942
Disposals/transfers - (1) (1,859) (1,187) (3,047)
December 31, 2016 - 3,110 10,687 1,588 15,385
Net book value, December 31, 2016 3,075 3,800 3,670 3,264 13,809
2015
Land
Buildings andleasehold
improvements
Furnitureand
equipmentEquipmentfor lease Total
(In Millions of Pesos)Cost
January 1, 2015 3,074 6,162 13,839 4,912 27,987Additions - 573 1,627 1,658 3,858Disposals (7) (5) (1,502) (1,849) (3,363)Amortization - (152) - - (152)Transfers - (19) - - (19)Others 3 5 (3) - 5
December 31, 2015 3,070 6,564 13,961 4,721 28,316
Accumulated depreciationJanuary 1, 2015 - 2,521 11,002 1,704 15,227Depreciation - 263 1,417 1,092 2,772Disposals/transfers - (2) (1,423) (1,084) (2,509)Others - 2 (2) - -
December 31, 2015 - 2,784 10,994 1,712 15,490
Net book value, December 31, 2015 3,070 3,780 2,967 3,009 12,826

(17)
Parent
2016
Land
Buildings andleasehold
improvementsFurniture and
equipment Total
(In Millions of Pesos)Cost
January 1, 2016 2,657 5,758 12,866 21,281Additions - 458 2,307 2,765
Disposals (7) (5) (2,017) (2,029)
Amortization - (129) - (129)
Transfers 10 (35) - (25)
December 31, 2016 2,660 6,047 13,156 21,863
Accumulated depreciationJanuary 1, 2016 - 2,440 10,126 12,566
Depreciation - 285 1,413 1,698
Disposals/transfers - (3) (1,793) (1,796)
December 31, 2016 - 2,722 9,746 12,468
Net book value, December 31, 2016 2,660 3,325 3,410 9,395
2015
Land
Buildings andleasehold
improvementsFurniture and
equipment Total
(In Millions of Pesos)Cost
January 1, 2015 2,664 5,389 12,811 20,864Additions - 494 1,481 1,975Disposals (7) (5) (1,426) (1,438)Amortization - (101) - (101)Transfers - (19) - (19)
December 31, 2015 2,657 5,758 12,866 21,281
Accumulated depreciationJanuary 1, 2015 - 2,214 10,183 12,397Depreciation - 228 1,316 1,544Disposals/transfers - (2) (1,373) (1,375)
December 31, 2015 - 2,440 10,126 12,566
Net book value, December 31, 2015 2,657 3,318 2,740 8,715
Depreciation is included in Occupancy and equipment-related expenses in the statement of income.

(18)
Note 12 - Investment Properties
The account at December 31 consists of:
Consolidated Parent
2016 2015 2016 2015
(In Millions of Pesos)Land 97 97 97 97Buildings 2,067 2,032 2,067 2,032
2,164 2,129 2,164 2,129Accumulated depreciation (1,493) (1,394) (1,493) (1,394)Allowance for impairment (2) (2) (2) (2)
669 733 669 733
The movement in investment properties is summarized as follows:
Consolidated Parent
2016 2015 2016 2015
(In Millions of Pesos)At January 1 733 808 733 808Transfers 35 19 35 19Depreciation (99) (94) (99) (94)
At December 31 669 733 669 733
Investment properties have aggregate fair value of P3,090 million as at December 31, 2016(2015 - P3,050 million). The fair value of investment property is determined on the basis of appraisal made by aninternal or an external appraiser duly certified by the General Administrative and Shared Services Group.Valuation method employed by the appraisers mainly includes the market data approach.
Depreciation is included in Occupancy and equipment-related expenses in the statement of income.
All investment properties generate rental income. Rental income from investment properties recognized in thestatement of income, as part of Other operating income, amounts to P243 million for the year endedDecember 31, 2016 (2015 - P262 million; 2014 - P298 million). Direct operating expenses (including repairs andmaintenance) arising from these investment properties amount to P190 million for the year endedDecember 31, 2016 (2015 - P165 million; 2014 - P125 million).
Note 13 - Investments in Subsidiaries and Associates
This account at December 31 consists of investments in shares of stock:
Consolidated Parent
2016 2015 2016 2015
(In Millions of Pesos)Carrying value (net of impairment)
Investments at equity method 6,818 6,453 - -Investments at cost method - - 8,948 8,068
6,818 6,453 8,948 8,068

(19)
Investments in associates carried at equity method in the consolidated statement of condition follow:
Place of business/country of
incorporation
Percentage ofownership interest
(%) Acquisition costMeasurement
method
Name of entity 2016 2015 2016 2015
(In Millions of Pesos)BPI-Philamlife Assurance Corporation Philippines 47.67 47.67 371 371 EquityAF Payments, Inc. Philippines 20.00 20.00 590 460 EquityNational Reinsurance Corporation* Philippines 13.69 13.69 204 204 EquityBeacon Property Ventures, Inc. Philippines 20.00 20.00 80 100 EquityCityTrust Realty Corporation Philippines 40.00 40.00 2 2 EquityGlobal Payments-Asia Pacific
Philippines Incorporated Philippines 49.00 49.00 1,342 1,342 Equity
2,589 2,479*BPI Group has significant influence due to its representation on the governing body of National Reinsurance Corporation
For BPI-Philamlife Assurance Corporation, BPI acts as distribution channel for the former’s insurance products. In2014, the distribution agreement with Philamlife has been extended for another twenty years or untilNovember 27, 2039 unless earlier terminated.
In August 2015, BPI subscribed to primary shares of Global Payments-Asia Pacific Philippines Incorporated for atotal consideration of P1.3 billion; thereby acquiring a 49% stake in the entity.
Details and movements of investments in associates carried at equity method in the consolidated financialstatements follow:
2016 2015
(In Millions of Pesos)Acquisition cost
At January 1 2,479 977Additions 130 1,502Return of capital (20) -
At December 31 2,589 2,479
Accumulated equity in net incomeAt January 1 2,651 2,024Share in net income for the year 814 627Dividends received (476) -
At December 31 2,989 2,651
Accumulated share in other comprehensive incomeAt January 1 1,323 1,783Share in other comprehensive loss for the year (83) (460)
At December 31 1,240 1,323
6,818 6,453
As the associates are not considered to be individually material to impact the financial statements of the BPIGroup, the unaudited financial information of associates as at and for the years ended December 31 has beenaggregated as follows:
2016 2015
(In Millions of Pesos)Total assets 109,662 95,029Total liabilities 90,386 76,281Total revenues 23,231 23,769Total net income 1,338 1,138

(20)
The details of equity investments at cost method in the separate financial statements of the Parent Bank follow:
Acquisition costAllowance forimpairment Carrying value
2016 2015 2016 2015 2016 2015
(In Millions of Pesos)Subsidiaries
BPI Europe Plc. 1,910 1,910 - - 1,910 1,910BPI Direct BanKO, Inc., A Savings
Bank (formerly BPI DirectSavings Bank, Inc.)
1,009 392 - - 1,009 392
Ayala Plans, Inc. 863 863 - - 863 863BPI Capital Corporation 623 623 - - 623 623BPI Asset Management and Trust
Corporation 600 - - - 600 -BPI Card Finance Corp. 340 50 - - 340 50BPI Century Tokyo Lease and
Finance Corporation 329 329 - - 329 329FGU Insurance Corporation 303 303 - - 303 303BPI Globe BanKO, Inc. - 607 - - - 607BPI Forex Corp. 195 195 - - 195 195BPI Express Remittance Corp. USA 191 191 - - 191 191BPI Family Savings Bank, Inc. 150 150 - - 150 150First Far-East Development
Corporation 91 91 - - 91 91Green Enterprises S.R.L. in
Liquidation 54 54 - - 54 54FEB Stock Brokers, Inc. 25 25 - - 25 25BPI Computer Systems Corp. 23 23 - - 23 23BPI Express Remittance Spain S.A 26 26 - - 26 26Others 321 321 (104) (104) 217 217
Associates 1,999 2,019 - - 1,999 2,0199,052 8,172 (104) (104) 8,948 8,068
On August 30, 2016, the Parent Bank made an additional capital infusion to BPI Card Finance Corp. amounting toP290 million.
Effective September 20, 2016, the Parent Bank has assumed full ownership of BPI Globe BanKO, Inc., from prior40% ownership, after acquiring the combined 60% stake held by two other shareholders for a consideration ofP29 million. Refer to Note 31.3 for details.
On October 6, 2016, BPI Asset Management and Trust Corporation, with an initial paid-in capital of P600 million,was incorporated with the SEC as a wholly-owned subsidiary of the Parent Bank. The primary business purpose ofBPI Asset Management and Trust Corporation is to carry and engage in the business of trust, other fiduciaryactivities and investment management activities.
There is no individual subsidiary with non-controlling interest considered material to the Parent Bank.

(21)
Note 14 - Deferred Income Taxes
The significant components of deferred income tax assets and liabilities at December 31 are as follows:
Consolidated Parent
2016 2015 2016 2015
(In Millions of Pesos)Deferred income tax assets
Allowance for impairment 6,843 6,466 4,173 4,116Pension liability 796 496 597 449Bonus accruals 301 - 245 -Net operating loss carry over (NOLCO) 63 63 - -Fair value loss on securities 48 - 48 -Minimum corporate income tax (MCIT) 1 1 - -Others 35 74 32 8
Total deferred income tax assets 8,087 7,100 5,095 4,573
Deferred income tax liabilitiesRevaluation gain on properties (519) (511) (519) (523)Fair value gain on securities - (39) - (106)Others (25) (117) (5) (8)
Total deferred income tax liabilities (544) (667) (524) (637)
Deferred income tax assets, net 7,543 6,433 4,571 3,936
The movement in the deferred income tax account is summarized as follows:
Consolidated Parent
2016 2015 2016 2015
(In Millions of Pesos)At January 1 6,433 5,718 3,936 3,595Amounts credited to statement of income 884 598 439 238Amounts credited to other comprehensive income 226 117 196 103
At December 31 7,543 6,433 4,571 3,936
The deferred tax (credit) charge in the statement of income comprises the following temporary differences:
Consolidated Parent
2016 2015 2014 2016 2015 2014
(In Millions of Pesos)Allowance for impairment (377) (670) (298) (57) (322) (163)Bonus accruals (301) - - (245) - -Fair value (loss) gain on
securities (142) 81 (41) (142) 81 (41)Pension (52) 40 76 36 31 75NOLCO - - (107) - - -Others (12) (49) (46) (31) (28) (9)
(884) (598) (416) (439) (238) (138)

(22)
The outstanding NOLCO at December 31 consists of:
Consolidated Parent
Year of Incurrence Year of Expiration 2016 2015 2016 2015
(In Millions of Pesos)2016 2019 182 - - -2015 2018 188 188 - -2014 2017 361 361 - -2013 2016 20 20 - -2012 2015 - 10 - -
751 579 - -Used portion/ expired during the year (20) (10) - -NOLCO not recognized (521) (359) - -
210 210 - -Tax rate 30% 30% 30% 30%
Deferred income tax asset on NOLCO 63 63 - -
The details of MCIT at December 31 are as follows:
Consolidated Parent
Year of Incurrence Year of Expiration 2016 2015 2016 2015
(In Millions of Pesos)2014 2017 1 1 - -
Note 15 - Other Resources
The account at December 31 consists of the following:
Consolidated Parent
2016 2015 2016 2015
(In Millions of Pesos)Accounts receivable 2,898 2,854 1,974 1,989Intangible assets 2,336 2,054 2,277 2,009Residual value of equipment for lease 2,090 1,952 - -Prepaid expenses 1,752 906 1,268 483Accrued trust and other fees 1,124 1,196 953 1,080Sundry debits 574 15 565 8Rental deposits 510 403 430 336Creditable withholding tax 380 329 82 63Miscellaneous assets 1,811 2,602 1,179 1,655
13,475 12,311 8,728 7,623
Allowance for impairment (1,190) (1,456) (990) (1,237)12,285 10,855 7,738 6,386
Intangible assets mainly pertain to contractual customer relationships and computer software.
Sundry debits pertain to float items arising from timing differences in recording transactions which are expected toclear in one to two days.
Miscellaneous assets include returned checks, prepaid taxes and other office supplies.

(23)
The reconciliation of the allowance for impairment at December 31 is summarized as follows:
Consolidated Parent
2016 2015 2016 2015
(In Millions of Pesos)At January 1 1,456 1,478 1,237 1,330(Reversal of) provision for impairment losses (39) 7 (23) (66)Write-off (227) (29) (224) (27)
At December 31 1,190 1,456 990 1,237
The allowance for impairment as at December 31, 2016 and 2015 mainly pertains to accounts receivable.
Consolidated Parent
2016 2015 2016 2015
(In Millions of Pesos)Current 8,555 8,270 5,980 5,604Non-current 4,920 4,041 2,748 2,019
13,475 12,311 8,728 7,623
Note 16 - Deposit Liabilities
The account at December 31 consists of:
Consolidated Parent
2016 2015 2016 2015
(In Millions of Pesos)Demand 231,525 214,597 219,869 205,061Savings 820,181 707,783 711,270 610,725Time 379,594 353,319 253,339 217,599
1,431,300 1,275,699 1,184,478 1,033,385
The Parent balances above include amounts due from related parties (Note 27). The Consolidated balances above alsoinclude amounts due from related parties (Note 27) except for accounts considered as intercompany transactions.
Consolidated Parent
2016 2015 2016 2015
(In Millions of Pesos)Current 806,779 720,871 572,877 551,682Non-current 624,521 554,828 611,601 481,703
1,431,300 1,275,699 1,184,478 1,033,385
Related interest expense on deposit liabilities is broken down as follows:
Consolidated Parent
2016 2015 2014 2016 2015 2014
(In Millions of Pesos)Demand 557 513 452 514 463 405Savings 6,774 5,886 5,584 5,497 4,674 4,320Time 7,970 6,927 4,798 3,605 3,246 2,010
15,301 13,326 10,834 9,616 8,383 6,735

(24)
Under current and existing BSP regulations as at December 31, 2016 and 2015, the BPI Group should comply witha simplified minimum reserve requirement on statutory/legal and liquidity reserves. Further, BSP requires allreserves be kept at the central bank. The BPI Group is in full compliance with the simplified reserve requirement.
The required statutory/legal and liquidity reserves as reported to BSP at December 31 follows:
Consolidated Parent
2016 2015 2016 2015
(In Millions of Pesos)Required reserves (included in Due from BSP) 210,335 183,642 191,507 165,110
Note 17 - Bills Payable
The account at December 31 consists of:
Consolidated Parent
2016 2015 2016 2015
(In Millions of Pesos)Local banks 9,150 7,052 61 120Foreign banks 52,823 13,889 52,196 12,706
61,973 20,941 52,257 12,826
The range of average interest rates (%) of bills payable for the years ended December 31 follows:
Consolidated Parent
2016 2015 2016 2015
Bangko Sentral ng Pilipinas 4.10 - 4.40 3.55 - 3.85 - -Private firms and local banks - Peso-denominated 3.22 - 3.85 3.34 - 3.60 4.37 - 4.48 4.35 - 5.32Foreign banks - Foreign-currency denominated 1.08 - 1.30 0.92 - 1.15 1.08 - 1.30 0.92 - 1.15
Consolidated Parent
2016 2015 2014 2016 2015 2014
(In Millions of Pesos)Interest expense 634 332 350 406 115 138
Consolidated Parent
2016 2015 2016 2015
(In Millions of Pesos)Current 34,268 16,114 25,057 8,008Non-current 27,705 4,827 27,200 4,818
61,973 20,941 52,257 12,826
Bills payable include funds borrowed from Land Bank of the Philippines (LBP), Development Bank of thePhilippines (DBP) and BSP which were relent to customers of the BPI Group in accordance with the financingprograms of LBP, DBP and BSP and credit balances of settlement bank accounts. The average payment term ofthese bills payable is 0.95 years (2015 - 1.99 years). Loans and advances of the BPI Group arising from thesefinancing programs serve as security for the related bills payable (Note 10).

(25)
Note 18 - Deferred Credits and Other Liabilities
The account at December 31 consists of the following:
Consolidated Parent
2016 2015 2016 2015
(In Millions of Pesos)Bills purchased - contra 11,319 13,485 11,312 13,465Accounts payable 4,875 4,483 3,325 2,594Dividends payable 3,543 3,539 3,543 3,539Deposits on lease contracts 1,970 1,868 - -Outstanding acceptances 1,452 2,494 1,452 2,494Withholding tax payable 555 517 434 380Due to the Treasurer of the Philippines 430 467 383 414Other deferred credits 276 343 80 108Miscellaneous liabilities 7,738 7,502 6,307 6,101
32,158 34,698 26,836 29,095
Bills purchased - contra represents liabilities arising from the outright purchases of checks before actual clearing asa means of immediate financing offered by the BPI Group.
Miscellaneous liabilities include pension liability, insurance and other employee-related payables.
Consolidated Parent
2016 2015 2016 2015
(In Millions of Pesos)Current 29,126 32,945 25,675 28,274Non-current 3,032 1,753 1,161 821
32,158 34,698 26,836 29,095
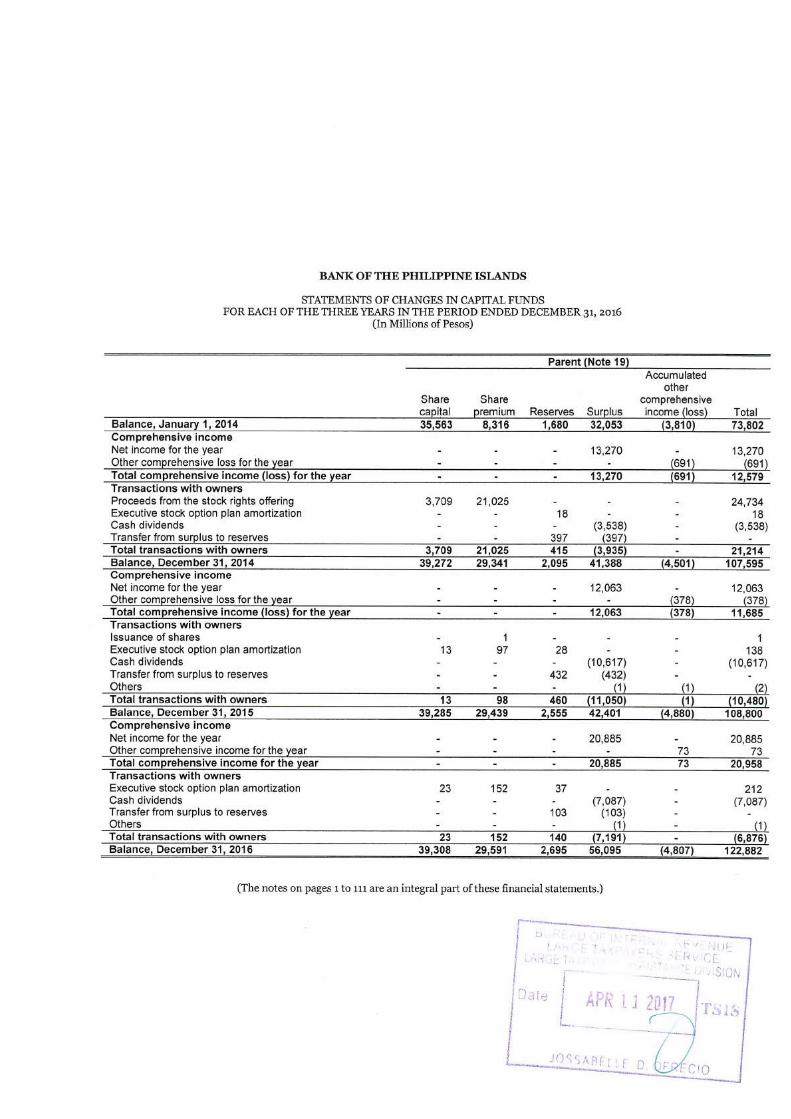
Note 19 - Capital Funds
Details of authorized share capital of the Parent Bank follow:
2016 2015 2014
(In Millions of Pesos,Except Par Value Per Share)
Authorized capital (at P10 par value per share)Common shares 49,000 49,000 49,000Preferred A shares 600 600 600
49,600 49,600 49,600
Details of outstanding common shares follow:
2016 2015 2014
(In Number of Shares)Issued common shares
At January 1 3,932,220,179 3,932,214,184 3,558,720,023Issuance of shares during the year 4,823,424 5,995 373,494,161
At December 31 3,937,043,603 3,932,220,179 3,932,214,184
Subscribed common shares 6,213,433 3,685,784 5,056,319
Share premium as at December 31, 2016 amounts to P29,591 million (2015 -P29,439 million).

(26)
As at December 31, 2016, 2015 and 2014, the Parent Bank has 11,596, 11,754 and 11,858 common shareholders,respectively. There are no preferred shares issued and outstanding at December 31, 2016, 2015 and 2014.
On November 6, 2013, the Board of Directors of the Parent Bank approved the stock rights offer by way of issuancefrom the unissued portion of the authorized capital stock. The Parent Bank offered for subscription a total of370,370,370 common shares to eligible shareholders on a pre-emptive rights basis at P67.50 per share. The stockrights have been fully subscribed and listed on February 10, 2014. The proceeds from the rights offer amounting toP25 billion have increased the Parent Bank’s capital base.
Details of and movements in Accumulated other comprehensive income (loss) for the years ended December 31follow:
Consolidated Parent
2016 2015 2014 2016 2015 2014
(In Millions of Pesos)Fair value reserve on available-for-sale
securitiesAt January 1 (4,381) (3,855) (2,952) (4,226) (4,072) (3,029)Unrealized fair value loss before tax (507) (542) (1,153) (133) (217) (1,201)Amount recycled to profit or loss 1,072 (26) (253) 623 22 (324)Deferred income tax effect (22) 42 503 12 41 482
At December 31 (3,838) (4,381) (3,855) (3,724) (4,226) (4,072)
Share in other comprehensive income (loss)of insurance subsidiariesAt January 1 (67) 188 36 - - -Share in other comprehensive (loss)
income for the year, before tax (108) (265) 157 - - -Deferred income tax effect 17 10 (5) - - -
At December 31 (158) (67) 188 - - -
Share in other comprehensive income (loss)of associatesAt January 1 1,333 1,784 1,530 - - -Share in other comprehensive (loss)
income for the year (74) (451) 254 - - -
At December 31 1,259 1,333 1,784 - - -
Translation adjustment on foreign operationsAt January 1 (691) (768) (703) - - -Translation differences (113) 77 (65) - - -
At December 31 (804) (691) (768) - - -
Actuarial losses on defined benefit plan, netAt January 1 (958) (572) (1,072) (654) (429) (781)Actuarial (losses) gains for the year (827) (546) 713 (613) (322) 503Deferred income tax effect 248 160 (213) 184 97 (151)
At December 31 (1,537) (958) (572) (1,083) (654) (429)
(5,078) (4,764) (3,223) (4,807) (4,880) (4,501)
On December 18, 2015, the Board of Directors of the Parent Bank approved to grant to qualified beneficiaries/participants up to 3,575,000 shares for Executive Stock Option Plan (ESOP) and 8,000,000 shares for ExecutiveStock Purchase Plan (ESPP).
On November 12, 2014, the Board of Directors of the Parent Bank approved to grant to qualified beneficiaries/participants up to 3,200,000 shares for ESOP and 4,100,000 shares for ESPP.
On November 27, 2013, the Board of Directors of the Parent Bank approved to grant to qualified beneficiaries/participants up to 3,500,000 shares for ESOP and up to 4,300,000 shares for ESPP.

(27)
The ESOP has a three-year vesting period with 1/3 of the option being vested at the end of each year from grantdate while the ESPP has a five-year payment period.
The exercise price for ESOP is equal to the volume weighted average of BPI share price for the most recentprevious 30-trading days from grant date. There were no options granted for the year ended December 31, 2016.The weighted average fair value of options granted determined using the Black-Scholes valuation model was P11.64and P16.20 for the years ended December 31, 2015 and 2014, respectively.
Movements in the number of employee share options are as follows:
2016 2015 2014
At January 1 9,225,000 6,350,000 3,250,000Granted - 3,575,000 3,175,000Exercised (16,667) (91,667) -Cancelled (108,333) (608,333) (75,000)
At December 31 9,100,000 9,225,000 6,350,000
Exercisable 3,033,333 2,650,000 1,058,333
The subscription price for ESPP is equivalent to 15% below the volume weighted average of BPI share price for themost recent previous 30-trading days from grant date. The subscription dates for ESPP were on January 25, 2016,November 12, 2014 and December 23, 2013.
The impact of ESOP is not considered material to the financial statements; thus, the disclosures were only limitedto the information mentioned above.
Details of and movements in Reserves for the years ended December 31 follow:
Consolidated Parent2016 2015 2014 2016 2015 2014
(In Millions of Pesos)Surplus reserves
At January 1 2,563 2,098 1,680 2,555 2,095 1,680Transfer from surplus 103 432 397 103 432 397Executive stock plan amortization 45 33 21 37 28 18
At December 31 2,711 2,563 2,098 2,695 2,555 2,095
Surplus reserves consist of:
Consolidated Parent
2016 2015 2014 2016 2015 2014
(In Millions of Pesos)Reserve for trust business 2,577 2,474 2,043 2,577 2,474 2,043Reserve for self-insurance 34 34 34 34 34 34Executive stock option plan amortization 100 55 21 84 47 18
2,711 2,563 2,098 2,695 2,555 2,095
In compliance with existing BSP regulations, 10% of the Parent Bank’s income from trust business is appropriatedto surplus reserve. This yearly appropriation is required until the surplus reserve for trust business reaches 20% ofthe Parent Bank’s regulatory net worth.
Reserve for self-insurance represents the amount set aside to cover losses due to fire, defalcation by and otherunlawful acts of personnel and third parties.

(28)
Cash dividends declared by the Board of Directors of the Parent Bank during the years 2014 to 2016 follow:
Date declared Date approved by the BSP
Amount of dividends
Per shareTotal
(In Millions of Pesos)
May 21, 2014 June 19, 2014 0.90 3,538November 19, 2014 February 2, 2015 0.90 3,539May 20, 2015 July 20, 2015 0.90 3,539December 16, 2015 Not applicable, see below. 0.90 3,539June 15, 2016 Not applicable, see below. 0.90 3,543December 14, 2016 Not applicable, see below. 0.90 3,543
Prior to October 2015, cash dividends declared are payable to common shareholders of record as of 15th workingday from receipt by the Parent Bank of the approval by the BSP and distributable on the 15th working day from thesaid record date.
In October 2015, BSP Circular No. 888, Amendments to Regulations on Dividend Declaration and InterestPayments on Tier 1 Capital Instruments, was issued which amends the section on recording of dividends. Theliability for dividends declared shall be taken up in the bank’s books upon its declaration. Prior to the release ofBSP Circular No. 888, the liability for recording dividends declared is taken up in the books upon receipt of BSPapproval thereof or if no such approval is received, after thirty (30) banking/business days from the date therequired report on dividend declaration was received by the appropriate department of the Supervision andExamination Sector, whichever comes earlier.
The calculation of earnings per share (EPS) is shown below:
Consolidated Parent
2016 2015 2014 2016 2015 2014
(In Millions, Except Earnings Per Share Amounts)a) Net income attributable to equity holders
of the Parent Bank 22,050 18,234 18,039 20,885 12,063 13,270b) Weighted average number of common
shares outstanding during the year 3,937 3,932 3,905 3,937 3,932 3,905c) Basic EPS (a/b) 5.60 4.64 4.62 5.30 3.07 3.40
The basic and diluted EPS are the same for the years presented as the stock options outstanding is not significant toimpact the weighted average number of common shares.

(29)
Note 20 - Other Operating Income
Details of other operating income follow:
Consolidated Parent
2016 2015 2014 2016 2015 2014
(In Millions of Pesos)Trust and asset management fees 3,605 3,607 3,433 2,369 2,912 2,793Rental income 1,687 1,729 1,796 353 382 439Credit card income 1,530 1,537 1,550 1,519 1,529 1,548Gain on sale of assets 712 2,530 1,363 322 1,950 2,418Dividend income 56 48 22 6,083 389 572Others 1,365 1,199 2,504 1,084 889 2,201
8,955 10,650 10,668 11,730 8,051 9,971
Trust and asset management fees arise from the BPI Group’s asset management and trust services and are based onagreed terms with various managed funds and investments.
Rental income is earned by the BPI Group by leasing out its investment properties (Note 12) and other assets whichconsist mainly of fleet of vehicles. The BPI Group’s operating lease agreements typically pertain to cancellable leaseswith a period of two to five years.
Credit card income pertains to membership fees arising from issuance of credit cards and various service chargesearned from the cardholders.
Gain on sale of assets arises mainly from the sale of assets pertaining to merchant acquiring business, disposals ofproperties (including equity investments), foreclosed collaterals and non-performing assets.
Dividend income recognized by the Parent Bank substantially pertains to dividend distribution of subsidiaries. During2016, BPI Family Savings Bank, Inc. and BPI Capital Corporation declared dividends payable to the Parent Bankamounting to P4,500 million and P1,000 million, respectively.
Other income includes recoveries on charged-off assets and revenues from service arrangements with customersand related parties.
Note 21 - Leases
The BPI Group and the Parent Bank have various lease agreements which mainly pertain to branch premises that arerenewable under certain terms and conditions. The rentals (included in Occupancy and equipment-related expenses)under these lease contracts are as follows:
Consolidated Parent
(In Millions of Pesos)2016 1,337 1,097
2015 1,259 1,0412014 1,160 937
The future minimum lease payments under non-cancellable operating leases of the BPI Group are as follows:
2016 2015
(In Millions of Pesos)No later than 1 year 65 74Later than 1 year but no later than 5 years 101 126More than 5 years 10 10
176 210

(30)
Note 22 - Operating Expenses
Details of compensation and fringe benefits expenses follow:
Consolidated Parent
2016 2015 2014 2016 2015 2014
(In Millions of Pesos)Salaries and wages 11,332 10,158 9,516 8,998 8,062 7,610Retirement expense (Note 25) 755 1,039 826 602 854 670Other employee benefit expenses 1,376 1,266 1,508 1,113 1,033 1,288
13,463 12,463 11,850 10,713 9,949 9,568
Details of other operating expenses follow:
Consolidated Parent
2016 2015 2014 2016 2015 2014
(In Millions of Pesos)Insurance 3,426 2,837 2,513 2,160 1,921 1,642Advertising 1,144 1,303 1,335 955 1,152 1,163Travel and communication 812 770 722 687 650 601Taxes and licenses 620 585 469 369 375 295Supervision and examination fees 606 541 497 526 474 436Litigation expenses 512 397 417 279 211 224Management and other
professional fees 495 442 297 424 343 251Office supplies 324 301 275 271 253 226Amortization expense 312 323 316 308 320 312Shared expenses - - - 12 15 22Others 3,071 2,714 2,252 2,157 1,815 1,421
11,322 10,213 9,093 8,148 7,529 6,593
Other expenses mainly include fees and incentives paid to agents, outsourcing fees, freight charges and otherbusiness expense such as those incurred in staff meetings, periodicals and magazines.

(31)
Note 23 - Income Taxes
A reconciliation between the provision for income tax at the statutory tax rate and the actual provision for incometax for the years ended December 31 follows:
Consolidated
2016 2015 2014
AmountRate(%) Amount
Rate(%) Amount
Rate(%)
(In Millions of Pesos)Statutory income tax 8,043 30.00 7,054 30.00 6,906 30.00Effect of items not subject to statutory tax rate:
Income subjected to lower tax rates (764) (2.85) (886) (3.77) (1,571) (6.82)Tax-exempt income (3,942) (14.70) (1,515) (6.44) (2,062) (8.96)Others, net 1,198 4.47 485 2.06 1,685 7.31
Actual income tax 4,535 16.92 5,138 21.85 4,958 21.53
Parent
2016 2015 2014
AmountRate(%) Amount
Rate(%) Amount
Rate(%)
(In Millions of Pesos)Statutory income tax 7,267 30.00 4,828 30.00 5,067 30.00Effect of items not subject to statutory tax rate:
Income subjected to lower tax rates (669) (2.76) (792) (4.92) (1,491) (8.83)Tax-exempt income (2,577) (10.64) (340) (2.11) (1,035) (6.13)Others, net (683) (2.82) 335 2.08 1,080 6.39
Actual income tax 3,338 13.78 4,031 25.05 3,621 21.43
Note 24 - Basic Quantitative Indicators of Financial Performance
The key financial performance indicators follow (in %):
Consolidated Parent
2016 2015 2016 2015
Return on average equity 13.77 12.33 17.72 11.04Return on average assets 1.39 1.30 1.67 1.08Net interest margin 2.85 2.98 2.58 2.69

(32)
Note 25 - Retirement Plans
BPI and its subsidiaries, and a non-life insurance subsidiary have separate trusteed, non-contributory retirementbenefit plans covering all qualified officers and employees. Effective January 1, 2016, the BPI Group implementeda defined contribution plan, in addition to its existing defined benefit plan, which is accounted for as a definedbenefit plan with minimum guarantee. The description of the plans follows:
Defined benefit retirement plan
BPI
BPI has a unified plan which includes its subsidiaries other than insurance companies. Under this plan, thenormal retirement age is 60 years. Normal retirement benefit consists of a lump sum benefit equivalent to 200%of the basic monthly salary of the employee at the time of his retirement for each year of service, if he has renderedat least 10 years of service, or to 150% of his basic monthly salary, if he has rendered less than 10 years of service.For voluntary retirement, the benefit is equivalent to 112.50% of the employee’s basic monthly salary for aminimum of 10 years of service with the rate factor progressing to a maximum of 200% of basic monthly salary forservice years of 25 or more. Death or disability benefit, on the other hand, shall be determined on the same basisas in voluntary retirement.
The net defined benefit cost and contributions to be paid by the entities within the BPI Group are determined byan independent actuary.
Non-life insurance subsidiary
BPI/MS has a separate trusteed defined benefit plan. Under the plan, the normal retirement age is 60 years.Normal retirement benefit consists of a lump sum benefit equivalent to 175% of the basic monthly salary of theemployee at the time of his retirement for each year of service, if he has rendered as least 10 years of service, or to150% of his basic monthly salary, if he has rendered less than 10 years of service.
Death or disability benefit for all employees of the non-life insurance subsidiary shall be determined on the samebasis as in normal or voluntary retirement as the case may be.
Defined contribution retirement plan
For the defined contribution retirement plan, the defined benefit minimum guarantee is equivalent to a certainpercentage of the monthly salary payable to an employee at normal retirement age with the required creditedyears of service based on the provisions of Republic Act (“RA”) No. 7641. All non-unionized employees hired on orafter the effective date are automatically under the new defined contribution plan. Employees hired prior to theeffective date shall have the option to elect to become members of the new defined contribution plan.
Plan assets for both the defined benefit and defined contribution plans are held in trusts, governed by localregulations and practice in the Philippines.

(33)
Following are the amounts recognized based on recent actuarial valuations:
Defined benefit retirement plan
(a) Pension liability as at December 31 recognized in the statement of condition
Consolidated
2016 2015
(In Millions of Pesos)Present value of defined benefit obligation 11,952 11,991Fair value of plan assets (10,084) (10,953)
Pension liability recognized in the statement of condition 1,868 1,038
Parent
2016 2015
(In Millions of Pesos)Present value of defined benefit obligation 9,905 9,849Fair value of plan assets (8,543) (9,106)
Pension liability recognized in the statement of condition 1,362 743
Pension liability is shown as part of “Miscellaneous liabilities” within Deferred credits and other liabilities(Note 18).
The movement in plan assets is summarized as follows:
Consolidated Parent
2016 2015 2016 2015
(In Millions of Pesos)At January 1 10,953 11,133 9,106 9,165Transfer to defined contribution plan (659) - (535) -Interest income 521 469 440 388Contributions 704 942 577 766Benefit payments (1,026) (1,208) (699) (896)Remeasurement - return on plan assets (409) (383) (346) (317)
At December 31 10,084 10,953 8,543 9,106
The carrying value of the plan assets of the BPI Group as at December 31, 2016 is equivalent to the fair value ofP10,084 million (2015 - P10,953 million). The carrying value of the plan assets of the Parent Bank as atDecember 31, 2016 is equivalent to the fair value of P8,543 million (2015 - P9,106 million).
The plan assets are comprised of the following:
Consolidated Parent
2016 2015 2016 2015
Amount % Amount % Amount % Amount %
(In Millions of Pesos Except for Rates)Debt securities 4,416 44 4,859 44 3,741 44 4,039 44Equity securities 4,461 44 4,857 44 3,779 44 4,038 44Others 1,207 12 1,237 12 1,023 12 1,029 12
10,084 100 10,953 100 8,543 100 9,106 100

(34)
Pension plan assets of the unified retirement plan include investment in BPI’s common shares with carryingamount of P160 million (2015 - P164 million) and fair value of P373 million at December 31, 2016(2015 - P362 million). Realized and unrealized gains coming from BPI’s common shares amount toP5 million and P213 million in 2016, respectively (2015 - P1,248 million and P197 million). The actual return onplan assets of the BPI Group was P112 million in 2016 (2015 - P85 million). An officer of the Parent Bank exercisesthe voting rights over the plan’s investment in BPI’s common shares.
The movement in the present value of defined benefit obligation is summarized as follows:
Consolidated Parent
2016 2015 2016 2015
(In Millions of Pesos)At January 1 11,991 11,541 9,849 9,498Transfers to defined contribution plan (659) - (535) -Current service cost 649 1,016 535 837Interest cost 597 492 493 405Past service cost - plan amendment (197) - (162)
Benefit payments (1,026) (1,208) (699) (896)Settlement loss 163 - 123 -Remeasurement - change in assumptions and experience
adjustment 434 150 301 5
At December 31 11,952 11,991 9,905 9,849
The BPI Group has no other transactions with the plan other than the contributions presented above for the yearsended December 31, 2016 and 2015.
(b) Expense recognized in the statement of income
Consolidated Parent
2016 2015 2014 2016 2015 2014
(In Millions of Pesos)Current service cost 649 1,016 759 535 837 621Net interest cost 76 23 67 53 17 49Settlement loss 163 - - 123 - -Past service cost (197) - - (162) - -
691 1,039 826 549 854 670
The principal assumptions used for the actuarial valuations of the unified plan of the BPI Group are as follows:
2016 2015
Discount rate 5.35% 4.98%Future salary increases 5.00% 5.00%
Assumptions regarding future mortality and disability experience are based on published statistics generally usedfor local actuarial valuation purposes.
The defined benefit plan typically exposes the BPI Group to a number of risks such as investment risk, interest raterisk and salary risk. The most significant of which relate to investment and interest rate risk. The present value ofthe defined benefit obligation is determined by discounting the estimated future cash outflows using interest ratesof government bonds that are denominated in the currency in which the benefits will be paid, and that have termsto maturity approximating the terms of the related pension liability. A decrease in government bond yields willincrease the defined benefit obligation although this will also be partially offset by an increase in the value of theplan’s fixed income holdings. Hence, the present value of defined benefit obligation is directly affected by thediscount rate to be applied by the BPI Group. However, the BPI Group believes that due to the long-term nature ofthe pension liability and the strength of the BPI Group itself, the mix of debt and equity securities holdings of theplan is an appropriate element of the BPI Group’s long term strategy to manage the plan efficiently.

(35)
The BPI Group ensures that the investment positions are managed within an asset-liability matching framework thathas been developed to achieve long-term investments that are in line with the obligations under the plan. The BPIGroup’s main objective is to match assets to the defined benefit obligation by investing primarily in long-term debtsecurities with maturities that match the benefit payments as they fall due. The asset-liability matching is beingmonitored on a regular basis and potential change in investment mix is being discussed with the trustor, as necessaryto better ensure the appropriate asset-liability matching.
The BPI Group contributes to the plan depending on the suggested funding contribution as calculated by anindependent actuary. The expected contribution for the year ending December 31, 2017 for the BPI Group and theParent Bank amounts to P583 million and P482 million, respectively. The weighted average duration of thedefined benefit obligation under the BPI unified retirement plan as at December 31, 2016 is 12 years(2015 - 13 years).
The projected maturity analysis of retirement benefit payments as at December 31 are as follows:
Consolidated
(In Millions of Pesos) 2016 2015
Less than a year 1,025 996Between 1 to 5 years 3,446 3,323Between 5 to 10 years 5,533 5,554Between 10 to 15 years 10,785 10,057Between 15 to 20 years 11,886 13,359Over 20 years 53,585 78,502
Parent
(In Millions of Pesos) 2016 2015
Less than a year 721 639Between 1 to 5 years 2,668 2,582Between 5 to 10 years 4,913 4,815Between 10 to 15 years 9,085 8,651Between 15 to 20 years 10,184 11,259Over 20 years 40,951 62,274
The sensitivity of the defined benefit obligation as at December 31 to changes in the weighted principalassumptions follows:
Consolidated
2016
Impact on defined benefit obligation
Change inassumption
Increase inassumption Decrease in assumption
Discount rate 0.5% Decrease by 1.00% Increase by 1.05%Salary growth rate 1.0% Increase by 1.77% Decrease by 1.63%
2015
Impact on defined benefit obligation
Change inassumption
Increase inassumption Decrease in assumption
Discount rate 0.5% Decrease by 1.28% Increase by 1.32%Salary growth rate 1.0% Increase by 2.24% Decrease by 2.14%

(36)
Parent
2016
Impact on defined benefit obligation
Change inassumption
Increase inassumption Decrease in assumption
Discount rate 0.5% Decrease by 0.99% Increase by 1.04%Salary growth rate 1.0% Increase by 1.74% Decrease by 1.61%
2015
Impact on defined benefit obligation
Change inassumption
Increase inassumption Decrease in assumption
Discount rate 0.5% Decrease by 1.29% Increase by 1.32%Salary growth rate 1.0% Increase by 2.24% Decrease by 2.14%
The above sensitivity analyses are based on a change in an assumption while holding all other assumptionsconstant. In practice, this is unlikely to occur, and changes in some of the assumptions may be correlated. Whencalculating the sensitivity of the defined benefit obligation to significant actuarial assumptions, the same method(present value of the defined benefit obligation calculated with the projected unit credit method at the end of thereporting period) has been applied as when calculating the retirement liability recognized within the statement ofcondition.
Defined contribution retirement plan subject to the requirements of RA No. 7641
December 31, 2016
Consolidated Parent
(In Millions of Pesos)Fair value of plan assets 660 536Present value of defined benefit obligation (235) (192)
425 344
Effect of asset ceiling 425 344
- -
The movements in the present value of the defined benefit obligation follow:
2016
Consolidated Parent
(In Millions of Pesos)At January 1 - -
Current service cost 64 53
Transfer to the Plan 659 535Remeasurement - change in assumptions and experience
adjustment (488) (396)
At December 31 235 192

(37)
The movements in the fair value of plan assets follow:
2016
Consolidated Parent
(In Millions of Pesos)At January 1 - -Contribution paid by employer 24 20
Transfer to the Plan 659 535
Remeasurement - return on plan assets (23) (19)
At December 31 660 536
Total expenses for the year ended December 31, 2016 under the defined contribution plan amount to P64 millionfor BPI Group and P53 million for the Parent Bank.
The major categories of plan assets as a percentage of the fair value of total plan assets as at December 31, 2016follow:
Consolidated Parent
(In Millions of Pesos Except for Rates)Amount Rate Amount Rate
Equity instruments 502 76 408 76
Debt instruments 75 11 61 11
Other assets 83 13 67 13
660 100 536 100
The asset allocation of the Plan is set and reviewed from time to time by the Plan trustees taking into account themembership profile, the liquidity requirements of the Plan and risk appetite of the Plan sponsor.
Contributions are determined based on the plan provisions. The expected contribution to the definedcontribution plan for the year ending December 31, 2017 for the BPI Group and the Parent Bank amounts to P113million and P90 million, respectively.
The weighted average duration of the defined contribution retirement plan for the BPI Group and Parent Bank is25 years.
Note 26 - Trust Assets
At December 31, 2016, the net asset value of trust and fund assets administered by the BPI Group amounts toP564 billion (2015 - P538 billion).
Government securities deposited by the BPI Group and the Parent Bank with the BSP in compliance with therequirements of the General Banking Act relative to the trust functions follow:
Consolidated Parent
2016 2015 2016 2015
(In Millions of Pesos)Government securities (included in Held-to-maturity
securities) 5,881 5,459 5,881 5,455

(38)
Note 27 - Related Party Transactions
In the normal course of business, the Parent Bank transacts with related parties consisting of its subsidiaries andassociates. Likewise, the BPI Group has transactions with Ayala Corporation (AC) and its subsidiaries (Ayala Group),where all transactions are dealt with on an arm's length basis. AC is a substantial stockholder of BPI as at reportingdate.
These transactions such as loans and advances, deposit arrangements, trading of government securities andcommercial papers, sale of assets, lease of bank premises, investment advisory/management, service arrangementsand advances for operating expenses are made in the normal banking activities and have terms and conditions thatare generally comparable to those offered to non-related parties or to similar transactions in the market.
The Parent Bank has a Board-level Related Party Transaction Committee that vets and endorses all significantrelated party transactions, including those involving DOSRI, for which the latter shall require final Board approval.The Committee consists of three directors, majority of whom are independent directors including the Chairman,and two non-voting members from management, namely, the Chief Audit Executive and the Chief ComplianceOfficer.
Significant related party transactions, which represent movements in the account balance, and outstanding balancesas at and for the years ended December 31 are summarized below (transactions with subsidiaries have beeneliminated in the consolidated financial statements):
Consolidated
2016
Transactionsfor the year
Outstandingbalances Terms and conditions
(In Millions of Pesos)Loans and advances from:
Subsidiaries 3 75 These are loans and advances grantedto related parties that are generallysecured with interest rates ranging from1.63% to 7.64% (including thosepertaining to foreigncurrency-denominated loans) and withmaturity periods ranging from 5 days to14 years. Additional information onDOSRI loans are discussed below.
Associates 45 45
AC (8,143) 5,965
Subsidiaries of AC 7,109 22,197
Key management personnel - -
Other related parties (552) 894
(1,538) 29,176
Deposits from:Subsidiaries 146 7,238 These are demand, savings and time
deposits bearing the following averageinterest rates:Demand - 0.23% to 0.27%Savings - 0.81%Time - 2.13% to 2.26%
Associates 135 848
Ayala Group 845 12,206Key management personnel (545) 1,340
581 21,632

(39)
2015
Transactionsfor the year
Outstandingbalances Terms and conditions
(In Millions of Pesos)Loans and advances from:
Subsidiaries 41 72 These are loans and advances grantedto related parties that are generallysecured with interest rates ranging from1.05% to 7.60% (including thosepertaining to foreigncurrency-denominated loans) and withmaturity periods ranging from 5 days to11 years. Additional information onDOSRI loans are discussed below.
Associates - -
AC (142) 14,108
Subsidiaries of AC 507 15,088
Key management personnel - -
Other related parties 583 1,446
989 30,714
Deposits from:Subsidiaries 1,066 7,092 These are demand, savings and time
deposits bearing the following averageinterest rates:Demand - 0.23% to 0.27%Savings - 0.81% to 0.82%Time - 2.00% to 2.11%
Associates (276) 713Ayala Group (20,030) 11,361Key management personnel (836) 1,885
(20,076) 21,051
2014
Transactionsfor the year
Outstandingbalances Terms and conditions
(In Millions of Pesos)Loans and advances from:
Subsidiaries (163) 31 These are loans and advances grantedto related parties that are generallysecured with interest rates ranging from0.99% to 5.49% (including thosepertaining to foreigncurrency-denominated loans) and withmaturity periods ranging from 23 daysto 10 years. Additional information onDOSRI loans are discussed below.
Associates - -
AC 8,000 14,250
Subsidiaries of AC (1,484) 14,581
Key management personnel - -
Other related parties 863 863
7,216 29,725
Deposits from:Subsidiaries (910) 6,026 These are demand, savings and time
deposits bearing the following averageinterest rates:Demand - 0.23% to 0.24%Savings - 0.83% to 0.86%Time - 1.70% to 1.76%
Associates 317 989Ayala Group 10,232 31,391Key management personnel 1,707 2,721
11,346 41,127

(40)
Parent
2016
Transactionsfor the year
Outstandingbalances Terms and conditions
(In Millions of Pesos)Loans and advances from:
Subsidiaries 3 75 These are loans and advances grantedto related parties that are generallysecured with interest rates ranging from1.63% to 7.64% (including thosepertaining to foreigncurrency-denominated loans) and withmaturity periods ranging from 5 days to14 years. Additional information onDOSRI loans are discussed below.
Associates 45 45
AC (8,143) 5,965
Subsidiaries of AC 7,109 22,197
Key management personnel - -
Other related parties (552) 894
(1,538) 29,176
Deposits from:Subsidiaries 141 7,145 These are demand, savings and time
deposits bearing the following averageinterest rates:Demand - 0.22% to 0.25%Savings - 0.76% to 0.77%Time - 1.43% to 1.48%
Associates 130 841
Ayala Group 1,231 11,980
Key management personnel (641) 1,132
861 21,098
2015
Transactionsfor the year
Outstandingbalances Terms and conditions
(In Millions of Pesos)Loans and advances from:
Subsidiaries 41 72 These are loans and advances grantedto related parties that are generallysecured with interest rates ranging from1.05% to 7.60% (including thosepertaining to foreigncurrency-denominated loans) and withmaturity periods ranging from 5 days to11 years. Additional information onDOSRI loans are discussed below.
Associates - -
AC (142) 14,108
Subsidiaries of AC 507 15,088
Key management personnel - -
Other related parties 583 1,446
989 30,714
Deposits from:Subsidiaries 1,059 7,004 These are demand, savings and time
deposits bearing the following averageinterest rates:Demand - 0.21% to 0.26%Savings - 0.75% to 0.76%Time - 1.35% to 1.48%
Associates (264) 711Ayala Group (19,696) 10,749Key management personnel (695) 1,773
(19,596) 20,237

(41)
2014
Transactionsfor the year
Outstandingbalances Terms and conditions
(In Millions of Pesos)Loans and advances from:
Subsidiaries (163) 31 These are loans and advances grantedto related parties that are generallysecured with interest rates ranging from0.99% to 5.49% (including thosepertaining to foreigncurrency-denominated loans) and withmaturity periods ranging from 23 daysto 10 years. Additional information onDOSRI loans are discussed below.
Associates - -
AC 8,000 14,250
Subsidiaries of AC (1,484) 14,581
Key management personnel - -
Other related parties 863 863
7,216 29,725
Deposits from:Subsidiaries 647 5,945 These are demand, savings and time
deposits bearing the following averageinterest rates:Demand - 0.21% to 0.23%Savings - 0.77% to 0.80%Time - 0.78% to 0.94%
Associates 303 975Ayala Group 9,286 30,445Key management personnel 1,454 2,468
11,690 39,833

(42)
The aggregate amounts included in the determination of income before income tax (prior to elimination) thatresulted from transactions with each class of related parties are as follows:
Consolidated
2016 2015 2014
(In Millions of Pesos)Interest income
Subsidiaries 43 4 10AC 169 474 384Subsidiaries of AC 621 493 495Other related parties 31 34 16
864 1,005 905
Other incomeSubsidiaries 946 923 817Associates 885 900 -AC 17 - 37Subsidiaries of AC 49 12 798
1,897 1,835 1,652
Interest expenseSubsidiaries 41 12 10Associates 8 2 2Ayala Group 74 38 118Key management personnel 15 17 20
138 69 150
Other expensesSubsidiaries 836 813 101Associates 36 - -AC 58 81 116Subsidiaries of AC 211 74 277
1,141 968 494
Retirement benefitsKey management personnel 44 42 58
Salaries, allowances and other short-term benefitsKey management personnel 749 602 673Directors’ remuneration 77 74 69

(43)
Parent
2016 2015 2014
(In Millions of Pesos)Interest income
Subsidiaries 2 1 1AC 169 474 384Subsidiaries of AC 621 493 495Other related parties 31 34 16
823 1,002 896
Other incomeSubsidiaries 893 820 708Associates 777 773 -Subsidiaries of AC - 1 729
1,670 1,594 1,437
Interest expenseSubsidiaries 39 12 9Associates 8 2 2Ayala Group 65 33 115Key management personnel 14 12 15
126 59 141
Other expensesSubsidiaries 21 80 45AC 50 63 116Subsidiaries of AC 209 74 51
280 217 212
Retirement benefitsKey management personnel 37 32 49
Salaries, allowances and other short-term benefitsKey management personnel 604 504 570Directors’ remuneration 67 64 61
Other income mainly consists of rental income and revenue from service arrangements with related parties. Also,in November 2014, an investment property was sold to a related party for P1.59 billion resulting in a gain ofP729 million.
Other expenses mainly consist of rental expenses and management fees.
Based on the objective assessment done on related party balances, provisions have been recognized againstreceivables from related parties, as deemed applicable.

(44)
Details of DOSRI loans are as follows:
Consolidated Parent
2016 2015 2016 2015
(In Millions of Pesos)Outstanding DOSRI loans 6,236 15,554 6,187 15,520
In percentages (%)
Consolidated Parent
2016 2015 2016 2015
% to total outstanding loans and advances 0.59 1.76 0.74 2.31% to total outstanding DOSRI loans
Unsecured DOSRI loans 29.60 12.12 29.80 12.14Past due DOSRI loans 0.04 0.01 0.04 0.01Non-performing DOSRI loans 0.02 - 0.02 -
At December 31, 2016 and 2015, the BPI Group is in full compliance with the General Banking Act and the BSPregulations on DOSRI loans.
Note 28 - Critical Accounting Estimates and Judgments
The BPI Group makes estimates and assumptions that affect the reported amounts of assets and liabilities. Estimatesand judgments are continually evaluated and are based on historical experience and other factors, includingexpectations of future events that are believed to be reasonable under the circumstances. It is reasonably possiblethat the outcomes within the next financial year could differ from assumptions made at reporting date and couldresult in the adjustment to the carrying amount of affected assets or liabilities.
A. Critical accounting estimates
(i) Impairment losses on loans and advances (Note 10)
The BPI Group reviews its loan portfolios to assess impairment on a regular basis. In determining whether animpairment loss should be recorded in profit or loss, the BPI Group makes judgments as to whether there is anyobservable data indicating that there is a measurable decrease in the estimated future cash flows from a portfolio ofloans before the decrease can be identified with an individual loan in that portfolio. This evidence may includeobservable data indicating that there has been an adverse change in the payment status of borrowers in a group, ornational or local economic conditions that correlate with defaults on assets in the group. Management uses estimatesbased on historical loss experience for loans with credit risk characteristics and objective evidence of impairmentsimilar to those in the portfolio when scheduling its future cash flows. The methodology and assumptions used forestimating both the amount and timing of future cash flows are reviewed regularly to reduce any differences betweenloss estimates and actual loss experience. To the extent that the net present value of estimated cash flows ofindividually impaired accounts and the estimated impairment for collectively assessed accounts differs by +/- 5%,impairment provision for the year ended December 31, 2016 would be an estimated P469 million(2015 - P431 million) higher or lower.
(ii) Fair value of derivatives and other financial instruments (Notes 6 and 29.4)
The fair values of financial instruments that are not quoted in active markets are determined by using generallyaccepted valuation techniques. Where valuation techniques (for example, discounted cash flow models) are used todetermine fair values, they are validated and periodically reviewed by qualified personnel independent of the area thatcreated them. Inputs used in these models are from observable data and quoted market prices in respect of similarfinancial instruments.
All models are approved by the Board of Directors before they are used, and models are calibrated to ensure thatoutputs reflect actual data and comparative market prices. Changes in assumptions about these factors could affectreported fair value of financial instruments. The BPI Group considers that it is impracticable to disclose withsufficient reliability the possible effects of sensitivities surrounding the fair value of financial instruments that are notquoted in active markets.

(45)
(iii) Pension liability on defined benefit plan (Note 25)
The BPI Group estimates its pension benefit obligation and expense for defined benefit pension plans based on theselection of certain assumptions used by actuaries in calculating such amounts. Those assumptions are describedin Note 25 and include, among others, the discount rate and future salary increases. The BPI Group determinesthe appropriate discount rate at the end of each year. This is the interest rate that should be used to determine thepresent value of estimated future cash outflows expected to be required to settle the retirement obligations. Thepresent value of the defined benefit obligations of the BPI Group at December 31, 2016 and 2015 are determinedusing the market yields on Philippine government bonds with terms consistent with the expected payments ofemployee benefits. Plan assets are invested in either equity securities, debt securities or other forms ofinvestments. Equity markets may experience volatility, which could affect the value of pension plan assets. Thisvolatility may make it difficult to estimate the long-term rate of return on plan assets. Actual results that differfrom the BPI Group’s assumptions are reflected as remeasurements in other comprehensive income. The BPIGroup’s assumptions are based on actual historical experience and external data regarding compensation anddiscount rate trends. The sensitivity analysis on key assumptions is disclosed in Note 25.
(iv) Valuation of assets held for sale
In determining the fair value of assets held for sale, the BPI Group analyzed the sales prices by applyingappropriate units of comparison, adjusted by differences between the subject asset or property and related marketdata. Should there be a subsequent write-down of the asset to fair value less cost to sell, such write-down isrecognized as impairment loss in the statement of income.
In 2016, the BPI Group has recognized reversal of impairment loss on its foreclosed assets amounting toP289 million as a result of improvement in fair market values of properties (2015 - reversal of impairment loss ofP308 million).
The BPI Group considers that it is impracticable to disclose with sufficient reliability the possible effects ofsensitivities surrounding the fair value of assets held for sale.
B. Critical accounting judgments
(i) Impairment of available-for-sale securities (Note 8)
The BPI Group follows the guidance of PAS 39 to determine when an available-for-sale security is impaired. Thisdetermination requires significant judgment. In making this judgment, the BPI Group evaluates, among otherfactors, the duration and extent to which the fair value of an investment is less than its cost; and the financial healthand near-term business outlook of the issuer, including factors such as industry and sector performance, changes intechnology and operational and financing cash flows.
(ii) Classification of held-to-maturity securities (Note 9)
The BPI Group follows the guidance of PAS 39 in classifying non-derivative financial assets with fixed ordeterminable payments and fixed maturity as held-to-maturity. This classification requires significant judgment. Inmaking this judgment, the BPI Group evaluates its intention and ability to hold such investments to maturity. If theBPI Group fails to keep these investments to maturity other than for the specific circumstances - for example sellingan insignificant amount close to maturity - it will be required to reclassify the entire class as available-for-sale. Theinvestments would therefore be measured at fair value and not at amortized cost.
(iii) Classification of assets held for sale
Management follows the principles in PFRS 5 in classifying certain foreclosed assets (consisting of real estate andauto or chattel) as assets held for sale when the carrying amount of the assets will be recovered principally throughsale. Management is committed to a plan to sell these foreclosed assets and the assets are actively marketed for saleat a price that is reasonable in relation to their current fair value.

(46)
(iv) Realization of deferred income tax assets (Note 14)
Management reviews at each reporting date the carrying amounts of deferred tax assets. The carrying amount ofdeferred tax assets is reduced to the extent that the related tax assets cannot be utilized due to insufficient taxableprofit against which the deferred tax losses will be applied. Management believes that sufficient taxable profit will begenerated to allow all or part of the deferred income tax assets to be utilized.
Note 29 - Financial Risk and Capital Management
Risk management in the BPI Group covers all perceived areas of risk exposure, even as it continuously endeavors toidentify and manage new and emerging risks. Capital management is understood to be a facet of risk management.
The primary objective of the BPI Group is the generation of recurring acceptable returns to shareholders’ capital. Tothis end, the BPI Group’s policies, business strategies and activities are directed towards the generation of cash flowsthat are in excess of its fiduciary and contractual obligations to its depositors, and to its various funders andstakeholders.
To generate acceptable returns to its shareholders’ capital, the BPI Group understands that it has to bear risk, andthat risk-taking is inherent in its business. Risk is understood by the BPI Group as the uncertainty in its futureincome - an uncertainty that emanates from the possibility of incurring losses that are due to unplanned andunexpected drops in revenues, increases in expenses, impairment of asset values, or increases in liabilities.
The possibility of incurring losses is, however, compensated by the possibility of earning more than expectedincome. Risk-taking is, therefore, not entirely negative to be avoided. Risk-taking actions present opportunities ifrisks are fully identified and accounted, deliberately taken, and are kept within prudent and rationalized limits.
Enterprise Risk Management Framework
BPI espouses a comprehensive risk management and capital management framework, which integrates themanagement of all its financial and non-financial risk exposures. The framework conforms not only to BPI’s ownrigorous standards, but also to BSP’s directives in promoting an effective Internal Capital Adequacy AssessmentProcess (ICAAP) and other risk management processes. The framework also ensures that BPI has adequate liquidityand capital to mitigate risks. The framework focuses on three key components consisting of:
Sound risk management governance; Effective processes, information systems, and controls; and Timely and reliable risk data.
The Board of Directors carries out its risk management function through the Risk Management Committee (RMC) ofthe Board. The RMC is tasked with nurturing a culture of risk management across the enterprise. The RMC sets therisk appetite; proposes and approves risk management policies, frameworks, and guidelines; and regularly reviewsrisk management structures, metrics, limits, and issues across the BPI Group, in order to meet and comply withregulatory and international standards on risk measurement and management.
At the management level, the Risk Management Office (RMO) is headed by the Chief Risk Officer (CRO). The CRO isultimately responsible in leading the formulation of risk management policies and methodologies in alignment withthe overall business strategy of BPI, ensuring that risks are prudently and rationally undertaken and within its riskappetite, as well as commensurate and disciplined to maximize returns on shareholders' capital. Risk management iscarried out by a dedicated team of skilled risk managers and senior officers who have extensive prior operationalexperience. BPI’s risk managers regularly monitor key risk indicators and report exposures against carefullyestablished financial and business risk metrics and limits approved by the RMC. Finally, independent reviews areregularly conducted by the Internal Audit group, regulatory examiners, and external auditors to ensure that riskcontrols and mitigants are in place and functioning effectively as intended.

(47)
The most important risks that the BPI Group manages are credit risk, liquidity risk, market risk and operational andinformation technology (IT) risks.
29.1 Credit risk
The BPI Group takes on exposure to credit risk, which is the risk that a counterparty will cause a financial loss to theBPI Group by failing to discharge an obligation. Significant changes in the economy, or in the prospects of aparticular industry segment that may represent a concentration in the BPI Group’s portfolio, could result in lossesthat are different from those provided for at the reporting date. Management therefore carefully manages its exposureto credit risk. Credit exposures arise principally in loans and advances, debt securities and other bills. There is alsocredit risk in off-balance sheet financial arrangements. The Credit Policy and Risk Management Division supportsthe Credit Committee in managing credit risk, and reports are regularly provided to the Board of Directors.
29.1.1 Credit risk management
(a) Loans and advances
In measuring credit risk of loans and advances at a counterparty level, the BPI Group considers three components:(i) the probability of default by the client or counterparty on its contractual obligations; (ii) current exposures tothe counterparty and its likely future development; and (iii) the likely recovery ratio on the defaulted obligations.In the evaluation process, the BPI Group also considers the conditions of the industry/sector to which thecounterparty is exposed, other existing exposures to the group where the counterparty may be related, as well asthe client and the BPI Group’s fallback position assuming the worst-case scenario. Outstanding and potentialcredit exposures are reviewed to likewise ensure that they conform to existing internal credit policies.
The BPI Group assesses the probability of default of individual counterparties using internal rating tools tailored tothe various categories of counterparty. The BPI Group has internal credit risk rating systems, designed forcorporate, small and medium-sized enterprises (SMEs), and retail accounts, that measure the borrower's creditrisk based on quantitative and qualitative factors. The ratings of individual exposures may subsequently migratebetween classes as the assessment of their probabilities of default changes. For retail, the consumer credit scoringsystem is a formula-based model for evaluating each credit application against a set of characteristics thatexperience has shown to be relevant in predicting repayment. The BPI Group regularly validates the performanceof the rating systems and their predictive power with regard to default events, and enhances them if necessary.The BPI Group's internal ratings are mapped to the following standard BSP classifications:
Unclassified - these are loans that do not have a greater-than-normal risk and do not possess thecharacteristics of loans classified below. The counterparty has the ability to satisfy the obligation in full andtherefore minimal loss, if any, is anticipated.
Loans especially mentioned - these are loans that have potential weaknesses that deserve management’s closeattention. These potential weaknesses, if left uncorrected, may affect the repayment of the loan and thusincrease the credit risk of the BPI Group.
Substandard - these are loans which appear to involve a substantial degree of risk to the BPI Group because ofunfavorable record or unsatisfactory characteristics. Further, these are loans with well-defined weaknesseswhich may include adverse trends or development of a financial, managerial, economic or political nature, or asignificant deterioration in collateral.
Doubtful - these are loans which have the weaknesses similar to those of the substandard classification withadded characteristics that existing facts, conditions, and values make collection or liquidation in full highlyimprobable and substantial loss is probable.
Loss - these are loans which are considered uncollectible and of such little value that their continuance asbankable assets is not warranted although the loans may have some recovery or salvage value.

(48)
(b) Debt securities and other bills
For debt securities and other bills, external ratings such as Standard & Poor’s, Moody’s and Fitch’s ratings or theirequivalents are used by the BPI Group for managing credit risk exposures. Investments in these securities andbills are viewed as a way to gain better credit quality mix and at the same time, maintain a readily available sourceto meet funding requirements.
29.1.2 Risk limit control and mitigation policies
The BPI Group manages, limits and controls concentrations of credit risk wherever they are identified - inparticular, to individual counterparties and groups, to industries and sovereigns.
The BPI Group structures the levels of credit risk it undertakes by placing limits on the amount of risk accepted inrelation to one borrower, or groups of borrowers, and to geographical and industry segments. Such risks aremonitored on a regular basis and subjected to annual or more frequent review, when considered necessary. Limitson large exposures and credit concentration are approved by the Board of Directors.
The exposure to any one borrower is further restricted by sub-limits covering on- and off-balance sheet exposures.Actual exposures against limits are monitored regularly.
Exposure to credit risk is also managed through regular analysis of the ability of existing and potential borrowersto meet interest and capital repayment obligations and by changing these lending limits where appropriate.
Settlement risk arises in any situation where a payment in cash, securities, foreign exchange currencies, or equities ismade in the expectation of a corresponding receipt in cash, securities, foreign exchange currencies, or equities. Dailysettlement limits are established for each counterparty to cover the aggregate of all settlement risk arising from theBPI Group’s market transactions on any single day. The introduction of the delivery versus payment facility in thelocal market has brought down settlement risk significantly.
The BPI Group employs a range of policies and practices to mitigate credit risk. Some of these specific control andmitigation measures are outlined below.
(a) Collateral
One of the most traditional and common practice in mitigating credit risk is requiring security particularly forloans and advances. The BPI Group implements guidelines on the acceptability of specific classes of collateral forcredit risk mitigation. The principal collateral types for loans and advances are:
Mortgages over real estate properties and chattels; and Hold-out on financial instruments such as debt securities deposits, and equities
In order to minimize credit loss, the BPI Group seeks additional collateral from the counterparty whenimpairment indicators are observed for the relevant individual loans and advances.
(b) Derivatives
The BPI Group maintains strict market limits on net open derivative positions (i.e., the difference betweenpurchase and sale contracts). Credit risk is limited to the net current fair value of instruments, which in relation toderivatives is only a small fraction of the contract, or notional values used to express the volume of instrumentsoutstanding. This credit risk exposure is managed as part of the overall lending limits with customers, togetherwith potential exposures from market movements. Collateral or other security is not usually obtained for creditrisk exposures on these instruments (except where the BPI Group requires margin deposits from counterparties).

(49)
(c) Master netting arrangements
The BPI Group further restricts its exposure to credit losses by entering into master netting arrangements withcounterparties with which it undertakes a significant volume of transactions. Master netting arrangements do notgenerally result in an offset of balance sheet assets and liabilities, as transactions are usually settled on a gross basis.However, the credit risk associated with favorable contracts (asset position) is reduced by a master nettingarrangement to the extent that if a default occurs, all amounts with the counterparty are terminated and settled on anet basis. The BPI Group’s overall exposure to credit risk on derivative instruments subject to master nettingarrangements can change substantially within a short period, as it is affected by each transaction subject to thearrangement.
(d) Credit-related commitments
The primary purpose of these instruments is to ensure that funds are available to a customer as required. Standbyletters of credit carry the same credit risk as loans. Documentary and commercial letters of credit - which are writtenundertakings by the BPI Group on behalf of a customer authorizing a third party to draw drafts on the BPI Group upto a stipulated amount under specific terms and conditions - are collateralized by the underlying shipments of goodsto which they relate and therefore carry less risk than a direct loan.
Commitments to extend credit represent unused portions of authorizations to extend credit in the form of loans, orletters of credit. With respect to credit risk on commitments to extend credit, the BPI Group is potentially exposed toloss in an amount equal to the total unused commitments. However, the likely amount of loss is less than the totalunused commitments, as most commitments to extend credit are contingent upon customers maintaining specificcredit standards. The BPI Group monitors the term to maturity of credit commitments because longer-termcommitments generally have a greater degree of credit risk than shorter-term commitments.
29.1.3 Impairment and provisioning policies
As described in Note 29.1.1, the BPI Group’s credit-quality mapping on loans and advances is based on the standardBSP loan classifications. Impairment provisions are recognized for financial reporting purposes based on objectiveevidence of impairment (Note 31.9).
The table below shows the percentage of the BPI Group’s loans and advances and the related allowance forimpairment.
Consolidated
2016 2015
Loans and
advances (%)
Allowance for
impairment (%)
Loans and
advances (%)
Allowance for
impairment (%)
Unclassified 98.31 0.90 98.12 0.91
Loans especially mentioned 0.24 5.01 0.20 5.03
Substandard 0.52 24.86 0.69 21.19
Doubtful 0.58 66.78 0.54 63.75
Loss 0.35 100.00 0.45 100.00
100.00 100.00
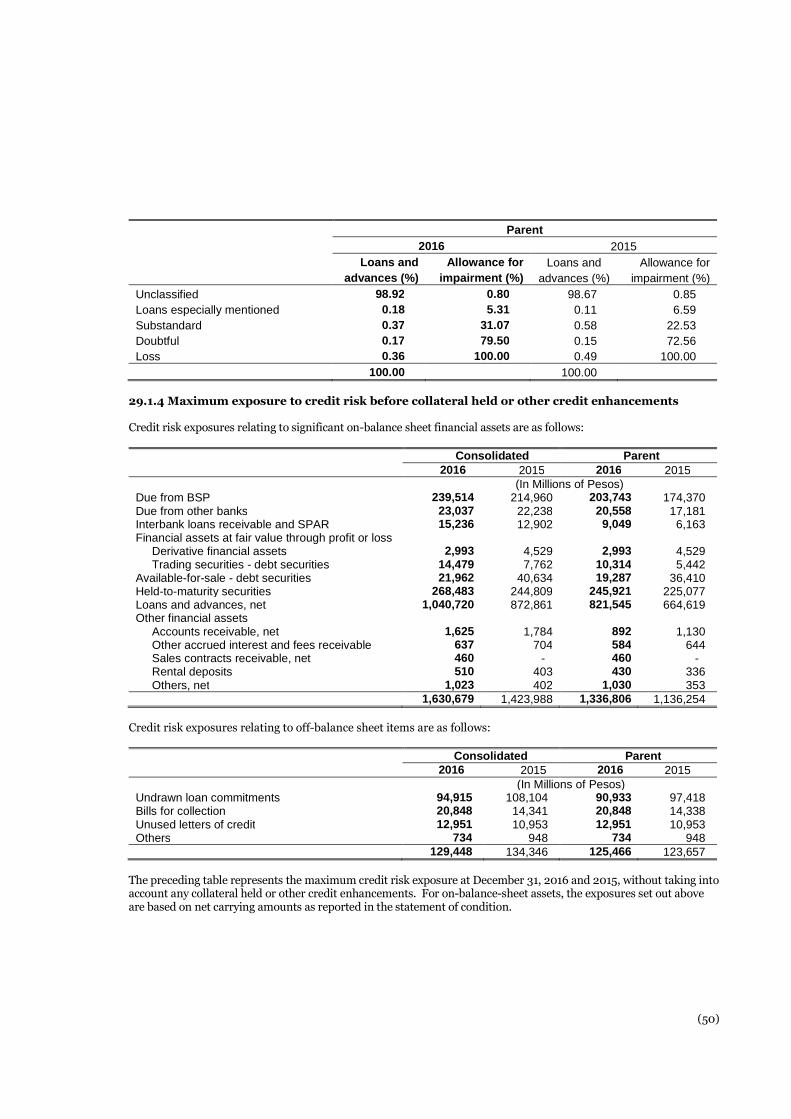
(50)
Parent
2016 2015
Loans and
advances (%)
Allowance for
impairment (%)
Loans and
advances (%)
Allowance for
impairment (%)
Unclassified 98.92 0.80 98.67 0.85
Loans especially mentioned 0.18 5.31 0.11 6.59
Substandard 0.37 31.07 0.58 22.53
Doubtful 0.17 79.50 0.15 72.56
Loss 0.36 100.00 0.49 100.00
100.00 100.00
29.1.4 Maximum exposure to credit risk before collateral held or other credit enhancements
Credit risk exposures relating to significant on-balance sheet financial assets are as follows:
Consolidated Parent
2016 2015 2016 2015
(In Millions of Pesos)Due from BSP 239,514 214,960 203,743 174,370Due from other banks 23,037 22,238 20,558 17,181Interbank loans receivable and SPAR 15,236 12,902 9,049 6,163Financial assets at fair value through profit or loss
Derivative financial assets 2,993 4,529 2,993 4,529Trading securities - debt securities 14,479 7,762 10,314 5,442
Available-for-sale - debt securities 21,962 40,634 19,287 36,410Held-to-maturity securities 268,483 244,809 245,921 225,077Loans and advances, net 1,040,720 872,861 821,545 664,619Other financial assets
Accounts receivable, net 1,625 1,784 892 1,130Other accrued interest and fees receivable 637 704 584 644Sales contracts receivable, net 460 - 460 -Rental deposits 510 403 430 336Others, net 1,023 402 1,030 353
1,630,679 1,423,988 1,336,806 1,136,254
Credit risk exposures relating to off-balance sheet items are as follows:
Consolidated Parent
2016 2015 2016 2015
(In Millions of Pesos)Undrawn loan commitments 94,915 108,104 90,933 97,418Bills for collection 20,848 14,341 20,848 14,338Unused letters of credit 12,951 10,953 12,951 10,953Others 734 948 734 948
129,448 134,346 125,466 123,657
The preceding table represents the maximum credit risk exposure at December 31, 2016 and 2015, without taking intoaccount any collateral held or other credit enhancements. For on-balance-sheet assets, the exposures set out aboveare based on net carrying amounts as reported in the statement of condition.

(51)
Management is confident in its ability to continue to control and sustain minimal exposure to credit risk of the BPIGroup resulting from its loan and advances portfolio based on the following:
98% of the loans and advances portfolio is considered to be neither past due nor impaired (2015 - 98%);
Mortgage loans are backed by collateral; and
The BPI Group continues to implement stringent selection process of granting loans and advances.
29.1.5 Credit quality of loans and advances
Loans and advances are summarized as follows:
Consolidated Parent
2016 2015 2016 2015
(In Millions of Pesos)Neither past due nor impaired 1,036,136 868,886 820,722 663,514Past due but not impaired 5,301 3,530 3,524 2,824Impaired 17,959 16,807 9,027 8,905
1,059,396 889,223 833,273 675,243Allowance for impairment (18,676) (16,362) (11,728) (10,624)
1,040,720 872,861 821,545 664,619
Impaired category as shown in the table above includes loan accounts which are individually (Note 29.1.5c) andcollectively assessed for impairment.
The total consolidated gross impairment provision for loans and advances is P4,955 million (2015 - P4,099 million),of which P2,531 million (2015 - P649 million) represents provision for individually impaired loans and the remainingamount of P2,424 million (2015 - P3,450 million) represents the portfolio provision. Further information of theimpairment allowance for loans and advances is provided in Note 10.
When entering into new markets or new industries, the BPI Group focuses on corporate accounts and retailcustomers with good credit rating and customers providing sufficient collateral, where appropriate or necessary.
Collaterals held as security for Loans and advances are described in Note 10.
(a) Loans and advances neither past due nor impaired
Loans and advances that were neither past due nor impaired consist mainly of accounts with Unclassified rating andthose loan accounts in a portfolio to which an impairment has been allocated on a collective basis. Details of theseaccounts follow:
Consolidated Parent
2016 2015 2016 2015
(In Millions of Pesos)Corporate entities:
Large corporate customers 757,037 605,940 741,368 578,779Small and medium enterprises 78,289 87,902 42,433 51,725
Retail customers:Credit cards 33,638 29,987 32,914 29,501Real estate mortgages 112,349 96,484 17 24Auto loans 50,524 43,537 - -
Others 4,299 5,036 3,990 3,4851,036,136 868,886 820,722 663,514

(52)
(b) Loans and advances past due but not impaired
The table below presents the gross amount of loans and advances that were past due but not impaired classified bytype of borrowers. Collateralized past due loans are not considered impaired when the cash flows that may resultfrom foreclosure of the related collateral are higher than the carrying amount of the loans.
Consolidated
2016 2015
Largecorporatecustomers
Small andmedium
enterprisesRetail
customers Total
Largecorporatecustomers
Small andmedium
enterprisesRetail
customers Total
(In Millions of Pesos)Past due up to 30 days 293 243 2,325 2,861 134 157 1,716 2,007Past due 31 - 90 days 225 274 1,363 1,862 189 78 863 1,130Past due 91 - 180 days 232 159 110 501 34 85 - 119Over 180 days 60 14 3 77 104 120 50 274
810 690 3,801 5,301 461 440 2,629 3,530
Fair value of collateral 1,925 1,165
Parent
2016 2015
Largecorporatecustomers
Small andmedium
enterprisesRetail
customers Total
Largecorporatecustomers
Small andmedium
enterprisesRetail
customers Total
(In Millions of Pesos)Past due up to 30 days 226 46 1,923 2,195 42 54 1,683 1,779Past due 31 - 90 days 205 33 933 1,171 172 59 747 978Past due 91 - 180 days 89 66 - 155 25 13 - 38Over 180 days - 3 - 3 - 29 - 29
520 148 2,856 3,524 239 155 2,430 2,824
Fair value of collateral 527 208
(c) Loans and advances individually impaired
The breakdown of the gross amount of individually impaired loans and advances (included in Impaired category) byclass, along with the fair value of related collateral held by the BPI Group as security, are as follows:
Consolidated Parent
2016 2015 2016 2015
(In Millions of Pesos)Corporate entities:
Large corporate customers 4,594 4,182 4,385 3,746Small and medium enterprises 4,690 4,245 2,405 2,662
Retail customers:Credit cards 1,527 1,899 1,498 1,876Auto loans 2 3 - -
Others 378 318 259 220
11,191 10,647 8,547 8,504
Fair value of collateral 6,977 8,003 6,481 7,430

(53)
29.1.6 Credit quality of other financial assets
(a) Due from BSP
Due from BSP are considered fully performing. As at December 31, 2016, the account consists of clearing account andother deposit facilities amounting to P239,514 million (2015 - 214,960 million) for BPI Group and P203,743 million(2015 - P174,370 million) for the Parent Bank.
(b) Due from other banks
Due from other banks are considered fully performing at December 31, 2016 and 2015. The table below presents thecredit ratings of counterparty banks based on international and domestic credit assessment agencies.
Consolidated Parent
2016 2015 2016 2015
(In Millions of Pesos)AA- to AA+ 201 2,524 201 2,524A- to A+ 16,235 15,641 16,196 11,755Lower than A- 3,992 1,808 3,500 1,777Unrated 2,609 2,265 661 1,125
23,037 22,238 20,558 17,181
(c) Interbank loans receivable and securities purchased under agreement to resell
Interbank loans receivable are considered fully performing at December 31, 2016 and 2015. The table below presentsthe credit ratings of counterparty banks based on international and domestic credit assessment agencies.
Consolidated Parent
2016 2015 2016 2015
(In Millions of Pesos)A- to A+ 8,207 1,882 7,210 1,882Lower than A- 444 - - -Unrated 2,009 4,507 1,839 4,281
10,660 6,389 9,049 6,163
Securities purchased under agreements to resell includes reverse repurchase agreements amounting toP4,576 million and nil for the BPI Group and Parent Bank, respectively (2015 - P6,513 million and nil for the BPIGroup and Parent Bank, respectively), which are made with a sovereign counterparty and are considered fullyperforming.

(54)
(d) Derivative financial assets
The table below presents the ratings based on international and domestic credit assessment agencies ofcounterparties for derivative financial assets at December 31, 2016 and 2015 presented in the consolidated and parentfinancial statements.
Consolidated and Parent
2016 2015
(In Millions of Pesos)AA- to AA+ 231 1,217A- to A+ 1,976 2,904Lower than A- 701 91Unrated 85 317
2,993 4,529
(e) Debt securities, treasury bills and other government securities
The table below presents the ratings of debt securities, treasury bills and other government securities atDecember 31, 2016 and 2015 based on international and domestic credit assessment agencies:
Consolidated Parent
Tradingsecurities
Available-for-sale
Held-to-maturity Total
Tradingsecurities
Available-for-sale
Held-to-maturity Total
(In Millions of Pesos)AAA 4,074 2,270 4,371 10,715 - 2,018 4,045 6,063AA- to AA+ 2,002 7,778 10,105 19,885 2,002 7,684 9,889 19,575
A- to A+ 2,692 8,784 29,543 41,019 2,692 8,530 28,352 39,574
Lower than A- 5,711 1,230 223,330 230,271 5,620 1,055 202,557 209,232Unrated - 1,900 1,134 3,034 - - 1,078 1,078
At December 31, 2016 14,479 21,962 268,483 304,924 10,314 19,287 245,921 275,522
Consolidated Parent
Tradingsecurities
Available-for-sale
Held-to-maturity Total
Tradingsecurities
Available-for-sale
Held-to-maturity Total
(In Millions of Pesos)AAA 72 105 785 962 - - 785 785AA- to AA+ 6,814 27,186 4,831 38,831 4,698 26,518 3,979 35,195A- to A+ - 5,757 19,089 24,846 - 5,009 19,089 24,098Lower than A- 876 5,605 218,856 225,337 744 4,883 199,977 205,604Unrated - 1,981 1,248 3,229 - - 1,247 1,247
At December 31, 2015 7,762 40,634 244,809 293,205 5,442 36,410 225,077 266,929
(f) Other financial assets
The BPI Group’s other financial assets (shown under Other resources) at December 31, 2016 and 2015 consist mainlyof sales contracts receivable, accounts receivable, accrued interest and fees receivable from various unratedcounterparties with good credit standing.

(55)
29.1.7 Repossessed or foreclosed collaterals
The BPI Group acquires assets by taking possession of collaterals held as security for loans and advances.As at December 31, 2016, the BPI Group’s foreclosed collaterals have carrying amount of P3,667 million(2015 - P4,385 million). The related foreclosed collaterals have aggregate fair value of P9,753 million(2015 - P10,954 million). Foreclosed collaterals include real estate (land, building, and improvements), auto andchattel.
Repossessed properties are sold as soon as practicable and are classified as “Assets held for sale” in the statement ofcondition.
29.1.8 Concentrations of risks of financial assets with credit risk exposure
The BPI Group’s main credit exposure at their carrying amounts, as categorized by industry sectors follow:
Consolidated
Financial
institutions Consumer Manufacturing Real estate Others
Less -
allowance Total
(In Millions of Pesos)
Due from BSP 239,514 - - - - - 239,514
Due from other banks 23,037 - - - - - 23,037
Interbank loans receivable
and SPAR 15,236 - - - - - 15,236
Financial assets at fair
value through profit or loss
Derivative financial
assets 2,960 - 17 2 14 2,993
Trading securities -
debt securities 4,937 - 1 367 9,174 - 14,479
Available-for-sale - debt
securities 19,456 - 190 104 2,212 - 21,962
Held-to-maturity securities 54,610 68 3,226 502 210,077 - 268,483
Loans and advances, net 100,395 97,618 168,760 244,152 448,471 (18,676) 1,040,720
Other financial assets
Accounts receivable, net - - - - 2,433 (808) 1,625
Other accrued interest
and fees receivable - - - - 637 - 637
Sales contracts
receivable, net - - - - 465 (5) 460
Rental deposits - - - - 510 - 510
Others, net - - - - 1,106 (83) 1,023
At December 31, 2016 460,145 97,686 172,194 245,127 675,099 (19,572) 1,630,679

(56)
Financial
institutions Consumer Manufacturing Real estate Others
Less -
allowance Total
(In Millions of Pesos)
Due from BSP 214,960 - - - - - 214,960
Due from other banks 22,238 - - - - - 22,238
Interbank loans receivable
and SPAR 12,902 - - - - - 12,902
Financial assets at fair
value through profit or
loss
Derivative financial
assets 4,415 - 2 - 112 - 4,529
Trading securities -
debt securities 1 - 4 35 7,722 - 7,762
Available-for-sale - debt
securities 13,821 - - 105 26,708 - 40,634
Held-to-maturity securities 25,661 - 270 502 218,376 - 244,809
Loans and advances, net 106,226 88,612 166,926 194,484 332,975 (16,362) 872,861
Other financial assets
Accounts receivable, net - - - - 2,848 (1,064) 1,784
Other accrued interest
and fees receivable - - - - 704 - 704
Sales contracts
receivable, net - - - - 6 (6) -
Rental deposits - - - - 403 - 403
Others, net - - - - 499 (97) 402
At December 31, 2015 400,224 88,612 167,202 195,126 590,353 (17,529) 1,423,988

(57)
Parent
Financial
institutions Consumer Manufacturing Real estate Others
Less -
allowance Total
(In Millions of Pesos)
Due from BSP 203,743 - - - - - 203,743
Due from other banks 20,558 - - - - - 20,558
Interbank loans receivable
and SPAR 9,049 - - - - - 9,049
Financial assets at fair
value through profit or
loss
Derivative financial
assets 2,960 - 17 2 14 - 2,993
Trading securities -
debt securities 4,937 - - - 5,377 - 10,314
Available-for-sale - debt
securities 17,167 - 149 - 1,971 - 19,287
Held-to-maturity securities 52,232 - 3,226 502 189,961 - 245,921
Loans and advances, net 98,727 42,350 162,291 127,117 402,788 (11,728) 821,545
Other financial assets
Accounts receivable, net - - - - 1,509 (617) 892
Other accrued interest
and fees receivable - - - - 584 - 584
Sales contracts
receivable, net - - - - 465 (5) 460
Rental deposits - - - - 430 - 430
Others, net - - - - 1,106 (76) 1,030
At December 31, 2016 409,373 42,350 165,683 127,621 604,205 (12,426) 1,336,806

(58)
Financial
institutions Consumer Manufacturing Real estate Others
Less -
allowance Total
(In Millions of Pesos)
Due from BSP 174,370 - - - - - 174,370
Due from other banks 17,181 - - - - - 17,181
Interbank loans receivable
and SPAR 6,163 - - - - - 6,163
Financial assets at fair
value through profit or
loss
Derivative financial
assets 4,415 - 2 - 112 - 4,529
Trading securities -
debt securities - - - - 5,442 - 5,442
Available-for-sale - debt
securities 10,947 - - - 25,463 - 36,410
Held-to-maturity securities 23,711 - 270 502 200,594 - 225,077
Loans and advances, net 104,446 38,208 160,751 84,730 287,108 (10,624) 664,619
Other financial assets
Accounts receivable, net - - - - 1,983 (853) 1,130
Other accrued interest
and fees receivable - - - - 644 - 644
Sales contracts
receivable, net - - - - 6 (6) -
Rental deposits - - - - 336 - 336
Others, net - - - - 443 (90) 353
At December 31, 2015 341,233 38,208 161,023 85,232 522,131 (11,573) 1,136,254
Trading, available-for-sale and held-to-maturity securities under “Others” category include local and US treasurybills. Likewise, Loans and advances under the same category pertain to loans granted to individual and retailborrowers belonging to various industry sectors.
29.2 Market risk
The BPI Group is exposed to market risk - the risk that the fair value or future cash flows of a financial instrumentwill fluctuate because of changes in market prices. Market risk is managed by the RMO guided by policies andprocedures approved by the RMC and confirmed by the Executive Committee/Board of Directors.
Market risk management
Market risk management is incumbent on the Board of Directors through the RMC. Market risk management in BPIcovers managing exposures to trading risk, foreign exchange risk, counterparty credit risk, interest rate risk of thebanking book and liquidity risk. At the management level, the Bank’s market risk exposures are managed by theRMO, headed by the Bank’s CRO who reports directly to the RMC. In addition, Internal Audit is responsible for theindependent review of risk assessment measures and procedures and the control environment.
The BPI Group reviews and controls market risk exposures of both its trading and non-trading portfolios. Tradingportfolios include those positions arising from the BPI Group’s market-making transactions. Non-tradingportfolios primarily arise from the interest rate management of the BPI Group’s retail and commercial bankingassets and liabilities.

(59)
The BPI Group has exposures in interest rate swaps, currency swaps and structured notes as part of its trading andposition taking activities. Derivatives are also used to hedge open exposures to mitigate price risk inherent in thebank's portfolios.
Value-at-Risk (VaR) measurement is an integral part of the BPI Group’s market risk control system. This metricestimates, at 99% confidence level, the maximum loss that a trading portfolio may incur over a trading day. Thismetric indicates as well that there is 1% statistical probability that the trading portfolios’ actual loss would begreater than the computed VaR. In order to ensure model soundness, the VaR is periodically subject to modelvalidation and back testing. VaR is supplemented by other risk metrics and measurements that would providepreliminary signals to Treasury and to the management to assess the vulnerability of Bank’s positions. To controlthe risk, the RMC sets risk limits for trading portfolios which are consistent with the Bank’s goals, objectives, riskappetite, and strategies.
Stress tests indicate the potential losses that could arise in extreme conditions that would have detrimental effect tothe Bank’s positions. The Bank periodically performs stress testing (price risk and liquidity risk) to assess the Bank’scondition on assumed stress scenarios. Contingency plans are frequently reviewed to ensure the Bank’s preparednessin the event of real stress. Results of stress tests are reviewed by Senior Management and by the RMC.
The average daily VaR for the trading portfolios are as follows:
Consolidated Parent
2016 2015 2016 2015
(In Millions of Pesos)
Local fixed-income 66 171 60 150
Foreign fixed-income 61 118 40 102
Foreign exchange 51 70 17 42
Derivatives 71 54 71 54
Equity securities 30 42 - -
Mutual fund 3 4 - -
282 459 188 348

(60)
29.2.1 Foreign exchange risk
Foreign exchange risk is the risk that the fair value or future cash flows of financial instrument will fluctuate becauseof changes in foreign exchange rates. It arises on financial instruments that are denominated in a foreign currencyother than the functional currency which they are measured.
The BPI Group takes on exposure to the effects of fluctuations in the prevailing exchange rates on its foreign currencyfinancial position and cash flows. The table below summarizes the BPI Group’s exposure to more material foreigncurrency exchange rate risk at December 31, 2016 and 2015. Included in the table are the BPI Group’s financialinstruments at carrying amounts, categorized by currency.
Consolidated
USD JPY EUR GBP
Less -
allowance Total
(In Millions of Pesos)
As at December 31, 2016
Financial Assets
Cash and other cash items 2,566 103 157 29 - 2,855
Due from other banks 15,482 1,744 3,393 240 - 20,859
Interbank loans receivable and
SPAR 9,182 - - 524 - 9,706
Financial assets at fair value
through profit or loss
Derivative financial assets 2,002 - 70 101 - 2,173
Trading securities - debt
securities 8,945 - - - - 8,945
Available-for-sale securities - debt
securities 18,960 - - - - 18,960
Held-to-maturity securities 90,110 - - 741 - 90,851
Loans and advances, net 121,204 61 138 2,161 (622) 122,942
Others financial assets
Accounts receivable, net 81 - - 4 (16) 69
Other accrued interest and
fees receivable 334 - 14 66 - 414
Total financial assets 268,866 1,908 3,772 3,866 (638) 277,774
Financial Liabilities
Deposit liabilities 210,223 1,618 3,494 1,450 - 216,785
Derivative financial liabilities 1,944 - 50 116 - 2,110
Bills payable 54,301 - 26 - - 54,327
Due to BSP and other banks 268 - - - - 268
Manager’s checks and demand
drafts outstanding 133 - 13 3 - 149
Other financial liabilities
Accounts payable 92 - 2 - - 94
Total financial liabilities 266,961 1,618 3,585 1,569 - 273,733
Net on-balance sheet financial
position (in Philippine Peso) 1,905 290 187 2,297 (638) 4,041

(61)
USD JPY EUR GBP
Less -
allowance Total
(In Millions of Pesos)
As at December 31, 2015
Financial Assets
Cash and other cash items 1,912 102 119 22 - 2,155
Due from other banks 14,691 1,312 1,836 1,331 - 19,170
Interbank loans receivable and
SPAR 4,985 - - 323 - 5,308
Financial assets at fair value
through profit or loss
Derivative financial assets 2,783 - 41 37 - 2,861
Trading securities - debt
securities 7,534 - - - - 7,534
Available-for-sale securities - debt
securities 37,313 - 5 - - 37,318
Held-to-maturity securities 59,182 - 1,509 915 - 61,606
Loans and advances, net 91,311 340 310 31 (469) 91,523
Others financial assets
Accounts receivable, net 78 - 11 4 (15) 78
Other accrued interest and
fees receivable 246 - 97 43 - 386
Total financial assets 220,035 1,754 3,928 2,706 (484) 227,939
Financial Liabilities
Deposit liabilities 199,776 1,381 3,570 1,375 - 206,102
Derivative financial liabilities 1,820 - 39 40 - 1,899
Bills payable 13,889 - 41 - - 13,930
Due to BSP and other banks 224 - - - - 224
Manager’s checks and demand
drafts outstanding 21 - 12 1 - 34
Other financial liabilities
Accounts payable 119 - 12 1 - 132
Total financial liabilities 215,849 1,381 3,674 1,417 - 222,321
Net on-balance sheet financial
position (in Philippine Peso) 4,186 373 254 1,289 (484) 5,618

(62)
Parent
USD JPY EUR GBP
Less -
allowance Total
(In Millions of Pesos)
As at December 31, 2016
Financial Assets
Cash and other cash items 2,390 103 157 27 - 2,677
Due from other banks 13,836 1,744 3,387 152 - 19,119
Interbank loans receivable and
SPAR 7,210 - - - - 7,210
Financial assets at fair value
through profit or loss
Derivative financial assets 2,002 - 70 101 - 2,173
Trading securities - debt
securities 5,246 - - - - 5,246
Available-for-sale securities - debt
securities 18,840 - - - - 18,840
Held-to-maturity securities 80,318 - - - - 80,318
Loans and advances, net 121,179 61 115 2,142 (617) 122,880
Other financial assets
Accounts receivable, net 77 - - - (16) 61
Other accrued interest and
fees receivable 326 - 14 49 - 389
Total financial assets 251,424 1,908 3,743 2,471 (633) 258,913
Financial Liabilities
Deposit liabilities 195,466 1,618 3,494 1,183 - 201,761
Derivative financial liabilities 1,944 - 50 115 - 2,109
Bills payable 52,196 - - - - 52,196
Due to BSP and other banks 268 - - - - 268
Manager’s checks and demand
drafts outstanding 133 - 13 3 - 149
Other financial liabilities
Accounts payable 90 - 2 - - 92
Total financial liabilities 250,097 1,618 3,559 1,301 - 256,575
Net on-balance sheet financial
position (in Philippine Peso) 1,327 290 184 1,170 (633) 2,338

(63)
USD JPY EUR GBP
Less -
allowance Total
(In Millions of Pesos)
As at December 31, 2015
Financial Assets
Cash and other cash items 1,750 102 112 19 - 1,983
Due from other banks 10,367 1,309 1,672 1,047 - 14,395
Interbank loans receivable and
SPAR 4,252 - - - - 4,252
Financial assets at fair value
through profit or loss
Derivative financial assets 2,783 - 41 37 - 2,861
Trading securities - debt
securities 5,417 - - - - 5,417
Available-for-sale securities - debt
securities 35,768 - 5 - - 35,773
Held-to-maturity securities 52,200 - 1,509 - - 53,709
Loans and advances, net 91,063 340 223 1 (468) 91,159
Other financial assets
Accounts receivable, net 75 - - - (15) 60
Other accrued interest and
fees receivable 242 - 97 24 - 363
Total financial assets 203,917 1,751 3,659 1,128 (483) 209,972
Financial Liabilities
Deposit liabilities 185,462 1,381 3,376 1,064 - 191,283
Derivative financial liabilities 1,820 - 39 39 - 1,898
Bills payable 12,706 - - - - 12,706
Due to BSP and other banks 224 - - - - 224
Manager’s checks and demand
drafts outstanding 20 - 12 1 - 33
Other financial liabilities
Accounts payable 99 - 1 - - 100
Total financial liabilities 200,331 1,381 3,428 1,104 - 206,244
Net on-balance sheet financial
position (in Philippine Peso) 3,586 370 231 24 (483) 3,728
Presented below is a sensitivity analysis demonstrating the impact on the BPI Group’s and the Parent Bank’spre-tax income of reasonably possible change in the exchange rate between US Dollar and Philippine Peso. Thefluctuation rate is based on the historical movement of US Dollar year on year.
Year Change in currency
Effect on pre-tax income(In Millions of Pesos)
Consolidated Parent
2016 +/- 2.33% +/- 30 +/- 172015 +/- 2.38% +/- 94 +/- 80

(64)
29.2.2 Interest rate risk
Interest rate risk is the risk that the BPI Group will experience deterioration in its financial position brought about bymovements in the absolute level of interest rates. Interest rate risk in the banking book arises from the BPI Group’score banking activities. The main source of this type of interest rate risk is re-pricing risk, which reflects the fact thatthe BPI Group’s assets and liabilities have different maturities and are re-priced at different interest rates. The Bankemploys two methods to measure the potential impact of interest rate risk in Group’s financial positions - (i) one thatfocuses on the economic value of the banking book, and (ii) one that focuses on net interest earnings. The RMC setslimits on the two interest rate risk metrics which are monitored monthly by the Market Risk Division of the RMO.
First, the BPI Group employs the Balance Sheet Value-at-Risk (BSVaR) metric to measure the impact of interest ratemovements on the economic value of banking book. The BSVaR is founded on re-pricing gaps, or the differencebetween the amounts of rate-sensitive assets and the amounts of rate-sensitive liabilities. The BSVaR, therefore,estimates the “riskiness of the balance sheet” and compares the degree of risk taking activity in the banking booksfrom one period to the next. The BSVaR assumes a static balance sheet, i.e., there will be no new transactions movingforward and no portfolio rebalancing will be undertaken in response to future changes in market rates. Inconsideration of the static framework and the fact that incomes from the banking book is accrued rather thangenerated from marking-to-market, the probable loss that is estimated by the BSVaR is not realized in accountingincome.
The Bank sets limits for BPI Group and each legal entity based on estimated equity duration, assumed movement ofmarket rates (in basis points) and estimated equity value. As at December 31, the average BSVaR, computed on amonthly basis, for the banking or non-trading book are as follows:
Consolidated Parent
2016 2015 2016 2015
(In Millions of Pesos)BSVaR 3,142 2,315 2,695 1,923
The second re-pricing risk metric used by the Bank is Earnings-at-Risk (EaR). This metric measures the potentialdeterioration in the Bank’s net interest income due to changes in interest rates. The Bank’s earnings are affected whenmovements in borrowing and lending rates are not perfectly synchronized, which create a gap due to such mismatch.Based on the banking book positions as at particular valuation dates, the Group projects interest receivables out of itsassets, and interest payables on its liabilities, in the next 12 months. Net interest income - the difference betweeninterest receipts and payments - is projected in this exercise. BPI, on a group level, is positively gapped henceincrease in rates becomes beneficial to the Bank. As of December 31, 2016, the net interest income impact ofmovement in interest rates amounts to P293 million (2015 - P473 million).

(65)
The table below summarizes the BPI Group’s exposure to interest rate risk, categorized by the earlier of contractualrepricing or maturity dates.
Consolidated
Repricing
Up to 1 year
Over 1 up to
3 years Over 3 years
Non-
repricing Total
(In Millions of Pesos)
As at December 31, 2016
Financial Assets
Cash and other cash items - - - 35,692 35,692
Due from BSP - - - 239,514 239,514
Due from other banks - - - 23,037 23,037
Interbank loans receivable and SPAR - - - 15,236 15,236
Financial assets at fair value through
profit or loss
Derivative financial assets 1,574 627 792 - 2,993
Trading securities - debt securities - - - 14,479 14,479
Available-for-sale - debt securities 12,476 1,996 245 7,245 21,962
Held-to-maturity securities 1 - 1 268,481 268,483
Loans and advances, net 743,278 66,798 167,822 62,822 1,040,720
Other financial assets
Accounts receivable, net - - - 1,625 1,625
Other accrued interest and fees
receivable - - - 637 637
Sales contracts receivable, net - - - 460 460
Rental deposits - - - 510 510
Others, net - - - 1,023 1,023
Total financial assets 757,329 69,421 168,860 670,761 1,666,371
Financial Liabilities
Deposit liabilities 806,779 580,998 43,523 - 1,431,300
Derivative financial liabilities 1,985 319 808 - 3,112
Bills payable - 19,693 - 42,280 61,973
Due to BSP and other banks - - - 670 670
Manager’s checks and demand drafts
outstanding - - - 7,579 7,579
Other financial liabilities
Accounts payable - - - 4,875 4,875
Outstanding acceptances - - - 1,452 1,452
Deposits on lease contracts - - - 1,970 1,970
Dividends payable - - - 3,543 3,543
Others - - - 1,786 1,786
Total financial liabilities 808,764 601,010 44,331 64,155 1,518,260
Total interest gap (51,435) (531,589) 124,529 606,606 148,111

(66)
Repricing
Up to 1 year
Over 1 up to
3 years Over 3 years
Non-
repricing Total
(In Millions of Pesos)
As at December 31, 2015
Financial Assets
Cash and other cash items - - - 35,681 35,681
Due from BSP - - - 214,960 214,960
Due from other banks - - - 22,238 22,238
Interbank loans receivable and SPAR - - - 12,902 12,902
Financial assets at fair value through
profit or loss
Derivative financial assets 3,791 422 316 - 4,529
Trading securities - debt securities - - - 7,762 7,762
Available-for-sale - debt securities 4,497 - - 36,137 40,634
Held-to-maturity securities - 3 - 244,806 244,809
Loans and advances, net 612,854 74,234 126,292 59,481 872,861
Other financial assets
Accounts receivable, net - - - 1,784 1,784
Other accrued interest and fees
receivable - - - 704 704
Rental deposits - - - 403 403
Others, net - - - 402 402
Total financial assets 621,142 74,659 126,608 637,260 1,459,669
Financial Liabilities
Deposit liabilities 438,832 242,198 593,022 1,647 1,275,699
Derivative financial liabilities 2,601 364 251 - 3,216
Bills payable - - - 20,941 20,941
Due to BSP and other banks - - - 431 431
Manager’s checks and demand drafts
outstanding - - - 8,308 8,308
Other financial liabilities
Accounts payable - - - 4,483 4,483
Outstanding acceptances - - - 2,494 2,494
Deposits on lease contracts - - - 1,868 1,868
Dividends payable - - - 3,539 3,539
Others - - - 1,161 1,161
Total financial liabilities 441,433 242,562 593,273 44,872 1,322,140
Total interest gap 179,709 (167,903) (466,665) 592,388 137,529

(67)
Parent
Repricing
Up to 1 year
Over 1 up to
3 years Over 3 years
Non-
repricing Total
(In Millions of Pesos)
As at December 31, 2016
Financial Assets
Cash and other cash items - - - 34,855 34,855
Due from BSP - - - 203,743 203,743
Due from other banks - - - 20,558 20,558
Interbank loans receivable and SPAR - - - 9,049 9,049
Financial assets at fair value through
profit or loss
Derivative financial assets 1,574 627 792 - 2,993
Trading securities - debt securities - - - 10,314 10,314
Available-for-sale - debt securities 12,476 1,996 245 4,570 19,287
Held-to-maturity securities 1 - 1 245,919 245,921
Loans and advances, net 672,099 26,674 111,374 11,398 821,545
Other financial assets
Accounts receivable, net - - - 892 892
Other accrued interest and feesreceivable - - - 584 584
Sales contracts receivable, net - - - 460 460
Rental deposits - - - 430 430
Others, net - - - 1,030 1,030
Total financial assets 686,150 29,297 112,412 543,802 1,371,661
Financial Liabilities
Deposit liabilities 572,877 515,446 96,155 - 1,184,478
Derivative financial liabilities 1,985 319 808 - 3,112
Bills payable - 19,693 - 32,564 52,257
Due to BSP and other banks - - - 670 670
Manager’s checks and demand drafts
outstanding - - - 5,893 5,893
Other financial liabilities
Accounts payable - - - 3,325 3,325
Outstanding acceptances - - - 1,452 1,452
Dividends payable - - - 3,543 3,543
Others - - - 1,245 1,245
Total financial liabilities 574,862 535,458 96,963 48,692 1,255,975
Total interest gap 111,288 (506,161) 15,449 495,110 115,686

(68)
Repricing
Up to 1 year
Over 1 up to
3 years Over 3 years
Non-
repricing Total
(In Millions of Pesos)
As at December 31, 2015
Financial Assets
Cash and other cash items - - - 34,797 34,797
Due from BSP - - - 174,370 174,370
Due from other banks - - - 17,181 17,181
Interbank loans receivable and SPAR - - - 6,163 6,163
Financial assets at fair value through
profit or loss
Derivative financial assets 3,791 422 316 - 4,529
Trading securities - debt securities - - - 5,442 5,442
Available-for-sale - debt securities - 4,497 - 31,913 36,410
Held-to-maturity securities - 3 - 225,074 225,077
Loans and advances, net 534,063 38,152 78,033 14,371 664,619
Other financial assets
Accounts receivable, net - - - 1,130 1,130Other accrued interest and fees
receivable - - - 644 644
Rental deposits - - - 336 336
Others, net - - - 353 353
Total financial assets 537,854 43,074 78,349 511,774 1,171,051
Financial Liabilities
Deposit liabilities 551,682 394,382 87,321 - 1,033,385
Derivative financial liabilities 2,601 364 251 - 3,216
Bills payable - - - 12,826 12,826
Due to BSP and other banks - - - 431 431
Manager’s checks and demand drafts
outstanding - - - 6,693 6,693
Other financial liabilities
Accounts payable - - - 2,594 2,594
Outstanding acceptances - - - 2,494 2,494
Deposits on lease contracts - - - - -
Dividends payable - - - 3,539 3,539
Others - - - 1,043 1,043
Total financial liabilities 554,283 394,746 87,572 29,620 1,066,221
Total interest gap (16,429) (351,672) (9,223) 482,154 104,830

(69)
29.3 Liquidity risk
Liquidity risk is the risk that the BPI Group will be unable to meet its payment obligations associated with itsfinancial liabilities when they fall due and to replace funds when they are withdrawn. The consequence may be thefailure to meet obligations to repay depositors and fulfill commitments to lend.
The Bank’s liquidity profile is observed and monitored through its metric, the Minimum Cumulative Liquidity Gap(MCLG). The MCLG is the smallest net cumulative cash inflow (if positive) or the largest net cumulative cashoutflow (if negative) over the next three (3) months. The MCLG indicates the biggest funding requirement in theshort term and the degree of liquidity risk present in the current cash flow profile of the Bank. A red flag isimmediately raised and reported to management and the RMC when the MCLG level projected over the next 3months is about to breach the RMC-prescribed MCLG limit.
29.3.1 Liquidity risk management process
The BPI Group’s liquidity management process, as carried out within the BPI Group and monitored by the RMCincludes:
Day-to-day funding, managed by monitoring future cash flows to ensure that requirements can be met. Thisincludes replenishment of funds as they mature or as borrowed by customers;
Maintaining a portfolio of highly marketable assets that can easily be liquidated as protection against anyunforeseen interruption to cash flow;
Monitoring liquidity gaps against internal and regulatory requirements (Note 16); Managing the concentration and profile of debt maturities; and Performing periodic liquidity stress testing on the BPI Group’s liquidity position by assuming a faster rate of
withdrawals in its deposit base.
Monitoring and reporting take the form of cash flow measurement and projections for the next day, week andmonth as these are key periods for liquidity management. The starting point for these projections is an analysis ofthe contractual maturity of the financial liabilities (Notes 29.3.3 and 29.3.4) and the expected collection date of thefinancial assets.
The BPI Group also monitors unmatched medium-term assets, the level and type of undrawn lendingcommitments, the usage of overdraft facilities and the impact of contingent liabilities such as standby letters ofcredit.
29.3.2 Funding approach
Sources of liquidity are regularly reviewed by the BPI Group to maintain a wide diversification by currency,geography, counterparty, product and term.

(70)
29.3.3 Non-derivative cash flows
The table below presents the maturity profile of non-derivative financial instruments based on undiscounted cashflows, including interest, which the BPI Group uses to manage the inherent liquidity risk. The maturity analysis isbased on the remaining period from the end of the reporting period to the contractual maturity date or, if earlier,the expected date the financial asset will be realized or the financial liability will be settled.
Consolidated
Up to 1 year
Over 1 up to
3 years Over 3 years Total
(In Millions of Pesos)
As at December 31, 2016
Financial Assets
Cash and other cash items 35,692 - - 35,692
Due from BSP 239,539 - - 239,539
Due from other banks 23,037 - - 23,037
Interbank loans receivable and SPAR 14,833 238 371 15,442
Financial assets at fair value through
profit or loss
Trading securities - debt securities 13,615 532 864 15,011
Available-for-sale securities - debt
securities 15,393 4,094 3,339 22,826
Held-to-maturity securities 45,425 61,683 230,340 337,448
Loans and advances, net 501,878 106,506 475,347 1,083,731
Other financial assets
Accounts receivable, net 1,625 - - 1,625
Other accrued interest and fees
receivable 637 - - 637
Sales contracts receivable, net 460 - - 460
Rental deposits 510 - - 510
Others, net 1,023 - - 1,023
Total financial assets 893,667 173,053 710,261 1,776,981
Financial Liabilities
Deposit liabilities 480,124 234,072 734,648 1,448,844
Bills payable 35,306 28,372 - 63,678
Due to BSP and other banks 670 - - 670
Manager’s checks and demand drafts
outstanding 7,579 - - 7,579
Other financial liabilities
Accounts payable 4,875 - - 4,875
Outstanding acceptances 1,452 - - 1,452
Deposits on lease contracts 1,970 - - 1,970
Dividends payable 3,543 - - 3,543
Others 1,786 - - 1,786
Total financial liabilities 537,305 262,444 734,648 1,534,397
Total maturity gap 356,362 (89,391) (24,387) 242,584

(71)
Up to 1 year
Over 1 up to
3 years Over 3 years Total
(In Millions of Pesos)
As at December 31, 2015
Financial Assets
Cash and other cash items 35,681 - - 35,681
Due from BSP 214,976 - - 214,976
Due from other banks 22,238 - - 22,238
Interbank loans receivable and SPAR 12,526 61 636 13,223
Financial assets at fair value through
profit or loss
Trading securities - debt securities 2,266 316 5,991 8,573
Available-for-sale securities - debt
securities 24,691 6,763 9,059 40,513
Held-to-maturity securities 38,288 67,963 211,233 317,484
Loans and advances, net 497,093 147,604 353,432 998,129
Other financial assets
Accounts receivable, net 1,784 - - 1,784
Other accrued interest and fees
receivable 704 - - 704
Sales contracts receivable, net - - - -
Rental deposits 403 - - 403
Others, net 402 - - 402
Total financial assets 851,052 222,707 580,351 1,654,110
Financial Liabilities
Deposit liabilities 729,638 529,520 29,826 1,288,984
Bills payable 21,106 4,896 54 26,056
Due to BSP and other banks 431 - - 431
Manager’s checks and demand drafts
outstanding 8,308 - - 8,308
Other financial liabilities
Accounts payable 4,483 - - 4,483
Outstanding acceptances 2,494 - - 2,494
Deposits on lease contracts 1,868 - - 1,868
Dividends payable 3,539 - - 3,539
Others 1,161 - - 1,161
Total financial liabilities 773,028 534,416 29,880 1,337,324
Total maturity gap 78,024 (311,709) 550,471 316,786

(72)
Parent
Up to 1 year
Over 1 up to
3 years Over 3 years Total
(In Millions of Pesos)
As at December 31, 2016
Financial Assets
Cash and other cash items 34,855 - - 34,855
Due from BSP 203,747 - - 203,747
Due from other banks 20,558 - - 20,558
Interbank loans receivable and SPAR 8,785 223 181 9,189
Financial assets at fair value through
profit or loss
Trading securities - debt securities 9,870 46 858 10,774
Available-for-sale securities - debt
securities 13,141 3,735 3,241 20,117
Held-to-maturity securities 42,447 57,001 209,576 309,024
Loans and advances, net 444,691 70,089 342,750 857,530
Other financial assets, net
Accounts receivable, net 892 - - 892
Other accrued interest and fees
receivable 584 - - 584
Sales contracts receivable, net 460 - - 460
Rental deposits 430 - - 430
Others, net 1,030 - - 1,030
Total financial assets 781,490 131,094 556,606 1,469,190
Financial Liabilities
Deposit liabilities 377,784 196,485 624,237 1,198,506
Bills payable 25,615 28,131 - 53,746
Due to BSP and other banks 670 - - 670
Manager’s checks and demand drafts
outstanding 5,893 - - 5,893
Other financial liabilities
Accounts payable 3,325 - - 3,325
Outstanding acceptances 1,452 - - 1,452
Dividends payable 3,543 - - 3,543
Others 1,245 - - 1,245
Total financial liabilities 419,527 224,616 624,237 1,268,380
Total maturity gap 361,963 (93,522) (67,631) 200,810

(73)
Up to 1 year
Over 1 up to
3 years Over 3 years Total
(In Millions of Pesos)
As at December 31, 2015
Financial Assets
Cash and other cash items 34,797 - - 34,797
Due from BSP 174,370 - - 174,370
Due from other banks 17,181 - - 17,181
Interbank loans receivable and SPAR 5,949 44 417 6,410
Financial assets at fair value through
profit or loss
Trading securities - debt securities 136 236 5,821 6,193
Available-for-sale securities - debt
securities 23,838 6,372 7,799 38,009
Held-to-maturity securities 36,145 63,977 191,407 291,529
Loans and advances, net 420,353 63,065 210,711 694,129
Other financial assets, net
Accounts receivable, net 1,130 - - 1,130
Other accrued interest and fees
receivable 644 - - 644
Rental deposits 336 - - 336
Others, net 353 - - 353
Total financial assets 715,232 133,694 416,155 1,265,081
Financial Liabilities
Deposit liabilities 583,615 450,782 50 1,034,447
Bills payable 8,073 4,895 - 12,968
Due to BSP and other banks 431 - - 431
Manager’s checks and demand drafts
outstanding 6,693 - - 6,693
Other financial liabilities
Accounts payable 2,594 - - 2,594
Outstanding acceptances 2,494 - - 2,494
Dividends payable 3,539 - - 3,539
Others 1,043 - - 1,043
Total financial liabilities 608,482 455,677 50 1,064,209
Total maturity gap 106,750 (321,983) 416,105 200,872

(74)
29.3.4 Derivative cash flows
(a) Derivatives settled on a net basis
The BPI Group’s derivatives that are settled on a net basis consist of interest rate swaps, non-deliverable forwardsand non-deliverable swaps. The table below presents the contractual undiscounted cash flows of interest rateswaps based on the remaining period from December 31 to the contractual maturity dates that are subject tooffsetting, enforceable master netting arrangements and similar agreements.
Consolidated and Parent
Up to 1 year
Over 1 up to
3 years
Over 3
years Total
2016 (In Millions of Pesos)
Interest rate swap contracts - held for trading
- Inflow 254 372 797 1,423
- Outflow (210) (303) (808) (1,321)
- Net inflow (outflow) 44 69 (11) 102
Non-deliverable forwards and swaps - held for trading
- Inflow 988 - - 988
- Outflow (990) - - (990)
- Net outflow (2) - - (2)
Up to 1 year
Over 1 up to
3 years
Over 3
years Total
2015 (In Millions of Pesos)
Interest rate swap contracts - held for trading
- Inflow 689 397 319 1,405
- Outflow (691) (315) (254) (1,260)
- Net inflow (outflow) (2) 82 65 145
Non-deliverable forwards and swaps - held for trading
- Inflow 12,986 - - 12,986
- Outflow (12,699) - - (12,699)
- Net inflow 287 - - 287
(b) Derivatives settled on a gross basis
The BPI Group’s derivatives that are settled on a gross basis include foreign exchange derivatives mainly currencyforwards and currency swaps. The table below presents the contractual undiscounted cash flows of foreignexchange derivatives based on the remaining period from reporting date to the contractual maturity dates.

(75)
Consolidated and Parent
Up to 1 year
Over 1 up to
3 years
Over 3
years Total
(In Millions of Pesos)
Foreign exchange derivatives - held for trading
2016
- Inflow 120,012 4,130 - 124,142
- Outflow (120,469) (3,892) - (124,361)
- Net inflow (outflow) (457) 238 - (219)
2015
- Inflow 380,144 36,361 - 416,505
- Outflow (379,255) (36,369) - (415,624)
- Net inflow (outflow) 889 (8) - 881

(76)
29.4 Fair value of financial assets and liabilities
The table below summarizes the carrying amount and fair value of those significant financial assets and liabilitiesnot presented on the statement of condition at fair value at December 31.
Consolidated
Carrying amount Fair value
2016 2015 2016 2015
(In Millions of Pesos)
Financial assets
Cash and other cash items 35,692 35,681 35,692 35,681
Due from BSP 239,514 214,960 239,514 214,960
Due from other banks 23,037 22,238 23,037 22,238
Interbank loans receivable and SPAR 15,236 12,902 15,236 12,902
Held-to-maturity securities 268,483 244,809 261,742 248,866
Loans and advances, net 1,040,720 872,861 1,225,785 882,112
Other financial assets
Accounts receivable, net 1,625 1,784 1,625 1,784
Other accrued interest and fees receivable 637 704 637 704
Sales contracts receivable, net 460 - 460 -
Rental deposits 510 403 510 403
Others, net 1,023 402 1,023 402
Financial liabilities
Deposit liabilities 1,431,300 1,275,699 1,422,203 1,289,099
Bills payable 61,973 20,941 61,489 20,878
Due to BSP and other banks 670 431 670 431
Manager’s checks and demand drafts
outstanding 7,579 8,308 7,579 8,308
Other financial liabilities
Accounts payable 4,875 4,483 4,875 4,483
Outstanding acceptances 1,452 2,494 1,452 2,494
Deposits on lease contracts 1,970 1,868 1,970 1,868
Dividends payable 3,543 3,539 3,543 3,539
Others 1,786 1,161 1,786 1,161

(77)
Parent
Carrying amount Fair value
2016 2015 2016 2015
(In Millions of Pesos)
Financial assets
Cash and other cash items 34,855 34,797 34,855 34,797
Due from BSP 203,743 174,370 203,743 174,370
Due from other banks 20,558 17,181 20,558 17,181
Interbank loans receivable and SPAR 9,049 6,163 9,049 6,163
Held-to-maturity securities 245,921 225,077 238,906 228,684
Loans and advances, net 821,545 664,619 981,180 660,783
Other financial assets
Accounts receivable, net 892 1,130 892 1,130
Other accrued interest and fees receivable 584 644 584 644
Sales contracts receivable, net 460 - 460 -
Rental deposits 430 336 430 336
Others, net 1,030 353 1,030 353
Financial liabilities
Deposit liabilities 1,184,478 1,033,385 1,173,276 1,030,986
Bills payable 52,257 12,826 51,772 12,763
Due to BSP and other banks 670 431 670 431
Manager’s checks and demand drafts
outstanding 5,893 6,693 5,893 6,693
Other financial liabilities
Accounts payable 3,325 2,594 3,325 2,594
Outstanding acceptances 1,452 2,494 1,452 2,494
Dividends payable 3,543 3,539 3,543 3,539
Others 1,245 1,043 1,245 1,043
(i) Cash and other cash items, due from BSP and other banks and interbank loans receivable and SPAR
The fair value of floating rate placements and overnight deposits approximates their carrying amount. Theestimated fair value of fixed interest bearing deposits is based on discounted cash flows using prevailing money-market interest rates for debts with similar credit risk and remaining maturity. All of these financial assets have amaturity of one year, thus their fair values approximate their carrying amounts.
(ii) Investment securities
Fair value of held-to-maturity assets is based on market prices or broker/dealer price quotations. Where thisinformation is not available, fair value is estimated using quoted market prices for securities with similar credit,maturity and yield characteristics.
(iii) Loans and advances
The estimated fair value of loans and advances represents the discounted amount of estimated future cash flowsexpected to be received. Expected cash flows are discounted with the use of assumptions regarding appropriatecredit spread for the loan, derived from other market instruments.

(78)
(iv) Financial liabilities
The estimated fair value of deposits with no stated maturity, which includes non-interest-bearing deposits, is theamount repayable on demand.
The estimated fair value of fixed interest-bearing deposits and other borrowings not quoted in an active market isbased on discounted cash flows using market interest rates for new debts with similar remaining maturity.
(v) Other financial assets / liabilities
Carrying amounts of other financial assets / liabilities which have no definite repayment dates are assumed to betheir fair values.
29.5 Fair value hierarchy
The following table presents the fair value hierarchy of the BPI Group’s assets and liabilities at December 31:
Consolidated
Fair value
2016 Level 1 Level 2 Total
Recurring measurements (In Millions of Pesos)
Financial assetsFinancial assets at fair value through profit or loss
Derivative financial assets - 2,993 2,993
Trading securities
- Debt securities 9,411 5,068 14,479
- Equity securities 124 - 124Available-for-sale financial assets
- Debt securities 8,282 13,680 21,962
- Equity securities 1,991 266 2,257
19,808 22,007 41,815
Financial liabilities
Derivative financial liabilities - 3,112 3,112
Non-recurring measurements
Assets held for sale, net - 2,267 2,267

(79)
Fair value
2016 Level 1 Level 2 Total
Fair values disclosed (In Millions of Pesos)
Financial assets
Cash and other cash items - 35,692 35,692
Due from BSP - 239,514 239,514
Due from other banks - 23,037 23,037
Interbank loans receivable and SPAR - 15,236 15,236
Held-to-maturity securities 258,266 3,476 261,742
Loans and advances, net - 1,225,785 1,225,785
Other financial assets
Accounts receivable, net - 1,625 1,625
Other accrued interest and fees receivable - 637 637
Sales contracts receivable, net - 460 460
Rental deposits - 510 510
Others, net - 1,023 1,023
Financial liabilities
Deposit liabilities - 1,422,203 1,422,203
Bills payable - 61,489 61,489
Due to BSP and other banks - 670 670
Manager’s checks and demand drafts outstanding - 7,579 7,579
Other financial liabilities
Accounts payable - 4,875 4,875
Outstanding acceptances - 1,452 1,452
Deposits on lease contracts - 1,970 1,970
Dividends payable - 3,543 3,543
Others - 1,786 1,786
Non-financial assets
Investment properties - 3,090 3,090
Fair value
2015 Level 1 Level 2 Total
Recurring measurements (In Millions of Pesos)
Financial assetsFinancial assets at fair value through profit or loss
Derivative financial assets - 4,529 4,529
Trading securities
- Debt securities 7,690 72 7,762
- Equity securities 322 - 322Available-for-sale financial assets
- Debt securities 37,677 2,957 40,634- Equity securities 1,338 1 1,339
47,027 7,559 54,586
Financial liabilitiesDerivative financial liabilities - 3,216 3,216
Non-recurring measurementsAssets held for sale, net - 2,762 2,762

(80)
Fair value
2015 Level 1 Level 2 Total
Fair values disclosed (In Millions of Pesos)
Financial assets
Cash and other cash items - 35,681 35,681
Due from BSP - 214,960 214,960
Due from other banks - 22,238 22,238
Interbank loans receivable and SPAR - 12,902 12,902
Held-to-maturity securities 248,087 779 248,866
Loans and advances, net - 882,112 882,112
Other financial assets
Accounts receivable, net - 1,784 1,784
Other accrued interest and fees receivable - 704 704
Sales contracts receivable, net - - -
Rental deposits - 403 403
Others, net - 402 402
Financial liabilities
Deposit liabilities - 1,289,099 1,289,099
Bills payable - 20,878 20,878
Due to BSP and other banks - 431 431
Manager’s checks and demand drafts outstanding - 8,308 8,308
Other financial liabilities
Accounts payable - 4,483 4,483
Outstanding acceptances - 2,494 2,494
Deposits on lease contracts - 1,868 1,868
Dividends payable - 3,539 3,539
Others - 1,161 1,161
Non-financial assets
Investment properties - 3,050 3,050
Parent
Fair value
2016 Level 1 Level 2 Total
Recurring measurements (In Millions of Pesos)Financial assets
Financial assets at fair value through profit or loss
Derivative financial assets - 2,993 2,993
Trading securities - debt securities 5,621 4,693 10,314
Available-for-sale financial assets- Debt securities 6,068 13,219 19,287
- Equity securities 248 - 248
11,937 20,905 32,842
Financial liabilities
Derivative financial liabilities - 3,112 3,112
Non-recurring measurements
Assets held for sale, net - 1,036 1,036

(81)
Fair value
2016 Level 1 Level 2 Total
Fair values disclosed (In Millions of Pesos)
Financial assets
Cash and other cash items - 34,855 34,855
Due from BSP - 203,743 203,743
Due from other banks - 20,558 20,558
Interbank loans receivable and SPAR - 9,049 9,049
Held-to-maturity securities 235,430 3,476 238,906
Loans and advances, net - 981,180 981,180
Other financial assets
Accounts receivable, net - 892 892
Other accrued interest and fees receivable - 584 584
Sales contracts receivable, net - 460 460
Rental deposits - 430 430
Others, net - 1,030 1,030
Financial liabilities
Deposit liabilities - 1,173,276 1,173,276
Bills payable - 51,772 51,772
Due to BSP and other banks - 670 670
Manager’s checks and demand drafts outstanding - 5,893 5,893
Other financial liabilities
Accounts payable - 3,325 3,325
Outstanding acceptances - 1,452 1,452
Dividends payable - 3,543 3,543
Others - 1,245 1,245
Non-financial assets
Investment properties - 3,090 3,090
Fair value
2015 Level 1 Level 2 Total
Recurring measurements (In Millions of Pesos)Financial assetsFinancial assets at fair value through profit or loss
Derivative financial assets - 4,529 4,529Trading securities - debt securities 5,442 - 5,442
Available-for-sale financial assets- Debt securities 35,942 468 36,410- Equity securities 215 - 215
41,599 4,997 46,596
Financial liabilities
Derivative financial liabilities - 3,216 3,216
Non-recurring measurements
Assets held for sale, net - 1,599 1,599

(82)
Fair value
2015 Level 1 Level 2 Total
Fair values disclosed (In Millions of Pesos)
Financial assets
Cash and other cash items - 34,797 34,797
Due from BSP - 174,370 174,370
Due from other banks - 17,181 17,181
Interbank loans receivable and SPAR - 6,163 6,163
Held-to-maturity securities 228,057 627 228,684
Loans and advances, net - 660,783 660,783
Other financial assets
Accounts receivable, net - 1,130 1,130
Other accrued interest and fees receivable - 644 644
Sales contracts receivable, net - - -
Rental deposits - 336 336
Others, net - 353 353
Financial liabilities
Deposit liabilities - 1,030,986 1,030,986
Bills payable - 12,763 12,763
Due to BSP and other banks - 431 431
Manager’s checks and demand drafts outstanding - 6,693 6,693
Other financial liabilities
Accounts payable - 2,594 2,594
Outstanding acceptances - 2,494 2,494
Deposits on lease contracts - - -
Dividends payable - 3,539 3,539
Others - 1,043 1,043
Non-financial assets
Investment properties - 3,050 3,050
The BPI Group has no financial instruments, other assets or liabilities with non-recurring fair value measurementsor with fair values disclosed that fall under the Level 3 category as at December 31, 2016 and 2015. There were notransfers between Level 1 and Level 2 during the years ended December 31, 2016 and 2015.
29.6 Insurance risk management
The non-life insurance entities decide on the retention, or the absolute amount that they are ready to assumeinsurance risk from one event. The retention amount is a function of capital, experience, actuarial study and riskappetite or aversion.
In excess of the retention, these entities arrange reinsurances either thru treaties or facultative placements. Theyalso accredit reinsurers based on certain criteria and set limits as to what can be reinsured. The reinsurancetreaties and the accreditation of reinsurers require Board of Directors’ approval.
29.7 Capital management
Cognizant of its exposure to risks, the BPI Group understands that it must maintain sufficient capital to absorbunexpected losses, to stay in business for the long haul, and to satisfy regulatory requirements. The BPI Groupfurther understands that its performance, as well as the performance of its various units, should be measured interms of returns generated vis-à-vis allocated capital and the amount of risk borne in the conduct of business.

(83)
The BPI Group manages its capital following the framework of Basel Committee on Banking SupervisionAccord II (Basel II) and its implementation in the Philippines by the BSP. The BSP through its Circular 538requires each bank and its financial affiliated subsidiaries to keep its Capital Adequacy Ratio (CAR) - the ratio ofqualified capital to risk-weighted exposures - to be no less than 10%. In quantifying its CAR, BPI currently uses theStandardized Approach (for credit risk and market risk) and the Basic Indicator Approach (for operational risk).Capital adequacy reports are filed with the BSP every quarter.
Qualifying capital and risk-weighted assets are computed based on BSP regulations. The qualifying capital of theParent Bank consists of core tier 1 capital and tier 2 capital. Tier 1 capital comprises paid-up capital stock, paid-insurplus, surplus including net income for the year, surplus reserves and minority interest less deductions such asdeferred income tax, unsecured credit accommodations to DOSRI, goodwill and net unrealized fair value losses onavailable-for-sale securities. Tier 2 capital includes general loan loss provisions for BSP reporting purposes.
The Basel II framework following BSP Circular 538 took into effect on July 1, 2007 and was relevant until 2013.
Effective January 1, 2014, the BSP, through its Circular 781, requires each bank and its financial affiliatedsubsidiaries to adopt new capital requirements in accordance with the provisions of Basel III. The new guidelinesare meant to strengthen the composition of the Bank's capital by increasing the level of core capital and regulatorycapital. The Circular sets out minimum Common Equity Tier 1 (CET1) ratio and Tier 1 Capital ratios of 6.0% and7.5%, respectively. A capital conservation buffer of 2.5%, comprised of CET1 capital, was likewise imposed. Theminimum required capital adequacy ratio remains at 10% which includes the capital conservation buffer.
In addition, existing capital requirements as at December 31, 2010 which do not meet the eligibility criteria forcapital instruments under the revised capital framework shall no longer be recognized as capital upon theeffectivity of Basel III.
The table below summarizes the CAR of the Bank (combined regular and FCDU books) under the Basel IIIframework for the years ended December 31, 2016 and 2015.
Consolidated Parent
2016 2015 2016 2015
(In Millions of Pesos)Tier 1 capital 160,901 146,181 160,549 145,769Tier 2 capital 10,299 8,659 8,722 7,076
Gross qualifying capital 171,200 154,840 169,271 152,845Less: Regulatory adjustments/required deductions 22,210 21,437 58,155 57,449
Total qualifying capital 148,990 133,403 111,116 95,396
Risk weighted assets 1,145,846 981,517 956,478 793,604CAR (%) 13.00 13.59 11.62 12.02CET1 (%) 12.10 12.71 10.71 11.13
The BPI Group has fully complied with the CAR requirement of the BSP.
Likewise, the BPI Group manages the capital of its non-life insurance subsidiaries, pre-need subsidiary and securitiesdealer subsidiaries in accordance with the capital requirements of the relevant regulatory agency, such as InsuranceCommission, Philippine SEC and PSE. These subsidiaries have fully complied with the relevant capital requirements.
As part of the reforms of the PSE to expand capital market and improve transparency among listed firms, PSErequires listed entities to maintain a minimum of ten percent (10%) of their issued and outstanding shares, exclusiveof any treasury shares, held by the public. The Parent Bank has fully complied with this requirement.

(84)
Note 30 - Commitments and Contingencies
At present, there are lawsuits, claims and tax assessments pending against the BPI Group. In the opinion ofmanagement, after reviewing all actions and proceedings and court decisions with legal counsels, the aggregateliability or loss, if any, arising therefrom will not have a material effect on the BPI Group’s financial position orfinancial performance.
BPI and some of its subsidiaries are defendants in legal actions arising from normal business activities. Managementbelieves that these actions are without merit or that the ultimate liability, if any, resulting from them will notmaterially affect the financial statements.
In the normal course of business, the BPI Group makes various commitments (Note 29.1.4) that are not presented inthe financial statements. The BPI Group does not anticipate any material losses from these commitments.
Note 31 - Summary of Significant Accounting Policies
The principal accounting policies applied in the preparation of these financial statements are set out below. Thesepolicies have been consistently applied to all the years presented, unless otherwise stated.
31.1 Basis of preparation
The financial statements of the BPI Group have been prepared in accordance with Philippine Financial ReportingStandards (PFRS). The term PFRS in general includes all applicable PFRS, Philippine Accounting Standards(PAS), and interpretations of the Philippine Interpretations Committee (PIC), Standing Interpretations Committee(SIC) and International Financial Reporting Interpretations Committee (IFRIC) which have been approved by theFinancial Reporting Standards Council (FRSC) and adopted by the SEC.
As allowed by the SEC, the pre-need subsidiary of the Parent Bank continues to follow the provisions of thePre-Need Uniform Chart of Accounts (PNUCA) prescribed by the SEC and adopted by the Insurance Commission.
The financial statements comprise the statement of condition, statement of income and statement of totalcomprehensive income shown as two statements, statement of changes in capital funds, statement of cash flowsand the notes.
These financial statements have been prepared under the historical cost convention, as modified by the revaluationof trading securities, available-for-sale financial assets and all derivative contracts.
The preparation of financial statements in conformity with PFRS requires the use of certain critical accountingestimates. It also requires management to exercise its judgment in the process of applying the BPI Group’saccounting policies. Changes in assumptions may have a significant impact on the financial statements in theperiod the assumptions changed. Management believes that the underlying assumptions are appropriate and thatthe financial statements therefore fairly present the financial position and results of the BPI Group. The areasinvolving a higher degree of judgment or complexity, or areas where assumptions and estimates are significant tothe financial statements are disclosed in Note 28.
31.2 Changes in accounting policy and disclosures
(a) New and amended standards adopted by the BPI Group
The following standards have been adopted by the BPI Group effective January 1, 2016:
Amendment to PFRS 5, ‘Non-current assets held for sale and discontinued operations’ on the methods ofdisposal. This amendment clarifies that when an asset (or disposal group) is reclassified from ‘held for sale’ to‘held for distribution’ or vice versa, this does not constitute a change to a plan of sale or distribution and doesnot have to be accounted for as such.

(85)
Amendments to PFRS 7, ‘Financial instruments: Disclosures’, (with consequential amendments toPFRS 1). This amendment provides specific guidance for transferred financial assets to help managementdetermine whether the terms of a servicing arrangement constitute ‘continuing involvement’ and, therefore,whether the asset qualifies for derecognition.
Amendments to PAS 19, ‘Employee benefits’. This amendment clarifies that that when determining thediscount rate for post-employment benefit obligations, it is the currency that the liabilities are denominated inthat is important and not the country where they arise.
Amendments to PAS 1, ‘Presentation of financial statements’ Disclosure initiative. The amendments provideclarifications on a number of issues, including (a) materiality - an entity should not aggregate or disaggregateinformation in a manner that obscures useful information. Where items are material, sufficient informationmust be provided to explain the impact on the financial position or performance. (b) Disaggregation andsubtotals - line items specified in PAS 1 may need to be disaggregated where this is relevant to anunderstanding of the entity’s financial position or performance. There is also new guidance on the use ofsubtotals. (c) Notes - confirmation that the notes do not need to be presented in a particular order. (d) othercomprehensive income (“OCI”) arising from investments accounted for under the equity method - the share ofOCI arising from equity-accounted investments is grouped based on whether the items will or will notsubsequently be reclassified to profit or loss. Each group should then be presented as a single line item in thestatement of other comprehensive income.
Amendments to PFRS 10, ‘Consolidated financial statements’, PFRS 12 ‘Disclosure of interests in otherentities’ and PAS 28, ‘Investments in associates and joint ventures’. The amendments provide clarificationthat the exception from preparing consolidated financial statements is also available to intermediate parententities which are subsidiaries of investment entities. An investment entity should consolidate a subsidiarywhich is not an investment entity and whose main purpose and activity is to provide services in support of theinvestment entity’s investment activities. Entities which are not investment entities but have an interest in anassociate or joint venture which is an investment entity have a policy choice when applying the equity methodof accounting. The fair value measurement applied by the investment entity associate or joint venture caneither be retained, or a consolidation may be performed at the level of the associate or joint venture, whichwould then unwind the fair value measurement.
Amendments to PAS 16, ‘Property, plant and equipment’ and PAS 38, ‘Intangible assets’. The amendmentsclarify that a revenue-based method of depreciation or amortization is generally not appropriate.
Amendments to PAS 27, ‘Separate financial statements’. The amendments will allow entities to use the equitymethod in their separate financial statements to measure investments in subsidiaries, joint ventures andassociates.
Other standards, amendments and interpretations which are effective for the financial year beginning onJanuary 1, 2016 are considered not relevant to the BPI Group.
(b) New standards, amendments and interpretations not yet adopted
A number of new standards and amendments to standards and interpretations are effective for annual periodsbeginning after January 1, 2016, and have not been applied in preparing these financial statements. None of thesestandards are expected to have a significant effect on the financial statements of the BPI Group, except thefollowing as set out below:
PFRS 9, ‘Financial instruments’ will replace the multiple classification and measurement models in PAS 39‘Financial instruments: Recognition and measurement’ with a single model that has initially only twoclassification categories: amortized cost and fair value. Classification of debt assets will be driven by theentity’s business model for managing the financial assets and the contractual cash flow characteristics of thefinancial assets. A debt instrument is measured at amortized cost if: a) the objective of the business model is tohold the financial asset for the collection of the contractual cash flows, and b) the contractual cash flows underthe instrument solely represent payments of principal and interest. All other debt and equity instruments,including investments in complex debt instruments and equity investments, must be recognized at fair value.

(86)
All fair value movements on financial assets are taken through the statement of income, except for equityinvestments that are not held for trading, which may be recorded in the statement of income or in reserves(without subsequent recycling to profit or loss). For financial liabilities that are measured under the fair valueoption entities will need to recognize the part of the fair value change that is due to changes in the their owncredit risk in other comprehensive income rather than profit or loss.
The new hedge accounting rules (released in December 2013) align hedge accounting more closely withcommon risk management practices. As a general rule, it will be easier to apply hedge accounting goingforward. The new standard also introduces expanded disclosure requirements and changes in presentation.
In July 2014, the Financial Accounting Standards Board (FASB) made further changes to the classification andmeasurement rules and also introduced a new impairment model. With these amendments, PFRS 9 is nowcomplete. The changes introduce a third measurement category (FVOCI) for certain financial assets that aredebt instruments and a new expected credit loss (ECL) model which involves a three-stage approach wherebyfinancial assets move through the three stages as their credit quality changes. The stage dictates how an entitymeasures impairment losses and applies the effective interest rate method. A simplified approach is permittedfor financial assets that do not have a significant financing component (e.g. trade receivables). On initialrecognition, entities will record a day-1 loss equal to the 12 month ECL (or lifetime ECL for trade receivables),unless the assets are considered credit impaired. For financial years commencing before February 1, 2015,entities can elect to apply PFRS 9 early for any of the following: (1) the own credit risk requirements forfinancial liabilities, (2) classification and measurement (C&M) requirements for financial assets, (3) C&Mrequirements for financial assets and financial liabilities, or (4) C&M requirements for financial assets andliabilities and hedge accounting. After February 1, 2015, the new rules must be adopted in their entirety. Thestandard is effective for accounting periods beginning on or after January 1, 2018. Early adoption is permitted.The PFRS 9 Implementation Project of the BPI Group, which will enable the BPI Group to quantify the impactof the new standard, including the Bank’s full transition plans and roadmap beginning January 1, 2018, iscurrently being collaborated upon by the Parent Bank’s designated PFRS 9 committee and working groups.
PFRS 15, ‘Revenue from contracts with customers’ will replace PAS 18, ‘Revenue’ which covers contracts forgoods and services and PAS 11, ‘Construction contracts’ which covers construction contracts. The newstandard is based on the principle that revenue is recognized when control of a good or service transfers to acustomer - so the notion of control replaces the existing notion of risks and rewards. A new five-step processmust be applied before revenue can be recognized: (1) identify contracts with customers, (2) identify theseparate performance obligation, (3) determine the transaction price of the contract, (4) allocate thetransaction price to each of the separate performance obligations, and (5) recognize the revenue as eachperformance obligation is satisfied. Key changes to current practice are: (1) Any bundled goods or services thatare distinct must be separately recognized, and any discounts or rebates on the contract price must generallybe allocated to the separate elements; (2) Revenue may be recognized earlier than under current standards ifthe consideration varies for any reasons (such as for incentives, rebates, performance fees, royalties, andsuccess of an outcome) - minimum amounts must be recognized if they are not at significant risk of reversal;(3) The point at which revenue is able to be recognized may shift: some revenue which is currently recognizedat a point in time at the end of a contract may have to be recognized over the contract term and vice versa; (4)There are new specific rules on licenses, warranties, non-refundable upfront fees and, consignmentarrangements, to name a few; and (5) As with any new standard, there are also increased disclosures. Theseaccounting changes may have flow-on effects on the entity’s business practices regarding systems, processesand controls, compensation and bonus plans, contracts, tax planning and investor communications. Thestandard is effective for annual periods beginning on or after January 1, 2018 and earlier application ispermitted. Entities will have a choice of full retrospective application, or prospective application withadditional disclosures. The BPI Group is currently assessing the impact of PFRS 15.

(87)
PFRS 16, ‘Leases’ will replace the current guidance in PAS 17, ‘Leases’. PFRS 16 will affect primarily theaccounting by lessees and will result in the recognition of almost all leases on balance sheet. The standardremoves the current distinction between operating and financing leases and requires recognition of an asset(the right to use the leased item) and a financial liability to pay rentals for virtually all lease contracts. Anoptional exemption exists for short-term and low-value leases. The income statement will also be affectedbecause the total expense is typically higher in the earlier years of a lease and lower in later years.Additionally, operating expense will be replaced with interest and depreciation, so key metrics like EBITDAwill change. Operating cash flows will be higher as cash payments for the principal portion of the lease liabilityare classified within financing activities. Only the part of the payments that reflects interest can continue to bepresented as operating cash flows. The accounting by lessors will not significantly change. Some differencesmay arise as a result of the new guidance on the definition of a lease. Under PFRS 16, a contract is, or contains,a lease if the contract conveys the right to control the use of an identified asset for a period of time in exchangefor consideration. The BPI Group is currently assessing the impact of PFRS 16.
Amendments to PAS 12, ‘Income taxes’. The amendments, which are effective January 1, 2017, clarify theaccounting for deferred tax where an asset is measured at fair value and that fair value is below the asset’s taxbase. Specifically, the amendments confirm that (a) a temporary difference exists whenever the carryingamount of an asset is less than its tax base at the end of the reporting period; (b) an entity can assume that itwill recover an amount higher than the carrying amount of an asset to estimate its future taxable profit; (c)where the tax law restricts the source of taxable profits against which particular types of deferred tax assetscan be recovered, the recoverability of the deferred tax assets can only be assessed in combination with otherdeferred tax assets of the same type; and (d) tax deductions resulting from the reversal of deferred tax assetsare excluded from the estimated future taxable profit. The amendments to the standard are not expected tohave a material impact on the financial statements of the BPI Group as currently there are no materialtemporary differences arising from assets measured at fair value.
Amendments to PAS 7, ‘Statement of cash flows’. Beginning January 1, 2017, entities will be required toexplain changes in their liabilities arising from financing activities. This includes changes arising from cashflows (e.g. drawdowns and repayments of borrowings) and non-cash changes such as acquisitions, disposals,accretion of interest and unrealized exchange differences. Changes in financial assets must be included in thisdisclosure if the cash flows were, or will be, included in cash flows from financing activities. This could be thecase, for example, for assets that hedge liabilities arising from financing liabilities. Entities may includechanges in other items as part of this disclosure, for example by providing a ‘net debt’ reconciliation. However,in this case the changes in the other items must be disclosed separately from the changes in liabilities arisingfrom financing activities. The information may be disclosed in tabular format as a reconciliation from openingand closing balances, but a specific format is not mandated. The adoption of the amendments to the standardwill result in additional disclosure on changes in liabilities arising from financing activities of the BPI Group.
There are no other standards, amendments or interpretations that are not yet effective that are expected to have amaterial impact on the financial statements of the BPI Group.

(88)
31.3 Consolidation
The consolidated financial statements comprise the financial statements of the BPI Group as atDecember 31, 2016 and 2015. The subsidiaries financial statements are prepared for the same reporting year as theParent Bank. The consolidated financial statements include the financial statements of the Parent Bank and thefollowing subsidiaries as at December 31:
SubsidiariesCountry of
incorporation Principal activities
% of ownership
2016 2015
BPI Family Savings Bank, Inc. Philippines Banking 100 100
BPI Capital Corporation Philippines Investment house 100 100
BPI Direct BanKO, Inc., A Savings Bank(formerly BPI Direct Savings Bank, Inc.) Philippines Banking 100 100
BPI Asset Management and TrustCorporation Philippines Trust 100 -
BPI International Finance Limited Hong Kong Financing 100 100
BPI Europe Plc. England and Wales Banking (deposit) 100 100
BPI Securities Corp. Philippines Securities dealer 100 100
BPI Card Finance Corp. Philippines Financing 100 100
Filinvest Algo Financial Corp. Philippines Financing 100 100
BPI Investment Management Inc. Philippines Investment management 100 100
Santiago Land Dev. Corp. Philippines Land holding 100 100
BPI Operations Management Corp. Philippines Operations management 100 100
BPI Computer Systems Corp. Philippines Business systems service 100 100
BPI Forex Corp. Philippines Foreign exchange 100 100
BPI Express Remittance Corp. USA USA Remittance 100 100
BPI Remittance Centre HK (Ltd) Hong Kong Remittance 100 100
Green Enterprises S. R. L. in Liquidation Italy Remittance 100 100
First Far - East Development Corporation Philippines Real estate 100 100
FEB Stock Brokers, Inc. Philippines Securities dealer 100 100
BPI Express Remittance Spain S.A Spain Remittance 100 100
FEB Speed International Philippines Remittance 100 100
AF Holdings & Management Corp. Philippines Financial managementconsultancy 100 100
Ayala Plans, Inc. Philippines Pre-need 98.67 98.67
FGU Insurance Corporation Philippines Non-life insurance 94.62 94.62
BPI Century Tokyo Lease and FinanceCorporation Philippines Leasing 51 51
BPI Century Tokyo Rental Corporation Philippines Rental 51 51
CityTrust Securities Corporation Philippines Securities dealer 51 51
BPI/MS Insurance Corporation Philippines Non-life insurance 50.85 50.85
BPI Globe BanKO Inc. Philippines Banking - 40
On August 30, 2016, the Parent Bank made an additional capital infusion to BPI Card Finance Corp. amounting toP290 million.
(89)
On September 20, 2016, the Bank acquired an additional 60% of the issued shares of BPI Globe BanKO, Inc. forP29 million. Immediately prior to the purchase, the carrying amount of the existing non-controlling interest wasP10 million. The BPI Group recognized a decrease in non-controlling interests of P10 million and a decrease inequity attributable to owners of the Parent Bank of P19 million. The effect on the equity attributable to the ownersof the Bank for the year ended December 31, 2016 is summarized as follows:
(In Millions of Pesos)
Consideration paid to non-controlling interests (29)Carrying amount of non-controlling interests acquired 10
Excess of consideration paid recognized in equity (19)
At Parent Bank, the excess of consideration paid recognized in the statement of income for the year endedDecember 31, 2016 amounts to P19 million.
On October 6, 2016, BPI Asset Management and Trust Corporation, with an initial paid-in capital of P600 million,was incorporated with the SEC as a wholly-owned subsidiary of the Parent Bank. The primary business purpose ofBPI Asset Management and Trust Corporation is to carry and engage in the business of trust, other fiduciaryactivities and investment management activities.
On December 29, 2016, the merger of BPI Direct Savings Bank, Inc. and BPI Globe BanKO, Inc. was approved bythe SEC with BPI Direct Savings Bank, Inc. as the surviving corporation. The surviving company's corporate namewas changed to BPI Direct BanKO, Inc. as a result of the merger transaction.
On December 23, 2014, BPI sold its 49% interest in BPI Leasing Corporation to Century Tokyo LeasingCorporation for a total consideration of P1,744 million, thereby bringing its remaining ownership interest down to51%. The BPI Group recognized an increase in non-controlling interest of P1,231 million and an increase in equityattributable to owners of the Parent Bank of P336 million. The name of BPI Leasing has also been changed to BPICentury Tokyo Lease and Finance Corporation as a consequence of the sale. In addition, the Parent Bank’seffective ownership in BPI Century Tokyo Rental Corporation and CityTrust Securities Corporation, bothwholly-owned subsidiaries of BPI Century Tokyo Lease and Finance Corporation, has been reduced to 51% each asat December 31, 2014.
The effect of change in the ownership interest in BPI Century Tokyo Lease and Finance Corporation on the equityattributable to owners of Parent Bank for the year ended December 31, 2014 is summarized as follows:
(In Millions of Pesos)
Consideration received from non-controlling interest 1,744Carrying amount of non-controlling interest sold, including related cost 1,408
Excess of consideration received recognized in equity 336
At Parent Bank, the gain from sale recognized in the statement of income for the year ended December 31, 2014amounts to P1,428 million.
(a) Subsidiaries
Subsidiaries are all entities over which the BPI Group has control. The BPI Group controls an entity when it isexposed to, or has rights to, variable returns from its involvement with the entity and has the ability to affect thosereturns through its power over the entity. The BPI Group also assesses existence of control where it does not havemore than 50% of the voting power but is able to govern the financial and operating policies by virtue of de-factocontrol. De-facto control may arise in circumstances where the size of the BPI Group’s voting rights relative to thesize and dispersion of holdings of other shareholders give the BPI Group the power to govern the financial andoperating policies.
Subsidiaries are fully consolidated from the date on which control is transferred to the BPI Group. They arede-consolidated from the date that control ceases.

(90)
The BPI Group applies the acquisition method of accounting to account for business combinations. Theconsideration transferred for the acquisition of a subsidiary is the fair values of the assets transferred, the liabilitiesincurred to the former owners of the acquiree and the equity interests issued by the BPI Group. The considerationtransferred includes the fair value of any asset or liability resulting from a contingent consideration arrangement.Acquisition-related costs are expensed as incurred. Identifiable assets acquired and liabilities and contingentliabilities assumed in a business combination are measured initially at their fair values at the acquisition date. Onan acquisition-by-acquisition basis, the BPI Group recognizes any non-controlling interest in the acquiree either atfair value or at the non-controlling interest’s proportionate share of the acquiree’s identifiable net assets.
Acquisition-related costs are expensed as incurred.
If the business combination is achieved in stages, the acquisition date carrying value of the acquirer’s previouslyheld equity interest in the acquiree is remeasured to fair value at the acquisition date through profit or loss.
Any contingent consideration to be transferred by the BPI Group is recognized at fair value at the acquisition date.Subsequent changes to the fair value of the contingent consideration that is deemed to be an asset or liability isrecognized in accordance with PAS 39 either in profit or loss or as a change to other comprehensive income.Contingent consideration that is classified as equity is not re-measured, and its subsequent settlement is notaccounted for within equity.
The excess of the aggregate of the consideration transferred, the amount of any non-controlling interest in theacquiree and the acquisition-date fair value of any previous equity interest in the acquiree over the fair value of theBPI Group’s share of the identifiable net assets acquired is recorded as goodwill. If the total of considerationtransferred, non-controlling interest recognized and previously held interest measured is less than the fair value ofthe net assets of the subsidiary acquired in the case of a bargain purchase, the difference is recognized directly inprofit or loss.
Inter-company transactions, balances and unrealized gains on transactions between group companies areeliminated. Unrealized losses are also eliminated. Accounting policies of subsidiaries have been changed wherenecessary to ensure consistency with the policies adopted by the BPI Group, except for the pre-need subsidiarywhich follows the provisions of the PNUCA as allowed by the SEC.
When the BPI Group ceases to have control, any retained interest in the entity is re-measured to its fair value at thedate when control is lost, with the change in carrying amount recognized in profit or loss. The fair value is theinitial carrying amount for purposes of subsequently accounting for the retained interest as an associate, jointventure or financial asset. In addition, any amounts previously recognized in other comprehensive income inrespect of that entity are accounted for as if the BPI Group had directly disposed of the related assets or liabilities.This may mean that amounts previously recognized in other comprehensive income are reclassified to profit orloss.
(b) Transactions with non-controlling interests
Transactions with non-controlling interests that do not result in loss of control are accounted for as equitytransactions - that is, as transactions with the owners in their capacity as owners. For purchases fromnon-controlling interests, the difference between any consideration paid and the relevant share acquired of thecarrying value of net assets of the subsidiary is recorded in equity. Gains or losses on disposals tonon-controlling interests are also recorded in equity.
Interests in the equity of subsidiaries not attributable to the Parent Bank are reported in consolidated equity asnon-controlling interests. Profits or losses attributable to non-controlling interests are reported in the statementof income as net income (loss) attributable to non-controlling interests.

(91)
(c) Associates
Associates are all entities over which the BPI Group has significant influence but not control, generallyaccompanying a shareholding of between 20% and 50% of the voting rights. Investments in associates in theconsolidated financial statements are accounted for using the equity method of accounting. Under the equitymethod, the investment is initially recognized at cost and the carrying amount is increased or decreased torecognize the investor’s share of the profit or loss of the investee after the date of acquisition. The BPI Group’sinvestment in associates includes goodwill identified on acquisition (net of any accumulated impairment loss).
If the ownership interest in an associate is reduced but significant influence is retained, a proportionate share ofthe amounts previously recognized in other comprehensive income is reclassified to profit or loss whereappropriate.
The BPI Group’s share of its associates’ post-acquisition profits or losses is recognized in profit or loss, and itsshare of post-acquisition movements in reserves is recognized in other comprehensive income. The cumulativepost-acquisition movements are adjusted against the carrying amount of the investment. When the BPI Group’sshare of losses in an associate equals or exceeds its interest in the associate, including any other unsecuredreceivables, the BPI Group does not recognize further losses, unless it has incurred legal or constructive obligationsor made payments on behalf of the associate.
The BPI Group determines at each reporting date whether there is any objective evidence that the investment inthe associate is impaired. If this is the case, the BPI Group calculates the amount of impairment as the differencebetween the recoverable amount of the associate and its carrying value and recognizes the amount adjacent to‘share of profit (loss) of an associate’ in profit or loss.
Unrealized gains on transactions between the BPI Group and its associates are eliminated to the extent of the BPIGroup’s interest in the associates. Unrealized losses are also eliminated unless the transaction provides evidenceof an impairment of the asset transferred. Accounting policies of associates have been changed where necessary toensure consistency with the policies adopted by the BPI Group.
31.4 Investments in subsidiaries and associates
Investments in subsidiaries and associates in the Parent Bank’s separate financial statements are accounted forusing the cost method in accordance with PAS 27. Under this method, income from investment is recognized inprofit or loss only to the extent that the investor receives distributions from accumulated profits of the investeearising after the acquisition date. Distributions received in excess of such profits are regarded as a recovery ofinvestment and are recognized as reduction of the cost of the investment.
The Parent Bank recognizes a dividend from a subsidiary or associate in profit or loss in its separate financialstatements when its right to receive the dividend is established.
The Parent Bank determines at each reporting date whether there is any indicator of impairment that theinvestment in the subsidiary or associate is impaired. If this is the case, the Parent Bank calculates the amount ofimpairment as the difference between the recoverable amount and carrying value and the difference is recognizedin profit or loss.
Investments in subsidiaries and associates are derecognized upon disposal or when no future economic benefitsare expected to be derived from the subsidiaries and associates at which time the cost and the related accumulatedimpairment loss are removed in the statement of condition. Any gains and losses on disposal is determined bycomparing the proceeds with the carrying amount of the investment and recognized in profit or loss.

(92)
31.5 Segment reporting
Operating segments are reported in a manner consistent with the internal reporting provided to the chief executiveofficer who allocates resources to, and assesses the performance of the operating segments of the BPI Group.
All transactions between business segments are conducted on an arm´s length basis, with intra-segment revenueand costs being eliminated upon consolidation. Income and expenses directly associated with each segment areincluded in determining business segment performance.
In accordance with PFRS 8, the BPI Group has the following main banking business segments: consumer banking,corporate banking and investment banking. Its insurance business is assessed separately from these bankingbusiness segments (Note 3).
31.6 Cash and cash equivalents
Cash and cash equivalents consist of Cash and other cash items, Due from BSP, Due from other banks, andInterbank loans receivable and securities purchased under agreements to resell with maturities of less than threemonths from the date of acquisition and that are subject to insignificant risk of changes in value.
31.7 Repurchase and reverse repurchase agreements
Securities sold subject to repurchase agreements (‘repos’) are reclassified in the financial statements as pledgedassets when the transferee has the right by contract or custom to sell or repledge the collateral; the counterpartyliability is included in deposits from banks or deposits from customers, as appropriate. The difference between saleand repurchase price is treated as interest and accrued over the life of the agreements using the effective interestmethod.
Securities purchased under agreements to resell (‘reverse repos’) are recorded as loans and advances to otherbanks and customers and included in the statement of condition under “Interbank loans receivable and securitiespurchased under agreements to resell”. Securities lent to counterparties are also retained in the financialstatements.
31.8 Financial assets
31.8.1 Classification
The BPI Group classifies its financial assets in the following categories: financial assets at fair value through profitor loss, loans and receivables, held-to-maturity securities and available-for-sale securities. The classificationdepends on the purpose for which the financial assets are acquired. Management determines the classification ofits financial assets at initial recognition.
(a) Financial assets at fair value through profit or loss
This category has two sub-categories: financial assets held for trading and those designated at fair value throughprofit or loss at inception.
A financial asset is classified as held for trading if it is acquired principally for the purpose of selling orrepurchasing it in the near term or if it is part of a portfolio of identified financial instruments that are managedtogether and for which there is evidence of a recent actual pattern of short-term profit-taking. Financial assetsheld for trading (other than derivatives) are shown as “Trading securities” in the statement of condition.
Derivatives are also categorized as held for trading unless they are designated as hedging instruments.
Financial assets designated at fair value through profit or loss at inception are those that are managed and theirperformance is evaluated on a fair value basis, in accordance with a documented investment strategy. Informationabout these financial assets is provided internally on a fair value basis to the BPI Group’s key managementpersonnel. The BPI Group has no financial assets that are specifically designated at fair value through profit orloss.

(93)
(b) Loans and receivables
Loans and receivables are non-derivative financial assets with fixed or determinable payments: (i) that are notquoted in an active market, (ii) with no intention of being traded, and (iii) that are not designated as available-for-sale. Significant accounts falling under this category include loans and advances, cash and other cash items, duefrom BSP and other banks, interbank loans receivable and securities purchased under agreements to resell andaccounts receivable included under other resources.
(c) Held-to-maturity securities
Held-to-maturity securities are non-derivative financial assets with fixed or determinable payments and fixedmaturities that the BPI Group’s management has the positive intention and ability to hold to maturity.
(d) Available-for-sale securities
Available-for-sale securities are non-derivative financial assets that are either designated in this category or notclassified in any of the other categories.
31.8.2 Recognition and measurement
(a) Initial recognition and measurement
Regular-way purchases and sales of financial assets at fair value through profit or loss, held-to-maturity securitiesand available-for-sale securities are recognized on trade date, the date on which the BPI Group commits topurchase or sell the asset. Loans and receivables are recognized upon origination when cash is advanced to theborrowers or when the right to receive payment is established. Financial assets not carried at fair value throughprofit or loss are initially recognized at fair value plus transaction costs. Financial assets carried at fair valuethrough profit or loss are initially recognized at fair value; and transaction costs are recognized in profit or loss.
(b) Subsequent measurement
Available-for-sale securities and financial assets at fair value through profit or loss are subsequently carried at fairvalue. Loans and receivables and held-to-maturity securities are subsequently carried at amortized cost.Amortized cost is the amount at which the financial instrument was recognized at initial recognition less anyprincipal repayments, plus accrued interest, and for financial assets less any write-down for incurred impairmentlosses. Accrued interest includes amortization of transaction costs deferred at initial recognition and of anypremium or discount to maturity amount using the effective interest method. Accrued interest income, includingboth accrued coupon and amortized discount or premium (including fees deferred at origination, if any), are notpresented separately and are included in the carrying values of the related items in the statement of condition.Gains and losses arising from changes in the fair value of financial assets at fair value through profit or loss areincluded in the statement of income (as “Trading gain/loss on securities”) in the year in which they arise. Changesin the fair value of monetary and non-monetary securities classified as available-for-sale are recognized directly inother comprehensive income, until the financial asset is derecognized or impaired at which time the cumulativefair value adjustments previously recognized in other comprehensive income should be recognized in profit or loss.However, interest is calculated on these securities using the effective interest method and foreign currency gainsand losses on monetary assets classified as available-for-sale are recognized in profit or loss. Dividends on equityinstruments are recognized in profit or loss when the BPI Group’s right to receive payment is established.

(94)
31.8.3 Reclassification
The BPI Group may choose to reclassify a non-derivative financial asset held for trading out of theheld-for-trading category if the financial asset is no longer held for the purpose of selling it in the near term.Financial assets other than loans and receivables are permitted to be reclassified out of the held-for-tradingcategory only in rare circumstances arising from a single event that is unusual and highly unlikely to recur in thenear term. In addition, the BPI Group may choose to reclassify financial assets that would meet the definition ofloans and receivables out of the held-for-trading or available-for-sale categories if the BPI Group has the intentionand ability to hold these financial assets for the foreseeable future or until maturity at the date of reclassification.
Reclassifications are made at fair value as of the reclassification date. Fair value becomes the new cost or amortizedcost as applicable, and no reversals of fair value gains or losses recorded before reclassification date aresubsequently made. Effective interest rates for financial assets reclassified to loans and receivables andheld-to-maturity categories are determined at the reclassification date. Further increases in estimates of cash flowsadjust effective interest rates prospectively.
Reclassification and sale of held-to-maturity securities other than an insignificant amount, would taint the entireportfolio and result in reclassification to available-for-sale category, except on sales and reclassifications that:
are so close to maturity that changes in market interests rates would not significantly affect fair value; occur after the entity has collected substantially all of the asset’s original principal; or are attributable to an isolated, non-recurring event that could not have been reasonably expected.
31.8.4 Derecognition
Financial assets are derecognized when the contractual rights to receive the cash flows from these assets haveceased to exist or the assets have been transferred and substantially all the risks and rewards of ownership of theassets are also transferred (that is, if substantially all the risks and rewards have not been transferred, the BPIGroup tests control to ensure that continuing involvement on the basis of any retained powers of control does notprevent derecognition).
31.9 Impairment of financial assets
(a) Assets carried at amortized cost
The BPI Group assesses at each reporting date whether there is objective evidence that a financial asset or group offinancial assets is impaired. A financial asset or a group of financial assets is impaired and impairment losses areincurred only if there is objective evidence of impairment as a result of one or more events that occurred after theinitial recognition of the asset (a ‘loss event’) and that loss event (or events) has an impact on the estimated futurecash flows of the financial asset or group of financial assets that can be reliably estimated.
The criteria that the BPI Group uses to determine that there is objective evidence of an impairment loss include:
Delinquency in contractual payments of principal or interest;
Cash flow difficulties experienced by the borrower;
Breach of loan covenants or conditions;
Initiation of bankruptcy proceedings;
Deterioration of the borrower’s competitive position; and
Deterioration in the value of collateral.
The BPI Group first assesses whether objective evidence of impairment exists individually for financial assets thatare individually significant, and collectively for financial assets that are not individually significant. If the BPIGroup determines that no objective evidence of impairment exists for an individually assessed financial asset,whether significant or not, it includes the asset in a group of financial assets with similar credit risk characteristicsand collectively assesses them for impairment. Financial assets that are individually assessed for impairment andfor which an impairment loss is or continues to be recognized are not included in a collective assessment ofimpairment.

(95)
The amount of impairment loss is measured as the difference between the asset’s carrying amount and the presentvalue of estimated future cash flows (excluding future credit losses that have not been incurred) discounted at thefinancial asset’s original effective interest rate (recoverable amount). The calculation of recoverable amount of acollateralized financial asset reflects the cash flows that may result from foreclosure less costs of obtaining andselling the collateral, whether or not foreclosure is probable. If a loan or held-to-maturity investment has avariable interest rate, the discount rate for measuring any impairment loss is the current effective interest ratedetermined under the contract. The carrying amount of the asset is reduced through the use of an allowanceaccount and the amount of loss is recognized in profit or loss.
For purposes of a collective evaluation of impairment, financial assets are grouped on the basis of similar creditrisk characteristics (i.e., on the basis of the BPI Group’s grading process that considers asset type, industry,geographical location, collateral type, past-due status and other relevant factors). Those characteristics arerelevant to the estimation of future cash flows for groups of such assets by being indicative of the debtors’ ability topay all amounts due according to the contractual terms of the assets being evaluated.
Future cash flows in a group of financial assets that are collectively evaluated for impairment are estimated on thebasis of the contractual cash flows of the assets in the BPI Group and historical loss experience for assets withcredit risk characteristics similar to those in the BPI Group. Historical loss experience is adjusted on the basis ofcurrent observable data to reflect the effects of current conditions that did not affect the period on which thehistorical loss experience is based and to remove the effects of conditions in the historical period that do notcurrently exist. The methodology and assumptions used for estimating future cash flows are reviewed regularly toreduce any differences between loss estimates and actual loss experience.
When a loan is uncollectible, it is written off against the related allowance for loan impairment. Such loans arewritten off after all the necessary procedures have been completed and the amount of loss has been determined.
If in a subsequent period, the amount of impairment loss decreases and the decrease can be related objectively toan event occurring after the impairment was recognized (such as an improvement in the debtor’s credit rating), thepreviously recognized impairment loss is reversed by adjusting the allowance account. Subsequent recoveries ofamounts previously written-off are credited to impairment loss in the statement of income.
(b) Assets classified as available-for-sale
The BPI Group assesses at each reporting date whether there is an objective evidence that a security classified asavailable-for-sale is impaired. For debt securities, the BPI Group uses the criteria mentioned in (a) above. For anequity security classified as available-for-sale, a significant or prolonged decline in the fair value below cost isconsidered in determining whether the securities are impaired. Generally, the BPI Group treats ‘significant’ as20% or more and ‘prolonged’ as greater than six months. The cumulative loss (difference between the acquisitioncost and the current fair value less any impairment loss on that financial asset previously recognized in profit orloss) is removed from other comprehensive income and recognized in profit or loss when the asset is determined tobe impaired. If in a subsequent period, the fair value of a debt instrument previously impaired increases and theincrease can be objectively related to an event occurring after the impairment loss was recognized, the impairmentloss is reversed through profit or loss. Reversal of impairment losses recognized previously on equity instrumentsis made directly to other comprehensive income.
(c) Renegotiated loans
Loans that are either subject to individual or collective impairment assessment and whose terms have beenrenegotiated are no longer considered to be past due but are treated as new loans.

(96)
31.10 Financial liabilities
31.10.1 Classification
The BPI Group classifies its financial liabilities in the following categories: financial liabilities at fair value throughprofit or loss and financial liabilities at amortized cost.
(a) Financial liabilities at fair value through profit or loss
This category comprises two sub-categories: financial liabilities classified as held for trading, and financialliabilities designated by the BPI Group as at fair value through profit or loss upon initial recognition.
A financial liability is classified as held for trading if it is acquired or incurred principally for the purpose of sellingor repurchasing it in the near term or if it is part of a portfolio of identified financial instruments that are managedtogether and for which there is evidence of a recent actual pattern of short-term profit-taking. Derivatives are alsocategorized as held for trading unless they are designated and effective as hedging instruments. Gains and lossesarising from changes in fair value of financial liabilities classified as held for trading are included in the statementof income and are reported as “Trading gains/losses”. The BPI Group has no financial liabilities that aredesignated at fair value through profit loss.
(b) Other liabilities measured at amortized cost
Financial liabilities that are not classified as at fair value through profit or loss fall into this category and aremeasured at amortized cost. Financial liabilities measured at amortized cost include deposits from customers andbanks, bills payable, amounts due to BSP and other banks, manager’s checks and demand drafts outstanding,subordinated notes and other financial liabilities under deferred credits and other liabilities.
31.10.2 Recognition and measurement
(a) Initial recognition and measurement
Financial liabilities not carried at fair value through profit or loss are initially recognized at fair value plustransaction costs. Financial liabilities carried at fair value through profit or loss are initially recognized at fairvalue; and transaction costs are recognized as expense in profit or loss.
(b) Subsequent measurement
Financial liabilities at fair value through profit or loss are subsequently carried at fair value. Other liabilities aremeasured at amortized cost using the effective interest method.
31.10.3 Derecognition
Financial liabilities are derecognized when they have been redeemed or otherwise extinguished (i.e. when theobligation is discharged or is cancelled or has expired). Collateral (shares and bonds) furnished by the BPI Groupunder standard repurchase agreements and securities lending and borrowing transactions is not derecognizedbecause the BPI Group retains substantially all the risks and rewards on the basis of the predetermined repurchaseprice, and the criteria for derecognition are therefore not met.
31.11 Fair value measurement
Fair value is the price that would be received to sell an asset or paid to transfer a liability in an orderly transactionbetween market participants at the measurement date.
The fair value of a non-financial asset is measured based on its highest and best use. The asset’s current use ispresumed to be its highest and best use.
(97)
The fair value of financial and non-financial liabilities takes into account non-performance risk, which is the riskthat the entity will not fulfill an obligation.
The BPI Group classifies its fair value measurements using a fair value hierarchy that reflects the significance ofthe inputs used in making the measurements. The fair value hierarchy has the following levels:
Level 1 - Quoted prices (unadjusted) in active markets for identical assets or liabilities. This level includeslisted equity securities and debt instruments on exchanges (for example, Philippine Stock Exchange, Inc.,Philippine Dealing and Exchange Corp., etc.).
Level 2 - Inputs other than quoted prices included within Level 1 that are observable for the asset or liability,either directly (that is, as prices) or indirectly (that is, derived from prices). This level includes the majority ofthe over-the-counter (“OTC”) derivative contracts. The primary source of input parameters like LIBOR yieldcurve or counterparty credit risk is Bloomberg.
Level 3 - Inputs for the asset or liability that are not based on observable market data (unobservable inputs).This level includes equity investments and debt instruments with significant unobservable components. Thishierarchy requires the use of observable market data when available. The BPI Group considers relevant andobservable market prices in its valuations where possible. The BPI Group has no assets or liabilities classifiedunder Level 3 as at December 31, 2016 and 2015.
The appropriate level is determined on the basis of the lowest level input that is significant to the fair valuemeasurement.
(a) Financial instruments
For financial instruments traded in active markets, the determination of fair values of financial assets and financialliabilities is based on quoted market prices or dealer price quotations. This includes listed equity securities andquoted debt instruments on major exchanges and broker quotes mainly from Bloomberg.
A financial instrument is regarded as quoted in an active market if quoted prices are readily and regularly availablefrom an exchange, dealer, broker, industry group, pricing service or regulatory agency, and those prices representactual and regularly occurring market transactions on an arm’s length basis. If the above criteria are not met, themarket is regarded as being inactive. Indications that a market is inactive are when there is a wide bid-offer spreador significant increase in the bid-offer spread or there are few recent transactions.
For all other financial instruments, fair value is determined using valuation techniques. In these techniques, fairvalues are estimated from observable data in respect of similar financial instruments, using models to estimate thepresent value of expected future cash flows or other valuation techniques, using inputs (for example, LIBOR yieldcurve, FX rates, volatilities and counterparty spreads) existing at reporting dates. The BPI Group uses widelyrecognized valuation models for determining fair values of non-standardized financial instruments of lowercomplexity, such as options or interest rate and currency swaps. For these financial instruments, inputs intomodels are generally market observable.
For more complex instruments, the BPI Group uses internally developed models, which are usually based onvaluation methods and techniques generally recognized as standard within the industry. Valuation models areused primarily to value derivatives transacted in the OTC market, unlisted debt securities (including those withembedded derivatives) and other debt instruments for which markets were or have become illiquid. Some of theinputs to these models may not be market observable and are therefore estimated based on assumptions.
The fair value of OTC derivatives is determined using valuation methods that are commonly accepted in thefinancial markets, such as present value techniques and option pricing models. The fair value of foreign exchangeforwards is generally based on current forward exchange rates, with the resulting value discounted back to presentvalue.

(98)
In cases when the fair value of unlisted equity instruments cannot be determined reliably, the instruments arecarried at cost less impairment. The fair value for loans and advances as well as liabilities to banks and customersare determined using a present value model on the basis of contractually agreed cash flows, taking into accountcredit quality, liquidity and costs. The fair values of contingent liabilities and irrevocable loan commitmentscorrespond to their carrying amounts.
(b) Non-financial assets or liabilities
The BPI Group uses valuation techniques that are appropriate in the circumstances and applies the techniqueconsistently. Commonly used valuation techniques are as follows:
Market approach - A valuation technique that uses observable inputs, such as prices, broker quotes and otherrelevant information generated by market transactions involving identical or comparable assets or group ofassets.
Income approach - A valuation technique that converts future amounts (e.g., cash flows or income andexpenses) to a single current (i.e., discounted) amount. The fair value measurement is determined on the basisof the value indicated by current market expectations about those future amounts.
Cost approach - A valuation technique that reflects the amount that would be required currently to replace theservice capacity of an asset (often referred to as current replacement cost).
The fair values were determined in reference to observable market inputs reflecting orderly transactions, i.e.market listings, published broker quotes and transacted deals from similar and comparable assets, adjusted todetermine the point within the range that is most representative of the fair value under current market conditions.The fair values of BPI Group’s investment properties and foreclosed assets (shown as Assets held for sale) fallunder level 2 of the fair value hierarchy. The BPI Group has no non-financial assets or liabilities classified underLevel 3 as at December 31, 2016 and 2015.

(99)
31.12 Classes of financial instruments
The BPI Group classifies the financial instruments into classes that reflect the nature of information and take intoaccount the characteristics of those financial instruments. The classification made can be seen in the table below:
Classes (as determined by the BPI Group)
Categories(as defined by PAS 39) Main classes Sub-classes
Financial assetsFinancial assets at fair value
through profit or loss
- Trading securities- Debt securities
- Equity securities
- Derivative financial assets
- Cash and other cash items
Loans and receivables
- Loans and advancesto banks
- Due from BSP
- Due from other banks
- Interbank loans receivable andsecurities purchased under agreementsto resell
- Loans and advances tocustomers
- Loans toindividuals(retail)
- Real estatemortgages
- Auto loans
- Credit cards
- Others
- Loans tocorporateentities
- Large corporatecustomers
- Small and medium-sized enterprises
- Others - Accounts receivables- Sales contracts receivable- Rental deposits- Other accrued interest and feesreceivable
Held-to-maturity investments- Investment securities
(debt securities)- Government- Others
Available-for-sale financialassets
- Investment securities(debt securities)
- Government- Others
- Investment securities(equity securities)
- Listed- Unlisted
Financial liabilities Financial liabilities at fairvalue through profit or loss - Derivative financial liabilities
Financial liabilities atamortized cost
- Deposits fromcustomers
- Demand
- Savings
- Time
- Deposits from banks
- Bills payable
- Due to BSP and otherbanks
- Manager’s check anddemand drafts outstanding
- Interest payable
- Unsecured subordinateddebt
- Other liabilities - Accounts payable
- Outstanding acceptances
- Dividend payable
Off-balance sheetfinancialinstruments
Loan commitments
Guarantees, acceptances and other financial facilities

(100)
31.13 Offsetting of financial instruments
Financial assets and liabilities are offset and the net amount reported in the statement of condition when there is alegally enforceable right to offset the recognized amounts and there is an intention to settle on a net basis, orrealize the asset and settle the liability simultaneously.
As at December 31, 2016 and 2015, there are no financial assets and liabilities that have been offset.
31.14 Derivative financial instruments
Derivatives are initially recognized at fair value on the date on which a derivative contract is entered into and aresubsequently re-measured at their fair value. Fair values are obtained from quoted market prices in active marketsincluding recent market transactions, and valuation techniques (for example for structured notes), includingdiscounted cash flow models and options pricing models, as appropriate. All derivatives are carried as assets whenfair value is positive and as liabilities when fair value is negative.
Certain derivatives embedded in other financial instruments are treated as separate derivatives when theireconomic characteristics and risks are not closely related to those of the host contract and the host contract is notcarried at fair value through profit or loss. The assessment of whether an embedded derivative is required to beseparated from the host contract is done when the BPI Group first becomes a party to the contract. Reassessmentof embedded derivative is only done when there are changes in the contract that significantly modify thecontractual cash flows. The embedded derivatives are measured at fair value with changes in fair value recognizedin profit or loss.
The BPI Group’s derivative instruments do not qualify for hedge accounting. Changes in the fair value of anyderivative instrument that do not qualify for hedge accounting are recognized immediately in the statement ofincome under “Trading gain/loss on securities”.
31.15 Bank premises, furniture, fixtures and equipment
Land and buildings comprise mainly of branches and offices. All bank premises, furniture, fixtures and equipmentare stated at historical cost less accumulated depreciation. Historical cost includes expenditure that is directlyattributable to the acquisition of an asset which comprises its purchase price, import duties and any directlyattributable costs of bringing the asset to its working condition and location for its intended use.
Subsequent costs are included in the asset’s carrying amount or are recognized as a separate asset, as appropriate,only when it is probable that future economic benefits associated with the item will flow to the BPI Group and thecost of the item can be measured reliably. All other repairs and maintenance are charged to profit or loss duringthe year in which they are incurred.
Land is not depreciated. Depreciation for buildings and furniture and equipment is calculated using the straight-line method to allocate cost or residual values over the estimated useful lives of the assets, as follows:
Building 25-50 yearsFurniture and equipment 3-5 yearsEquipment for lease 2-8 years
Leasehold improvements are depreciated over the shorter of the lease term (ranges from 5 to 10 years) and theuseful life of the related improvement (ranges from 5 to 10 years). Major renovations are depreciated over theremaining useful life of the related asset.
The assets’ residual values and useful lives are reviewed, and adjusted if appropriate, at each reporting date. Assetsare reviewed for impairment whenever events or changes in circumstances indicate that the carrying amount maynot be recoverable.

(101)
An asset’s carrying amount is written down immediately to its recoverable amount if the asset’s carrying amount isgreater than its estimated recoverable amount. The recoverable amount is the higher of an asset’s fair value lesscosts to sell and value in use. There are no bank premises, furniture, fixtures and equipment that are fully impairedas at December 31, 2016 and 2015.
An item of Bank premises, furniture, fixtures and equipment is derecognized upon disposal or when no futureeconomic benefits are expected to arise from the continued use of the asset. Any gain or loss arising onderecognition of the asset (calculated as the difference between the net disposal proceeds and the carrying amountof the item) is included in profit or loss in the period the item is derecognized.
31.16 Investment properties
Properties that are held either to earn rental income or for capital appreciation or both, and that are notsignificantly occupied by the BPI Group are classified as investment properties. Transfers to, and from, investmentproperty are made when, and only when, there is a change in use, evidenced by:
(a) Commencement of owner-occupation, for a transfer from investment property to owner-occupied property;(b) Commencement of development with a view of sale, for a transfer from investment property to real properties
held-for-sale and development;(c) End of owner occupation, for a transfer from owner-occupied property to investment property; or(d) Commencement of an operating lease to another party, for a transfer from real properties held-for-sale and
development to investment property.
Transfers to and from investment property do not result in gain or loss.
Investment properties comprise land and building. Investment properties are measured initially at cost, includingtransaction costs. Subsequent to initial recognition, investment properties are stated at cost less accumulateddepreciation and impairment losses, if any. Depreciation on investment property is determined using the samepolicy as applied to Bank premises, furniture, fixtures, and equipment. Impairment test is conducted when there isan indication that the carrying amount of the asset may not be recovered. An impairment loss is recognized for theamount by which the property’s carrying amount exceeds its recoverable amount, which is the higher of theproperty’s fair value less costs to sell and value in use.
An item of investment property is derecognized upon disposal or when no future economic benefits are expected toarise from the continued use of the asset. Any gains and losses arising on derecognition of the asset (calculated as thedifference between the net disposal proceeds and the carrying amount of the item) is included in profit or loss in theperiod the item is derecognized.
31.17 Foreclosed assets
Assets foreclosed shown as Assets held for sale in the statement of condition are accounted for at the lower of cost andfair value less cost to sell similar to the principles of PFRS 5. The cost of assets foreclosed includes the carryingamount of the related loan less allowance for impairment at the time of foreclosure. Impairment loss is recognized forany subsequent write-down of the asset to fair value less cost to sell.
Foreclosed assets not classified as Assets held for sale are accounted for in any of the following classification using themeasurement basis appropriate to the asset as follows:
(a) Investment property is accounted for using the cost model under PAS 40;
(b) Bank-occupied property is accounted for using the cost model under PAS 16; and
(c) Financial assets are classified as available-for-sale.

(102)
31.18 Intangible assets
(a) Goodwill
Goodwill represents the excess of the cost of an acquisition over the fair value of the BPI Group’s share in the netidentifiable assets of the acquired subsidiary/associate at the date of acquisition. Goodwill on acquisitions ofsubsidiaries is included under Other resources in the statement of condition. Goodwill on acquisitions of associates isincluded in Investments in subsidiaries and associates. Separately recognized goodwill is carried at cost lessaccumulated impairment losses. Gains and losses on the disposal of a subsidiary/associate include carrying amountof goodwill relating to the subsidiary/associate sold.
Goodwill is an indefinite-lived intangible asset and hence not subject to amortization.
Goodwill is allocated to cash-generating units for the purpose of impairment testing. Each cash-generating unit isrepresented by each primary reporting segment.
Goodwill impairment reviews are undertaken annually or more frequently if events or changes in circumstancesindicate a potential impairment. The carrying value of goodwill is compared to the recoverable amount, which is thehigher of value in use and the fair value less costs to sell. Any impairment is recognized immediately as an expenseand is not subsequently reversed.
(b) Contractual customer relationships
Contractual customer relationships acquired in a business combination are recognized at fair value at the acquisitiondate. The contractual customer relationships have finite useful lives of ten years and are carried at cost lessaccumulated amortization. Amortization is calculated using the straight-line method over the expected life of thecustomer relationship. Contractual customer relationships are included under Other resources in the statement ofcondition.
(c) Computer software
Acquired computer software licenses are capitalized on the basis of the costs incurred to acquire and bring to use thespecific software. These costs are amortized on a straight-line basis over the expected useful lives (three to five years).Computer software is included under Other resources in the statement of condition.
Costs associated with maintaining computer software programs are recognized as an expense as incurred.Development costs that are directly attributable to the design and testing of identifiable and unique software productscontrolled by the BPI Group are recognized as intangible assets when the following criteria are met:
it is technically feasible to complete the software product so that it will be available for use; management intends to complete the software product and use or sell it; there is an ability to use or sell the software product; it can be demonstrated how the software product will generate probable future economic benefits; adequate technical, financial and other resources to complete the development and to use or sell the software
product are available; and the expenditure attributable to the software product during its development can be reliably measured.
Directly attributable costs that are capitalized as part of the software product include the software developmentemployee costs and an appropriate portion of relevant overheads.
Other development expenditures that do not meet these criteria are recognized as an expense when incurred.Development costs previously recognized as an expense are not recognized as an asset in a subsequent period.

(103)
31.19 Impairment of non-financial assets
Assets that have indefinite useful lives - for example, goodwill or intangible assets not ready for use - are not subject toamortization and are tested annually for impairment and more frequently if there are indicators of impairment.Assets that have definite useful lives are subject to amortization and are reviewed for impairment whenever events orchanges in circumstances indicate that the carrying amount may not be recoverable. An impairment loss isrecognized for the amount by which the asset’s carrying amount exceeds its recoverable amount. The recoverableamount is the higher of an asset’s fair value less costs to sell and value in use. For purposes of assessing impairment,assets are grouped at the lowest levels for which there are separately identifiable cash flows (cash-generating units).Non-financial assets other than goodwill that suffered impairment are reviewed for possible reversal of impairment ateach reporting date.
31.20 Borrowings and borrowing costs
The BPI Group’s borrowings consist mainly of bills payable and unsecured subordinated debt. Borrowings arerecognized initially at fair value, being their issue proceeds, net of transaction costs incurred. Borrowings aresubsequently carried at amortized cost; any difference between the proceeds (net of transaction costs) and theredemption value is recognized in profit or loss over the period of the borrowings using the effective interest method.
Borrowing costs that are directly attributable to the acquisition, construction or production of a qualifying asset arecapitalized as part of the cost of the asset. All other borrowing costs are expensed as incurred. The BPI Group has noqualifying asset as at December 31, 2016 and 2015.
31.21 Interest income and expense
Interest income and expense are recognized in profit or loss for all interest-bearing financial instruments using theeffective interest method.
The effective interest method is a method of calculating the amortized cost of a financial asset or a financial liabilityand of allocating the interest income or interest expense over the relevant period. The effective interest rate is the ratethat exactly discounts estimated future cash payments or receipts through the expected life of the financial instrumentor, when appropriate, a shorter period to the net carrying amount of the financial asset or financial liability.
When calculating the effective interest rate, the BPI Group estimates cash flows considering all contractual terms ofthe financial instrument but does not consider future credit losses. The calculation includes all fees paid or receivedbetween parties to the contract that are an integral part of the effective interest rate, transaction costs and all otherpremiums or discounts.
Once a financial asset or a group of similar financial assets has been written down as a result of an impairment loss,interest income is recognized using the rate of interest used to discount the future cash flows for the purpose ofmeasuring impairment loss.
31.22 Fees and commission income
Fees and commissions are generally recognized on an accrual basis when the service has been provided.Commission and fees arising from negotiating or participating in the negotiation of a transaction for a third party(i.e. the arrangement of the acquisition of shares or other securities, or the purchase or sale of businesses) arerecognized on completion of underlying transactions. Portfolio and other management advisory and service feesare recognized based on the applicable service contracts, usually on a time-proportionate basis. Assetmanagement fees related to investment funds are recognized ratably over the period in which the service isprovided.
31.23 Dividend income
Dividend income is recognized in profit or loss when the BPI Group’s right to receive payment is established.

(104)
31.24 Credit card income
Credit card income is recognized upon receipt from merchants of charges arising from credit card transactions.These are computed based on rates agreed with merchants and are deducted from the payments to establishments.
31.25 Foreign currency translation
(a) Functional and presentation currency
Items in the financial statements of each entity in the BPI Group are measured using the currency of the primaryeconomic environment in which the entity operates (the “functional currency”). The financial statements arepresented in Philippine Peso, which is the Parent Bank’s functional and presentation currency.
(b) Transactions and balances
Foreign currency transactions are translated into the functional currency using the exchange rates prevailing at thedates of the transactions or valuation where items are remeasured. Foreign exchange gains and losses resultingfrom the settlement of such transactions and from the translation at year-end exchange rates of monetary assetsand liabilities denominated in foreign currencies are recognized in profit or loss. Non-monetary items measured athistorical cost denominated in a foreign currency are translated at exchange rates as at the date of initialrecognition. Non-monetary items in a foreign currency that are measured at fair value are translated using theexchange rates at the date when the fair value is determined.
Changes in the fair value of monetary securities denominated in foreign currency classified as available-for-sale areanalyzed between translation differences resulting from changes in the amortized cost of the security, and otherchanges in the carrying amount of the security. Translation differences are recognized in profit or loss, and otherchanges in carrying amount are recognized in other comprehensive income.
Translation differences on non-monetary financial instruments, such as equities held at fair value through profit orloss, are reported as part of the fair value gain or loss recognized under “Trading gain (loss)” in the statement ofincome. Translation differences on non-monetary financial instruments, such as equities classified as available-for-sale, are included in Accumulated other comprehensive income (loss) in the capital funds.
(c) Foreign subsidiaries
The results and financial position of BPI’s foreign subsidiaries (none of which has the currency of ahyperinflationary economy) that have a functional currency different from the presentation currency are translatedinto the presentation currency as follows:
(i) assets and liabilities are translated at the closing rate at reporting date;
(ii) income and expenses are translated at average exchange rates (unless this average is not a reasonableapproximation of the cumulative effect of the rates prevailing on the transaction dates, in which caseincome and expenses are translated at the dates of the transactions); and
(iii) all resulting exchange differences are recognized as a separate component (Translation adjustments) ofAccumulated other comprehensive income (loss) in the capital funds. When a foreign operation is sold,such exchange differences are recognized in profit or loss as part of the gain or loss on sale.
31.26 Accrued expenses and other liabilities
Accrued expenses and other liabilities are recognized in the period in which the related money, goods or services arereceived or when a legally enforceable claim against the BPI Group is established.

(105)
31.27 Provisions for legal or contractual obligations
Provisions are recognized when all of the following conditions are met: (i) the BPI Group has a present legal orconstructive obligation as a result of past events; (ii) it is probable that an outflow of resources will be required tosettle the obligation; and (iii) the amount has been reliably estimated. Provisions are not recognized for futureoperating losses.
Where there are a number of similar obligations, the likelihood that an outflow will be required in settlement isdetermined by considering the class of obligations as a whole. A provision is recognized even if the likelihood of anoutflow with respect to any one item is included in the same class of obligations may be small.
Provisions are measured at the present value of the expenditures expected to be required to settle the obligation usinga pre-tax rate that reflects the current market assessments of the time value of money and the risk specific to theobligation. The increase in the provision due to the passage of time is recognized as interest expense.
31.28 Income taxes
(a) Current income tax
Income tax payable is calculated on the basis of the applicable tax law in the respective jurisdiction and is recognizedas an expense for the year except to the extent that current tax is related to items (for example, current tax onavailable-for-sale investments) that are charged or credited in other comprehensive income or directly to capitalfunds.
The BPI Group has substantial income from its investment in government securities subject to final withholding tax.Such income is presented at its gross amount and the final tax paid or withheld is included in Provision for incometax - Current.
(b) Deferred income tax
Deferred income tax is recognized on temporary differences arising between the tax bases of assets and liabilitiesand their carrying amounts in the financial statements. The deferred income tax is not accounted for if it arisesfrom initial recognition of an asset or liability in a transaction, other than a business combination, that at the timeof the transaction affects neither accounting nor taxable profit or loss. Deferred income tax is determined usingtax rates (and laws) that have been enacted or substantively enacted at the reporting date and are expected to applywhen the related deferred income tax asset is realized or the deferred income tax liability is settled.
Deferred income tax assets are recognized for all deductible temporary differences, carry-forward of unused taxlosses (net operating loss carryover or NOLCO) and unused tax credits (excess minimum corporate income tax orMCIT) to the extent that it is probable that future taxable profit will be available against which the temporarydifferences, unused tax losses and unused tax credits can be utilized. Deferred income tax liabilities are recognizedin full for all taxable temporary differences except to the extent that the deferred tax liability arises from the initialrecognition of goodwill.
The BPI Group reassesses at each reporting date the need to recognize a previously unrecognized deferred income taxasset.
Deferred income tax assets are recognized on deductible temporary differences arising from investments insubsidiaries, and associates and joint arrangements only to the extent that it is probable the temporary difference willreverse in the future and there is sufficient taxable profit available against which the temporary difference can beutilized.
Deferred income tax liabilities are provided on taxable temporary differences arising from investments insubsidiaries, and associates and joint arrangements, except for deferred income tax liability where the timing of thereversal of the temporary difference is controlled by the BPI Group and it is probable that the temporary differencewill not reverse in the foreseeable future. Generally the BPI Group is unable to control the reversal of the temporarydifference for associates except when there is an agreement in place that gives the BPI Group the ability to control thereversal of the temporary difference.

(106)
Deferred income tax assets and liabilities are offset when there is a legally enforceable right to offset current tax assetsagainst current tax liabilities and when the deferred income taxes assets and liabilities relate to income taxes levied bythe same taxation authority on either the taxable entity or different taxable entities where there is an intention tosettle the balances on a net basis.
31.29 Employee benefits
(a) Short-term benefits
The BPI Group recognizes a liability net of amount already paid and an expense for services rendered by employeesduring the accounting period. Short-term benefits given by to its employees include salaries and wages, socialsecurity contributions, short-term compensated absences and bonuses, and non-monetary benefits.
Short-term employee benefit obligations are measured on an undiscounted basis and are expensed as the relatedservice is provided.
(b) Defined benefit retirement plan
The BPI Group has a defined benefit plan that shares risks among entities within the group. A defined benefit planis a pension plan that defines an amount of pension benefit that an employee will receive on retirement, usuallydependent on one or more factors such as age, years of service and compensation.
The liability recognized in the statement of condition in respect of defined benefit pension plan is the present valueof the defined benefit obligation at the reporting date less the fair value of plan assets. The defined benefitobligation is calculated annually by independent actuaries using the projected unit credit method. The presentvalue of the defined benefit obligation is determined by discounting the estimated future cash outflows usinginterest rates of government bonds that are denominated in the currency in which the benefits will be paid, andthat have terms to maturity approximating the terms of the related pension liability.
Actuarial gains and losses arising from experience adjustments and changes in actuarial assumptions are chargedor credited to equity in other comprehensive income in the period in which they arise.
Past-service costs are recognized immediately in profit or loss.
For individual financial reporting purposes, the unified plan assets are allocated among the BPI Group entitiesbased on the level of the defined benefit obligation attributable to each entity to arrive at the net liability or assetthat should be recognized in the individual financial statements.
(c) Defined contribution retirement plan
The BPI Group also maintains a defined contribution plan that covers certain full-time employees. Under itsdefined contribution plan, the Group pays fixed contributions based on the employees’ monthly salaries. TheGroup, however, is covered under RA No. 7641, otherwise known as The Philippine Retirement Pay Law, whichprovides for its qualified employees a defined benefit minimum guarantee. The defined benefit minimumguarantee is equivalent to a certain percentage of the monthly salary payable to an employee at normal retirementage with the required credited years of service based on the provisions of RA No. 7641. Accordingly, the Groupaccounts for its retirement obligation under the higher of the defined benefit obligation relating to the minimumguarantee and the obligation arising from the defined contribution plan.
For the defined benefit minimum guarantee plan, the liability is determined based on the present value of theexcess of the projected defined benefit obligation over the projected defined contribution obligation at the end ofthe reporting period. The defined benefit obligation is calculated annually by a qualified independent actuary usingthe projected unit credit method. The BPI Group and Parent Bank determine the net interest expense (income) onthe net defined benefit liability (asset) for the period by applying the discount rate used to measure the definedbenefit obligation at the beginning of the annual period to the net defined benefit liability (asset) then, taking intoaccount any changes in the net defined benefit liability (asset) during the period as a result of contributions andbenefit payments. Net interest and other expenses related to the defined benefit plan are recognized in thestatement of income.

(107)
The defined contribution liability is measured at the fair value of the defined contribution assets upon which thedefined contribution benefits depend, with an adjustment for margin on asset returns, if any, where this isreflected in the defined contribution benefits.
Actuarial gains and losses arising from the remeasurements of the net defined contribution liability are recognizedimmediately in the other comprehensive income.
(d) Share-based compensation
The BPI Group engages in equity-settled share-based payment transactions in respect of services received fromcertain employees.
The fair value of the services received is measured by reference to the fair value of the shares or share optionsgranted on the date of the grant. The cost of employee services received in respect of the shares or share optionsgranted is recognized in profit or loss (with a corresponding increase in reserve in capital funds) over the periodthat the services are received, which is the vesting period.
The fair value of the options granted is determined using option pricing models which take into account theexercise price of the option, the current share price, the risk-free interest rate, the expected volatility of the shareprice over the life of the option and other relevant factors.
When the stock options are exercised, the proceeds received, net of any directly attributable transaction costs, arecredited to share capital (par value) and share premium for the excess of exercise price over par value.
(e) Profit sharing and bonus plans
The BPI Group recognizes a liability and an expense for bonuses and profit-sharing, based on a formula that takesinto consideration the profit attributable to the Parent Bank’s shareholders after certain adjustments. The BPIGroup recognizes a provision where contractually obliged or where there is a past practice that has created aconstructive obligation.
31.30 Capital funds
Share capital, comprising common shares, is classified as equity.
Share premium includes any premiums or consideration received in excess of par value on the issuance of sharecapital.
Incremental costs directly attributable to the issue of new shares or options are shown in capital funds as adeduction from the proceeds, net of tax.
31.31 Earnings per share (EPS)
Basic EPS is calculated by dividing income applicable to common shares by the weighted average number ofcommon shares outstanding during the year with retroactive adjustments for stock dividends. In case of a rightsissue, an adjustment factor is being considered for the weighted average number of shares outstanding for allperiods before the rights issue. Diluted EPS is computed in the same manner as basic EPS, however, net incomeattributable to common shares and the weighted average number of shares outstanding are adjusted for the effectsof all dilutive potential common shares.
31.32 Dividends on common shares
Dividends on common shares are recognized as a liability in the BPI Group’s financial statements in the period inwhich the dividends are approved by the Board of Directors.

(108)
31.33 Fiduciary activities
The BPI Group commonly acts as trustee and in other fiduciary capacities that result in the holding or placing ofassets on behalf of individuals, trusts, retirement benefit plans and other institutions. These assets and income arisingthereon are excluded from these financial statements, as they are not assets of the BPI Group (Note 26).
31.34 Leases
(a) BPI Group is the lessee
(i) Operating lease
Leases in which a significant portion of the risks and rewards of ownership are retained by another party,the lessor, are classified as operating leases. Payments, including prepayments, made under operatingleases (net of any incentives received from the lessor) are charged to “Occupancy and equipment-relatedexpenses” in the statement of income on a straight-line basis over the period of the lease. When anoperating lease is terminated before the lease period has expired, any payment required to be made to thelessor by way of penalty is recognized as an expense in the period in which the termination takes place.
(ii) Finance lease
Leases of assets, where the BPI Group has substantially all the risks and rewards of ownership, areclassified as finance leases. Finance leases are capitalized at the commencement of the lease at the lowerof the fair value of the leased property and the present value of the minimum lease payments. Each leasepayment is allocated between the liability and finance charges so as to achieve a constant rate on thefinance balance outstanding. The interest element of the finance cost is charged to profit or loss over thelease period so as to produce a constant periodic rate of interest on the remaining balance of the liabilityfor each period.
(b) BPI Group is the lessor
(i) Operating lease
Properties (land and building) leased out under operating leases are included in “Investment properties”in the statement of condition. Rental income under operating leases is recognized in profit or loss on astraight-line basis over the period of the lease.
(ii) Finance lease
When assets are leased out under a finance lease, the present value of the lease payments is recognized asa receivable. The difference between the gross receivable and the present value of the receivable isrecognized as unearned finance income.
Lease income under finance lease is recognized over the term of the lease using the net investmentmethod before tax, which reflects a constant periodic rate of return.

(109)
31.35 Insurance and pre-need operations
(a) Non-life insurance
The more significant accounting policies observed by the non-life insurance subsidiaries follow: (a) gross premiumswritten from short-term insurance contracts are recognized at the inception date of the risks underwritten and areearned over the period of cover in accordance with the incidence of risk using the 24th method; (b) acquisition costsare deferred and charged to expense in proportion to the premium revenue recognized; reinsurance commissions aredeferred and deducted from the applicable deferred acquisition costs, subject to the same amortization method as therelated acquisition costs; (c) a liability adequacy test is performed which compares the subsidiaries’ reportedinsurance contract liabilities against current best estimates of all contractual future cash flows and claimshandling, and policy administration expenses as well as investment income backing up such liabilities, with anydeficiency immediately charged to profit or loss; (d) amounts recoverable from reinsurers and loss adjustmentexpenses are classified as assets, with an allowance for estimated uncollectible amounts; and (e) financial assets andliabilities are measured following the classification and valuation provisions of PAS 39.
(b) Pre-need
The more significant provisions of the PNUCA as applied by the pre-need subsidiary follow: (a) premium incomefrom sale of pre-need plans is recognized as earned when collected; (b) costs of contracts issued and other directcosts and expenses are recognized as expense when incurred; (c) pre-need reserves which represent the accruednet liabilities of the subsidiary to its plan holders are actuarially computed based on standards and guidelines setforth by the Insurance Commission; the increase or decrease in the account is charged or credited to other costs ofcontracts issued in profit or loss; and (d) insurance premium reserves which represent the amount that must be setaside by the subsidiary to pay for premiums for insurance coverage of fully paid plan holders, are actuariallycomputed based on standards and guidelines set forth by the Insurance Commission.
31.36 Related party relationships and transactions
Related party relationship exists when one party has the ability to control, directly, or indirectly through one or moreintermediaries, the other party or exercises significant influence over the other party in making financial andoperating decisions. Such relationship also exists between and/or among entities which are under common controlwith the reporting enterprise, or between and/or among the reporting enterprise and its key management personnel,directors, or its shareholders. In considering each possible related party relationship, attention is directed to thesubstance of the relationship, and not merely the legal form.
31.37 Comparatives
Except when a standard or an interpretation permits or requires otherwise, all amounts are reported or disclosed withcomparative information.
Where PAS 8 applies, comparative figures have been adjusted to conform with changes in presentation in the currentyear. There were no changes to the presentation made during the year.
31.38 Subsequent events (or Events after the reporting date)
Post year-end events that provide additional information about the BPI Group’s financial position at the reportingdate (adjusting events) are reflected in the financial statements. Post year-end events that are not adjusting eventsare disclosed in the notes to financial statements when material.

(110)
Note 32 - Supplementary information required by the Bureau of Internal Revenue
On December 28, 2010, Revenue Regulations (RR) No. 15-2010 became effective and amended certain provisions ofRR No. 21-2002 prescribing the manner of compliance with any documentary and/or procedural requirements inconnection with the preparation and submission of financial statements and income tax returns. Section 2 ofRR No. 21-2002 was further amended to include in the Notes to Financial Statements information on taxes, dutiesand license fees paid or accrued during the year in addition to what is mandated by PFRS.
Below is the additional information required by RR No. 15-2010 that is relevant to the Parent Bank. This informationis presented for purposes of filing with the Bureau of Internal Revenue (BIR) and is not a required part of the basicfinancial statements.
(i) Documentary stamp tax
Documentary stamp taxes paid through the Electronic Documentary Stamp Tax System for the year endedDecember 31, 2016 consist of:
(In Millions of Pesos) Amount
Deposit and loan documents 3,609Trade finance documents 262Mortgage documents 161Others 5
4,037
A portion of the amount disclosed above was passed on to the counterparties.
(ii) Withholding taxes
Withholding taxes paid/accrued and/or withheld for the year ended December 31, 2016 consist of:
(In Millions of Pesos)
Amount
Paid Accrued Total
Income taxes withheld on compensation 1,922 218 2,140
Final income taxes withheld on interest on deposits and yield ondeposit substitutes
1,318 127 1,445
Final income taxes withheld on income payment 600 37 637
Creditable income taxes withheld (expanded) 359 34 393
Fringe benefit tax 91 17 108VAT withholding tax 35 18 53
4,325 451 4,776

(111)
(iii) All other local and national taxes
All other local and national taxes paid/accrued for the year ended December 31, 2016 consist of:
(In Millions of Pesos)
Amount
Paid Accrued Total
Gross receipts tax 2,613 250 2,863
Real property tax 90 - 90
Municipal taxes 104 - 104Others 33 - 33
2,840 250 3,090
(iv) Tax cases and assessments
As at reporting date, the Parent Bank has pending cases filed in courts and with the tax authorities contestingcertain tax assessments and for various claims for tax refund. Management is of the opinion that the ultimateoutcome of the said cases will not have a material impact on the financial statements of the Parent Bank.