bank of barodabankofbaroda.com/download/bobanalysts_fy14.pdf · bank of baroda: a credible show in...
TRANSCRIPT

Bank of Baroda:
A Credible Show in Tough Times
Performance Analysis: 2013-14 (FY14)
Dr Rupa Rege Nitsure Chief Economist
May 13, 2014

BOB’s Results At A Glance
Results for Q4, FY14
Performance Parameter
Rs crore Growth (y-o-y)
Net Profit 1,157 12.5
Operating Profit 2,564 19.5
Total Business 9,65,900 20.4
Total Deposits 5,68,894 20.1
Total Advances 3,97,006 21.0
Total Assets 6,59,505 20.5
Net Worth 34,933 13.7
Total Capital (Basel II) 46,165 13.9
Tier 1 Capital (Basel II) 34,207 10.8
Business per Employee 18.65 10.4
Ratios for 2013-14 (FY14)
Key Performance Ratio (in %)
Return on Average Assets 0.75
Return on Equity 13.0
Cost-Income Ratio 43.44
Capital Adequacy Ratio (Basel II, Tier 1: 9.54%)
12.87
Capital Adequacy Ratio (Basel III, Tier 1: 9.28%)
12.28
Provision Coverage Ratio 65.45
Gross NPA 2.94
Net NPA 1.52

BOB’s Results At A Glance
Sequential Improvement In …..
Parameter Q1, FY14 Q2, FY14 Q3, FY14 Q4, FY14
Net Interest Income
Rs 2,889 cr Rs 2,895 cr Rs 3,057 cr Rs 3,124 cr
Fresh Slippages Rs 1,960 cr Rs 1,863 cr Rs 1,553 cr Rs 1,295 cr
Incremental Restructuring
Rs 2,147 cr Rs 1,637 cr Rs 1,213 cr Rs 1,157 cr
Bank’s Key Strategic Initiatives in FY14
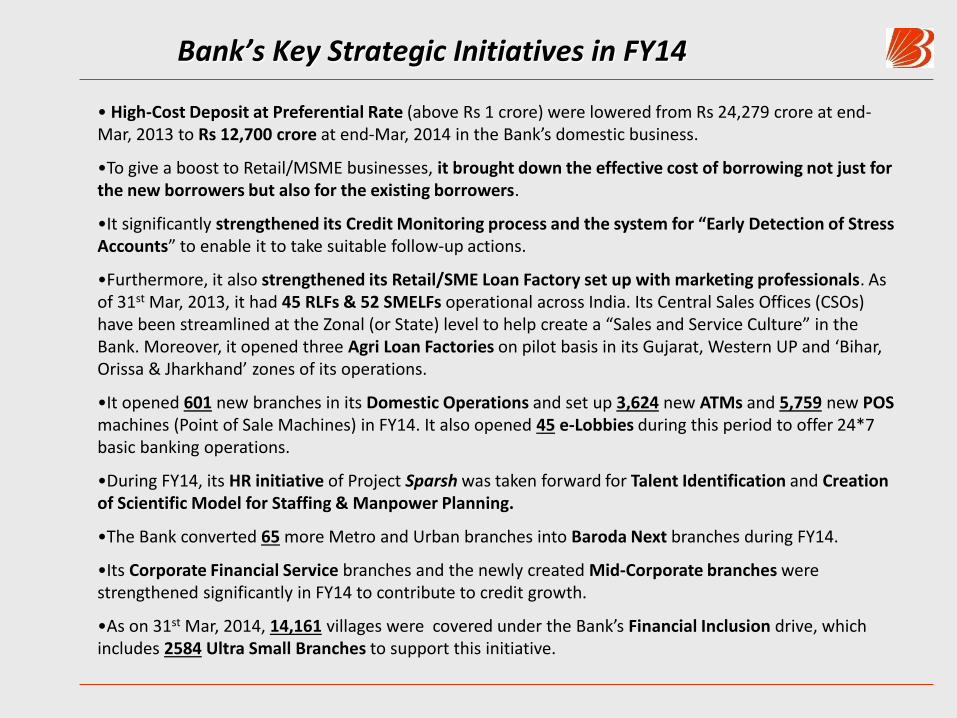
• High-Cost Deposit at Preferential Rate (above Rs 1 crore) were lowered from Rs 24,279 crore at end-Mar, 2013 to Rs 12,700 crore at end-Mar, 2014 in the Bank’s domestic business.
•To give a boost to Retail/MSME businesses, it brought down the effective cost of borrowing not just for the new borrowers but also for the existing borrowers.
•It significantly strengthened its Credit Monitoring process and the system for “Early Detection of Stress Accounts” to enable it to take suitable follow-up actions.
•Furthermore, it also strengthened its Retail/SME Loan Factory set up with marketing professionals. As of 31st Mar, 2013, it had 45 RLFs & 52 SMELFs operational across India. Its Central Sales Offices (CSOs) have been streamlined at the Zonal (or State) level to help create a “Sales and Service Culture” in the Bank. Moreover, it opened three Agri Loan Factories on pilot basis in its Gujarat, Western UP and ‘Bihar, Orissa & Jharkhand’ zones of its operations.
•It opened 601 new branches in its Domestic Operations and set up 3,624 new ATMs and 5,759 new POS machines (Point of Sale Machines) in FY14. It also opened 45 e-Lobbies during this period to offer 24*7 basic banking operations.
•During FY14, its HR initiative of Project Sparsh was taken forward for Talent Identification and Creation of Scientific Model for Staffing & Manpower Planning.
•The Bank converted 65 more Metro and Urban branches into Baroda Next branches during FY14.
•Its Corporate Financial Service branches and the newly created Mid-Corporate branches were strengthened significantly in FY14 to contribute to credit growth.
•As on 31st Mar, 2014, 14,161 villages were covered under the Bank’s Financial Inclusion drive, which includes 2584 Ultra Small Branches to support this initiative.

Bank of Baroda: Key Strengths
Bank of Baroda is a 105 years old State-owned Bank with modern & contemporary personality, offering banking products and services to Large industrial, SME, retail & agricultural customers across the country.
Relatively Strong Presence in Progressive States like Gujarat & Maharashtra
Uninterrupted Record in Profit-making and
Dividend Payment
Overseas Business Operations extend across
24 countries through 102 Offices
First PSB to receive & maintain Corporate Governance
Rating (CGR-2)
Globally Integrated
Advanced Technology
Platform
Pioneer in many
Customer-Centric Initiatives
Strong Domestic
Presence through
4,874 brs & 6,254 ATMs
Modern & Contemporary
Personality
Provides Financial Services to over
60 mln Customers Globally
A well-accepted & recognised Brand in
Indian banking industry
Domestic Branch Network (as on 31st Mar, 2014)
29263100 3364
39044276
4,874
0
500
1000
1500
2000
2500
3000
3500
4000
4500
5000
FY09 FY10 FY11 FY12 FY13 FY14
No. of Domestic Branches
Regional Break-up of
Domestic Branches as on 31st Mar 2014
Metro Urban Semi-Urban
Rural
980 849 1,273 1,772
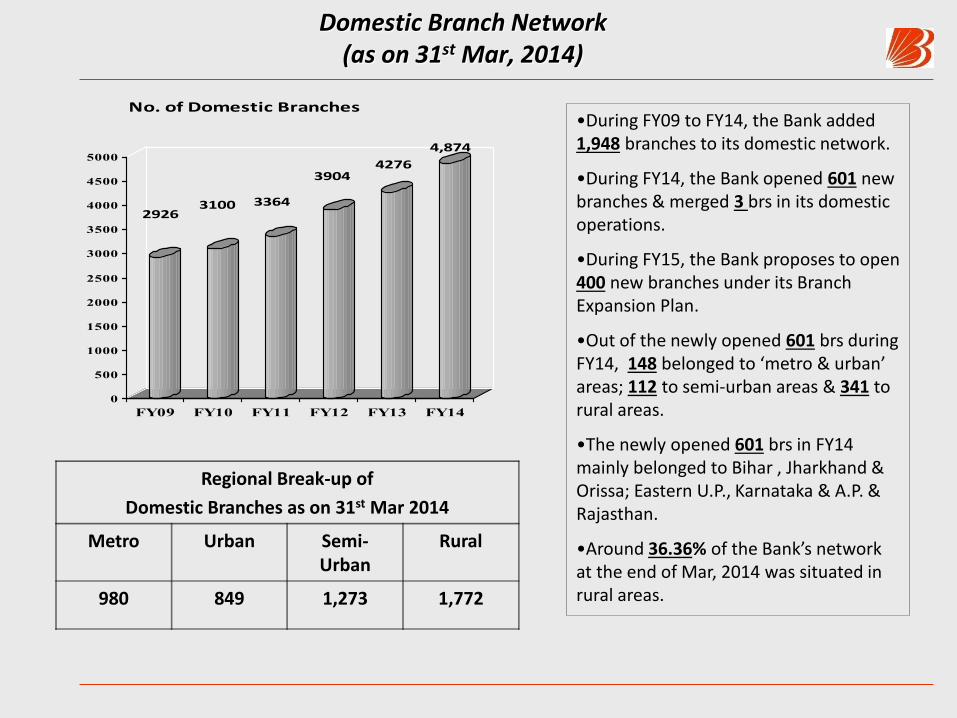
•During FY09 to FY14, the Bank added 1,948 branches to its domestic network.
•During FY14, the Bank opened 601 new branches & merged 3 brs in its domestic operations.
•During FY15, the Bank proposes to open 400 new branches under its Branch Expansion Plan.
•Out of the newly opened 601 brs during FY14, 148 belonged to ‘metro & urban’ areas; 112 to semi-urban areas & 341 to rural areas.
•The newly opened 601 brs in FY14 mainly belonged to Bihar , Jharkhand & Orissa; Eastern U.P., Karnataka & A.P. & Rajasthan.
•Around 36.36% of the Bank’s network at the end of Mar, 2014 was situated in rural areas.

Concentration (%): Domestic Branch Network (As on 31st Mar, 2014)
Rest of India, 25.6
UP & Uttaranchal,
23.0South, 11.0
Rajasthan, 10.6
Maharashtra, 10.9
Gujarat, 19.0

Pattern of Shareholding: 31st Mar, 2014
• FIIs
16.1%
Corp.
Bodies
3.9%
Indian
Public
4.7%Others
1.8%
Mutual
Funds
6.8%
Insurance
Cos
10.5%
Govt. of
India
56.3%
• BOB is a Part of the following Indexes
BSE 100, BSE 200, BSE 500 & Bankex
Nifty, BankNifty, CNX 100, CNX 200, CNX 500
• BOB’s Share is also listed on BSE and NSE in the ‘Future and Options’ segment.
As on 31st Mar, 2014
•Share Capital: Rs 430.68 crore
•Net worth: Rs 34,933 crore (up 13.7%, y-o-y)
• B. V. per share (vs. F. V. per share: Rs 10): Rs 813.50 (up 11.6%, y-o-y)
•Return on Equity: 13.00% in FY14

Macro Environment: FY14
• Underlying economic currents remained weak for India throughout FY14.
• Official estimates place economic growth for FY14 at 4.9% supported by strong agricultural
growth of 4.6%.
• A deep slowdown continued in the mining and manufacturing sectors. In fact, it was the first
time since 1991-92 that India’s Mfg sector contracted during FY14.
• Services sector covering 60.0% of the economy is estimated to have grown by a lower 6.9%.
• High & persistent inflation remained a key macroeconomic risk during FY14. While WPI-based
inflation averaged at 5.9%, CPI-based inflation averaged at 9.5%.
• Despite growth concerns, RBI had to raise the policy rate by 75 bps during May’13 to Jan’14.
• Around June-July, 2013, India was faced with significant debt capital outflows and pressures
on its currency, equity and bond markets, as global liquidity conditions tightened.
• The RBI controlled the situation by tightening liquidity, relaxing limits on FDI, ECBs and
encouraging NRI remittances and sharply increasing gold import duties.
• India’s external vulnerabilities fell significantly in H2, FY14 helped by policy actions to shrink
the CAD & strengthen capital flows.
• Indian banking sector witnessed relatively lower business expansion (deposits up 14.6% &
credit up 14.3%) with continued stresses on asset quality and restructured loan-books.

Business Expansion
Particular
(Rs crore) Mar’13 Dec’13 Mar’14
Y-O-Y
(%)
Change
Over
Dec’13 (%)
Global Business 8,02,069 8,56,218 9,65,900 20.4 12.8
Domestic Business 5,66,000 5,78,616 6,51,223 15.1 12.5
Overseas Business 2,36,069 2,77,602 3,14,677 33.3 13.3
Global Deposits 4,73,883 5,03,772 5,68,894 20.1 12.9
Domestic Deposits 3,41,706 3,40,941 3,79,054 10.9 11.2
Overseas Deposits 1,32,178 1,62,831 1,89,840 43.6 16.6
Global CASA Deposits 1,19,981 1,32,066 1,46,488 22.1 10.9
Domestic CASA 1,03,809 1,10,032 1,20,381 16.0 9.4
Overseas CASA 16,172 22,034 26,107 61.4 18.5
•Share of Domestic CASA in Total Deposits well-protected at 31.76% at end-Mar, 2014.

Business Expansion
Particular
(Rs crore) Mar’13 Dec’13 Mar’14
Y-O-Y
(%)
Change
Over
Dec’13 (%)
Global advances (Net) 3,28,186 3,52,446 3,97,006 21.0 12.6
Domestic Advances 2,24,294 2,37,674 2,72,169 21.3 14.5
Overseas Advances 1,03,891 1,14,772 1,24,837 20.2 8.8
Retail Credit
Of which: 38,046 42,777 46,019 21.0 7.6
Home Loans 16,045 18,398 19,558 21.9 6.3
SME Credit 46,722 54,396 56,634 21.2 4.1
Farm Credit 27,663 26,310 28,432 2.8 8.1
Credit to Weaker Sections
17,045 18,112 20,599 20.9 13.7
CASA Position
Particular
(Rs crore) Mar’13 Dec’13 Mar’14
Y-O-Y
(%)
Change
Over
Dec’13 (%)
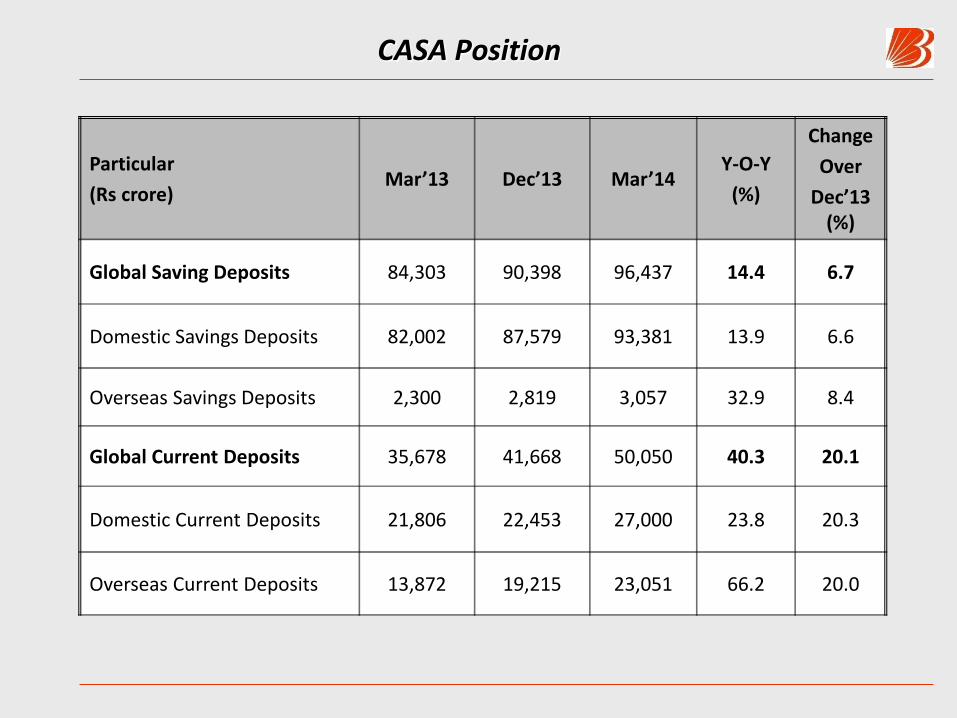
Global Saving Deposits 84,303 90,398 96,437 14.4 6.7
Domestic Savings Deposits 82,002 87,579 93,381 13.9 6.6
Overseas Savings Deposits 2,300 2,819 3,057 32.9 8.4
Global Current Deposits 35,678 41,668 50,050 40.3 20.1
Domestic Current Deposits 21,806 22,453 27,000 23.8 20.3
Overseas Current Deposits 13,872 19,215 23,051 66.2 20.0

Bank’s Profits & Its Key Components: Q4, FY13 & FY14
Particular
(Rs crore) Q4, FY13 Q4, FY14
YOY
(%)
Interest Income 9,072 10,289 13.4
Interest Expenses 6,258 7,164 14.5
NII (Spread) 2,814 3,124 11.0
Other Income 1,191 1,326 11.4
Staff Expenses 1,139 1,040 -8.7
Total Expenses 8,080 9,035 11.8
Operating Profit 2,182 2,580 18.2
Provisions 1,116 1,407 26.0
Net Profit 1,029 1,157 12.5

Bank’s Profits & Its Key Components: FY13 & FY14
Particular
(Rs crore) FY13 FY14
YOY
(%)
Interest Income 35,197 38,940 10.6
Interest Expenses 23,881 26,974 13.0
NII (Spread) 11,315 11,965 5.7
Other Income 3,631 4,463 22.9
Staff Expenses 3,450 4,140 20.0
Total Expenses 29,754 34,049 14.4
Operating Profit 9,074 9,353 3.1
Provisions 4,518 4,750 5.1
Net Profit 4,481 4,541 1.3
Deposit & Loan Costs: Q4,FY13 to Q4,FY14
Particular (in %) Q4, FY13
Q1, FY14
Q2, FY14
Q3, FY14
Q4, FY14
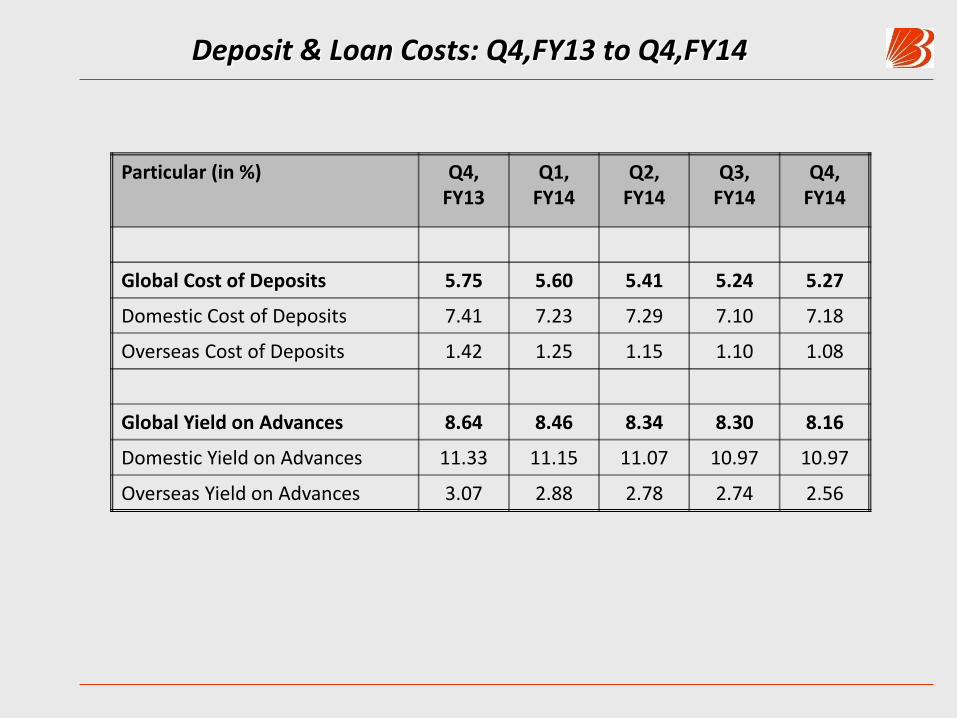
Global Cost of Deposits 5.75 5.60 5.41 5.24 5.27
Domestic Cost of Deposits 7.41 7.23 7.29 7.10 7.18
Overseas Cost of Deposits 1.42 1.25 1.15 1.10 1.08
Global Yield on Advances 8.64 8.46 8.34 8.30 8.16
Domestic Yield on Advances 11.33 11.15 11.07 10.97 10.97
Overseas Yield on Advances 3.07 2.88 2.78 2.74 2.56

Investment Yields & NIMs: Q4,FY13 to Q4,FY14
Particular (in %) Q4, FY13
Q1, FY14
Q2, FY14
Q3, FY14
Q4, FY14
Global Yield on Investment 7.74 7.79 7.74 7.78 7.81
Domestic Yield on Investment 7.85 7.93 7.90 7.98 7.99
Overseas Yield on Investment 5.05 4.39 4.19 3.62 4.00
Global NIM 2.51 2.41 2.32 2.37 2.29
Domestic NIM 2.93 2.84 2.85 2.95 2.84
Overseas NIM 1.49 1.32 1.19 1.18 1.09
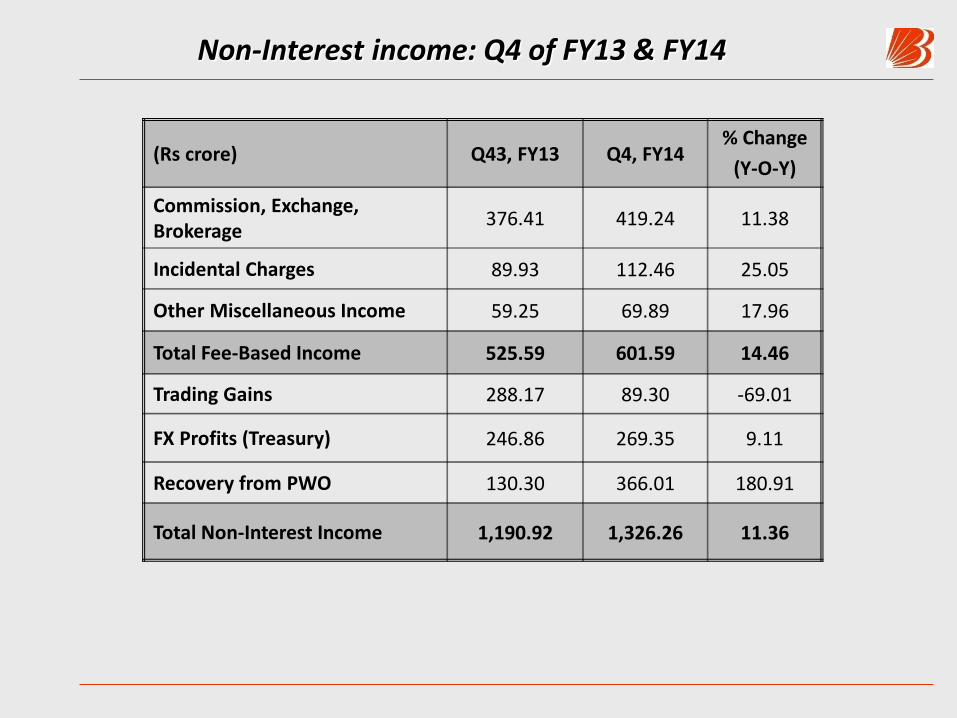
Non-Interest income: Q4 of FY13 & FY14
(Rs crore) Q43, FY13 Q4, FY14 % Change
(Y-O-Y)
Commission, Exchange, Brokerage
376.41 419.24 11.38
Incidental Charges 89.93 112.46 25.05
Other Miscellaneous Income 59.25 69.89 17.96
Total Fee-Based Income 525.59 601.59 14.46
Trading Gains 288.17 89.30 -69.01
FX Profits (Treasury) 246.86 269.35 9.11
Recovery from PWO 130.30 366.01 180.91
Total Non-Interest Income 1,190.92 1,326.26 11.36

Non-Interest income: FY13 & FY14
(Rs crore) FY13 FY14 % Change
(Y-O-Y)
Commission, Exchange, Brokerage
1,257.36 1,437.39 14.32
Incidental Charges 337.41 388.03 15.00
Other Miscellaneous Income 263.69 291.13 10.41
Total Fee-Based Income 1,858.46 2,116.55 13.89
Trading Gains 617.29 743.80 20.07
FX Profits (Treasury) 802.51 1,039.06 29.48
Recovery from PWO 352.37 563.33 59.87
Total Non-Interest Income 3,630.62 4,462.74 22.92

Provisions & Contingencies: Q4 of FY13 & FY14
(Rs crore) Q4, FY13 Q4, FY14 %
Change
Provision for NPA & Bad Debts Written-off
1097.24 637.42 -41.91
Provision for Depreciation on Investment
211.16 293.40 38.95
Provision for Standard Advances 220.35 191.27 -13.20
Other Provisions (including Provision for staff welfare)
69.66 31.05 -55.43
Tax Provisions -482.53 253.59 -152.6
Total Provisions 1115.88 1406.73 26.06

Provisions & Contingencies: FY13 & FY14
(Rs crore) FY13 FY14 %
Change
Provision for NPA & Bad Debts Written-off
3,449.44 2,967.72 -13.97
Provision for Depreciation on Investment
225.46 198.59 -11.92
Provision for Standard Advances 393.80 535.04 35.87
Other Provisions (including Provision for staff welfare)
99.22 92.36 -6.91
Tax Provisions 350.51 956.23 172.81
Total Provisions 4,518.43 4,749.94 5.12

Bank’s Domestic Treasury Highlights: Q4 & Full year FY14
• Trading Gains improved from Rs 617 crore in FY13 to Rs 741 crore in FY14 reflecting
growth of 20.1%. Despite heightened volatility in financial markets, trading gains
remained decent on y-o-y basis.
• The FX Profits too increased by a significant 29.5% (y-o-y) in FY14 and provided good
support to Non-Interest Income generation.
• As of 31st Mar , 2014, the share of SLR Securities in Total Investment was 85.02%.
• The Bank had 82.31% of SLR Securities in HTM and 17.24%in AFS at end-Mar 2014.
• The Bank shifted SLR securities worth Rs 737.81 cr & Rs 6,483.81 cr from AFS to HTM
in Apr & Sept 2013, respectively and worth Rs 9,487.52 cr from HTM to AFS in Apr,
2013.
• The per cent of SLR to NDTL at end-Mar, 2014 was at 24.52%.
• As on 31st Mar, 2014, the modified duration of AFS investments was 3.16% & that of
HTM securities was 5.23%.
• Total size of Bank’s Domestic Investment Book as on 31st Mar, 2014 stood at Rs
1,12,170 crore.

Highlights of Overseas Business: Q4 & Full Year FY14
• During FY14, the Bank’s “Overseas Business” contributed 32.6% to its Total Business, 24.2%
to Gross Profit and 30.5% to Core Fee-based income (i.e., Commission, Exchanges,
brokerage, etc.)
• Out of the Total Overseas Loan-book, 48.5% was Buyers’ Credit/BP/BD; 27.7% was in
Syndicated Loans/ECBs (mostly to Indian corporates) and 23.8% was in Local Credit. The
Bank’s exposure to non-India related companies is around 30.6% of its overseas loan-book
as on 31st Mar, 2014.
• While the GNPA (%) in domestic operations was at 3.56%, it was 1.58% for overseas
operations as on 31st Mar, 2014.
• The Cost-Income Ratio in Overseas operations was more favourable at 18.13% in FY14
versus 48.54% in Domestic operations.
• In FY14, the NIM (as % of interest-earning assets) in Overseas operations stood at 1.20%;
Gross Profit to Avg. Working Funds ratio at 1.13% and Return on Equity at 11.94%.
• The Outstanding balance of restructured loans in overseas operations as on 31st Mar, 2014
was at Rs 3,984 crore, out of which the Standard restructured loans were at Rs 3,238
crore.
• During FY14, the Bank opened two new branches in its Overseas Subsidiaries – Tanzania
and Uganda, one EBSU in Abu Dhabi, Dubai and closed one OBU (Offshore Banking Unit) in
Mumbai.

NPA Movement (Gross): FY14
Particular ( Rs crore)
A. Opening Balance 7,982.58
B. Additions during FY14 6,833.93
Out of which, Fresh Slippages 6,469.62
C. Reduction during FY14
Recovery 1,261.81
Upgradation 684.72
PWO & WO 963.52
Other Adjustments 30.56
NPA as on 31st Mar, 2014 11,875.90
Recovery in PWO in FY14 563.33
•Bank’s PCR improved from 61.68% in Q2 to 62.22% in Q3 to 65.45% in Q4 of FY14.

Sector-wise Gross NPA [Sequential Movement]
Sector
Gross NPA
(%)
End-June, 2013
Gross NPA (%)
End-Sept, 2013
Gross NPA (%)
End-Dec, 2013
Gross NPA (%)
End-Mar, 2014
Agriculture 5.29 5.76 5.77 5.35
Large & Medium Industries 5.06 5.56 6.03 5.05
Retail 2.24 2.52 2.11 1.96
Housing 1.52 1.91 1.47 1.45
MSME 4.26 4.63 4.95 4.93
Overseas Operations 1.56 1.77 1.75 1.58

Restructured Accounts (Domestic)
Year Outstanding as on 31st March, 2014 (Rs crore)
Standard Category NPA Category Grand total
No. of A/Cs Amount No of A/Cs Amount No of A/Cs Amount
Up to 2008 112 581.15 161 7.66 273 588.81
2008-09 4,841 856.07 3,874 177.05 8,715 1,033.12
2009-10 2,457 1,475.41 1,554 263.84 4,011 1,739.25
2010-11 480 1,495.48 349 80.08 829 1,575.56
2011-12 1,398 5,050.16 543 733.11 1,941 5,783.27
2012-13 11,422 7,184.15 2,482 1,619.28 13,904 8,803.43
2013-14 23,576 5,933.87 3,197 463.42 26,773 6,397.29
Total 44,286 22,576.29 12,160 3,344.44 56,446 25,920.73
Less standard restructured accounts that ceased to attract higher provisions and/or additional risk weight at end of FY14
3,980 3,367.47 3,980 3,367.47
TOTAL 40,306 19,208.82 12,160 3,344.44 52,466 22,553.26

Restructured Accounts
•In its global operations, the Bank restructured loans to the tune of Rs 1,157 cr (6,556 accounts) in Q4, FY14 versus Rs 1,213 crore (6,173 accounts) in Q3, FY14.
•For the full year FY14, the amount restructured was Rs 6,397 cr as against Rs 8,506 cr in FY13.
•As on 31st March, 2014, the total restructured portfolio of the Bank’s Domestic Operations stood at Rs 22,553.26 crore and of Overseas Operations stood at Rs 3,983.68 crore.
•Cumulatively, this constitutes 6.57% of the Bank’s Global Advances.
•The ratio of restructured standard advances to gross standard advances (excluding the NPAs) works out to 5.73%.
•Restructured assets worth Rs 505 cr slipped into NPA during Q4; Rs 2,126 cr during FY14 and Rs 5,840 cr cumulatively so far.
•The Rate of Slippage into NPAs (from the restructured loan-book) so far is around 22.0%.
•There is no sectoral concentration and/or lumpiness in incremental restructuring done by the Bank, as the largest account being restructured was of the size of Rs 180 crore.

Sectoral Deployment of Credit at end-Mar, 2014
Sector % share in Gross Domestic Credit
Agriculture 10.2
Retail 16.6
SME 20.3
Large & Medium 32.1
Misc. including Trade 20.8
Total 100.0%

Technology Initiatives in FY14
•Under various alternate delivery channels (like ATM, Internet Banking, Mobile Banking etc) the Bank had the following value additions during FY14.
•e-Banking
•IMPS (Immediate Payment Services) implemented for funds-transfer through Mobile number and MMID of beneficiary or account number and IFSC code of beneficiary.
•Online transaction information sharing with a valued client RSGSM (Rajasthan Sriganganagar Sugar Mill)
•Online Recurring Deposit Account opening with Standing Instruction enabled through E-Banking
•Puduchery Excise tax collection through E-Banking
•Enabled Delhi VAT offline payments for branches; VAT collection through e-banking in Daman & Diu
•ATM
•Bunch Note Acceptor implementation for account based - Phase II completed.
•Non personalized card product stabilization completed successfully
•In-house customization completed for Cheque Book request on ATM
•Online Hot listing between Card Management System and Base24 switch completed
•Adhaar number seeding and NEFT facility enabled through ATM
•Online charges for Rupay KCC completed
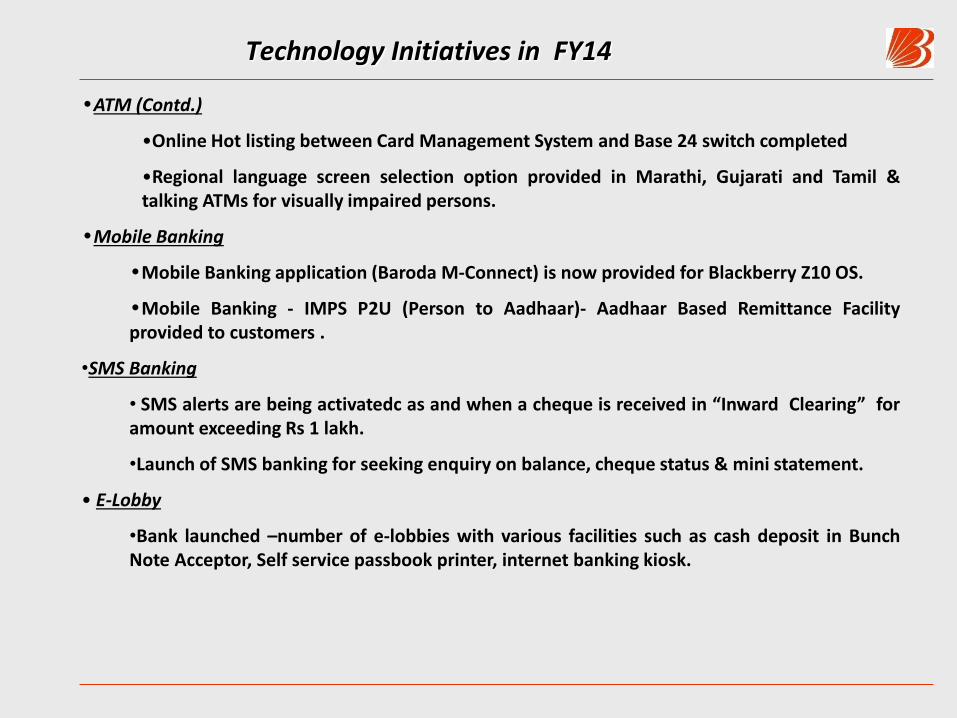
Technology Initiatives in FY14
•ATM (Contd.)
•Online Hot listing between Card Management System and Base 24 switch completed
•Regional language screen selection option provided in Marathi, Gujarati and Tamil & talking ATMs for visually impaired persons.
•Mobile Banking
•Mobile Banking application (Baroda M-Connect) is now provided for Blackberry Z10 OS.
•Mobile Banking - IMPS P2U (Person to Aadhaar)- Aadhaar Based Remittance Facility provided to customers .
•SMS Banking
• SMS alerts are being activatedc as and when a cheque is received in “Inward Clearing” for amount exceeding Rs 1 lakh.
•Launch of SMS banking for seeking enquiry on balance, cheque status & mini statement.
• E-Lobby
•Bank launched –number of e-lobbies with various facilities such as cash deposit in Bunch Note Acceptor, Self service passbook printer, internet banking kiosk.
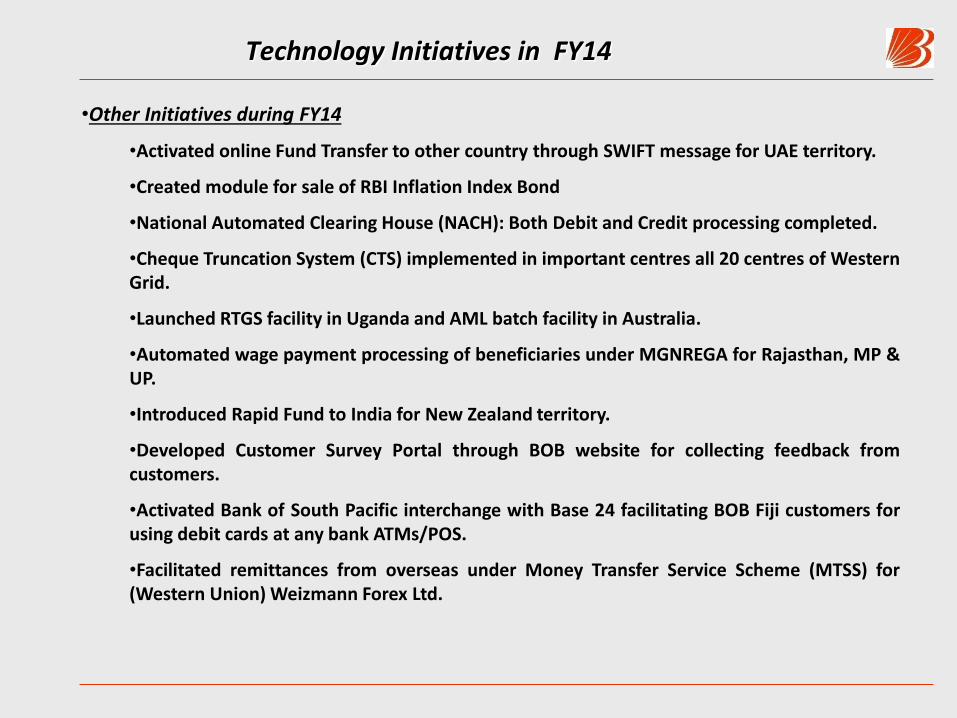
Technology Initiatives in FY14
•Other Initiatives during FY14
•Activated online Fund Transfer to other country through SWIFT message for UAE territory.
•Created module for sale of RBI Inflation Index Bond
•National Automated Clearing House (NACH): Both Debit and Credit processing completed.
•Cheque Truncation System (CTS) implemented in important centres all 20 centres of Western Grid.
•Launched RTGS facility in Uganda and AML batch facility in Australia.
•Automated wage payment processing of beneficiaries under MGNREGA for Rajasthan, MP & UP.
•Introduced Rapid Fund to India for New Zealand territory.
•Developed Customer Survey Portal through BOB website for collecting feedback from customers.
•Activated Bank of South Pacific interchange with Base 24 facilitating BOB Fiji customers for using debit cards at any bank ATMs/POS.
•Facilitated remittances from overseas under Money Transfer Service Scheme (MTSS) for (Western Union) Weizmann Forex Ltd.
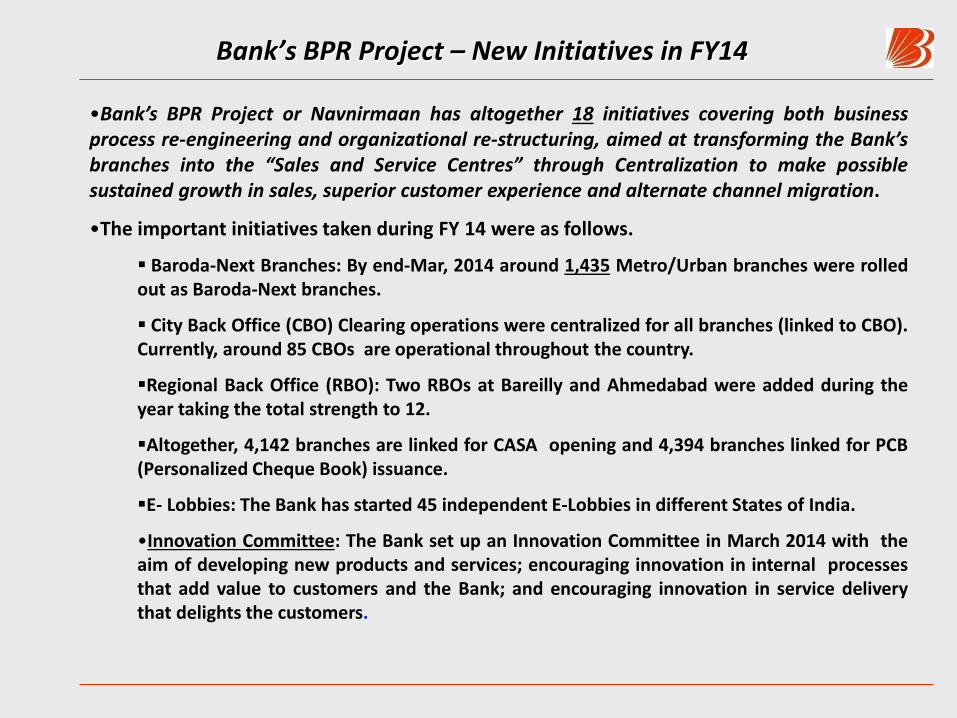
Bank’s BPR Project – New Initiatives in FY14
•Bank’s BPR Project or Navnirmaan has altogether 18 initiatives covering both business process re-engineering and organizational re-structuring, aimed at transforming the Bank’s branches into the “Sales and Service Centres” through Centralization to make possible sustained growth in sales, superior customer experience and alternate channel migration.
•The important initiatives taken during FY 14 were as follows.
Baroda-Next Branches: By end-Mar, 2014 around 1,435 Metro/Urban branches were rolled out as Baroda-Next branches.
City Back Office (CBO) Clearing operations were centralized for all branches (linked to CBO). Currently, around 85 CBOs are operational throughout the country.
Regional Back Office (RBO): Two RBOs at Bareilly and Ahmedabad were added during the year taking the total strength to 12.
Altogether, 4,142 branches are linked for CASA opening and 4,394 branches linked for PCB (Personalized Cheque Book) issuance.
E- Lobbies: The Bank has started 45 independent E-Lobbies in different States of India.
•Innovation Committee: The Bank set up an Innovation Committee in March 2014 with the aim of developing new products and services; encouraging innovation in internal processes that add value to customers and the Bank; and encouraging innovation in service delivery that delights the customers.

New Recruitment in FY14
Category Proposed Joined up to
30/03/2014
Total New Hiring for FY14 6,300 5,810
Of which:
Probationary Officers 1,530 1494
Specialist Officers 389 321
Baroda Manipal Trainees 870 859
Campus Recruitment 11 11
Clerks 3,500 3,125
*No. of Employees superannuated in FY14: 1,566
•As in the past, the Bank is carrying out two programmes notably “a skills’ up-gradation programme and a structured six-month long on-boarding programme” for its new joinees to inculcate in them general banking skills as well as the specialised skills in the areas of credit, forex, soft skills, etc.
•Its other two programmes – SPARSH {A HR transformation project} and Baroda Manipal School of Banking { An innovative & new channel of resourcing of trained manpower for itself} are in full swing.

Bank’s Forward Guidance
•Indian economy is expected to recover gradually in FY15, supported by political stability & enabling policy framework, relatively stronger global economic growth and improved competitiveness of exports.
•This augurs well for the banking business. Also comfortable liquidity position and RBI’s focused inflation targeting could further help. Macro recovery and potential for post-elections reforms should see a gradual reduction in the banking industry’s stressed assets.
• The Bank aspires to grow with cautious optimism and would concentrate on improving its domestic NIM to 3.0% through further rebalancing of loan-book; bringing the ROAA close to 1.0% by further improving the CASA share and improving the yield on advances on the back of likely improvement in economic prospects.
•On the qualitative side, the Bank’s endeavours at BPR, Capacity Building, Technology Up-gradation, Talent Management & Training, Marketing, etc. would continue with full vigour.
•The Bank is continuously evolving its Strategic Focus to cope with changing circumstances.
•In the year FY14, it succeeded in giving retail orientation to its business; further strengthening its liability franchise and capital position and bringing down incremental slippages & restructuring pains.
•We at Bank of Baroda see our sustainable & resilient performance in the past few years as a source of competitive advantage in the years ahead. We are committed to protect our Leadership Position in the market.
Thank you.