bank of hawaii corporation form 10-q securities and
TRANSCRIPT

Table of Contents
UNITED STATESSECURITIES AND EXCHANGE COMMISSION
Washington, D.C. 20549
FORM 10-Q
(Mark One)
x Quarterly Report Pursuant to Section 13 or 15(d) of the Securities Exchange Act of 1934 for the quarterly period ended March 31, 2018
oro Transition Report Pursuant to Section 13 or 15(d) of the Securities Exchange Act of 1934 for the transition
period from to
Commission File Number: 1-6887
BANK OF HAWAII CORPORATION(Exact name of registrant as specified in its charter)
Delaware
99-0148992(State of incorporation)
(I.R.S. Employer Identification No.)
130 Merchant Street, Honolulu, Hawaii
96813(Address of principal executive offices)
(Zip Code) 1-888-643-3888
(Registrant’s telephone number, including area code)
Indicate by check mark whether the registrant (1) has filed all reports required to be filed by Section 13 or 15(d) of the Securities Exchange Act of 1934during the preceding 12 months (or for such shorter period that the registrant was required to file such reports), and (2) has been subject to such filingrequirements for the past 90 days.
Yes x No o
Indicate by check mark whether the registrant has submitted electronically and posted on its corporate Web site, if any, every Interactive Data File required tobe submitted and posted pursuant to Rule 405 of Regulation S-T (Section 232.405 of this chapter) during the preceding 12 months (or for such shorter periodthat the registrant was required to submit and post such files).
Yes x No o
Indicate by check mark whether the registrant is a large accelerated filer, an accelerated filer, a non-accelerated filer, smaller reporting company, or anemerging growth company. See the definitions of “large accelerated filer,” “accelerated filer,” “smaller reporting company,” and “emerging growth company”in Rule 12b-2 of the Exchange Act.
Large accelerated filer x Accelerated filer oNon-accelerated filer o (Do not check if a smaller reporting company) Smaller reporting company o
Emerging growth company o
If an emerging growth company, indicate by check mark if the registrant has elected not to use the extended transition period for complying with any new orrevised financial accounting standards provided pursuant to Section 13(a) of the Exchange Act. o Indicate by check mark whether the registrant is a shell company (as defined in Rule 12b-2 of the Exchange Act).
Yes o No x
As of April 17, 2018, there were 42,267,067 shares of common stock outstanding.
Table of Contents
Bank of Hawaii CorporationForm 10-Q
Index
Page Part I - Financial Information
Item 1. Financial Statements (Unaudited)
Consolidated Statements of Income –
Three months ended March 31, 2018 and 20172
Consolidated Statements of Comprehensive Income –Three months ended March 31, 2018 and 2017
3
Consolidated Statements of Condition –March 31, 2018 and December 31, 2017
4
Consolidated Statements of Shareholders’ Equity –Three months ended March 31, 2018 and 2017
5
Consolidated Statements of Cash Flows –Three months ended March 31, 2018 and 2017
6
Notes to Consolidated Financial Statements (Unaudited) 7 Item 2. Management’s Discussion and Analysis of Financial Condition and Results of Operations 47 Item 3. Quantitative and Qualitative Disclosures About Market Risk 76 Item 4. Controls and Procedures 76 Part II - Other Information Item 1A. Risk Factors 77 Item 2. Unregistered Sales of Equity Securities and Use of Proceeds 77 Item 6. Exhibits 77 Signatures 78
1

Table of Contents
Bank of Hawaii Corporation and SubsidiariesConsolidated Statements of Income (Unaudited)
Three Months Ended
March 31,
(dollars in thousands, except per share amounts) 2018 2017
Interest Income
Interest and Fees on Loans and Leases $ 97,634 $ 87,937
Income on Investment Securities
Available-for-Sale 12,141 11,084
Held-to-Maturity 21,296 19,706
Deposits 18 5
Funds Sold 757 890
Other 300 230
Total Interest Income 132,146 119,852
Interest Expense
Deposits 7,581 3,691
Securities Sold Under Agreements to Repurchase 4,564 5,185
Funds Purchased 53 3
Short-Term Borrowings 16 —
Other Debt 976 1,101
Total Interest Expense 13,190 9,980
Net Interest Income 118,956 109,872
Provision for Credit Losses 4,125 4,400
Net Interest Income After Provision for Credit Losses 114,831 105,472
Noninterest Income
Trust and Asset Management 11,181 11,479
Mortgage Banking 2,145 3,300
Service Charges on Deposit Accounts 7,129 8,325
Fees, Exchange, and Other Service Charges 14,333 13,332
Investment Securities Gains (Losses), Net (666) 12,133
Annuity and Insurance 1,206 1,995
Bank-Owned Life Insurance 1,842 1,497
Other 6,865 3,855
Total Noninterest Income 44,035 55,916
Noninterest Expense
Salaries and Benefits 54,422 51,165
Net Occupancy 8,534 8,168
Net Equipment 5,527 5,501
Data Processing 3,891 3,410
Professional Fees 2,773 2,779
FDIC Insurance 2,157 2,209
Other 17,080 15,336
Total Noninterest Expense 94,384 88,568
Income Before Provision for Income Taxes 64,482 72,820
Provision for Income Taxes 10,442 21,644
Net Income $ 54,040 $ 51,176
Basic Earnings Per Share $ 1.29 $ 1.21
Diluted Earnings Per Share $ 1.28 $ 1.20
Dividends Declared Per Share $ 0.52 $ 0.50
Basic Weighted Average Shares 42,038,573 42,406,006
Diluted Weighted Average Shares 42,358,425 42,749,866
The accompanying notes are an integral part of the Consolidated Financial Statements (Unaudited).
2

Table of Contents
Bank of Hawaii Corporation and SubsidiariesConsolidated Statements of Comprehensive Income (Unaudited)
Three Months Ended
March 31,
(dollars in thousands) 2018 2017
Net Income $ 54,040 $ 51,176
Other Comprehensive Income (Loss), Net of Tax:
Net Unrealized Gains (Losses) on Investment Securities (9,121) 4,894
Defined Benefit Plans 216 146
Total Other Comprehensive Income (Loss) (8,905) 5,040
Comprehensive Income $ 45,135 $ 56,216
The accompanying notes are an integral part of the Consolidated Financial Statements (Unaudited).
3

Table of Contents
Bank of Hawaii Corporation and SubsidiariesConsolidated Statements of Condition (Unaudited)
(dollars in thousands)March 31,
2018 December 31,
2017
Assets
Interest-Bearing Deposits in Other Banks $ 2,589 $ 3,421
Funds Sold 387,766 181,413
Investment Securities
Available-for-Sale 2,184,187 2,232,979
Held-to-Maturity (Fair Value of $3,711,149 and $3,894,121) 3,789,092 3,928,170
Loans Held for Sale 23,548 19,231
Loans and Leases 9,916,628 9,796,947
Allowance for Loan and Lease Losses (107,938) (107,346)
Net Loans and Leases 9,808,690 9,689,601
Total Earning Assets 16,195,872 16,054,815
Cash and Due From Banks 174,871 263,017
Premises and Equipment, Net 137,201 130,926
Accrued Interest Receivable 52,941 50,485
Foreclosed Real Estate 2,768 1,040
Mortgage Servicing Rights 24,493 24,622
Goodwill 31,517 31,517
Bank-Owned Life Insurance 280,537 280,034
Other Assets 235,830 252,596
Total Assets $ 17,136,030 $ 17,089,052
Liabilities
Deposits
Noninterest-Bearing Demand $ 4,759,777 $ 4,724,300
Interest-Bearing Demand 3,028,373 3,082,563
Savings 5,397,291 5,389,013
Time 1,771,692 1,688,092
Total Deposits 14,957,133 14,883,968
Securities Sold Under Agreements to Repurchase 505,293 505,293
Other Debt 235,699 260,716
Retirement Benefits Payable 37,046 37,312
Accrued Interest Payable 8,229 6,946
Taxes Payable and Deferred Taxes 29,557 24,009
Other Liabilities 121,880 138,940
Total Liabilities 15,894,837 15,857,184
Shareholders’ Equity Common Stock ($.01 par value; authorized 500,000,000 shares;issued / outstanding: March 31, 2018 - 58,051,646 / 42,314,414and December 31, 2017 - 57,959,074 / 42,401,443) 577 576
Capital Surplus 563,598 561,161
Accumulated Other Comprehensive Loss (51,097) (34,715)
Retained Earnings 1,551,900 1,512,218Treasury Stock, at Cost (Shares: March 31, 2018 - 15,737,232 and December 31, 2017 - 15,557,631) (823,785) (807,372)
Total Shareholders’ Equity 1,241,193 1,231,868
Total Liabilities and Shareholders’ Equity $ 17,136,030 $ 17,089,052
The accompanying notes are an integral part of the Consolidated Financial Statements (Unaudited).

4

Table of Contents
Bank of Hawaii Corporation and SubsidiariesConsolidated Statements of Shareholders’ Equity (Unaudited)
(dollars in thousands)
CommonShares
Outstanding Common
Stock CapitalSurplus
Accum.Other
Compre-hensiveIncome
(Loss) RetainedEarnings
TreasuryStock Total
Balance as of December 31, 2017 42,401,443 $ 576 $ 561,161 $ (34,715) $ 1,512,218 $ (807,372) $ 1,231,868
Net Income — — — — 54,040 — 54,040
Other Comprehensive Loss — — — (8,905) — — (8,905)Reclassification of the Income Tax Effects of theTax Cuts and Jobs Act from AOCI — — — (7,477) 7,477 — —
Share-Based Compensation — — 1,867 — — — 1,867Common Stock Issued under Purchase and EquityCompensation Plans and Related Tax Benefits 121,299 1 570 — 252 1,128 1,951
Common Stock Repurchased (208,328) — — — — (17,541) (17,541)
Cash Dividends Declared ($0.52 per share) — — — — (22,087) — (22,087)
Balance as of March 31, 2018 42,314,414 $ 577 $ 563,598 $ (51,097) $ 1,551,900 $ (823,785) $ 1,241,193
Balance as of December 31, 2016 42,635,978 $ 576 $ 551,628 $ (33,906) $ 1,415,440 $ (772,201) $ 1,161,537
Net Income — — — — 51,176 — 51,176
Other Comprehensive Income — — — 5,040 — — 5,040
Share-Based Compensation — — 1,735 — — — 1,735Common Stock Issued under Purchase and EquityCompensation Plans and Related Tax Benefits 235,803 — 535 — (702) 6,744 6,577
Common Stock Repurchased (135,749) — — — — (11,509) (11,509)
Cash Dividends Declared ($0.50 per share) — — — — (21,419) — (21,419)
Balance as of March 31, 2017 42,736,032 $ 576 $ 553,898 $ (28,866) $ 1,444,495 $ (776,966) $ 1,193,137
The accompanying notes are an integral part of the Consolidated Financial Statements (Unaudited).
5

Table of Contents
Bank of Hawaii Corporation and SubsidiariesConsolidated Statements of Cash Flows (Unaudited)
Three Months Ended
March 31,
(dollars in thousands) 2018 2017
Operating Activities
Net Income $ 54,040 $ 51,176
Adjustments to Reconcile Net Income to Net Cash Provided by Operating Activities:
Provision for Credit Losses 4,125 4,400
Depreciation and Amortization 3,339 3,280
Amortization of Deferred Loan and Lease Fees (151) (427)
Amortization and Accretion of Premiums/Discounts on Investment Securities, Net 8,966 10,130
Share-Based Compensation 1,867 1,735
Benefit Plan Contributions (375) (334)
Deferred Income Taxes (138) 9,161
Net Gains on Sales of Loans and Leases (573) (2,168)
Net Losses (Gains) on Sales of Investment Securities 666 (12,133)
Proceeds from Sales of Loans Held for Sale 66,003 68,884
Originations of Loans Held for Sale (70,290) (73,983)
Net Tax Benefits from Share-Based Compensation 767 1,900
Net Change in Other Assets and Other Liabilities 6,632 (19,942)
Net Cash Provided by Operating Activities 74,878 41,679
Investing Activities
Investment Securities Available-for-Sale:
Proceeds from Sales, Prepayments and Maturities 89,399 94,028
Purchases (59,160) (234,979)
Investment Securities Held-to-Maturity:
Proceeds from Prepayments and Maturities 195,199 161,465
Purchases (59,598) (181,048)
Net Change in Loans and Leases (124,225) (198,531)
Proceeds from Sales of Loans — 79,169
Premises and Equipment, Net (9,614) (4,640)
Net Cash Provided by (Used in) Investing Activities 32,001 (284,536)
Financing Activities
Net Change in Deposits 73,165 156,293
Net Change in Short-Term Borrowings — (23,086)
Repayments of Long-Term Debt (25,000) —
Proceeds from Issuance of Common Stock 1,959 6,494
Repurchase of Common Stock (17,541) (11,509)
Cash Dividends Paid (22,087) (21,419)
Net Cash Provided by Financing Activities 10,496 106,773
Net Change in Cash and Cash Equivalents 117,375 (136,084)
Cash and Cash Equivalents at Beginning of Period 447,851 879,607
Cash and Cash Equivalents at End of Period $ 565,226 $ 743,523
Supplemental Information
Cash Paid for Interest $ 11,908 $ 8,905
Cash Paid for Income Taxes 961 1,822
Non-Cash Investing Activities:
Transfer from Loans to Foreclosed Real Estate 1,728 843
Transfers from Loans to Loans Held for Sale — 30,477
The accompanying notes are an integral part of the Consolidated Financial Statements (Unaudited).
6

Table of Contents
Bank of Hawaii Corporation and SubsidiariesNotes to Consolidated Financial Statements
(Unaudited)
Note 1. Summary of Significant Accounting Policies
Basis of Presentation
Bank of Hawaii Corporation (the “Parent”) is a Delaware corporation and a bank holding company headquartered in Honolulu, Hawaii. Bank of HawaiiCorporation and its subsidiaries (collectively, the “Company”) provide a broad range of financial products and services to customers in Hawaii, Guam, andother Pacific Islands. The accompanying consolidated financial statements include the accounts of the Parent and its subsidiaries. The Parent’s principaloperating subsidiary is Bank of Hawaii (the “Bank”).
The consolidated financial statements in this report have not been audited by an independent registered public accounting firm, but in the opinion ofmanagement, reflect all adjustments necessary for a fair presentation of the results for the interim periods. All such adjustments are of a normal recurringnature. Intercompany accounts and transactions have been eliminated in consolidation. Certain prior period information has been reclassified to conform tothe current period presentation. Operating results for the interim periods disclosed herein are not necessarily indicative of the results that may be expected forthe full fiscal year or for any future period.
The accompanying consolidated financial statements have been prepared in accordance with U.S. generally accepted accounting principles (“GAAP”) forinterim financial information and with the instructions to Form 10-Q and Rule 10-01 of Regulation S-X. Accordingly, they do not include all of theinformation and accompanying notes required by GAAP for complete financial statements and should be read in conjunction with the audited consolidatedfinancial statements and related notes included in the Company’s Annual Report on Form 10-K for the year ended December 31, 2017.
Use of Estimates in the Preparation of Financial Statements
The preparation of financial statements in conformity with GAAP requires management to make estimates and assumptions that affect the reported amountsin the financial statements and accompanying notes. Actual results may differ from those estimates and such differences could be material to the financialstatements.
Variable Interest Entities
Variable interests are defined as contractual ownership or other interests in an entity that change with fluctuations in an entity’s net asset value. The primarybeneficiary consolidates the variable interest entity (“VIE”). The primary beneficiary is defined as the enterprise that has both the power to direct theactivities of the VIE that most significantly impact the entity’s economic performance and the obligation to absorb losses or the right to receive benefits thatcould be significant to the VIE.
The Company has limited partnership interests in several low-income housing partnerships. These partnerships provide funds for the construction andoperation of apartment complexes that provide affordable housing to lower-income households. If these developments successfully attract a specifiedpercentage of residents falling in that lower-income range, state and/or federal income tax credits are made available to the partners. The tax credits aregenerally recognized over 10 years. In order to continue receiving the tax credits each year over the life of the partnership, the low-income residency targetsmust be maintained.
Prior to January 1, 2015, the Company utilized the effective yield method whereby the Company recognized tax credits generally over 10 years and amortizedthe initial cost of the investment to provide a constant effective yield over the period that tax credits are allocated to the Company. On January 1, 2015, theCompany adopted ASU No. 2014-01, “Accounting for Investments in Qualified Affordable Housing Projects” prospectively for new investments. ASU No.2014-01 permits reporting entities to make an accounting policy election to account for their investments in qualified affordable housing projects using theproportional amortization method if certain conditions are met. As permitted by ASU No. 2014-01, the Company elected to continue to utilize the effectiveyield method for investments made prior to January 1, 2015.
7
Table of Contents
Unfunded commitments to fund these low-income housing partnerships were $15.0 million and $17.5 million as of March 31, 2018 and December 31, 2017,respectively. These unfunded commitments are unconditional and legally binding and are recorded in other liabilities in the consolidated statements ofcondition. See Note 6 Affordable Housing Projects Tax Credit Partnerships for more information.
The Company also has limited partnership interests in solar energy tax credit partnership investments. These partnerships develop, build, own and operatesolar renewable energy projects. Over the course of these investments, the Company expects to receive federal and state tax credits, tax-related benefits, andexcess cash available for distribution, if any. The Company may be called to sell its interest in the limited partnerships through a call option once allinvestment tax credits have been recognized. Tax benefits associated with these investments are generally recognized over six years.
These entities meet the definition of a VIE; however, the Company is not the primary beneficiary of the entities as the general partner has both the power todirect the activities that most significantly impact the economic performance of the entities and the obligation to absorb losses or the right to receive benefitsthat could be significant to the entities. While the partnership agreements allow the limited partners, through a majority vote, to remove the general partner,this right is not deemed to be substantive as the general partner can only be removed for cause.
The investments in these entities are initially recorded at cost, which approximates the maximum exposure to loss as a result of the Company’s involvementwith these unconsolidated entities. The balance of the Company’s investments in these entities was $86.3 million and $87.6 million as of March 31, 2018 andDecember 31, 2017, respectively, and is included in other assets in the consolidated statements of condition.
Tax Cuts and Jobs Act
Public law No. 115-97, known as the Tax Cuts and Jobs Act (the "Tax Act"), enacted on December 22, 2017, reduced the U.S. federal corporate tax rate from35% to 21% effective January 1, 2018. Also on December 22, 2017, the Securities and Exchange Commission issued Staff Accounting Bulletin No. 118(“SAB 118”), which provides guidance on accounting for tax effects of the Tax Act. SAB 118 provides a measurement period of up to one year from theenactment date to complete the accounting. Any adjustments during this measurement period will be included in net earnings from continuing operations asan adjustment to income tax expense in the reporting period when such adjustments are determined. Based on the information available and currentinterpretation of the rules, the Company estimated the impact of the reduction in the corporate tax rate and remeasurement of certain deferred tax assets andliabilities. The provisional amount recorded in the fourth quarter of 2017 related to the remeasurement of the Company's deferred tax balance resulted inadditional income tax expense of $3.6 million. An additional $0.1 million was expensed in the first quarter of 2018 due to the remeasurement of theCompany’s deferred tax balance. In addition, during the first quarter of 2018, the Company recorded a $2.0 million basis adjustment on its low incomehousing partnership investments, which consequently reduced income tax expense by the same amount. The final impact of the Tax Act may differ from theseestimates as a result of changes in management’s interpretations and assumptions, as well as new guidance that may be issued by the Internal RevenueService.
Accounting Standards Adopted in 2018
In May 2014, the FASB issued ASU No. 2014-09, “Revenue from Contracts with Customers.” The standard’s core principle is that a company will recognizerevenue when it transfers promised goods or services to customers in an amount that reflects the consideration to which the company expects to be entitled inexchange for those goods or services. In doing so, companies generally will be required to use more judgment and make more estimates than under currentguidance. These may include identifying performance obligations in the contract, estimating the amount of variable consideration to include in the transactionprice and allocating the transaction price to each separate performance obligation. Subsequent to the issuance of ASU 2014-09, the FASB issued targetedupdates to clarify specific implementation issues including ASU No. 2016-08, “Principal versus Agent Considerations (Reporting Revenue Gross versusNet),” ASU No. 2016-10, “Identifying Performance Obligations and Licensing,” ASU No. 2016-12, “Narrow-Scope Improvements and PracticalExpedients,” and ASU No. 2016-20 “Technical Corrections and Improvements to Topic 606, Revenue from Contracts with Customers.” For financialreporting purposes, the standard allows for either full retrospective adoption, meaning the standard is applied to all of the periods presented, or modifiedretrospective adoption, meaning the standard is applied only to the most current period presented in the financial statements with the cumulative effect ofinitially applying the standard recognized at the date of initial application. Since the guidance does not apply to revenue associated with financial instruments,including loans and securities that are accounted for under other GAAP, the new guidance did not have a material impact on revenue most closely associatedwith financial instruments, including interest income and expense. The Company completed its overall assessment of revenue streams and review of relatedcontracts potentially affected by the ASU, including trust and asset management fees, deposit related fees, interchange fees, merchant income, and annuityand insurance commissions. Based on this assessment, the
8

Table of Contents
Company concluded that ASU 2014-09 did not materially change the method in which the Company currently recognizes revenue for these revenue streams.The Company also completed its evaluation of certain costs related to these revenue streams to determine whether such costs should be presented as expensesor contra-revenue (i.e., gross vs. net). Based on its evaluation, the Company determined that the classification of certain debit and credit card related costsshould change (i.e., costs previously recorded as expense is now recorded as contra-revenue, and vice versa). These classification changes resulted inimmaterial changes to both revenue and expense. The Company also determined that certain costs related to ATMs should be recorded as an expense ratherthan a reduction of revenue. This change did not have a material effect to noninterest income or expense. The Company adopted ASU 2014-09 and its relatedamendments on its required effective date of January 1, 2018 utilizing the modified retrospective approach. Since there was no net income impact uponadoption of the new guidance, a cumulative effect adjustment to opening retained earnings was not deemed necessary. Consistent with the modifiedretrospective approach, the Company did not adjust prior period amounts for the debit and credit card costs and the ATM costs reclassifications noted above.See Note 15 Revenue Recognition for more information.
In January 2016, the FASB issued ASU No. 2016-01, “Recognition and Measurement of Financial Assets and Financial Liabilities.” This ASU addressescertain aspects of recognition, measurement, presentation, and disclosure of financial instruments by making targeted improvements to GAAP as follows: (1)require equity investments (except those accounted for under the equity method of accounting or those that result in consolidation of the investee) to bemeasured at fair value with changes in fair value recognized in net income. However, an entity may choose to measure equity investments that do not havereadily determinable fair values at cost minus impairment, if any, plus or minus changes resulting from observable price changes in orderly transactions forthe identical or a similar investment of the same issuer; (2) simplify the impairment assessment of equity investments without readily determinable fair valuesby requiring a qualitative assessment to identify impairment. When a qualitative assessment indicates that impairment exists, an entity is required to measurethe investment at fair value; (3) eliminate the requirement to disclose the fair value of financial instruments measured at amortized cost for entities that are notpublic business entities; (4) eliminate the requirement for public business entities to disclose the method(s) and significant assumptions used to estimate thefair value that is required to be disclosed for financial instruments measured at amortized cost on the balance sheet; (5) require public business entities to usethe exit price notion when measuring the fair value of financial instruments for disclosure purposes; (6) require an entity to present separately in othercomprehensive income the portion of the total change in the fair value of a liability resulting from a change in the instrument-specific credit risk when theentity has elected to measure the liability at fair value in accordance with the fair value option for financial instruments; (7) require separate presentation offinancial assets and financial liabilities by measurement category and form of financial asset (that is, securities or loans and receivables) on the balance sheetor the accompanying notes to the financial statements; and (8) clarify that an entity should evaluate the need for a valuation allowance on a deferred tax assetrelated to available-for-sale securities in combination with the entity’s other deferred tax assets. The adoption of ASU No. 2016-01 on January 1, 2018 did nothave a material impact on the Company’s Consolidated Financial Statements. In accordance with (5) above, the Company measured the fair value of its loanportfolio as of March 31, 2018 using an exit price notion (see Note 14 Fair Value of Assets and Liabilities).
In August 2016, the FASB issued ASU No. 2016-15, “Classification of Certain Cash Receipts and Cash Payments.” Current GAAP is unclear or does notinclude specific guidance on how to classify certain transactions in the statement of cash flows. This ASU is intended to reduce diversity in practice in howeight particular transactions are classified in the statement of cash flows. ASU No. 2016-15 is effective for interim and annual reporting periods beginningafter December 15, 2017. Entities are required to apply the guidance retrospectively. If it is impracticable to apply the guidance retrospectively for an issue,the amendments related to that issue would be applied prospectively. The Company adopted ASU No. 2016-15 on January 1, 2018. ASU No. 2016-15 did nothave a material impact on the Company’s Consolidated Financial Statements.
In March 2017, the FASB issued ASU No. 2017-07, “Improving the Presentation of Net Periodic Pension Cost and Net Periodic Postretirement BenefitCost.” Under the new guidance, employers are required to present the service cost component of the net periodic benefit cost in the same income statementline item (e.g., Salaries and Benefits) as other employee compensation costs arising from services rendered during the period. In addition, only the servicecost component will be eligible for capitalization in assets. Employers will present the other components of net periodic benefit cost separately (e.g., OtherNoninterest Expense) from the line item that includes the service cost. ASU No. 2017-07 is effective for interim and annual reporting periods beginning afterDecember 15, 2017. Employers will apply the guidance on the presentation of the components of net periodic benefit cost in the income statementretrospectively. The guidance limiting the capitalization of net periodic benefit cost in assets to the service cost component will be applied prospectively. TheCompany adopted ASU No. 2017-07 on January 1, 2018 and utilized the ASU’s practical expedient allowing entities to estimate amounts for comparativeperiods using the information previously disclosed in their pension and other postretirement benefit plan footnote. ASU No. 2017-07 did not have a materialimpact on the Company’s Consolidated Financial Statements.
9
Table of Contents
In February 2018, the FASB issued ASU No. 2018-02, “Reclassification of Certain Tax Effects from Accumulated Other Comprehensive Income.” This ASUallows a reclassification from accumulated other comprehensive income (“AOCI”) to retained earnings for certain income tax effects stranded in AOCI as aresult of the Tax Act. Consequently, the reclassification eliminates the stranded tax effects resulting from the Tax Act and is intended to improve theusefulness of information reported to financial statement users. However, because the ASU only relates to the reclassification of the income tax effects of theTax Act, the underlying guidance that requires the effect of a change in tax laws or rates to be included in income from continuing operations is not affected. ASU No. 2018-02 is effective for the Company's reporting period beginning on January 1, 2019; early adoption is permitted. The Company elected to earlyadopt ASU No. 2018-02 during the first quarter of 2018, and elected to reclassify the income tax effects of the Tax Act from AOCI to retained earnings. Thereclassification decreased AOCI and increased retained earnings by $7.5 million, with zero net effect on total shareholders’ equity. The Company utilizes theindividual securities approach when releasing income tax effects from AOCI for its investment securities.
Accounting Standards Pending Adoption
In February 2016, the FASB issued ASU No. 2016-02, “Leases.” Under the new guidance, lessees will be required to recognize the following for all leases(with the exception of short-term leases): 1) a lease liability, which is the present value of a lessee’s obligation to make lease payments, and 2) a right-of-useasset, which is an asset that represents the lessee’s right to use, or control the use of, a specified asset for the lease term. Lessor accounting under the newguidance remains largely unchanged as it is substantially equivalent to existing guidance for sales-type leases, direct financing leases, and operating leases.Leveraged leases have been eliminated, although lessors can continue to account for existing leveraged leases using the current accounting guidance. Otherlimited changes were made to align lessor accounting with the lessee accounting model and the new revenue recognition standard. All entities will classifyleases to determine how to recognize lease-related revenue and expense. Quantitative and qualitative disclosures will be required by lessees and lessors tomeet the objective of enabling users of financial statements to assess the amount, timing, and uncertainty of cash flows arising from leases. The intention is torequire enough information to supplement the amounts recorded in the financial statements so that users can understand more about the nature of an entity’sleasing activities. ASU No. 2016-02 is effective for interim and annual reporting periods beginning after December 15, 2018; early adoption is permitted. Allentities are required to use a modified retrospective approach for leases that exist or are entered into after the beginning of the earliest comparative period inthe financial statements. They have the option to use certain relief; full retrospective application is prohibited. The Company has several lease agreements,such as branch locations, which are currently considered operating leases, and therefore, not recognized on the Company’s consolidated statements ofcondition. The Company expects the new guidance will require these lease agreements to be recognized on the consolidated statements of condition as aright-of-use asset and a corresponding lease liability. Therefore, the Company’s preliminary evaluation indicates the provisions of ASU No. 2016-02 areexpected to impact the Company’s consolidated statements of condition, along with our regulatory capital ratios. However, the Company continues toevaluate the extent of potential impact the new guidance will have on the Company’s Consolidated Financial Statements. The Company is nearing completionof identifying a complete inventory of arrangements containing a lease and accumulating the lease data necessary to apply the amended guidance. In addition,the Company has obtained new software to aid in the transition to the new leasing guidance.
10
Table of Contents
In June 2016, the FASB issued ASU No. 2016-13, “Measurement of Credit Losses on Financial Instruments.” This ASU significantly changes how entitieswill measure credit losses for most financial assets and certain other instruments that aren’t measured at fair value through net income. In issuing the standard,the FASB is responding to criticism that today’s guidance delays recognition of credit losses. The standard will replace today’s “incurred loss” approach withan “expected loss” model. The new model, referred to as the current expected credit loss (“CECL”) model, will apply to: (1) financial assets subject to creditlosses and measured at amortized cost, and (2) certain off-balance sheet credit exposures. This includes, but is not limited to, loans, leases, held-to-maturitysecurities, loan commitments, and financial guarantees. The CECL model does not apply to available-for-sale (“AFS”) debt securities. For AFS debtsecurities with unrealized losses, entities will measure credit losses in a manner similar to what they do today, except that the credit losses will be recognizedas allowances rather than reductions in the amortized cost of the securities. As a result, entities will recognize improvements to estimated credit lossesimmediately in earnings rather than as interest income over time, as they do today. The ASU also simplifies the accounting model for purchased credit-impaired debt securities and loans. ASU 2016-13 also expands the disclosure requirements regarding an entity’s assumptions, models, and methods forestimating the allowance for loan and lease losses. In addition, entities will need to disclose the amortized cost balance for each class of financial asset bycredit quality indicator, disaggregated by the year of origination. ASU No. 2016-13 is effective for interim and annual reporting periods beginning afterDecember 15, 2019; early adoption is permitted for interim and annual reporting periods beginning after December 15, 2018. Entities will apply thestandard’s provisions as a cumulative-effect adjustment to retained earnings as of the beginning of the first reporting period in which the guidance is effective(i.e., modified retrospective approach). The Company is continuing its implementation efforts through its Company-wide implementation team. This team hasassigned roles and responsibilities, key tasks to complete, and a general timeline to be followed. The implementation team meets periodically to discuss thelatest developments and ensure progress is being made. The team also keeps current on evolving interpretations and industry practices related to ASU 2016-13 via webcasts, publications, conferences, and peer bank meetings. The team continues to evaluate and validate data resources and different lossmethodologies. The Company has also engaged an outside consultant to assist with the methodology review and validation, as well as other key aspects ofimplementing the standard. The Company’s preliminary evaluation indicates the provisions of ASU No. 2016-13 are expected to impact the Company’sConsolidated Financial Statements, in particular the level of the reserve for credit losses. However, the Company continues to evaluate the extent of thepotential impact.
In August 2017, the FASB issued ASU No. 2017-12, “Targeted Improvements to Accounting for Hedging Activities.” This ASU’s objectives are to (1)improve the transparency and understandability of information conveyed to financial statement users about an entity’s risk management activities by betteraligning the entity’s financial reporting for hedging relationships with those risk management activities; and (2) reduce the complexity of and simplify theapplication of hedge accounting by preparers. ASU No. 2017-12 is effective for interim and annual reporting periods beginning after December 15, 2018;early adoption is permitted. The Company currently does not designate any derivative financial instruments as formal hedging relationships, and therefore,does not utilize hedge accounting. However, the Company is currently evaluating this ASU to determine whether its provisions will enhance the Company’sability to employ risk management strategies, while improving the transparency and understanding of those strategies for financial statement users.
11

Table of Contents
Note 2. Cash and Cash Equivalents
The following table provides a reconciliation of cash and cash equivalents reported within the consolidated statements of condition that sum to the total of thesame such amounts shown in the consolidated statements of cash flows:
(dollars in thousands)March 31,
2018 December 31,
2017
Interest-Bearing Deposits in Other Banks $ 2,589 $ 3,421Funds Sold 387,766 181,413Cash and Due From Banks 174,871 263,017Total Cash and Cash Equivalents $ 565,226 $ 447,851
12
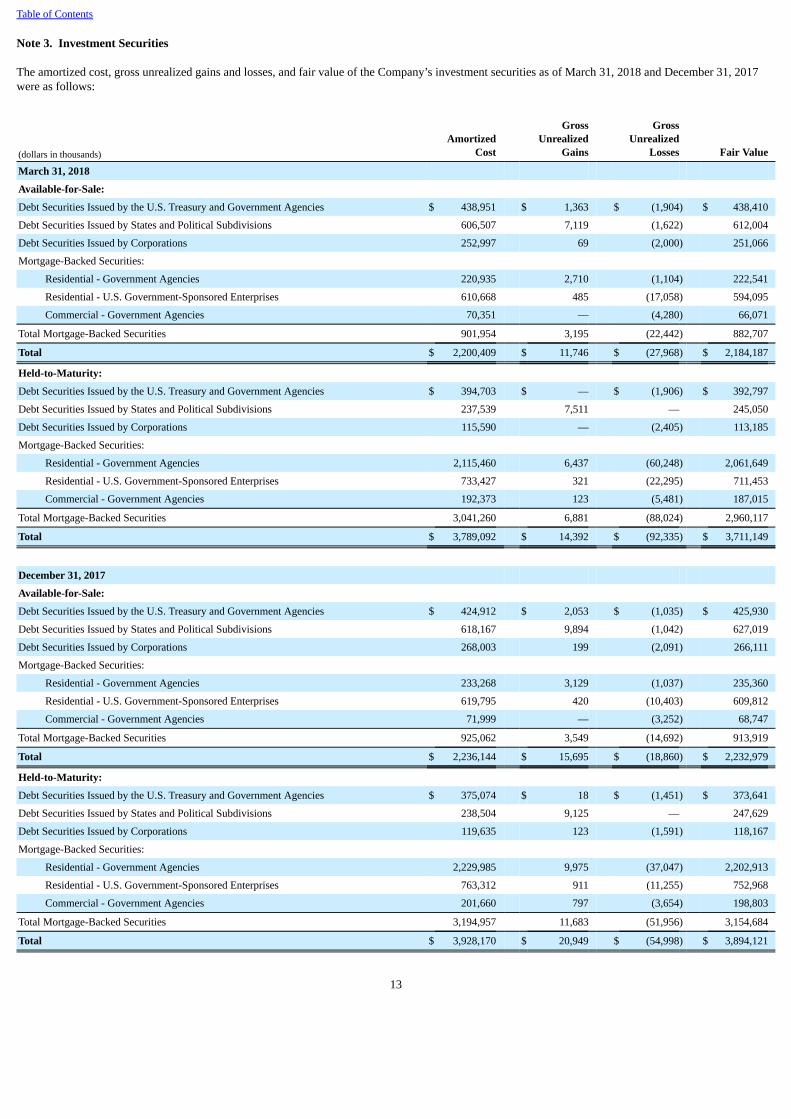
Table of Contents
Note 3. Investment Securities
The amortized cost, gross unrealized gains and losses, and fair value of the Company’s investment securities as of March 31, 2018 and December 31, 2017were as follows:
(dollars in thousands)Amortized
Cost
GrossUnrealized
Gains
GrossUnrealized
Losses Fair Value
March 31, 2018
Available-for-Sale:
Debt Securities Issued by the U.S. Treasury and Government Agencies $ 438,951 $ 1,363 $ (1,904) $ 438,410
Debt Securities Issued by States and Political Subdivisions 606,507 7,119 (1,622) 612,004
Debt Securities Issued by Corporations 252,997 69 (2,000) 251,066
Mortgage-Backed Securities:
Residential - Government Agencies 220,935 2,710 (1,104) 222,541
Residential - U.S. Government-Sponsored Enterprises 610,668 485 (17,058) 594,095
Commercial - Government Agencies 70,351 — (4,280) 66,071
Total Mortgage-Backed Securities 901,954 3,195 (22,442) 882,707
Total $ 2,200,409 $ 11,746 $ (27,968) $ 2,184,187
Held-to-Maturity:
Debt Securities Issued by the U.S. Treasury and Government Agencies $ 394,703 $ — $ (1,906) $ 392,797
Debt Securities Issued by States and Political Subdivisions 237,539 7,511 — 245,050
Debt Securities Issued by Corporations 115,590 — (2,405) 113,185
Mortgage-Backed Securities:
Residential - Government Agencies 2,115,460 6,437 (60,248) 2,061,649
Residential - U.S. Government-Sponsored Enterprises 733,427 321 (22,295) 711,453
Commercial - Government Agencies 192,373 123 (5,481) 187,015
Total Mortgage-Backed Securities 3,041,260 6,881 (88,024) 2,960,117
Total $ 3,789,092 $ 14,392 $ (92,335) $ 3,711,149
December 31, 2017
Available-for-Sale:
Debt Securities Issued by the U.S. Treasury and Government Agencies $ 424,912 $ 2,053 $ (1,035) $ 425,930
Debt Securities Issued by States and Political Subdivisions 618,167 9,894 (1,042) 627,019
Debt Securities Issued by Corporations 268,003 199 (2,091) 266,111
Mortgage-Backed Securities:
Residential - Government Agencies 233,268 3,129 (1,037) 235,360
Residential - U.S. Government-Sponsored Enterprises 619,795 420 (10,403) 609,812
Commercial - Government Agencies 71,999 — (3,252) 68,747
Total Mortgage-Backed Securities 925,062 3,549 (14,692) 913,919
Total $ 2,236,144 $ 15,695 $ (18,860) $ 2,232,979
Held-to-Maturity:
Debt Securities Issued by the U.S. Treasury and Government Agencies $ 375,074 $ 18 $ (1,451) $ 373,641
Debt Securities Issued by States and Political Subdivisions 238,504 9,125 — 247,629
Debt Securities Issued by Corporations 119,635 123 (1,591) 118,167
Mortgage-Backed Securities:
Residential - Government Agencies 2,229,985 9,975 (37,047) 2,202,913
Residential - U.S. Government-Sponsored Enterprises 763,312 911 (11,255) 752,968
Commercial - Government Agencies 201,660 797 (3,654) 198,803
Total Mortgage-Backed Securities 3,194,957 11,683 (51,956) 3,154,684
Total $ 3,928,170 $ 20,949 $ (54,998) $ 3,894,121
13

Table of Contents
The table below presents an analysis of the contractual maturities of the Company’s investment securities as of March 31, 2018. Debt securities issued bygovernment agencies (Small Business Administration securities) and mortgage-backed securities are disclosed separately in the table below as theseinvestment securities may prepay prior to their scheduled contractual maturity dates.
(dollars in thousands) Amortized Cost Fair Value
Available-for-Sale:
Due in One Year or Less $ 82,510 $ 82,492
Due After One Year Through Five Years 610,230 609,665
Due After Five Years Through Ten Years 144,294 147,503
Due After Ten Years 23,020 23,945
860,054 863,605
Debt Securities Issued by Government Agencies 438,401 437,875
Mortgage-Backed Securities:
Residential - Government Agencies 220,935 222,541
Residential - U.S. Government-Sponsored Enterprises 610,668 594,095
Commercial - Government Agencies 70,351 66,071
Total Mortgage-Backed Securities 901,954 882,707
Total $ 2,200,409 $ 2,184,187
Held-to-Maturity:
Due in One Year or Less $ 284,876 $ 284,063
Due After One Year Through Five Years 200,331 200,997
Due After Five Years Through Ten Years 235,187 237,411
Due After Ten Years 27,438 28,561
747,832 751,032
Mortgage-Backed Securities:
Residential - Government Agencies 2,115,460 2,061,649
Residential - U.S. Government-Sponsored Enterprises 733,427 711,453
Commercial - Government Agencies 192,373 187,015
Total Mortgage-Backed Securities 3,041,260 2,960,117
Total $ 3,789,092 $ 3,711,149
Investment securities with carrying values of $2.5 billion and $2.4 billion as of March 31, 2018 and December 31, 2017, respectively, were pledged to securedeposits of governmental entities and securities sold under agreements to repurchase.
The table below presents the gains and losses from the sales of investment securities for the three months ended March 31, 2018 and 2017.
Three Months Ended
March 31,
(dollars in thousands) 2018 2017
Gross Gains on Sales of Investment Securities $ — $ 12,467
Gross Losses on Sales of Investment Securities (666) (334)
Net Gains (Losses) on Sales of Investment Securities $ (666) $ 12,133
The losses during the three months ended March 31, 2018 and 2017 were due to fees paid to the counterparties of our prior Visa Class B share saletransactions which are expensed as incurred.
14

Table of Contents
The Company’s gross unrealized losses and the related fair value of investment securities, aggregated by investment category and length of time in acontinuous unrealized loss position, were as follows:
Less Than 12 Months 12 Months or Longer Total
(dollars in thousands) Fair Value Gross
UnrealizedLosses Fair Value
GrossUnrealized
Losses Fair Value Gross
UnrealizedLosses
March 31, 2018
Available-for-Sale: Debt Securities Issued by the U.S. Treasury and Government Agencies $ 198,606 $ (1,124) $ 122,552 $ (780) $ 321,158 $ (1,904)Debt Securities Issued by States and Political Subdivisions 211,831 (1,613) 679 (9) 212,510 (1,622)
Debt Securities Issued by Corporations 39,958 (42) 186,038 (1,958) 225,996 (2,000)
Mortgage-Backed Securities:
Residential - Government Agencies 4,782 (38) 19,530 (1,066) 24,312 (1,104)
Residential - U.S. Government-Sponsored Enterprises 400,447 (10,337) 150,143 (6,721) 550,590 (17,058)
Commercial - Government Agencies — — 66,071 (4,280) 66,071 (4,280)
Total Mortgage-Backed Securities 405,229 (10,375) 235,744 (12,067) 640,973 (22,442)
Total $ 855,624 $ (13,154) $ 545,013 $ (14,814) $ 1,400,637 $ (27,968)
Held-to-Maturity: Debt Securities Issued by the U.S. Treasury and Government Agencies $ 273,603 $ (807) $ 119,195 $ (1,099) $ 392,798 $ (1,906)
Debt Securities Issued by Corporations 56,855 (517) 56,330 (1,888) 113,185 (2,405)
Mortgage-Backed Securities:
Residential - Government Agencies 1,101,266 (27,870) 666,461 (32,378) 1,767,727 (60,248)
Residential - U.S. Government-Sponsored Enterprises 383,734 (9,124) 320,791 (13,171) 704,525 (22,295)
Commercial - Government Agencies 75,948 (677) 79,496 (4,804) 155,444 (5,481)
Total Mortgage-Backed Securities 1,560,948 (37,671) 1,066,748 (50,353) 2,627,696 (88,024)
Total $ 1,891,406 $ (38,995) $ 1,242,273 $ (53,340) $ 3,133,679 $ (92,335)
December 31, 2017
Available-for-Sale: Debt Securities Issued by the U.S. Treasury and Government Agencies $ 103,842 $ (599) $ 132,071 $ (436) $ 235,913 $ (1,035)Debt Securities Issued by States and Political Subdivisions 172,343 (1,032) 734 (10) 173,077 (1,042)
Debt Securities Issued by Corporations 12,985 (15) 192,927 (2,076) 205,912 (2,091)
Mortgage-Backed Securities:
Residential - Government Agencies 11,035 (4) 10,618 (1,033) 21,653 (1,037)
Residential - U.S. Government-Sponsored Enterprises 429,342 (5,720) 150,887 (4,683) 580,229 (10,403)
Commercial - Government Agencies — — 68,747 (3,252) 68,747 (3,252)
Total Mortgage-Backed Securities 440,377 (5,724) 230,252 (8,968) 670,629 (14,692)
Total $ 729,547 $ (7,370) $ 555,984 $ (11,490) $ 1,285,531 $ (18,860)
Held-to-Maturity: Debt Securities Issued by the U.S. Treasuryand Government Agencies $ 254,283 $ (532) $ 89,391 $ (919) $ 343,674 $ (1,451)
Debt Securities Issued by Corporations 25,490 (110) 58,869 (1,481) 84,359 (1,591)
Mortgage-Backed Securities:
Residential - Government Agencies 1,030,472 (12,262) 704,545 (24,785) 1,735,017 (37,047)
Residential - U.S. Government-Sponsored Enterprises 293,530 (3,106) 339,232 (8,149) 632,762 (11,255)
Commercial - Government Agencies 497 (5) 82,288 (3,649) 82,785 (3,654)
Total Mortgage-Backed Securities 1,324,499 (15,373) 1,126,065 (36,583) 2,450,564 (51,956)
Total $ 1,604,272 $ (16,015) $ 1,274,325 $ (38,983) $ 2,878,597 $ (54,998)
15

Table of Contents
The Company does not believe that the investment securities that were in an unrealized loss position as of March 31, 2018, which were comprised of 469securities, represent an other-than-temporary impairment. Total gross unrealized losses were primarily attributable to changes in interest rates, relative towhen the investment securities were purchased, and not due to the credit quality of the investment securities. As of March 31, 2018 and December 31, 2017,the gross unrealized losses reported for mortgage-backed securities were mostly related to investment securities issued by the Government National MortgageAssociation. The Company does not intend to sell the investment securities that were in an unrealized loss position and it is not more likely than not that theCompany will be required to sell the investment securities before recovery of their amortized cost basis, which may be at maturity.
Interest income from taxable and non-taxable investment securities for the three months ended March 31, 2018 and 2017 were as follows:
Three Months Ended
March 31,
(dollars in thousands) 2018 2017
Taxable $ 28,671 $ 25,767
Non-Taxable 4,766 5,023
Total Interest Income from Investment Securities $ 33,437 $ 30,790
As of March 31, 2018, included in the Company’s investment securities portfolio were debt securities issued by political subdivisions within the State ofHawaii of $488.4 million, representing 57% of the total fair value of the Company’s municipal debt securities. Of the entire Hawaii municipal bond portfolio,94% were credit-rated Aa2 or better by Moody’s while the remaining Hawaii municipal bonds were credit-rated A1 or better by at least one nationallyrecognized statistical rating organization. Of the Company’s total Hawaii municipal bond holdings, 79% were general obligation issuances. As of March 31,2018, there were no other holdings of municipal debt securities that were issued by a single state or political subdivision which comprised more than 10% ofthe total fair value of the Company’s municipal debt securities.
As of March 31, 2018 and December 31, 2017, the carrying value of the Company’s Federal Home Loan Bank of Des Moines stock and Federal ReserveBank stock was as follows:
(dollars in thousands)March 31,
2018 December 31,
2017
Federal Home Loan Bank Stock $ 19,000 $ 20,000
Federal Reserve Bank Stock 20,745 20,645
Total $ 39,745 $ 40,645
These securities can only be redeemed or sold at their par value and only to the respective issuing government-supported institution or to another memberinstitution. The Company records these non-marketable equity securities as a component of other assets and periodically evaluates these securities forimpairment. Management considers these non-marketable equity securities to be long-term investments. Accordingly, when evaluating these securities forimpairment, management considers the ultimate recoverability of the par value rather than recognizing temporary declines in value.
Visa Class B Restricted Shares
In 2008, the Company received Visa Class B restricted shares as part of Visa’s initial public offering. These shares are transferable only under limitedcircumstances until they can be converted into the publicly traded Class A common shares. This conversion will not occur until the settlement of certainlitigation which is indemnified by Visa members, including the Company. Visa funded an escrow account from its initial public offering to settle theselitigation claims. Should this escrow account be insufficient to cover these litigation claims, Visa is entitled to fund additional amounts to the escrow accountby reducing each member bank’s Class B conversion ratio to unrestricted Class A shares. As of March 31, 2018, the conversion ratio was 1.6483.
The Company occasionally sells these Visa Class B shares to other financial institutions. Concurrent with every sale the Company entered into an agreementwith the buyer that requires payment to the buyer in the event Visa further reduces the conversion ratio. Based on the existing transfer restriction and theuncertainty of the outcome of the Visa litigation mentioned above, the remaining 86,614 Class B shares (142,766 Class A equivalents) that the Companyowns as of March 31, 2018 are carried at a zero cost basis.
16

Table of Contents
Note 4. Loans and Leases and the Allowance for Loan and Lease Losses
Loans and Leases
The Company’s loan and lease portfolio was comprised of the following as of March 31, 2018 and December 31, 2017:
(dollars in thousands)March 31,
2018 December 31,
2017
Commercial
Commercial and Industrial $ 1,329,096 $ 1,279,347
Commercial Mortgage 2,097,339 2,103,967
Construction 186,530 202,253
Lease Financing 179,771 180,931
Total Commercial 3,792,736 3,766,498
Consumer
Residential Mortgage 3,505,239 3,466,773
Home Equity 1,601,698 1,585,455
Automobile 558,468 528,474
Other 1 458,487 449,747
Total Consumer 6,123,892 6,030,449
Total Loans and Leases $ 9,916,628 $ 9,796,947
1 Comprised of other revolving credit, installment, and lease financing.
The majority of the Company’s lending activity is with customers located in the State of Hawaii. A substantial portion of the Company’s real estate loans aresecured by real estate in Hawaii.
Net gains related to sales of residential mortgage loans, recorded as a component of mortgage banking income were $0.3 million and $1.3 million for thethree months ended March 31, 2018 and 2017, respectively.
17
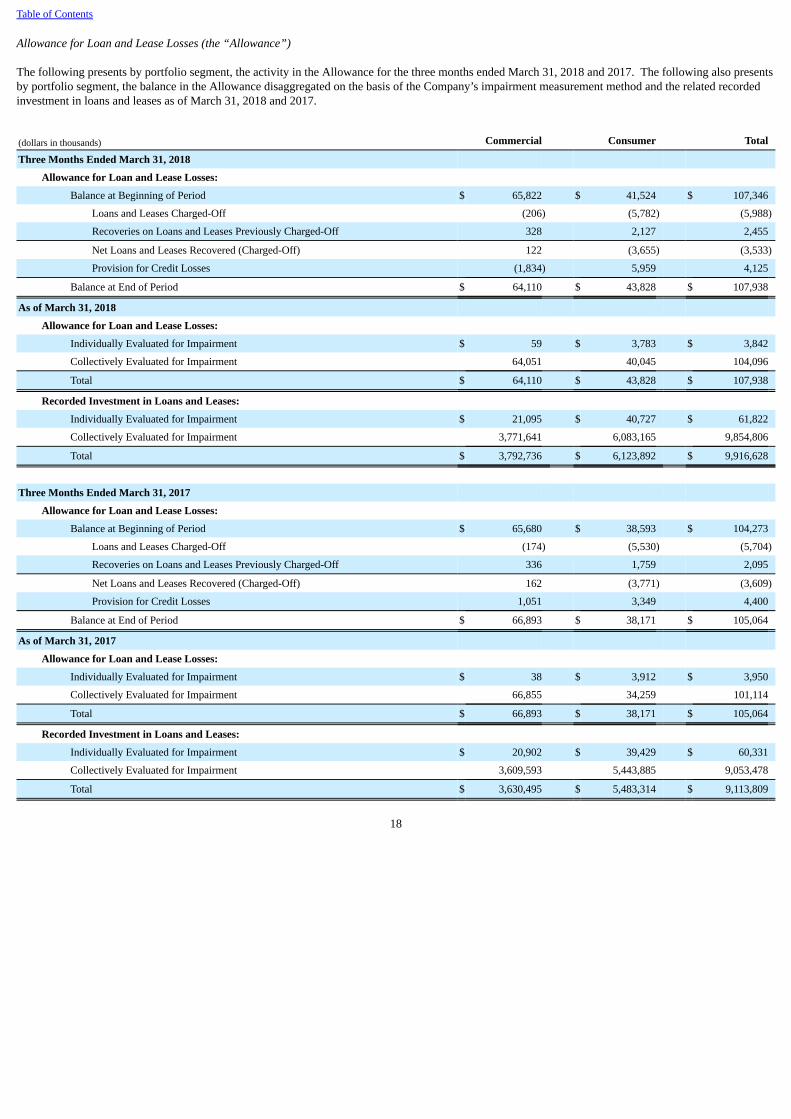
Table of Contents
Allowance for Loan and Lease Losses (the “Allowance”)
The following presents by portfolio segment, the activity in the Allowance for the three months ended March 31, 2018 and 2017. The following also presentsby portfolio segment, the balance in the Allowance disaggregated on the basis of the Company’s impairment measurement method and the related recordedinvestment in loans and leases as of March 31, 2018 and 2017.
(dollars in thousands) Commercial Consumer Total
Three Months Ended March 31, 2018
Allowance for Loan and Lease Losses:
Balance at Beginning of Period $ 65,822 $ 41,524 $ 107,346
Loans and Leases Charged-Off (206) (5,782) (5,988)
Recoveries on Loans and Leases Previously Charged-Off 328 2,127 2,455
Net Loans and Leases Recovered (Charged-Off) 122 (3,655) (3,533)
Provision for Credit Losses (1,834) 5,959 4,125
Balance at End of Period $ 64,110 $ 43,828 $ 107,938
As of March 31, 2018
Allowance for Loan and Lease Losses:
Individually Evaluated for Impairment $ 59 $ 3,783 $ 3,842
Collectively Evaluated for Impairment 64,051 40,045 104,096
Total $ 64,110 $ 43,828 $ 107,938
Recorded Investment in Loans and Leases:
Individually Evaluated for Impairment $ 21,095 $ 40,727 $ 61,822
Collectively Evaluated for Impairment 3,771,641 6,083,165 9,854,806
Total $ 3,792,736 $ 6,123,892 $ 9,916,628
Three Months Ended March 31, 2017
Allowance for Loan and Lease Losses:
Balance at Beginning of Period $ 65,680 $ 38,593 $ 104,273
Loans and Leases Charged-Off (174) (5,530) (5,704)
Recoveries on Loans and Leases Previously Charged-Off 336 1,759 2,095
Net Loans and Leases Recovered (Charged-Off) 162 (3,771) (3,609)
Provision for Credit Losses 1,051 3,349 4,400
Balance at End of Period $ 66,893 $ 38,171 $ 105,064
As of March 31, 2017
Allowance for Loan and Lease Losses:
Individually Evaluated for Impairment $ 38 $ 3,912 $ 3,950
Collectively Evaluated for Impairment 66,855 34,259 101,114
Total $ 66,893 $ 38,171 $ 105,064
Recorded Investment in Loans and Leases:
Individually Evaluated for Impairment $ 20,902 $ 39,429 $ 60,331
Collectively Evaluated for Impairment 3,609,593 5,443,885 9,053,478
Total $ 3,630,495 $ 5,483,314 $ 9,113,809
18
Table of Contents
Credit Quality Indicators
The Company uses several credit quality indicators to manage credit risk in an ongoing manner. The Company uses an internal credit risk rating system thatcategorizes loans and leases into pass, special mention, or classified categories. Credit risk ratings are applied individually to those classes of loans and leasesthat have significant or unique credit characteristics that benefit from a case-by-case evaluation. These are typically loans and leases to businesses orindividuals in the classes which comprise the commercial portfolio segment. Groups of loans and leases that are underwritten and structured usingstandardized criteria and characteristics, such as statistical models (e.g., credit scoring or payment performance), are typically risk-rated and monitoredcollectively. These are typically loans and leases to individuals in the classes which comprise the consumer portfolio segment.
The following are the definitions of the Company’s credit quality indicators:
Pass: Loans and leases in all classes within the commercial and consumer portfolio segments that are not adversely rated, arecontractually current as to principal and interest, and are otherwise in compliance with the contractual terms of the loan or leaseagreement. Management believes that there is a low likelihood of loss related to those loans and leases that are considered pass.
Special Mention: Loans and leases that have potential weaknesses that deserve management’s close attention. If not addressed, these potentialweaknesses may result in deterioration of the repayment prospects for the loan or lease. Management believes that there is amoderate likelihood of some loss related to those loans and leases that are considered special mention.
Classified: Loans and leases in the classes within the commercial portfolio segment that are inadequately protected by the sound worth andpaying capacity of the borrower or of the collateral pledged, if any. Classified loans and leases are also those in the classes withinthe consumer portfolio segment that are past due 90 days or more as to principal or interest. Residential mortgage loans that arepast due 90 days or more as to principal or interest may be considered pass if the Company is in the process of collection and thecurrent loan-to-value ratio is 60% or less. Home equity loans that are past due 90 days or more as to principal or interest may beconsidered pass if the Company is in the process of collection, the first mortgage is with the Company, and the current combinedloan-to-value ratio is 60% or less. Residential mortgage and home equity loans may be current as to principal and interest, but maybe considered classified for a period of generally up to six months following a loan modification. Following a period ofdemonstrated performance in accordance with the modified contractual terms, the loan may be removed from classified status.Management believes that there is a distinct possibility that the Company will sustain some loss if the deficiencies related toclassified loans and leases are not corrected in a timely manner.
19

Table of Contents
The Company’s credit quality indicators are periodically updated on a case-by-case basis. The following presents by class and by credit quality indicator, therecorded investment in the Company’s loans and leases as of March 31, 2018 and December 31, 2017.
March 31, 2018
(dollars in thousands)Commercial
and Industrial Commercial
Mortgage Construction Lease
Financing Total
Commercial
Pass $ 1,289,103 $ 2,041,154 $ 183,240 $ 179,401 $ 3,692,898
Special Mention 22,506 36,431 — 10 58,947
Classified 17,487 19,754 3,290 360 40,891
Total $ 1,329,096 $ 2,097,339 $ 186,530 $ 179,771 $ 3,792,736
(dollars in thousands)Residential
Mortgage Home
Equity Automobile Other 1 Total
Consumer
Pass $ 3,498,291 $ 1,597,383 $ 558,135 $ 457,702 $ 6,111,511
Classified 6,948 4,315 333 785 12,381
Total $ 3,505,239 $ 1,601,698 $ 558,468 $ 458,487 $ 6,123,892
Total Recorded Investment in Loans and Leases
$ 9,916,628
December 31, 2017
(dollars in thousands)Commercial
and Industrial Commercial
Mortgage Construction Lease
Financing Total
Commercial
Pass $ 1,234,738 $ 2,046,745 $ 198,926 $ 180,522 $ 3,660,931
Special Mention 15,394 35,762 6 11 51,173
Classified 29,215 21,460 3,321 398 54,394
Total $ 1,279,347 $ 2,103,967 $ 202,253 $ 180,931 $ 3,766,498
(dollars in thousands)Residential
Mortgage Home
Equity Automobile Other 1 Total
Consumer
Pass $ 3,457,531 $ 1,580,917 $ 527,587 $ 449,008 $ 6,015,043
Classified 9,242 4,538 887 739 15,406
Total $ 3,466,773 $ 1,585,455 $ 528,474 $ 449,747 $ 6,030,449
Total Recorded Investment in Loans and Leases
$ 9,796,947
1 Comprised of other revolving credit, installment, and lease financing.
20
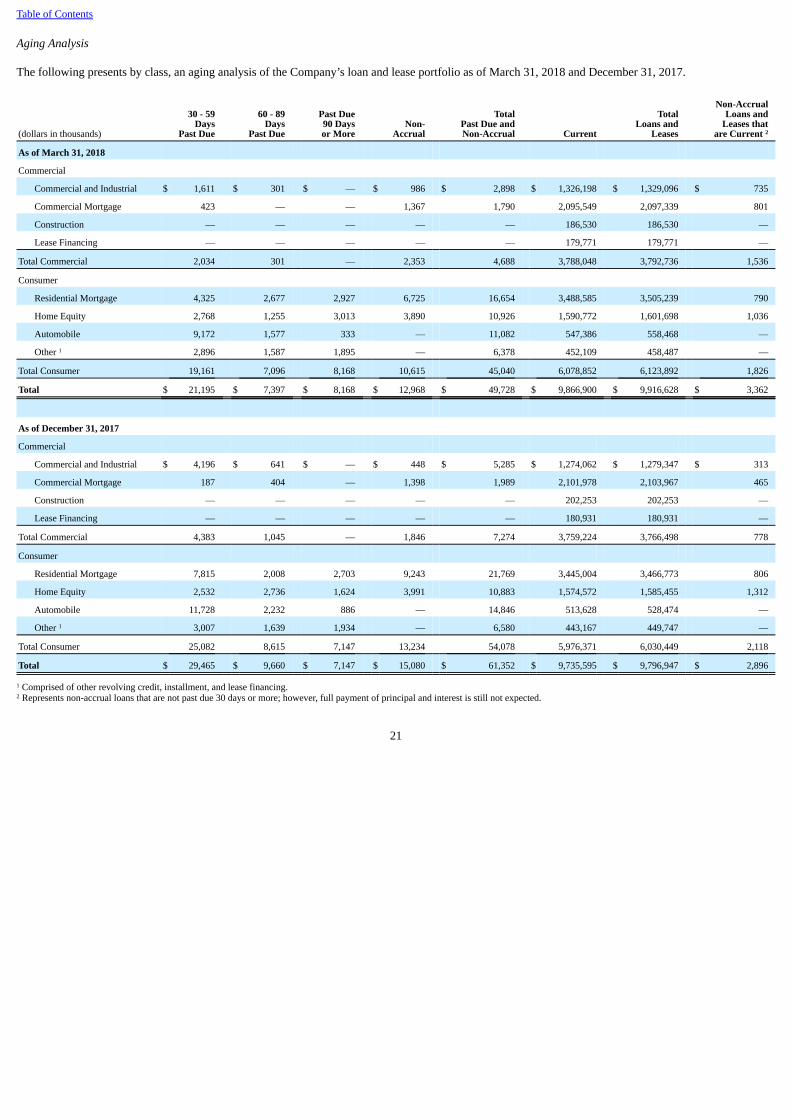
Table of Contents
Aging Analysis
The following presents by class, an aging analysis of the Company’s loan and lease portfolio as of March 31, 2018 and December 31, 2017.
(dollars in thousands)
30 - 59Days
Past Due 60 - 89
DaysPast Due
Past Due90 Daysor More
Non-Accrual
TotalPast Due andNon-Accrual Current
TotalLoans and
Leases
Non-AccrualLoans and
Leases thatare Current 2
As of March 31, 2018
Commercial
Commercial and Industrial $ 1,611 $ 301 $ — $ 986 $ 2,898 $ 1,326,198 $ 1,329,096 $ 735
Commercial Mortgage 423 — — 1,367 1,790 2,095,549 2,097,339 801
Construction — — — — — 186,530 186,530 —
Lease Financing — — — — — 179,771 179,771 —
Total Commercial 2,034 301 — 2,353 4,688 3,788,048 3,792,736 1,536
Consumer
Residential Mortgage 4,325 2,677 2,927 6,725 16,654 3,488,585 3,505,239 790
Home Equity 2,768 1,255 3,013 3,890 10,926 1,590,772 1,601,698 1,036
Automobile 9,172 1,577 333 — 11,082 547,386 558,468 —
Other 1 2,896 1,587 1,895 — 6,378 452,109 458,487 —
Total Consumer 19,161 7,096 8,168 10,615 45,040 6,078,852 6,123,892 1,826
Total $ 21,195 $ 7,397 $ 8,168 $ 12,968 $ 49,728 $ 9,866,900 $ 9,916,628 $ 3,362
As of December 31, 2017
Commercial
Commercial and Industrial $ 4,196 $ 641 $ — $ 448 $ 5,285 $ 1,274,062 $ 1,279,347 $ 313
Commercial Mortgage 187 404 — 1,398 1,989 2,101,978 2,103,967 465
Construction — — — — — 202,253 202,253 —
Lease Financing — — — — — 180,931 180,931 —
Total Commercial 4,383 1,045 — 1,846 7,274 3,759,224 3,766,498 778
Consumer
Residential Mortgage 7,815 2,008 2,703 9,243 21,769 3,445,004 3,466,773 806
Home Equity 2,532 2,736 1,624 3,991 10,883 1,574,572 1,585,455 1,312
Automobile 11,728 2,232 886 — 14,846 513,628 528,474 —
Other 1 3,007 1,639 1,934 — 6,580 443,167 449,747 —
Total Consumer 25,082 8,615 7,147 13,234 54,078 5,976,371 6,030,449 2,118
Total $ 29,465 $ 9,660 $ 7,147 $ 15,080 $ 61,352 $ 9,735,595 $ 9,796,947 $ 2,896
1 Comprised of other revolving credit, installment, and lease financing.2 Represents non-accrual loans that are not past due 30 days or more; however, full payment of principal and interest is still not expected.
21

Table of Contents
Impaired Loans
The following presents by class, information related to impaired loans as of March 31, 2018 and December 31, 2017.
(dollars in thousands)
Recorded Investment
Unpaid Principal
Balance
Related Allowance for
Loan Losses
March 31, 2018
Impaired Loans with No Related Allowance Recorded:
Commercial
Commercial and Industrial $ 8,982 $ 12,596 $ —
Commercial Mortgage 9,498 12,998 —
Construction 1,399 1,399 —
Total Commercial 19,879 26,993 —
Total Impaired Loans with No Related Allowance Recorded $ 19,879 $ 26,993 $ —
Impaired Loans with an Allowance Recorded:
Commercial
Commercial and Industrial $ 968 $ 1,659 $ 34
Commercial Mortgage 248 248 25
Total Commercial 1,216 1,907 59
Consumer
Residential Mortgage 20,399 25,142 3,080
Home Equity 1,953 1,953 276
Automobile 15,627 15,627 337
Other 1 2,748 2,748 90
Total Consumer 40,727 45,470 3,783
Total Impaired Loans with an Allowance Recorded $ 41,943 $ 47,377 $ 3,842
Impaired Loans: Commercial $ 21,095 $ 28,900 $ 59
Consumer 40,727 45,470 3,783
Total Impaired Loans $ 61,822 $ 74,370 $ 3,842
December 31, 2017
Impaired Loans with No Related Allowance Recorded:
Commercial
Commercial and Industrial $ 8,094 $ 15,747 $ —
Commercial Mortgage 8,696 12,196 —
Construction 1,415 1,415 —
Total Commercial 18,205 29,358 —
Total Impaired Loans with No Related Allowance Recorded $ 18,205 $ 29,358 $ —
Impaired Loans with an Allowance Recorded:
Commercial
Commercial and Industrial $ 811 $ 811 $ 21
Commercial Mortgage 1,200 1,200 120
Total Commercial 2,011 2,011 141
Consumer
Residential Mortgage 21,581 26,324 3,118
Home Equity 1,965 1,965 276
Automobile 14,811 14,811 305
Other 1 2,645 2,645 76
Total Consumer 41,002 45,745 3,775
Total Impaired Loans with an Allowance Recorded $ 43,013 $ 47,756 $ 3,916
Impaired Loans:
Commercial $ 20,216 $ 31,369 $ 141
Consumer 41,002 45,745 3,775
Total Impaired Loans $ 61,218 $ 77,114 $ 3,916

1 Comprised of other revolving credit and installment financing.
22
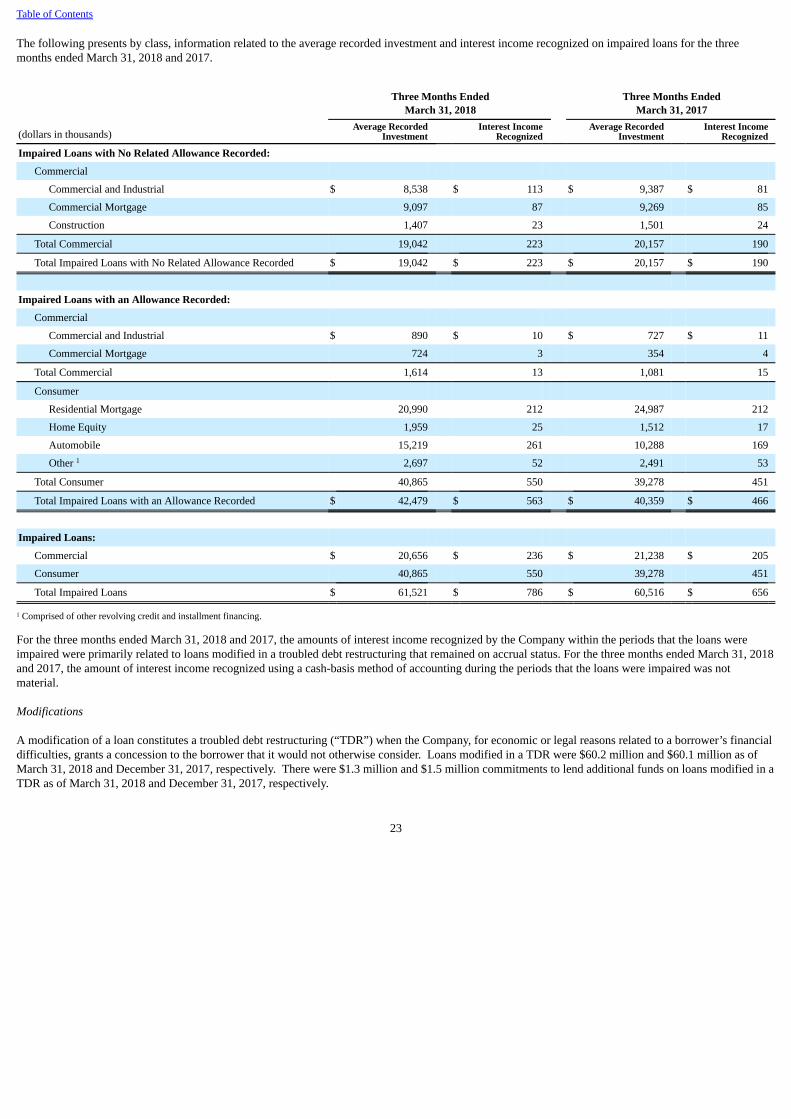
Table of Contents
The following presents by class, information related to the average recorded investment and interest income recognized on impaired loans for the threemonths ended March 31, 2018 and 2017.
Three Months Ended
March 31, 2018 Three Months Ended
March 31, 2017
(dollars in thousands)Average Recorded
Investment Interest Income
Recognized Average Recorded
Investment Interest Income
Recognized
Impaired Loans with No Related Allowance Recorded:
Commercial
Commercial and Industrial $ 8,538 $ 113 $ 9,387 $ 81
Commercial Mortgage 9,097 87 9,269 85
Construction 1,407 23 1,501 24
Total Commercial 19,042 223 20,157 190
Total Impaired Loans with No Related Allowance Recorded $ 19,042 $ 223 $ 20,157 $ 190
Impaired Loans with an Allowance Recorded:
Commercial
Commercial and Industrial $ 890 $ 10 $ 727 $ 11
Commercial Mortgage 724 3 354 4
Total Commercial 1,614 13 1,081 15
Consumer
Residential Mortgage 20,990 212 24,987 212
Home Equity 1,959 25 1,512 17
Automobile 15,219 261 10,288 169
Other 1 2,697 52 2,491 53
Total Consumer 40,865 550 39,278 451
Total Impaired Loans with an Allowance Recorded $ 42,479 $ 563 $ 40,359 $ 466
Impaired Loans:
Commercial $ 20,656 $ 236 $ 21,238 $ 205
Consumer 40,865 550 39,278 451
Total Impaired Loans $ 61,521 $ 786 $ 60,516 $ 656
1 Comprised of other revolving credit and installment financing.
For the three months ended March 31, 2018 and 2017, the amounts of interest income recognized by the Company within the periods that the loans wereimpaired were primarily related to loans modified in a troubled debt restructuring that remained on accrual status. For the three months ended March 31, 2018and 2017, the amount of interest income recognized using a cash-basis method of accounting during the periods that the loans were impaired was notmaterial.
Modifications
A modification of a loan constitutes a troubled debt restructuring (“TDR”) when the Company, for economic or legal reasons related to a borrower’s financialdifficulties, grants a concession to the borrower that it would not otherwise consider. Loans modified in a TDR were $60.2 million and $60.1 million as ofMarch 31, 2018 and December 31, 2017, respectively. There were $1.3 million and $1.5 million commitments to lend additional funds on loans modified in aTDR as of March 31, 2018 and December 31, 2017, respectively.
23
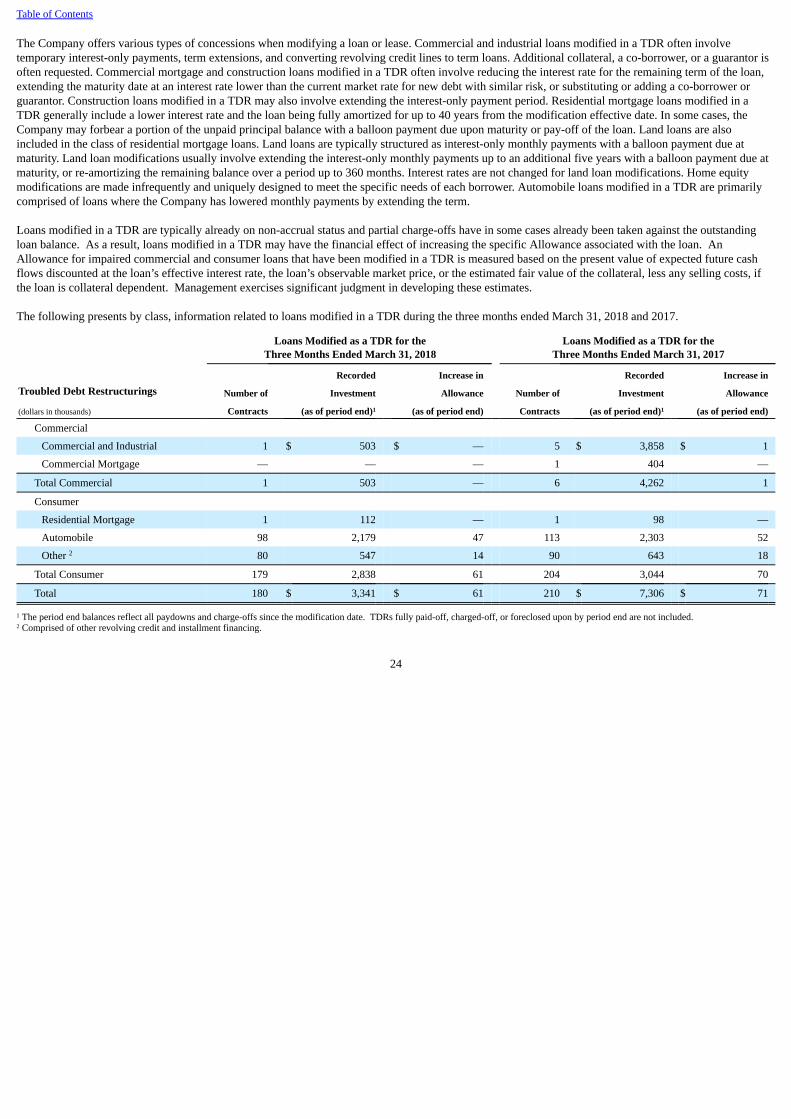
Table of Contents
The Company offers various types of concessions when modifying a loan or lease. Commercial and industrial loans modified in a TDR often involvetemporary interest-only payments, term extensions, and converting revolving credit lines to term loans. Additional collateral, a co-borrower, or a guarantor isoften requested. Commercial mortgage and construction loans modified in a TDR often involve reducing the interest rate for the remaining term of the loan,extending the maturity date at an interest rate lower than the current market rate for new debt with similar risk, or substituting or adding a co-borrower orguarantor. Construction loans modified in a TDR may also involve extending the interest-only payment period. Residential mortgage loans modified in aTDR generally include a lower interest rate and the loan being fully amortized for up to 40 years from the modification effective date. In some cases, theCompany may forbear a portion of the unpaid principal balance with a balloon payment due upon maturity or pay-off of the loan. Land loans are alsoincluded in the class of residential mortgage loans. Land loans are typically structured as interest-only monthly payments with a balloon payment due atmaturity. Land loan modifications usually involve extending the interest-only monthly payments up to an additional five years with a balloon payment due atmaturity, or re-amortizing the remaining balance over a period up to 360 months. Interest rates are not changed for land loan modifications. Home equitymodifications are made infrequently and uniquely designed to meet the specific needs of each borrower. Automobile loans modified in a TDR are primarilycomprised of loans where the Company has lowered monthly payments by extending the term.
Loans modified in a TDR are typically already on non-accrual status and partial charge-offs have in some cases already been taken against the outstandingloan balance. As a result, loans modified in a TDR may have the financial effect of increasing the specific Allowance associated with the loan. AnAllowance for impaired commercial and consumer loans that have been modified in a TDR is measured based on the present value of expected future cashflows discounted at the loan’s effective interest rate, the loan’s observable market price, or the estimated fair value of the collateral, less any selling costs, ifthe loan is collateral dependent. Management exercises significant judgment in developing these estimates.
The following presents by class, information related to loans modified in a TDR during the three months ended March 31, 2018 and 2017.
Loans Modified as a TDR for the
Three Months Ended March 31, 2018 Loans Modified as a TDR for the
Three Months Ended March 31, 2017
Recorded Increase in Recorded Increase in
Troubled Debt Restructurings Number of Investment Allowance Number of Investment Allowance
(dollars in thousands) Contracts (as of period end)1 (as of period end) Contracts (as of period end)1 (as of period end) Commercial
Commercial and Industrial 1 $ 503 $ — 5 $ 3,858 $ 1
Commercial Mortgage — — — 1 404 —
Total Commercial 1 503 — 6 4,262 1
Consumer
Residential Mortgage 1 112 — 1 98 —
Automobile 98 2,179 47 113 2,303 52
Other 2 80 547 14 90 643 18
Total Consumer 179 2,838 61 204 3,044 70
Total 180 $ 3,341 $ 61 210 $ 7,306 $ 71
1 The period end balances reflect all paydowns and charge-offs since the modification date. TDRs fully paid-off, charged-off, or foreclosed upon by period end are not included.2 Comprised of other revolving credit and installment financing.
24

Table of Contents
The following presents by class, all loans modified in a TDR that defaulted during the three months ended March 31, 2018 and 2017, and within twelvemonths of their modification date. A TDR is considered to be in default once it becomes 60 days or more past due following a modification.
Three Months Ended
March 31, 2018 Three Months Ended
March 31, 2017
TDRs that Defaulted During the Period, Recorded Recorded Within Twelve Months of their Modification Date Number of Investment Number of Investment
(dollars in thousands) Contracts (as of period end)1 Contracts (as of period end)1
Commercial Commercial and Industrial 1 $ 29 2 $ 148
Commercial Mortgage 1 341 1 404
Total Commercial 2 370 3 552
Consumer
Home Equity 1 236 — —
Automobile 25 435 11 224
Other 2 32 215 27 199
Total Consumer 58 886 38 423
Total 60 $ 1,256 41 $ 975
1 The period end balances reflect all paydowns and charge-offs since the modification date. TDRs fully paid-off, charged-off, or foreclosed upon by period end are not included.2 Comprised of other revolving credit and installment financing.
Commercial and consumer loans modified in a TDR are closely monitored for delinquency as an early indicator of possible future default. If loans modifiedin a TDR subsequently default, the Company evaluates the loan for possible further impairment. The specific Allowance associated with the loan may beincreased, adjustments may be made in the allocation of the Allowance, or partial charge-offs may be taken to further write-down the carrying value of theloan.
Foreclosure Proceedings
Consumer mortgage loans collateralized by residential real estate property that are in the process of foreclosure totaled $3.9 million as of March 31, 2018.
Note 5. Mortgage Servicing Rights
The Company’s portfolio of residential mortgage loans serviced for third parties was $2.9 billion as of March 31, 2018 and December 31, 2017. Substantiallyall of these loans were originated by the Company and sold to third parties on a non-recourse basis with servicing rights retained. These retained servicingrights are recorded as a servicing asset and are initially recorded at fair value (see Note 14 Fair Value of Assets and Liabilities for more information). Changesto the balance of mortgage servicing rights are recorded in mortgage banking income in the Company’s consolidated statements of income.
The Company’s mortgage servicing activities include collecting principal, interest, and escrow payments from borrowers; making tax and insurance paymentson behalf of borrowers; monitoring delinquencies and executing foreclosure proceedings; and accounting for and remitting principal and interest payments toinvestors. Servicing income, including late and ancillary fees, was $1.8 million and $1.7 million for the three months ended March 31, 2018 and 2017,respectively. Servicing income is recorded in mortgage banking income in the Company’s consolidated statements of income. The Company’s residentialmortgage investor loan servicing portfolio is primarily comprised of fixed rate loans concentrated in Hawaii.
For the three months ended March 31, 2018 and 2017, the change in the carrying value of the Company’s mortgage servicing rights accounted for under thefair value measurement method was as follows:
Three Months Ended
March 31,
(dollars in thousands) 2018 2017
Balance at Beginning of Period $ 1,454 $ 1,655
Change in Fair Value:
Due to Payoffs (50) (69)
Total Changes in Fair Value of Mortgage Servicing Rights (50) (69)
Balance at End of Period $ 1,404 $ 1,586
25
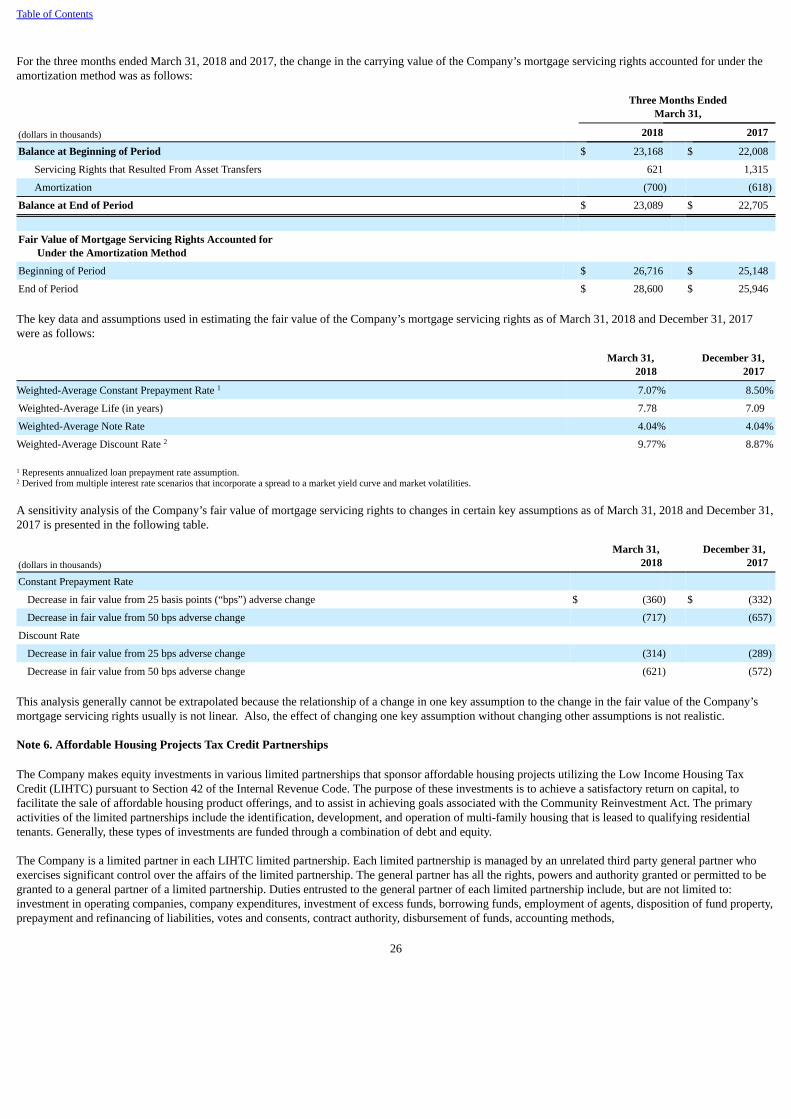
Table of Contents
For the three months ended March 31, 2018 and 2017, the change in the carrying value of the Company’s mortgage servicing rights accounted for under theamortization method was as follows:
Three Months Ended
March 31,
(dollars in thousands) 2018 2017
Balance at Beginning of Period $ 23,168 $ 22,008
Servicing Rights that Resulted From Asset Transfers 621 1,315
Amortization (700) (618)
Balance at End of Period $ 23,089 $ 22,705
Fair Value of Mortgage Servicing Rights Accounted for
Under the Amortization Method
Beginning of Period $ 26,716 $ 25,148
End of Period $ 28,600 $ 25,946
The key data and assumptions used in estimating the fair value of the Company’s mortgage servicing rights as of March 31, 2018 and December 31, 2017were as follows:
March 31,
2018 December 31,
2017
Weighted-Average Constant Prepayment Rate 1 7.07% 8.50%
Weighted-Average Life (in years) 7.78 7.09
Weighted-Average Note Rate 4.04% 4.04%
Weighted-Average Discount Rate 2 9.77% 8.87%
1 Represents annualized loan prepayment rate assumption.2 Derived from multiple interest rate scenarios that incorporate a spread to a market yield curve and market volatilities.
A sensitivity analysis of the Company’s fair value of mortgage servicing rights to changes in certain key assumptions as of March 31, 2018 and December 31,2017 is presented in the following table.
(dollars in thousands)March 31,
2018 December 31,
2017
Constant Prepayment Rate
Decrease in fair value from 25 basis points (“bps”) adverse change $ (360) $ (332)
Decrease in fair value from 50 bps adverse change (717) (657)
Discount Rate
Decrease in fair value from 25 bps adverse change (314) (289)
Decrease in fair value from 50 bps adverse change (621) (572)
This analysis generally cannot be extrapolated because the relationship of a change in one key assumption to the change in the fair value of the Company’smortgage servicing rights usually is not linear. Also, the effect of changing one key assumption without changing other assumptions is not realistic.
Note 6. Affordable Housing Projects Tax Credit Partnerships
The Company makes equity investments in various limited partnerships that sponsor affordable housing projects utilizing the Low Income Housing TaxCredit (LIHTC) pursuant to Section 42 of the Internal Revenue Code. The purpose of these investments is to achieve a satisfactory return on capital, tofacilitate the sale of affordable housing product offerings, and to assist in achieving goals associated with the Community Reinvestment Act. The primaryactivities of the limited partnerships include the identification, development, and operation of multi-family housing that is leased to qualifying residentialtenants. Generally, these types of investments are funded through a combination of debt and equity.
The Company is a limited partner in each LIHTC limited partnership. Each limited partnership is managed by an unrelated third party general partner whoexercises significant control over the affairs of the limited partnership. The general partner has all the rights, powers and authority granted or permitted to begranted to a general partner of a limited partnership. Duties entrusted to the general partner of each limited partnership include, but are not limited to:investment in operating companies, company expenditures, investment of excess funds, borrowing funds, employment of agents, disposition of fund property,prepayment and refinancing of liabilities, votes and consents, contract authority, disbursement of funds, accounting methods,
26

Table of Contents
tax elections, bank accounts, insurance, litigation, cash reserve, and use of working capital reserve funds. Except for limited rights granted to the limitedpartner(s) relating to the approval of certain transactions, the limited partner(s) may not participate in the operation, management, or control of the limitedpartnership’s business, transact any business in the limited partnership’s name or have any power to sign documents for or otherwise bind the limitedpartnership. In addition, the general partner may only be removed by the limited partner(s) in the event the general partner fails to comply with the terms ofthe agreement or is negligent in performing its duties.
The general partner of each limited partnership has both the power to direct the activities which most significantly affect the performance of each partnershipand the obligation to absorb losses or the right to receive benefits that could be significant to the entities. Therefore, the Company has determined that it is notthe primary beneficiary of any LIHTC partnership. The Company uses the effective yield method to account for its pre-2015 investments in these entities.Beginning January 1, 2015, any new investments that meet the requirements of the proportional amortization method are recognized using the proportionalamortization method. The Company’s net affordable housing tax credit investments and related unfunded commitments were $71.3 million and $71.7 millionas of March 31, 2018 and December 31, 2017, respectively, and are included in other assets in the consolidated statements of condition.
Unfunded Commitments
As of March 31, 2018, the expected payments for unfunded affordable housing commitments were as follows:
(dollars in thousands) Amount
2018 $ 11,1472019 2,8932020 512021 272022 33Thereafter 802
Total Unfunded Commitments $ 14,953
The following table presents tax credits and other tax benefits recognized and amortization expense related to affordable housing for the three months endedMarch 31, 2018 and 2017.
Three Months Ended
March 31,
(dollars in thousands) 2018 2017
Effective Yield Method Tax credits and other tax benefits recognized $ 3,432 $ 3,430
Amortization Expense in Provision for Income Taxes 2,078 2,161
Proportional Amortization Method
Tax credits and other tax benefits recognized $ 410 $ 320
Amortization Expense in Provision for Income Taxes 333 253
There were no impairment losses related to LIHTC investments during the three months ended March 31, 2018 and 2017. During the first quarter 2018 theCompany recorded a $2.0 million adjustment to increase its LIHTC investments. This adjustment resulted in a decrease to provision for income tax.
Note 7. Balance Sheet Offsetting
Interest Rate Swap Agreements (“Swap Agreements”)
The Company enters into swap agreements to facilitate the risk management strategies of a small number of commercial banking customers. The Companymitigates the risk of entering into these agreements by entering into equal and offsetting swap agreements with highly-rated third party financial institutions.The swap agreements are free-standing derivatives and are recorded at fair value in the Company’s consolidated statements of condition (asset positions areincluded in other assets and liability positions are included in other liabilities). The Company is party to master netting arrangements with its financialinstitution counterparties; however, the Company does not offset assets and liabilities under these arrangements for financial statement presentation purposes.The master netting arrangements provide for a single net settlement of all swap agreements, as well as collateral, in the event of default on, or termination of,any one contract. Collateral, usually in the form of cash or
27

Table of Contents
marketable securities, is posted by the party (i.e., the Company or the financial institution counterparty) with net liability positions in accordance withcontract thresholds. The Company had net liability positions with its financial institution counterparties totaling $0.7 million and $3.2 million as of March 31,2018 and December 31, 2017, respectively. See Note 12 Derivative Financial Instruments for more information.
Parties to a centrally cleared over-the-counter derivative exchange daily payments that reflect the daily change in value of the derivative. Effective 2017, thesepayments, commonly referred to as variation margin, are recorded as settlements of the derivatives’ mark-to-market exposure rather than collateral against theexposures. This rule change effectively results in any centrally cleared derivative having a fair value that approximates zero on a daily basis, and therefore,these swap agreements were not included in the offsetting table at the end of this section. See Note 12 Derivative Financial Instruments for more information.
Securities Sold Under Agreements to Repurchase (“Repurchase Agreements”)
The Company enters into agreements under which it sells securities subject to an obligation to repurchase the same or similar securities. Under thesearrangements, the Company may transfer legal control over the assets but still retain effective control through an agreement that both entitles and obligatesthe Company to repurchase the assets. As a result, these repurchase agreements are accounted for as collateralized financing arrangements (i.e., securedborrowings) and not as sales and subsequent repurchases of securities. The obligation to repurchase the securities is reflected as a liability in the Company’sconsolidated statements of condition, while the securities underlying the repurchase agreements remain in the respective investment securities asset accounts.As a result, there is no offsetting or netting of the investment securities assets with the repurchase agreement liabilities. In addition, as the Company does notenter into reverse repurchase agreements, there is no such offsetting to be done with the repurchase agreements.
The right of setoff for a repurchase agreement resembles a secured borrowing, whereby the collateral pledged by the Company would be used to settle the fairvalue of the repurchase agreement should the Company be in default (e.g., fail to make an interest payment to the counterparty). For private institutionrepurchase agreements, if the private institution counterparty were to default (e.g., declare bankruptcy), the Company could cancel the repurchase agreement(i.e., cease payment of principal and interest) and attempt collection on the amount of collateral value in excess of the repurchase agreement fair value. Thecollateral is held by a third party financial institution in the counterparty’s custodial account. The counterparty has the right to sell or repledge the investmentsecurities. For government entity repurchase agreements, the collateral is held by the Company in a segregated custodial account under a tri-party agreement.The Company is required by the counterparty to maintain adequate collateral levels. In the event the collateral fair value falls below stipulated levels, theCompany will pledge additional securities. The Company closely monitors collateral levels to ensure adequate levels are maintained, while mitigating thepotential risk of over-collateralization in the event of counterparty default.
28

Table of Contents
The following table presents the remaining contractual maturities of the Company’s repurchase agreements as of March 31, 2018 and December 31, 2017,disaggregated by the class of collateral pledged.
Remaining Contractual Maturity of Repurchase Agreements
(dollars in thousands) Up to
90 days 91-365 days 1-3 Years After
3 Years Total
March 31, 2018
Class of Collateral Pledged:
Debt Securities Issued by the U.S. Treasury and Government Agencies $ — $ — $ 118,227 $ 193,803 $ 312,030
Debt Securities Issued by States and Political Subdivisions 1,803 2,690 — — 4,493
Mortgage-Backed Securities:
Residential - Government Agencies — 800 55,046 44,868 100,714
Residential - U.S. Government-Sponsored Enterprises — — 51,727 36,329 88,056
Total $ 1,803 $ 3,490 $ 225,000 $ 275,000 $ 505,293
December 31, 2017
Class of Collateral Pledged:
Debt Securities Issued by the U.S. Treasury and Government Agencies $ — $ — $ 110,392 $ 202,484 $ 312,876
Debt Securities Issued by States and Political Subdivisions 1,200 2,590 — — 3,790
Mortgage-Backed Securities:
Residential - Government Agencies 1,503 — 18,793 80,960 101,256
Residential - U.S. Government-Sponsored Enterprises — — 20,815 66,556 87,371
Total $ 2,703 $ 2,590 $ 150,000 $ 350,000 $ 505,293
29
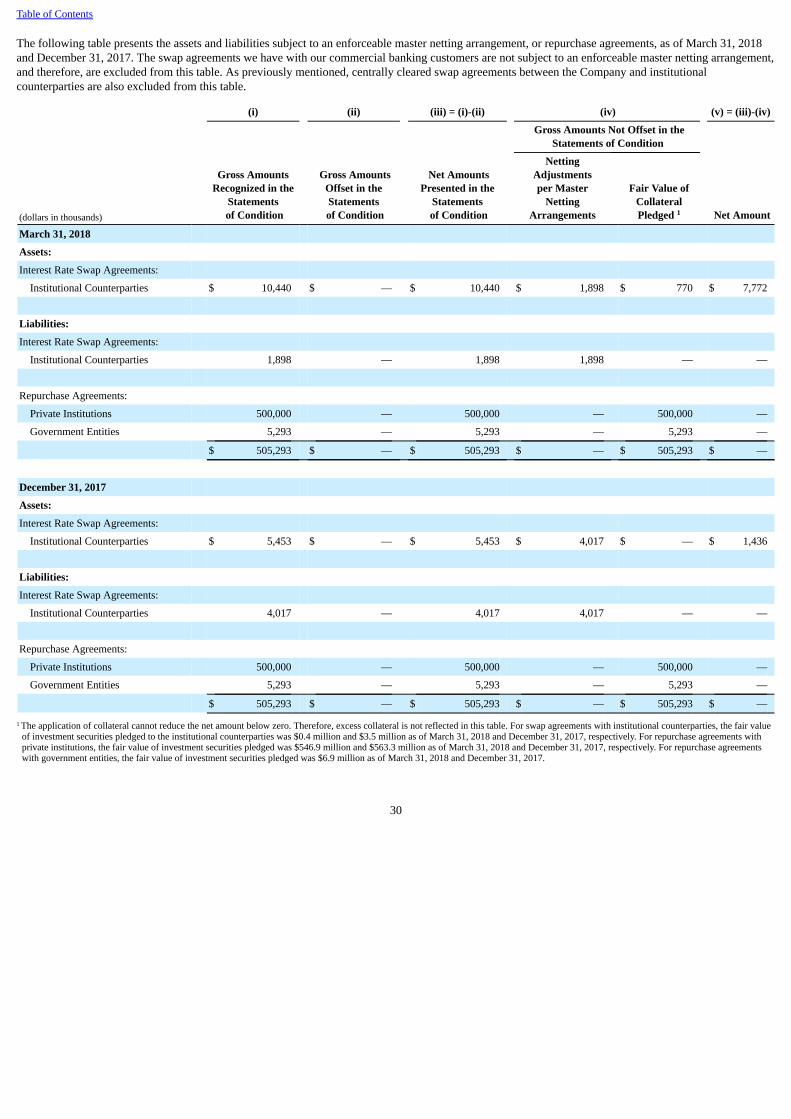
Table of Contents
The following table presents the assets and liabilities subject to an enforceable master netting arrangement, or repurchase agreements, as of March 31, 2018and December 31, 2017. The swap agreements we have with our commercial banking customers are not subject to an enforceable master netting arrangement,and therefore, are excluded from this table. As previously mentioned, centrally cleared swap agreements between the Company and institutionalcounterparties are also excluded from this table.
(i) (ii) (iii) = (i)-(ii) (iv) (v) = (iii)-(iv)
Gross AmountsRecognized in the
Statements of Condition
Gross AmountsOffset in theStatements
of Condition
Net AmountsPresented in the
Statements of Condition
Gross Amounts Not Offset in the
Statements of Condition
(dollars in thousands)
NettingAdjustmentsper Master
NettingArrangements
Fair Value ofCollateralPledged 1 Net Amount
March 31, 2018 Assets: Interest Rate Swap Agreements: Institutional Counterparties $ 10,440 $ — $ 10,440 $ 1,898 $ 770 $ 7,772
Liabilities: Interest Rate Swap Agreements: Institutional Counterparties 1,898 — 1,898 1,898 — —
Repurchase Agreements: Private Institutions 500,000 — 500,000 — 500,000 —
Government Entities 5,293 — 5,293 — 5,293 —
$ 505,293 $ — $ 505,293 $ — $ 505,293 $ —
December 31, 2017 Assets: Interest Rate Swap Agreements: Institutional Counterparties $ 5,453 $ — $ 5,453 $ 4,017 $ — $ 1,436
Liabilities: Interest Rate Swap Agreements: Institutional Counterparties 4,017 — 4,017 4,017 — —
Repurchase Agreements: Private Institutions 500,000 — 500,000 — 500,000 —
Government Entities 5,293 — 5,293 — 5,293 —
$ 505,293 $ — $ 505,293 $ — $ 505,293 $ —
1 The application of collateral cannot reduce the net amount below zero. Therefore, excess collateral is not reflected in this table. For swap agreements with institutional counterparties, the fair valueof investment securities pledged to the institutional counterparties was $0.4 million and $3.5 million as of March 31, 2018 and December 31, 2017, respectively. For repurchase agreements withprivate institutions, the fair value of investment securities pledged was $546.9 million and $563.3 million as of March 31, 2018 and December 31, 2017, respectively. For repurchase agreementswith government entities, the fair value of investment securities pledged was $6.9 million as of March 31, 2018 and December 31, 2017.
30
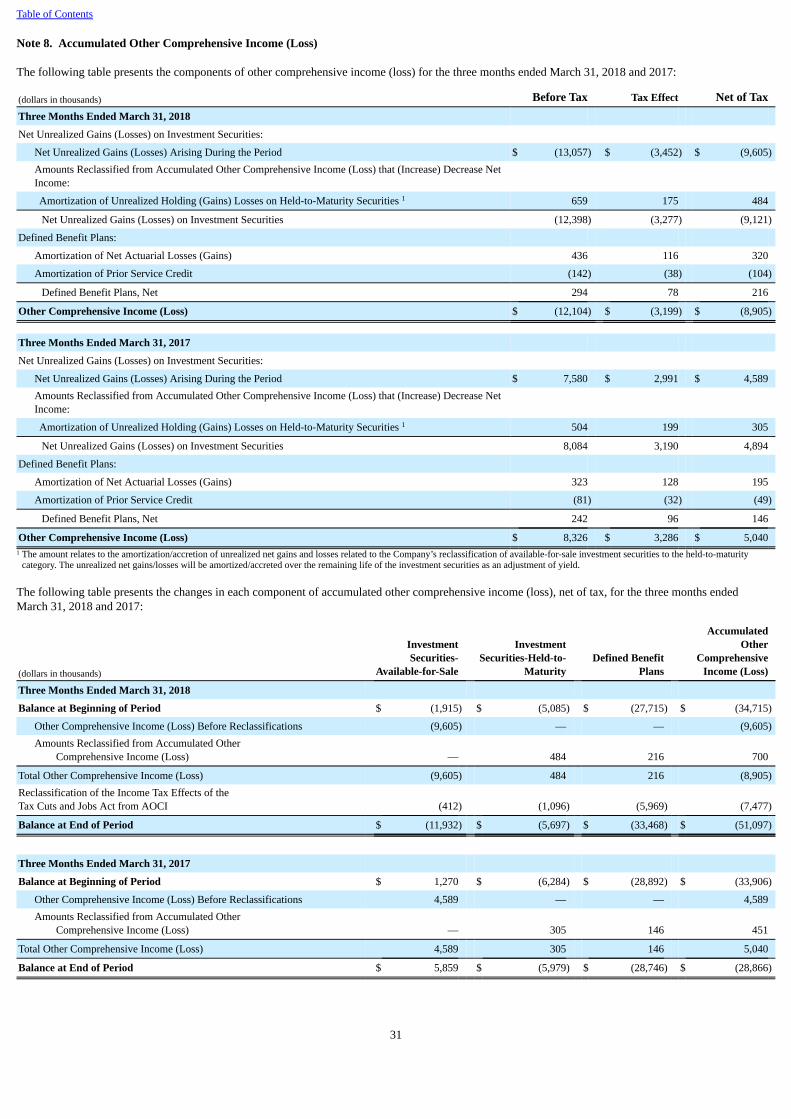
Table of Contents
Note 8. Accumulated Other Comprehensive Income (Loss)
The following table presents the components of other comprehensive income (loss) for the three months ended March 31, 2018 and 2017:
(dollars in thousands) Before Tax Tax Effect Net of TaxThree Months Ended March 31, 2018
Net Unrealized Gains (Losses) on Investment Securities:
Net Unrealized Gains (Losses) Arising During the Period $ (13,057) $ (3,452) $ (9,605)Amounts Reclassified from Accumulated Other Comprehensive Income (Loss) that (Increase) Decrease NetIncome: Amortization of Unrealized Holding (Gains) Losses on Held-to-Maturity Securities 1 659 175 484
Net Unrealized Gains (Losses) on Investment Securities (12,398) (3,277) (9,121)
Defined Benefit Plans:
Amortization of Net Actuarial Losses (Gains) 436 116 320
Amortization of Prior Service Credit (142) (38) (104)
Defined Benefit Plans, Net 294 78 216
Other Comprehensive Income (Loss) $ (12,104) $ (3,199) $ (8,905)
Three Months Ended March 31, 2017
Net Unrealized Gains (Losses) on Investment Securities:
Net Unrealized Gains (Losses) Arising During the Period $ 7,580 $ 2,991 $ 4,589Amounts Reclassified from Accumulated Other Comprehensive Income (Loss) that (Increase) Decrease NetIncome: Amortization of Unrealized Holding (Gains) Losses on Held-to-Maturity Securities 1 504 199 305
Net Unrealized Gains (Losses) on Investment Securities 8,084 3,190 4,894
Defined Benefit Plans:
Amortization of Net Actuarial Losses (Gains) 323 128 195
Amortization of Prior Service Credit (81) (32) (49)
Defined Benefit Plans, Net 242 96 146
Other Comprehensive Income (Loss) $ 8,326 $ 3,286 $ 5,0401 The amount relates to the amortization/accretion of unrealized net gains and losses related to the Company’s reclassification of available-for-sale investment securities to the held-to-maturity
category. The unrealized net gains/losses will be amortized/accreted over the remaining life of the investment securities as an adjustment of yield.
The following table presents the changes in each component of accumulated other comprehensive income (loss), net of tax, for the three months endedMarch 31, 2018 and 2017:
(dollars in thousands)
InvestmentSecurities-
Available-for-Sale
InvestmentSecurities-Held-to-
Maturity Defined Benefit
Plans
AccumulatedOther
ComprehensiveIncome (Loss)
Three Months Ended March 31, 2018 Balance at Beginning of Period $ (1,915) $ (5,085) $ (27,715) $ (34,715)
Other Comprehensive Income (Loss) Before Reclassifications (9,605) — — (9,605)Amounts Reclassified from Accumulated Other Comprehensive Income (Loss) — 484 216 700
Total Other Comprehensive Income (Loss) (9,605) 484 216 (8,905)Reclassification of the Income Tax Effects of theTax Cuts and Jobs Act from AOCI (412) (1,096) (5,969) (7,477)
Balance at End of Period $ (11,932) $ (5,697) $ (33,468) $ (51,097)
Three Months Ended March 31, 2017 Balance at Beginning of Period $ 1,270 $ (6,284) $ (28,892) $ (33,906)
Other Comprehensive Income (Loss) Before Reclassifications 4,589 — — 4,589Amounts Reclassified from Accumulated Other Comprehensive Income (Loss) — 305 146 451
Total Other Comprehensive Income (Loss) 4,589 305 146 5,040
Balance at End of Period $ 5,859 $ (5,979) $ (28,746) $ (28,866)
31

Table of Contents
The following table presents the amounts reclassified out of each component of accumulated other comprehensive income (loss) for the three months endedMarch 31, 2018 and 2017:
Details about Accumulated OtherComprehensive Income (Loss) Components
Amount Reclassified from Accumulated OtherComprehensive Income (Loss)1
Affected Line Item in theStatement Where Net Income Is
Presented
Three Months Ended March 31,
(dollars in thousands) 2018 2017 Amortization of Unrealized Holding Gains (Losses) on Investment Securities Held-to-Maturity $ (659) $ (504) Interest Income
175 199 Provision for Income Tax
(484) (305) Net of Tax
Amortization of Defined Benefit Plan Items
Prior Service Credit 2 142 81 Net Actuarial Losses 2 (436) (323)
(294) (242) Total Before Tax
78 96 Provision for Income Tax
(216) (146) Net of Tax
Total Reclassifications for the Period $ (700) $ (451) Net of Tax
1 Amounts in parentheses indicate reductions to net income.2 These accumulated other comprehensive income (loss) components are included in the computation of net periodic benefit cost and are included in Other Noninterest Expense on the consolidated
statements of income (see Note 11 Pension Plans and Postretirement Benefit Plan for additional details).
Note 9. Earnings Per Share
There were no adjustments to net income, the numerator, for purposes of computing earnings per share. The following is a reconciliation of the weightedaverage number of common shares outstanding for computing diluted earnings per share and antidilutive stock options and restricted stock outstanding for thethree months ended March 31, 2018 and 2017:
Three Months Ended
March 31,
2018 2017
Denominator for Basic Earnings Per Share 42,038,573 42,406,006
Dilutive Effect of Equity Based Awards 319,852 343,860
Denominator for Diluted Earnings Per Share 42,358,425 42,749,866
Antidilutive Stock Options and Restricted Stock Outstanding 137 —
Note 10. Business Segments
The Company’s business segments are defined as Retail Banking, Commercial Banking, Investment Services and Private Banking, and Treasury and Other. The Company’s internal management accounting process measures the performance of these business segments. This process, which is not necessarilycomparable with the process used by any other financial institution, uses various techniques to assign balance sheet and income statement amounts to thebusiness segments, including allocations of income, expense, the provision for credit losses, and capital. This process is dynamic and requires certainallocations based on judgment and other subjective factors. Unlike financial accounting, there is no comprehensive authoritative guidance for managementaccounting that is equivalent to GAAP. Previously reported results have been reclassified to conform to the current reporting structure.
The net interest income of the business segments reflects the results of a funds transfer pricing process that matches assets and liabilities with similar interestrate sensitivity and maturity characteristics and reflects the allocation of net interest income related to the Company’s overall asset and liability managementactivities on a proportionate basis. The basis for the allocation of net interest income is a function of the Company’s assumptions that are subject to changebased on changes in current interest rates and market conditions. Funds transfer pricing also serves to transfer interest rate risk to Treasury. However, the
32

Table of Contents
other business segments have some latitude to retain certain interest rate exposures related to customer pricing decisions within guidelines.
The provision for credit losses reflects the actual net charge-offs of the business segments. The amount of the consolidated provision for loan and leaselosses is based on the methodology that we use to estimate our consolidated Allowance. The residual provision for credit losses to arrive at the consolidatedprovision for credit losses is included in Treasury and Other.
Noninterest income and expense includes allocations from support units to business units. These allocations are based on actual usage where practicablycalculated or by management’s estimate of such usage.
The provision for income taxes is allocated to business segments using a 26% effective income tax rate. However, the provision for income taxes for ourLeasing business unit (included in the Commercial Banking segment) and Auto Leasing portfolio and Pacific Century Life Insurance business unit (bothincluded in the Retail Banking segment) are assigned their actual effective income tax rates due to the unique relationship that income taxes have with theirproducts. The residual income tax expense or benefit to arrive at the consolidated effective income tax rate is included in Treasury and Other.
Retail Banking
Retail Banking offers a broad range of financial products and services to consumers and small businesses. Loan and lease products include residentialmortgage loans, home equity lines of credit, automobile loans and leases, personal lines of credit, installment loans, small business loans and leases, andcredit cards. Deposit products include checking, savings, and time deposit accounts. Retail Banking also offers some types of consumer insurance products. Products and services from Retail Banking are delivered to customers through 69 branch locations and 377 ATMs throughout Hawaii and the Pacific Islands,e-Bankoh (on-line banking service), a 24-hour customer service center, and a mobile banking service.
Commercial Banking
Commercial Banking offers products including corporate banking, commercial real estate loans, commercial lease financing, auto dealer financing, anddeposit products. Commercial lending and deposit products are offered to middle-market and large companies in Hawaii and the Pacific Islands. In addition,Commercial Banking offers deposit products to government entities in Hawaii. Commercial real estate mortgages focus on customers that include investors,developers, and builders predominantly domiciled in Hawaii. Commercial Banking also includes international banking and provides merchant services to itscustomers.
Investment Services and Private Banking
Investment Services and Private Banking includes private banking and international client banking services, trust services, investment management, andinstitutional investment advisory services. A significant portion of this segment’s income is derived from fees, which are generally based on the marketvalues of assets under management. The private banking and personal trust groups assist individuals and families in building and preserving their wealth byproviding investment, credit, and trust services to high-net-worth individuals. The investment management group manages portfolios utilizing a variety ofinvestment products. Institutional client services offer investment advice to corporations, government entities, and foundations. This segment also provides afull service brokerage offering equities, mutual funds, life insurance, and annuity products.
Treasury and Other
Treasury consists of corporate asset and liability management activities, including interest rate risk management and a foreign currency exchange business. This segment’s assets and liabilities (and related interest income and expense) consist of interest-bearing deposits, investment securities, federal funds soldand purchased, and short and long-term borrowings. The primary sources of noninterest income are from bank-owned life insurance, net gains from the saleof investment securities, and foreign exchange income related to customer-driven currency requests from merchants and island visitors. The net residualeffect of the transfer pricing of assets and liabilities is included in Treasury, along with the elimination of intercompany transactions.
Other organizational units (Technology, Operations, Marketing, Human Resources, Finance, Credit and Risk Management, and Corporate and RegulatoryAdministration) provide a wide-range of support to the Company’s other income earning segments. Expenses incurred by these support units are charged tothe business segments through an internal cost allocation process.
33

Table of Contents
Selected business segment financial information as of and for the three months ended March 31, 2018 and 2017 were as follows:
(dollars in thousands) Retail Banking Commercial
Banking
InvestmentServices and
Private Banking Treasury
and Other Consolidated
Total
Three Months Ended March 31, 2018
Net Interest Income $ 64,397 $ 42,898 $ 9,887 $ 1,774 $ 118,956
Provision for Credit Losses 3,743 (151) (60) 593 4,125
Net Interest Income After Provision for Credit Losses 60,654 43,049 9,947 1,181 114,831
Noninterest Income 19,253 5,642 13,670 5,470 44,035
Noninterest Expense (54,599) (20,332) (16,207) (3,246) (94,384)
Income Before Provision for Income Taxes 25,308 28,359 7,410 3,405 64,482
Provision for Income Taxes (6,291) (6,824) (1,954) 4,627 (10,442)
Net Income $ 19,017 $ 21,535 $ 5,456 $ 8,032 $ 54,040
Total Assets as of March 31, 2018 $ 6,041,271 $ 3,771,678 $ 332,454 $ 6,990,627 $ 17,136,030
Three Months Ended March 31, 2017
Net Interest Income $ 65,158 $ 41,931 $ 6,650 $ (3,867) $ 109,872
Provision for Credit Losses 3,801 (188) (5) 792 4,400
Net Interest Income After Provision for Credit Losses 61,357 42,119 6,655 (4,659) 105,472
Noninterest Income 20,925 5,438 14,549 15,004 55,916
Noninterest Expense (52,260) (18,355) (15,471) (2,482) (88,568)
Income Before Provision for Income Taxes 30,022 29,202 5,733 7,863 72,820
Provision for Income Taxes (10,673) (10,256) (2,121) 1,406 (21,644)
Net Income $ 19,349 $ 18,946 $ 3,612 $ 9,269 $ 51,176
Total Assets as of March 31, 2017 $ 5,438,421 $ 3,577,524 $ 288,178 $ 7,360,092 $ 16,664,215
Note 11. Pension Plans and Postretirement Benefit Plan
Components of net periodic benefit cost for the Company’s pension plans and the postretirement benefit plan are presented in the following table for the threemonths ended March 31, 2018 and 2017.
Pension Benefits Postretirement Benefits
(dollars in thousands) 2018 2017 2018 2017Three Months Ended March 31,
Service Cost $ — $ — $ 115 $ 123
Interest Cost 1,041 1,161 235 272
Expected Return on Plan Assets (1,282) (1,238) — —
Amortization of:
Prior Service Credit — — (142) (81)
Net Actuarial Losses (Gains) 498 433 (62) (110)
Net Periodic Benefit Cost $ 257 $ 356 $ 146 $ 204
The service cost component of net periodic benefit cost are included in salaries and benefits and all other components of net periodic benefit cost are includedin other noninterest expense in the consolidated statements of income for the Company’s pension plans and postretirement benefit plan. For the three monthsended March 31, 2018, the Company contributed $0.1 million to the pension plans and $0.3 million to the postretirement benefit plan. The Company expectsto contribute a total of $0.5 million to the pension plans and $0.9 million to the postretirement benefit plan for the year ending December 31, 2018.
34

Table of Contents
Note 12. Derivative Financial Instruments
The notional amount and fair value of the Company’s derivative financial instruments as of March 31, 2018 and December 31, 2017 were as follows:
March 31, 2018 December 31, 2017
(dollars in thousands) Notional Amount Fair Value Notional Amount Fair Value
Interest Rate Lock Commitments $ 42,643 $ 937 $ 35,422 $ 789
Forward Commitments 56,181 (138) 45,143 (56)
Interest Rate Swap Agreements Receive Fixed/Pay Variable Swaps 378,442 (8,932) 374,670 (1,331)
Pay Fixed/Receive Variable Swaps 378,442 8,542 374,670 1,436
Foreign Exchange Contracts 57,877 13 54,332 (13)
The following table presents the Company’s derivative financial instruments, their fair values, and their location in the consolidated statements of condition asof March 31, 2018 and December 31, 2017:
Derivative Financial Instruments March 31, 2018 December 31, 2017
Not Designated as Hedging Instruments 1 Asset Liability Asset Liability
(dollars in thousands) Derivatives Derivatives Derivatives Derivatives
Interest Rate Lock Commitments $ 939 $ 2 $ 789 $ —
Forward Commitments 22 160 14 70
Interest Rate Swap Agreements 13,068 13,458 9,583 9,478
Foreign Exchange Contracts 135 122 132 145
Total $ 14,164 $ 13,742 $ 10,518 $ 9,693
1 Asset derivatives are included in other assets and liability derivatives are included in other liabilities in the consolidated statements of condition.
The following table presents the Company’s derivative financial instruments and the amount and location of the net gains or losses recognized in theconsolidated statements of income for the three months ended March 31, 2018 and 2017:
Location of Derivative Financial Instruments Net Gains (Losses) Three Months Ended
Not Designated as Hedging Instruments Recognized in the March 31,
(dollars in thousands) Statements of Income 2018 2017
Interest Rate Lock Commitments Mortgage Banking $ 530 $ 1,267
Forward Commitments Mortgage Banking 684 (424)
Interest Rate Swap Agreements Other Noninterest Income 118 156
Foreign Exchange Contracts Other Noninterest Income 964 1,050
Total $ 2,296 $ 2,049
Management has received authorization from the Bank’s Board of Directors to use derivative financial instruments as an end-user in connection with theBank’s risk management activities and to accommodate the needs of the Bank’s customers. As with any financial instrument, derivative financial instrumentshave inherent risks. Market risk is defined as the risk of adverse financial impact due to fluctuations in interest rates, foreign exchange rates, and equityprices. Market risks associated with derivative financial instruments are balanced with the expected returns to enhance earnings performance and shareholdervalue, while limiting the volatility of each. The Company uses various processes to monitor its overall market risk exposure, including sensitivity analysis,value-at-risk calculations, and other methodologies.
Derivative financial instruments are also subject to credit and counterparty risk, which is defined as the risk of financial loss if a borrower or counterparty iseither unable or unwilling to repay borrowings or settle transactions in accordance with the underlying contractual terms. Credit and counterparty risksassociated with derivative financial instruments are similar to those relating to traditional financial instruments. The Company manages derivative credit andcounterparty risk by evaluating the creditworthiness of each borrower or counterparty, adhering to the same credit approval process used for commerciallending activities.
As of March 31, 2018 and December 31, 2017, the Company did not designate any derivative financial instruments as formal hedging relationships. TheCompany’s free-standing derivative financial instruments are required to be carried at their fair value on the Company’s consolidated statements of condition. These financial instruments have been limited to interest rate lock commitments (“IRLCs”), forward commitments, interest rate swap agreements, foreignexchange contracts, and conversion rate swap agreements.
35

Table of Contents
The Company enters into IRLCs for residential mortgage loans which commit us to lend funds to a potential borrower at a specific interest rate and within aspecified period of time. IRLCs that relate to the origination of mortgage loans that will be held for sale are considered derivative financial instruments underapplicable accounting guidance. Outstanding IRLCs expose the Company to the risk that the price of the mortgage loans underlying the commitments maydecline due to increases in mortgage interest rates from inception of the rate lock to the funding of the loan. To mitigate this risk, the Company utilizesforward commitments as economic hedges against the potential decreases in the values of the loans held for sale. IRLCs and forward commitments are free-standing derivatives which are carried at fair value with changes recorded in the mortgage banking component of noninterest income in the Company’sconsolidated statements of income.
The Company enters into interest rate swap agreements to facilitate the risk management strategies of a small number of commercial banking customers. TheCompany mitigates the interest rate risk of entering into these agreements by entering into equal and offsetting interest rate swap agreements with highly ratedthird party financial institutions. The interest rate swap agreements are free-standing derivatives and are recorded at fair value in the Company’s consolidatedstatements of condition. Fair value changes are recorded in other noninterest income in the Company’s consolidated statements of income. The Company isparty to master netting arrangements with its financial institution counterparties; however, the Company does not offset assets and liabilities under thesearrangements for financial statement presentation purposes. Collateral, usually in the form of cash or marketable securities, is posted by the counterparty withnet liability positions in accordance with contract thresholds. See Note 7 Balance Sheet Offsetting for more information.
The Company’s interest rate swap agreements with financial institution counterparties may contain credit-risk-related contingent features tied to a specifiedcredit rating of the Company. Under these provisions, should the Company’s specified rating fall below a particular level (e.g., investment grade), or if theCompany no longer obtains the specified rating, the counterparty may require the Company to pledge collateral on an immediate and ongoing basis (subjectto the requirement that such swaps are in a net liability position beyond the level specified in the contract), or require immediate settlement of the swapagreement. Other credit-risk-related contingent features may also allow the counterparty to require immediate settlement of the swap agreement if theCompany fails to maintain a specified minimum level of capitalization.
With regard to derivative contracts not centrally cleared through a clearinghouse, new regulations require collateral to be posted by the party with a netliability position (i.e., the threshold for posting collateral was reduced to zero, subject to certain minimum transfer amounts). The requirements generallyapply to new derivative contracts entered into after the applicable compliance date of the regulation (March 1, 2017 for the Company), although certaincounterparties may elect to apply lower thresholds to existing contracts.
Parties to a centrally cleared over-the-counter derivative exchange daily payments that reflect the daily change in value of the derivative. These payments arecommonly referred to as variation margin. Historically, variation margin payments have typically been treated as collateral against the derivative position.Effective 2017, the Chicago Mercantile Exchange and LCH.Clearnet Limited (collectively, the “clearinghouses”) amended their rulebooks to legallycharacterize variation margin payments for over-the-counter derivatives they clear as settlements of the derivatives’ mark-to-market exposure rather thancollateral against the exposures. This rule change effectively causes any derivative cleared through one of the clearinghouses to have a fair value thatapproximates zero on a daily basis. During the second quarter of 2017, the Company executed its first swap agreements cleared through one of theclearinghouses. Going forward, the Company expects most of the swap agreements executed with third party financial institutions will be required to becleared through one of the clearinghouses. The uncleared swap agreements executed with third party financial institutions will remain subject to the collateralrequirements and credit-risk-related contingent features described in the previous paragraphs, and therefore, are not subject to the variation margin rulechange. Likewise, the swap agreements executed with the Company’s commercial banking customers will remain uncleared and will also not be subject to thevariation margin rule change.
The Company utilizes foreign exchange contracts to offset risks related to transactions executed on behalf of customers. The foreign exchange contracts arefree-standing derivatives which are carried at fair value with changes included in other noninterest income in the Company’s consolidated statements ofincome.
As each sale of Visa Class B restricted shares was completed, the Company entered into a conversion rate swap agreement with the buyer that requirespayment to the buyer in the event Visa further reduces the conversion ratio of Class B into Class A unrestricted common shares. In the event of Visaincreasing the conversion ratio, the buyer would be required to make payment to the Company. As of March 31, 2018, the conversion rate swap agreementwas valued at zero (i.e., no contingent liability recorded) as further reductions to the conversion ratio were deemed neither probable nor reasonably estimableby management. See Note 3 Investment Securities for more information.
36
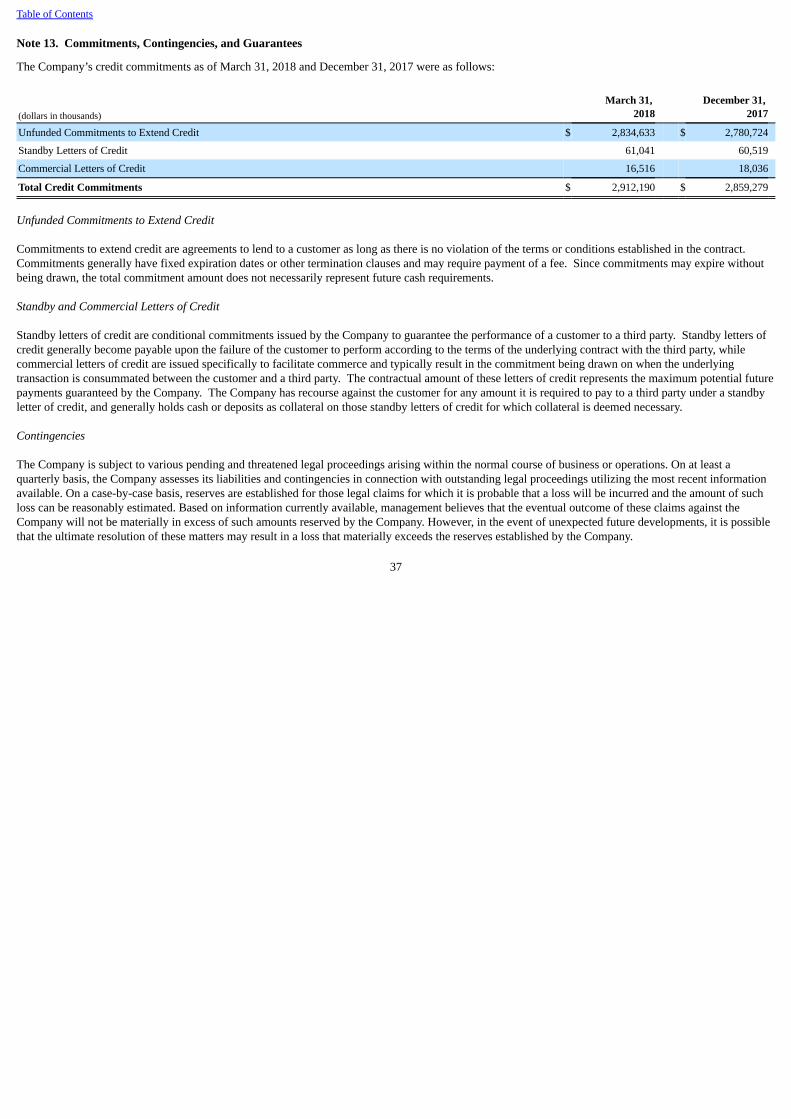
Table of Contents
Note 13. Commitments, Contingencies, and Guarantees
The Company’s credit commitments as of March 31, 2018 and December 31, 2017 were as follows:
(dollars in thousands)March 31,
2018 December 31,
2017
Unfunded Commitments to Extend Credit $ 2,834,633 $ 2,780,724
Standby Letters of Credit 61,041 60,519
Commercial Letters of Credit 16,516 18,036
Total Credit Commitments $ 2,912,190 $ 2,859,279
Unfunded Commitments to Extend Credit
Commitments to extend credit are agreements to lend to a customer as long as there is no violation of the terms or conditions established in the contract. Commitments generally have fixed expiration dates or other termination clauses and may require payment of a fee. Since commitments may expire withoutbeing drawn, the total commitment amount does not necessarily represent future cash requirements.
Standby and Commercial Letters of Credit
Standby letters of credit are conditional commitments issued by the Company to guarantee the performance of a customer to a third party. Standby letters ofcredit generally become payable upon the failure of the customer to perform according to the terms of the underlying contract with the third party, whilecommercial letters of credit are issued specifically to facilitate commerce and typically result in the commitment being drawn on when the underlyingtransaction is consummated between the customer and a third party. The contractual amount of these letters of credit represents the maximum potential futurepayments guaranteed by the Company. The Company has recourse against the customer for any amount it is required to pay to a third party under a standbyletter of credit, and generally holds cash or deposits as collateral on those standby letters of credit for which collateral is deemed necessary.
Contingencies
The Company is subject to various pending and threatened legal proceedings arising within the normal course of business or operations. On at least aquarterly basis, the Company assesses its liabilities and contingencies in connection with outstanding legal proceedings utilizing the most recent informationavailable. On a case-by-case basis, reserves are established for those legal claims for which it is probable that a loss will be incurred and the amount of suchloss can be reasonably estimated. Based on information currently available, management believes that the eventual outcome of these claims against theCompany will not be materially in excess of such amounts reserved by the Company. However, in the event of unexpected future developments, it is possiblethat the ultimate resolution of these matters may result in a loss that materially exceeds the reserves established by the Company.
37

Table of Contents
Risks Related to Representation and Warranty Provisions
The Company sells residential mortgage loans in the secondary market primarily to the Federal National Mortgage Association (“Fannie Mae”). TheCompany also pools Federal Housing Administration (“FHA”) insured and U.S. Department of Veterans Affairs (“VA”) guaranteed residential mortgageloans for sale to the Government National Mortgage Corporation (“Ginnie Mae”). These pools of FHA-insured and VA-guaranteed residential mortgage loansare securitized by Ginnie Mae. The agreements under which the Company sells residential mortgage loans to Fannie Mae or Ginnie Mae and the insurance orguaranty agreements with FHA and VA contain provisions that include various representations and warranties regarding the origination and characteristics ofthe residential mortgage loans. Although the specific representations and warranties vary among investors, insurance or guarantee agreements, they typicallycover ownership of the loan, validity of the lien securing the loan, the absence of delinquent taxes or liens against the property securing the loan, compliancewith loan criteria set forth in the applicable agreement, compliance with applicable federal, state, and local laws, and other matters. As of March 31, 2018, theunpaid principal balance of residential mortgage loans sold by the Company was $2.6 billion. The agreements under which the Company sells residentialmortgage loans require delivery of various documents to the investor or its document custodian. Although these loans are primarily sold on a non-recoursebasis, the Company may be obligated to repurchase residential mortgage loans or reimburse investors for losses incurred if a loan review reveals thatunderwriting and documentation standards were potentially not met. Some agreements may require the Company to repurchase delinquent loans. Uponreceipt of a repurchase request, the Company works with investors or insurers to arrive at a mutually agreeable resolution. Repurchase demands are typicallyreviewed on an individual loan-by-loan basis to validate the claims made by the investor or insurer and to determine if a contractually required repurchaseevent has occurred. The Company manages the risk associated with potential repurchases or other forms of settlement through its underwriting and qualityassurance practices and by servicing mortgage loans to meet investor and secondary market standards. During the three months ended March 31, 2018, therewere four residential mortgage loans repurchased with an aggregate unpaid principal balance of $1.0 million as a result of the representation and warrantyprovisions contained in these contracts. Three of the loans were delinquent in payment of principal and interest at the time of repurchase, however no materiallosses were incurred related to these repurchases. As of March 31, 2018, there were no pending repurchase requests related to representation and warrantyprovisions.
Risks Relating to Residential Mortgage Loan Servicing Activities
In addition to servicing loans in the Company’s portfolio, substantially all of the loans the Company sells to investors are sold with servicing rights retained.The Company also services loans originated by other mortgage loan originators. As servicer, the Company’s primary duties are to: (1) collect payments duefrom borrowers; (2) advance certain delinquent payments of principal and interest; (3) maintain and administer any hazard, title, or primary mortgageinsurance policies relating to the mortgage loans; (4) maintain any required escrow accounts for payment of taxes and insurance and administer escrowpayments; and (5) foreclose on defaulted mortgage loans or, to the extent consistent with the documents governing a securitization, consider alternatives toforeclosure, such as loan modifications or short sales. Each agreement under which the Company acts as servicer generally specifies a standard ofresponsibility for actions taken by the Company in such capacity and provides protection against expenses and liabilities incurred by the Company whenacting in compliance with the respective servicing agreements. However, if the Company commits a material breach of obligations as servicer, the Companymay be subject to termination if the breach is not cured within a specified period following notice. The standards governing servicing and the possibleremedies for violations of such standards vary by investor. These standards and remedies are determined by servicing guides issued by the investors as well asthe contract provisions established between the investors and the Company. Remedies could include repurchase of an affected loan. For the three monthsended March 31, 2018, there were no loans repurchased related to loan servicing activities. As of March 31, 2018, there were no pending repurchase requestsrelated to loan servicing activities.
Although to date repurchase requests related to representation and warranty provisions and servicing activities have been limited, it is possible that requests torepurchase mortgage loans may increase in frequency as investors more aggressively pursue all means of recovering losses on their purchased loans.However, as of March 31, 2018, management believes that this exposure is not material due to the historical level of repurchase requests and loss trends andthus has not established a liability for losses related to mortgage loan repurchases. As of March 31, 2018, 99% of the Company’s residential mortgage loansserviced for investors were current. The Company maintains ongoing communications with investors and continues to evaluate this exposure by monitoringthe level and number of repurchase requests as well as the delinquency rates in the loans sold to investors.
38

Table of Contents
Note 14. Fair Value of Assets and Liabilities
Fair Value Hierarchy
Fair value is defined as the price that would be received to sell an asset or paid to transfer a liability in the principal or most advantageous market for an assetor liability in an orderly transaction between market participants at the measurement date. GAAP established a fair value hierarchy that prioritizes the use ofinputs used in valuation methodologies into the following three levels:
Level 1: Inputs to the valuation methodology are quoted prices, unadjusted, for identical assets or liabilities in active markets. A quotedprice in an active market provides the most reliable evidence of fair value and is used to measure fair value whenever available. A contractually binding sales price also provides reliable evidence of fair value.
Level 2: Inputs to the valuation methodology include quoted prices for similar assets or liabilities in active markets; inputs to the
valuation methodology include quoted prices for identical or similar assets or liabilities in markets that are not active; or inputs tothe valuation methodology that utilize model-based techniques for which all significant assumptions are observable in themarket.
Level 3: Inputs to the valuation methodology are unobservable and significant to the fair value measurement; inputs to the valuation
methodology that utilize model-based techniques for which significant assumptions are not observable in the market; or inputs tothe valuation methodology that require significant management judgment or estimation, some of which may be internallydeveloped.
Management maximizes the use of observable inputs and minimizes the use of unobservable inputs when determining fair value measurements. Managementreviews and updates the fair value hierarchy classifications of the Company’s assets and liabilities on a quarterly basis.
Assets and Liabilities Measured at Fair Value on a Recurring Basis
Investment Securities Available-for-Sale
Fair values of investment securities available-for-sale were primarily measured using information from a third-party pricing service. This service providespricing information by utilizing evaluated pricing models supported with market data information. Standard inputs include benchmark yields, reported trades,broker/dealer quotes, issuer spreads, two-sided markets, benchmark securities, bids, offers, and reference data from market research publications. Level 1investment securities are comprised of debt securities issued by the U.S. Treasury, as quoted prices were available, unadjusted, for identical securities inactive markets. Level 2 investment securities were primarily comprised of debt securities issued by the Small Business Administration, states andmunicipalities, corporations, as well as mortgage-backed securities issued by government agencies and government-sponsored enterprises. Fair values wereestimated primarily by obtaining quoted prices for similar assets in active markets or through the use of pricing models. In cases where there may be limitedor less transparent information provided by the Company’s third-party pricing service, fair value may be estimated by the use of secondary pricing services orthrough the use of non-binding third-party broker quotes.
On a quarterly basis, management reviews the pricing information received from the Company’s third-party pricing service. This review process includes acomparison to non-binding third-party broker quotes, as well as a review of market-related conditions impacting the information provided by the Company’sthird-party pricing service. Management primarily identifies investment securities which may have traded in illiquid or inactive markets by identifyinginstances of a significant decrease in the volume or frequency of trades, relative to historical levels, as well as instances of a significant widening of the bid-ask spread in the brokered markets. Investment securities that are deemed to have been trading in illiquid or inactive markets may require the use ofsignificant unobservable inputs to determine fair value. As of March 31, 2018 and December 31, 2017, management did not make adjustments to pricesprovided by the third-party pricing service as a result of illiquid or inactive markets. On a quarterly basis, management also reviews a sample of securitiespriced by the Company’s third-party pricing service to review the significant assumptions and valuation methodologies used by the service. Based on thisreview, management determines whether the current placement of the security in the fair value hierarchy is appropriate or whether transfers may bewarranted. The Company’s third-party pricing service has also established processes for us to submit inquiries regarding quoted prices. Periodically, we willchallenge the quoted prices provided by our third-party pricing service. The Company’s third-party pricing service will review the inputs to the evaluation inlight of the new market data presented by us.
39
Table of Contents
The Company’s third-party pricing service may then affirm the original quoted price or may update the evaluation on a going-forward basis.
Loans Held for Sale
The fair value of the Company’s residential mortgage loans held for sale was determined based on quoted prices for similar loans in active markets, andtherefore, is classified as a Level 2 measurement.
Mortgage Servicing Rights
Mortgage servicing rights do not trade in an active market with readily observable market data. As a result, the Company estimates the fair value of mortgageservicing rights by using a discounted cash flow model to calculate the present value of estimated future net servicing income. The Company stratifies itsmortgage servicing portfolio on the basis of loan type. The assumptions used in the discounted cash flow model are those that we believe market participantswould use in estimating future net servicing income. Significant assumptions in the valuation of mortgage servicing rights include estimated loan repaymentrates, the discount rate, servicing costs, and the timing of cash flows, among other factors. Mortgage servicing rights are classified as Level 3 measurementsdue to the use of significant unobservable inputs, as well as significant management judgment and estimation.
Other Assets
Other assets recorded at fair value on a recurring basis are primarily comprised of investments related to deferred compensation arrangements. Quoted pricesfor these investments, primarily in mutual funds, are available in active markets. Thus, the Company’s investments related to deferred compensationarrangements are classified as Level 1 measurements in the fair value hierarchy.
Derivative Financial Instruments
Derivative financial instruments recorded at fair value on a recurring basis are comprised of interest rate lock commitments (“IRLCs”), forwardcommitments, interest rate swap agreements, foreign exchange contracts, and Visa Class B to Class A shares conversion rate swap agreements. The fairvalues of IRLCs are calculated based on the value of the underlying loan held for sale, which in turn is based on quoted prices for similar loans in thesecondary market. However, this value is adjusted by a factor which considers the likelihood that the loan in a locked position will ultimately close. Thisfactor, the closing ratio, is derived from the Bank’s internal data and is adjusted using significant management judgment. As such, IRLCs are classified asLevel 3 measurements. Forward commitments are classified as Level 2 measurements as they are primarily based on quoted prices from the secondarymarket based on the settlement date of the contracts, interpolated or extrapolated, if necessary, to estimate a fair value as of the end of the reporting period. The fair values of interest rate swap agreements are calculated using a discounted cash flow approach and utilize Level 2 observable inputs such as a marketyield curve, effective date, maturity date, notional amount, and stated interest rate. In addition, the Company includes in its fair value calculation a creditfactor adjustment which is based primarily on management judgment. Thus, interest rate swap agreements are classified as a Level 3 measurement. The fairvalues of foreign exchange contracts are calculated using the Bank’s multi-currency accounting system which utilizes contract specific information such ascurrency, maturity date, contractual amount, and strike price, along with market data information such as the spot rates of specific currency and yield curves. Foreign exchange contracts are classified as Level 2 measurements because while they are valued using the Bank’s multi-currency accounting system,significant management judgment or estimation is not required. The fair value of the Visa Class B restricted shares to Class A unrestricted common sharesconversion rate swap agreements represent the amount owed by the Company to the buyer of the Visa Class B shares as a result of a reduction of theconversion ratio subsequent to the sales date. As of March 31, 2018 and December 31, 2017, the conversion rate swap agreements were valued at zero asreductions to the conversion ratio were neither probable nor reasonably estimable by management. See Note 12 Derivative Financial Instruments for moreinformation.
The Company is exposed to credit risk if borrowers or counterparties fail to perform. The Company seeks to minimize credit risk through credit approvals,limits, monitoring procedures, and collateral requirements. The Company generally enters into transactions with borrowers and counterparties that carry highquality credit ratings. Credit risk associated with borrowers or counterparties as well as the Company’s non-performance risk is factored into thedetermination of the fair value of derivative financial instruments.
40
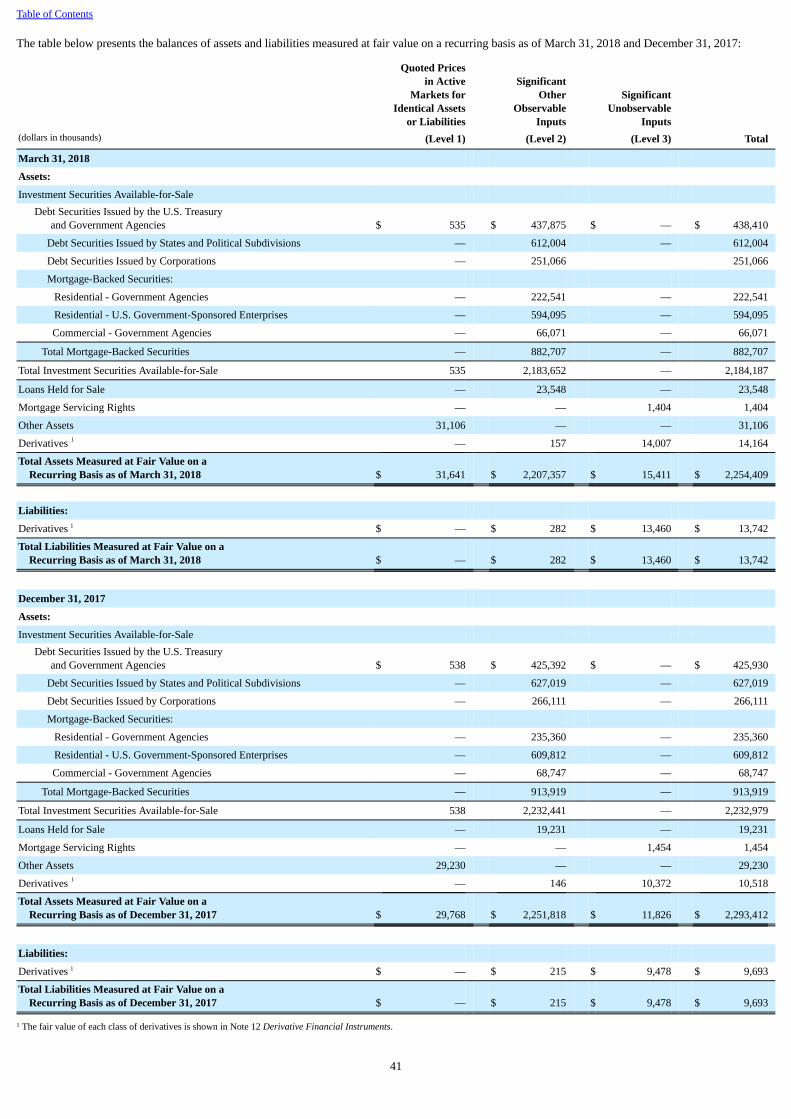
Table of Contents
The table below presents the balances of assets and liabilities measured at fair value on a recurring basis as of March 31, 2018 and December 31, 2017:
Quoted Pricesin Active
Markets forIdentical Assets
or Liabilities
SignificantOther
ObservableInputs
SignificantUnobservable
Inputs
(dollars in thousands) (Level 1) (Level 2) (Level 3) Total
March 31, 2018
Assets:
Investment Securities Available-for-Sale
Debt Securities Issued by the U.S. Treasury and Government Agencies $ 535 $ 437,875 $ — $ 438,410
Debt Securities Issued by States and Political Subdivisions — 612,004 — 612,004
Debt Securities Issued by Corporations — 251,066 251,066
Mortgage-Backed Securities:
Residential - Government Agencies — 222,541 — 222,541
Residential - U.S. Government-Sponsored Enterprises — 594,095 — 594,095
Commercial - Government Agencies — 66,071 — 66,071
Total Mortgage-Backed Securities — 882,707 — 882,707
Total Investment Securities Available-for-Sale 535 2,183,652 — 2,184,187
Loans Held for Sale — 23,548 — 23,548
Mortgage Servicing Rights — — 1,404 1,404
Other Assets 31,106 — — 31,106
Derivatives 1 — 157 14,007 14,164
Total Assets Measured at Fair Value on aRecurring Basis as of March 31, 2018 $ 31,641 $ 2,207,357 $ 15,411 $ 2,254,409
Liabilities:
Derivatives 1 $ — $ 282 $ 13,460 $ 13,742
Total Liabilities Measured at Fair Value on aRecurring Basis as of March 31, 2018 $ — $ 282 $ 13,460 $ 13,742
December 31, 2017
Assets:
Investment Securities Available-for-Sale
Debt Securities Issued by the U.S. Treasury and Government Agencies $ 538 $ 425,392 $ — $ 425,930
Debt Securities Issued by States and Political Subdivisions — 627,019 — 627,019
Debt Securities Issued by Corporations — 266,111 — 266,111
Mortgage-Backed Securities:
Residential - Government Agencies — 235,360 — 235,360
Residential - U.S. Government-Sponsored Enterprises — 609,812 — 609,812
Commercial - Government Agencies — 68,747 — 68,747
Total Mortgage-Backed Securities — 913,919 — 913,919
Total Investment Securities Available-for-Sale 538 2,232,441 — 2,232,979
Loans Held for Sale — 19,231 — 19,231
Mortgage Servicing Rights — — 1,454 1,454
Other Assets 29,230 — — 29,230
Derivatives 1 — 146 10,372 10,518
Total Assets Measured at Fair Value on aRecurring Basis as of December 31, 2017 $ 29,768 $ 2,251,818 $ 11,826 $ 2,293,412
Liabilities:
Derivatives 1 $ — $ 215 $ 9,478 $ 9,693
Total Liabilities Measured at Fair Value on aRecurring Basis as of December 31, 2017 $ — $ 215 $ 9,478 $ 9,693
1 The fair value of each class of derivatives is shown in Note 12 Derivative Financial Instruments.
41

Table of Contents
For the three months ended March 31, 2018 and 2017, the changes in Level 3 assets and liabilities measured at fair value on a recurring basis were as follows:
(dollars in thousands)
MortgageServicing Rights 1
Net DerivativeAssets andLiabilities 2
Three Months Ended March 31, 2018
Balance as of January 1, 2018 $ 1,454 $ 894
Realized and Unrealized Net Gains (Losses):
Included in Net Income (50) 537
Transfers to Loans Held for Sale — (382)
Variation Margin Payments — (502)
Balance as of March 31, 2018 $ 1,404 $ 547
Total Unrealized Net Gains (Losses) Included in Net IncomeRelated to Assets Still Held as of March 31, 2018 $ — $ 547
Three Months Ended March 31, 2017
Balance as of January 1, 2017 $ 1,655 $ 1,053
Realized and Unrealized Net Gains (Losses):
Included in Net Income (69) 1,267
Transfers to Loans Held for Sale — (1,072)
Balance as of March 31, 2017 $ 1,586 $ 1,248
Total Unrealized Net Gains (Losses) Included in Net IncomeRelated to Assets Still Held as of March 31, 2017 $ — $ 1,248
1 Realized and unrealized gains and losses related to mortgage servicing rights are reported as a component of mortgage banking income in the Company’s consolidated statements of income.2 Realized and unrealized gains and losses related to interest rate lock commitments are reported as a component of mortgage banking income in the Company’s consolidated statements of income.
Realized and unrealized gains and losses related to interest rate swap agreements are reported as a component of other noninterest income in the Company’s consolidated statements of income.
For Level 3 assets and liabilities measured at fair value on a recurring or nonrecurring basis as of March 31, 2018 and December 31, 2017, the significantunobservable inputs used in the fair value measurements were as follows:
Significant Unobservable Inputs
(weighted-average) Fair Value
(dollars in thousands) Valuation
Technique Description Mar. 31,
2018 Dec. 31,
2017 Mar. 31,
2018 Dec. 31,
2017
Mortgage Servicing Rights Discounted Cash Flow Constant Prepayment Rate 1 7.07% 8.50% $ 30,004 $ 28,170
Discount Rate 2 9.77% 8.87%
Net Derivative Assets and Liabilities:
Interest Rate Lock Commitments Pricing Model Closing Ratio 92.81% 93.25% $ 937 $ 789
Interest Rate Swap Agreements Discounted Cash Flow Credit Factor 0.02% 0.10% $ (390) $ 105
1 Represents annualized loan repayment rate assumption.2 Derived from multiple interest rate scenarios that incorporate a spread to a market yield curve and market volatilities.
The significant unobservable inputs used in the fair value measurement of the Company’s mortgage servicing rights are the weighted-average constantprepayment rate and weighted-average discount rate. Significant increases (decreases) in any of those inputs in isolation could result in a significantly lower(higher) fair value measurement. Although the constant prepayment rate and the discount rate are not directly interrelated, they generally move in oppositedirections of each other.
42

Table of Contents
The Company estimates the fair value of mortgage servicing rights by using a discounted cash flow model to calculate the present value of estimated futurenet servicing income. The Company’s Treasury Division enters observable and unobservable inputs into the model to arrive at an estimated fair value. Toassess the reasonableness of the fair value measurement, the Treasury Division performs a back-test by comparing the model’s results to historicalprepayment data. The fair value and constant prepayment rate are also compared to forward-looking estimates to assess reasonableness. The TreasuryDivision also compares the fair value of the Company’s mortgage servicing rights to a value calculated by an independent third party. Discussions are heldwith members from the Treasury, Mortgage Banking, and Controllers Divisions, along with the independent third party to discuss and reconcile the fair valueestimates and key assumptions used by the respective parties in arriving at those estimates. A subcommittee of the Company’s Asset/Liability ManagementCommittee is responsible for providing oversight over the valuation methodology and key assumptions.
The significant unobservable input used in the fair value measurement of the Company’s IRLCs is the closing ratio, which represents the percentage of loanscurrently in a lock position which management estimates will ultimately close. Generally, the fair value of an IRLC is positive (negative) if the prevailinginterest rate is lower (higher) than the IRLC rate. Therefore, an increase in the closing ratio (i.e., higher percentage of loans are estimated to close) willincrease the gain or loss. The closing ratio is largely dependent on the loan processing stage that a loan is currently in and the change in prevailing interestrates from the time of the rate lock. The closing ratio is computed by our secondary marketing system using historical data and the ratio is periodicallyreviewed by the Company.
The unobservable input used in the fair value measurement of the Company’s interest rate swap agreements is the credit factor. This factor represents the riskthat a counterparty is either unable or unwilling to settle a transaction in accordance with the underlying contractual terms. A significant increase (decrease)in the credit factor could result in a significantly lower (higher) fair value measurement. The credit factor is determined by the Treasury Division based onthe risk rating assigned to each counterparty in which the Company holds a net asset position. The Company’s Credit Policy Committee periodically reviewsand approves the Expected Default Frequency of the Economic Capital Model for Credit Risk. The Expected Default Frequency is used as the credit factorfor interest rate swap agreements.
Assets and Liabilities Measured at Fair Value on a Nonrecurring Basis
The Company may be required periodically to measure certain assets and liabilities at fair value on a nonrecurring basis in accordance with GAAP. Theseadjustments to fair value usually result from the application of lower-of-cost-or-fair value accounting or impairment write-downs of individual assets. For thethree months ended March 31, 2018 and December 31, 2017, there were no material adjustments to fair value for the Company’s assets and liabilitiesmeasured at fair value on a nonrecurring basis in accordance with GAAP.
Fair Value Option
The Company elects the fair value option for all residential mortgage loans held for sale. This election allows for a more effective offset of the changes in fairvalues of the loans held for sale and the derivative financial instruments used to financially hedge them without having to apply complex hedge accountingrequirements. As noted above, the fair value of the Company’s residential mortgage loans held for sale was determined based on quoted prices for similarloans in active markets.
The following table reflects the difference between the aggregate fair value and the aggregate unpaid principal balance of the Company’s residential mortgageloans held for sale as of March 31, 2018 and December 31, 2017.
(dollars in thousands)AggregateFair Value
AggregateUnpaid Principal
Aggregate Fair ValueLess Aggregate
Unpaid Principal March 31, 2018
Loans Held for Sale $ 23,548 $ 23,307 $ 241
December 31, 2017
Loans Held for Sale $ 19,231 $ 18,854 $ 377
Changes in the estimated fair value of residential mortgage loans held for sale are reported as a component of mortgage banking income in the Company’sconsolidated statements of income. For the three months ended March 31, 2018 and 2017, the net gains or losses from the change in fair value of theCompany’s residential mortgage loans held for sale were not material.
43

Table of Contents
Financial Instruments Not Recorded at Fair Value on a Recurring Basis
The following presents the carrying amount, fair value, and placement in the fair value hierarchy of the Company’s financial instruments not recorded at fairvalue on a recurring basis as of March 31, 2018 and December 31, 2017. This table excludes financial instruments for which the carrying amountapproximates fair value. For short-term financial assets such as cash and cash equivalents, the carrying amount is a reasonable estimate of fair value due tothe relatively short time between the origination of the instrument and its expected realization. For non-marketable equity securities such as Federal HomeLoan Bank and Federal Reserve Bank stock, the carrying amount is a reasonable estimate of fair value as these securities can only be redeemed or sold attheir par value and only to the respective issuing government supported institution or to another member institution. For financial liabilities such asnoninterest-bearing demand, interest-bearing demand, and savings deposits, the carrying amount is a reasonable estimate of fair value due to these productshaving no stated maturity.
Fair Value Measurements
Carrying
Quoted Prices in Active
Markets forIdentical
Assets orLiabilities
SignificantOther
ObservableInputs
SignificantUnobservable
Inputs(dollars in thousands) Amount Fair Value (Level 1) (Level 2) (Level 3)
March 31, 2018
Financial Instruments - Assets
Investment Securities Held-to-Maturity $ 3,789,092 $ 3,711,149 $ 392,798 $ 3,318,351 $ —
Loans 1 9,553,491 9,485,997 — — 9,485,997
Financial Instruments - Liabilities
Time Deposits $ 1,771,692 $ 1,758,779 $ — $ 1,758,779 $ —
Securities Sold Under Agreements to Repurchase 505,293 505,271 — 505,271 —
Other Debt 2 $ 225,000 $ 223,027 — $ 223,027 $ —
December 31, 2017
Financial Instruments - Assets
Investment Securities Held-to-Maturity $ 3,928,170 $ 3,894,121 $ 373,640 $ 3,520,481 $ —
Loans 1 9,436,506 9,519,369 — — 9,519,369
Financial Instruments - Liabilities
Time Deposits 1,688,092 1,679,684 — 1,679,684 —
Securities Sold Under Agreements to Repurchase 505,293 505,278 — 505,278 —
Other Debt 2 250,000 248,520 — 248,520 —
1 Carrying amount is net of unearned income and the Allowance. In accordance with the prospective adoption of ASU No. 2016-01, the fair value of loans as of March 31, 2018 was measuredusing an exit price notion. The fair value of loans as of December 31, 2017 was measured using an entry price notion.
2 Excludes capitalized lease obligations.
44
Table of Contents
Note 15. Revenue Recognition
On January 1, 2018, the Company adopted ASU No. 2014-09 “Revenue from Contracts with Customers” (Topic 606) and all subsequent ASUs that modifiedTopic 606. As stated in Note 1 Summary of Significant Accounting Policies, the implementation of the new standard did not have a material impact on themeasurement or recognition of revenue; as such, a cumulative effect adjustment to opening retained earnings was not deemed necessary. Results for reportingperiods beginning after January 1, 2018 are presented under Topic 606, while prior period amounts were not adjusted and continue to be reported inaccordance with our historic accounting under Topic 605.
Topic 606 does not apply to revenue associated with financial instruments, including revenue from loans and securities. In addition, certain noninterestincome streams such as fees associated with mortgage servicing rights, financial guarantees, derivatives, and certain credit card fees are also not in scope ofthe new guidance. Topic 606 is applicable to noninterest revenue streams such as trust and asset management income, deposit related fees, interchange fees,merchant income, and annuity and insurance commissions. However, the recognition of these revenue streams did not change significantly upon adoption ofTopic 606. Substantially all of the Company’s revenue is generated from contracts with customers. Noninterest revenue streams in-scope of Topic 606 arediscussed below.
Trust and Asset Management
Trust and asset management income is primarily comprised of fees earned from the management and administration of trusts and other customer assets. TheCompany’s performance obligation is generally satisfied over time and the resulting fees are recognized monthly, based upon the month-end market value ofthe assets under management and the applicable fee rate. Payment is generally received a few days after month end through a direct charge to customers’accounts. The Company does not earn performance-based incentives. Optional services such as real estate sales and tax return preparation services are alsoavailable to existing trust and asset management customers. The Company’s performance obligation for these transactional-based services is generallysatisfied, and related revenue recognized, at a point in time (i.e., as incurred). Payment is received shortly after services are rendered.
Service Charges on Deposit Accounts
Service charges on deposit accounts consist of account analysis fees (i.e., net fees earned on analyzed business and public checking accounts), monthlyservice fees, check orders, and other deposit account related fees. The Company’s performance obligation for account analysis fees and monthly service feesis generally satisfied, and the related revenue recognized, over the period in which the service is provided. Check orders and other deposit account related feesare largely transactional based, and therefore, the Company’s performance obligation is satisfied, and related revenue recognized, at a point in time. Paymentfor service charges on deposit accounts is primarily received immediately or in the following month through a direct charge to customers’ accounts.
Fees, Exchange, and Other Service Charges
Fees, exchange, and other service charges are primarily comprised of debit and credit card income, ATM fees, merchant services income, and other servicecharges. Debit and credit card income is primarily comprised of interchange fees earned whenever the Company’s debit and credit cards are processedthrough card payment networks such as Visa. ATM fees are primarily generated when a Company cardholder uses a non-Company ATM or a non-Companycardholder uses a Company ATM. Merchant services income mainly represents fees charged to merchants to process their debit and credit card transactions,in addition to account management fees. Other service charges include revenue from processing wire transfers, bill pay service, cashier’s checks, and otherservices. The Company’s performance obligation for fees, exchange, and other service charges are largely satisfied, and related revenue recognized, when theservices are rendered or upon completion. Payment is typically received immediately or in the following month.
Annuity and Insurance
Annuity and insurance income primarily consists of commissions received on annuity product sales. The Company acts as an intermediary between theCompany’s customer and the insurance carrier. The Company’s performance obligation is generally satisfied upon the issuance of the annuity policy. Shortlyafter the policy is issued, the carrier remits the commission payment to the Company, and the Company recognizes the revenue. The Company does not earn asignificant amount of trailer fees on annuity sales. The majority of the trailer fees relates to variable annuity products and are calculated based on a percentageof market value at period end. Revenue is not recognized until the annuity’s market value can be determined.
45

Table of Contents
Other
Other noninterest income consists of other recurring revenue streams such as commissions from sales of mutual funds and other investments, investmentadvisor fees from the Company’s Managed Account Platform Services (MAPS) wealth management product, safety deposit box rental fees, and othermiscellaneous revenue streams. Commissions from the sale of mutual funds and other investments are recognized on trade date, which is when the Companyhas satisfied its performance obligation. The Company also receives periodic service fees (i.e., trailers) from mutual fund companies typically based on apercentage of net asset value. Trailer revenue is recorded over time, usually monthly or quarterly, as net asset value is determined. Investment advisor feesfrom the MAPS wealth management product is earned over time and based on an annual percentage rate of the net asset value. The investment advisor feesare charged to the customer’s account in advance on the first month of the quarter, and the revenue is recognized over the following three-month period. Safedeposit box rental fees are charged to the customer on an annual basis and recognized upon receipt of payment. The Company determined that since rentalsand renewals occur fairly consistently over time, revenue is recognized on a basis consistent with the duration of the performance obligation.
The following presents noninterest income, segregated by revenue streams in-scope and out-of-scope of Topic 606, for the three months ended March 31,2018 and 2017.
Three Months Ended
March 31,
(dollars in thousands) 2018 2017
Noninterest Income In-scope of Topic 606: Trust and Asset Management $ 11,181 $ 11,479
Service Charges on Deposit Accounts 3,574 4,033
Fees, Exchange, and Other Service Charges 11,593 10,755
Annuity and Insurance 1,144 1,891
Other 2,277 2,096
Noninterest Income (in-scope of Topic 606) 29,769 30,254
Noninterest Income (out-of-scope of Topic 606) 14,266 25,662
Total Noninterest Income $ 44,035 $ 55,916
Contract Balances
A contract asset balance occurs when an entity performs a service for a customer before the customer pays consideration (resulting in a contract receivable) orbefore payment is due (resulting in a contract asset). A contract liability balance is an entity’s obligation to transfer a service to a customer for which theentity has already received payment (or payment is due) from the customer. The Company’s noninterest revenue streams are largely based on transactionalactivity, or standard month-end revenue accruals such as asset management fees based on month-end market values. Consideration is often receivedimmediately or shortly after the Company satisfies its performance obligation and revenue is recognized. The Company does not typically enter into long-term revenue contracts with customers, and therefore, does not experience significant contract balances. As of March 31, 2018 and December 31, 2017, theCompany did not have any significant contract balances.
Contract Acquisition Costs
In connection with the adoption of Topic 606, an entity is required to capitalize, and subsequently amortize into expense, certain incremental costs ofobtaining a contract with a customer if these costs are expected to be recovered. The incremental costs of obtaining a contract are those costs that an entityincurs to obtain a contract with a customer that it would not have incurred if the contract had not been obtained (for example, sales commission). TheCompany utilizes the practical expedient which allows entities to immediately expense contract acquisition costs when the asset that would have resultedfrom capitalizing these costs would have been amortized in one year or less. Upon adoption of Topic 606, the Company did not capitalize any contractacquisition cost.
46
Table of Contents
Item 2. Management’s Discussion and Analysis of Financial Condition and Results of Operations
Forward-Looking Statements
This report contains forward-looking statements within the meaning of the Private Securities Litigation Reform Act of 1995. These statements can beidentified by the fact that they do not relate strictly to historical or current facts and may include statements concerning, among other things, the anticipatedeconomic and business environment in our service area and elsewhere, credit quality and other financial and business matters in future periods, our futureresults of operations and financial position, our business strategy and plans and our objectives and future operations. We also may make forward-lookingstatements in our other documents filed with or furnished to the U.S. Securities and Exchange Commission (the “SEC”). In addition, our senior managementmay make forward-looking statements orally to analysts, investors, representatives of the media and others. Our forward-looking statements are based onnumerous assumptions, any of which could prove to be inaccurate, and actual results may differ materially from those projected because of a variety of risksand uncertainties, including, but not limited to: 1) general economic conditions either nationally, internationally, or locally may be different than expected,and particularly, any event that negatively impacts the tourism industry in Hawaii; 2) unanticipated changes in the securities markets, public debt markets, andother capital markets in the U.S. and internationally; 3) competitive pressures in the markets for financial services and products; 4) the impact of legislativeand regulatory initiatives, particularly the Dodd-Frank Wall Street Reform and Consumer Protection Act of 2010 (the “Dodd-Frank Act”) and the currentadministration’s review of potential changes to such initiatives; 5) changes in fiscal and monetary policies of the markets in which we operate; 6) theincreased cost of maintaining or the Company’s ability to maintain adequate liquidity and capital, based on the requirements adopted by the Basel Committeeon Banking Supervision and U.S. regulators; 7) actual or alleged conduct which could harm our reputation; 8) changes in accounting standards; 9) changes intax laws or regulations, including Public Law 115-97, commonly known as the Tax Cuts and Jobs Act, or the interpretation of such laws and regulations;10) changes in our credit quality or risk profile that may increase or decrease the required level of our reserve for credit losses; 11) changes in market interestrates that may affect credit markets and our ability to maintain our net interest margin; 12) the impact of litigation and regulatory investigations of theCompany, including costs, expenses, settlements, and judgments; 13) any failure in or breach of our operational systems, information systems orinfrastructure, or those of our merchants, third party vendors and other service providers; 14) any interruption or breach of security of our information systemsresulting in failures or disruptions in customer account management, general ledger processing, and loan or deposit systems; 15) changes to the amount andtiming of proposed common stock repurchases; and 16) natural disasters, public unrest or adverse weather, public health, and other conditions impacting usand our customers’ operations. Given these risks and uncertainties, investors should not place undue reliance on any forward-looking statement as aprediction of our actual results. A detailed discussion of these and other risks and uncertainties that could cause actual results and events to differ materiallyfrom such forward-looking statements is included under the section entitled “Risk Factors” in Part II of this report and Part I of our Annual Report onForm 10-K for the year ended December 31, 2017, and subsequent periodic and current reports filed with the SEC. Words such as “believes,” “anticipates,”“expects,” “intends,” “targeted,” and similar expressions are intended to identify forward-looking statements but are not the exclusive means of identifyingsuch statements. We undertake no obligation to update forward-looking statements to reflect later events or circumstances, except as may be required by law.
47
Table of Contents
Overview
Bank of Hawaii Corporation (the “Parent”) is a Delaware corporation and a bank holding company headquartered in Honolulu, Hawaii. The Parent’sprincipal operating subsidiary is Bank of Hawaii (the “Bank”).
The Bank, directly and through its subsidiaries, provides a broad range of financial services and products to businesses, consumers, and governments inHawaii, Guam, and other Pacific Islands. References to “we,” “our,” “us,” or the “Company” refer to the Parent and its subsidiaries that are consolidated forfinancial reporting purposes.
Our business strategy is to use our unique market knowledge, prudent management discipline and brand strength to deliver exceptional value to ourstakeholders.
Hawaii Economy
General economic conditions in Hawaii remained positive during the first quarter of 2018 due to a continuation of the strong tourism market, activeconstruction industry, low unemployment, and robust real estate market. For the first two months of 2018, total visitor arrivals increased 7.7% while totalvisitor spending increased 8.5% compared to the same period in 2017. The Hawaii statewide seasonally-adjusted unemployment rate was 2.1% in March2018 compared to 4.1% nationally. For the first three months of 2018, the volume of single-family home sales on Oahu decreased 0.4%, while the volume ofcondominium sales on Oahu increased 0.7% compared with the same period in 2017. The median price of single-family home sales and condominium saleson Oahu increased 2.0% and 9.0%, respectively, for the first three months of 2018 compared to the same period in 2017. As of March 31, 2018, months ofinventory of single-family homes and condominiums on Oahu remained low at 2.1 months and 2.6 months, respectively.
Earnings Summary
Net income for the first quarter of 2018 was $54.0 million, an increase of $2.9 million or 6% compared to the same period in 2017. Diluted earnings pershare was $1.28 for the first quarter of 2018, an increase of $0.08 or 7% compared to the same period in 2017.
Our higher earnings for the first quarter of 2018 were primarily due to the following:
• The provision for income taxes for the first quarter of 2018 was $10.4 million, a decrease of $11.2 million or 52% compared to the same period in 2017primarily due to the federal corporate tax rate changing from 35% to 21% as a result of the Tax Cuts and Jobs Act. The effective tax rate for the firstquarter of 2018 was 16.19%, down from 29.72% for the same period in 2017. The tax rate was also favorably impacted by a $2.0 million basisadjustment to the Company’s low income housing investments in the first quarter of 2018.
• Net interest income for the first quarter of 2018 was $119.0 million, an increase of $9.1 million or 8% compared to the same period in 2017. Thisincrease was primarily due to a higher level of earning assets, including growth in both our commercial and consumer lending portfolios, combined witha higher net interest margin. The higher level of earning assets was primarily funded by higher deposit balances. Our net interest margin was 3.00% in thefirst quarter of 2018, an increase of 11 basis points compared to the same period in 2017. The higher margin in 2018 was primarily due to our loans,which generally have higher yields than our investment securities, comprising a larger percentage of our earning assets compared to 2017. In addition,yields on our commercial loans, home equity loans, and investments portfolio increased. This increase was partially offset by an increase in rates offeredon our deposit products.
• Other noninterest income for the first quarter of 2018 was $6.9 million, an increase of $3.0 million or 78% in the first quarter of 2018 compared to thesame period in 2017 primarily due to a distribution received in the first quarter of 2018 from a low-income housing investment sale totaling $2.8 million.
48

Table of Contents
This increase was partially offset by the following:
• Investment securities gains (losses), net totaled $(0.7) million in the first quarter of 2018 compared to $12.1 million during the same period in 2017. Thenet losses in the first quarter of 2018 were due to fees paid to the counterparties of our prior Visa Class B share sale transactions. The net gain in the firstquarter of 2017 was primarily due the sale of 90,000 Visa Class B shares.
• Salaries and benefits for the first quarter of 2018 was $54.4 million, an increase of $3.3 million or 6% compared to the same period in 2017 primarily dueto merit and minimum wage increases.
• Other noninterest expense for the first quarter of 2018 was $17.1 million, an increase of $1.7 million or 11% compared to the same period in 2017primarily due to a $2.0 million increase in legal reserves.
• Mortgage banking income for the first quarter of 2018 was $2.1 million, a decrease of $1.2 million or 35% compared to the same period in 2017primarily due to lower loan sales.
We maintained a strong balance sheet during the first quarter of 2018, with what we believe are adequate reserves for credit losses and high levels of liquidityand capital.
• Total loans and leases were $9.9 billion as of March 31, 2018, an increase of $119.7 million or 1% from December 31, 2017 primarily due to growth inour consumer lending portfolio.
• The allowance for loan and lease losses (the “Allowance”) was $107.9 million as of March 31, 2018, an increase of $0.6 million or 1% fromDecember 31, 2017. The Allowance represents 1.09% of total loans and leases outstanding as of March 31, 2018 and 1.10% of total loans and leasesoutstanding as of December 31, 2017. The level of our Allowance was commensurate with the Company’s credit risk profile, loan portfolio growth andcomposition, and a healthy Hawaii economy.
• As of March 31, 2018, the total carrying value of our investment securities portfolio was $6.0 billion, a decrease of $187.9 million or 3% compared toDecember 31, 2017. During the first three months of 2018, we reduced our positions in mortgage-backed securities issued by Ginnie Mae and FannieMae. We re-invested these proceeds primarily into higher yielding loan products. In addition, we increased our holdings in Small BusinessAdministration securities and U.S. Treasury notes. Ginnie Mae mortgage-backed securities continue to be our largest concentration in our portfolio.
• Total deposits were $15.0 billion as of March 31, 2018, an increase of $73.2 million or less than 1% from December 31, 2017 primarily due to anincrease in consumer deposits offset by a decrease in commercial, public and other deposits.
• Total shareholders’ equity was $1.2 billion as of March 31, 2018, an increase of $9.3 million or 1% from December 31, 2017. We continued to returncapital to our shareholders in the form of share repurchases and dividends. During the first three months of 2018, we acquired 208,328 shares of ourcommon stock at a total cost of $17.5 million under our share repurchase program and from shares obtained from employees and/or directors inconnection with income tax withholdings related to the vesting of restricted stock, shares purchased for a deferred compensation plan, and stock swaps,less shares distributed from the deferred compensation plan. We also paid cash dividends of $22.1 million during the first three months of 2018.
49

Table of Contents
Our financial highlights are presented in Table 1.
Financial Highlights
Table 1 Three Months Ended March 31,
(dollars in thousands, except per share amounts) 2018 2017
For the Period:
Operating Results
Net Interest Income $ 118,956 $ 109,872
Provision for Credit Losses 4,125 4,400
Total Noninterest Income 44,035 55,916
Total Noninterest Expense 94,384 88,568
Net Income 54,040 51,176
Basic Earnings Per Share 1.29 1.21
Diluted Earnings Per Share 1.28 1.20
Dividends Declared Per Share 0.52 0.50
Performance Ratios
Return on Average Assets 1.29% 1.26%
Return on Average Shareholders’ Equity 17.74 17.63
Efficiency Ratio 1 57.91 53.42
Net Interest Margin 2 3.00 2.89
Dividend Payout Ratio 3 40.31 41.32
Average Shareholders’ Equity to Average Assets 7.29 7.16
Average Balances
Average Loans and Leases $ 9,803,753 $ 9,020,351
Average Assets 16,957,430 16,434,606
Average Deposits 14,720,266 14,218,886
Average Shareholders’ Equity 1,235,550 1,177,326
Market Price Per Share of Common Stock
Closing $ 83.10 $ 82.36
High 89.09 90.80
Low 78.40 77.03
March 31,
2018 December 31,
2017
As of Period End:
Balance Sheet Totals
Loans and Leases $ 9,916,628 $ 9,796,947
Total Assets 17,136,030 17,089,052
Total Deposits 14,957,133 14,883,968
Other Debt 235,699 260,716
Total Shareholders’ Equity 1,241,193 1,231,868
Asset Quality
Non-Performing Assets $ 15,736 $ 16,120
Allowance for Loan and Lease Losses 107,938 107,346
Allowance to Loans and Leases Outstanding 1.09% 1.10%
Capital Ratios
Common Equity Tier 1 Capital Ratio 13.37% 13.24%
Tier 1 Capital Ratio 13.37 13.24
Total Capital Ratio 14.59 14.46
Tier 1 Leverage Ratio 7.46 7.26
Total Shareholders’ Equity to Total Assets 7.24 7.21
Tangible Common Equity to Tangible Assets 4 7.07 7.04
Tangible Common Equity to Risk-Weighted Assets 4 12.80 12.84
Non-Financial Data
Full-Time Equivalent Employees 2,138 2,132Branches 69 69

ATMs 377 387
1 Efficiency ratio is defined as noninterest expense divided by total revenue (net interest income and total noninterest income).2 Net interest margin is defined as net interest income, on a taxable-equivalent basis, as a percentage of average earning assets.3 Dividend payout ratio is defined as dividends declared per share divided by basic earnings per share.4 Tangible common equity to tangible assets and tangible common equity to risk-weighted assets are Non-GAAP financial measures. See the “Use of Non-GAAP Financial Measures” section
below.
50
Table of Contents
Use of Non-GAAP Financial Measures
The ratios “tangible common equity to tangible assets” and “tangible common equity to risk-weighted assets” are Non-GAAP financial measures. TheCompany believes these measurements are useful for investors, regulators, management and others to evaluate capital adequacy relative to other financialinstitutions. Although these Non-GAAP financial measures are frequently used by stakeholders in the evaluation of a financial institution, they havelimitations as analytical tools, and should not be considered in isolation, or as a substitute for analyses of results as reported under GAAP. Table 2 provides areconciliation of these Non-GAAP financial measures with their most closely related GAAP measures.
GAAP to Non-GAAP Reconciliation
Table 2
(dollars in thousands)March 31,
2018 December 31,
2017
Total Shareholders’ Equity $ 1,241,193 $ 1,231,868
Less: Goodwill 31,517 31,517
Tangible Common Equity $ 1,209,676 $ 1,200,351
Total Assets $ 17,136,030 $ 17,089,052
Less: Goodwill 31,517 31,517
Tangible Assets $ 17,104,513 $ 17,057,535
Risk-Weighted Assets, determined in accordance with prescribed regulatory requirements $ 9,451,647 $ 9,348,296
Total Shareholders’ Equity to Total Assets 7.24% 7.21%
Tangible Common Equity to Tangible Assets (Non-GAAP) 7.07% 7.04%
Tier 1 Capital Ratio 13.37% 13.24%
Tangible Common Equity to Risk-Weighted Assets (Non-GAAP) 12.80% 12.84%
51
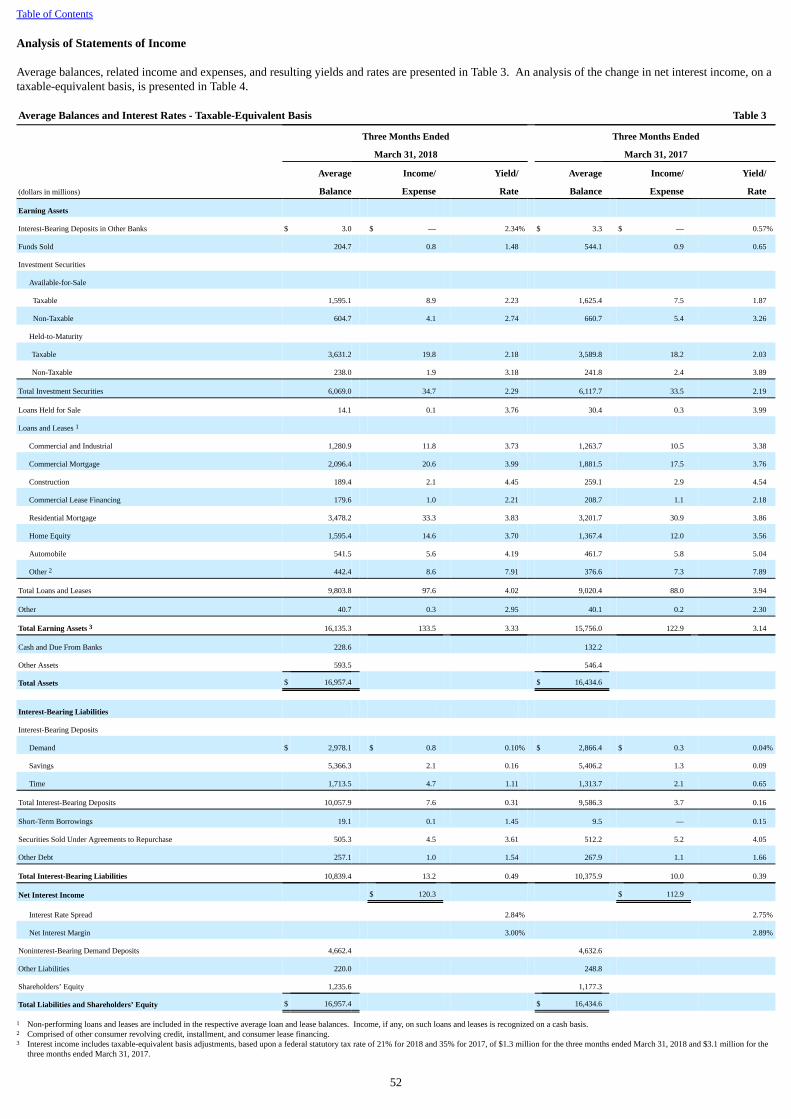
Table of Contents
Analysis of Statements of Income
Average balances, related income and expenses, and resulting yields and rates are presented in Table 3. An analysis of the change in net interest income, on ataxable-equivalent basis, is presented in Table 4.
Average Balances and Interest Rates - Taxable-Equivalent Basis Table 3 Three Months Ended Three Months Ended
March 31, 2018 March 31, 2017
Average Income/ Yield/ Average Income/ Yield/
(dollars in millions) Balance Expense Rate Balance Expense Rate
Earning Assets
Interest-Bearing Deposits in Other Banks $ 3.0 $ — 2.34% $ 3.3 $ — 0.57%
Funds Sold 204.7 0.8 1.48 544.1 0.9 0.65
Investment Securities
Available-for-Sale
Taxable 1,595.1 8.9 2.23 1,625.4 7.5 1.87
Non-Taxable 604.7 4.1 2.74 660.7 5.4 3.26
Held-to-Maturity
Taxable 3,631.2 19.8 2.18 3,589.8 18.2 2.03
Non-Taxable 238.0 1.9 3.18 241.8 2.4 3.89
Total Investment Securities 6,069.0 34.7 2.29 6,117.7 33.5 2.19
Loans Held for Sale 14.1 0.1 3.76 30.4 0.3 3.99
Loans and Leases 1
Commercial and Industrial 1,280.9 11.8 3.73 1,263.7 10.5 3.38
Commercial Mortgage 2,096.4 20.6 3.99 1,881.5 17.5 3.76
Construction 189.4 2.1 4.45 259.1 2.9 4.54
Commercial Lease Financing 179.6 1.0 2.21 208.7 1.1 2.18
Residential Mortgage 3,478.2 33.3 3.83 3,201.7 30.9 3.86
Home Equity 1,595.4 14.6 3.70 1,367.4 12.0 3.56
Automobile 541.5 5.6 4.19 461.7 5.8 5.04
Other 2 442.4 8.6 7.91 376.6 7.3 7.89
Total Loans and Leases 9,803.8 97.6 4.02 9,020.4 88.0 3.94
Other 40.7 0.3 2.95 40.1 0.2 2.30
Total Earning Assets 3 16,135.3 133.5 3.33 15,756.0 122.9 3.14
Cash and Due From Banks 228.6 132.2
Other Assets 593.5 546.4
Total Assets $ 16,957.4 $ 16,434.6
Interest-Bearing Liabilities
Interest-Bearing Deposits
Demand $ 2,978.1 $ 0.8 0.10% $ 2,866.4 $ 0.3 0.04%
Savings 5,366.3 2.1 0.16 5,406.2 1.3 0.09
Time 1,713.5 4.7 1.11 1,313.7 2.1 0.65
Total Interest-Bearing Deposits 10,057.9 7.6 0.31 9,586.3 3.7 0.16
Short-Term Borrowings 19.1 0.1 1.45 9.5 — 0.15
Securities Sold Under Agreements to Repurchase 505.3 4.5 3.61 512.2 5.2 4.05
Other Debt 257.1 1.0 1.54 267.9 1.1 1.66
Total Interest-Bearing Liabilities 10,839.4 13.2 0.49 10,375.9 10.0 0.39
Net Interest Income $ 120.3 $ 112.9
Interest Rate Spread 2.84% 2.75%
Net Interest Margin 3.00% 2.89%
Noninterest-Bearing Demand Deposits 4,662.4 4,632.6
Other Liabilities 220.0 248.8
Shareholders’ Equity 1,235.6 1,177.3
Total Liabilities and Shareholders’ Equity $ 16,957.4 $ 16,434.6
1 Non-performing loans and leases are included in the respective average loan and lease balances. Income, if any, on such loans and leases is recognized on a cash basis.2 Comprised of other consumer revolving credit, installment, and consumer lease financing.3 Interest income includes taxable-equivalent basis adjustments, based upon a federal statutory tax rate of 21% for 2018 and 35% for 2017, of $1.3 million for the three months ended March 31, 2018 and $3.1 million for the
three months ended March 31, 2017.
52
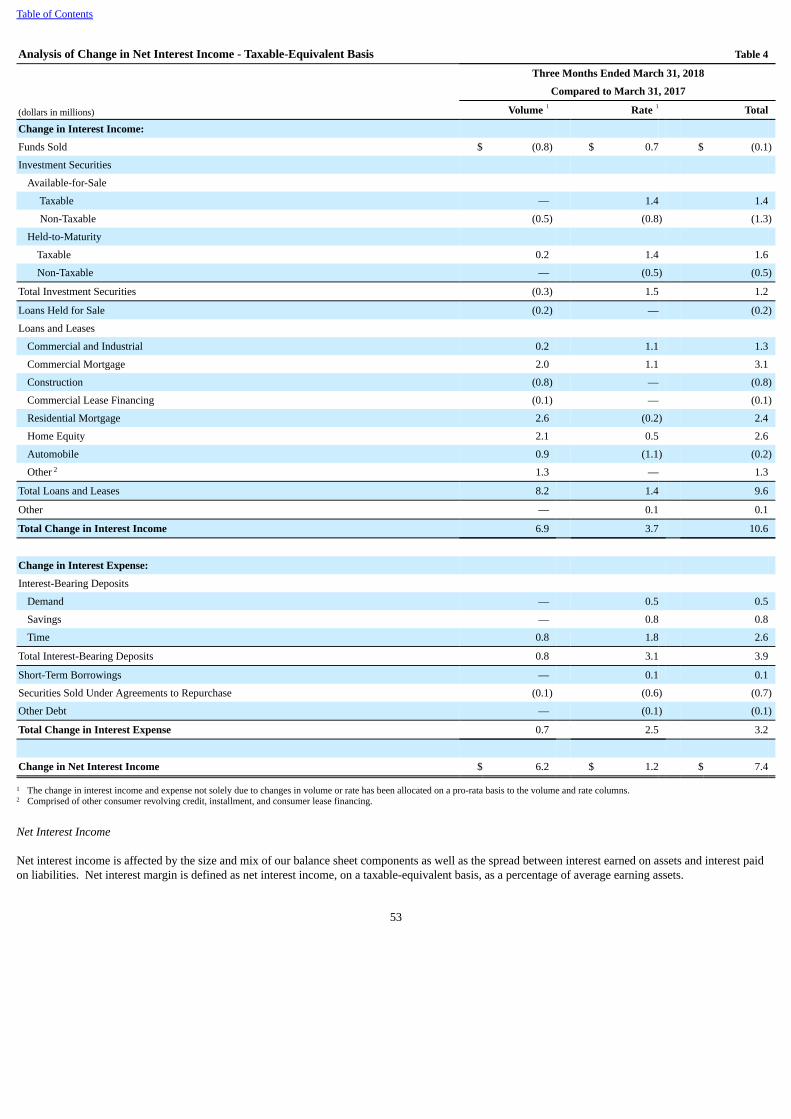
Table of Contents
Analysis of Change in Net Interest Income - Taxable-Equivalent Basis Table 4
Three Months Ended March 31, 2018
Compared to March 31, 2017
(dollars in millions) Volume 1 Rate 1 Total
Change in Interest Income:
Funds Sold $ (0.8) $ 0.7 $ (0.1)
Investment Securities
Available-for-Sale Taxable — 1.4 1.4
Non-Taxable (0.5) (0.8) (1.3)
Held-to-Maturity Taxable 0.2 1.4 1.6
Non-Taxable — (0.5) (0.5)
Total Investment Securities (0.3) 1.5 1.2
Loans Held for Sale (0.2) — (0.2)
Loans and Leases Commercial and Industrial 0.2 1.1 1.3
Commercial Mortgage 2.0 1.1 3.1
Construction (0.8) — (0.8)
Commercial Lease Financing (0.1) — (0.1)
Residential Mortgage 2.6 (0.2) 2.4
Home Equity 2.1 0.5 2.6
Automobile 0.9 (1.1) (0.2)
Other 2 1.3 — 1.3
Total Loans and Leases 8.2 1.4 9.6
Other — 0.1 0.1
Total Change in Interest Income 6.9 3.7 10.6
Change in Interest Expense:
Interest-Bearing Deposits
Demand — 0.5 0.5
Savings — 0.8 0.8
Time 0.8 1.8 2.6
Total Interest-Bearing Deposits 0.8 3.1 3.9
Short-Term Borrowings — 0.1 0.1
Securities Sold Under Agreements to Repurchase (0.1) (0.6) (0.7)
Other Debt — (0.1) (0.1)
Total Change in Interest Expense 0.7 2.5 3.2
Change in Net Interest Income $ 6.2 $ 1.2 $ 7.4
1 The change in interest income and expense not solely due to changes in volume or rate has been allocated on a pro-rata basis to the volume and rate columns.2 Comprised of other consumer revolving credit, installment, and consumer lease financing.
Net Interest Income
Net interest income is affected by the size and mix of our balance sheet components as well as the spread between interest earned on assets and interest paidon liabilities. Net interest margin is defined as net interest income, on a taxable-equivalent basis, as a percentage of average earning assets.
53

Table of Contents
Net interest income was $119.0 million for the first quarter of 2018, an increase of $9.1 million or 8% compared to the same period in 2017. On a taxable-equivalent basis, net interest income was $120.3 million for the first quarter of 2018, an increase of $7.4 million or 7% compared to the same period in 2017.This increase was primarily due to a higher level of earning assets, including growth in both our commercial and consumer lending portfolios, and higher netinterest margin. The higher level of earning assets was primarily funded by higher deposit balances. Net interest margin was 3.00% for the first quarter of2018, an increase of 11 basis points compared to the same period in 2017. The higher margin in 2018 was primarily due to our loans, which generally havehigher yields than our investment securities, comprising a larger percentage of our earning assets compared to 2017.
Yields on our earning assets increased by 19 basis points in the first quarter of 2018 compared to the same period in 2017 primarily due to the aforementionedshift in the mix of our earning assets from investment securities to loans, which generally have higher yields. Yields on our commercial and industrial andcommercial mortgage loans increased by 35 basis points and 23 basis points, respectively, due to higher yields on floating rate loans. Yields on our investmentsecurities portfolio increased by 10 basis points primarily due to the higher interest rate environment and lower premium amortization. These yield increaseswere partially offset by an 85 basis point and 3 basis point yield decreases in our automobile and residential mortgage loan portfolios, respectively, primarilydue to continued payoff activity of higher-rate loans and the addition of lower-rate loans to both portfolios.
Interest rates paid on our interest-bearing liabilities increased by 10 basis points in the first quarter of 2018 compared to the same period in 2017. Increases toour funding costs are primarily due to higher rates paid on our time deposits, offset by growth in our interest-bearing demand deposits, which generally havelower rates than other funding sources. Interest rates paid on our time deposits increased by 46 basis points for the first three months of 2018 compared to thesame period in 2017, a reflection of the higher interest rate environment. The average balance of core deposits increased by $71.8 million or 1% in 2018compared to 2017. The higher funding costs were partially offset by the lower rates paid on our securities sold under agreements to repurchase. Interest ratespaid on our repurchase agreements decreased by 44 basis points for the first three months of 2018 compared to the same period in 2017 primarily due to therestructuring of three repurchase agreements with private institutions with an aggregate total of $200.0 million. These repurchase agreements were to maturein 2018 and had a weighted-average interest rate of 3.94%. The restructuring of the agreements extended the maturity dates to June 2022 and lowered theweighted-average interest rate to 2.70% effective June 2017.
Average balances of our earning assets increased by $379.3 million or 2% in the first quarter of 2018 compared to the same period in 2017 primarily due toloan growth as the average balances of our loan and lease portfolio increased by $783.4 million. The average balance of our residential mortgage portfolioincreased by $276.5 million in the first quarter of 2018 primarily due to a relatively constant level of loan originations combined with a slowdown in payoffactivity. The average balance of our home equity portfolio increased by $228.0 million in the first quarter of 2018 due in large part to the continued loandemand in light of a strong Hawaii economy and healthy real estate market conditions. In addition, we experienced healthy line utilization during 2018. Theaverage balance of our commercial mortgage portfolio increased by $214.9 million in the first quarter of 2018 as a result of continued demand from new andexisting customers as a result of a strong Hawaii economy. Partially offsetting the increase in the average balances of our loans and leases portfolio was a$48.7 million decrease in the average balance of our investment securities portfolio in the first quarter of 2018 primarily due to the shift in the mix of ourearning assets from investment securities to loans.
Average balances of our interest-bearing liabilities increased by $463.5 million or 4% in the first quarter of 2018 compared to the same period in 2017primarily due to growth in our time deposits, along with continued growth in our relationship checking products. Additionally, average balances of our timedeposits increased by $399.8 million, while interest-bearing demand accounts increased by $111.7 million for the first quarter of 2018.
Provision for Credit Losses
The provision for credit losses (the “Provision”) reflects our judgment of the expense or benefit necessary to achieve the appropriate amount of theAllowance. We maintain the Allowance at levels we believe adequate to cover our estimate of probable credit losses as of the end of the reporting period. The Allowance is determined through detailed quarterly analyses of the loan and lease portfolio. The Allowance is based on our loss experience and changesin the economic environment, as well as an ongoing assessment of credit quality. Additional factors that are considered in determining the amount of theAllowance are the level of net charge-offs, non-performing assets, risk-rating migration, as well as changes in our portfolio size and composition. Werecorded a provision of $4.1 million in the first quarter of 2018 compared to a $4.4 million provision in the same period in 2017. Our decision to record aprovision is reflective of our evaluation of the adequacy of the Allowance. For further discussion on the Allowance, see “Corporate Risk Profile - Reserve forCredit Losses” in this Management’s Discussion and Analysis of Financial Condition and Results of Operations.
54
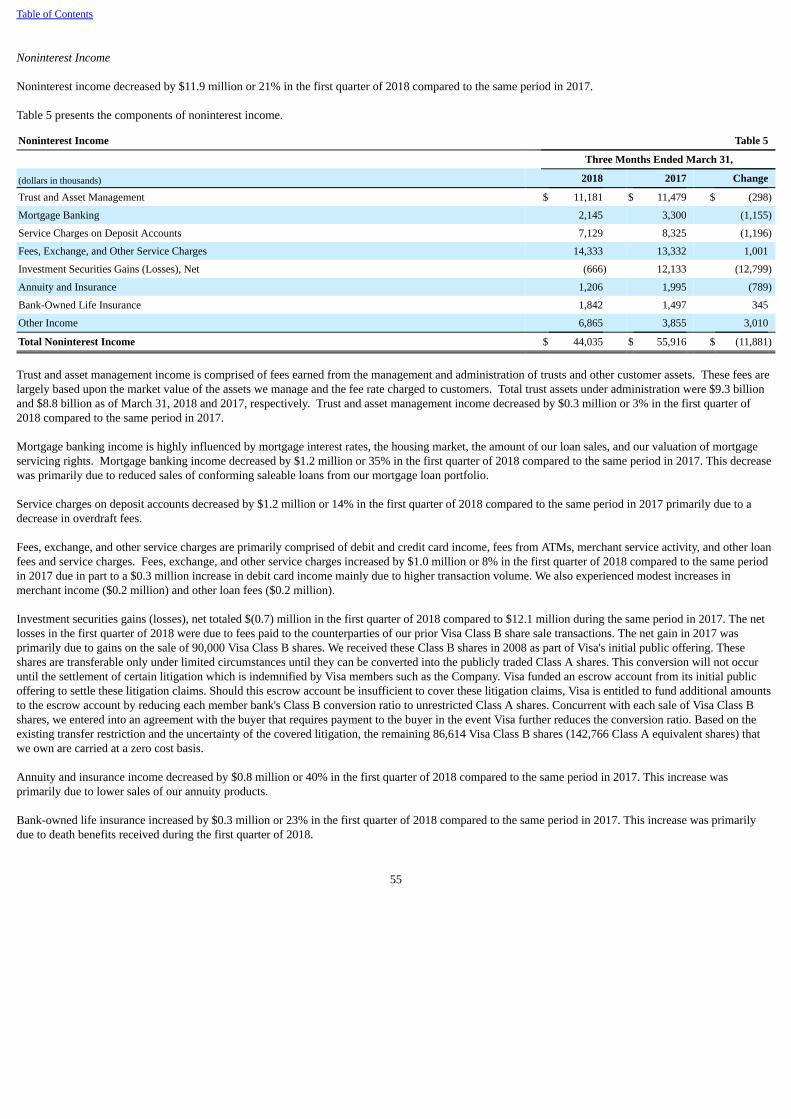
Table of Contents
Noninterest Income
Noninterest income decreased by $11.9 million or 21% in the first quarter of 2018 compared to the same period in 2017.
Table 5 presents the components of noninterest income.
Noninterest Income Table 5
Three Months Ended March 31,
(dollars in thousands) 2018 2017 Change
Trust and Asset Management $ 11,181 $ 11,479 $ (298)
Mortgage Banking 2,145 3,300 (1,155)
Service Charges on Deposit Accounts 7,129 8,325 (1,196)
Fees, Exchange, and Other Service Charges 14,333 13,332 1,001
Investment Securities Gains (Losses), Net (666) 12,133 (12,799)
Annuity and Insurance 1,206 1,995 (789)
Bank-Owned Life Insurance 1,842 1,497 345
Other Income 6,865 3,855 3,010
Total Noninterest Income $ 44,035 $ 55,916 $ (11,881)
Trust and asset management income is comprised of fees earned from the management and administration of trusts and other customer assets. These fees arelargely based upon the market value of the assets we manage and the fee rate charged to customers. Total trust assets under administration were $9.3 billionand $8.8 billion as of March 31, 2018 and 2017, respectively. Trust and asset management income decreased by $0.3 million or 3% in the first quarter of2018 compared to the same period in 2017.
Mortgage banking income is highly influenced by mortgage interest rates, the housing market, the amount of our loan sales, and our valuation of mortgageservicing rights. Mortgage banking income decreased by $1.2 million or 35% in the first quarter of 2018 compared to the same period in 2017. This decreasewas primarily due to reduced sales of conforming saleable loans from our mortgage loan portfolio.
Service charges on deposit accounts decreased by $1.2 million or 14% in the first quarter of 2018 compared to the same period in 2017 primarily due to adecrease in overdraft fees.
Fees, exchange, and other service charges are primarily comprised of debit and credit card income, fees from ATMs, merchant service activity, and other loanfees and service charges. Fees, exchange, and other service charges increased by $1.0 million or 8% in the first quarter of 2018 compared to the same periodin 2017 due in part to a $0.3 million increase in debit card income mainly due to higher transaction volume. We also experienced modest increases inmerchant income ($0.2 million) and other loan fees ($0.2 million).
Investment securities gains (losses), net totaled $(0.7) million in the first quarter of 2018 compared to $12.1 million during the same period in 2017. The netlosses in the first quarter of 2018 were due to fees paid to the counterparties of our prior Visa Class B share sale transactions. The net gain in 2017 wasprimarily due to gains on the sale of 90,000 Visa Class B shares. We received these Class B shares in 2008 as part of Visa's initial public offering. Theseshares are transferable only under limited circumstances until they can be converted into the publicly traded Class A shares. This conversion will not occuruntil the settlement of certain litigation which is indemnified by Visa members such as the Company. Visa funded an escrow account from its initial publicoffering to settle these litigation claims. Should this escrow account be insufficient to cover these litigation claims, Visa is entitled to fund additional amountsto the escrow account by reducing each member bank's Class B conversion ratio to unrestricted Class A shares. Concurrent with each sale of Visa Class Bshares, we entered into an agreement with the buyer that requires payment to the buyer in the event Visa further reduces the conversion ratio. Based on theexisting transfer restriction and the uncertainty of the covered litigation, the remaining 86,614 Visa Class B shares (142,766 Class A equivalent shares) thatwe own are carried at a zero cost basis.
Annuity and insurance income decreased by $0.8 million or 40% in the first quarter of 2018 compared to the same period in 2017. This increase wasprimarily due to lower sales of our annuity products.
Bank-owned life insurance increased by $0.3 million or 23% in the first quarter of 2018 compared to the same period in 2017. This increase was primarilydue to death benefits received during the first quarter of 2018.
55

Table of Contents
Other noninterest income increased by $3.0 million or 78% in the first quarter of 2018 compared to the same periods in 2017 primarily due to a distributionreceived in the first quarter of 2018 from a low-income housing investment sale totaling $2.8 million.
Noninterest Expense
Noninterest expense increased by $5.8 million or 7% in the first quarter of 2018 compared to the same period in 2017.
Table 6 presents the components of noninterest expense.
Noninterest Expense Table 6
Three Months Ended March 31,
(dollars in thousands) 2018 2017 Change
Salaries $ 32,704 $ 29,425 $ 3,279
Incentive Compensation 5,178 5,774 (596)
Share-Based Compensation 2,081 2,303 (222)
Commission Expense 954 1,836 (882)
Retirement and Other Benefits 4,841 4,604 237
Payroll Taxes 4,172 3,944 228
Medical, Dental, and Life Insurance 3,461 3,279 182
Separation Expense 1,031 — 1,031
Total Salaries and Benefits 54,422 51,165 3,257
Net Occupancy 8,534 8,168 366
Net Equipment 5,527 5,501 26
Data Processing 3,891 3,410 481
Professional Fees 2,773 2,779 (6)
FDIC Insurance 2,157 2,209 (52)
Other Expense: Delivery and Postage Services 2,289 2,333 (44)
Mileage Program Travel 1,135 1,125 10
Merchant Transaction and Card Processing Fees 1,328 937 391
Advertising 1,255 1,282 (27)
Amortization of Solar Energy Partnership Investments 916 848 68
Other 10,157 8,811 1,346
Total Other Expense 17,080 15,336 1,744
Total Noninterest Expense $ 94,384 $ 88,568 $ 5,816
Total salaries and benefits expense increased by $3.3 million or 6% in the first quarter of 2018 compared to the same period in 2017. Salaries increased by$3.3 million primarily due to merit and minimum wage increases. In addition, separation expense increased by $1.0 million. These increases were partiallyoffset by a $0.9 million decrease in commission expense due to a decrease in loan origination and refinancing activity coupled with lower sales of annuityproducts. In addition, incentive compensation decreased by $0.6 million.
Net occupancy increased by 0.4 million or 4% in the first quarter of 2018 compared to the same period in 2017. This increase was primarily due to ATM leasespace rental costs of $0.3 million. These costs were recorded as a reduction of ATM fee income in 2017. This accounting change was related to the 2018adoption of the new revenue recognition accounting guidance.
Data processing increased by $0.5 million or 14% in the first quarter of 2018 compared to the same period in 2017 due to ongoing information technologyprojects.
Total other expense increased by $1.7 million or 11% in the first quarter of 2018 compared to the same period in 2017 primarily due to a $2.0 million increasein legal reserves.
56

Table of Contents
Provision for Income Taxes
Table 7 presents our provision for income taxes and effective tax rates.
Provision for Income Taxes and Effective Tax Rates Table 7
Three Months EndedMarch 31,
(dollars in thousands) 2018 2017
Provision for Income Taxes $ 10,442 $ 21,644
Effective Tax Rates 16.19% 29.72%
The provision for income taxes was $10.4 million in the first quarter of 2018, a decrease of $11.2 million or 52% compared to the same period in 2017. Theeffective tax rate was 16.19% in the first quarter of 2018 compared to 29.72% in the same period in 2017. The lower effective rate in the first quarter of 2018was primarily due to the federal corporate tax rate changing from 35% to 21% as a result of the Tax Cuts and Jobs Act. The tax rate was also favorablyimpacted by a $2.0 million basis adjustment to the company’s low income housing investments in the first quarter of 2018. This was partially offset by the taxbenefits from the exercise of stock options and the vesting of restricted stock being $1.1 million lower in the first quarter of 2018 compared to 2017.
57

Table of Contents
Analysis of Statements of Condition
Investment Securities
The carrying value of our investment securities portfolio was $6.0 billion as of March 31, 2018, a decrease of $187.9 million or 3% compared toDecember 31, 2017. As of March 31, 2018, our investment securities portfolio was comprised of securities with an average base duration of approximately3.6 years.
We continually evaluate our investment securities portfolio in response to established asset/liability management objectives, changing market conditions thatcould affect profitability, and the level of interest rate risk to which we are exposed. These evaluations may cause us to change the level of funds we deployinto investment securities, change the composition of our investment securities portfolio, and change the proportion of investments made into the available-for-sale and held-to-maturity investment categories.
During the first three months of 2018, we reduced our positions in mortgage-backed securities issued by Ginnie Mae and Fannie Mae. We re-invested theseproceeds primarily into higher yielding loan products. In addition, we increased our holdings in Small Business Administration securities and U.S. Treasurynotes. Ginnie Mae mortgage-backed securities continue to be our largest concentration in our portfolio. As of March 31, 2018, our portfolio of Ginnie Maemortgage-backed securities was primarily comprised of securities issued in 2008 or later. As of March 31, 2018, these mortgage-backed securities were allAAA-rated, with a low probability of a change in their credit ratings in the near future. As of March 31, 2018, our available-for-sale investment securitiesportfolio was comprised of securities with an average base duration of approximately 2.5 years.
Gross unrealized gains in our investment securities portfolio were $26.1 million as of March 31, 2018 and $36.6 million as of December 31, 2017. Grossunrealized losses on our temporarily impaired investment securities were $120.3 million as of March 31, 2018 and $73.9 million as of December 31, 2017.The higher unrealized losses were primarily caused by the higher interest rate environment. The gross unrealized loss positions were primarily related tomortgage-backed securities issued by Ginnie Mae, Fannie Mae and Freddie Mac, and corporate debt securities. See Note 3 to the Consolidated FinancialStatements for more information.
As of March 31, 2018, included in our investment securities portfolio were debt securities issued by political subdivisions within the State of Hawaii of$488.4 million, representing 57% of the total fair value of the Company’s municipal debt securities. Of the entire Hawaii municipal bond portfolio, 94% werecredit-rated Aa2 or better by Moody’s while the remaining Hawaii municipal bonds were credit-rated A1 or better by at least one nationally recognizedstatistical rating organization. Approximately 79% of our Hawaii municipal bond holdings were general obligation issuances. As of March 31, 2018, therewere no other holdings of municipal debt securities that were issued by a single state or political subdivision which comprised more than 10% of the total fairvalue of our municipal debt securities.
58

Table of Contents
Loans and Leases
Table 8 presents the composition of our loan and lease portfolio by major categories.
Loan and Lease Portfolio Balances Table 8
(dollars in thousands)March 31,
2018 December 31,
2017
Commercial
Commercial and Industrial $ 1,329,096 $ 1,279,347
Commercial Mortgage 2,097,339 2,103,967
Construction 186,530 202,253
Lease Financing 179,771 180,931
Total Commercial 3,792,736 3,766,498
Consumer
Residential Mortgage 3,505,239 3,466,773
Home Equity 1,601,698 1,585,455
Automobile 558,468 528,474
Other 1 458,487 449,747
Total Consumer 6,123,892 6,030,449
Total Loans and Leases $ 9,916,628 $ 9,796,947
1 Comprised of other revolving credit, installment, and lease financing.
Total loans and leases as of March 31, 2018 increased by $119.7 million or 1% from December 31, 2017 primarily due to growth in our consumer lendingportfolio.
Commercial loans and leases as of March 31, 2018 increased by $26.2 million or 1% from December 31, 2017. Commercial and industrial loans increased by$49.7 million or 4% from December 31, 2017. Commercial mortgage loans decreased by $6.6 million or less than 1% from December 31, 2017. Although weexperienced continued strong loan production in this portfolio, there were repayments of commercial mortgage loans in excess of $60.0 million resulting fromincreased property sales in the first three months of 2018. Construction loans decreased by $15.7 million or 8% from December 31, 2017 primarily due topaydowns and successful completion of construction projects such as condominiums and low-income housing, partially offset by increased activity in ourportfolio. Lease financing remained relatively unchanged from December 31, 2017.
Consumer loans and leases as of March 31, 2018 increased by $93.4 million or 2% from December 31, 2017. Residential mortgage loans increased by $38.5million or 1% from December 31, 2017 primarily due to a relatively constant level of loan originations combined with a slowdown in payoff activity. Homeequity lines and loans increased by $16.2 million or 1% from December 31, 2017 as a result of continued loan demand in light of a strong Hawaii economyand healthy real estate market conditions. Additionally, utilization on new and existing home equity lines remained steady during 2018. Automobile loansincreased by $30.0 million or 6% from December 31, 2017 primarily driven by competitive pricing and focus on providing exceptional service. Otherconsumer loans increased by $8.7 million or 2% from December 31, 2017, primarily due to growth in our automobile leasing and installment loans.
59
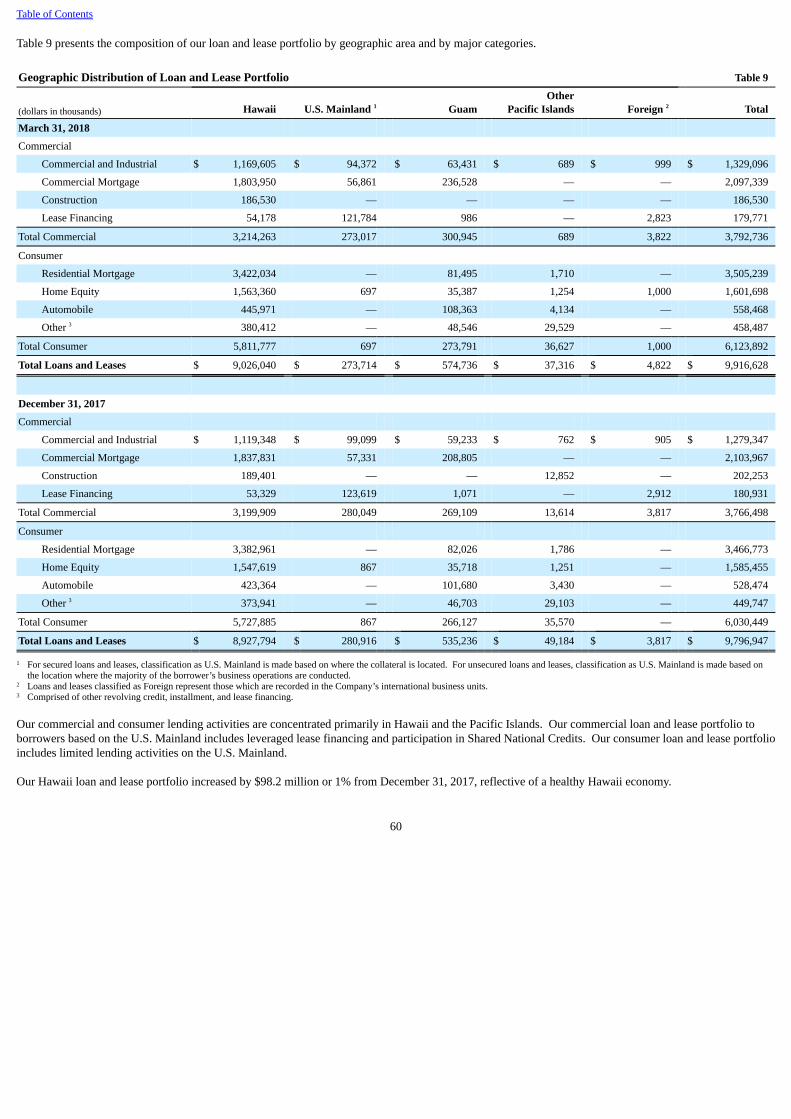
Table of Contents
Table 9 presents the composition of our loan and lease portfolio by geographic area and by major categories.
Geographic Distribution of Loan and Lease Portfolio Table 9
(dollars in thousands) Hawaii U.S. Mainland 1 Guam Other
Pacific Islands Foreign 2 Total
March 31, 2018
Commercial
Commercial and Industrial $ 1,169,605 $ 94,372 $ 63,431 $ 689 $ 999 $ 1,329,096
Commercial Mortgage 1,803,950 56,861 236,528 — — 2,097,339
Construction 186,530 — — — — 186,530
Lease Financing 54,178 121,784 986 — 2,823 179,771
Total Commercial 3,214,263 273,017 300,945 689 3,822 3,792,736
Consumer
Residential Mortgage 3,422,034 — 81,495 1,710 — 3,505,239
Home Equity 1,563,360 697 35,387 1,254 1,000 1,601,698
Automobile 445,971 — 108,363 4,134 — 558,468
Other 3 380,412 — 48,546 29,529 — 458,487
Total Consumer 5,811,777 697 273,791 36,627 1,000 6,123,892
Total Loans and Leases $ 9,026,040 $ 273,714 $ 574,736 $ 37,316 $ 4,822 $ 9,916,628
December 31, 2017
Commercial
Commercial and Industrial $ 1,119,348 $ 99,099 $ 59,233 $ 762 $ 905 $ 1,279,347
Commercial Mortgage 1,837,831 57,331 208,805 — — 2,103,967
Construction 189,401 — — 12,852 — 202,253
Lease Financing 53,329 123,619 1,071 — 2,912 180,931
Total Commercial 3,199,909 280,049 269,109 13,614 3,817 3,766,498
Consumer
Residential Mortgage 3,382,961 — 82,026 1,786 — 3,466,773
Home Equity 1,547,619 867 35,718 1,251 — 1,585,455
Automobile 423,364 — 101,680 3,430 — 528,474
Other 3 373,941 — 46,703 29,103 — 449,747
Total Consumer 5,727,885 867 266,127 35,570 — 6,030,449
Total Loans and Leases $ 8,927,794 $ 280,916 $ 535,236 $ 49,184 $ 3,817 $ 9,796,947
1 For secured loans and leases, classification as U.S. Mainland is made based on where the collateral is located. For unsecured loans and leases, classification as U.S. Mainland is made based onthe location where the majority of the borrower’s business operations are conducted.
2 Loans and leases classified as Foreign represent those which are recorded in the Company’s international business units.3 Comprised of other revolving credit, installment, and lease financing.
Our commercial and consumer lending activities are concentrated primarily in Hawaii and the Pacific Islands. Our commercial loan and lease portfolio toborrowers based on the U.S. Mainland includes leveraged lease financing and participation in Shared National Credits. Our consumer loan and lease portfolioincludes limited lending activities on the U.S. Mainland.
Our Hawaii loan and lease portfolio increased by $98.2 million or 1% from December 31, 2017, reflective of a healthy Hawaii economy.
60
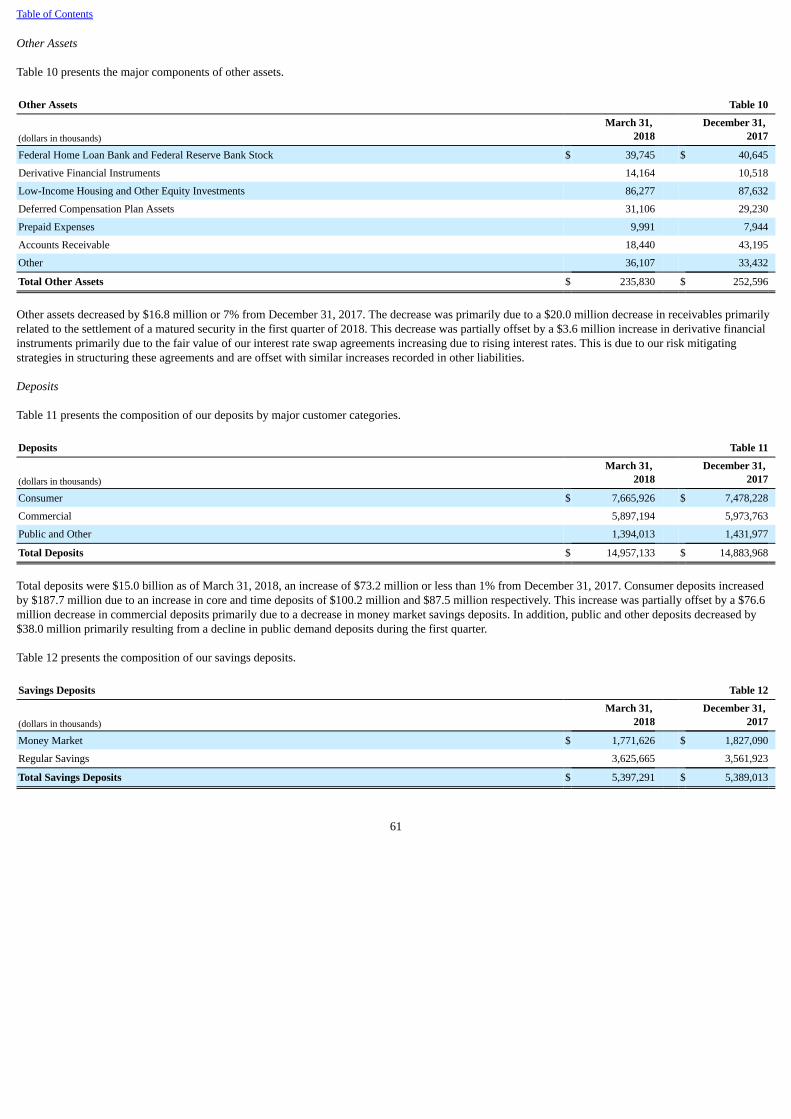
Table of Contents
Other Assets
Table 10 presents the major components of other assets.
Other Assets
Table 10
(dollars in thousands)March 31,
2018 December 31,
2017
Federal Home Loan Bank and Federal Reserve Bank Stock $ 39,745 $ 40,645
Derivative Financial Instruments 14,164 10,518
Low-Income Housing and Other Equity Investments 86,277 87,632
Deferred Compensation Plan Assets 31,106 29,230
Prepaid Expenses 9,991 7,944
Accounts Receivable 18,440 43,195
Other 36,107 33,432
Total Other Assets $ 235,830 $ 252,596
Other assets decreased by $16.8 million or 7% from December 31, 2017. The decrease was primarily due to a $20.0 million decrease in receivables primarilyrelated to the settlement of a matured security in the first quarter of 2018. This decrease was partially offset by a $3.6 million increase in derivative financialinstruments primarily due to the fair value of our interest rate swap agreements increasing due to rising interest rates. This is due to our risk mitigatingstrategies in structuring these agreements and are offset with similar increases recorded in other liabilities.
Deposits
Table 11 presents the composition of our deposits by major customer categories.
Deposits
Table 11
(dollars in thousands)March 31,
2018 December 31,
2017
Consumer $ 7,665,926 $ 7,478,228
Commercial 5,897,194 5,973,763
Public and Other 1,394,013 1,431,977
Total Deposits $ 14,957,133 $ 14,883,968
Total deposits were $15.0 billion as of March 31, 2018, an increase of $73.2 million or less than 1% from December 31, 2017. Consumer deposits increasedby $187.7 million due to an increase in core and time deposits of $100.2 million and $87.5 million respectively. This increase was partially offset by a $76.6million decrease in commercial deposits primarily due to a decrease in money market savings deposits. In addition, public and other deposits decreased by$38.0 million primarily resulting from a decline in public demand deposits during the first quarter.
Table 12 presents the composition of our savings deposits.
Savings Deposits
Table 12
(dollars in thousands)March 31,
2018 December 31,
2017
Money Market $ 1,771,626 $ 1,827,090
Regular Savings 3,625,665 3,561,923
Total Savings Deposits $ 5,397,291 $ 5,389,013
61

Table of Contents
Securities Sold Under Agreements to Repurchase
Table 13 presents the composition of our securities sold under agreements to repurchase.
Securities Sold Under Agreements to Repurchase Table 13
(dollars in thousands)March 31,
2018 December 31,
2017
Private Institutions $ 500,000 $ 500,000
Government Entities 5,293 5,293
Total Securities Sold Under Agreements to Repurchase $ 505,293 $ 505,293
Securities sold under agreements to repurchase was $505.3 million as of March 31, 2018 and December 31, 2017. As of March 31, 2018, the weighted-average maturity was 184 days for our repurchase agreements with government entities and 3.4 years for our repurchase agreements with private institutions.Some of our repurchase agreements with private institutions may be terminated at earlier specified dates by the private institution or in some cases by eitherthe private institution or the Company. If all such agreements were to terminate at the earliest possible date, the weighted-average maturity for our repurchaseagreements with private institutions would decrease to 2.4 years. As of March 31, 2018, the weighted-average interest rate for outstanding agreements withgovernment entities and private institutions was 0.73% and 3.64%, respectively, with all rates being fixed. Each of our repurchase agreements is accounted foras a collateralized financing arrangement (i.e., a secured borrowing) and not as a sale and subsequent repurchase of securities.
Other Debt
Table 14 presents the composition of our other debt.
Other Debt Table 14
(dollars in thousands)March 31,
2018 December 31,
2017
Federal Home Loan Bank Advances $ 225,000 $ 250,000
Capital Lease Obligations 10,699 10,716
Total $ 235,699 $ 260,716
Other debt was $235.7 million as of March 31, 2018, a decrease of $25.0 million or 10% from December 31, 2017. This decrease was primarily due to a$25.0 million FHLB advance which matured during the first quarter of 2018. As of March 31, 2018, our FHLB advances had a weighted-average interest rateof 1.28% with maturity dates ranging from 2018 to 2020. These advances were primarily for asset/liability management purposes. As of March 31, 2018, ourremaining unused line of credit with the FHLB was $2.1 billion.
62
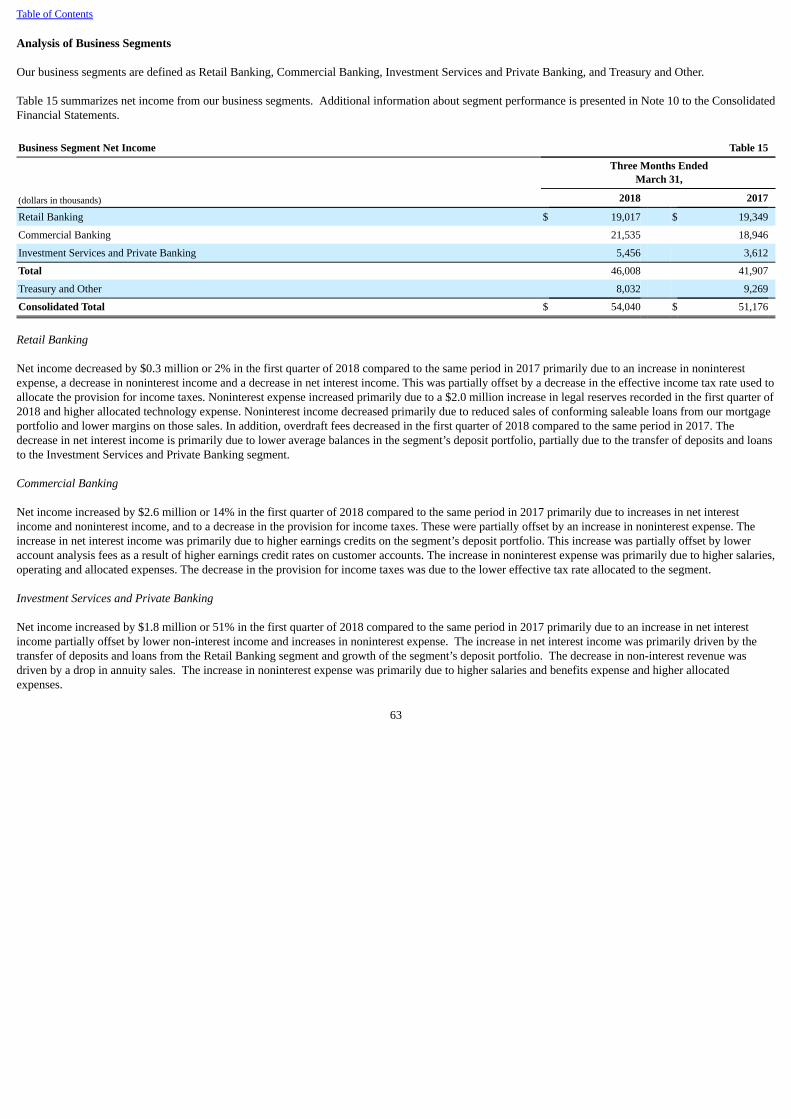
Table of Contents
Analysis of Business Segments
Our business segments are defined as Retail Banking, Commercial Banking, Investment Services and Private Banking, and Treasury and Other.
Table 15 summarizes net income from our business segments. Additional information about segment performance is presented in Note 10 to the ConsolidatedFinancial Statements.
Business Segment Net Income Table 15
Three Months Ended
March 31,
(dollars in thousands) 2018 2017
Retail Banking $ 19,017 $ 19,349
Commercial Banking 21,535 18,946
Investment Services and Private Banking 5,456 3,612
Total 46,008 41,907
Treasury and Other 8,032 9,269
Consolidated Total $ 54,040 $ 51,176
Retail Banking
Net income decreased by $0.3 million or 2% in the first quarter of 2018 compared to the same period in 2017 primarily due to an increase in noninterestexpense, a decrease in noninterest income and a decrease in net interest income. This was partially offset by a decrease in the effective income tax rate used toallocate the provision for income taxes. Noninterest expense increased primarily due to a $2.0 million increase in legal reserves recorded in the first quarter of2018 and higher allocated technology expense. Noninterest income decreased primarily due to reduced sales of conforming saleable loans from our mortgageportfolio and lower margins on those sales. In addition, overdraft fees decreased in the first quarter of 2018 compared to the same period in 2017. Thedecrease in net interest income is primarily due to lower average balances in the segment’s deposit portfolio, partially due to the transfer of deposits and loansto the Investment Services and Private Banking segment.
Commercial Banking
Net income increased by $2.6 million or 14% in the first quarter of 2018 compared to the same period in 2017 primarily due to increases in net interestincome and noninterest income, and to a decrease in the provision for income taxes. These were partially offset by an increase in noninterest expense. Theincrease in net interest income was primarily due to higher earnings credits on the segment’s deposit portfolio. This increase was partially offset by loweraccount analysis fees as a result of higher earnings credit rates on customer accounts. The increase in noninterest expense was primarily due to higher salaries,operating and allocated expenses. The decrease in the provision for income taxes was due to the lower effective tax rate allocated to the segment.
Investment Services and Private Banking
Net income increased by $1.8 million or 51% in the first quarter of 2018 compared to the same period in 2017 primarily due to an increase in net interestincome partially offset by lower non-interest income and increases in noninterest expense. The increase in net interest income was primarily driven by thetransfer of deposits and loans from the Retail Banking segment and growth of the segment’s deposit portfolio. The decrease in non-interest revenue wasdriven by a drop in annuity sales. The increase in noninterest expense was primarily due to higher salaries and benefits expense and higher allocatedexpenses.
63

Table of Contents
Treasury and Other
Net income decreased by $1.2 million or 13% in the first quarter of 2018 as compared to the first quarter of 2017 primarily due to a decrease in noninterestincome and an increase in the provision for income taxes partially offset by an increase in net interest income. The decrease in noninterest income wasprimarily due to gains on the sale of 90,000 Visa Class B shares in the first quarter of 2017. Partially offsetting this was a $2.8 million distribution receivedfrom a low-income housing investment sale in the first quarter of 2018. The increase in net interest income was primarily due to an increase in fundingincome related to lending activities and interest income from investment securities resulting from an increase in associated yields. This was partially offset byhigher deposit funding costs. The provision for income taxes in this business segment represents the residual amount to arrive at the total tax expense for theCompany. The overall effective tax rate decreased to 16.19% in 2018 compared to 29.72% in 2017.
Other organizational units (Technology, Operations, Marketing, Human Resources, Finance, Credit and Risk Management, and Corporate and RegulatoryAdministration) included in Treasury and Other provide a wide range of support to the Company's other income earning segments. Expenses incurred bythese support units are charged to the business segments through an internal cost allocation process.
Corporate Risk Profile
Credit Risk
As of March 31, 2018, our overall credit risk profile reflects a healthy Hawaii economy as our levels of non-performing assets and credit losses remain wellcontrolled. The underlying risk profile of our lending portfolio continued to remain strong during the first three months of 2018.
We actively manage exposures with deteriorating asset quality to reduce levels of potential loss exposure and closely monitor our reserves and capital toaddress both anticipated and unforeseen issues. Risk management activities include detailed analysis of portfolio segments and stress tests of certainsegments to ensure that reserve and capital levels are appropriate. We perform frequent loan and lease-level risk monitoring and risk rating reviews, whichprovide opportunities for early interventions to allow for credit exits or restructuring, loan and lease sales, and voluntary workouts and liquidations.
64

Table of Contents
Non-Performing Assets and Accruing Loans and Leases Past Due 90 Days or More
Table 16 presents information on non-performing assets (“NPAs”) and accruing loans and leases past due 90 days or more.
Non-Performing Assets and Accruing Loans and Leases Past Due 90 Days or More
Table 16
(dollars in thousands)March 31,
2018 December 31,
2017
Non-Performing Assets
Non-Accrual Loans and Leases
Commercial
Commercial and Industrial $ 986 $ 448Commercial Mortgage 1,367 1,398
Total Commercial 2,353 1,846
Consumer Residential Mortgage 6,725 9,243
Home Equity 3,890 3,991
Total Consumer 10,615 13,234
Total Non-Accrual Loans and Leases 12,968 15,080
Foreclosed Real Estate 2,768 1,040
Total Non-Performing Assets $ 15,736 $ 16,120
Accruing Loans and Leases Past Due 90 Days or More Consumer
Residential Mortgage $ 2,927 $ 2,703Home Equity 3,013 1,624
Automobile 333 886
Other 1 1,895 1,934
Total Consumer 8,168 7,147
Total Accruing Loans and Leases Past Due 90 Days or More $ 8,168 $ 7,147
Restructured Loans on Accrual Status and Not Past Due 90 Days or More $ 56,743 $ 55,672
Total Loans and Leases $ 9,916,628 $ 9,796,947
Ratio of Non-Accrual Loans and Leases to Total Loans and Leases 0.13% 0.15%
Ratio of Non-Performing Assets to Total Loans and Leases and Foreclosed Real Estate 0.16% 0.16%
Ratio of Commercial Non-Performing Assets to Total Commercial Loans and Leases and Commercial Foreclosed Real Estate 0.06% 0.05%
Ratio of Consumer Non-Performing Assets to Total Consumer Loans and Leases and Consumer Foreclosed Real Estate 0.22% 0.24%
Ratio of Non-Performing Assets and Accruing Loans and Leases Past Due 90 Days or More to Total Loans and Leases and Foreclosed Real Estate 0.24% 0.24%
Changes in Non-Performing Assets
Balance as of December 31, 2017 $ 16,120
Additions 2,332
Reductions
Payments (1,251)
Return to Accrual Status (1,270)
Charge-offs/Write-downs (195)
Total Reductions (2,716)
Balance as of March 31, 2018 $ 15,736
1 Comprised of other revolving credit, installment, and lease financing.
65

Table of Contents
NPAs consist of non-accrual loans and leases, and foreclosed real estate. Changes in the level of non-accrual loans and leases typically represent increases forloans and leases that reach a specified past due status, offset by reductions for loans and leases that are charged-off, paid down, sold, transferred to foreclosedreal estate, or are no longer classified as non-accrual because they have returned to accrual status.
Total NPAs were $15.7 million as of March 31, 2018, a decrease of $0.4 million or 2% from December 31, 2017. The decrease was experienced in ourconsumer lending portfolio. The ratio of our NPAs to total loans and leases and foreclosed real estate was 0.16% as of March 31, 2018, unchanged fromDecember 31, 2017.
Commercial and industrial non-accrual loans increased by $0.5 million or 120% from December 31, 2017 primarily due to the addition of one borrower. Wehave evaluated this borrower for impairment and recorded no partial charge-offs in the first quarter of 2018.
Commercial mortgage non-accrual loans were $1.4 million as of March 31, 2018, relatively unchanged from December 31, 2017. We have evaluated thecommercial mortgage non-accrual loans for impairment and recorded no charge-offs.
The largest component of our NPAs continues to be residential mortgage loans. Residential mortgage non-accrual loans decreased by $2.5 million or 27%from December 31, 2017 primarily due to transfers to foreclosed real estate and from loans returning to accrual status. Residential mortgage non-accrualloans remain at elevated levels due mainly to the lengthy judicial foreclosure process as well as residential mortgage loan modifications the Bank entered intoto assist borrowers wishing to remain in their residences despite having financial challenges. As of March 31, 2018, our residential mortgage non-accrualloans were comprised of 23 loans with a weighted average current LTV ratio of 57%.
Foreclosed real estate represents property acquired as the result of borrower defaults on loans. Foreclosed real estate is recorded at fair value, less estimatedselling costs, at the time of foreclosure. On an ongoing basis, properties are appraised as required by market conditions and applicable regulations. Foreclosed real estate increased by $1.7 million or 166% from December 31, 2017 due to the addition of four residential properties.
Loans and Leases Past Due 90 Days or More and Still Accruing Interest
Loans and leases in this category are 90 days or more past due, as to principal or interest, and are still accruing interest because they are well secured and inthe process of collection. Loans and leases past due 90 days or more and still accruing interest were $8.2 million as of March 31, 2018, a $1.0 million or 14%increase from December 31, 2017.
Impaired Loans
Impaired loans are defined as loans for which we believe it is probable we will not collect all amounts due according to the contractual terms of the loanagreement. Included in impaired loans are all classes of commercial non-accruing loans (except lease financing and small business loans), all loans modifiedin a TDR (including accruing TDRs), and other loans where we believe that we will be unable to collect all amounts due according to the contractual terms ofthe loan agreement. Impaired loans exclude lease financing and smaller balance homogeneous loans (consumer and small business non-accruing loans) thatare collectively evaluated for impairment. Impaired loans were $61.8 million as of March 31, 2018 and $61.2 million as of December 31, 2017, and had arelated Allowance of $3.8 million and $3.9 million as of March 31, 2018 and December 31, 2017, respectively. As of March 31, 2018, we have recordedcumulative charge-offs of $15.9 million related to our total impaired loans. Our impaired loans are considered in management’s assessment of the overalladequacy of the Allowance.
66

Table of Contents
Table 17 presents information on loans with terms that have been modified in a TDR.
Loans Modified in a Troubled Debt Restructuring
Table 17
(dollars in thousands)March 31,
2018 December 31,
2017
Commercial Commercial and Industrial $ 8,994 $ 8,486
Commercial Mortgage 9,074 9,205
Construction 1,399 1,416
Total Commercial 19,467 19,107
Consumer Residential Mortgage 20,399 21,581
Home Equity 1,953 1,965
Automobile 15,627 14,811
Other 1 2,748 2,645
Total Consumer 40,727 41,002
Total $ 60,194 $ 60,109
1 Comprised of other revolving credit, installment, and lease financing.
Loans modified in a TDR remained relatively unchanged from December 31, 2017. Residential mortgage loans remain our largest TDR loan class.
67
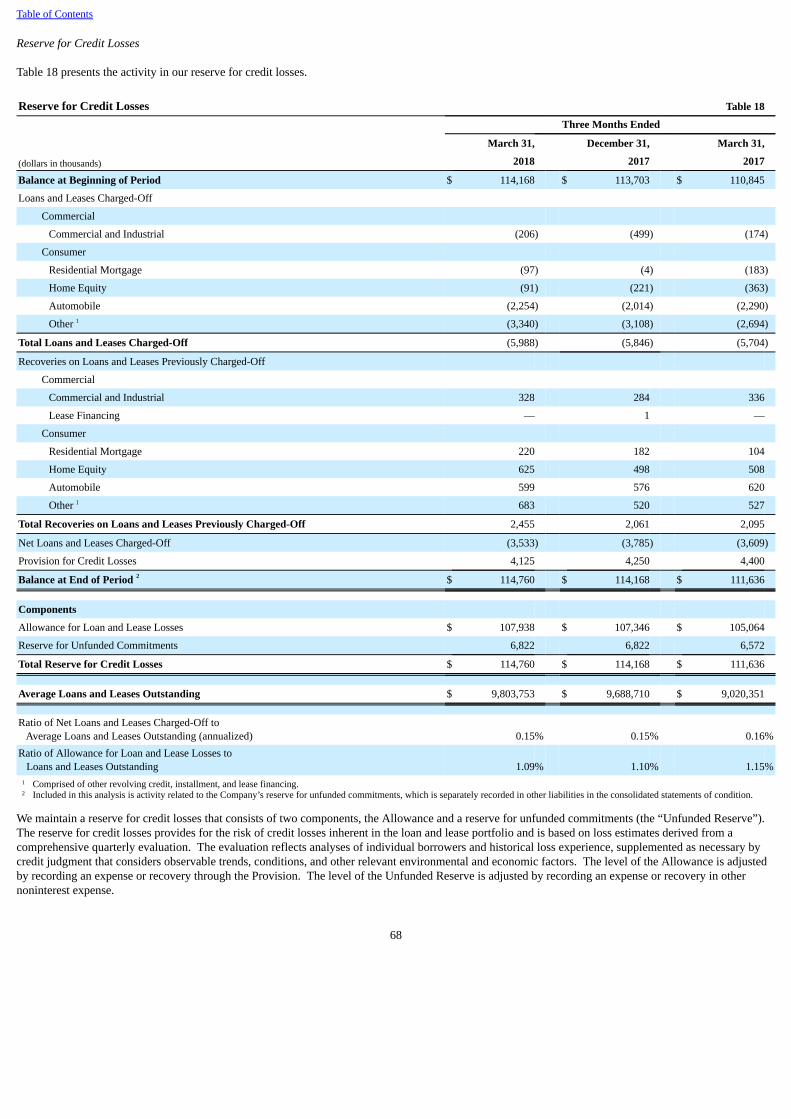
Table of Contents
Reserve for Credit Losses
Table 18 presents the activity in our reserve for credit losses.
Reserve for Credit Losses
Table 18
Three Months Ended
March 31, December 31, March 31,
(dollars in thousands) 2018 2017 2017
Balance at Beginning of Period $ 114,168 $ 113,703 $ 110,845
Loans and Leases Charged-Off Commercial
Commercial and Industrial (206) (499) (174)
Consumer Residential Mortgage (97) (4) (183)
Home Equity (91) (221) (363)
Automobile (2,254) (2,014) (2,290)
Other 1 (3,340) (3,108) (2,694)
Total Loans and Leases Charged-Off (5,988) (5,846) (5,704)
Recoveries on Loans and Leases Previously Charged-Off
Commercial
Commercial and Industrial 328 284 336
Lease Financing — 1 —
Consumer Residential Mortgage 220 182 104
Home Equity 625 498 508
Automobile 599 576 620
Other 1 683 520 527
Total Recoveries on Loans and Leases Previously Charged-Off 2,455 2,061 2,095
Net Loans and Leases Charged-Off (3,533) (3,785) (3,609)
Provision for Credit Losses 4,125 4,250 4,400
Balance at End of Period 2 $ 114,760 $ 114,168 $ 111,636
Components
Allowance for Loan and Lease Losses $ 107,938 $ 107,346 $ 105,064
Reserve for Unfunded Commitments 6,822 6,822 6,572
Total Reserve for Credit Losses $ 114,760 $ 114,168 $ 111,636
Average Loans and Leases Outstanding $ 9,803,753 $ 9,688,710 $ 9,020,351
Ratio of Net Loans and Leases Charged-Off to Average Loans and Leases Outstanding (annualized) 0.15% 0.15% 0.16%Ratio of Allowance for Loan and Lease Losses to Loans and Leases Outstanding 1.09% 1.10% 1.15%
1 Comprised of other revolving credit, installment, and lease financing.2 Included in this analysis is activity related to the Company’s reserve for unfunded commitments, which is separately recorded in other liabilities in the consolidated statements of condition.
We maintain a reserve for credit losses that consists of two components, the Allowance and a reserve for unfunded commitments (the “Unfunded Reserve”). The reserve for credit losses provides for the risk of credit losses inherent in the loan and lease portfolio and is based on loss estimates derived from acomprehensive quarterly evaluation. The evaluation reflects analyses of individual borrowers and historical loss experience, supplemented as necessary bycredit judgment that considers observable trends, conditions, and other relevant environmental and economic factors. The level of the Allowance is adjustedby recording an expense or recovery through the Provision. The level of the Unfunded Reserve is adjusted by recording an expense or recovery in othernoninterest expense.
68

Table of Contents
Allowance for Loan and Lease Losses
As of March 31, 2018, the Allowance was $107.9 million or 1.09% of total loans and leases outstanding, compared with an Allowance of $107.3 million or1.10% of total loans and leases outstanding as of December 31, 2017. The decrease in the ratio of Allowance to loans and leases outstanding wascommensurate with the Company’s credit risk profile, loan growth, and a healthy Hawaii economy.
Net charge-offs on loans and leases were $3.5 million or 0.15% of total average loans and leases, on an annualized basis, in the first quarter of 2018 comparedto net charge-offs of $3.6 million or 0.16% of total average loans and leases, on an annualized basis, in the first quarter of 2017. Net charge-offs in ourconsumer portfolios were $3.7 million for the first three months of 2018 compared to $3.8 million for the same period in 2017. Net recoveries in ourcommercial portfolios were $0.1 million for the first three months of 2018 compared to $0.2 million for the same period in 2017.
Although we determine the amount of each component of the Allowance separately, the Allowance as a whole was considered appropriate by management asof March 31, 2018, based on our ongoing analysis of estimated probable credit losses, credit risk profiles, economic conditions, coverage ratios, and otherrelevant factors.
The Reserve for Unfunded Commitments
The Unfunded Reserve was $6.8 million as of March 31, 2018, unchanged from December 31, 2017. The process used to determine the Unfunded Reserve isconsistent with the process for determining the Allowance, as adjusted for estimated funding probabilities.
69
Table of Contents
Market Risk Market risk is the potential of loss arising from adverse changes in interest rates and prices. We are exposed to market risk as a consequence of the normalcourse of conducting our business activities. Our market risk management process involves measuring, monitoring, controlling, and mitigating risks that cansignificantly impact our statements of income and condition. In this management process, market risks are balanced with expected returns in an effort toenhance earnings performance, while limiting volatility.
Our primary market risk exposure is interest rate risk.
Interest Rate Risk
The objective of our interest rate risk management process is to maximize net interest income while operating within acceptable limits established for interestrate risk and maintaining adequate levels of funding and liquidity. The potential cash flows, sales, or replacement value of many of our assets and liabilities,especially those that earn or pay interest, are sensitive to changes in the general level of interest rates. This interest rate risk arises primarily from our corebusiness activities of extending loans and accepting deposits. Our investment securities portfolio is also subject to significant interest rate risk.
Many factors affect our exposure to changes in interest rates such as general economic and financial conditions, customer preferences, historical pricingrelationships, and repricing characteristics of financial instruments. Our earnings are affected not only by general economic conditions but also by themonetary and fiscal policies of the U.S. and its agencies, particularly the Federal Reserve Bank (the “FRB”). The monetary policies of the FRB can influencethe overall growth of loans, investment securities, and deposits and the level of interest rates earned on assets and paid for liabilities.
In managing interest rate risk, we, through the Asset/Liability Management Committee (“ALCO”), measure short and long-term sensitivities to changes ininterest rates. The ALCO, which is comprised of members of executive management, utilizes several techniques to manage interest rate risk, which include:
• adjusting the balance sheet mix or altering the interest rate characteristics of assets and liabilities;
• changing product pricing strategies;
• modifying characteristics of the investment securities portfolio; and
• using derivative financial instruments.
Our use of derivative financial instruments, as detailed in Note 12 to the Consolidated Financial Statements, has generally been limited. This is due to naturalon-balance sheet hedges arising out of offsetting interest rate exposures from loans and investment securities with deposits and other interest-bearingliabilities. In particular, the investment securities portfolio is utilized to manage the interest rate exposure and sensitivity to within the guidelines and limitsestablished by the ALCO. We utilize natural and offsetting economic hedges in an effort to reduce the need to employ off-balance sheet derivative financialinstruments to hedge interest rate risk exposures. Expected movements in interest rates are also considered in managing interest rate risk. Thus, as interestrates change, we may use different techniques to manage interest rate risk.
A key element in our ongoing process to measure and monitor interest rate risk is the utilization of an asset/liability simulation model that attempts to capturethe dynamic nature of the statement of condition. The model is used to estimate and measure the statement of condition sensitivity to changes in interestrates. These estimates are based on assumptions about the behavior of loan and deposit pricing, repayment rates on mortgage-based assets, and principalamortization and maturities on other financial instruments. The model’s analytics include the effects of standard prepayment options on mortgages andcustomer withdrawal options for deposits. While such assumptions are inherently uncertain, we believe that our assumptions are reasonable.
70
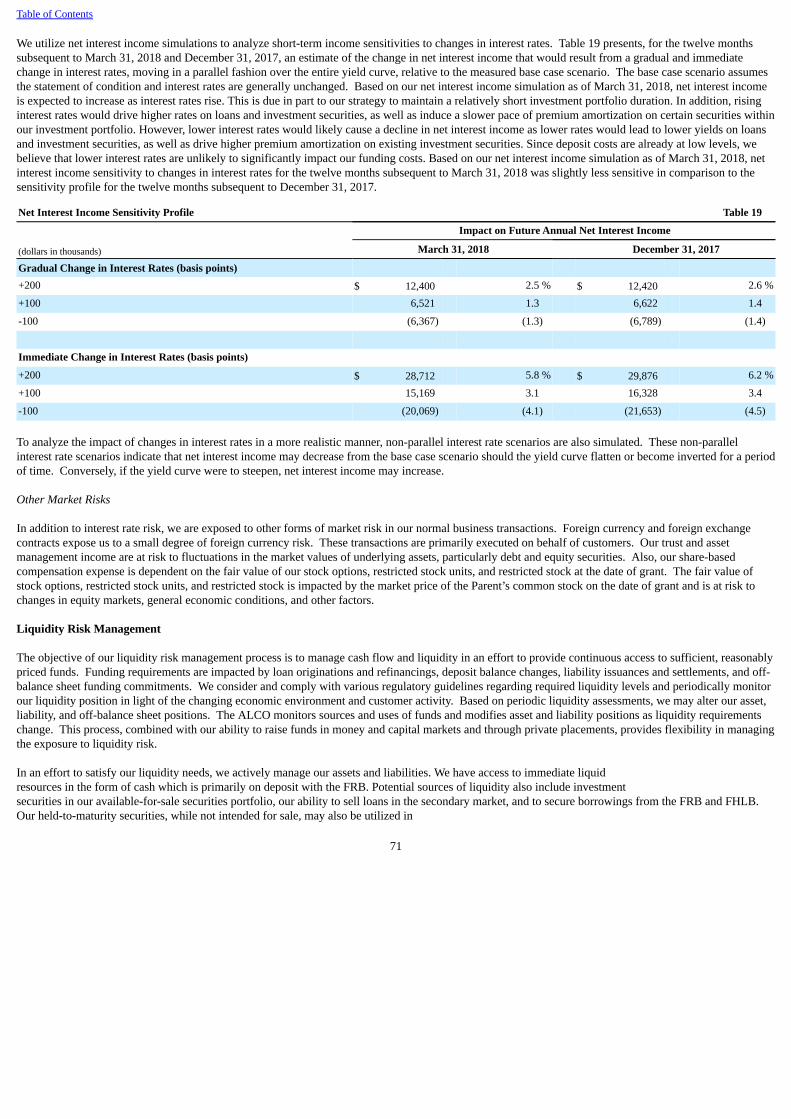
Table of Contents
We utilize net interest income simulations to analyze short-term income sensitivities to changes in interest rates. Table 19 presents, for the twelve monthssubsequent to March 31, 2018 and December 31, 2017, an estimate of the change in net interest income that would result from a gradual and immediatechange in interest rates, moving in a parallel fashion over the entire yield curve, relative to the measured base case scenario. The base case scenario assumesthe statement of condition and interest rates are generally unchanged. Based on our net interest income simulation as of March 31, 2018, net interest incomeis expected to increase as interest rates rise. This is due in part to our strategy to maintain a relatively short investment portfolio duration. In addition, risinginterest rates would drive higher rates on loans and investment securities, as well as induce a slower pace of premium amortization on certain securities withinour investment portfolio. However, lower interest rates would likely cause a decline in net interest income as lower rates would lead to lower yields on loansand investment securities, as well as drive higher premium amortization on existing investment securities. Since deposit costs are already at low levels, webelieve that lower interest rates are unlikely to significantly impact our funding costs. Based on our net interest income simulation as of March 31, 2018, netinterest income sensitivity to changes in interest rates for the twelve months subsequent to March 31, 2018 was slightly less sensitive in comparison to thesensitivity profile for the twelve months subsequent to December 31, 2017.
Net Interest Income Sensitivity Profile Table 19
Impact on Future Annual Net Interest Income
(dollars in thousands) March 31, 2018 December 31, 2017
Gradual Change in Interest Rates (basis points)
+200 $ 12,400 2.5 % $ 12,420 2.6 %
+100 6,521 1.3 6,622 1.4
-100 (6,367) (1.3) (6,789) (1.4)
Immediate Change in Interest Rates (basis points) +200 $ 28,712 5.8 % $ 29,876 6.2 %
+100 15,169 3.1 16,328 3.4
-100 (20,069) (4.1) (21,653) (4.5)
To analyze the impact of changes in interest rates in a more realistic manner, non-parallel interest rate scenarios are also simulated. These non-parallelinterest rate scenarios indicate that net interest income may decrease from the base case scenario should the yield curve flatten or become inverted for a periodof time. Conversely, if the yield curve were to steepen, net interest income may increase.
Other Market Risks
In addition to interest rate risk, we are exposed to other forms of market risk in our normal business transactions. Foreign currency and foreign exchangecontracts expose us to a small degree of foreign currency risk. These transactions are primarily executed on behalf of customers. Our trust and assetmanagement income are at risk to fluctuations in the market values of underlying assets, particularly debt and equity securities. Also, our share-basedcompensation expense is dependent on the fair value of our stock options, restricted stock units, and restricted stock at the date of grant. The fair value ofstock options, restricted stock units, and restricted stock is impacted by the market price of the Parent’s common stock on the date of grant and is at risk tochanges in equity markets, general economic conditions, and other factors.
Liquidity Risk Management
The objective of our liquidity risk management process is to manage cash flow and liquidity in an effort to provide continuous access to sufficient, reasonablypriced funds. Funding requirements are impacted by loan originations and refinancings, deposit balance changes, liability issuances and settlements, and off-balance sheet funding commitments. We consider and comply with various regulatory guidelines regarding required liquidity levels and periodically monitorour liquidity position in light of the changing economic environment and customer activity. Based on periodic liquidity assessments, we may alter our asset,liability, and off-balance sheet positions. The ALCO monitors sources and uses of funds and modifies asset and liability positions as liquidity requirementschange. This process, combined with our ability to raise funds in money and capital markets and through private placements, provides flexibility in managingthe exposure to liquidity risk.
In an effort to satisfy our liquidity needs, we actively manage our assets and liabilities. We have access to immediate liquidresources in the form of cash which is primarily on deposit with the FRB. Potential sources of liquidity also include investmentsecurities in our available-for-sale securities portfolio, our ability to sell loans in the secondary market, and to secure borrowings from the FRB and FHLB.Our held-to-maturity securities, while not intended for sale, may also be utilized in
71

Table of Contents
repurchase agreements to obtain funding. Our core deposits have historically provided us with a long-term source of stable and relatively lower cost source offunding. Additional funding is available through the issuance of long-term debt or equity.
Maturities and payments on outstanding loans and investment securities also provide a steady flow of funds. Liquidity is furtherenhanced by our ability to pledge loans to access secured borrowings from the FHLB and FRB. As of March 31, 2018, we had additional borrowing capacityof $2.1 billion from the FHLB and $516.3 million from the FRB based on the amount of collateral pledged.
We continued our focus on maintaining a strong liquidity position throughout the first three months of 2018. As of March 31, 2018, cash and cashequivalents were $565.2 million, the carrying value of our available-for-sale investment securities was $2.2 billion, and total deposits were $15.0 billion. Asof March 31, 2018, our available-for-sale investment securities portfolio was comprised of securities with an average base duration of approximately 2.5years.
Capital Management
We actively manage capital, commensurate with our risk profile, to enhance shareholder value. We also seek to maintain capital levels for the Company andthe Bank at amounts in excess of the regulatory “well-capitalized” thresholds. Periodically, we may respond to market conditions by implementing changes toour overall balance sheet positioning to manage our capital position.
The Company and the Bank are each subject to regulatory capital requirements administered by the federal banking agencies. Failure to meet minimumcapital requirements could cause certain mandatory and discretionary actions by regulators that, if undertaken, would likely have a material effect on ourfinancial statements. Under capital adequacy guidelines and the regulatory framework for prompt corrective action, the Company and the Bank must meetspecific capital guidelines that involve quantitative and qualitative measures. These measures were established by regulation intended to ensure capitaladequacy. As of March 31, 2018, the Company and the Bank were considered “well capitalized” under this regulatory framework. The Company’sregulatory capital ratios are presented in Table 20 below. There have been no conditions or events since March 31, 2018 that management believes havechanged either the Company’s or the Bank’s capital classifications.
As of March 31, 2018, shareholders’ equity was $1.2 billion, an increase of $9.3 million or 1% from December 31, 2017. For the first three months of 2018,net income of $54.0 million, common stock issuances of $2.0 million, share-based compensation of $1.9 million were partially offset by other comprehensiveloss of $8.9 million, cash dividends paid of $22.1 million, and common stock repurchased of $17.5 million. In the first three months of 2018, included in theamount of common stock repurchased were 165,500 shares repurchased under our share repurchase program. These shares were repurchased at an averagecost per share of $84.23 and a total cost of $13.9 million. From the beginning of our share repurchase program in July 2001 through March 31, 2018, werepurchased a total of 54.4 million shares of common stock and returned a total of $2.09 billion to our shareholders at an average cost of $38.43 per share.
From April 1, 2018 through April 17, 2018, the Parent repurchased an additional 48,000 shares of common stock at an average cost of $82.61 per share for atotal of $4.0 million. Remaining buyback authority under our share repurchase program was $102.1 million as of April 17, 2018. The actual amount andtiming of future share repurchases, if any, will depend on market and economic conditions, regulatory rules, applicable SEC rules, and various other factors.
In April 2018, the Parent’s Board of Directors declared a quarterly cash dividend of $0.60 per share on the Parent’s outstanding shares. The dividend will bepayable on June 14, 2018 to shareholders of record at the close of business on May 31, 2018.
The final rules implementing the Basel Committee on Banking Supervision’s (“BCBS”) capital guidelines for U.S. banks became effective for the Companyon January 1, 2015, with full compliance with all of the final rule’s requirements phased in over a multi-year schedule, to be fully phased-in by January 1,2019. As of March 31, 2018, the Company’s capital levels remained characterized as “well-capitalized” under the new rules. See the “Regulatory InitiativesAffecting the Banking Industry” section below for further discussion on Basel III.
72

Table of Contents
Table 20 presents our regulatory capital and ratios as of March 31, 2018 and December 31, 2017.
Regulatory Capital and Ratios
Table 20
(dollars in thousands)March 31,
2018 December 31,
2017 Regulatory Capital
Shareholders’ Equity $ 1,241,193 $ 1,231,868 Less: Goodwill 1 28,718 28,718
Postretirement Benefit Liability Adjustments (33,469) (27,715)
Net Unrealized Gains (Losses) on Investment Securities 2 (17,628) (7,000)
Other (198) (198) Common Equity Tier 1 Capital 1,263,770 1,238,063
Tier 1 Capital 1,263,770 1,238,063 Allowable Reserve for Credit Losses 114,760 114,168 Total Regulatory Capital $ 1,378,530 $ 1,352,231
Risk-Weighted Assets $ 9,451,647 $ 9,348,296
Key Regulatory Capital Ratios
Common Equity Tier 1 Capital Ratio 13.37 % 13.24 %
Tier 1 Capital Ratio 13.37 13.24 Total Capital Ratio 14.59 14.46 Tier 1 Leverage Ratio 7.46 7.26
1 Calculated net of deferred tax liabilities.2 Includes unrealized gains and losses related to the Company’s reclassification of available-for-sale investment securities to the held-to-maturity category.
73

Table of Contents
Regulatory Initiatives Affecting the Banking Industry
Basel III
The FRB and the FDIC approved the final rules implementing the Basel Committee on Banking Supervision’s (“BCBS”) capital guidelines for U.S. banks.Under the final rules, minimum requirements increased for both the quantity and quality of capital held by the Company. The rules include a new commonequity Tier 1 capital to risk-weighted assets minimum ratio of 4.5%, raise the minimum ratio of Tier 1 capital to risk-weighted assets from 4.0% to 6.0%,require a minimum ratio of Total Capital to risk-weighted assets of 8.0%, and require a minimum Tier 1 leverage ratio of 4.0%. A new capital conservationbuffer, comprised of common equity Tier 1 capital, was also established above the regulatory minimum capital requirements. This capital conservation bufferbegan phasing in beginning January 1, 2016 at 0.625% of risk-weighted assets and will increase each subsequent year by an additional 0.625% until reachingits final level of 2.5% on January 1, 2019. Strict eligibility criteria for regulatory capital instruments were also implemented under the final rules. The finalrules also revised the definition and calculation of Tier 1 capital, Total Capital, and risk-weighted assets.
The phase-in period for the final rules became effective for the Company on January 1, 2015, with full compliance with all of the final rules’ requirementsphased in over a multi-year schedule, to be fully implemented by January 1, 2019. As of March 31, 2018, the Company’s capital levels remainedcharacterized as “well-capitalized” under the new rules.
Management continues to monitor regulatory developments and their potential impact to the Company’s liquidity requirements.
Stress Testing
The Dodd-Frank Act required federal banking agencies to issue regulations that obligate banks with total consolidated assets of more than $10.0 billion toconduct and publish company-run annual stress tests to assess the potential impact of different scenarios on the consolidated earnings and capital of each bankand certain related items over a nine-quarter forward-looking planning horizon, taking into account all relevant exposures and activities. On October 9, 2012,the FRB published final rules implementing the stress testing requirements for banks, such as the Company, with total consolidated assets of more than $10.0billion but less than $50.0 billion. These rules set forth the timing and type of stress test activities, as well as rules governing controls, oversight anddisclosure.
In March 2014, the FRB, OCC, and FDIC issued final supervisory guidance for these stress tests. This joint final supervisory guidance discusses supervisoryexpectations for stress test practices, provides examples of practices that would be consistent with those expectations, and offers additional details about stresstest methodologies. It also emphasizes the importance of stress testing as an ongoing risk management practice.
We submitted our latest stress testing results to the FRB on July 28, 2017 and disclosed the results to the public on October 24, 2017. The disclosure isavailable on our website www.boh.com, in the 2017 Financial Reports section of the Investor Relations area.
Deposit Insurance Fund (“DIF”) Assessment
In March 2016, the FDIC approved a final rule that imposes on banks with at least $10 billion in assets, such as the Company, a surcharge of 4.5 cents per$100 of their assessment base, after making certain adjustments. The surcharge became effective for the third quarter of 2016 and the FDIC estimates thesurcharge will be imposed for approximately two years. The surcharge takes effect at the same time that the regular FDIC insurance assessment rates for allbanks decline under a rule adopted by the FDIC in 2011.
74
Table of Contents
Operational Risk
Operational risk represents the risk of loss resulting from our operations, including, but not limited to, the risk of fraud by employees or persons outside theCompany, errors relating to transaction processing and technology, failure to adhere to compliance requirements, and the risk of cyber attacks. We are alsoexposed to operational risk through our outsourcing arrangements, and the effect that changes in circumstances or capabilities of our outsourcing vendors canhave on our ability to continue to perform operational functions necessary to our business. The risk of loss also includes the potential legal actions that couldarise as a result of an operational deficiency or as a result of noncompliance with applicable regulatory standards, adverse business decisions or theirimplementation, and customer attrition due to potential negative publicity. Operational risk is inherent in all business activities, and management of this risk isimportant to the achievement of Company goals and objectives.
Our Operating Risk Committee (the “ORC”) provides oversight and assesses the most significant operational risks facing the Company. We have developed aframework that provides for a centralized operating risk management function through the ORC, supplemented by business unit responsibility for managingoperational risks specific to their business units. Our internal audit department also validates the system of internal controls through ongoing risk-based auditprocedures and reports on the effectiveness of internal controls to executive management and the Audit and Risk Committee of the Board of Directors.
We continuously strive to strengthen our system of internal controls to improve the oversight of operational risk. While our internal controls have beendesigned to minimize operational risks, there is no assurance that business disruption or operational losses will not occur. On an ongoing basis, managementreassesses operational risks, implements appropriate process changes, and invests in enhancements to our systems of internal controls.
Off-Balance Sheet Arrangements, Credit Commitments, and Contractual Obligations
Off-Balance Sheet Arrangements
We hold interests in several unconsolidated variable interest entities (“VIEs”). These unconsolidated VIEs are primarily low-income housing partnershipsand solar energy partnerships. Variable interests are defined as contractual ownership or other interests in an entity that change with fluctuations in an entity’snet asset value. The primary beneficiary consolidates the VIE. We have determined that the Company is not the primary beneficiary of these entities. As aresult, we do not consolidate these VIEs.
Credit Commitments and Contractual Obligations
Our credit commitments and contractual obligations have not changed materially since previously reported in our Annual Report on Form 10-K for the yearended December 31, 2017.
75

Table of Contents
Item 3. Quantitative and Qualitative Disclosures About Market Risk
See “Market Risk” of this Management’s Discussion and Analysis of Financial Condition and Results of Operations.
Item 4. Controls and Procedures
Disclosure Controls and Procedures
The Company’s management, including the Chief Executive Officer and Chief Financial Officer, conducted an evaluation of the effectiveness of theCompany’s disclosure controls and procedures (as defined in Rules 13a-15(e) and 15d-15(e) under the Securities Exchange Act of 1934, as amended (the“Exchange Act”)) as of March 31, 2018. The Company’s disclosure controls and procedures are designed to ensure that information required to be disclosedby the Company in the reports that it files or submits under the Exchange Act is recorded, processed, summarized, and reported within the time periodsspecified in the U.S. Securities and Exchange Commission’s rules and forms, and that such information is accumulated and communicated to the Company’smanagement, including the Company’s Chief Executive Officer and Chief Financial Officer, to allow timely decisions regarding required disclosure. Basedon this evaluation, the Chief Executive Officer and Chief Financial Officer concluded that the Company’s disclosure controls and procedures were effectiveas of March 31, 2018.
Changes in Internal Control over Financial Reporting
There were no changes in the Company’s internal control over financial reporting (as defined in Rules 13a-15(f) and 15d-15(f) under the Exchange Act) thatoccurred during the quarter ended March 31, 2018 that have materially affected or are reasonably likely to materially affect the Company’s internal controlover financial reporting.
76
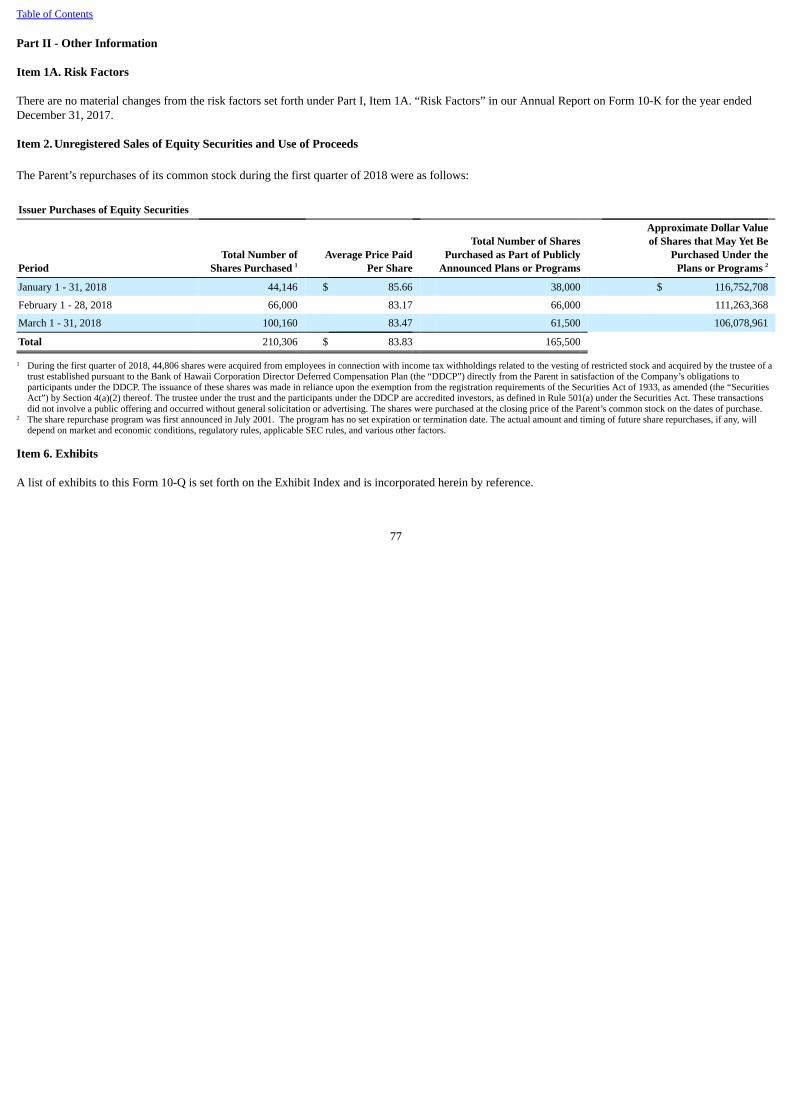
Table of Contents
Part II - Other Information
Item 1A. Risk Factors
There are no material changes from the risk factors set forth under Part I, Item 1A. “Risk Factors” in our Annual Report on Form 10-K for the year endedDecember 31, 2017.
Item 2. Unregistered Sales of Equity Securities and Use of Proceeds
The Parent’s repurchases of its common stock during the first quarter of 2018 were as follows:
Issuer Purchases of Equity Securities
PeriodTotal Number of
Shares Purchased 1 Average Price Paid
Per Share
Total Number of SharesPurchased as Part of Publicly
Announced Plans or Programs
Approximate Dollar Value of Shares that May Yet Be
Purchased Under the Plans or Programs 2
January 1 - 31, 2018 44,146 $ 85.66 38,000 $ 116,752,708
February 1 - 28, 2018 66,000 83.17 66,000 111,263,368
March 1 - 31, 2018 100,160 83.47 61,500 106,078,961
Total 210,306 $ 83.83 165,500
1 During the first quarter of 2018, 44,806 shares were acquired from employees in connection with income tax withholdings related to the vesting of restricted stock and acquired by the trustee of atrust established pursuant to the Bank of Hawaii Corporation Director Deferred Compensation Plan (the “DDCP”) directly from the Parent in satisfaction of the Company’s obligations toparticipants under the DDCP. The issuance of these shares was made in reliance upon the exemption from the registration requirements of the Securities Act of 1933, as amended (the “SecuritiesAct”) by Section 4(a)(2) thereof. The trustee under the trust and the participants under the DDCP are accredited investors, as defined in Rule 501(a) under the Securities Act. These transactionsdid not involve a public offering and occurred without general solicitation or advertising. The shares were purchased at the closing price of the Parent’s common stock on the dates of purchase.
2 The share repurchase program was first announced in July 2001. The program has no set expiration or termination date. The actual amount and timing of future share repurchases, if any, willdepend on market and economic conditions, regulatory rules, applicable SEC rules, and various other factors.
Item 6. Exhibits
A list of exhibits to this Form 10-Q is set forth on the Exhibit Index and is incorporated herein by reference.
77

Table of Contents
Signatures
Pursuant to the requirements of Section 13 or 15(d) of the Securities Exchange Act of 1934, the registrant has duly caused this report to be signed on itsbehalf by the undersigned, thereunto duly authorized.
Date: April 23, 2018
Bank of Hawaii Corporation
By: /s/ Peter S. Ho
Peter S. Ho
Chairman of the Board,
Chief Executive Officer, and
President
By: /s/ Dean Y. Shigemura
Dean Y. Shigemura
Chief Financial Officer
78

Table of Contents
Exhibit Index
Exhibit Number
31.1 Certification of Chief Executive Officer Pursuant to Rule 13a-14(a) of the Securities Exchange Act of 1934, as Amended, Adopted Pursuant
to Section 302 of the Sarbanes Oxley Act of 2002 31.2 Certification of Chief Financial Officer Pursuant to Rule 13a-14(a) of the Securities Exchange Act of 1934, as Amended, Adopted Pursuant to
Section 302 of the Sarbanes Oxley Act of 2002 32 Certification of Chief Executive Officer and Chief Financial Officer Pursuant to 18 U.S.C. Section 1350, as Adopted Pursuant to Section 906
of the Sarbanes-Oxley Act of 2002 101 Interactive Data File
79

Exhibit 31.1
Certification of Chief Executive Officer Pursuant toRule 13a-14(a) of the Securities Exchange Act of 1934, as Amended,Adopted Pursuant to Section 302 of the Sarbanes-Oxley Act of 2002
I, Peter S. Ho, certify that:
1. I have reviewed this quarterly report on Form 10-Q of Bank of Hawaii Corporation;
2. Based on my knowledge, this report does not contain any untrue statement of a material fact or omit to state a material fact necessary to make thestatements made, in light of the circumstances under which such statements were made, not misleading with respect to the period covered by this report;
3. Based on my knowledge, the financial statements, and other financial information included in this report, fairly present in all material respects thefinancial condition, results of operations and cash flows of the registrant as of, and for, the periods presented in this report;
4. The registrant’s other certifying officer and I are responsible for establishing and maintaining disclosure controls and procedures (as defined in ExchangeAct Rules 13a-15(e) and 15d-15(e)) and internal control over financial reporting (as defined in Exchange Act Rules 13a-15(f) and 15d-15(f)) for theregistrant and have:
a) Designed such disclosure controls and procedures, or caused such disclosure controls and procedures to be designed under our supervision, to ensurethat material information relating to the registrant, including its consolidated subsidiaries, is made known to us by others within those entities,particularly during the period in which this report is being prepared;
b) Designed such internal control over financial reporting, or caused such internal control over financial reporting to be designed under our supervision,to provide reasonable assurance regarding the reliability of financial reporting and the preparation of financial statements for external purposes inaccordance with generally accepted accounting principles;
c) Evaluated the effectiveness of the registrant’s disclosure controls and procedures and presented in this report our conclusions about the effectivenessof the disclosure controls and procedures, as of the end of the period covered by this report based on such evaluation; and
d) Disclosed in this report any change in the registrant’s internal control over financial reporting that occurred during the registrant’s most recent fiscalquarter (the registrant’s fourth fiscal quarter in the case of an annual report) that has materially affected, or is reasonably likely to materially affect,the registrant’s internal control over financial reporting; and
5. The registrant’s other certifying officer and I have disclosed, based on our most recent evaluation of internal control over financial reporting, to theregistrant’s auditors and the audit and risk committee of the registrant’s board of directors:
a) All significant deficiencies and material weaknesses in the design or operation of internal control over financial reporting which are reasonablylikely to adversely affect the registrant’s ability to record, process, summarize and report financial information; and
b) Any fraud, whether or not material, that involves management or other employees who have a significant role in the registrant’s internal control overfinancial reporting.
Date: April 23, 2018 /s/ Peter S. Ho
Peter S. Ho
Chairman of the Board,
Chief Executive Officer, and
President

Exhibit 31.2
Certification of Chief Financial Officer Pursuant toRule 13a-14(a) of the Securities Exchange Act of 1934, as Amended,Adopted Pursuant to Section 302 of the Sarbanes-Oxley Act of 2002
I, Dean Y. Shigemura, certify that:
1. I have reviewed this quarterly report on Form 10-Q of Bank of Hawaii Corporation;
2. Based on my knowledge, this report does not contain any untrue statement of a material fact or omit to state a material fact necessary to make thestatements made, in light of the circumstances under which such statements were made, not misleading with respect to the period covered by this report;
3. Based on my knowledge, the financial statements, and other financial information included in this report, fairly present in all material respects thefinancial condition, results of operations and cash flows of the registrant as of, and for, the periods presented in this report;
4. The registrant’s other certifying officer and I are responsible for establishing and maintaining disclosure controls and procedures (as defined in ExchangeAct Rules 13a-15(e) and 15d-15(e)) and internal control over financial reporting (as defined in Exchange Act Rules 13a-15(f) and 15d-15(f)) for theregistrant and have:
a) Designed such disclosure controls and procedures, or caused such disclosure controls and procedures to be designed under our supervision, to ensurethat material information relating to the registrant, including its consolidated subsidiaries, is made known to us by others within those entities,particularly during the period in which this report is being prepared;
b) Designed such internal control over financial reporting, or caused such internal control over financial reporting to be designed under our supervision,to provide reasonable assurance regarding the reliability of financial reporting and the preparation of financial statements for external purposes inaccordance with generally accepted accounting principles;
c) Evaluated the effectiveness of the registrant’s disclosure controls and procedures and presented in this report our conclusions about the effectivenessof the disclosure controls and procedures, as of the end of the period covered by this report based on such evaluation; and
d) Disclosed in this report any change in the registrant’s internal control over financial reporting that occurred during the registrant’s most recent fiscalquarter (the registrant’s fourth fiscal quarter in the case of an annual report) that has materially affected, or is reasonably likely to materially affect,the registrant’s internal control over financial reporting; and
5. The registrant’s other certifying officer and I have disclosed, based on our most recent evaluation of internal control over financial reporting, to theregistrant’s auditors and the audit and risk committee of the registrant’s board of directors:
a) All significant deficiencies and material weaknesses in the design or operation of internal control over financial reporting which are reasonablylikely to adversely affect the registrant’s ability to record, process, summarize and report financial information; and
b) Any fraud, whether or not material, that involves management or other employees who have a significant role in the registrant’s internal control overfinancial reporting.
Date: April 23, 2018 /s/ Dean Y. Shigemura
Dean Y. Shigemura
Chief Financial Officer

Exhibit 32
Certification of Chief Executive Officer and Chief Financial OfficerPursuant to 18 U.S.C. Section 1350, as Adopted Pursuant to
Section 906 of the Sarbanes-Oxley Act of 2002
We hereby certify pursuant to 18 U.S.C. Section 1350, as adopted pursuant to Section 906 of the Sarbanes-Oxley Act of 2002, that the Quarterly Report onForm 10-Q of Bank of Hawaii Corporation (the “Company”) for the quarter ended March 31, 2018 (the “Report”):
• fully complies with the requirements of Section 13(a) or 15(d), as applicable, of the Securities Exchange Act of 1934, as amended; and
• the information contained in the Report fairly presents, in all material respects, the financial condition and results of operations of the Company.
Date: April 23, 2018 /s/ Peter S. Ho
Peter S. Ho
Chairman of the Board,
Chief Executive Officer, and
President
/s/ Dean Y. Shigemura
Dean Y. Shigemura
Chief Financial Officer
A signed original of this written statement required by Section 906 has been provided to the Company and will be retained by the Company and furnished tothe Securities and Exchange Commission or its staff upon request.