bank of cyprus group · the bank of cyprus group operates through a total of 108 branches in...
TRANSCRIPT

49
133
156
255
192
0
127
127
127
0
153
204
191
191
191
203
224
230
234
234
234
0
97
114
Corporate presentation
Bank of Cyprus Group
December 2019

49
133
156
255
192
0
127
127
127
0
153
204
191
191
191
203
224
230
234
234
234
0
97
114
The Bank of Cyprus Group is the leading banking and financial services group in Cyprus, providing a wide range of financial products and
services which include retail and commercial banking, finance, factoring, investment banking, brokerage, fund management, private
banking, life and general insurance. The Bank of Cyprus Group operates through a total of 108 branches in Cyprus, of which 11 operate as
cash offices. Bank of Cyprus also has representative offices in Russia, Ukraine and China. The Bank of Cyprus Group employs 4,134* staff
worldwide. At 30 September 2019, the Group’s Total Assets amounted to €21.1 bn and Total Equity was €2.5 bn. The Bank of Cyprus
Group comprises Bank of Cyprus Holdings Public Limited Company, its subsidiary Bank of Cyprus Public Company Limited and its
subsidiaries.
*The Bank of Cyprus Group employed 4,134 staff worldwide as at 30 September 2019. The number of staff has been reduced by c.470
employees following the completion of a voluntary staff exit plan in October 2019.

49
133
156
255
192
0
127
127
127
0
153
204
191
191
191
203
224
230
234
234
234
0
97
114
Investment highlights
3
2
3
Leading financial hub in Cyprus
Market leader in both loans and deposits
4
Well positioned to capitalise on growth opportunities
Highly correlated with the Cyprus economy which is expected to grow twice as fast as the euro area
average in the next three years
Significantly de-risked balance sheet profile
Successful execution of decisive strategic actions in reducing NPEs
Funding structure normalised
Good capital position
Pathway to sustainable returns profile via the core Cypriot bank
Finish the task of balance sheet de-risking
Further improve efficiencies in operating model
Revenue stabilisation and diversification
Medium Term Guidance to be communicated with FY2019 FR
Strong leadership team…
…with an excellent track-record of delivery against strategic objectives
Clear focus on strategic priorities…
…to manage the residual legacy portfolio and…
…to further improve efficiency supported by on-going digital transformation
…whilst maintaining good capital position
5
Creating a Stronger, Safer
and future focused Bank
1
6

49
133
156
255
192
0
127
127
127
0
153
204
191
191
191
203
224
230
234
234
234
0
97
114
13.0
7.5 3.7 1.8
Gross loans
€ bn
Branch network
# branches
Deposits
€ bn
Source: CBC, company disclosure as of 30 September 2019
1) Hellenic Bank Data as of 30 June 2019
16.5 14.8
2.2 5.6
97 129
22 8
41%
35%
Market share
Leading financial hub in Cyprus
Hellenic Bank
22%
30%
4
Positioning against market players
11% 5%
5% 11%
1
Market leading full service bank in Cyprus
1

49
133
156
255
192
0
127
127
127
0
153
204
191
191
191
203
224
230
234
234
234
0
97
114
0
0.1
0.2
0.3
0.4
0.5
0.6
0.7
0.8
0.9
Apr
20
16
Ju
l 20
16
Sep
2016
No
v 2
016
Ja
n 2
01
7
Apr
20
17
Ju
n 2
01
7
Aug
2017
Oct 20
17
Ja
n 2
01
8
Mar
20
18
May 2
01
8
Ju
l 20
18
Oct 20
18
De
c 2
018
Feb
20
19
Apr
20
19
Ju
n 2
01
9
Sep
2019
No
v 2
019
Cyprus - maturity 4/11/2025 Portugal - maturity 15/10/2025
Spain - maturity 31/10/2025 Italy - maturity 01/12/2025
Greece - maturity 30/01/2028
9.5
13.3
16.6 16.5
13.2 13.0
10.3
7.6 7.5 7.3
340
360
380
400
420
440
460
5.0
7.0
9.0
11.0
13.0
15.0
17.0
20
11
Q4
20
12
Q2
20
12
Q4
2Q
20
13
4Q
20
13
2Q
20
14
4Q
20
14
2Q
20
15
4Q
20
15
2Q
20
16
4Q
20
16
2Q
20
17
4Q
20
17
2Q
20
18
4Q
20
18
20
19
Q1
20
19
Q2
Unemployment rate SA (%)
Cyprus now one of the fastest growing economies in Europe
5
4.1
3.2
-8.0
-6.0
-4.0
-2.0
0.0
2.0
4.0
6.0
8.0
2011 2012 2013 2014 2015 2016 2017 2018 3Q2019
Real GDP SA annualised % change y-o-y 1
Source: Statistical Service of Republic of Cyprus; Bloomberg
(1) SA: Seasonally Adjusted
(2) Normalised against Germany Government bond with maturity 15/8/2025 except Greece
(3) Due to the Debt swap of the Hellenic Republic, from November 2017 onwards data for the new Hellenic Republic Bond
with maturity 30/01/2028 was used and normalised against the closest maturity of German Government bond (DBR) 15/08/2027
Real GDP growth (%) – 2019e
4.9%
3.2%
2.0% 1.8% 1.7% 1.1%
0.1%
Ireland Cyprus Spain Portugal Greece Euro areaaverage
Italy
1
Spreads (%)
2
2
2
2
3
Cyprus economy expected to grow twice as fast as the euro area average in the next three years
Unemployment rate dropped to 7.3%, the lowest since 2013 Reduction in spreads following reduction in government bond
yields
2

63% 31%
49% 78%
Substantial improvement on key Balance Sheet metrics
6
26.8
21.1
Dec
2014
Sep
2019
Total assets
-€5.7 bn
> €5.5 bn balance sheet
deleveraging c.€9 bn reduction in RWAs
22.7
13.8
Sep
2019
Dec
2014
RWAs
-€8.9 bn
Funding structure normalised
c.€11 bn reduction in NPEs
15.0
4.1
Dec
2014
NPEs
Sep
2019
-73%
Good capital position above
regulatory requirements
Dec
2014
141%
Sep
2019
L/D ratio 66%
-75 p.p.
€ bn € bn
€ bn NPE ratio
(1) Allowing for transitional arrangements
(2) Pro-forma for the disposal of the investment CNP and Voluntary Staff Exit Plan completed in October 2019
(3) OCR(SREP)- Overall Capital Requirement comprises the Total SREP Capital Requirement (Pillar 1 and Pillar 2 Requirement) plus combined buffer requirements (capital conservation buffer,
countercyclical buffer and systemic buffers)
(4)
10.5%
Min. regulatory requirements
Dec
2014
14.9% 14.0%
Sep
2019
CET1
1 1,2
NPEs reduced by 73% since 2014
Funding stack normalisation with a
deposit funded asset base
Strengthened capital position relative
to balance sheet risk profile
Customer deposits as % of total assets
3
3

7
… impacting C/I ratio
Cost management remains a key focus going forward
36%
FY2014 9M2019
C/I ratio
62%
FY2015 FY2014 FY2016 FY2017
COR
9M2019 FY2018
2.8%
4.3%
1.7%
4.0%
1.0% 1.2%
Cost of risk normalisation following B/S de-risking
completion
193 235
331 227
320
83
9M2016 9M2019
844
545
… resulting in lower but higher quality income…
51%
49%
73%
27%
9.9 8.9
5.9
2.0
10.9
Sep
2019
Sep
2016
15.8
Legacy
Performing
Smaller yet safer loan book led by B/S de-risking…
63%
37%
82%
18%
Net loans (€ bn)
(1) C/I ratio: Cost-to-income ratio
(2) COR: Cost of risk ratio
For calculations please refer to “Glossary & Definitions”
1 2
…with consequences for Profit and Loss metrics 3
Legacy
Performing
Non Interest Income
% of Total Interest Income
on Loans
Interest Income on loans
and Non Interest Income (€ mn)
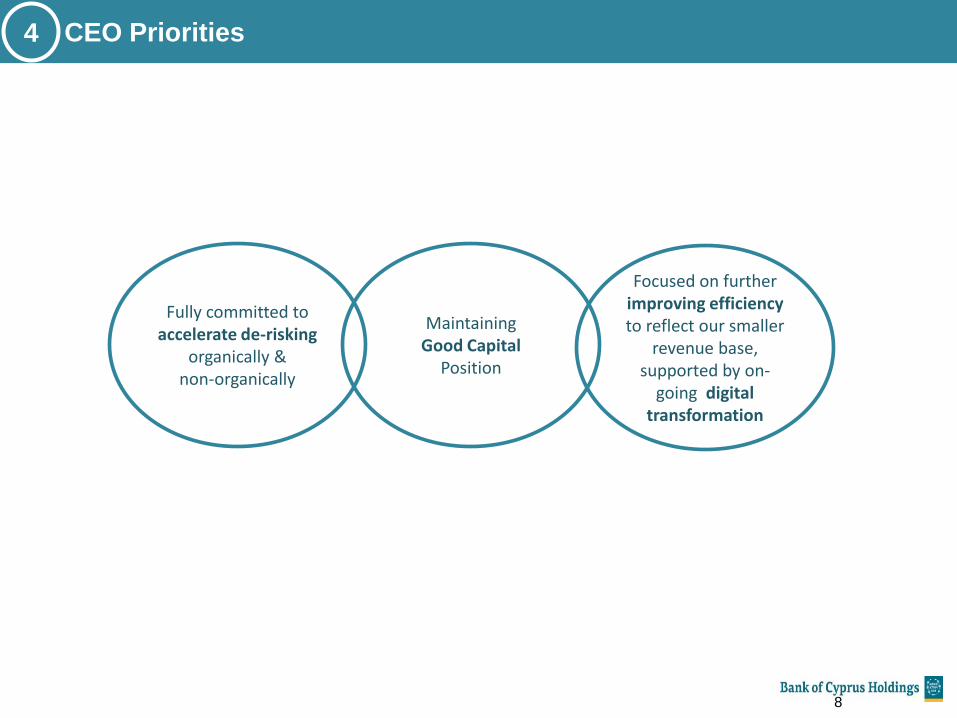
Fully committed to accelerate de-risking
organically & non-organically
8
4 CEO Priorities
Focused on further improving efficiency to reflect our smaller
revenue base, supported by on-
going digital transformation
Maintaining Good Capital
Position

• Estia scheme resulting in clear distinction of eligible borrowers in 3 categories:
Scheme participants 487 applications (c.€120 mn) received until 22 November 2019
Non viable Alternative restructuring solutions considered
Remaining Focus mainly on realising collateral via consensual & non consensual foreclosures
Estia eligible2
portfolio €0.83 bn
• Close monitoring of redefaults & quality of restructurings
• c.75% available for NPE exit by end 2020, subject to continuing to meet all relevant exit criteria
Non-Core3 NPEs
€0.53
bn
• In an advanced preparation phase of reviewing NPE reduction structures expected to be finalised in
1H20201
De-risking acceleration
>€2 bn
9
Accelerate de-risking, organically and non-organically to tackle remaining €4.1 bn NPEs and €1.5 bn REOs
• Net organic reduction of €227 mn in 3Q2019 and of €684 mn for 9M2019
• Ahead of target of c.€200 mn per quarter in 2019
Organic de-risking continues
€0.8 bn
for 2019
• €1.10 bn sales5 of 1,459 properties since set-up in Jan 2016
• On board assets in REMU at conservative c.25%-30% discount to open market value (OMV)
• REMU sales achieved comfortably above Book Value
Real Estate Management Unit (REMU)
€1.5 bn
REOs4
4 Strategic priorities - manage the residual legacy portfolio
(1) NPE reduction structures under review include outright sales. The Group is not committed to any outcome arising from this preparation phase
(2) ESTIA-eligible portfolio refers to the potentially eligible portfolio based on the Bank’s available data. Further, eligibility w ill be assessed on an individual level and borrowers will be eligible if they apply and
meet the specific criteria of the Scheme as announced by the Government
(3) NPEs that have been restructured, have no arrears and are in the pipeline to exit NPE definition subject to meeting the relevant exit criteria
(4) Real – estate-owned properties
(5) Sales contract prices

• Further 8% reduction in number of branches by the year end
• Completion of Voluntary Staff Exit Plan in 4Q2019 at one-off cost of €79 mn
• Full time employees reduced by 11%; Gross annual savings2 in staff costs of 13% (€28 mn) Staff Costs
10
• Expected to minimise upon completion of de-risking Restructuring Expenses
To reflect our smaller revenue base, supported by on-going Digital Transformation
• Adoption of digital products and services continues to grow and gain momentum
• 75% of transactions1 through digital channels; 54% increase in active mobile banking users since June 2017
Digital Transformation
• Expected to normalise following balance sheet de-risking Cost of Risk
4 Strategic priorities – improve efficiency
Branch Footprint Rationalisation
• Liquidity management strategy underway for specific customer groups
• Actively pricing down deposits; 57 bps reduction since Jan 18
Cost of Funding and Liquidity Management
(1) Transactions involving deposits, cash withdrawals and transfers
(2) This gross annual saving does not include any impact from the renewal of the collective agreement for 2019 which remains under discussion
49
133
156
255
192
0
127
127
127
0
153
204
191
191
191
203
224
230
234
234
234
0
97
114
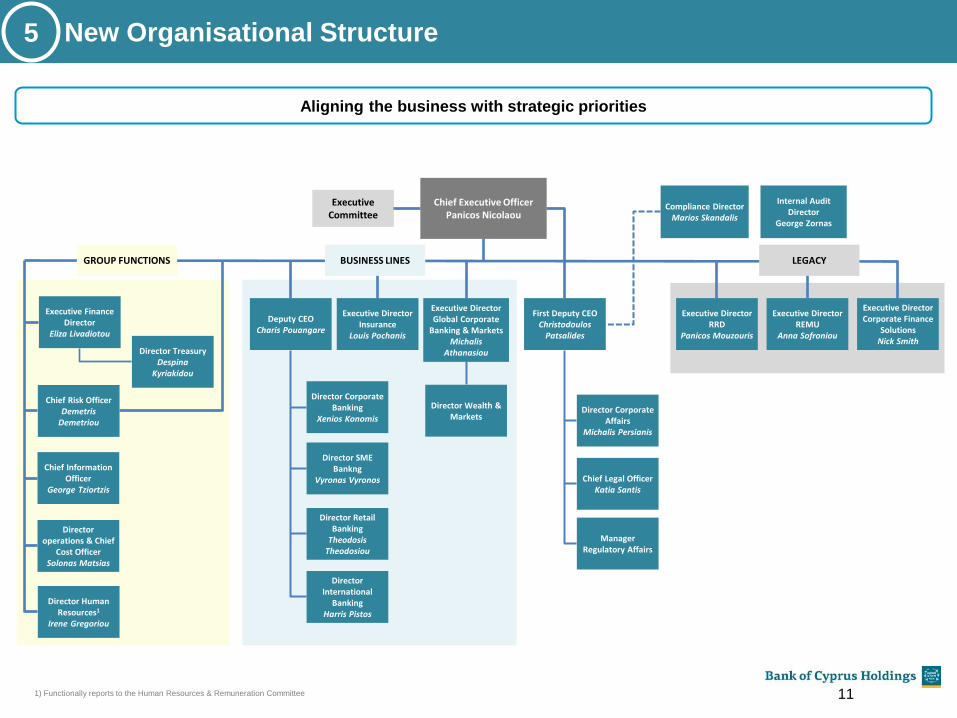
Internal Audit Director
George Zornas
Chief Executive Officer Panicos Nicolaou
Executive Committee
Compliance Director Marios Skandalis
Executive Finance Director
Eliza Livadiotou
1) Functionally reports to the Human Resources & Remuneration Committee 11
Director operations & Chief
Cost Officer Solonas Matsias
Chief Risk Officer Demetris
Demetriou
Chief Information Officer
George Tziortzis
Director Human Resources1
Irene Gregoriou
Director Treasury Despina
Kyriakidou
GROUP FUNCTIONS
Deputy CEO Charis Pouangare
Executive Director Insurance
Louis Pochanis
Executive Director Global Corporate
Banking & Markets Michalis
Athanasiou
Director Corporate Banking
Xenios Konomis
Director SME Bankng
Vyronas Vyronos
Director Retail Banking
Theodosis Theodosiou
Director International
Banking Harris Pistos
Executive Director Corporate Finance
Solutions Nick Smith
Executive Director REMU
Anna Sofroniou
Executive Director RRD
Panicos Mouzouris
First Deputy CEO Christodoulos
Patsalides
Director Corporate Affairs
Michalis Persianis
Chief Legal Officer Katia Santis
Manager Regulatory Affairs
Director Wealth & Markets
BUSINESS LINES LEGACY
New Organisational Structure 5
Aligning the business with strategic priorities
49
133
156
255
192
0
127
127
127
0
153
204
191
191
191
203
224
230
234
234
234
0
97
114
12
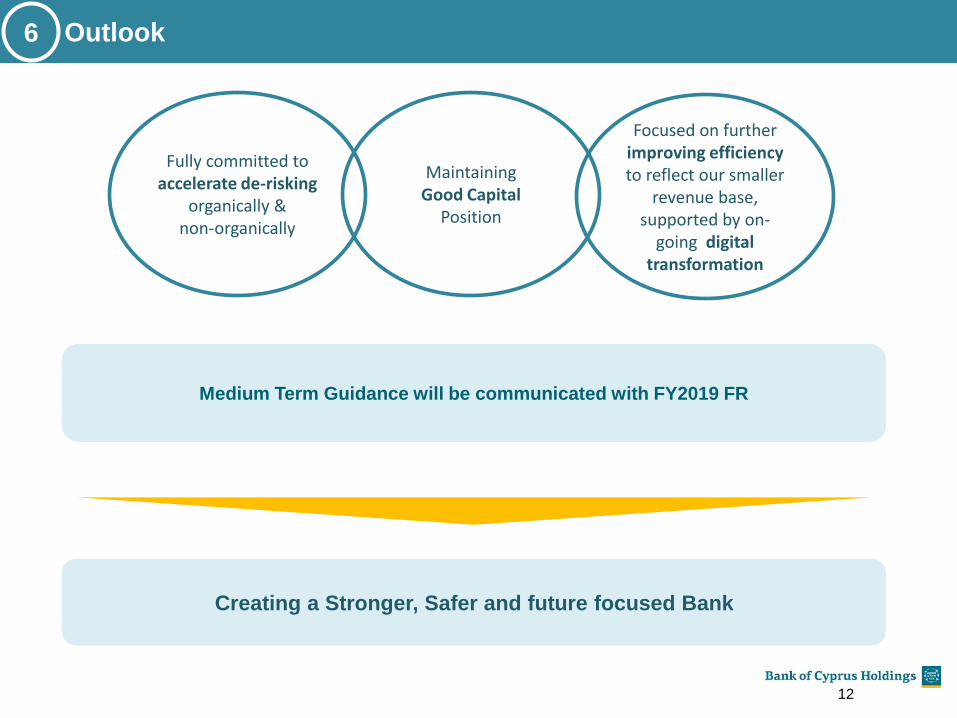
Medium Term Guidance will be communicated with FY2019 FR
Creating a Stronger, Safer and future focused Bank
Outlook 6
Fully committed to accelerate de-risking
organically & non-organically
Focused on further improving efficiency to reflect our smaller
revenue base, supported by on-
going digital transformation
Maintaining Good Capital
Position
49
133
156
255
192
0
127
127
127
0
153
204
191
191
191
203
224
230
234
234
234
0
97
114
13
Group Financial Results
for the nine months ended 30 September 2019

49
133
156
255
192
0
127
127
127
0
153
204
191
191
191
203
224
230
234
234
234
0
97
114
3Q2019 - Highlights
14
• New lending of €491 mn for 3Q2019 and €1.6 bn for 9M2019
• Total Income of €162 mn, Operating profit of €63 mn
• Recurring income from on-going insurance business (€12 mn in 3Q2019; €42 mn in 9M2019)
• Cost of risk at 0.90%
• Underlying profit of €18 mn for 3Q2019 and €35 mn for 9M2019
• Profit after tax of €19 mn for 3Q2019 and €116 mn for 9M2019
• Deposits flat qoq at €16.5 bn
• Loan to deposit ratio at 66%
• Liquidity surplus reduced to €3.0 bn on TLTRO repayment
• Liquidity management strategy underway for specific customer groups
• Total Capital ratio of 17.9%1 pro forma for disposal of investment in CNP2 and Voluntary Staff Exit Plan (VEP)3 (18.2%1 as reported)
• CET1 ratio of 14.9%1 pro forma for disposal of investment in CNP2 and VEP3 (15.2%1 as reported)
Positive
Performance in
3Q2019
Active Liquidity
Management
Good Capital
Position
• NPEs of €4.1 bn (€2.0 bn net); 73% reduction since 2014
• Gross NPE ratio reduced to 31%, coverage increased to 51%
• Organic NPE reduction continued ahead of guidance (€227 mn in 3Q2019; €684 mn in 9M2019)
• REMU sales of €355 mn in 9M2019
• Good momentum in efforts to accelerate de-risking with further portfolio sales
Balance Sheet
Repair Continues
at Pace
(1) Allowing for IFRS 9 transitional arrangements
(2) In October 2019 the Bank completed the disposal of its entire shareholding of 49.9% in its associate CNP Insurance Holdings Limited (“CNP”). https://www.bankofcyprus.com/globalassets/investor-
relations/press-releases/eng/20191007-completion-of-sale-of-cnp_eng_final.pdf
(3) In October 2019, the Group announced the successful completion of a Voluntary staff Exit Plan (VEP). https://www.bankofcyprus.com/globalassets/investor-relations/press-releases/eng/20191031-
vep_eng_final.pdf
(4) Transactions involving deposits, cash withdrawals and transfers
(5) This gross annual saving does not include any impact from the renewal of the collective agreement for 2019 which remains under discussion.
• Successful completion of VEP in 4Q2019 at one-off cost of €79 mn, supported by the on-going Digital Transformation Programme
• Full time employees reduced by 11%
• Gross annual savings5 in staff costs of 13% (€28 mn)
• Branch footprint rationalisation continues; further 8% reduction in branches in number of branches by the year end
• 75% of transactions4 through digital channels; 54% increase in active mobile banking users since June 2017
Cost Management
Actions in 4Q2019
Supported by
Digital
Transformation

49
133
156
255
192
0
127
127
127
0
153
204
191
191
191
203
224
230
234
234
234
0
97
114
14.9% 15.2% 14.9%
17.9%
0.5% (0.3%) 0.2% (0.1%) 0.3% (0.6%)
1.6%
1.4%
CET130 Jun 2019
Operatingprofitability
Loan creditlosses
and otherimpairments
RWAs(organic)
Other CET 130 Sep 2019
Disposal ofCNP
VEP CET 130 Sep 2019pro forma forCNP and VEP
AT1 T2 Total Capitalratio
30 Sep 2019pro-forma forCNP and VEP
1
5 1,2 1,2
11.9
%
14.9
%
13
.4%
16.2
%
14.9
%
17.8
%
15.2
%
18.2
%
14.9
%
17.9
%
CET 1 ratio Total capital ratio
Dec 2018 Mar 2019 Jun 2019 Sep 2019 Sep 2019pro-forma for CNP and VEP
RWA intensity at 65%
Capital at 14.9%, well above regulatory requirements
15
(1) Allowing for IFRS 9 transitional arrangements.
(2) The CET1 ratio for 30 Sep 2019, including the full impact of IFRS 9 amounted to 13.6% and 13.3% pro forma for the completion of the disposal of the investment in CNP and the VEP
(3) Loan credit losses and other impairments include the net change of the prudential charges relating to specific credits and other items
(4) In October 2019 the Bank completed the disposal of its entire shareholding of 49.9% in its associate CNP Insurance Holdings Limited (“CNP”). https://www.bankofcyprus.com/globalassets/investor-
relations/press-releases/eng/20191007-completion-of-sale-of-cnp_eng_final.pdf
(5) In October 2019, the Group announced the successful completion of a Voluntary staff Exit Plan (VEP). https://www.bankofcyprus.com/globalassets/investor-relations/press-releases/eng/20191031-
vep_eng_final.pdf
(6) OCR(SREP)- Overall Capital Requirement comprises the Total SREP Capital Requirement (Pillar 1 and Pillar 2 Requirement) plus combined buffer requirements (capital conservation buffer,
countercyclical buffer and systemic buffers)
(7) New SREP requirements are expected to be effective as from January 2020, and are subject to ECB final 2019 SREP decision. Since 2015, the Bank has been designated as an Other Systemically
Important Institution (O-SII). The Central Bank of Cyprus set the O-SII buffer for the Group at 2%. This buffer will be phased-in gradually, having started from 1 January 2019 at 0.5% and increasing by
0.5% every year thereafter, until being fully implemented (2.0%) on 1 January 2022
14.0%
Evolution of Capital Ratios
10.5%
CET1 ratio at 14.9%1,2; Total capital ratio at 17.9%1
min 2019 OCR (SREP)6 requirement
3
1,2 1
1,2 4
Unchanged SREP
capital requirements
expected for 2020 when
ignoring the phasing-in
of O-SII7 of 50 bps (see
slide 47)
Dec-17 Jun-19 Mar-19 Dec-14 Sep-19 Dec-16 Dec-18 Mar-19
pro forma
for Helix
85% 85%
73% 70% 71%
64% 64% 65%
Reduction of -20 p.p.
49
133
156
255
192
0
127
127
127
0
153
204
191
191
191
203
224
230
234
234
234
0
97
114
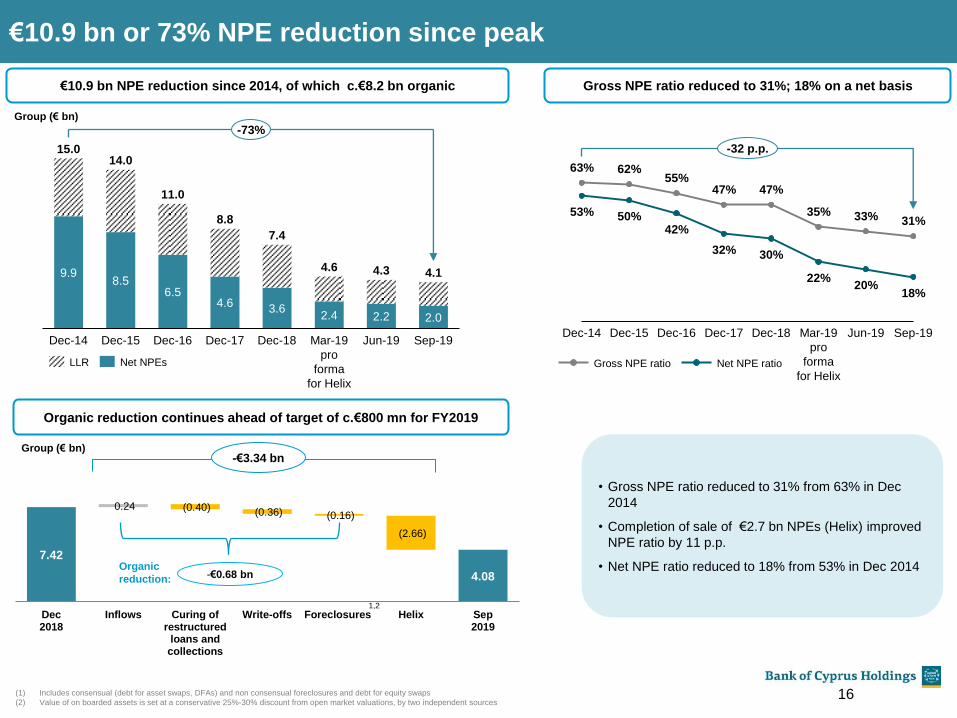
7.42 7.42 7.26 6.90 6.74
4.08 4.08
0.24 (0.40) (0.36) (0.16)
(2.66)
Dec2018
Inflows Curing ofrestructured
loans andcollections
Write-offs Foreclosures Helix Sep2019
€10.9 bn or 73% NPE reduction since peak
€10.9 bn NPE reduction since 2014, of which c.€8.2 bn organic
Organic reduction continues ahead of target of c.€800 mn for FY2019
-€3.34 bn
Group (€ bn)
1,2
(1) Includes consensual (debt for asset swaps, DFAs) and non consensual foreclosures and debt for equity swaps
(2) Value of on boarded assets is set at a conservative 25%-30% discount from open market valuations, by two independent sources
16
9.9 8.5
6.5 4.6
3.6 2.4 2.2 2.0
7.4
Dec-15 Dec-14 Dec-17 Dec-18 Dec-16
14.0
Mar-19
pro
forma
for Helix
Jun-19 Sep-19
15.0
11.0
8.8
4.6 4.3 4.1
-73%
-€0.68 bn
• Gross NPE ratio reduced to 31% from 63% in Dec
2014
• Completion of sale of €2.7 bn NPEs (Helix) improved
NPE ratio by 11 p.p.
• Net NPE ratio reduced to 18% from 53% in Dec 2014
LLR Net NPEs
Gross NPE ratio reduced to 31%; 18% on a net basis
42%
62%
18%
63%
Dec-15
35% 53%
55%
Dec-14
50%
47%
Dec-16
47%
30% 32%
Dec-17 Dec-18
22%
Mar-19
pro
forma
for Helix
33%
20%
31%
Jun-19 Sep-19
-32 p.p.
Gross NPE ratio Net NPE ratio
Organic
reduction:
Group (€ bn)

49
133
156
255
192
0
127
127
127
0
153
204
191
191
191
203
224
230
234
234
234
0
97
114
11.36
7.18 6.26
3.74 3.65 3.55
0.64
0.27
0.34
0.34 0.22 0.19
1.97
1.35
0.87
0.53 0.44
0.34
13.97
8.80
7.47
4.61 4.31 4.08
Dec 15 Dec 17 Dec 18 Mar 19pro forma for Helix
Jun 19 Sep 19
Core NPEs
Non Core NPEs
(1) In pipeline to exit NPEs subject to meet all exit criteria; the analysis is performed on a customer basis
Core NPE risk at €3.55 bn, 56% covered
% of Gross Loans
50%
36%
Coverage
4%
27%
Core NPEs
Forborne, NPEs, no arrears but impaired
NPEs no impairment, no arrears1 € bn
17
56%
19%
Core NPEs
Non Core NPEs (€ bn) Dec 18 Mar 19 Helix Mar 19
Pro forma for Helix Jun 19 Sep 19
Sep 19
Coverage
Corporate 0.68 0.58 (0.16) 0.42 0.28 0.22
SMEs 0.21 0.18 (0.05) 0.13 0.11 0.09
Retail 0.32 0.32 (0.00) 0.32 0.27 0.22
Total Non Core NPEs 1.21 1.08 (0.21) 0.87 0.66 0.53 19%
Core NPEs (€ bn)
Corporate 2.50 2.48 (1.88) 0.60 0.60 0.56
SMEs 1.60 1.47 (0.52) 0.95 0.84 0.78
Retail 2.16 2.24 (0.05) 2.19 2.21 2.21
Total Core NPEs 6.26 6.19 (2.45) 3.74 3.65 3.55 56%
Contractual balance of Core NPEs 5.35 71%
Core NPEs
28%
55%
Core NPEs
28%
55%

49
133
156
255
192
0
127
127
127
0
153
204
191
191
191
203
224
230
234
234
234
0
97
114
Clear strategy for further NPE reduction
18
0.56
0.60
1.56
4.08
€2.72bn
€0.83bn
€0.53bn
Group NPEs (€ bn)
Net organic reduction of €227 mn in 3Q2019 and of €684 mn for 9M2019, ahead of target of c.€800 mn for FY2019
Good momentum in efforts to accelerate de-risking with further portfolio sales
• Close monitoring of redefaults &
quality of restructurings
• Resolution of portfolio as per the Government-led scheme (see slide 7& 28)
• Clear definition of socially protected
Estia participants: 487 applications (c.€120 mn) received until 22 November 2019
Non viable: Alternative restructuring solutions being considered
Remaining: Focus mainly on realising collateral via consensual & non consensual foreclosures
• Focus on realising collateral via consensual and non consensual foreclosures for non-Estia eligible clients
• On board assets in REMU at conservative c.25%-30% discount to open market value (OMV)
• Management continues to actively explore strategies to further accelerate de-risking including further
portfolio sales
In a an advanced preparation phase of reviewing NPE reduction structures expected to be finalised
in 1H20203
Include outright sales4
Potential transactions involve in total NPE portfolio > €2 bn GBV
0.13 0.06
0.25
0.09
0.38
0.15
up to 31 Dec 2020 2021+
No impairments no arrears
No arrears but Impaired
Exit dates for non core NPEs1 (€ bn)
Core NPEs excluding ESTIA eligible2: €2.72 bn
ESTIA eligible2: €0.83 bn
Non Core
Estia participants
Non-viable
Remaining
Retail-
Non Estia eligible
SME
Corporate
Non Core: €0.53 bn
(1) In pipeline to exit NPEs subject to meet all exit criteria; the analysis is performed on a customer basis
(2) ESTIA-eligible portfolio refers to the potentially eligible portfolio based on the Bank’s available data. Further, eligibility w ill be assessed on an individual level and borrowers will be eligible if they apply and
meet the specific criteria of the Scheme as announced by the Government. Please refer to slide 28 for a summary of the Scheme.
(3) The Group is not committed to any outcome arising from this preparation phase
(4) Including the Bank retaining a portion of the related financing

49
133
156
255
192
0
127
127
127
0
153
204
191
191
191
203
224
230
234
234
234
0
97
114
Timeline Jul
19
Sep
19
Oct1
9
Nov
19
Dec
19
Jan
20
Feb
20
Mar
20
Apr
20
May
20
Jun
20
Signing of MOU1
Applications Application period extended until the end of 2019
Restructuring solutions
offered to Applicants
Approval of applications
by the Government
Payment of 1st instalment
of the state subsidy
Clear definition of socially protected borrowers
ESTIA expected to:
• resolve part of ESTIA- eligible3 portfolio
• identify non-viable (vulnerable) customers and
• facilitate resolution of remaining customers mainly through consensual and non consensual foreclosures
Timeline
Restructured
loans will exit
NPE definition in
accordance with
the NPE exit
criteria2
BOC
current
actions
Establishment of dedicated teams and contact strategies developed to handle ESTIA-eligible customers3, including
those who will choose not to participate in the scheme
• Interaction with interested customers on-going, aimed at building applicant pipeline
487 applications received until 22 November 2019 since launch of the scheme (c.€120mn)
Pace of applications is accelerating in 4Q2019
ESTIA- Government scheme launched in September 2019
(1) The Memorandum of Understanding between the Ministry of Finance and the Banks participating in the Scheme was signed on 27 July 2019
(2) Please refer to slide 54 for the NPE forborne exit criteria
(3) ESTIA-eligible portfolio refers to the potentially eligible portfolio based on the Bank’s available data. Further, eligibility will be assessed on an individual level and borrowers will be eligible if they apply and
meet the specific criteria of the Scheme as announced by the Government. Please refer to slide 28 for a summary of the Scheme. 19
49
133
156
255
192
0
127
127
127
0
153
204
191
191
191
203
224
230
234
234
234
0
97
114
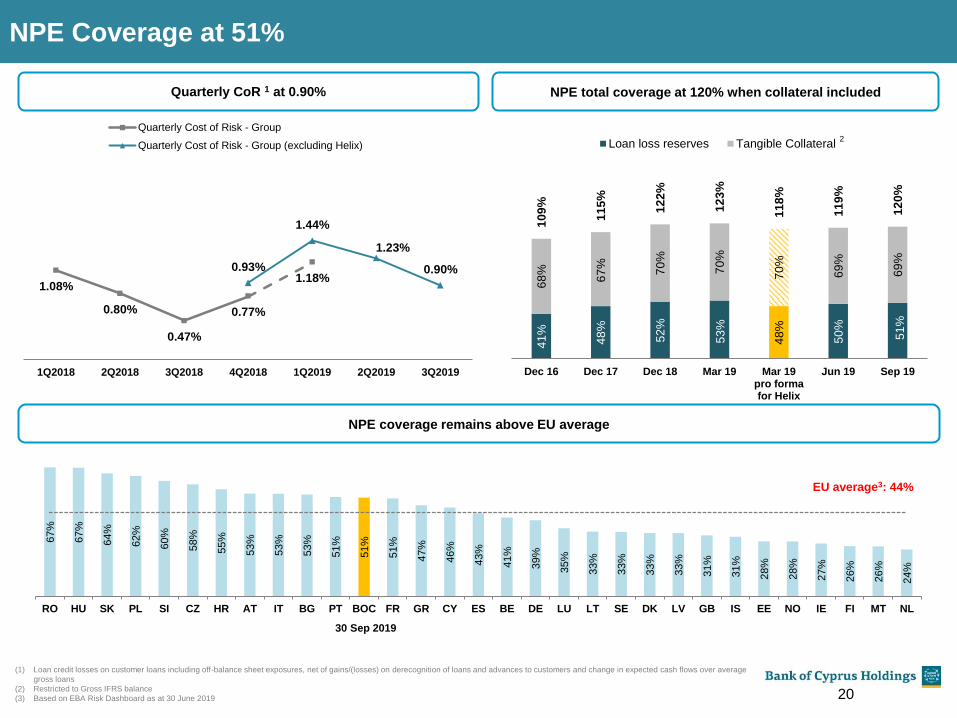
67%
67%
64%
62%
60%
58%
55%
53%
53%
53%
51%
51%
51%
47%
46%
43%
41%
39%
35%
33%
33%
33%
33%
31%
31%
28%
28%
27%
26%
26%
24%
RO HU SK PL SI CZ HR AT IT BG PT BOC FR GR CY ES BE DE LU LT SE DK LV GB IS EE NO IE FI MT NL
NPE Coverage at 51%
20
41
%
48
%
52
%
53
%
48
%
50
%
51
%
68
%
67
%
70
%
70
%
70
%
69
%
69
%
10
9%
11
5%
12
2%
12
3%
11
8%
11
9%
12
0%
Dec 16 Dec 17 Dec 18 Mar 19 Mar 19pro formafor Helix
Jun 19 Sep 19
Loan loss reserves Tangible Collateral
(1) Loan credit losses on customer loans including off-balance sheet exposures, net of gains/(losses) on derecognition of loans and advances to customers and change in expected cash flows over average
gross loans
(2) Restricted to Gross IFRS balance
(3) Based on EBA Risk Dashboard as at 30 June 2019
Quarterly CoR 1 at 0.90% NPE total coverage at 120% when collateral included
NPE coverage remains above EU average
2
30 Sep 2019
EU average3: 44%
1.08%
0.80%
0.47%
0.77%
1.18% 0.93%
1.44%
1.23%
0.90%
1Q2018 2Q2018 3Q2018 4Q2018 1Q2019 2Q2019 3Q2019
Quarterly Cost of Risk - Group
Quarterly Cost of Risk - Group (excluding Helix)

49
133
156
255
192
0
127
127
127
0
153
204
191
191
191
203
224
230
234
234
234
0
97
114
545 260 164 969
352
1,265 1,394
330
527
436
1293
2016 2017 2018 9M2019
75 289
613
82
163
189
434
2016 2017 2018 9M2019
Foreclosures becoming an important tool in NPEs resolution
21
Foreclosure commenced4
Auctions held
969 properties resolved excluding Helix assets since Jan’2016
Consensual
deals5
Sold at auction Repossessed2
• Auctions held for 434 assets in 9M2019
• c.1/5 properties auctioned are sold at auction
• Solution rate1 exceeds 70%
• 8 months time to auction (refer to slide 27)
• Reduce time of re-possession:
• Wait period reduced from 12 to 6 months from date of first
unsuccessful auction
• > 300 properties in the pipeline for repossession2
(1) The [number of cases resolved] as a proportion of [the number of cases that reached or would have reached an auction had they not closed prior to the auction set date]
(2) Properties that have been auctioned unsuccessfully at least once
(3) Principal Private Residence
(4) The foreclosure process is considered to have commenced upon serving notice to the mortgagor
(5) Includes DFAs, restructurings and settlements
no. of properties
no. of properties
Including Helix assets
Including Helix assets
Managed by REMU no. of properties
Foreclosure Law:
• The July 2018 foreclosure law amendments have expedited
the process and limited options to frustrate execution
• In July 2019, the Parliament voted through certain changes to the
2018 law which, in the most part, seek to:
• Provide additional checks and balances where banks are
seeking to foreclose small loans (<€350k) secured by a
PPR3, and
• Extend the foreclosure timetable by extending various notice
periods
• These amendments have not yet passed into law, as they have
been referred to the Supreme Court by the President
• Discussions are on-going, including, inter alia the MoF, the CBC
and the Financial Ombudsman, aiming to introduce
amendments to the foreclosure and loan restructuring framework
that are acceptable to all stakeholders
1Q
2Q
3Q
1Q
2Q
3Q

49
133
156
255
192
0
127
127
127
0
153
204
191
191
191
203
224
230
234
234
234
0
97
114
448 160 142 103 160 89
Land Commercial Hotels Residential CyReit Overseas
274
527
214
86
1
Legacy3
2016
2017
9M2019
2018
46%
44%
37%
25%
195
160
179
330
238
355
2016 2017 2018 9M2019
Sales Cyreit
REMU: €1.10 bn sales of 1,459 properties since set-up in Jan 2016
22
Asset disposal strategy tackles both value and volume of assets 46% of Legacy3 assets now sold
44% of 2016 book now sold
Asset disposals across all property classes
41% of sales (by value) relate to land
Sales contract prices1 (€ mn) Breakdown of cumulative sales1 by on-boarding year (€ mn)
# 99 # 331 # 575 # 4542
# properties % Sales of vintage stock (BV)4
Sales €1.10 bn
• Encouraging trends on real estate market
Residential Property prices up 2.7% yoy5
Sale contracts (excluding DFAs) up 15%
yoy6
(1) Amounts as per Sales purchase Agreements (SPAs)
(2) Number of properties sold include 21 properties from the disposal of Cyreit
(3) Legacy properties relate to properties that were on-boarded before REMU set-up in January 2016
(4) The BV of the properties disposed at the date of disposal as a proportion of the [BV of the
properties disposed at the time of the disposal plus the BV of the residual properties managed by
REMU as at 30 Sep 2019]
(5) Based on data from Land of Registry –Sales contracts
(6) https://www.centralbank.cy/images/media/pdf/RPPI-2019Q1-GR0003.pdf
€1.10 bn
Breakdown of cumulative sales1 by property type (€mn)
€1.10 bn
41% 15% 13% 9% 8% 14%

49
133
156
255
192
0
127
127
127
0
153
204
191
191
191
203
224
230
234
234
234
0
97
114
182 218 79 28 613 280 113
Residential Offices and other commercial propertiesManufacturing and industrial HotelsLand and Plots GolfGreece and Romania
23
(1) In addition to assets held by REMU, properties classified as ‘Investment properties’ with carrying value of €24 mn as at 30 September 2019 relate to legacy properties
(2) Assets in REMU on boarded at conservative prices c.25%-30% discount to open market value (OMV)
(3) Amounts as per Sales purchase Agreements (SPAs)
Assets #
Cyprus: €1,400 mn
€1,513 mn
# 3,356 # 1,879 # 54 # 652 # 218 # 4 # 5 # 544
Organic sales in 9M2019 achieved at 116% of Book Value
Sales contract prices3 (€ mn)
195
100
51
32
Total Sales
9M2019
Commercial
12
Hotels Land Residential
95% 101% 97% 92% 94%
116% 127% 108% 122% 118%
Net Proceeds / BV Gross Proceeds / OMV Sales contract prices3 (€ mn)
434
195
65
160
Offers accepted
9M2019
Sold
14
SPA in
preparation
SPA signed Cyreit
Total Sales
of €355 mn €79 mn Pipeline
€355 mn sales at a profit of €26 mn in 9M2019
€79 mn in the pipeline
REMU sales achieved comfortably above Book Value
1,427
1,641
1,530 1,548
1,513
2016 2017 Sep
2019
2018 Jun
2019
Evolution of REMU stock1
Group BV (€ mn)
REMU stock1 split as at 30 Sep 2019
Group BV (€ mn)
49
133
156
255
192
0
127
127
127
0
153
204
191
191
191
203
224
230
234
234
234
0
97
114
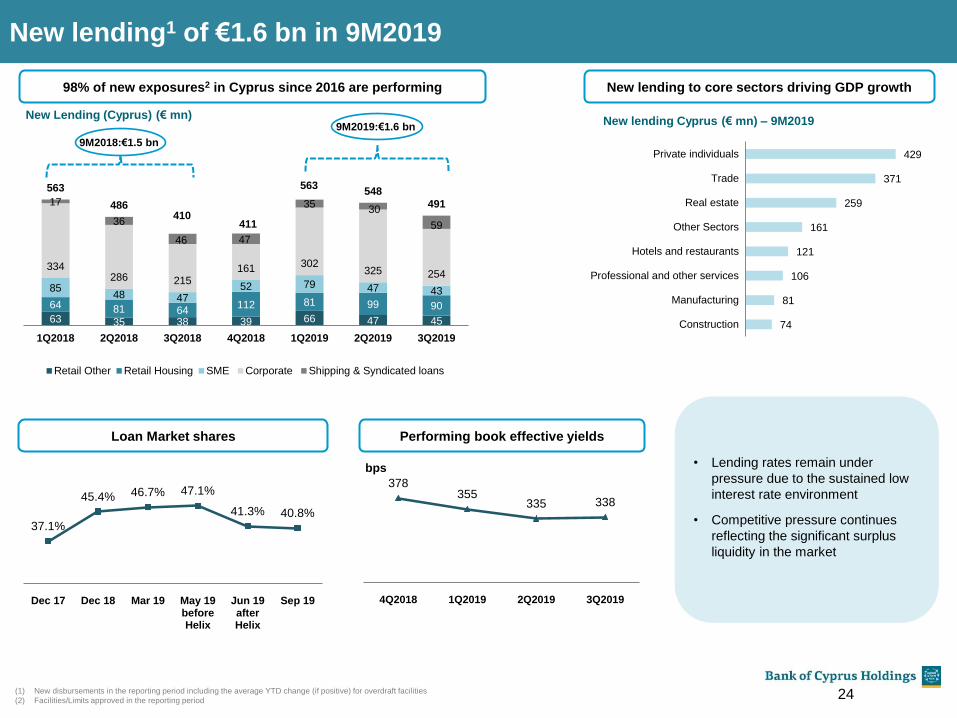
37.1%
45.4% 46.7% 47.1%
41.3% 40.8%
Dec 17 Dec 18 Mar 19 May 19beforeHelix
Jun 19afterHelix
Sep 19
74
81
106
121
161
259
371
429
Construction
Manufacturing
Professional and other services
Hotels and restaurants
Other Sectors
Real estate
Trade
Private individuals
63 35 38 39 66 47 45
64 81 64 112 81 99 90
85 48 47
52 79 47 43
334 286 215
161 302 325 254
17
36
46 47
35 30
59
563
486 410
411
563 548
491
1Q2018 2Q2018 3Q2018 4Q2018 1Q2019 2Q2019 3Q2019
Retail Other Retail Housing SME Corporate Shipping & Syndicated loans
New lending1 of €1.6 bn in 9M2019
24
New lending Cyprus (€ mn) – 9M2019
New lending to core sectors driving GDP growth 98% of new exposures2 in Cyprus since 2016 are performing
New Lending (Cyprus) (€ mn)
(1) New disbursements in the reporting period including the average YTD change (if positive) for overdraft facilities
(2) Facilities/Limits approved in the reporting period
Loan Market shares
378 355
335 338
4Q2018 1Q2019 2Q2019 3Q2019
Performing book effective yields
bps
• Lending rates remain under
pressure due to the sustained low
interest rate environment
• Competitive pressure continues
reflecting the significant surplus
liquidity in the market
9M2019:€1.6 bn
9M2018:€1.5 bn

49
133
156
255
192
0
127
127
127
0
153
204
191
191
191
203
224
230
234
234
234
0
97
114
• Drivers of interest income of Performing book: Competitive pressure on lending rates due to sustained low interest rate environment and significant excess
liquidity
• Drivers of interest income of Legacy book: Curing of restructured loans, DFAs, cash collections of interest on delinquent exposures
84 77 74 76
25 27 27 29
109 104 101 105
4Q2018 1Q2019 2Q2019 3Q2019
Performing Legacy
1
9.96 9.98 10.15 8.65 8.84 8.84 8.87 8.97
7.19 5.64
4.40
3.39 3.19 2.09 2.06 1.97
17.15
15.62
14.55
12.04 12.03
10.93 10.93 10.94
Dec-2015 Dec-2016 Dec-2017 Dec-2018 Mar-2019 Mar-2019pro formafor Helix
Jun-19 Sep-19
Performing Legacy
Balance sheet de-risking results in a smaller but safer loan book
25
€ mn (pre FTP)
Interest Income on Loans (excluding Helix): Performing vs Legacy Net Loans: Performing vs Legacy
€ bn
Sale of BOC UK -
€1.8 bn net loans
58%
82%
42%
18%
(1) Interest income on performing book for 1Q2019 increased from €74 mn to €77 mn since previously disclosed on 13 May 2019, due to reclassification between exposures

49
133
156
255
192
0
127
127
127
0
153
204
191
191
191
203
224
230
234
234
234
0
97
114 9M2019 9M2019 9M2019
Pro
fita
bilit
y
Interest Income on loans (€ mn)
(pre FTP) 2271 83 310
Reversal/(Loan credit losses)
(€ mn) 14 (131) (117)
Interest Income net of loan
credit losses (€ mn) 241 (48) 193
Cost of Risk -0.21% 4.40% 1.19%
Effective Yield 3.43%1 5.35% 3.80%
Risk adjusted Yield 3.65%1 (3.02%) 2.37%
Cap
ital
&
bala
nce
Sh
eet
Average Net Loans2
(€ mn) 8,833 2,091 10,924
RWA Intensity3 57% 105% 65%
Performing Legacy Group
Risk adjusted yield will rise as Legacy book reduces
Corporate
IB, W&M
SME and Retail Banking
Insurance and Other incl H/O
RRD
Overseas non core
REMU
26
• Performing Book is expected to
grow and to increasingly drive
Group results
• Legacy book revenues
predominantly driven by loan
credit losses unwinding (but
offset via loan credit losses)
• Release of €15 mn of provisions
in performing book in 3Q2019
mainly due to loan migration
from Stage 2 to Stage 1
• Interest on Net NPEs not
received in cash, fully provided
(€19 mn in 3Q2019 and €59 mn
in 9M2019)
• As Legacy book reduces:
Group risk adjusted yield
expected to rise
Group Risk intensity
expected to fall supporting
CET1 ratio build
(1) Interest income on performing book for 1Q2019 increased from €74 mn to €77 mn since previously disclosed on 13 May 2019, due to reclassification between exposures
(2) Interest Income on loans net of allowance for expected loan credit losses/Net Loans
(3) Risk Weighted Assets over Total Assets
Excluding Helix
49
133
156
255
192
0
127
127
127
0
153
204
191
191
191
203
224
230
234
234
234
0
97
114
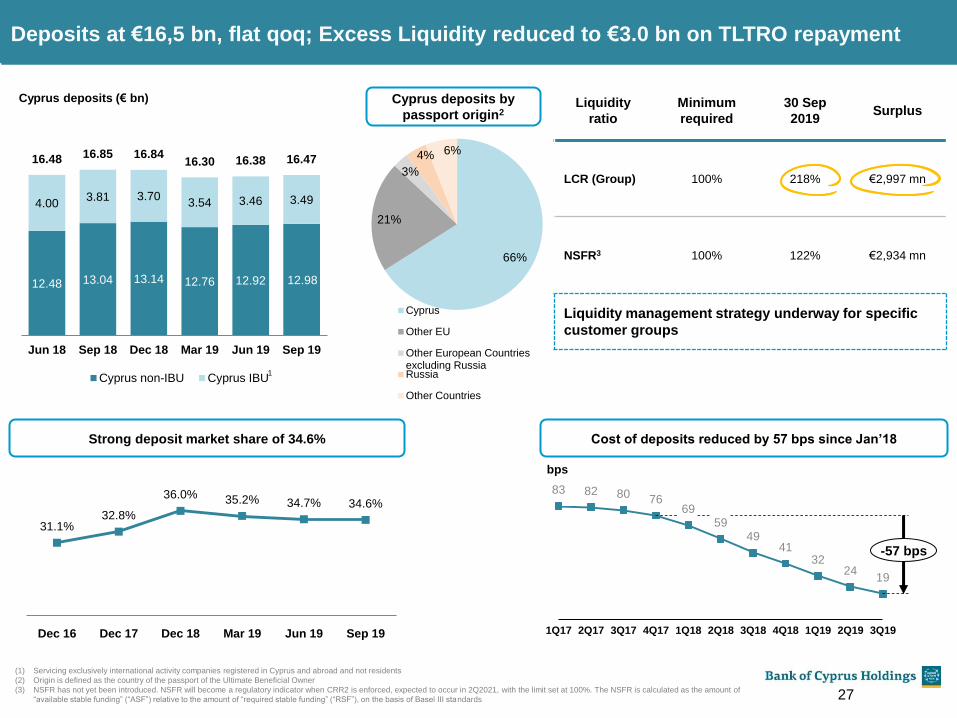
Deposits at €16,5 bn, flat qoq; Excess Liquidity reduced to €3.0 bn on TLTRO repayment
27
(1) Servicing exclusively international activity companies registered in Cyprus and abroad and not residents
(2) Origin is defined as the country of the passport of the Ultimate Beneficial Owner
(3) NSFR has not yet been introduced. NSFR will become a regulatory indicator when CRR2 is enforced, expected to occur in 2Q2021, with the limit set at 100%. The NSFR is calculated as the amount of
“available stable funding” (“ASF”) relative to the amount of “required stable funding” (“RSF”), on the basis of Basel III standards
12.48 13.04 13.14 12.76 12.92 12.98
4.00 3.81 3.70
3.54 3.46 3.49
16.48 16.85 16.84 16.30 16.38 16.47
Jun 18 Sep 18 Dec 18 Mar 19 Jun 19 Sep 19
Cyprus non-IBU Cyprus IBU
66%
21%
3%
4% 6%
Cyprus
Other EU
Other European Countriesexcluding RussiaRussia
Other Countries
Cyprus deposits by
passport origin2
Cyprus deposits (€ bn) Liquidity
ratio
Minimum
required
30 Sep
2019 Surplus
LCR (Group) 100% 218% €2,997 mn
NSFR3 100% 122% €2,934 mn
Liquidity management strategy underway for specific
customer groups
1
31.1% 32.8%
36.0% 35.2% 34.7% 34.6%
Dec 16 Dec 17 Dec 18 Mar 19 Jun 19 Sep 19
Strong deposit market share of 34.6% Cost of deposits reduced by 57 bps since Jan’18
bps
83 82 80 76 69
59 49
41 32
24 19
2Q18 1Q17 2Q17 4Q17 3Q17 1Q18 3Q18 4Q18 1Q19 2Q19 3Q19
-57 bps
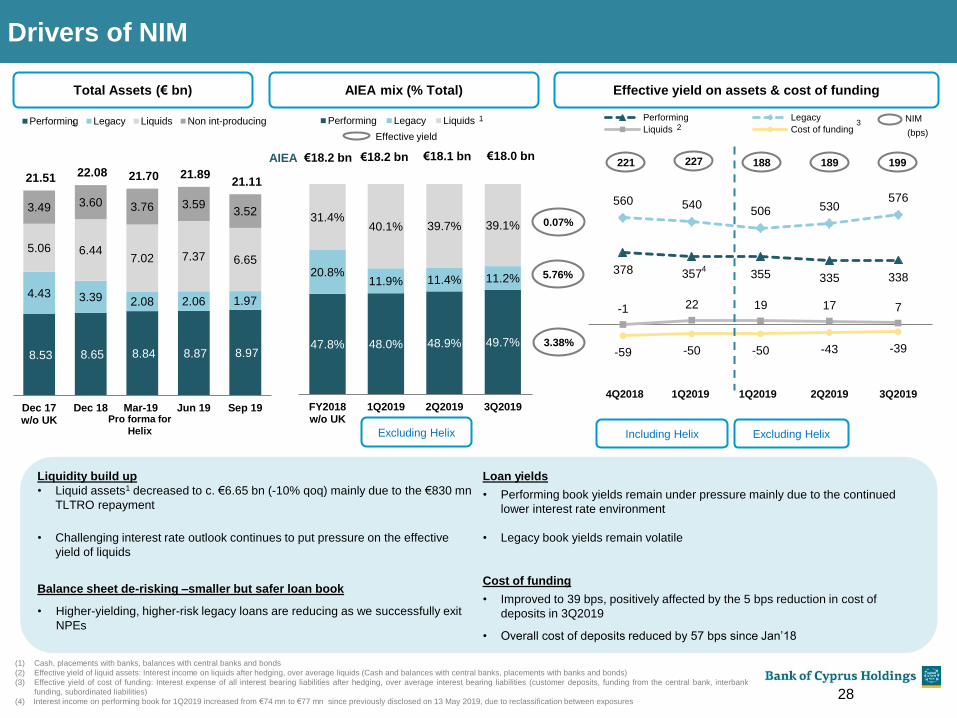
378 357 355 335 338
560 540 506 530
576
-1 22 19 17 7
-59 -50 -50 -43 -39
4Q2018 1Q2019 1Q2019 2Q2019 3Q2019
Performing Legacy
Liquids Cost of funding
221
47.8% 48.0% 48.9% 49.7%
20.8% 11.9% 11.4% 11.2%
31.4% 40.1% 39.7% 39.1%
FY2018w/o UK
1Q2019 2Q2019 3Q2019
Performing Legacy Liquids
€18.2 bn €18.2 bn €18.1 bn
Drivers of NIM
0.07%
5.76%
3.38%
Effective yield
Liquidity build up
• Liquid assets1 decreased to c. €6.65 bn (-10% qoq) mainly due to the €830 mn
TLTRO repayment
• Challenging interest rate outlook continues to put pressure on the effective
yield of liquids
Balance sheet de-risking –smaller but safer loan book
• Higher-yielding, higher-risk legacy loans are reducing as we successfully exit
NPEs
Loan yields
• Performing book yields remain under pressure mainly due to the continued
lower interest rate environment
• Legacy book yields remain volatile
Cost of funding
• Improved to 39 bps, positively affected by the 5 bps reduction in cost of
deposits in 3Q2019
• Overall cost of deposits reduced by 57 bps since Jan’18
8.53 8.65 8.84 8.87 8.97
4.43 3.39 2.08 2.06 1.97
5.06 6.44 7.02 7.37 6.65
3.49 3.60 3.76 3.59 3.52
21.51 22.08 21.70 21.89 21.11
Dec 17w/o UK
Dec 18 Mar-19 Jun 19 Sep 19
Performing Legacy Liquids Non int-producing NIM
AIEA
(bps)
28
Total Assets (€ bn) AIEA mix (% Total) Effective yield on assets & cost of funding
1 1
2 3
(1) Cash, placements with banks, balances with central banks and bonds
(2) Effective yield of liquid assets: Interest income on liquids after hedging, over average liquids (Cash and balances with central banks, placements with banks and bonds)
(3) Effective yield of cost of funding: Interest expense of all interest bearing liabilities after hedging, over average interest bearing liabilities (customer deposits, funding from the central bank, interbank
funding, subordinated liabilities)
(4) Interest income on performing book for 1Q2019 increased from €74 mn to €77 mn since previously disclosed on 13 May 2019, due to reclassification between exposures
189 €18.0 bn
188 227
Including Helix Excluding Helix
4
Pro forma for
Helix Excluding Helix
199

49
133
156
255
192
0
127
127
127
0
153
204
191
191
191
203
224
230
234
234
234
0
97
114
42 40 37 38 36
13 15 12
18 12
-6
3 4
12
10
16 24 18
24
14
65
82
71
92
72
3Q2018 4Q2018 1Q2019 2Q2019 3Q2019
Net FX gains/(losses) & Net gains/(losses) on other financial instruments, and other income
Gains/(losses) from revaluation and disposal of investment properties and on disposal of stock of properties
Insurance income net of insurance claims
Net fee and commission income
25%
Recurring income
28% 23% 22%
48
23%
% Net fee and commission
income % Total income
29
Non interest income of €72 mn in 3Q2019
Analysis of Non Interest Income (€ mn) – Quarterly
55 55 49
• Recurring income of €48 mn for 3Q2019, compared to €56 mn for 2Q2019, down 14% qoq mainly due to higher one-off insurance income in
2Q2019
• Net fee and commission income accounts for 23% of Total Income, compared to 22% the previous quarter
• Net gains2 decreased to €10 mn for 3Q2019, compared to €12 mn for 2Q2019; REMU profit remains volatile
• Net gains on financial instruments3 and other income of €14 mn for 3Q2019, compared to €24 mn in 2Q2019, affected mainly by one-off revaluation
gains on financial instruments in 2Q2019
• Following disposal of investment in associate CNP4, Group insurance arm remains well positioned for growth over medium term
(1) The interest income, non-interest income, staff costs, other operating expenses and loan credit losses related to Project Helix are disclosed under ‘Profit/(loss) relating to NPE sale (Helix)’ in
the underlying basis
(2) Gains/(losses) from revaluation and disposal of investment properties and on disposal of stock of properties
(3) Net FX gains/(losses) & Net gains/(losses) on other financial instruments, and other income
(4) In October 2019, the Group announced the successful completion of a Voluntary staff Exit Plan (VEP). https://www.bankofcyprus.com/globalassets/investor-relations/press-
releases/eng/20191031-vep_eng_final.pdf
56
Excluding Helix1
49
133
156
255
192
0
127
127
127
0
153
204
191
191
191
203
224
230
234
234
234
0
97
114
Total Expenses
30
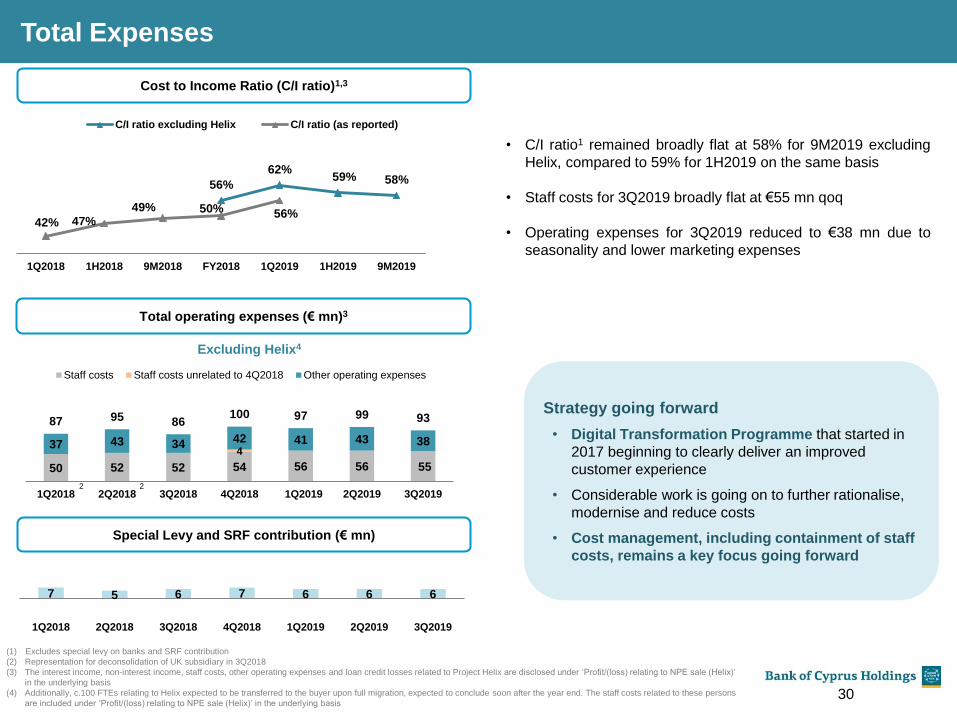
7 5 6 7 6 6 6
1Q2018 2Q2018 3Q2018 4Q2018 1Q2019 2Q2019 3Q2019
Cost to Income Ratio (C/I ratio)1,3
Total operating expenses (€ mn)3
Special Levy and SRF contribution (€ mn)
• C/I ratio1 remained broadly flat at 58% for 9M2019 excluding
Helix, compared to 59% for 1H2019 on the same basis
• Staff costs for 3Q2019 broadly flat at €55 mn qoq
• Operating expenses for 3Q2019 reduced to €38 mn due to
seasonality and lower marketing expenses
50 52 52 54 56 56 55
4 37 43 34 42 41 43 38
87 95 86 100 97 99 93
1Q2018 2Q2018 3Q2018 4Q2018 1Q2019 2Q2019 3Q2019
Staff costs Staff costs unrelated to 4Q2018 Other operating expenses
2 2
(1) Excludes special levy on banks and SRF contribution
(2) Representation for deconsolidation of UK subsidiary in 3Q2018
(3) The interest income, non-interest income, staff costs, other operating expenses and loan credit losses related to Project Helix are disclosed under ‘Profit/(loss) relating to NPE sale (Helix)’
in the underlying basis
(4) Additionally, c.100 FTEs relating to Helix expected to be transferred to the buyer upon full migration, expected to conclude soon after the year end. The staff costs related to these persons
are included under ‘Profit/(loss) relating to NPE sale (Helix)’ in the underlying basis
Strategy going forward
• Digital Transformation Programme that started in
2017 beginning to clearly deliver an improved
customer experience
• Considerable work is going on to further rationalise,
modernise and reduce costs
• Cost management, including containment of staff
costs, remains a key focus going forward
56%
62% 59% 58%
42% 47% 49% 50% 56%
1Q2018 1H2018 9M2018 FY2018 1Q2019 1H2019 9M2019
C/I ratio excluding Helix C/I ratio (as reported)
Excluding Helix4

49
133
156
255
192
0
127
127
127
0
153
204
191
191
191
203
224
230
234
234
234
0
97
114
Cost Management Actions Supported by Digital Transformation
31
11% reduction in FTEs following VEP completion
Branch footprint rationalisation continues
4,355 4,146 4,134
3,664
Sep-19 pro
forma for VEP
Dec-18 Sep-19 Dec-17
-11%
230
121
112 97 86
11 13
Dec-13 Dec-17
9
Dec-18 Dec-19 Sep-19
121 108 99
-11% -8%
Management remains focused on further
improvement in efficiency
• Successful completion of Voluntary Staff
Exit Plan (VEP) in 4Q2019 at one-off cost of
€79 mn
• Gross annual savings1 in staff costs of
13% (€28 mn)
• Staff reduced by ~470 FTEs or 11%
• Additionally, c.100 FTEs relating to Helix
expected to be transferred to the buyer upon full
migration, expected to conclude soon after the
year end
• The renewal of the collective agreement for
2019 is under discussion
• 13 branches closed (-11%) year to date
• Additional 9 branches (-8%) to be closed by the
end of the year
Overall 57% reduction in number of
branches since 2013
Cash offices Branches
(1) This gross annual saving does not include any impact from the renewal of the collective agreement for 2019 which remains under discussion.

€ mn (comparables adjusted for Helix) 9M2019 9M20181,2 3Q20191 2Q20191 qoq% yoy%
Net Interest Income 260 250 90 85 5% 4%
Non interest income 235 244 72 92 -22% -4%
Total income 495 494 162 177 -9% 0%
Total expenses (307) (286) (99) (105) -6% 7%
Operating profit 188 208 63 72 -13% -10%
Loan credit losses (117) (104) (30) (40) -26% 12%
(Impairments)/ reversal of impairments of other
financial and non-financial instruments (9) (12) 1 (9) -109% -21%
(Provisions)/ reversal of provisions for litigation,
regulatory and matters (3) (9) (6) 3 - -62%
Total loan credit losses, impairments and
provisions (129) (125) (35) (46) -27% 4%
Restructuring costs-Organic (21) (26) (9) (5) 99% -18%
Profit/ after tax-Organic 35 56 18 21 -15% -38%
Profit from discontinued operations (BOC UK) - 4 - - - -
Profit/ (loss) relating to NPE sale (Helix) 1 (105) 1 4 - -
Loss on remeasurement of investment in associate
classified as held for sale (CNP) net of share of profit
from associates (21) 8 (0) (23) - -
Reversal of impairment of DTA and impairment of
other tax receivables 101 - - - - -
Profit/ (loss) after tax-attributable to owners 116 (37) 19 2 - -
Net Interest margin (annualised) 1.92% 1.84% 1.99% 1.89% +10 bps +8 bps
Cost to income ratio 62% 58% 61% 59% +2 p.p. +4 p.p.
Cost-to-Income ratio adjusted for the
special levy and SRF contribution 58% 54% 57% 56% +1 p.p. +4 p.p.
Cost of Risk (annualised) 1.19% 1.00% 0.90% 1.23% -33 bps +19 bps
EPS – Organic (€ cent) 7.8 12.6 4.1 4.8 -0.7 -4.8
Income Statement
32
Key Highlights
(1) The interest income, non-interest income, staff costs, other operating expenses and loan credit losses related to Project Helix are disclosed under ‘Profit/(loss) relating to NPE sale (Helix)’ in the
underlying basis
(2) Including the impact from IFRIC Presentation of unrecognised interest following the curing of a credit-impaired financial asset (IFRS 9)). This resulted to a reclassification between net interest income
and loan credit losses, with no impact on the overall profitability
• NII increased to €90 mn in 3Q2019,
mainly helped by the further decrease
of the cost of deposits and the
increased interest cash collections not
previously recognised
• Non-Interest Income at €72 mn for
3Q2019, compared to €92 mn for
2Q2019 that was affected by higher
one-off insurance gains
• Total expenses for 3Q2019 at €99 mn
compared to €105 mn for 2Q2019 (ref
to slide 20) due to lower operating
expenses and staff costs
• Loan credit losses decreased to €30 mn
in 3Q2019, compared to €40 mn, in
2Q2019
• Restructuring costs of €9 mn for
3Q2019, reflecting the continued efforts
to accelerate de-risking
• Profit after tax of €19 mn for 3Q2019
• Profit after tax of €116 mn for
9M2019

49
133
156
255
192
0
127
127
127
0
153
204
191
191
191
203
224
230
234
234
234
0
97
114
33
CEO Priorities
• Maintain good capital position
• Fully committed to accelerate de-risking, organically and non-organically
• Focused on further improving efficiency to reflect our smaller revenue base,
supported by our on-going Digital Transformation Programme
Medium Term Guidance will be communicated with FY2019 FR
Creating a Stronger, Safer and future focused Bank

Credit Ratings:
Standard & Poor’s Global Ratings:
Long-term issuer credit rating: Affirmed at “B+” on 30 July 2019 (stable outlook)
Short-term issuer credit rating: Affirmed at “B” on 30 July 2019
Fitch Ratings:
Long-term Issuer Default Rating: Affirmed at “B-" on 21 March 2019 (positive outlook)
Short-term Issuer Default Rating: Affirmed at “B" on 21 March 2019
Viability Rating: Affirmed at “b-” on 21 March 2019
Moody’s Investors Service:
Baseline Credit Assessment: Affirmed at “caa1” on 24 January 2019
Short-term deposit rating: Affirmed at "Not Prime" on 14 June 2019
Long-term deposit rating: Affirmed to “B3” on 14 June 2019 (positive outlook)
Counterparty Risk Assessment: Affirmed at B1(cr) / Not-Prime (cr) on 14 June 2019
Listing:
LSE – BOCH, CSE – BOCH/ΤΡΚΗ, ISIN IE00BD5B1Y92
Visit our website at: www.bankofcyprus.com
Tel: +35722122239, Email: [email protected]
Annita Pavlou Investor Relations Manager, Tel: +357 22 122740, Email: [email protected]
Elena Hadjikyriacou ([email protected]), Marina Ioannou ([email protected])
Andri Rousou ([email protected]), Stephanie Koumera ([email protected])
Investor Relations
Contacts
Finance Director Eliza Livadiotou, Tel: +35722 122128, Email: [email protected]
Key Information and Contact Details
34

49
133
156
255
192
0
127
127
127
0
153
204
191
191
191
203
224
230
234
234
234
0
97
114
Appendix – Macroeconomic overview
35
49
133
156
255
192
0
127
127
127
0
153
204
191
191
191
203
224
230
234
234
234
0
97
114
3.3 3.1 3.0
3.8 3.5
3.2
-10.0
-8.0
-6.0
-4.0
-2.0
0.0
2.0
4.0
6.0
8.0
2011 2012 2013 2014 2015 2016 2017 2018 3Q2019
Real GDP Quarterly SA % change y-o-y Real GDP SA annualised % change y-o-y
398
360
411
7.5 7.3
340
360
380
400
420
440
460
0.0
2.0
4.0
6.0
8.0
10.0
12.0
14.0
16.0
18.0
20
09
Q4
20
10
Q2
20
10
Q4
20
11
Q2
20
11
Q4
20
12
Q2
20
12
Q4
20
13
Q2
20
13
Q4
20
14
Q2
20
14
Q4
20
15
Q2
20
15
Q4
20
16
Q2
20
16
Q4
20
17
Q2
20
17
Q4
20
18
Q2
20
18
Q4
20
19
Q2
Employment in 000s (4Q average NSA (RHS) Unemployment rate SA (%)4
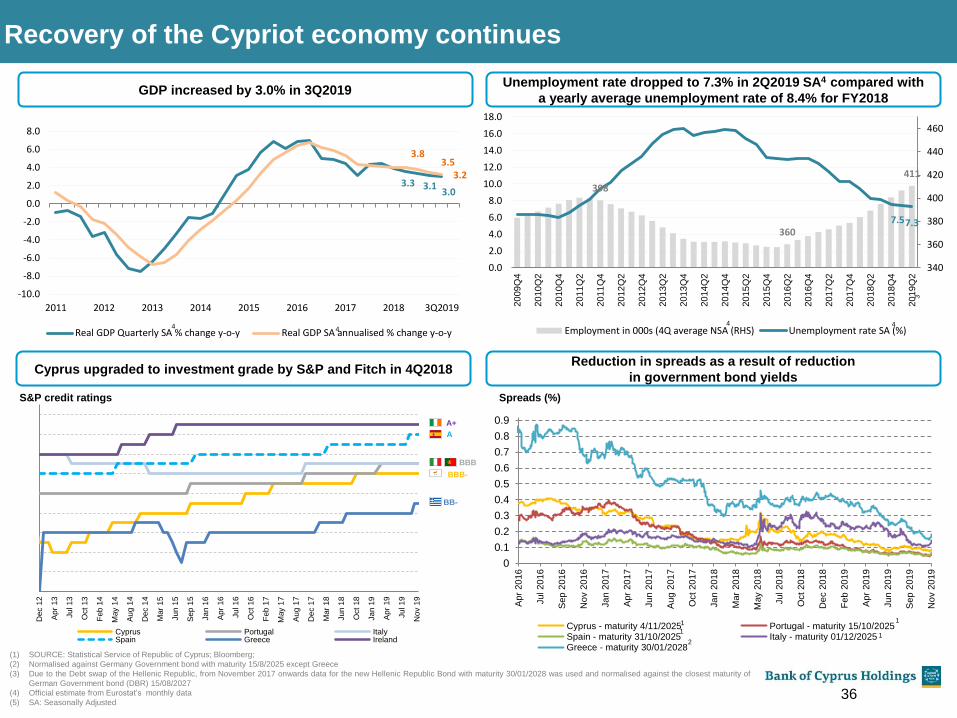
(1) SOURCE: Statistical Service of Republic of Cyprus; Bloomberg;
(2) Normalised against Germany Government bond with maturity 15/8/2025 except Greece
(3) Due to the Debt swap of the Hellenic Republic, from November 2017 onwards data for the new Hellenic Republic Bond with maturity 30/01/2028 was used and normalised against the closest maturity of
German Government bond (DBR) 15/08/2027
(4) Official estimate from Eurostat’s monthly data
(5) SA: Seasonally Adjusted 36
Recovery of the Cypriot economy continues
S&P credit ratings Spreads (%)
Cyprus upgraded to investment grade by S&P and Fitch in 4Q2018 Reduction in spreads as a result of reduction
in government bond yields
A+
Dec 1
2
Ap
r 13
Ju
l 1
3
Oct
13
Feb
14
May 1
4
Au
g 1
4
Dec 1
4
Mar
15
Ju
n 1
5
Se
p 1
5
Ja
n 1
6
Ap
r 16
Ju
l 1
6
Oct
16
Feb
17
May 1
7
Au
g 1
7
Dec 1
7
Mar
18
Ju
n 1
8
Oct
18
Ja
n 1
9
Ap
r 19
Ju
l 1
9
Nov 1
9
Cyprus Portugal ItalySpain Greece Ireland
A
BBB
BBB-
BB-
0
0.1
0.2
0.3
0.4
0.5
0.6
0.7
0.8
0.9
Apr
20
16
Ju
l 20
16
Sep
2016
No
v 2
016
Ja
n 2
01
7
Apr
20
17
Ju
n 2
01
7
Aug
2017
Oct 20
17
Ja
n 2
01
8
Mar
20
18
May 2
01
8
Ju
l 20
18
Oct 20
18
De
c 2
018
Feb
20
19
Apr
20
19
Ju
n 2
01
9
Sep
2019
No
v 2
019
Cyprus - maturity 4/11/2025 Portugal - maturity 15/10/2025Spain - maturity 31/10/2025 Italy - maturity 01/12/2025Greece - maturity 30/01/2028
1 1
1 1
2
GDP increased by 3.0% in 3Q2019 Unemployment rate dropped to 7.3% in 2Q2019 SA4 compared with
a yearly average unemployment rate of 8.4% for FY2018
4 4 4
3

49
133
156
255
192
0
127
127
127
0
153
204
191
191
191
203
224
230
234
234
234
0
97
114
Economic activity has been broadly based with main
drivers tourism and construction
37
… driven by tourism, professional services and construction activity
33.0%
30.0%
29.0%
25.0%
24.0%
21.0%
19.0%
12.5%
12.5%
Corporate tax rate (2018)
Double taxation
avoidance
treaties with more
than 60 countries
38.9%
38.9%
22.2%
Upper secondary
Less than
Upper secondary
Tertiary
Level of education 2018, age 15-64
Cyprus has the highest number of
university graduates in the population
in the EU after the UK and Ireland
Tourism arrivals (mn) Tourism: % changes yoy
Support from key business enablers
SOURCES; Statistical Service of Republic of Cyprus, Eurostat; Calculations by BOC Economic Research
2.4 2.5 2.4 2.4 2.7
3.2
3.7
3.9
3.2 3.3
Construction activity – strong recovery in 2017-19; building permits
spiked in Apr-June 2019 driven by luxury hotels
19.8
14.6
7.8
0.6
11.9 11.7
2.7
-1.7
2016 2017 2018 2019 Sep YTD(Aug forreceipts)
Total arrivals (% change) Total receipts (% change)
19.3 15.5 13.3
25.8
15.2 16.6
67.9
27.1 41.9
-21.9
12.7
92.0
-40.0
-20.0
0.0
20.0
40.0
60.0
80.0
100.0
% changes year-on-year
Production index in construction Building permits volume
1.2 0.0 0.4 0.2
1.0
1.0 1.5
1.1
1.6
1.6 1.1
0.5
1.5
1.0 0.2
0.7
-0.8 -0.5 -0.4 -0.5
0.6
0.4 0.6
0.5
0.4
0.6 0.5
0.4
6.7
4.4 4.1
3.3
Arts & Oher
Public, Edu. & Health
Prof. & Admin
Real Est.
Financial
Information
Trade, Tran. & Tour.
Construction
Agric. & Industry
GVA
49
133
156
255
192
0
127
127
127
0
153
204
191
191
191
203
224
230
234
234
234
0
97
114
Appendix – Additional asset quality slides
38
As from 1 January 2018 and following IFRS 9 implementation, the Bank’s disclosure in relation to the loan portfolio quality is based on Non Performing
Exposures (NPEs), in line with the EBA standards and ECB NPEs Guidance to the banks. Exposures that meet the NPE definition are considered to be
in default and hence credit-impaired and are classified in Stage 3 under IFRS 9 staging classification. Such loans are also considered to be in default for
credit risk management purposes.
49
133
156
255
192
0
127
127
127
0
153
204
191
191
191
203
224
230
234
234
234
0
97
114
Foreclosure
Law
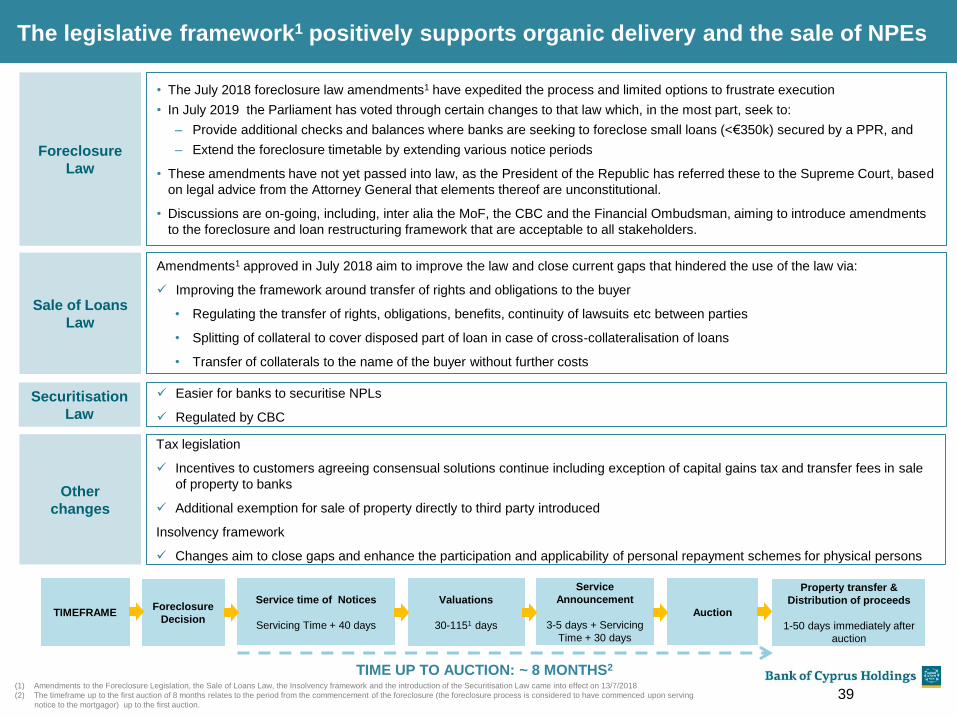
• The July 2018 foreclosure law amendments1 have expedited the process and limited options to frustrate execution
• In July 2019 the Parliament has voted through certain changes to that law which, in the most part, seek to:
– Provide additional checks and balances where banks are seeking to foreclose small loans (<€350k) secured by a PPR, and
– Extend the foreclosure timetable by extending various notice periods
• These amendments have not yet passed into law, as the President of the Republic has referred these to the Supreme Court, based
on legal advice from the Attorney General that elements thereof are unconstitutional.
• Discussions are on-going, including, inter alia the MoF, the CBC and the Financial Ombudsman, aiming to introduce amendments
to the foreclosure and loan restructuring framework that are acceptable to all stakeholders.
Sale of Loans
Law
Amendments1 approved in July 2018 aim to improve the law and close current gaps that hindered the use of the law via:
Improving the framework around transfer of rights and obligations to the buyer
• Regulating the transfer of rights, obligations, benefits, continuity of lawsuits etc between parties
• Splitting of collateral to cover disposed part of loan in case of cross-collateralisation of loans
• Transfer of collaterals to the name of the buyer without further costs
Other
changes
Tax legislation
Incentives to customers agreeing consensual solutions continue including exception of capital gains tax and transfer fees in sale
of property to banks
Additional exemption for sale of property directly to third party introduced
Insolvency framework
Changes aim to close gaps and enhance the participation and applicability of personal repayment schemes for physical persons
Securitisation
Law
Easier for banks to securitise NPLs
Regulated by CBC
Service time of Notices
Servicing Time + 40 days
Auction
Property transfer &
Distribution of proceeds
1-50 days immediately after
auction
TIMEFRAME
Valuations
30-1151 days
TIME UP TO AUCTION: ~ 8 MONTHS2
Foreclosure
Decision
Service
Announcement
3-5 days + Servicing
Time + 30 days
The legislative framework1 positively supports organic delivery and the sale of NPEs
(1) Amendments to the Foreclosure Legislation, the Sale of Loans Law, the Insolvency framework and the introduction of the Securitisation Law came into effect on 13/7/2018
(2) The timeframe up to the first auction of 8 months relates to the period from the commencement of the foreclosure (the foreclosure process is considered to have commenced upon serving
notice to the mortgagor) up to the first auction. 39
49
133
156
255
192
0
127
127
127
0
153
204
191
191
191
203
224
230
234
234
234
0
97
114
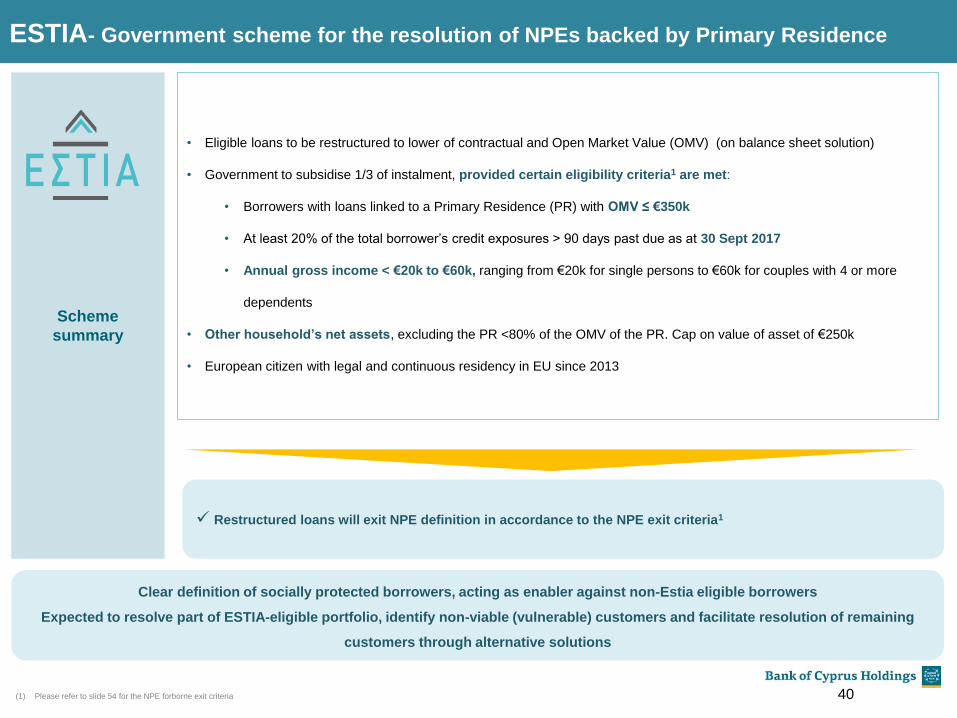
ESTIA- Government scheme for the resolution of NPEs backed by Primary Residence
• Eligible loans to be restructured to lower of contractual and Open Market Value (OMV) (on balance sheet solution)
• Government to subsidise 1/3 of instalment, provided certain eligibility criteria1 are met:
• Borrowers with loans linked to a Primary Residence (PR) with OMV ≤ €350k
• At least 20% of the total borrower’s credit exposures > 90 days past due as at 30 Sept 2017
• Annual gross income < €20k to €60k, ranging from €20k for single persons to €60k for couples with 4 or more
dependents
• Other household’s net assets, excluding the PR <80% of the OMV of the PR. Cap on value of asset of €250k
• European citizen with legal and continuous residency in EU since 2013
Scheme
summary
(1) Please refer to slide 54 for the NPE forborne exit criteria 40
Restructured loans will exit NPE definition in accordance to the NPE exit criteria1
Clear definition of socially protected borrowers, acting as enabler against non-Estia eligible borrowers
Expected to resolve part of ESTIA-eligible portfolio, identify non-viable (vulnerable) customers and facilitate resolution of remaining
customers through alternative solutions
49
133
156
255
192
0
127
127
127
0
153
204
191
191
191
203
224
230
234
234
234
0
97
114
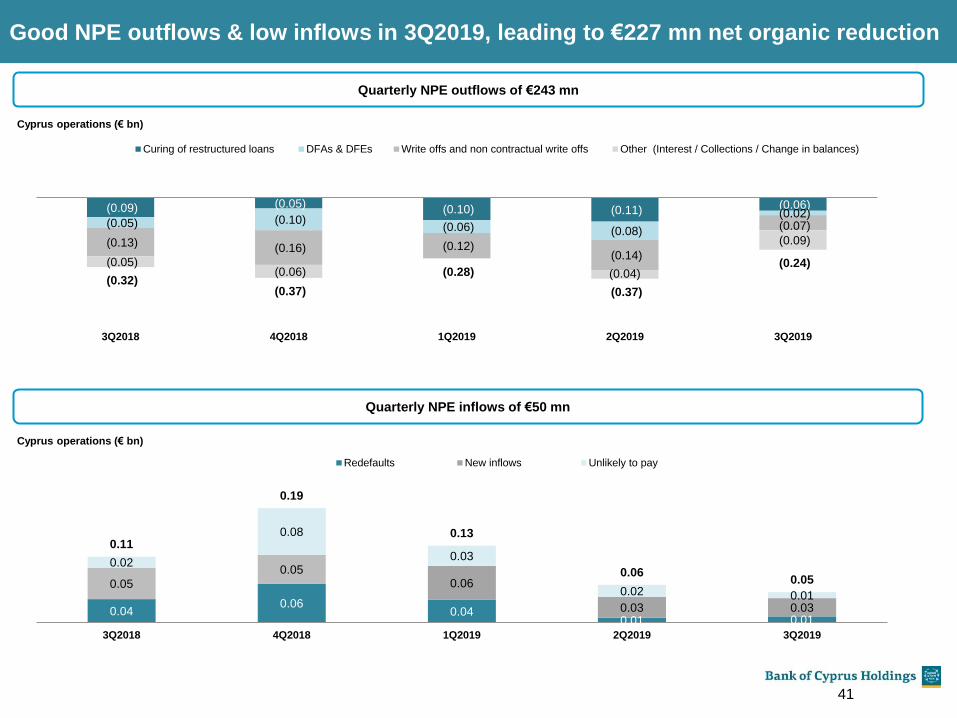
0.04 0.06
0.04 0.01 0.01
0.05
0.05 0.06
0.03 0.03
0.02
0.08
0.03
0.02 0.01
0.11
0.19
0.13
0.06 0.05
3Q2018 4Q2018 1Q2019 2Q2019 3Q2019
Redefaults New inflows Unlikely to pay
(0.09) (0.05) (0.10) (0.11) (0.06)
(0.05) (0.10) (0.06) (0.08)
(0.02)
(0.13) (0.16) (0.12) (0.14)
(0.07)
(0.05) (0.06) (0.04)
(0.09)
(0.32) (0.37)
(0.28)
(0.37)
(0.24)
3Q2018 4Q2018 1Q2019 2Q2019 3Q2019
Curing of restructured loans DFAs & DFEs Write offs and non contractual write offs Other (Interest / Collections / Change in balances)
41
Good NPE outflows & low inflows in 3Q2019, leading to €227 mn net organic reduction
Cyprus operations (€ bn)
Quarterly NPE outflows of €243 mn
Quarterly NPE inflows of €50 mn
Cyprus operations (€ bn)

49
133
156
255
192
0
127
127
127
0
153
204
191
191
191
203
224
230
234
234
234
0
97
114
92%
70%
67%
86%
44%
64%
69%
65%
100%
62%
66%
75%
100%
74%
65%
81%
60%
82%
70%
72%
71%
58%
70%
68%
90%
86%
81%
85%
98%
92%
84%
88%
100%
72%
87%
90%
0%
20%
40%
60%
80%
100%
1 2 3 4
2Q2017 3Q2017 4Q2017 1Q2018 2Q2018 3Q2018 4Q2018 1Q2019 2Q2019
72% 71% 80%
Weighted Avg since Apr-17
0.27 0.16 0.13 0.11 0.10 0.12 0.06
0.40
0.29
0.13 0.16 0.12 0.14 0.07
0.12
0.07
0.05 0.10 0.06
0.08
0.02
0.79
0.52
0.31 0.37
0.28 0.34
0.15
1Q2018 2Q2018 3Q2018 4Q2018 1Q2019 2Q2019 3Q2019
Restructured loans Write offs & non contractual write offs DFAs
(1) Write offs in 1Q2018 include a net impact of (c.€11 mn) of IFRS 9 grossing up and set offs
(2) Excluding write offs & non contractual write offs and DFAs and terminated accounts
(3) The performance of loans restructured during 3Q2019 is not presented in this graph as it is too early to assess
Restructuring efforts continue; re-default levels stable
42
Corporate SMEs Retail Total Bank – Cyprus
Quarterly evolution of restructuring activity (€ bn) (Cy operations)
Cohort analysis of restructured 2,3 loans; 80% of restructured loans present no arrears
1
NO ARREARS
92%
49
133
156
255
192
0
127
127
127
0
153
204
191
191
191
203
224
230
234
234
234
0
97
114
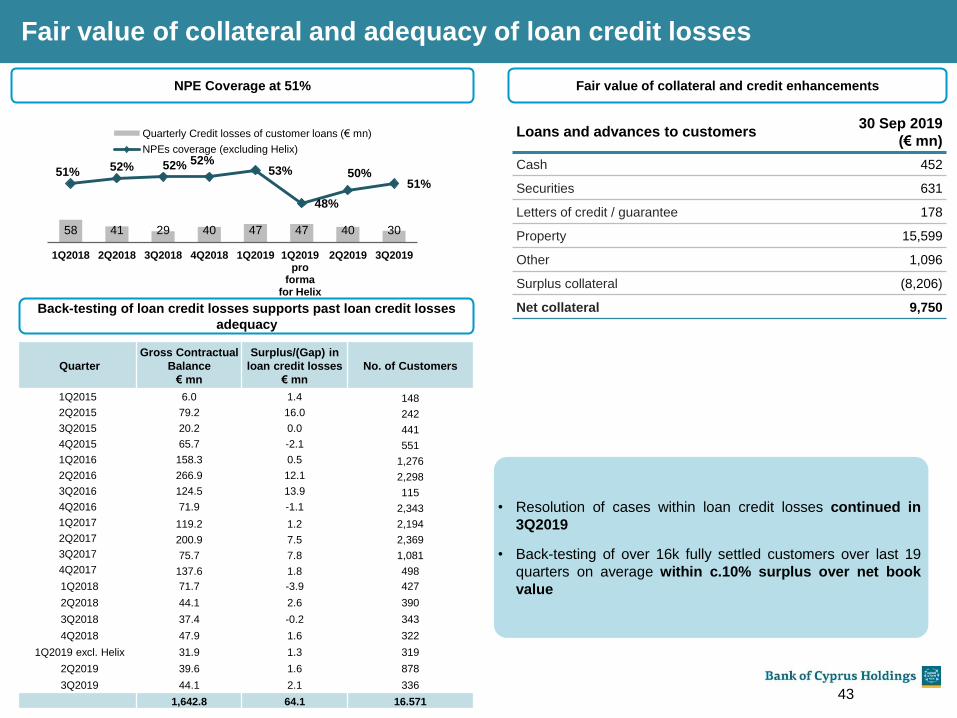
Fair value of collateral and adequacy of loan credit losses
43
Quarter
Gross Contractual
Balance
€ mn
Surplus/(Gap) in
loan credit losses
€ mn
No. of Customers
1Q2015 6.0 1.4 148
2Q2015 79.2 16.0 242
3Q2015 20.2 0.0 441
4Q2015 65.7 -2.1 551
1Q2016 158.3 0.5 1,276
2Q2016 266.9 12.1 2,298
3Q2016 124.5 13.9 115
4Q2016 71.9 -1.1 2,343
1Q2017 119.2 1.2 2,194
2Q2017 200.9 7.5 2,369
3Q2017 75.7 7.8 1,081
4Q2017 137.6 1.8 498
1Q2018 71.7 -3.9 427
2Q2018 44.1 2.6 390
3Q2018 37.4 -0.2 343
4Q2018 47.9 1.6 322
1Q2019 excl. Helix 31.9 1.3 319
2Q2019 39.6 1.6 878
3Q2019 44.1 2.1 336
1,642.8 64.1 16.571
• Resolution of cases within loan credit losses continued in
3Q2019
• Back-testing of over 16k fully settled customers over last 19
quarters on average within c.10% surplus over net book
value
Back-testing of loan credit losses supports past loan credit losses
adequacy
NPE Coverage at 51%
Loans and advances to customers 30 Sep 2019
(€ mn)
Cash 452
Securities 631
Letters of credit / guarantee 178
Property 15,599
Other 1,096
Surplus collateral (8,206)
Net collateral 9,750
Fair value of collateral and credit enhancements
58 41 29 40 47 47 40 30
51% 52% 52% 52% 53%
48%
50% 51%
42%
47%
52%
1Q2018 2Q2018 3Q2018 4Q2018 1Q2019 1Q2019pro
formafor Helix
2Q2019 3Q2019
Quarterly Credit losses of customer loans (€ mn)
NPEs coverage (excluding Helix)

49
133
156
255
192
0
127
127
127
0
153
204
191
191
191
203
224
230
234
234
234
0
97
114
Terminated Retail 1.54
Retail 0.90
Terminated SMEs 0.55
SME 0.31
Terminated Corporate
0.12
Corporate 0.57
Sep 192.44
2.48
2.50
2.55
2.47
(0.06)
0.02
(0.05)
0.03
(0.05)
0.08
Sep 19
Exits
Inflows
Jun 19
Exits
Inflows
Mar 19 pro forma
Helix
Mar 19
Inflows
Dec 18
0.86
0.94
1.08
1.64
1.75
(0.09)
0.01
(0.15)
0.01
(0.56)
(0.12)
0.01
Sep 19
Exits
Inflows
Jun 19
Exits
Inflows
Mar 19 pro forma
Helix
Mar 19
Exits
Inflows
Dec 18
€0.69 bn
€0.86 bn
€2.44 bn
NPE ratio
0.69
0.77
0.90
2.89
3.01
(0.10)
0.02
( 0.15)
0.02
(1,99)
(0.16)
0.04
Sep 19
Exits
Inflows
Jun 19
Exits
Inflows
Mar 19 pro forma
Helix
Mar 2019
Exits
Inflows
Dec 18
14%
NPE ratio 41%
Corporate
SME
Retail
NPE coverage 51%
58%
NPE coverage
Continuous progress across all segments (Cy operations)
NPE total
coverage 105%
NPE total
coverage 122%
Focus shifts to Retail and SME after intense Corporate attention
41%
44
Sep 2019
NPE ratio 42%
NPE coverage 56%
NPE total
coverage 123%
Sep 2019
Sep 2019
NPEs (Cy) €3.99 bn

49
133
156
255
192
0
127
127
127
0
153
204
191
191
191
203
224
230
234
234
234
0
97
114
5.00 3.99 3.19 3.07
1.02 0.88 0.77
2.99
2.02 1.76 1.65
1.09 0.95 0.87
1.77
1.57 1.49 1.50
1.50 1.45 1.41
1.27
1.22
0.98 1.05
1.00 1.03 1.03
11.03
8.80 7.42 7.27
4.61 4.31 4.08
Dec-16 Dec-17 Dec-18 Mar-19 Mar-19pro forma Helix
Jun-19 Sep-19
Retail Other Retail Housing SMEs Corporate
Gross loans & NPEs by Customer Type
9.47 9.01 7.06 7.07 4.96 5.00 5.03
4.35 3.51 2.98 2.88
2.30 2.15 2.06
4.22 4.17
4.07 4.07
4.07 4.07 4.07
2.09 2.06
1.79 1.86
1.82 1.85 1.88
20.13 18.75
15.90 15.88 13.15 13.07 13.04
Dec-16 Dec-17 Dec-18 Mar-19 Mar-19pro-forma for Helix
Jun-19 Sep-19
Retail other Retail Housing SMEs Corporate
45
Gross loans by customer type (€ bn)
NPEs by customer type (€ bn)
1
1
(1) Reporting as at 31 December 2017 includes transfers within RRD business lines following an internal reorganisation of RRD in 4Q2017
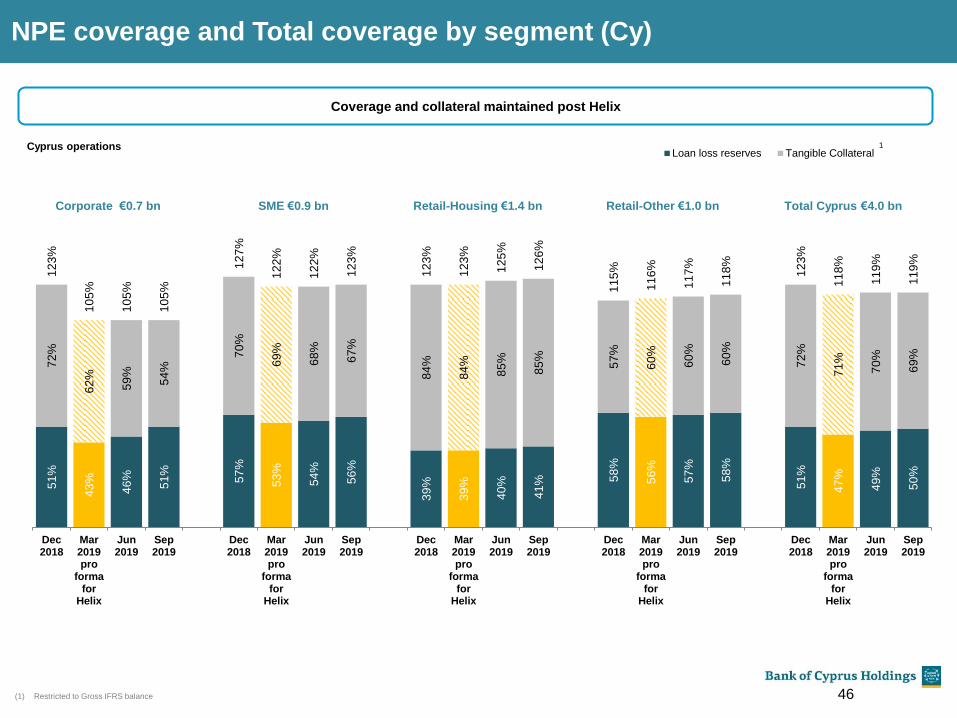
49
133
156
255
192
0
127
127
127
0
153
204
191
191
191
203
224
230
234
234
234
0
97
114
51
%
43
%
46
%
51
%
57
%
53
%
54
%
56
%
39
%
39
%
40
%
41
%
58
%
56
%
57
%
58
%
51
%
47
%
49
%
50
%
72
%
62
%
59
%
54
% 7
0%
69
%
68
%
67
%
84
%
84
%
85
%
85
%
57
%
60
%
60
%
60
%
72
%
71
%
70
%
69
%
12
3%
10
5%
10
5%
10
5%
12
7%
12
2%
12
2%
12
3%
12
3%
12
3%
12
5%
12
6%
11
5%
11
6%
11
7%
11
8%
12
3%
11
8%
11
9%
11
9%
Dec2018
Mar2019pro
formafor
Helix
Jun2019
Sep2019
Dec2018
Mar2019pro
formafor
Helix
Jun2019
Sep2019
Dec2018
Mar2019pro
formafor
Helix
Jun2019
Sep2019
Dec2018
Mar2019pro
formafor
Helix
Jun2019
Sep2019
Dec2018
Mar2019pro
formafor
Helix
Jun2019
Sep2019
Loan loss reserves Tangible Collateral
NPE coverage and Total coverage by segment (Cy)
46
Coverage and collateral maintained post Helix
1 Cyprus operations
(1) Restricted to Gross IFRS balance
Total Cyprus €4.0 bn Corporate €0.7 bn SME €0.9 bn Retail-Housing €1.4 bn Retail-Other €1.0 bn

49
133
156
255
192
0
127
127
127
0
153
204
191
191
191
203
224
230
234
234
234
0
97
114
Asset Quality- NPEs analysis
(€ mn) Sep-19 Jun-19 Mar-19 Dec-18 Sep-18
A. Gross Loans after Fair value on Initial recognition 12,757 12,782 15,437 15,438 15,721
Fair value on Initial recognition 278 290 445 462 480
B. Gross Loans 13,035 13,072 15,882 15,900 16,201
B1. Loans with no arrears 8,794 8,565 8,402 8,260 8,330
B2. Loans with arrears but not NPEs 156 195 207 221 249
1-30 DPD 119 150 138 166 184
31-90 DPD 37 45 69 55 65
B3. NPEs 4,085 4,312 7,273 7,419 7,622
With no arrears 802 949 1,356 1,482 1,615
Up to 30 DPD 69 89 108 136 117
31-90 DPD 86 125 183 231 179
91-180 DPD 159 149 240 178 236
181-365 DPD 251 225 316 393 347
Over 1 year DPD 2,718 2,775 5,070 4,999 5,128
NPE ratio (NPEs / Gross Loans) 31% 33% 46% 47% 47%
Allowance for expected loan credit losses (including fair value
adjustment on initial recognition1) 2,086 2,145 3,846 3,852 3,993
Gross loans coverage 16% 16% 24% 24% 25%
NPEs coverage 51% 50% 53% 52% 52%
47 (1) Comprise (i) loan credit losses for impairment of customer loans and advances, (ii) the fair value adjustment on initial recognition of loans acquired from Laiki Bank and on loans classified at FVPL, and
(iii) loan credit losses on off-balance sheet exposures disclosed on the balance sheet within other liabilities

49
133
156
255
192
0
127
127
127
0
153
204
191
191
191
203
224
230
234
234
234
0
97
114
45
%
53
%
32
%
76
%
33
% 45
%
52
%
51
%
49
%
52
%
28
%
68
%
53
%
43
%
46
%
34
% 47
%
51
%
26
%
69
%
49
%
43
%
44
%
34
%
34
%
32
%
9%
38
%
27
% 39
%
33
%
17
% 3
2%
29
%
8%
36
%
24
% 3
8%
32
%
17
%
Trade Manufacturing Hotels and Catering Construction Real estate Private individuals Professional andother services
Other sectors
31.12.17 31.12.18 31.03.19 30.06.19 30.09.2019
Analysis of gross loans and NPE ratio by Economic Activity
48
2.0
4
0.6
6
1.3
9
2.3
4
3.2
0
6.7
7
1.3
1
1.0
4
1.8
5
0.6
4
1.2
7
1.9
5
1.6
1
6.4
7
1.2
0
0.9
1
1.8
3
0.6
6
1.3
5
1.9
0
1.5
9
6.4
1
1.2
5
0.9
1
1.4
6
0.4
5
1.0
8
0.9
0
1.2
6
6.1
3
1.0
7
0.7
2
1.4
1
0.4
7
1.0
8
0.8
9
1.2
9
6.1
0
1.0
4
0.7
6
Trade Manufacturing Hotels & Restaurant Construction Real Estate Private Individuals Professional andother services
Other sectors
31.12.17 31.12.18 31.03.19 30.06.19 30.09.19
10% 11% 47% 8% 6%
% of total
7% 8% 3%
Gross loans by economic activity (€ bn)
NPE ratio by economic activity
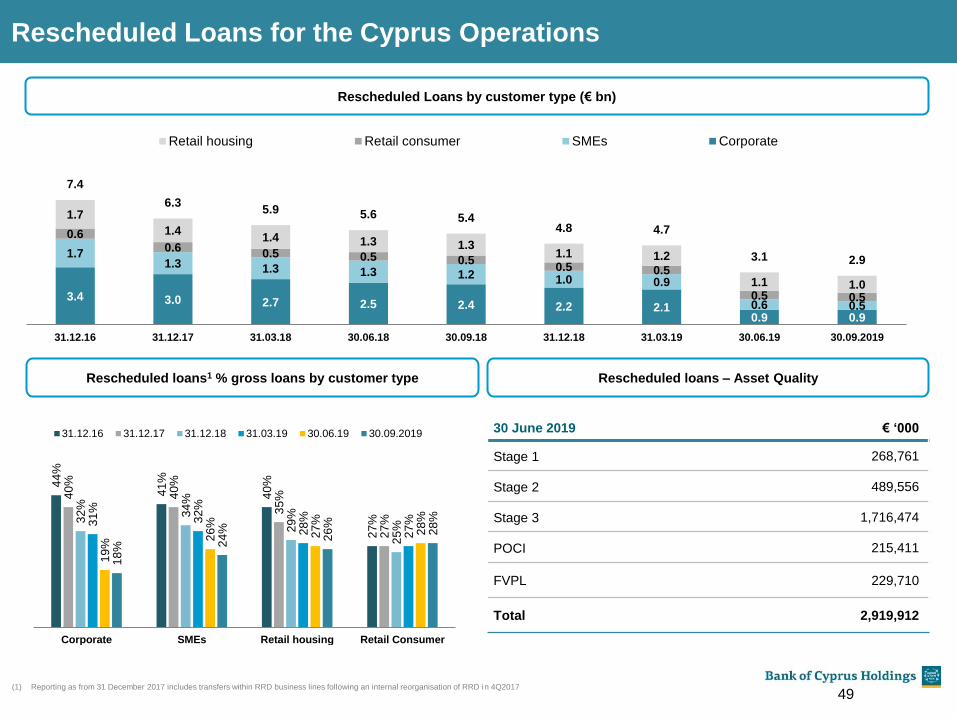
49
133
156
255
192
0
127
127
127
0
153
204
191
191
191
203
224
230
234
234
234
0
97
114
Rescheduled Loans for the Cyprus Operations
3.4 3.0 2.7 2.5 2.4 2.2 2.1 0.9 0.9
1.7 1.3 1.3 1.3 1.2 1.0 0.9
0.6 0.5
0.6 0.6
0.5 0.5 0.5 0.5 0.5
0.5 0.5
1.7
1.4 1.4 1.3 1.3
1.1 1.2
1.1 1.0
7.4
6.3 5.9 5.6 5.4
4.8 4.7
3.1 2.9
31.12.16 31.12.17 31.03.18 30.06.18 30.09.18 31.12.18 31.03.19 30.06.19 30.09.2019
Retail housing Retail consumer SMEs Corporate
44
%
41
%
40
%
27
%
40
%
40
%
35
%
27
%
32
%
34
%
29
%
25
%
31
%
32
%
28
%
27
%
19
% 26
%
27
%
28
%
18
%
24
%
26
%
28
%
Corporate SMEs Retail housing Retail Consumer
31.12.16 31.12.17 31.12.18 31.03.19 30.06.19 30.09.2019
49
Rescheduled Loans by customer type (€ bn)
Rescheduled loans1 % gross loans by customer type Rescheduled loans – Asset Quality
30 June 2019 € ‘000
Stage 1 268,761
Stage 2 489,556
Stage 3 1,716,474
POCI 215,411
FVPL 229,710
Total 2,919,912
(1) Reporting as from 31 December 2017 includes transfers within RRD business lines following an internal reorganisation of RRD in 4Q2017

49
133
156
255
192
0
127
127
127
0
153
204
191
191
191
203
224
230
234
234
234
0
97
114
Gross loans and allowance for expected loan credit losses by IFRS 9 stage
50 (1) Includes purchased or originated credit-impaired
Gross Loans (€ bn) 30 Sep 2019 30 Jun 2019 qoq %
Stage 1 6.26 6.02 4%
Stage 21 2.70 2.74 -2%
Stage 31 4.08 4.31 -5%
Total 13.04 13.07 0%
Allowance for
expected loan credit
losses (€ bn)
30 Sep 2019 30 Jun 2019 qoq %
Stage 1 0.08 0.08 6%
Stage 21 0.07 0.08 -14%
Stage 31 1.94 1.98 -3%
Total 2.09 2.14 -3%
• Increase in Stage 1 loans by c. €240 mn in
3Q2019, attributable mainly to:
• High quality of new lending
• Loan migration from Stage 2 to
Stage 1
• Net reduction of Stage 3 loans by €227
mn in 3Q2019

49
133
156
255
192
0
127
127
127
0
153
204
191
191
191
203
224
230
234
234
234
0
97
114
SOURCE: Central Bank of Cyprus, Cyprus Land Registry
1) In addition to assets held by REMU, properties classified as ‘Investment properties’ with carrying value of €24 mn as at 30 September relate to legacy properties
REMU – the engine for dealing with foreclosed assets
51
55
71
28
42
30
62 67
1Q2018 2Q2018 3Q2018 4Q2018 1Q2019 2Q2019 3Q2019
Book Value Sales of €67 mn for the 3Q2019 (Group)
Encouraging trends in Real Estate Market; Property prices up 2.7%
in 1Q2019
4306
3430 4,527 4,952
7,063
8,734 9,242
7,736
02,0004,0006,0008,000
10,00012,00014,00016,00018,00020,00022,00024,000
20
04
20
05
20
06
20
07
20
08
20
09
20
10
20
11
20
12
20
13
20
14
20
15
20
16
20
17
20
18
20
19
Ja
n-S
ep
Sales to Cypriots Sales to Non-Cypriots
Sales contracts – Excluding DFAs
(number of contracts)
75.6 77.2
1.5
2.7
-12.0
-10.0
-8.0
-6.0
-4.0
-2.0
0.0
2.0
4.0
30.0
40.0
50.0
60.0
70.0
80.0
90.0
100.0
110.0
120.0Central Bank Residential Property Price index
Residential Propert Price index (2010Q1=100) % change y-o-y (RHS)
Sale contracts (excl. DFAs) in 2019 Jan-Sep up 15% yoy
BV (€ mn) BV (€ mn)
REMU focus now on sales (Group)
1,427 1,399
103
159
114
Sales Properties
managed by
REMU as at
01 Jan 2019
Additions
(159)
(12)
Impairment
loss
(5)
Transfer to
non-current
assets and
disposal
groups held
for sale
Properties
managed by
REMU as at
30 Sep 2019
1,530 1,513
Investment Properties
1 1
49
133
156
255
192
0
127
127
127
0
153
204
191
191
191
203
224
230
234
234
234
0
97
114
Appendix – Additional financial information
52
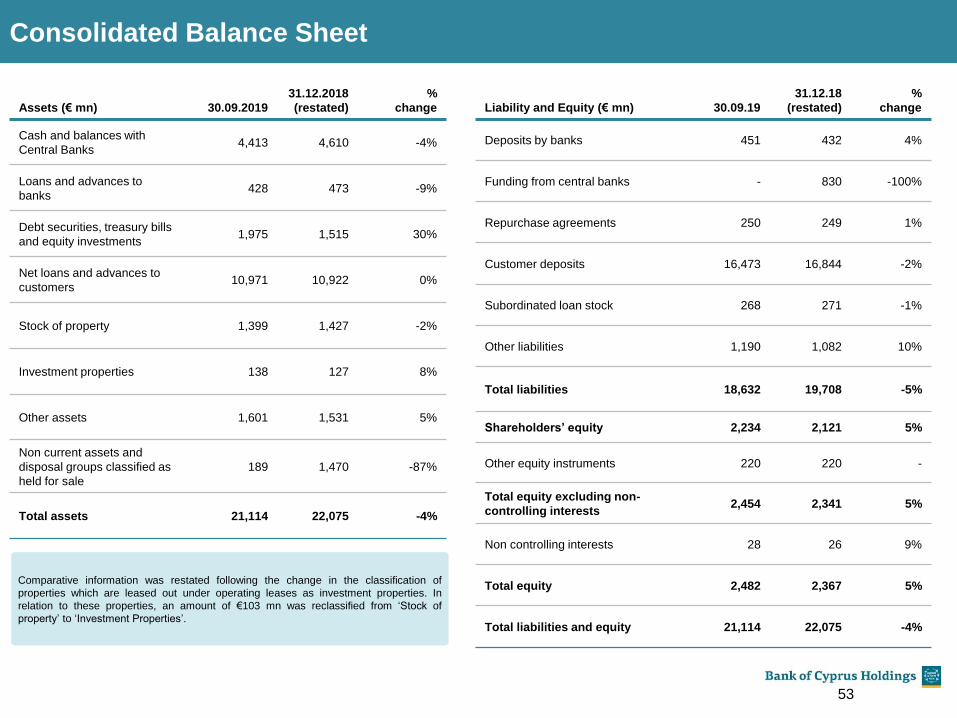
49
133
156
255
192
0
127
127
127
0
153
204
191
191
191
203
224
230
234
234
234
0
97
114
Assets (€ mn) 30.09.2019
31.12.2018
(restated)
%
change
Cash and balances with
Central Banks 4,413 4,610 -4%
Loans and advances to
banks 428 473 -9%
Debt securities, treasury bills
and equity investments 1,975 1,515 30%
Net loans and advances to
customers 10,971 10,922 0%
Stock of property 1,399 1,427 -2%
Investment properties 138 127 8%
Other assets 1,601 1,531 5%
Non current assets and
disposal groups classified as
held for sale
189 1,470 -87%
Total assets 21,114 22,075 -4%
Liability and Equity (€ mn) 30.09.19
31.12.18
(restated)
%
change
Deposits by banks 451 432 4%
Funding from central banks - 830 -100%
Repurchase agreements 250 249 1%
Customer deposits 16,473 16,844 -2%
Subordinated loan stock 268 271 -1%
Other liabilities 1,190 1,082 10%
Total liabilities 18,632 19,708 -5%
Shareholders’ equity 2,234 2,121 5%
Other equity instruments 220 220 -
Total equity excluding non-
controlling interests 2,454 2,341 5%
Non controlling interests 28 26 9%
Total equity 2,482 2,367 5%
Total liabilities and equity 21,114 22,075 -4%
Consolidated Balance Sheet
53
Comparative information was restated following the change in the classification of
properties which are leased out under operating leases as investment properties. In
relation to these properties, an amount of €103 mn was reclassified from ‘Stock of
property’ to ‘Investment Properties’.

49
133
156
255
192
0
127
127
127
0
153
204
191
191
191
203
224
230
234
234
234
0
97
114
37.5% 37.1% 38.6%
45.4% 47.1%
41.3% 40.8%
31.1% 32.8%
35.1% 36.0% 34.7% 34.7% 34.6%
Dec 16 Dec 17 Jun 18 Dec 18 May 19beforeHelix
Jun 19after Helix
Sep 19
Loans new basis Deposits
Core Cypriot business
54 (1) The market share on loans was affected as from 30 September 2018 following a decrease in total loans in the banking sector, mainly attributed to €6 bn non-performing loans of Cyprus Cooperative Bank
(CyCB) which remained to SEDIPES (a legal entity without license to operate as a credit institution) as a result of the agreement between CyCB and Hellenic Bank
29.5% 31.5% 34.1% 35.3% 34.4% 34.0% 34.6%
35.8% 37.3% 38.8% 38.3% 38.2% 37.2% 34.7%
Dec 16 Dec 17 Jun 18 Dec 18 Mar 19 Jun 19 Sep 19
Residents Non-residents
1
Market shares1 Strong market shares in resident and non-resident deposits
133 121
108 91
77 58 47 39
3 2 2 1 1 1 1 1 -50
-30
-10
10
30
50
70
90
110
130
150
170
190
210
230
250
4Q2017 1Q2018 2Q2018 3Q2018 4Q2018 1Q2019 2Q2019 3Q2019
Time & Notice accounts
Savings and Current accountsCost of deposits
Customer deposit rates decline further (bps) (Cy)
491 486 483 475 468 460 413 402
69 59 49 41 32 24 24 19
422 427 434 434 436 436 389 383
1Q2018 2Q2018 3Q2018 4Q2018 1Q2019 2Q2019 2Q2019 3Q2019
Yield on Loans Cost of Deposits Customer spread
Average contractual interest rates (bps) (Cy)
76 69 59 49 32 41 24
Excluding
Helix
19

49
133
156
255
192
0
127
127
127
0
153
204
191
191
191
203
224
230
234
234
234
0
97
114
€ mn Underlying
basis
Helix
Portfolio
Investment in associate
classified as HFS
Tax related
items Other
Statutory
Basis
Net interest income 260 34 - - - 294
Net fee and commission income 111 9 - (6) - 114
Net foreign exchange gains and net gains on financial instrument transactions 34 - - - 1 35
Insurance income net of claims and commissions 42 - - - - 42
Net gains from revaluation and disposal of investment properties and on disposal of stock
of properties 26 - - - - 26
Other income 22 - - - - 22
Total income 495 43 - (6) 1 533
Total expenses (307) (25) - - (24) (356)
Operating profit 188 18 - (6) (23) 177
Loan credit losses (117) (17) - - (1) (135)
Impairments of other financial and non-financial instruments (9) - - (8) - (17)
Provisions for litigation, regulatory and other matters (3) - - - 3 -
Remeasurement of investment in associate classified as held for sale - - (26) - - (26)
Share of profit from associate - - 5 - - 5
Profit before tax and non-recurring items 59 1 (21) (14) (21) 4
Tax (1) - - 115 - 114
(Profit) attributable to non-controlling interests (2) - - - - (2)
Profit after tax and before non-recurring items 56 1 (21) 101 (21) 116
Advisory and other restructuring costs – excluding discontinued operations and NPE sale
(Helix) (21) - - - 21 -
Profit after tax – Organic 35 1 (21) 101 - 116
Profit relating to NPE sale (Helix) 1 (1) - - - -
Loss relating on remeasurement of investment in associate classified as held for sale
(CNP) net of share of profit from associates (21) - 21 - - -
Reversal of impairment of DTA and impairment of other tax receivables 101 - - (101) - -
Profit after tax (attributable to the owners of the Company) 116 - - - - 116
Income Statement bridge1 for 9M2019
(1) Please refer to section F1 “Reconciliation of income statement between statutory and underlying basis” of the Group Financial Results for the period 30 September 2019
55

49
133
156
255
192
0
127
127
127
0
153
204
191
191
191
203
224
230
234
234
234
0
97
114
Analysis of Interest Income and Interest Expense
56
Analysis of Interest Income (€ mn) 1Q20191,2 2Q20192 3Q2019
Loans and advances to customers 104 101 105
Loans and advances to banks and central banks 2 2 1
Investments available-for-sale - - -
Investment at amortised costs 3 3 3
Investments FVOCI 5 5 6
Investments classified as loans and receivables - - -
114 111 115
Trading Investment - - -
Derivative financial instruments 9 9 9
Other investments at fair value through profit or loss - - -
Total Interest Income 123 120 124
Analysis of Interest Expense (€ mn)
Customer deposits (13) (10) (8)
Funding from central banks and deposits by banks (1) (1) (1)
Subordinated loan stock (6) (6) (6)
Repurchase agreements (2) (2) (2)
Negative interest on loans and advances to banks and central banks (4) (4) (5)
(26) (23) (22)
Derivative financial instruments (12) (12) (12)
Total Interest Expense (38) (35) (34)
(1) Interest income on loans and advances to customers for 1Q2019 increased from €101 mn to €104 mn and Interest income on loans and advances to banks and central banks decreased to €2 mn
from €5 mn since previously disclosed on 13 May 2019, due to reclassification of between exposures
(2) The interest income, non-interest income, staff costs, other operating expenses and loan credit losses related to Project Helix are disclosed under ‘Profit/(loss) relating to NPE sale (Helix)’ in the
underlying basis

49
133
156
255
192
0
127
127
127
0
153
204
191
191
191
203
224
230
234
234
234
0
97
114 € mn
Consumer
Banking
SME
Banking
Corporate
Banking
International
Banking
Wealth &
Markets RRD REMU Insurance Treasury Other
Total
Cyprus
Net interest income/(expense) 113 29 89 26 5 11 (10) 0 0 3 266
Net fee & commission income 33 7 13 38 2 17 - (4) 2 3 111
Other income 2 - 1 6 2 - 22 42 20 27 122
Total income 148 36 103 70 9 28 12 38 22 33 499
Total expenses (131) (17) (26) (30) (6) (46) (7) (15) (6) (16) (300)
Operating profit 17 19 77 40 3 (18) 5 23 16 17 199
Loan credit losses of customer loans
net of gains/(losses) on derecognition
of loans and changes in expected cash
flows
(7) 4 15 1 1 (131) - - - 0 (117)
(Impairment)/ reversal of impairment of
other financial and non financial
instruments
- - - - - - (10) - - 3 (7)
Provision for litigation and regulatory
matters - - - - - - - - - (1) (1)
Share of profits from associates - - - - - - - - - - -
Profit/(loss) before tax 10 23 92 41 4 (149) (5) 23 16 19 74
Tax (1) (3) (11) (5) 0 20 0 (2) (2) 3 (1)
Profit attributable to non controlling
interest - - - - - - - - - (2) (2)
Profit/(loss) after tax and before
restructuring costs, Helix, UK sale
and reversal of DTA impairment and
impairment of tax receivables
9 20 81 36 4 (129) (5) 21 14 20 71
Cyprus: Income Statement by business line1 for 9M2019
57
Excluding Helix
(1) The interest income, non-interest income, staff costs, other operating expenses and loan credit losses related to Project Helix are disclosed under ‘Profit/(loss) relating to NPE sale (Helix)’ in the underlying
basis

49
133
156
255
192
0
127
127
127
0
153
204
191
191
191
203
224
230
234
234
234
0
97
114 € mn 30.09.19
Group Equity per financial statements 2,482
Less: Intangibles (43)
Less: Deconsolidation of insurance and other entities (197)
Less: Regulatory adjustments (IFRS 9 and other items) 108
Less: Revaluation reserves and other unrealised items transferred to
Tier II (252)
CET 1 1 2,098
Risk Weighted Assets 13,758
CET 1 ratio 1 15,2%
Risk Weighted Assets – Regulatory Capital
31.12.18 31.03.192 30.06.193 30.09.192
Total equity excl. non-controlling
interests 2,341 2,443 2,443 2,454
CET1 capital 1,864
2,058 2,080 2,098
Tier I capital 2,084 2,278 2,300 2,318
Tier II capital 212 213 192 188
Total regulatory capital (Tier I +
Tier II) 2,296 2,491 2,492 2,506
58
(1) Allowing for IFRS 9 transitional arrangements
(2) Capital ratios include unaudited/un-reviewed profits for 1Q2019 and 9M2019
(3) Capital ratios include reviewed profits for 1H2019
31.12.17 31.12.18 31.03.19 Helix 30.06.19 30.09.2019
Cyprus 16,011 15,070 15,113 (1,452) 13,680 13.550
Russia 27 24 23 21 15
United Kingdom 922 84 77 69 69
Romania 118 38 37 40 16
Greece 168 144 128 136 102
Other 14 13 13 16 6
Total RWA 17,260 15,373 15,391 (1,452) 13,962 13,758
RWA intensity 73% 70% 71% 64% 65%
31.12.17 31.12.18 31.03.19 Helix 30.06.19 30.09.2019
Credit risk 15,538 13,833 13,852 (1,514) 12,361 12,219
Market risk 5 2 - 62 62 -
Operational risk 1,717 1,538 1,539 - 1,539 1,539
Total 17,260 15,373 15,391 (1,452) 13,962 13,758
Risk weighted assets by Geography (€ mn) Reconciliation of Group Equity to CET 1
Risk weighted assets by type of risk (€ mn) Equity and Regulatory Capital (€ mn)

49
133
156
255
192
0
127
127
127
0
153
204
191
191
191
203
224
230
234
234
234
0
97
114
Unchanged SREP capital requirements for 20201 when ignoring the phasing-in of
O-SII4
59
• P2R unchanged at 3.0%
• CCB unchanged at 2.5% (fully phased-in)
• O-SII increased to 1.0% (additional 50 bps phasing in)
• Per EBA final guidelines on SREP and supervisory stress testing and the Single Supervisory Mechanism’s (SSM) 2018
SREP methodology own funds held for the purposes of Pillar II Guidance cannot be used to meet any other capital
requirements (Pillar 1, Pillar II requirement or the combined buffer requirements), and therefore cannot be used twice6.
(1) New SREP requirements are expected to be effective as from January 2020, and are subject to ECB final 2019 SREP decision.
(2) Pillar 2 requirement in the form of CET1
(3) In accordance with the legislation in Cyprus which has been set for all credit institutions the applicable rate of the CCB was fully phased in at 2.5% in 2019
(4) Since 2015, the Bank has been designated as an Other Systemically Important Institution (O-SII). The Central Bank of Cyprus set the O-SII buffer for the Group at 2%. This buffer will be phased-in
gradually, having started from 1 January 2019 at 0.5% and increasing by 0.5% every year thereafter, until being fully implemented (2.0%) on 1 January 2022
(5) Additional Tier 1 Capital
(6) The new provisions are expected to be effective from January 2020 and remain subject to ECB final confirmation
SREP requirements for 2020: CET1 ratio at 11.0% SREP requirements for 2020 : Total Capital ratio at 14.5%
1
2
3,0%
2019
4,5%
3,0%
2,5%
0,5% 1,0%
2,5%
4,5%
2020
O-SII
CCB
Pillar 2R
Pillar 1
10,5% 11,0%
1,5%
0,5%
2,5% 2,5%
3,0%
2019
O-SII
2,0%
Pillar 1 4,5%
1,0%
3,0%
2,0%
2020
1,5%
4,5%
CCB
Pillar 2R
Tier 2
AT1
14,0% 14,5%
Total
Pillar 1
of 8%
2
3
4
4
5
3

49
133
156
255
192
0
127
127
127
0
153
204
191
191
191
203
224
230
234
234
234
0
97
114
11.0%
0.5%
14.9%
c. 11.5%
CET1 30 Sep 2019
Pro forma for CNP &
VEP
1 Jan 20203
MDA Threshold
Buffer to MDA Restrictions Level & Distributable Items1
CET1 Ratios (Pro forma for CNP & VEP)
Unfilled
AT1 + T2
capacity
340 bps
[ ] bps Distance
to MDA CET1
Ratio (%)
CET1
Req
Unfilled AT1 &
T2 Bucket
(1) Distributable Items definition per CRR
(2) Based on the SREP decisions of prior years, the Company and the Bank were under a regulatory prohibition for equity dividend distribution and therefore no dividends were declared or paid during
years 2018 and 2017. Following the 2018 SREP decision, the Company and the Bank are still under equity dividend distribution prohibition. This prohibition does not apply if the distributions
are made via the issuance of new ordinary shares to the shareholders which are eligible as CET1 capital
(3) Including phasing in of O-SII buffer (+50 bps)
Distributable Items at Bank and BOCH level
• Distributable Items amount to:
- Bank: c.€0.4bn and
- BOCH: c.€0.7bn
• No prohibition applies to the payment of coupons on any AT1 capital
instruments issued by the Company and the Bank2
• Significant CET1 MDA buffer 3 (1 Jan 2020) : ~340bps (~€460 mn)
Maximum Distributable Amount for BOCH
60

49
133
156
255
192
0
127
127
127
0
153
204
191
191
191
203
224
230
234
234
234
0
97
114
12.40 13.83 14.96 14.53 14.69 14.75
2.20 1.74 1.48 1.38 1.30 1.34 1.69
2.11 0.29 0.29 0.28 0.28 0.22
0.17 0.11 0.10 0.11 0.10
16.51 17.85
16.84 16.30 16.38 16.47
Dec-16 Dec-17 Dec-18 Mar-19 Jun-19 Sep-2019
EUR USD GBP Other Currencies
Analysis of Deposits
90%
8% 2%
61
Deposits by Currency (€ bn) 30 Sep 2019 (%)
30 Sep 2019 (%)
48%
9%
43%
9.27 10.00 8.78 8.44 8.14 7.94
1.06 1.54 1.35 1.37 1.42 1.46
6.18 6.31
6.71 6.49 6.82 7.07
16.51 17.85 16.84 16.30 16.38 16.47
Dec-16 Dec-17 Dec-18 Mar-19 Jun-19 Sep-19
Time deposits Savings accounts Current & demand accounts
1
Deposits by Type (€ bn)
6.73 6.63 5.96 5.70 5.79 5.80
0.80 0.91 0.83 0.76 0.76 0.79
8.98 10.31 10.05
9.84 9.83 9.88
16.51 17.85 16.84 16.30 16.38 16.47
Dec-16 Dec-17 Dec-18 Mar-19 Jun-19 Sep-19
Corporate SME Retail
1
Deposits by customer Sector (€ bn) 30 Sep 2019 (%)
35%
5% 60%
(1) The reduction relates to the sale of BOC UK in Sep-18
1

49
133
156
255
192
0
127
127
127
0
153
204
191
191
191
203
224
230
234
234
234
0
97
114
Reduction in Overseas Non-Core Exposures
44 31 23 21 19 18
149
79
35 33 34 32
42
9
7 7 8
11 1 1
283
193
164 152 152
138
518
312
240
214 214
188
Dec 2016 Dec 2017 Dec 2018 Mar 2019 Jun 2019 Sep 2019
Russia: Net exposure Romania: Net exposure Serbia: Net exposure
UK: Net exposure Greece: Net exposure
62
• The Group continues its efforts for further
deleveraging and disposal of non-essential assets
and operations in Greece, Romania and Russia
• In accordance with the Group’s strategy to exit from
overseas non-core operations, the operations of the
branch in Romania were terminated in January
2019, following the completion of deregistration
formalities with respective authorities
• During 3Q2019 the Group completed the sale of the
overseas exposures in Serbia, with a carrying value
of €8 mn
• In addition as at 30 September 2019, there were
€279 mn of overseas exposures in Greece (€311
mn at 30 June 2019) not identified as non-core
exposures
Overseas non-core exposures (€ mn)

49
133
156
255
192
0
127
127
127
0
153
204
191
191
191
203
224
230
234
234
234
0
97
114
Appendix – Glossary & Definitions
63

49
133
156
255
192
0
127
127
127
0
153
204
191
191
191
203
224
230
234
234
234
0
97
114
Glossary & Definitions
64
Allowance for expected credit
losses on loans and
advances to customers
(previously accumulated
provisions)
Allowance for expected credit losses to cover credit risk on loans and advances to customers comprise: (i) allowance for ECL on loans and advances to
customers, (ii) the fair value adjustment on initial recognition of loans and advances to customers, (iii) allowance for expected credit losses for off-balance sheet
exposures (financial guarantees and commitments) disclosed on the balance sheet within other liabilities and (iv) accumulated fair value adjustments on loans
and advances to customers classified at FVPL
Advisory and other
restructuring costs Comprise mainly: fees of external advisors in relation to: (i) disposal of operations and non-core assets, and (ii) customer loan restructuring activities
AIEA Average Interest Earning Assets include: cash and balances with central banks, plus loans and advances to banks, plus net loans and advances to customers,
plus investments (excluding equities and mutual funds).
AT1 AT1 (Additional Tier 1) is defined in accordance with Articles 51 and 52 of the Capital Requirements Regulation (EU) No 575/2013.
Average contractual interest
rates
Interest rates on cost of deposits were previously calculated as the Interest Expense over Average Balance. The current calculation which the Bank considers
more appropriate is based on the weighted average of the contractual rate times the balance at the end of the month. The rates are calculated based on the
month end contractual interest rates. The quarterly rates are the average of the three quarter month end contractual rates
Book Value BV= book value = Carrying value prior to the sale of property
BOC UK sale Comparatives have been represented for the results of Bank of Cyprus UK Limited (‘BOC UK’) and its subsidiary, Bank of Cyprus Financial Services Limited
(‘BOC FS’, and together the ‘UK Group’), from continuing operations to discontinued operations
CET1 capital ratio
(transitional basis) CET1 capital ratio (transitional basis) is defined in accordance with the Capital Requirements Regulation (EU) No 575/2013
CET1 fully loaded (FL) The CET1 fully loaded (FL) ratio is defined in accordance with the Capital Requirements Regulation (EU) No 575/2013
Cost of Funding Effective yield of cost of funding: Interest expense of all interest bearing liabilities after hedging, over average interest bearing liabilities (customer deposits,
funding from the central bank, interbank funding, subordinated liabilities). Historical information has been adjusted to take into account hedging
Contribution to SRF Relates to the contribution made to the Single Resolution Fund
Cost to Income ratio Cost-to-income ratio comprises total expenses (as defined) divided by total income (as defined)
Cost of Risk Loan credit losses charge (cost of risk) (year to date) is calculated as the annualised ‘loan credit losses’ (as defined) divided by average gross loans (the
average balance calculated as the average of the opening balance and the closing balance)
CRR DD Default Definition
DFAs Debt for Asset Swaps
DFEs Debt for Equity Swaps
DTA Deferred Tax Assets
EBA European Banking Authority
ECB European Central Bank

49
133
156
255
192
0
127
127
127
0
153
204
191
191
191
203
224
230
234
234
234
0
97
114
Glossary & Definitions
65
Effective yield Interest Income on Loans/Average Net Loans
Effective yield of liquid
assets
Interest Income on liquids after hedging, over average liquids (Cash and balances with central banks, placements with banks and bonds). Historical information
has been adjusted to take into account hedging
Foreclosures Value of on-boarded assets is set at a conservative 25%-30% discount from open market valuations, by two independent sources; Includes consensual and non
consensual DFAs and DFEs
FTP Fund transfer pricing methodologies applied between the business lines to present their results on an arm’s length basis
GBV Gross Book Value
Gross Loans
Gross loans are reported before the fair value adjustment on initial recognition relating to loans acquired from Laiki Bank (calculated as the difference between
the outstanding contractual amount and the fair value of loans acquired) amounting to €278 mn at 30 September 2019 (compared to €290 mn at 30 June 2019
and €462 mn at 31 December 2018).
Additionally, gross loans (i) include loans and advances to customers measured at fair value through profit and loss of €430 mn at 30 September 2019
(compared to €454 mn at 30 June 2019 and €456 mn as at 31 December 2018), and (ii) are reported after the reclassification between gross loans and expected
credit losses on loans and advances to customers classified as a disposal group held for sale of Nil as at 30 September 2019 and 30 June 2019 (compared to
€99 mn at 31 December 2018).
Gross Sales Proceeds Proceeds before selling charge and other leakages
GVA Gross Value Added
Group The Group consists οf Bank of Cyprus Holdings Public Limited Company, “BOC Holdings” or the “Company”, its subsidiary Bank of Cyprus Public Company
Limited, the “Bank” and the Bank’s subsidiaries
H/O Head Office
IB, W&M International Banking, Wealth and Markets
IBU Servicing exclusively international activity companies registered in Cyprus and abroad and not residents
Legacy Legacy relates to RRD, REMU and non-core overseas exposures
Loan credit losses Loan credit losses comprise: (i) credit losses to cover credit risk on loans and advances to customers, (ii) net gains on derecognition of financial assets measured
at amortised cost and (iii) net gains on loans and advances to customers at FVPL.
LLR (Loans Loss Reserve) Please refer to allowance for expected loan credit losses as defined above (previously ‘Accumulated provisions’)
Market shares
Both deposit and loan market shares are based on data from the Central Bank of Cyprus. The Bank is the single largest credit provider in Cyprus with a market
share of 40.8% at 30 September 2019, compared to 41.3% at 30 June 2019, 46.7% at 31 March 2019, 45.4% at 31 December 2018 and as at 30 September
2018, 38.6% at 30 June 2018 and 37.4% at 31 March 2018.
The market share on loans was affected as at 30 June 2019 following the derecognition of the Helix portfolio upon the completion of Project Helix announced on
28 June 2019. The market share on loans was affected during the quarter ended 31 March 2019 following a decrease in total loans in the banking sector of €1
bn, mainly attributed to reclassification, revaluation, exchange rate and other adjustments (CBC).
The market share on loans was affected as at 30 September 2018 following a decrease in total loans in the banking sector, mainly attributed to €6 bn non-
performing loans of Cyprus Cooperative Bank (CyCB) which remained to SEDIPES as a result of the agreement between CyCB and Hellenic Bank.
The market share on loans was affected as at 30 June 2018 following a decrease in total loans in the banking sector of €2.1 bn, due to loan reclassifications,
revaluations, exchange rate or other adjustments (CBC).

49
133
156
255
192
0
127
127
127
0
153
204
191
191
191
203
224
230
234
234
234
0
97
114
Glossary & Definitions
66
Net Proceeds Proceeds after selling charges and other leakages
Net fee and commission
income over total income Fee and commission income less fee and commission expense divided by total income (as defined)
Net interest margin (NIM)
Net interest margin is calculated as the net interest income (annualised) divided by the quarterly average interest earning assets. Average interest earning assets
exclude interest earning assets of any discontinued operations at each quarter end, if applicable. Interest earning assets include: cash and balances with central
banks, plus loans and advances to banks, plus net customer loans and advances, plus investments (excluding equities and mutual funds)
Net loans and advances to
customers Comprise gross loans (as defined) net of allowance for expected loan credit losses (as defined, but excluding credit losses on off-balance sheet exposures).
Net loan to deposit ratio Net loan to deposit ratio is calculated as gross loans (as defined) net of allowance for expected loan credit losses (as defined) divided by customer deposits.
New lending New lending includes the average YTD change (if positive) for overdraft facilities
Non-interest income
Non-interest income comprises Net fee and commission income, Net foreign exchange gains and net gains on financial instrument transactions and loss on
disposal/dissolution of subsidiaries and associates (excluding net gains on loans and advances to customers at FVPL), Insurance income net of claims and
commissions, Net gains/(losses) from revaluation and disposal of investment properties and on disposal of stock of properties, and Other income
Non-recurring items
Non-recurring items as presented in the ‘Interim Condensed Consolidated Income Statement – Underlying basis’ relate to: (i) advisory and other restructuring
costs, (ii) discontinued operations (UK sale), (iii) profit/(loss) relating to NPE sale (Helix), (iv) loss relating to sale of associate (CNP) including share of profit from
associates, and (v) reversal of impairment of DTA and impairment of other tax receivables.
NPEs
Non-Performing Exposures (NPEs) –as per the EBA definition: According to the EBA reporting standards on forbearance and non-performing exposures (NPEs),
published on 2014 and ECB’s Guidance to Banks on Non-Performing Loans published on March 2017 a loan is considered an NPE if:
1. the debtor is assessed as unlikely to pay its credit obligations in full without the realisation of the collateral, regardless of the existence of any past due
amount or of the number of days past due
2. the exposures are impaired or
3. there are material exposures which are more than 90 days past due, or
4. there are performing forborne exposures under probation for which additional forbearance measures are extended, or
5. there are performing forborne exposures under probation that present more than 30 days past due within the probation period. The NPEs are reported
before the deduction of accumulated loan credit losses(as defined)
The exit criteria of NPE forborne are the following:
1. The extension of forbearance measures does not lead to the recognition of impairment or default
2. One year has passed since the forbearance measures were extended
3. There is not, following the forbearance measures, any past due amount or concerns regarding the full repayment of the exposure according to the post
forbearance conditions
NPE coverage ratio
(previously ‘NPE Provision
coverage ratio’)
The NPE coverage ratio is calculated as the allowance for expected loan credit losses (as defined) over NPEs (as defined).
NPE ratio NPEs ratio is calculated as the NPEs as per EBA (as defined) divided by gross loans (as defined).
NPEs sales Include Helix and Velocity sales of GBV of €2.7 bn and €33 mn as at 31 March 2019

49
133
156
255
192
0
127
127
127
0
153
204
191
191
191
203
224
230
234
234
234
0
97
114
Glossary & Definitions
67
NSFR
The NSFR is calculated as the amount of “available stable funding” (ASF) relative to the amount of “required stable funding” (RSF), on the basis of Basel III
standards. Its calculation is a SREP requirement. The European Banking Authority (EBA) is working on finalising the NSFR and enforcing it as a regulatory ratio
under CRR2, currently expected in 2021
OMV Open Market Value
Operating profit Comprises profit before Total loan credit losses, impairments and provisions (as defined), tax, (profit)/loss attributable to non-controlling interests and non-
recurring items (as defined)
p.p. percentage points
Performing Relates to all business lines excluding Restructuring and Recoveries Division (“RRD”), REMU and non-core overseas exposures
Phased-in Capital
Conservation Buffer (CCB)
In accordance with the legislation in Cyprus which has been set for all credit institutions, the applicable rate of the CCB is 1.25% for 2017, 1.875% for 2018 and
2.5% for 2019 (fully phased-in).
Pro forma for Helix In addition to the impact from Project Helix, this pro forma also included the impact from the agreement for the sale of a portfolio of retail unsecured NPEs, with
gross book value €33 mn as at 31 March 2019, known as Project Velocity
Loan credit losses for
impairment of customer
loans
Credit losses for impairment of customer loans and gains/(losses) on derecognition of loans and changes in expected cash flows on acquired loans.
Profit/(loss) after tax and
before restructuring costs,
discontinued operations
and NPE sale (Helix)
Excludes advisory and other restructuring costs. It also excludes profit/(loss) from discontinued operations and any restructuring costs or loss relating to the NPE
sale (Helix)
Profit after tax-organic Profit/(loss) after tax and before ‘non-recurring items’ as defined, except for the “Advisory and other restructuring costs – excluding discontinued operations and
NPE sale (Helix)”.
qoq Quarter on quarter change
Restructured loans Restructuring activity within quarter as recorded at each quarter end and includes restructurings of NPEs, performing loans and re-restructurings
Risk adjusted yield Interest Income on Loans net of allowance for expected loan credit losses/Net Loans
RRD Restructuring and Recoveries Division
RWA Risk Weighted Assets
RWA Intensity Risk Weighted Assets over Total Assets
Special levy Relates to the special levy on deposits of credit institutions in Cyprus
Stage 2 & Stage 3 Loans Include purchased or originated credit-impaired
Tangible Collateral Restricted to Gross IFRS balance

49
133
156
255
192
0
127
127
127
0
153
204
191
191
191
203
224
230
234
234
234
0
97
114
Glossary & Definitions
68
Total Capital ratio Total capital ratio is defined in accordance with the Capital Requirements Regulation (EU) No 575/2013
Total expenses
Total expenses comprise staff costs, other operating expenses and the special levy and contribution to the Single Resolution Fund. It does not include ‘advisory
and other restructuring costs-excluding discontinued operations and NPE sale (Helix)’ or any restructuring costs relating to NPE sale (Helix).
Advisory and other restructuring costs-excluding discontinued operations and NPE sale (Helix)’ for 3Q2019 were €9 mn, compared to €5 mn for 2Q2019.
‘Advisory and other restructuring costs-excluding discontinued operations and NPE sale (Helix)’ for 9M2019 were €21 mn, compared to €26 mn for 9M2018.
Restructuring costs relating to NPE sale (Helix) for 3Q2019 were €1 mn, compared to €7 mn for 2Q2019. Restructuring costs relating to NPE sale (Helix) for
9M2019 were €9 mn, compared to €17 mn for 9M2018.
Total income Total income comprises net interest income and non-interest income (as defined)
Total loan credit losses,
impairments and
provisions
Total loan credit losses, impairments and provisions comprises loan credit losses (as defined), plus (provisions)/reversal of provisions for litigation, regulatory and
other matters plus (impairments)/reversal of impairments of other financial and non-financial assets.
T2 Tier 2 Capital
Underlying basis Statutory basis adjusted for certain items as explained in the Basis of Presentation.
Write offs and non
contractual write offs
Loans together with the associated loan credit losses are written off when there is no realistic prospect of future recovery. Partial write-offs, including non-
contractual write-offs, may occur when it is considered that there is no realistic prospect for the recovery of the contractual cash flows. In addition, write-offs may
reflect restructuring activity with customers and are part of the terms of the agreement and subject to satisfactory performance.
yoy Year on year change

49
133
156
255
192
0
127
127
127
0
153
204
191
191
191
203
224
230
234
234
234
0
97
114
This document contains certain forward-looking statements which can usually be identified by terms used such as “expect”,
“should be”, “will be” and similar expressions or variations thereof or their negative variations, but their absence does not
mean that a statement is not forward-looking. Examples of forward-looking statements include, but are not limited to,
statements relating to the Group’s near term and longer term future capital requirements and ratios, intentions, beliefs or
current expectations and projections about the Group’s future results of operations, financial condition, expected impairment
charges, the level of the Group’s assets, liquidity, performance, prospects, anticipated growth, provisions, impairments,
business strategies and opportunities. By their nature, forward-looking statements involve risk and uncertainty because they
relate to events, and depend upon circumstances, that will or may occur in the future. Factors that could cause actual
business, strategy and/or results to differ materially from the plans, objectives, expectations, estimates and intentions
expressed in such forward-looking statements made by the Group include, but are not limited to: general economic and
political conditions in Cyprus and other European Union (EU) Member States, interest rate and foreign exchange fluctuations,
legislative, fiscal and regulatory developments and information technology, litigation and other operational risks. Should any
one or more of these or other factors materialise, or should any underlying assumptions prove to be incorrect, the actual
results or events could differ materially from those currently being anticipated as reflected in such forward looking
statements. The forward-looking statements made in this document are only applicable as from the date of publication of this
document. Except as required by any applicable law or regulation, the Group expressly disclaims any obligation or
undertaking to release publicly any updates or revisions to any forward looking statement contained in this document to reflect
any change in the Group’s expectations or any change in events, conditions or circumstances on which any statement is
based.
The financial information included in this presentation is neither reviewed nor audited by the Group’s external auditors.
This financial information is presented in Euro (€) and all amounts are rounded as indicated. A comma is used to separate thousands and a dot is used to separate decimals.
Important Notice Regarding Additional Information Contained in the Investor Presentation
The presentation for the Group Financial Results for the nine months ended 30 September 2019 (the “Presentation”) is available on https://www.bankofcyprus.com/en-GB/investor-relations-new/reports-
presentations/financial-results/ and includes additional financial information not presented within the Group Financial Results Press Release (the “Press Release”), primarily relating to (i) NPE analysis (movements by
segments and customer type), (ii) rescheduled loans analysis, (iii) details of historic restructuring activity including REMU activity, (iv) analysis of new lending, (v) Income statement by business line, (vi) NIM and
interest income analysis and (vii) Loan portfolio analysis in accordance with the three-stages model for impairment of IFRS 9. Except in relation to any non-IFRS measure, the financial information contained in the
Investor Presentation has been prepared in accordance with the Group’s significant accounting policies as described in the Group’s Annual Financial Report 2018, and updated in the Interim Financial Report 2019.
The Investor Presentation should be read in conjunction with the information contained in the Press Release and neither the financial information in the Press Release nor in the Investor Presentation constitutes
statutory financial statements prepared in accordance with International Financial Reporting Standards.
Disclaimer
69