bank of ghana · bank of ghana p. o. box gp 2674 accra - ghana ... 30.85 36.00 total liquidity...
TRANSCRIPT
BANK OF GHANA
STATISTICAL BULLETIN
MArCH 2013

Prepared by Research DepartmentPublished by IDPS Department
Bank of GhanaP. O. Box GP 2674
Accra - Ghanawww.bog.gov.gh
ISSN: 0855 - 6229

Selected Economic Indicators 5 Charts 6Statistical Tables 11
Monetary Indicators
1. Monetary Survey 112. Assets of the Bank of Ghana 123. Liabilities of the Bank of Ghana 134. Assets of Deposit Money Banks 145. Liabilities of Deposit Money Banks 156. Sectoral Distribution of Outstanding Credit by Deposit Money Banks 167. Reserve Requirements of Deposit Money Banks 178. Bank Clearing and Debits 189. Consolidated Assets and Liabilities of Rural/Community Banks 19
Interest Rates
10. Interest Rates – Ranges 2011. Money Market & DMBs Rates 21
Government Fiscal Operations
12. Central Government Budget (Revenue) 2213. Central Government Budget (Expenditure) 2314. Central Government Fiscal Position (Financing) 2415. Fiscal Position – Narrow Coverage 2516. Outstanding Stock of Selected Financial Assets 2617. Holders and Structure of Domestic Debt 27
External Sector Indicators
18. International Reserves of Bank of Ghana 2819. Balance of Payments 2920. Merchandise Trade Flows 3021. Crude Oil and Petroleum Products Imports 3122. Ghana: Value, Volume and Unit Price of Exports 3223. Commodity Prices 3324. Ghana: Direction of Trade 3425. Foreign Exchange Rates (Interbank & Forex Bureaux Markets) 3526. Ghana: Public & Publicly Guaranteed External Debt 36
Real Sector Indicators
27. Ghana: Retail Prices of Major Petroleum Products 3728. National Consumer Price Index and Inflation Rates 3829. Gross Domestic Product at 2006 Constant Prices 3930. Gross Domestic Product at Current Prices 40
TABLE OF CONTENTS


STATISTICAL BULLETIN 5
Indi
cato
rs20
1020
1120
12
Dec
Mar
Jun
Sep
Dec
Jan
Feb
Mar
Apr
May
Jun
Jul
Aug
Sep
Oct
Nov
Dec
Infla
tiona
ry M
easu
res [
CO
ICO
P Ba
sed]
(y-o
-y)
H
eadl
ine
Infla
tion(
%)
8.58
9.13
8.59
8.40
8.58
8.73
8.64
8.78
9.11
9.34
9.40
9.50
9.50
9.43
9.24
9.30
8.80
A
vera
ge In
flatio
n(%
) (yr
)10
.75
10.0
09.
098.
838.
728.
708.
668.
638.
648.
688.
758.
858.
949.
039.
089.
1411
.88
C
ore
1: IN
FXEU
(infl
atio
n ad
j. fo
r ene
rgy
& u
tility
)8.
038.
177.
527.
757.
938.
107.
908.
108.
89.
179.
249.
349.
159.
219.
029.
088.
62
Mon
etar
y Se
ctor
Indi
cato
rs (y
-o-y
) Gro
wth
(%)
P
rivat
e Se
ctor
Cre
dit
19.8
610
.30
18.2
025
.50
26.3
032
.10
42.9
244
.62
37.4
039
.40
39.0
041
.30
43.7
043
.80
44.3
039
.00
39.3
0
R
eser
ve M
oney
(RM
)45
.22
37.6
052
.50
37.8
031
.10
38.8
224
.97
22.1
920
.20
35.7
045
.10
49.7
231
.55
49.3
030
.04
30.8
536
.00
T
otal
Liq
uidi
ty (M
2+)
35.0
036
.00
40.2
041
.90
33.2
032
.63
33.1
729
.06
30.1
034
.70
34.2
029
.64
30.7
628
.77
21.9
326
.25
24.3
2
B
road
Mon
ey (M
2)46
.20
36.4
036
.60
39.2
030
.20
29.6
630
.41
23.5
625
.00
28.9
030
.00
28.1
127
.91
24.8
718
.50
27.5
022
.91
Exte
rnal
Sec
tor D
evel
opm
ents
(US$
mill
ion)
N
et In
tern
atio
nal R
eser
ves
3,92
4.87
3,73
8.23
3,88
2.96
3,60
4.29
4,43
8.97
3,55
4.75
3,43
7.97
3,18
2.46
2,99
0.62
2,78
1.74
2,47
4.40
2,24
7.33
2,33
5.22
2,17
2.24
3,15
7.70
3,29
7.12
3,22
8.06
G
ross
Inte
rnat
iona
l Res
erve
s4,
724.
894,
503.
614,
764.
934,
594.
665,
382.
824,
557.
964,
708.
044,
640.
954,
401.
284,
166.
214,
090.
903,
989.
114,
192.
854,
096.
315,
168.
075,
250.
315,
348.
96
(e
quiv
in m
onth
s of i
mpo
rts o
f goo
ds &
serv
ices
)3.
703.
533.
832.
863.
262.
672.
762.
722.
502.
402.
482.
442.
552.
513.
113.
142.
99
Expo
rt*
2,11
4.89
3,10
4.30
3,35
3.13
3,33
9.30
2,98
8.69
n.a
n.a
4,11
8.11
n.a
n.a
3,41
4.88
n.a
n.a
2,70
2.61
n.a
n.a
3,30
5.83
Impo
rt*
3,03
6.05
3,34
4.03
4,00
5.55
4,09
8.27
4,38
9.87
n.a
n.a
4,11
7.93
n.a
n.a
4,74
7.16
n.a
n.a
4,34
4.33
n.a
n.a
4,55
3.38
Trad
e Ba
lanc
e*-9
21.1
6-2
39.7
3-6
52.4
2-7
58.9
7-1
,401
.18
n.a
n.a
0.18
n.a
n.a
-1,3
32.2
8n.
an.
a-1
,641
.72
n.a
n.a
-1,2
47.5
5
C
urre
nt A
ccou
nt (i
ncl.
offici
al tr
ansf
ers)
**-9
55.1
8-5
48.5
8-4
71.4
2-7
25.2
3-1
,921
.56
n.a
n.a
-986
.59
n.a
n.a
-1,5
28.7
8n.
an.
a-1
,539
.92
n.a
n.a
-866
.19
P
rivat
e Tr
ansf
ers (
net)*
*53
0.67
673.
7659
5.14
507.
6859
2.19
n.a
n.a
866.
93n.
an.
a47
6.76
n.a
n.a
372.
93n.
an.
a43
0.89
Com
mod
ity P
rice
Mov
emen
ts
C
ocoa
LIF
FE [
£ p
er to
nne]
1,99
4.48
2,16
1.61
1,85
8.55
1,82
3.52
1,40
6.00
1,49
2.00
1,50
1.00
1,50
2.00
1,45
6.00
1,49
9.00
1,51
7.00
1,56
2.73
1,63
8.65
1,65
9.10
1,55
7.39
1,56
9.32
1,50
8.05
G
old
[US$
per
fine
oun
ce]
1,39
1.16
1,42
2.50
1,52
8.25
1,76
8.96
1,65
8.49
1,63
2.18
1,73
0.50
1,67
1.28
1,64
7.70
1,57
9.24
1,60
2.91
1,59
0.96
1,63
1.05
1,74
6.89
1,74
4.96
1,72
1.17
1,67
8.82
B
rent
Cru
de O
il [U
S$ p
er b
arre
l]92
.34
114.
6211
3.91
109.
9610
7.72
111.
5512
6.96
124.
5512
0.37
109.
3695
.89
102.
7711
3.19
113.
0411
1.52
109.
5310
9.19
D
omes
tic P
etro
leum
Pric
es (G
H¢
per l
itre)
: Pre
miu
m1.
171.
521.
521.
521.
751.
751.
751.
751.
751.
751.
751.
751.
751.
751.
751.
751.
75
Rea
l Sec
tor I
ndic
ator
s(Ba
se: A
vg. 2
001=
100)
C
IEA
: yea
r-on
-yea
r gro
wth
(nom
inal
)16
.50
28.7
125
.48
27.2
621
.06
21.5
229
.59
20.3
611
.29
22.4
016
.52
17.2
116
.65
11.8
721
.37
19.0
113
.35
C
IEA
: yea
r-on
-yea
r gro
wth
(rea
l)10
.50
22.2
119
.57
21.5
315
.18
15.1
222
.82
13.3
04.
5015
.37
9.39
10.2
29.
234.
4214
.00
11.9
36.
73
Exte
rnal
Deb
t (In
mill
ion
of U
S$) B
y M
atur
ity
S
tock
6,25
4.55
6,68
1.87
7,08
2.64
7,34
5.38
7,58
9.45
7,73
3.98
7,77
8.37
7,82
1.26
7,98
2.37
7,55
3.67
7,70
4.63
7,72
0.51
7,51
4.98
7,84
3.16
7,84
5.88
7,85
4.91
8,83
5.56
E
xter
nal d
ebt/G
DP
(%)
20.9
017
.60
18.7
019
.80
20.8
017
.73
18.1
218
.38
18.9
219
.03
20.0
920
.25
19.7
820
.62
20.6
320
.65
20.8
0
D
ebt S
ervi
ce/E
xpor
ts o
f goo
ds a
nd se
rvic
es (%
) 3.
702.
403.
402.
503.
300.
500.
710.
801.
621.
070.
79n.
an.
a3.
20n.
an.
a3.
90
D
ebt S
ervi
ce/G
DP
(%)
0.30
0.20
0.30
0.30
0.30
0.05
0.07
0.08
0.16
0.12
0.09
0.10
0.07
0.09
0.16
0.12
0.19
Gov
ernm
ent F
isca
l Ope
ratio
ns (
Mill
ion
Gh
Ced
is)
Net
Dom
estic
Fin
anci
ng (N
DF)
-141
.82
629.
44-6
10.6
567
.75
-261
.84
761.
9095
.79
-117
.05
1027
.50
816.
6782
7.07
686.
1613
4.52
506.
2830
5.65
1579
.85
156.
67
ND
F as
% o
f GD
P-0
.31
1.05
-1.0
20.
11-0
.44
1.04
0.13
-0.1
61.
411.
121.
130.
940.
180.
690.
422.
160.
21
SELE
CTE
D E
CO
NO
MIC
IND
ICAT
OR
S
* = p
rovi
siona
l**
= Q
uart
erly
Ser
ies
n.a
= D
ata
not a
vaila
ble

STATISTICAL BULLETIN6
CHARTS
PRICE DEVELOPMENTS
Headline inflation ended the fourth quarter of 2012 at 8.8 per cent, down from 9.4 per cent in the preceding quarter. The decline in consumer price inflation was driven by declines in both Food and Non-Food indices, reflecting the tight monetary policy stance adopted especially after July 2012 and improved food supply situation. Food inflation declined from 4.4 per cent in September to 3.9 per cent in December 2012 while the Non-Food index declined from 12.4 per cent at the end of the third quarter of 2012 to 11.6 per cent at the end of December 2012.
Inflation Trend: Combined, Food & Non-Food
Actual and Bank of Ghana’s Core Inflation
Inflation Rate: Dec. (2011 & 2012)
Contribution to Overall Inflation Dec. (2011 & 2012): Non-food Inflation (%)
0.0
2.0
4.0
6.0
8.0
10.0
12.0
14.0
Jan.2011 Feb
Mar
Apr
May Jun Ju
l
Aug Sep
Oct Nov
Dec
Jan.2012 Feb
Mar
Apr May Jun Ju
l Aug
Sep
Oct Nov
Dec
Per cent
InflaBon Trend: Combine, Food & Non-‐Food
Combined Food Non-‐Food
0
2
4
6
8
10
12
Composite Food Non-‐Food
Per cenrt
Infla;on Rate: Dec (2011 & 2012)
Dec. 2011 Dec. 2012
7.0
7.5
8.0
8.5
9.0
9.5
10.0
Jan.20
11
Feb
Mar
Apr
May
Ju
n Ju
l Aug
Sep
Oct
Nov
Dec
Jan.20
12
Feb
Mar
Apr
May
Ju
n Ju
l Aug
Sep
Oct Nov
Dec
Perc
ent
Actual and Bank of Ghana's Core Inflation
Core Inflation CPI Inflation
0 5 10 15 20 25
Clothing and Footwear
Hotel, Cafes & Restaurants
Household goods, operations & services
Recreation, entertainment & Cultural services
Transport
Housing & Utilities
Medical care and Health services
Alcohol & Tabacco
Miscellaneous goods & Services
Education
Communications
13.11
5.23
13.07
13
22.7
6.93
7.59
11.38
19.02
2.48
0.65
13.58
8.41
12.65
10.39
20.57
7.66
9.45
15.12
14.37
16.47
0.43
Contribution to Overall Inflation (December): Non-food Inflation (%)
Dec. 2012 Dec. 2011

STATISTICAL BULLETIN 7
MONETARY DEVELOPMENTS
The annual growth rate of broad money including foreign currency deposits (M2+) increased by 24.3 per cent in December 2012, down from 33.2 per cent at end-December 2011. M2+ stood at GH¢22,618.6 million (30.9% of GDP) at the end of December 2012 as against a level of GH¢18,195.2 million (30.4% of GDP) recorded at the end of December 2011. The growth in M2+ was driven by a 49.9 per cent growth in Net Domestic Assets (NDA), which was moderated by a 9.1 per cent decline in Net Foreign Assets (NFA) of the banking system
Ghana Monetary Survey
Components of Money Supply
Reserve Money & Its Components
M2/GDP
-
5,000.0
10,000.0
15,000.0
20,000.0
25,000.0
Jan.20
11 Feb
Mar
Apr
May
Ju
n Ju
l Aug
Sep.20
11
Oct Nov
Dec
Jan.20
12 Feb
Mar
Apr
May
Ju
n Ju
l Aug
Sep
Oct Nov
Dec
GH
¢' M
illio
ns
Ghana Monetary Survey
Net Foreign Assets Net Domestic Assets Money Supply (M2+)
-‐
1,000.0
2,000.0
3,000.0
4,000.0
5,000.0
6,000.0
7,000.0
8,000.0
9,000.0
Jan.20
11 Feb
Mar
Apr
May
Ju
n Ju
l Aug
Sep
Oct
Nov
Dec
Jan.20
12 Feb
Mar
Apr
May
Ju
n Ju
l Aug
Sep
Oct Nov
Dec
GH
¢'M
illio
ns
Reserve Money & Its Components
Reserves of Banks Currency outside Banks Reserve Money (RM)
-
1,000.0
2,000.0
3,000.0
4,000.0
5,000.0
6,000.0
7,000.0
Jan.20
11
Feb
Mar
Apr
May
Ju
n Ju
l Aug
Sep.20
11
Oct Nov
Dec
Jan.20
12
Feb
Mar
Apr
May
Ju
n Ju
l Aug
Sep
Oct Nov
Dec
GH
¢' M
illio
ns
Components of Money Supply
Currency Outside Banks Demand Deposits Time & Savings Deposits Foreign Currency Deposits
15.0
16.0
17.0
18.0
19.0
20.0
21.0
22.0
23.0
24.0
25.0
Jan.20
11 Feb
Mar
Apr
May
Ju
n Ju
l Aug
Sep
Oct
Nov
Dec
Jan.20
12 Feb
Mar
Apr
May
Ju
n Ju
l Aug
Sep
Oct Nov
Dec
Per
cent
M2/GDP
STATISTICAL BULLETIN8
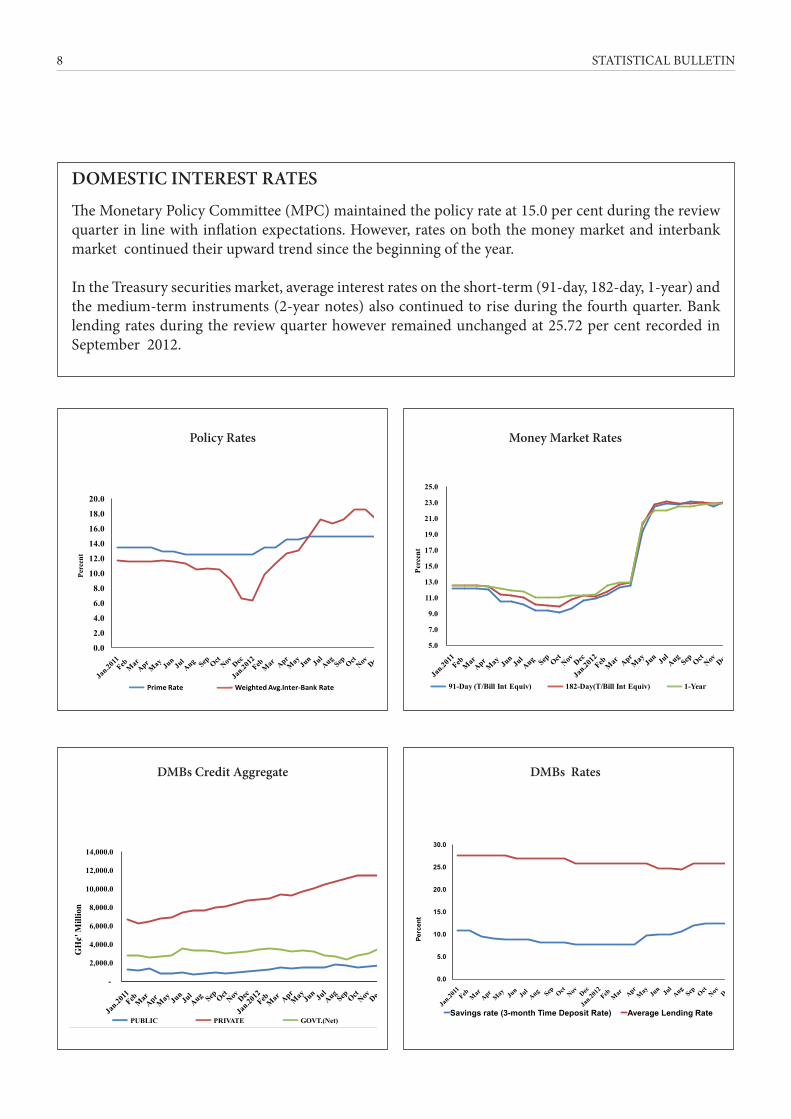
DOMESTIC INTEREST RATES
The Monetary Policy Committee (MPC) maintained the policy rate at 15.0 per cent during the review quarter in line with inflation expectations. However, rates on both the money market and interbank market continued their upward trend since the beginning of the year.
In the Treasury securities market, average interest rates on the short-term (91-day, 182-day, 1-year) and the medium-term instruments (2-year notes) also continued to rise during the fourth quarter. Bank lending rates during the review quarter however remained unchanged at 25.72 per cent recorded in September 2012.
Policy Rates
DMBs Credit Aggregate
Money Market Rates
DMBs Rates
0.0
2.0
4.0
6.0
8.0
10.0
12.0
14.0
16.0
18.0
20.0
Perc
ent
Policy rates & Weighted Average Inter-Bank rate
Prime Rate Weighted Avg.Inter-Bank Rate
5.0
7.0
9.0
11.0
13.0
15.0
17.0
19.0
21.0
23.0
25.0
Perc
ent
Money Market rates
91-Day (T/Bill Int Equiv) 182-Day(T/Bill Int Equiv) 1-Year
-
2,000.0
4,000.0
6,000.0
8,000.0
10,000.0
12,000.0
14,000.0
GH
¢' M
illio
n
DMBs Credit Aggregate
PUBLIC PrIVATE GOVT.(Net)
0.0
5.0
10.0
15.0
20.0
25.0
30.0
Perc
ent
DMBs rates
Savings rate (3-month Time Deposit Rate) Average Lending Rate
STATISTICAL BULLETIN 9
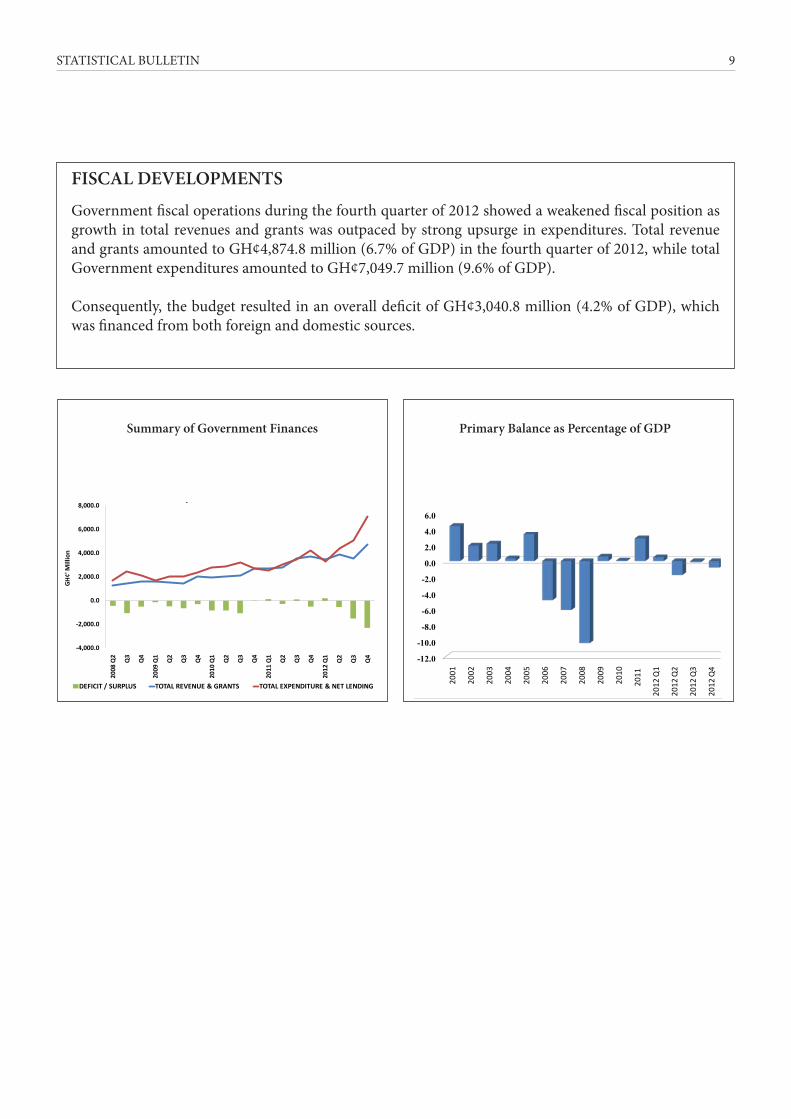
FISCAL DEVELOPMENTS
Government fiscal operations during the fourth quarter of 2012 showed a weakened fiscal position as growth in total revenues and grants was outpaced by strong upsurge in expenditures. Total revenue and grants amounted to GH¢4,874.8 million (6.7% of GDP) in the fourth quarter of 2012, while total Government expenditures amounted to GH¢7,049.7 million (9.6% of GDP).
Consequently, the budget resulted in an overall deficit of GH¢3,040.8 million (4.2% of GDP), which was financed from both foreign and domestic sources.
Summary of Government Finances Primary Balance as Percentage of GDP
-4,000.0
-2,000.0
0.0
2,000.0
4,000.0
6,000.0
8,000.0
2008
Q2
Q3
Q4
2009
Q1
Q2
Q3
Q4
2010
Q1
Q2
Q3
Q4
2011
Q1
Q2
Q3
Q4
2012
Q1
Q2
Q3
Q4
GH
¢' M
illio
n
Summary of Government Finances
DEFICIT / SURPLUS TOTAL REVENUE & GRANTS TOTAL EXPENDITURE & NET LENDING
-12.0
-10.0
-8.0
-6.0
-4.0
-2.0
0.0
2.0
4.0
6.0
2001
2002
2003
2004
2005
2006
2007
2008
2009
2010
2011
2012
Q1
2012
Q2
2012
Q3
2012
Q4
Primary Balanace as Percentage of GDP

STATISTICAL BULLETIN10
EXTERNAL SECTOR DEVELOPMENTS, FOREIGN EXCHANGE RATESAND EXTERNAL DEBT
The value of goods exported increased by 10.6 per cent to US$3,305.8 million during the fourth quarter of 2012 compared with US$2,988.7 million recorded in the corresponding quarter of 2011. The growth was mainly attributed to increased export earnings from gold, oil and non-traditional export items. The total imports bill during the fourth quarter of 2012, however, grew by 3.7 per cent to US$4,553.4 million from the level recorded in the corresponding period of 2011. This increase was mainly driven by a 11.4 per cent increase in non-oil imports which outpaced the 22.0 per cent decline in the value of oil imports.
Gross international reserves declined by US$33.9 million to US$5,349.0 million at end-December 2012, from a stock position of US$5,382.8 million recorded at the end of December 2011. The level of reserves was sufficient to provide a cover of 3.0 months of imports of goods and services, compared to 3.2 months of imports cover at the end of December 2011.
On the domestic currency market, the Ghana cedi strengthened marginally against the major international currencies in the fourth quarter of 2012 as policy measures, implemented in the second half of 2012 to contain the high volatility in the foreign exchange market, took hold. In the Interbank market, the Ghana cedi appreciated by only 0.5 per cent cumulatively against the US dollar but depreciated by 0.5 per cent and 1.1 per cent against the pound sterling and the euro respectively during the quarter. Similarly, in the forex bureau market, the Ghana cedi appreciated by 1.4 per cent and 2.3 per cent against the US dollar and the pound sterling respectively but depreciated by 0.5 per cent against the euro during the review quarter.
Ghana’s total outstanding external debt stock at the end of December 2012 stood at US$8,835.6 million.
International Reserves End Period Inter-Bank Transaction Exchange Rate (Per Ghana Cedis)
0.00
1,000.00
2,000.00
3,000.00
4,000.00
5,000.00
6,000.00
US$
Mill
ions
International Reserves
Gross Reserves Net Reserves
0
0.5
1
1.5
2
2.5
3
3.5
Gha
na C
edis
End Period Inter-Bank Transaction Exchange Rate (Per Ghana Cedis)
US Dollar Pound Sterling EURO

STATISTICAL BULLETIN 11
(Mill
ions
of G
hana
Ced
is )
Cla
ssifi
catio
n20
1120
12
Dec
Jan
Feb
Mar
Apr
ilM
ayJu
nJu
lA
ugSe
pO
ctN
ovD
ec
Net
For
eign
Ass
ets
BO
G 6
,669
.60
5,7
18.5
8 5
,762
.86
5,3
24.0
2 4
,978
.91
4,8
46.8
4 4
,483
.28
3,9
89.7
4 3
,690
.22
4,0
37.8
4 6
,123
.22
6,2
71.9
9 5
,781
.06
D
MBs
1,2
10.3
6 1
,463
.14
1,5
85.2
5 1
,506
.23
1,7
01.3
1 2
,028
.06
2,0
07.4
7 1
,538
.87
1,7
75.8
3 1
,588
.12
1,3
94.8
6 1
,210
.28
1,1
72.3
3
Net
Dom
estic
Ass
ets
10,
315.
23
10,
915.
64
10,
922.
34
11,
669.
91
12,
478.
37
12,
956.
49
13,
908.
36
14,
376.
74
14,
656.
83
14,
785.
98
13,
123.
91
14,
476.
81
15,
666.
66
C
laim
s on
Gov
't 7
,423
.39
7,4
99.0
4 7
,665
.11
7,7
34.2
9 7
,615
.54
7,7
68.9
0 7
,749
.60
6,9
97.0
1 7
,080
.12
6,7
02.0
7 7
,384
.80
7,4
76.1
2 9
,122
.62
G
ovt.
Dep
osits
2,2
42.8
4 1
,624
.19
1,8
36.0
1 2
,345
.39
1,2
20.0
8 1
,046
.50
457
.24
-320
.87
535
.73
24.
14
1,3
84.8
0 1
53.5
3 1
,406
.36
C
laim
s on
priv
ate
sect
or 9
,841
.10
11,
020.
53
11,
265.
45
10,
899.
07
10,
749.
00
11,
191.
84
11,
518.
58
12,
016.
45
12,
637.
52
12,
847.
98
12,
888.
67
14,
889.
43
13,
139.
37
O
ther
Item
s (ne
t)-4
,706
.42
-5,9
79.7
4-6
,172
.21
-4,6
18.0
6-4
,666
.09
-4,9
57.7
5-4
,902
.59
-4,9
57.5
9-4
,525
.09
-4,7
39.9
3-5
,764
.76
-7,7
35.2
1-5
,188
.97
Tota
l Ass
ets
18,
195.
19
18,
097.
37
18,
270.
45
18,
500.
16
19,1
58.5
9 19
,831
.40
20,3
99.1
1 19
,905
.35
20,1
22.8
8 20
,411
.94
20,
641.
99
21,
959.
08
22,6
20.0
5
Mon
ey S
uppl
y M
2+
C
urre
ncy
outs
ide
bank
s 3
,763
.27
3,6
10.1
4 3
,385
.72
3,4
88.8
9 3
,551
.07
3,6
08.6
9 3
,638
.47
3,6
84.6
0 3
,761
.00
3,8
47.7
7 4
,081
.22
4,5
69.8
4 4
,918
.56
D
eman
d de
posit
s 4
,951
.14
4,8
65.7
0 4
,868
.95
4,6
36.2
9 5
,063
.48
5,2
01.5
9 5
,624
.00
5,3
64.4
8 5
,270
.36
5,4
37.6
1 5
,667
.65
6,1
09.6
9 6
,238
.18
Sa
ving
s & T
ime
depo
sits
5,5
26.6
4 5
,355
.06
5,5
15.0
7 5
,547
.29
5,5
76.5
0 5
,808
.65
5,7
32.1
1 5
,811
.04
5,9
03.1
0 5
,774
.14
5,7
96.1
5 6
,289
.13
6,3
46.5
2
Fo
reig
n cu
rren
cy d
epos
its 3
,954
.15
4,2
66.4
7 4
,500
.71
4,8
27.6
8 4
,967
.54
5,2
12.4
6 5
,404
.53
5,0
45.2
4 5
,188
.41
5,3
52.4
2 5
,096
.96
4,9
90.4
3 5
,116
.80
Tota
l Lia
bilit
ies
18,
195.
19
18,
097.
37
18,
270.
45
18,
500.
16
19,1
58.5
9 19
,831
.40
20,3
99.1
1 19
,905
.35
20,1
22.8
8 20
,411
.94
20,
641.
99
21,
959.
08
22,6
20.0
5
Mem
oran
dum
Item
s
Re
serv
e M
oney
5,7
36.0
5 5
,509
.61
5,0
68.4
6 5
,017
.59
5,1
94.8
9 6
,017
.14
6,1
31.2
7 6
,230
.03
5,7
25.2
9 6
,252
.52
6,5
79.1
2 7
,086
.37
7,8
46.9
4
Cu
rren
cy /
Dep
osit
Ratio
0.2
6 0
.25
0.2
3 0
.23
0.2
3 0
.22
0.2
2 0
.23
0.2
3 0
.23
0.2
5 0
.26
0.2
8
Cu
rren
cy /
M2+
Rat
io 0
.21
0.2
0 0
.19
0.1
9 0
.19
0.1
8 0
.18
0.1
9 0
.19
0.1
9 0
.20
0.2
1 0
.22
Tabl
e 1.
Mon
etar
y Su
rvey
TABL
ES

STATISTICAL BULLETIN12
(Mill
ions
of G
hana
Ced
is )
Ass
et C
lass
ifica
tion
2011
2012
Dec
Jan
Feb
Mar
Apr
May
Jun
Jul
Aug
Sep
Oct
Nov
Dec
Fore
ign
Ass
ets
G
old
498
.80
527
.98
536
.79
542
.26
547
.56
581
.85
602
.24
606
.05
583
.69
582
.77
580
.16
579
.11
633
.88
SD
R H
oldi
ng 6
69.7
6 7
05.5
4 7
19.7
7 7
23.4
4 5
47.5
6 7
52.1
4 7
63.0
8 7
59.0
0 7
67.2
6 7
75.9
0 7
62.7
0 7
60.7
2 7
49.2
2
Fo
reig
n Cu
r.& B
al. w
ith B
ks 8
81.1
2 2
73.2
9 8
12.0
6 9
22.8
7 1
72.2
4 3
68.6
9 3
27.3
6 4
83.8
4 2
05.5
1 7
46.9
4 1
,980
.73
1,9
74.6
4 1
,913
.08
Fo
reig
n Se
curit
ies
6,2
47.5
3 5
,936
.91
5,7
53.6
3 5
,562
.97
5,9
74.3
6 5
,761
.14
5,8
94.4
1 5
,594
.67
5,7
64.0
3 5
,548
.48
6,3
08.0
7 6
,453
.21
6,4
01.7
3
O
ther
s 3
9.21
3
9.52
3
9.53
7
4.03
7
4.13
7
4.16
7
4.35
7
4.38
7
4.42
7
4.53
7
4.40
7
4.45
7
4.51
Tot
al 8
,336
.43
7,4
83.2
4 7
,861
.79
7,8
25.5
7 7
,493
.88
7,5
37.9
9 7
,661
.43
7,5
17.9
4 7
,394
.90
7,7
28.6
2 9
,706
.07
9,8
42.1
3 9
,772
.41
Cla
ims o
n G
over
nmen
t
G
hana
Gov
ernm
ent S
tock
s 2
,676
.32
2,7
12.9
0 2
,742
.42
2,7
69.5
3 2
,837
.67
2,8
62.0
7 2
,862
.18
2,7
90.1
5 2
,790
.23
2,6
86.3
8 2
,617
.07
2,6
16.9
7 3
,673
.45
Tr
easu
ry B
ills
5.7
8 5
.67
9.0
3 2
6.06
2
5.86
2
6.94
3
6.59
1
6.63
1
52.9
1 2
59.8
5 2
46.2
9 1
12.2
0 6
2.12
Lo
ans &
Adv
ance
s 4
97.4
1 4
15.4
8 4
52.8
3 5
13.2
6 5
56.5
4 5
95.0
1 6
35.6
8 3
97.0
0 3
97.0
1 3
97.0
2 3
97.0
1 3
97.0
1 3
97.0
1
Re
valu
atio
n St
ock
0.00
0.
00
0.00
0.
00
0.00
0.
00
0.00
0.
00
0.00
0.
00
0.00
0.
00
0.00
To
tal
3,1
79.5
1 3
,134
.06
3,2
04.2
8 3
,308
.86
3,4
20.0
8 3
,484
.02
3,53
4.45
3,
203.
79
3,34
0.15
3,
343.
24
3,26
0.37
3,
126.
19
4,13
2.58
Cla
ims o
n Pu
blic
Cor
pora
tions
849
.56
853
.26
857
.27
1,0
36.6
7 1
,026
.02
1,2
71.9
2 1
,078
.34
1,0
79.9
2 1
,081
.27
1,4
64.8
0 1
,585
.50
1,3
94.6
9 1
,859
.98
Cla
ims o
n D
MBs
105
.14
107
.70
103
.55
101
.49
83.
45
33.
45
33.
43
33.
48
78.
78
37.
55
38.
38
87.
49
90.
56
Oth
er A
sset
s 1
,107
.81
936
.01
953
.49
1,0
85.6
7 9
82.7
7 7
95.2
0 1
,713
.85
1,3
10.5
9 2
,084
.41
1,5
91.0
4 1
,505
.69
1,7
08.0
4 2
,221
.44
Tota
l Ass
ets
13,
578.
44
12,
514.
27
12,
980.
38
13,3
58.2
5 13
,006
.20
13,1
22.5
7 14
,021
.49
13,1
45.7
1 13
,979
.51
14,1
65.2
5 1
6,09
6.01
1
6,15
8.53
18
,076
.99
Tabl
e 2.
A
sset
s of
Bank
of G
hana
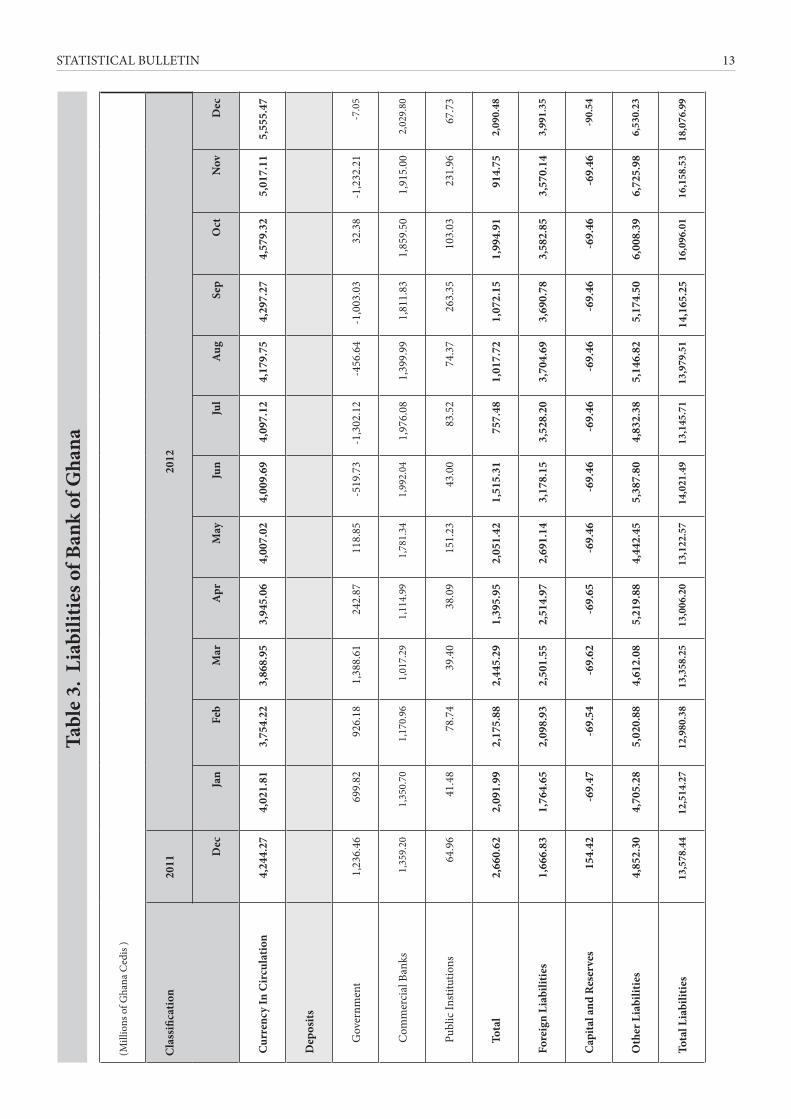
STATISTICAL BULLETIN 13
(Mill
ions
of G
hana
Ced
is )
Cla
ssifi
catio
n20
1120
12
Dec
Jan
Feb
Mar
Apr
May
Jun
Jul
Aug
Sep
Oct
Nov
Dec
Cur
renc
y In
Cir
cula
tion
4,2
44.2
7 4
,021
.81
3,7
54.2
2 3
,868
.95
3,9
45.0
6 4
,007
.02
4,0
09.6
9 4
,097
.12
4,1
79.7
5 4
,297
.27
4,5
79.3
2 5
,017
.11
5,5
55.4
7
Dep
osits
G
over
nmen
t 1
,236
.46
699
.82
926
.18
1,3
88.6
1 2
42.8
7 1
18.8
5 -5
19.7
3 -1
,302
.12
-456
.64
-1,0
03.0
3 32
.38
-1,2
32.2
1 -7
.05
C
omm
erci
al B
anks
1
,359
.20
1,3
50.7
0 1
,170
.96
1,0
17.2
9 1
,114
.99
1,7
81.3
4 1
,992
.04
1,9
76.0
8 1
,399
.99
1,8
11.8
3 1,
859.
50
1,91
5.00
2,
029.
80
P
ublic
Inst
itutio
ns
64.
96
41.
48
78.
74
39.
40
38.
09
151
.23
43.
00
83.
52
74.
37
263
.35
103.
03
231.
96
67.7
3
T
otal
2
,660
.62
2,0
91.9
9 2
,175
.88
2,4
45.2
9 1
,395
.95
2,0
51.4
2 1
,515
.31
757
.48
1,0
17.7
2 1
,072
.15
1,9
94.9
1 9
14.7
5 2
,090
.48
For
eign
Lia
bilit
ies
1,6
66.8
3 1
,764
.65
2,0
98.9
3 2
,501
.55
2,5
14.9
7 2
,691
.14
3,1
78.1
5 3
,528
.20
3,7
04.6
9 3
,690
.78
3,5
82.8
5 3
,570
.14
3,9
91.3
5
Cap
ital a
nd R
eser
ves
154
.42
-69.
47
-69.
54
-69.
62
-69.
65
-69.
46
-69.
46
-69.
46
-69.
46
-69.
46
-69.
46
-69.
46
-90.
54
Oth
er L
iabi
litie
s 4
,852
.30
4,7
05.2
8 5
,020
.88
4,6
12.0
8 5
,219
.88
4,4
42.4
5 5
,387
.80
4,8
32.3
8 5
,146
.82
5,1
74.5
0 6,
008.
39
6,72
5.98
6,
530.
23
Tot
al L
iabi
litie
s 1
3,57
8.44
1
2,51
4.27
1
2,98
0.38
1
3,35
8.25
1
3,00
6.20
1
3,12
2.57
1
4,02
1.49
1
3,14
5.71
1
3,97
9.51
14
,165
.25
16,
096.
01
16,
158.
53
18,0
76.9
9
Tabl
e 3.
Lia
bilit
ies o
f Ban
k of
Gha
na

STATISTICAL BULLETIN14
(Mill
ions
of G
hana
Ced
is )
Cla
ssifi
catio
n20
1120
12
Dec
Jan
Feb
Mar
Apr
May
Jun
Jul
Aug
Sep
Oct
Nov
Dec
Cas
h R
eser
ves
C
ash
in T
ill 4
81.0
0 4
11.6
7 3
68.5
1 3
80.0
6 3
93.9
9 3
98.3
3 3
71.2
2 4
12.5
2 4
18.7
4 4
49.5
0 4
98.1
0 4
47.2
8 6
36.9
2
B
alan
ce at
Ban
k of
Gha
na 2
,280
.76
1,9
52.8
1 2
,177
.33
1,6
39.8
5 2
,121
.49
2,1
97.9
1 2
,553
.57
2,2
46.7
0 1
,947
.41
2,2
73.6
9 2
,325
.43
2,5
10.8
7 2
,692
.76
To
tal
2,7
61.7
6 2
,364
.49
2,5
45.8
4 2
,019
.91
2,5
15.4
7 2
,596
.24
2,9
24.7
9 2
,659
.22
2,3
66.1
5 2
,723
.20
2,8
23.5
4 2
,692
.76
3,3
29.6
7
Fore
ign
Ass
ets
1,9
53.7
6 2
,272
.23
2,3
76.1
2 2
,286
.59
2,4
48.4
6 2
,765
.58
2,7
53.8
8 2
,405
.98
2,6
90.4
4 2
,377
.25
2,3
40.5
0 2
,119
.49
2,1
26.8
5
Cla
ims o
n G
over
nmen
t
G
over
nmen
t Sto
cks
2,6
15.5
0 2
,421
.00
2,4
03.5
4 2
,237
.68
2,0
97.0
3 1
,933
.34
2,0
31.7
4 1
,721
.39
1,9
70.1
0 1
,666
.40
2,3
66.0
0 2
,387
.04
2,9
14.8
0
T
reas
ury
Bills
946
.38
1,2
61.9
9 1
,375
.29
1,5
05.7
5 1
,416
.43
1,6
69.5
4 1
,501
.42
1,3
89.8
3 1
,087
.87
1,0
10.4
2 1
,076
.43
1,2
80.8
9 1
,393
.23
T
OR
Bond
s 6
82.0
0 6
82.0
0 6
82.0
0 6
82.0
0 6
82.0
0 6
82.0
0 6
82.0
0 6
82.0
0 6
82.0
0 6
82.0
0 6
82.0
0 6
82.0
0 6
82.0
0
To
tal
4,2
43.8
8 4
,364
.98
4,4
60.8
3 4
,425
.43
4,1
95.4
6 4
,284
.88
4,2
15.1
6 3
,793
.23
3,7
39.9
8 3
,358
.83
4,1
24.4
3 4
,349
.93
4,9
90.0
3
Cla
ims o
n Pu
blic
Cor
pora
tion
O
ther
Bill
s 2
97.2
1 2
97.2
1 3
02.3
9 3
84.0
4 4
26.3
1 3
42.9
0 3
46.8
3 3
54.3
8 4
34.6
2 2
14.8
3 9
4.56
1
16.3
7 1
13.8
6
L
oans
& A
dvan
ces
791
.54
838
.55
927
.25
1,1
26.8
4 9
95.1
5 1
,149
.42
1,1
33.5
8 1
,169
.53
1,3
88.6
9 1
,482
.03
1,3
62.5
8 1
,470
.35
1,5
48.1
5
T
otal
1,0
88.7
4 1
,135
.75
1,2
29.6
3 1
,510
.88
1,4
21.4
6 1
,492
.32
1,4
80.4
1 1
,523
.90
1,8
23.3
1 1
,696
.86
1,4
57.1
4 1
,586
.72
1,6
62.0
1
Cla
ims o
n Pr
ivat
e Se
ctor
8,7
52.3
6 8
,848
.11
9,0
09.7
9 9
,388
.18
9,3
27.5
4 9
,699
.52
10,
038.
17
10,
492.
54
10,
814.
22
11,
151.
12
11,
431.
53
11,
442.
73
11,
477.
37
Oth
er A
sset
s 2
,808
.97
3,1
43.6
5 2
,871
.89
3,1
18.0
4 3
,177
.74
3,4
33.4
4 3
,375
.12
3,6
99.5
7 3
,769
.63
3,9
74.0
3 3
,763
.26
4,0
73.6
8 3
,838
.72
Tota
l Ass
ets
21,
609.
47
22,
129.
21
22,
494.
10
22,
749.
04
23,
086.
13
24,
271.
99
24,
787.
53
24,
574.
44
25,
203.
71
25,
281.
28
25,
940.
40
26,
530.
70
27,
424.
65
Tabl
e 4.
Ass
ets o
f Dep
osit
Mon
ey B
anks
STATISTICAL BULLETIN 15
(Mill
ions
of G
hana
Ced
is )
Cla
ssifi
catio
n20
1120
12
Dec
Jan
Feb
Mar
Apr
May
Jun
Jul
Aug
Sep
Oct
Nov
Dec
PRIV
ATE
SEC
TOR
DEP
OSI
TS
D
eman
d D
epos
its 4
,337
.14
4,1
76.4
7 4
,240
.91
4,0
71.9
3 4
,536
.78
4,4
73.0
7 4
,950
.82
4,7
35.1
7 4
,563
.26
4,5
89.3
8 4
,797
.70
5,1
65.4
5 5
,532
.97
F
orei
gn C
urre
ncy
Dep
osits
3,9
54.1
5 4
,266
.47
4,5
00.7
1 4
,827
.68
4,9
67.5
4 5
,212
.46
5,4
04.5
3 5
,045
.24
5,1
88.4
1 5
,352
.42
5,0
96.9
6 4
,990
.43
5,1
16.8
0
S
avin
gs D
epos
its 2
,554
.52
2,5
77.5
8 2
,668
.10
2,6
99.7
8 2
,695
.60
2,8
27.5
2 2
,894
.89
2,9
95.6
0 2
,995
.16
2,9
32.8
3 2
,995
.82
3,2
03.2
4 3
,339
.88
T
ime
Dep
osits
2,5
20.6
0 2
,378
.35
2,3
98.6
7 2
,408
.64
2,5
39.2
9 2
,532
.40
2,4
46.4
3 2
,413
.17
2,5
95.5
3 2
,479
.18
2,4
74.5
3 2
,725
.60
2,7
38.5
0
To
tal
13,
366.
42
13,
398.
87
13,
808.
39
14,
008.
02
14,
739.
21
15,
045.
44
15,
696.
67
15,
189.
18
15,
342.
37
15,
353.
80
15,
365.
01
16,0
84.7
2 1
6,72
8.15
PU
BLIC
SEC
TOR
DEP
OSI
TS
D
eman
d D
epos
its 4
37.8
9 5
34.8
3 4
49.9
5 4
09.0
6 3
72.5
0 5
68.6
3 5
19.0
8 4
59.1
0 5
31.0
0 4
75.5
3 6
53.0
5 6
02.8
4 4
30.0
1
S
avin
gs D
epos
its 3
.29
9.4
8 9
.06
9.4
2 3
.96
4.0
5 4
.75
5.4
3 4
.04
5.9
2 4
.76
4.0
4 5
.94
T
ime
Dep
osits
448
.23
389
.66
439
.24
429
.46
337
.65
444
.69
386
.04
396
.83
308
.36
356
.22
321
.04
356
.24
262
.20
To
tal
889
.41
933
.96
898
.25
847
.94
714
.10
1,0
17.3
7 9
09.8
7 8
61.3
7 8
43.4
0 8
37.6
7 9
78.8
6 9
63.1
3 6
98.1
5
GO
VER
NM
ENT
DEP
OSI
TS 1
,006
.38
924
.37
909
.83
956
.78
977
.21
927
.66
976
.96
981
.24
992
.37
1,0
27.1
7 1
,352
.41
1,3
85.7
5 1
,413
.41
FOR
EIG
N L
IABI
LITI
ES 7
43.4
0 8
09.0
8 7
90.8
7 7
80.3
6 7
47.1
5 7
37.5
2 7
46.4
1 8
67.1
2 9
14.6
1 7
89.1
3 9
45.6
4 9
09.2
1 9
54.5
2
CR
EDIT
FRO
M B
AN
K O
F G
HA
NA
80.
59
84.
62
85.
24
102
.69
90.
88
94.
48
95.
98
97.
20
190
.13
100
.99
94.
91
95.
17
175
.11
PAID
-UP
CA
PITA
L &
RES
ERV
ES 3
,048
.19
3,1
57.9
9 3
,156
.51
3,2
36.2
3 3
,136
.41
3,0
58.1
9 3
,244
.44
3,3
21.1
7 3
,460
.74
3,5
62.3
1 3
,660
.84
3,8
13.3
1 4
,037
.20
OTH
ER L
IABI
LITI
ES 2
,475
.10
2,8
20.3
1 2
,845
.02
2,8
17.0
1 2
,681
.17
3,3
91.3
4 3
,117
.19
3,2
57.1
7 3
,460
.09
3,6
10.2
2 3
,542
.72
3,2
79.4
2 3
,418
.11
TOTA
L LI
ABI
LITI
ES 2
1,60
9.47
2
2,12
9.21
2
2,49
4.10
2
2,74
9.04
2
3,08
6.13
2
4,27
1.99
2
4,78
7.53
2
4,57
4.44
2
5,20
3.71
2
5,28
1.28
2
5,94
0.40
2
6,53
0.70
2
7,42
4.65
Tabl
e 5.
Lia
bilit
ies o
f Dep
osit
Mon
ey B
anks
STATISTICAL BULLETIN16
(Mill
ions
of G
hana
Ced
is )
Sect
ors
2011
2012
Dec
Jan
Feb
Mar
Apr
May
Jun
Jul
Aug
Sep
Oct
Nov
Dec
Agr
icul
ture
For
estr
y &
Fish
ing
537
.16
580
.37
559
.32
608
.23
597
.91
584
.49
602
.45
613
.32
612
.38
645
.26
629
.93
647
.33
631
.27
Min
ing
& Q
uarr
ying
398
.50
126
.15
127
.77
132
.18
130
.32
149
.80
169
.11
173
.29
147
.13
162
.38
170
.33
128
.65
148
.34
Man
ufac
turin
g 8
36.9
4 8
62.1
3 8
71.2
7 9
46.7
8 9
89.8
2 1
,165
.28
1,0
42.6
6 1
,273
.98
1,2
68.8
0 1
,322
.85
170
.33
1,3
10.3
2 1
,436
.46
Con
stru
ctio
n 7
51.6
4 3
77.2
3 3
81.2
9 4
33.1
4 4
41.8
6 5
02.9
7 5
68.5
6 5
47.1
5 5
36.3
9 5
44.0
4 5
35.4
1 6
07.5
2 6
25.7
1
Elec
tric
ity, G
as &
Wat
er 6
25.0
2 3
92.5
2 3
88.3
7 4
05.5
9 4
02.1
9 3
59.6
6 3
00.6
3 3
20.4
3 3
38.1
3 3
02.9
3 3
46.0
3 2
84.4
6 2
76.8
7
Impo
rt T
rade
861
.51
879
.63
841
.63
895
.77
847
.10
943
.15
987
.66
1,0
01.6
8 1
,036
.99
1,1
31.2
4 1
,087
.43
1,2
46.9
0 1
,038
.04
Expo
rt T
rade
112
.66
759
.69
775
.53
813
.87
861
.37
908
.28
959
.76
958
.96
977
.87
985
.41
1,0
04.0
7 8
95.7
8 1
,100
.30
Dom
estic
Tra
de 1
,520
.93
1,5
38.9
7 1
,672
.88
1,7
59.0
8 1
,653
.86
1,8
30.8
6 1
,986
.10
1,9
38.5
7 2
,142
.64
2,1
15.5
4 2
,124
.34
2,2
71.5
1 2
,202
.22
Tran
spor
t, St
orag
e &
Com
mun
icat
ion
391
.68
717
.91
965
.29
956
.15
787
.30
748
.49
729
.11
943
.32
1,1
66.7
4 1
,200
.62
1,0
84.2
2 9
31.8
5 1
,028
.41
Serv
ices
2,5
07.6
9 2
,440
.53
2,5
08.0
4 2
,658
.09
2,6
79.5
3 2
,699
.40
2,7
55.6
8 2
,871
.22
2,8
86.1
6 3
,150
.72
3,2
95.6
4 3
,407
.23
3,4
31.2
7
Oth
ers
757
.79
958
.48
791
.72
847
.26
874
.94
905
.85
1,0
24.0
2 9
79.3
8 1
,054
.10
1,0
32.6
0 1
,083
.97
1,1
23.0
8 1
,046
.64
Tota
l (ex
clud
ing
coco
a m
arke
ting)
9,3
01.5
3 9
,633
.61
9,8
83.1
0 1
0,45
6.14
1
0,26
6.19
1
0,79
8.24
1
1,12
5.74
1
1,62
1.31
1
2,16
7.32
1
2,59
3.61
1
2,74
7.97
1
2,85
4.64
1
2,96
5.52
Coc
oa M
arke
ting
50.
90
53.
04
53.
94
58.
89
56.
50
50.
70
46.
02
40.
76
35.
58
39.
54
46.
14
58.
44
59.
99
Tota
l 9
,352
.42
9,6
86.6
5 9
,937
.04
10,
515.
03
10,
322.
70
10,
848.
94
11,
171.
75
11,
662.
07
12,
202.
90
12,
633.
15
12,
794.
11
12,
913.
07
13,
025.
51
Tabl
e 6.
Sec
tora
l Dis
trib
utio
n of
Out
stan
ding
Cre
dit b
y D
epos
it M
oney
Ban
ks
STATISTICAL BULLETIN 17
(Mill
ions
of G
hana
Ced
is )
Cla
ssifi
catio
n20
1120
12
Dec
Jan
Feb
Mar
Apr
May
Jun
Jul
Aug
Sep
Oct
Nov
Dec
Liqu
idity
Res
erve
s
Pr
imar
y R
eser
ve
D
omes
tic 1
,391
.5
1,1
64.8
1
,138
.5
1,1
35.9
1
,164
.7
1,5
94.4
1
,753
.7
1,8
21.8
1
,796
.9
1,7
70.9
1
,874
.0
2,0
28.6
2
,044
.8
Fo
reig
n 5
18.5
5
27.9
6
22.9
6
80.2
6
65.8
4
94.3
4
12.0
4
15.4
4
09.7
4
20.2
3
58.8
3
33.9
4
29.2
T
otal
1,9
10.0
1
,692
.7
1,7
61.4
1
,816
.1
1,8
30.5
2
,088
.7
2,1
65.7
2
,237
.2
2,2
06.6
2
,191
.1
2,2
32.8
2
,362
.5
2,4
74.1
Dep
osits
Dom
estic
10,
837.
4 9
,392
.0
11,
064.
9 1
1,06
9.9
11,
428.
7 1
1,34
1.8
11,
492.
0 1
1,95
9.4
11,
947.
7 1
2,05
8.9
12,
225.
8 1
2,79
7.7
13,
156.
0
For
eign
4,0
26.7
4
,112
.0
4,3
20.6
4
,541
.0
4,9
68.2
6
,250
.9
5,3
76.9
5
,403
.5
5,3
21.1
5
,349
.1
4,2
43.7
5
,228
.5
5,3
01.5
To
tal
14,
864.
1 13
,504
.0
15,
385.
4 1
5,61
1.0
16,
396.
9 1
7,59
2.7
16,
868.
9 1
7,36
3.0
17,
268.
8 1
7,40
8.0
16,
469.
4 1
8,02
6.1
18,
457.
5
Res
erve
Rat
ios (
%)
Pr
imar
y Re
serv
e Ra
tio
(Dom
estic
) 1
2.8
12.
4 1
0.3
10.
3 1
0.2
14.
1 1
5.3
15.
2 1
5.0
14.
7 1
5.3
15.
9 1
5.5
Pr
imar
y Re
serv
e Ra
tio
(For
eign
) 1
2.9
12.
8 1
4.4
15.
0 1
3.4
7.9
7
.7
7.7
7
.7
7.9
8
.5
6.4
8
.1
Tabl
e 7.
Res
erve
Req
uire
men
ts o
f Dep
osit
Mon
ey B
anks
*Prim
ary
Rese
rve
Min
imum
Rat
io R
equi
rem
ent i
s 9 p
erce
nt
Fo
r Dom
estic
Dep
osits
= 9
per
cent
Fo
r For
eign
Dep
osits
= 9
per
cent
in th
eir r
espe
ctiv
e cu
rren
cies
STATISTICAL BULLETIN18
Table 8: Bank Clearing (2008 - 2012)
End of Period Number of Working
Days
Total Effects Cleared Average Effects ClearedPer Day
Number Amt (GH¢'000) Number Amt (GH¢'000)
2010Jan 20 454,478 2,849,038.0 22,724 142,451.9 Feb 20 468,012 2,590,980.0 23,401 129,549.0
Mar 22 499,347 2,801,340.0 22,698 127,333.6 Apr 20 451,642 2,791,079.0 22,582 139,553.9 May 21 539,062 2,927,010.0 25,670 139,381.5 Jun 22 521,200 2,905,871.0 23,691 132,085.1 Jul 21 494,521 3,166,600.0 23,549 150,790.5
Aug 22 502,283 3,147,113.0 22,831 143,050.6 Sep 21 496,627 3,180,297.0 23,649 151,442.7 Oct 21 597,459 4,270,370.0 28,450 203,350.9 Nov 22 537,558 3,856,249.0 24,434 175,284.0 Dec 21 552,906 4,295,620.0 26,329 204,553.3
2011Jan 20 518,294 3,938,746.4 25,915 196,937.3 Feb 20 496,382 3,862,139.5 24,816 193,107.0
Mar 22 571,160 4,082,221.9 25,962 185,555.5 Apr 19 476,777 3,664,053.7 25,094 192,844.9 May 20 563,097 4,240,101.8 28,155 212,005.1 June 22 559,769 4,267,670.0 25,444 193,985.0 July 20 511,851 4,183,113.0 25,593 209,155.6 Aug 23 524,848 4,183,023.7 22,819 181,870.6 Sep 21 574,944 4,592,538.9 27,378 218,692.3 Oct 20 575,515 5,369,816.7 28,776 268,490.8 Nov 22 575,216 5,002,317.3 26,146 227,378.1 Dec 19 582,066 5,959,063.6 30,635 313,634.9
2012Jan 21 581,355 5,806,496.8 27,684 276,499.8 Feb 21 535,715 5,048,638.3 25,510 240,411.3
Mar 21 552,798 5,094,772.6 26,324 242,608.2 Apr 19 499,116 4,913,515.2 26,269 258,606.1 May 21 579,601 5,240,355.0 27,600 249,540.7 Jun 21 546,076 5,709,357.6 26,004 271,874.2 Jul 21 570,559 5,874,732.1 27,169 279,749.1
Aug 23 529,840 5,489,378.9 23,037 238,668.6 Sep 16 530,102 5,171,491.0 33,131 323,218.2 Oct 23 649,224 6,610,043.5 28,227 287,393.2 Nov 22 567,089 7,095,788.7 25,777 322,535.8 Dec 21 522,028 6,726,047.1 24,858 320,288.0
STATISTICAL BULLETIN 19
(Mill
ions
of G
hana
Ced
is )
2009
2010
2011
2012
Q1
Q2
Q3
Q4
Q1
Q2
Q3
Q4
Q1
Q2
Q3
Q4
Q1
Q2
Q3
Q4
Ass
ets
Cas
h H
oldi
ngs &
Ba
lanc
es w
ith B
anks
85.
05
82.
25
80.
68
91.
29
85.
91
97.
86
97.
29
136
.46
99.
74
140
.11
nana
188.
1819
6.24
186.
8520
2.47
Bills
and
Bon
ds 1
22.9
8 1
39.1
2 1
46.6
4 1
86.3
5 2
02.9
0 2
13.2
7 1
95.2
6 2
89.3
7 2
40.9
6 3
13.6
3 na
na38
4.70
380.
2237
2.66
461.
20
Loan
s and
Adv
ance
s 2
12.1
9 2
23.9
7 2
30.8
6 2
39.3
8 2
42.0
3 2
59.8
3 2
72.6
0 3
11.0
6 2
68.1
5 3
56.4
7 na
na50
7.64
555.
0961
1.55
648.
52
Oth
er A
sset
s 7
6.54
8
6.88
8
8.32
9
3.31
9
4.73
1
03.0
7 1
01.0
4 1
22.2
3 1
12.8
4 1
53.1
1 na
na20
0.06
206.
3620
8.96
211.
84
Tota
l Ass
ets
496
.76
532
.22
546
.50
610
.33
625
.57
674
.03
666
.20
859
.13
721
.69
963
.32
nana
1,28
0.58
1,33
7.90
1,38
0.01
1,52
4.03
Liab
ilitie
s
Tota
l Dep
osits
372
.47
383
.21
394
.10
445
.73
459
.71
498
.78
492
.95
667
.31
547
.95
738
.83
nana
991.
881,
029.
901,
053.
311,
185.
57
Shar
ehol
ders
' Fun
ds 6
6.48
7
0.35
7
5.26
8
0.78
8
6.55
9
2.99
9
0.02
1
04.4
7 8
8.51
1
14.3
5 na
na14
7.70
160.
3917
5.85
188.
65
Oth
er L
iabi
litie
s 5
7.81
7
8.65
7
7.14
8
3.82
7
9.32
8
2.26
8
3.20
8
7.34
8
5.23
1
10.1
5 na
na14
1.00
147.
6115
0.86
149.
81
Tota
l Lia
bilit
ies
496
.76
532
.22
546
.50
610
.33
625
.57
674
.03
666
.20
859
.13
721
.69
963
.32
nana
1,28
0.58
1,33
7.90
1,38
0.01
1,52
4.03
No.
of R
epor
ting
Bank
s12
812
812
812
812
813
513
513
513
513
5na
na13
213
313
413
4
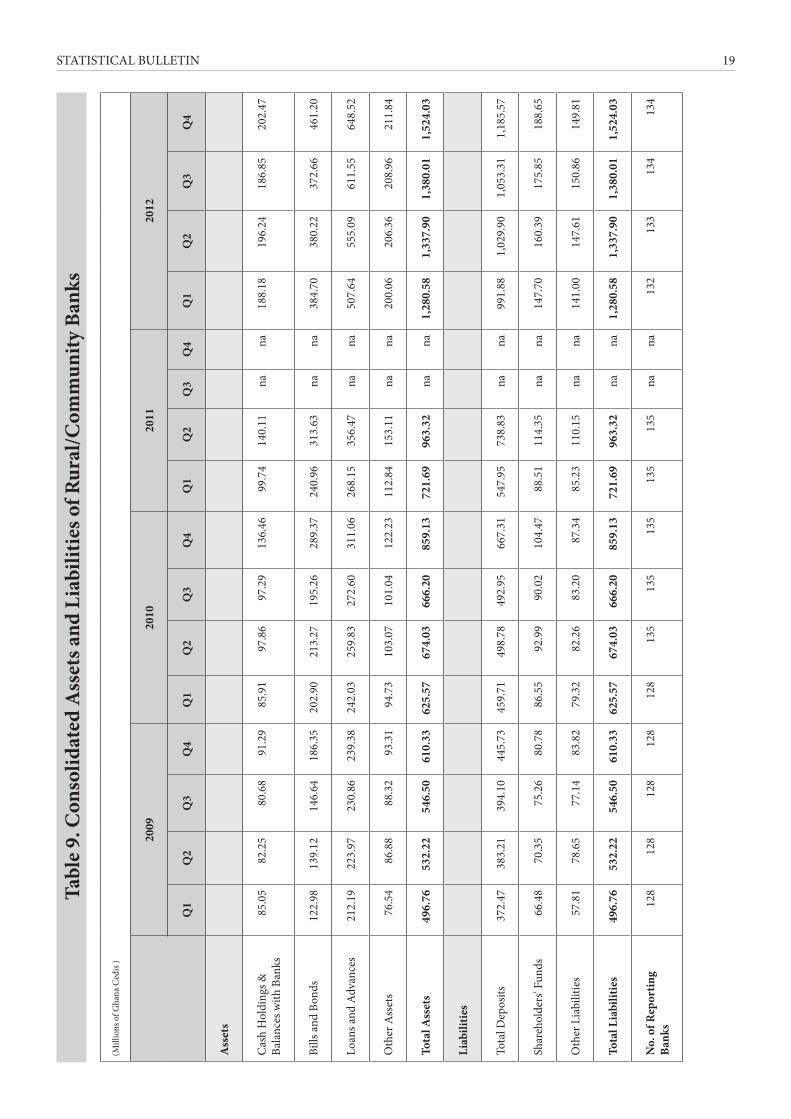
Tabl
e 9.
Con
solid
ated
Ass
ets a
nd L
iabi
litie
s of R
ural
/Com
mun
ity B
anks

STATISTICAL BULLETIN20
2010
2011
2012
Dec
Mar
Jun
Sep
Dec
Jan
Feb
Mar
Apr
May
Jun
July
Aug
Sep
Oct
Nov
Dec
1.C
ENTR
AL
BAN
K (E
ND
PER
IOD
RAT
ES)
a
. Red
iscou
nt R
ate
(Ban
k Ra
te)
b.
Prim
e Ra
te13
.50
13.5
013
.00
12.5
012
.50
12.5
013
.50
13.5
014
.50
14.5
0 15
.00
15.0
015
.00
15.0
015
.00
15.0
015
.00
BAN
K O
F G
HA
NA
BIL
LS
a
. 14-
Day
Disc
ount
Rat
es11
.70
11.7
011
.70
11.7
011
.70
11.7
011
.70
11.7
011
.70
11.7
011
.70
11.7
011
.70
11.7
011
.70
11.7
011
.70
b
. 14-
Day
Inte
rest
Rat
e Eq
uiva
lent
11.7
511
.75
11.7
511
.75
11.7
511
.75
11.7
511
.75
11.7
511
.75
11.7
511
.75
11.7
511
.75
11.7
511
.75
11.7
5
c
. 28
-Day
Disc
ount
Rat
es11
.97
11.7
511
.75
11.7
511
.75
11.7
511
.75
11.7
511
.75
17.3
018
.15
18.5
921
.04
22.1
822
.42
22.2
722
.38
d
. 28-
Day
Inte
rest
Rat
e Eq
uiva
lent
12.0
811
.86
11.8
611
.86
11.8
611
.86
11.8
611
.86
11.8
617
.53
17.5
318
.86
21.3
922
.56
22.8
122
.66
22.7
7
e
. 56-
Day
Disc
ount
Rat
es12
.00
11.7
711
.77
11.7
711
.77
11.7
711
.77
11.7
711
.77
11.7
719
.50
19.5
021
.00
21.5
221
.77
21.7
121
.73
f
. 56
-Day
Inte
rest
Rat
e Eq
uiva
lent
12.2
311
.99
11.9
911
.99
11.9
911
.99
11.9
911
.99
11.9
911
.99
20.1
020
.10
21.7
022
.25
22.5
222
.45
22.4
8
g.
27
0- D
ay In
tere
st R
ate
21.4
821
.48
21.4
821
.48
21.4
821
.48
21.4
8
h.
27
0-D
ay In
tere
st R
ate
Equi
vale
nt22
.21
22.2
122
.21
22.2
122
.21
22.2
125
.55
TREA
SURY
BIL
LS, N
OTE
S &
BO
ND
S
a
. 91
-Day
Disc
ount
Rat
e11
.91
11.7
510
.31
9.18
10.0
510
.56
11.0
311
.93
13.5
016
.23
20.5
821
.61
21.6
221
.78
21.8
321
.16
21.6
6
b
. 91
-Day
Inte
rest
Rat
e Eq
uiva
lent
12
.28
12.1
110
.58
9.39
10.3
010
.85
11.3
412
.30
13.9
716
.92
21.7
022
.85
22.8
523
.03
23.0
922
.34
22.9
0
c.
182
-Day
Disc
ount
Rat
e11
.93
11.7
710
.73
9.60
10.5
410
.60
11.1
611
.87
13.1
315
.93
19.8
520
.56
20.5
320
.51
20.6
120
.32
20.5
3
d.
182
-Day
Inte
rest
Rat
e Eq
uiva
lent
12
.68
12.5
111
.34
10.0
811
.13
11.1
911
.82
12.6
214
.05
17.3
122
.03
22.9
122
.88
22.8
522
.98
22.6
222
.88
e.
1-ye
ar F
ixed
Rat
e N
ote
12.6
512
.50
12.0
311
.20
11.3
011
.40
12.5
012
.90
15.9
020
.05
22.0
022
.00
22.5
022
.50
22.8
022
.80
22.9
0
f.
2-y
ear F
ixed
Rat
e N
ote
12.7
012
.49
12.1
111
.90
12.4
012
.30
12.7
013
.60
16.0
021
.15
23.0
023
.00
23.0
023
.00
23.0
023
.00
23.0
0
g.
3-y
ear F
ixed
Rat
e N
ote
13.3
013
.45
13.0
013
.00
12.0
014
.00
14.9
914
.99
14.9
924
.00
24.0
024
.00
24.0
024
.00
21.0
021
.00
24.0
0
h.
5-ye
ar F
ixed
Rat
e N
ote
13.6
713
.67
13.6
713
.67
14.0
014
.00
14.0
014
.00
14.0
014
.00
26.0
026
.00
26.0
026
.00
26.0
023
.00
23.0
0
INTE
R-BA
NK
MA
RK
ET
a
. In
ter-
bank
wei
ghte
d av
erag
e11
.65
11.5
911
.63
10.5
96.
556.
359.
8711
.26
12.6
9 13
.04
15.1
317
.23
16.7
017
.22
18.5
518
.64
17.1
1
2. C
OM
MER
CIA
L BA
NK
S
A. B
orro
win
g R
ates
. (%
)
i
. D
eman
d D
epos
its0.
25-7
.00
0.25
-6.7
50.
25-6
.50
0.25
-6.5
00.
25-6
.50
0.25
-6.5
00.
25-6
.50
0.25
-6.5
00.
25-6
.50
0.25
-6.5
00.
25-6
.50
0.25
-6.5
00.
25-6
.50
0.25
-6.5
00.
25-6
.50
0.25
-6.5
00.
25-6
.50
i
i. Sa
ving
s Dep
osits
2.00
-18.
001.
00-1
2.00
0.75
-8.0
00.
75-8
.00
0.10
-8.0
00.
10-8
.00
0.10
-8.0
00.
10-8
.00
0.10
-8.0
01.
00-1
0.00
1.0-
10.0
0.1-
10.0
0.1-
10.0
0.5-
10.0
0.5-
10.0
00.
5-10
.00
0.5-
10.0
0
i
ii. T
ime
Dep
osits
1
mon
th5.
25-2
3.00
5.00
-13.
203.
00-1
2.50
3.00
-11.
503.
00-1
1.50
3.00
-11.
503.
00-1
1.50
3.00
-11.
503.
00-1
4.50
2.50
-13.
03.
0-13
.03.
00-1
3.00
3.00
-14.
903.
00-1
4.95
3.50
-14.
653.
50-1
4.65
3.50
-14.
65
3
mon
ths
10.0
0-25
.75
4.00
-15.
004.
00-1
3.80
4.00
-12.
503.
00-1
2.50
3.00
-12.
503.
00-1
2.50
3.00
-12.
503.
00-1
2.50
3.00
-17.
303.
00-1
7.00
3.00
-17.
003.
00-1
8.00
3.00
-20.
903.
00-2
2.00
3.00
-22.
003.
00-2
2.00
6
mon
ths
10.0
0-27
.00
4.00
-15.
254.
00-1
4.00
4.00
-13.
003.
00-1
3.00
3.00
-13.
003.
00-1
3.00
3.00
-13.
005.
00-1
3.00
5.00
-17.
504.
00-1
7.00
4.00
-17.
004.
00-1
8.50
6.00
-18.
506.
00-2
3.30
6.00
-23.
006.
00-2
3.00
12
mon
ths
9.50
-26.
004.
50-1
5.50
5.00
-14.
504.
00-1
4.25
4.00
-14.
254.
00-1
4.25
4.00
-14.
254.
00-1
4.25
4.25
-14.
255.
25-1
7.50
2.00
-18.
002.
00-1
8.00
2.00
-19.
002.
00-2
1.70
4.25
-23.
004.
25-2
2.80
4.25
-22.
80
24
mon
ths
10.0
0-22
.00
3.50
-13.
152.
50-1
4.50
2.50
-14.
252.
50-1
4.25
2.50
-14.
252.
50-1
4.25
2.50
-14.
254.
50-1
4.25
4.50
-14.
254.
50-1
3.01
4.50
-17.
004.
50-1
9.00
4.50
-19.
004.
25-1
9.00
4.25
-19.
004.
25-1
9.00
36
mon
ths
14.0
0-18
.00
3.50
-12.
003.
00-1
4.50
3.00
-11.
503.
00-1
1.50
3.00
-11.
503.
00-1
1.50
3.00
-11.
503.
00-1
1.50
5.00
-11.
505.
00-1
3.02
5.00
-13.
005.
00-1
9.00
5.00
-19.
005.
00-1
9.00
5.00
-19.
005.
00-1
9.00
iv
. C
ertifi
cate
s of D
epos
it13
.00-
26.0
05.
75-1
2.50
5.75
-12.
503.
00-1
0.00
3.00
-10.
003.
00-1
0.00
7.50
-11.
507.
50-1
1.50
7.50
-11.
507.
50-1
1.50
7.50
-11.
507.
50-1
1.50
7.50
-11.
507.
50-1
1.50
7.50
-11.
507.
50-1
1.50
7.50
-11.
50
v.
C
all
Mon
ey4.
50-1
9.00
2.00
-13.
003.
00-1
2.00
3.00
-12.
003.
00 -
9.00
3.00
-9.0
03.
00-9
.00
3.00
-9.0
03.
00-9
.00
3.00
-9.0
02.
0-10
.51.
00-1
1.45
1.00
-11.
451.
00-1
1.45
1.00
-11.
451.
00-1
1.45
1.00
-11.
45
v
i. A
ny o
ther
10
.00-
15.4
24.
00-1
2.50
3.75
-12.
503.
75-1
2.50
2.00
-12.
502.
00-1
2.50
2.00
-12.
502.
00-1
2.50
2.00
-12.
502.
00-1
2.50
2.00
-12.
502.
00-1
2.50
2.00
-12.
503.
00-1
2.50
3.00
-12.
503.
00-1
2.50
3.00
-12.
50
B: L
endi
ng R
ates
.(%)
i
. A
gric
ultu
re, F
ores
try
& F
ishin
g24
.75-
40.0
019
.00-
34.6
419
.00-
34.9
019
.00-
34.9
016
.95-
34.9
016
.95-
34.9
016
.95-
34.9
016
.95-
34.9
016
.95-
34.9
016
.95-
34.9
014
.40-
34.9
014
.40-
34.9
014
.12-
34.9
014
.56-
37.3
114
.56-
37.3
114
.56-
37.3
114
.56-
37.3
1
i
i. E
xpor
t Tra
de25
.00-
40.0
019
.00-
35.1
519
.00-
34.9
019
.00-
34.9
016
.95-
34.9
016
.95-
34.9
016
.95-
34.9
016
.95-
34.9
016
.95-
34.9
016
.95-
34.9
014
.40-
34.9
014
.40-
34.9
014
.12-
34.9
014
.56-
37.3
114
.56-
37.3
114
.56-
37.3
114
.56-
37.3
1
i
ii. M
anuf
actu
ring
25.0
0-40
.00
19.0
0-35
.53
19.0
0-34
.90
19.0
0-34
.90
16.9
5-34
.90
16.9
5-34
.90
16.9
5-34
.90
16.9
5-34
.90
16.9
5-34
.90
16.9
5-34
.90
14.4
0-34
.90
14.4
0-34
.90
14.1
2-34
.90
14.5
6-37
.31
14.5
6-37
.31
14.5
6-37
.31
14.5
6-37
.31
i
v. M
inin
g &
Qua
rryi
ng25
.00-
40.0
019
.00-
36.0
219
.00-
34.9
019
.00-
34.9
016
.95-
34.9
016
.95-
34.9
016
.95-
34.9
016
.95-
34.9
016
.95-
34.9
016
.95-
34.9
014
.40-
34.9
014
.40-
34.9
014
.12-
34.9
014
.56-
37.3
114
.56-
37.3
114
.56-
37.3
114
.56-
37.3
1
v
. C
onst
ruct
ion
25.0
0-40
.00
19.0
0-36
.02
19.0
0-34
.90
19.0
0-34
.90
16.9
5-34
.90
16.9
5-34
.90
16.9
5-34
.90
16.9
5-34
.90
16.9
5-34
.90
16.9
5-34
.90
14.4
0-34
.90
14.4
0-34
.90
14.1
2-34
.90
14.5
6-37
.31
14.5
6-37
.31
14.5
6-37
.31
14.5
6-37
.31
v
i. O
ther
s25
.00-
40.0
019
.00-
36.0
219
.00-
34.9
019
.00-
34.9
016
.95-
34.9
016
.95-
34.9
016
.95-
34.9
016
.95-
34.9
016
.95-
34.9
016
.95-
34.9
014
.40-
34.9
014
.40-
34.9
014
.12-
34.9
014
.56-
37.3
114
.56-
37.3
114
.56-
37.3
114
.56-
37.3
1
C: B
ase
Rat
es (%
)24
.74-
32.0
021
.50-
27.0
020
.00-
27.0
018
.00-
27.0
016
.95-
25.9
516
.95-
25.9
516
.95-
25.9
516
.95-
25.9
516
.95-
25.9
516
.95-
25.9
514
.40-
25.9
514
.40-
25.9
512
.37-
26.5
014
.56-
26.0
012
.37-
26.5
012
.37-
26.5
012
.37-
26.5
0
Tabl
e 10
. Int
eres
t R
ates
- R
ange
s - (%
)
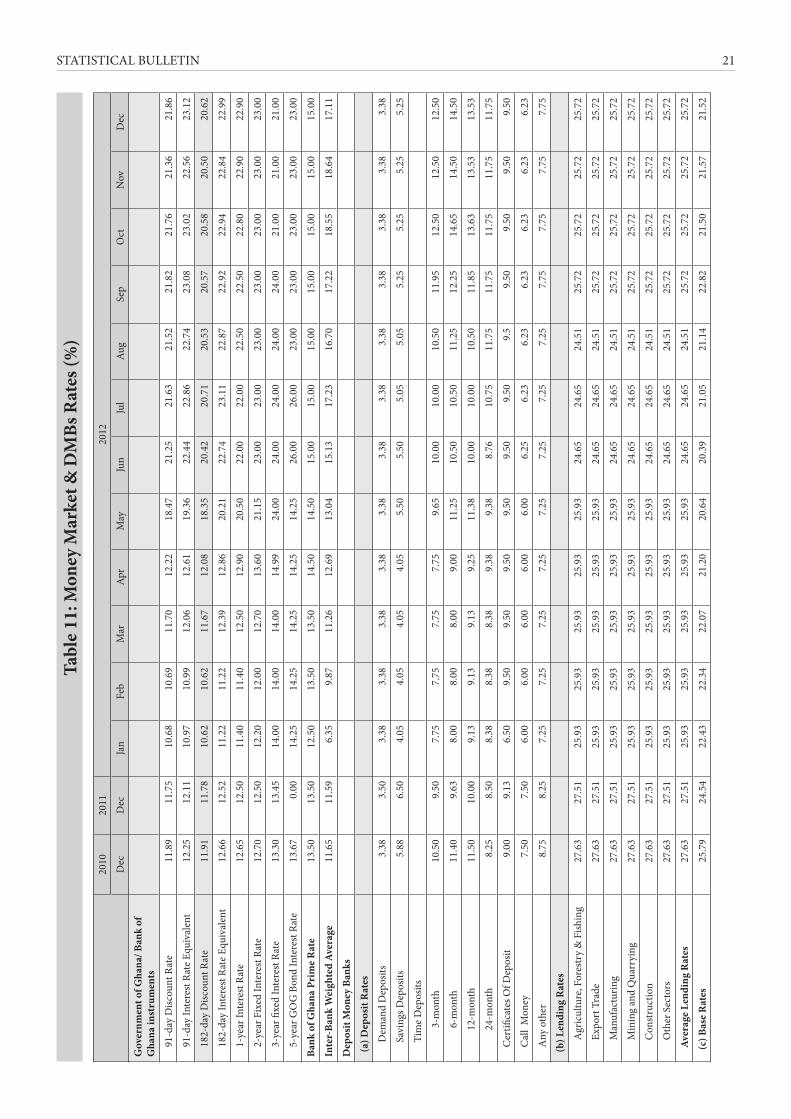
STATISTICAL BULLETIN 21
2010
2011
2012
Dec
Dec
Jan
Feb
Mar
Apr
May
Jun
Jul
Aug
Sep
Oct
Nov
Dec
Gov
ernm
ent o
f Gha
na/ B
ank
of
Gha
na in
stru
men
ts
9
1-da
y D
iscou
nt R
ate
11.8
911
.75
10.6
810
.69
11.7
012
.22
18.4
721
.25
21.6
321
.52
21.8
221
.76
21.3
621
.86
9
1-da
y In
tere
st R
ate
Equi
vale
nt12
.25
12.1
110
.97
10.9
912
.06
12.6
119
.36
22.4
422
.86
22.7
423
.08
23.0
222
.56
23.1
2
1
82-d
ay D
iscou
nt R
ate
11.9
111
.78
10.6
210
.62
11.6
712
.08
18.3
520
.42
20.7
120
.53
20.5
720
.58
20.5
020
.62
1
82-d
ay In
tere
st R
ate
Equi
vale
nt12
.66
12.5
211
.22
11.2
212
.39
12.8
620
.21
22.7
423
.11
22.8
722
.92
22.9
422
.84
22.9
9
1
-yea
r Int
eres
t Rat
e12
.65
12.5
011
.40
11.4
012
.50
12.9
020
.50
22.0
022
.00
22.5
022
.50
22.8
022
.90
22.9
0
2
-yea
r Fix
ed In
tere
st R
ate
12.7
012
.50
12.2
012
.00
12.7
013
.60
21.1
523
.00
23.0
023
.00
23.0
023
.00
23.0
023
.00
3
-yea
r fixe
d In
tere
st R
ate
13.3
013
.45
14.0
014
.00
14.0
014
.99
24.0
024
.00
24.0
024
.00
24.0
021
.00
21.0
021
.00
5
-yea
r GO
G B
ond
Inte
rest
Rat
e13
.67
0.00
14.2
514
.25
14.2
514
.25
14.2
526
.00
26.0
023
.00
23.0
023
.00
23.0
023
.00
Bank
of G
hana
Pri
me
Rat
e13
.50
13.5
012
.50
13.5
013
.50
14.5
014
.50
15.0
015
.00
15.0
015
.00
15.0
015
.00
15.0
0
Inte
r-Ba
nk W
eigh
ted
Aver
age
11.6
511
.59
6.35
9.87
11.2
612
.69
13.0
415
.13
17.2
316
.70
17.2
218
.55
18.6
417
.11
Dep
osit
Mon
ey B
anks
(a)
Dep
osit
Rat
es
Dem
and
Dep
osits
3.38
3.50
3.38
3.38
3.38
3.38
3.38
3.38
3.38
3.38
3.38
3.38
3.38
3.38
Savi
ngs D
epos
its5.
886.
504.
054.
054.
054.
055.
505.
505.
055.
055.
255.
255.
255.
25
Tim
e D
epos
its
3-m
onth
10.5
09.
507.
757.
757.
757.
759.
6510
.00
10.0
010
.50
11.9
512
.50
12.5
012
.50
6-m
onth
11.4
09.
638.
008.
008.
009.
0011
.25
10.5
010
.50
11.2
512
.25
14.6
514
.50
14.5
0
1
2-m
onth
11.5
010
.00
9.13
9.13
9.13
9.25
11.3
810
.00
10.0
010
.50
11.8
513
.63
13.5
313
.53
2
4-m
onth
8.25
8.50
8.38
8.38
8.38
9.38
9.38
8.76
10.7
511
.75
11.7
511
.75
11.7
511
.75
C
ertifi
cate
s Of D
epos
it9.
009.
136.
509.
509.
509.
509.
509.
509.
509.
59.
509.
509.
509.
50
C
all
Mon
ey7.
507.
506.
006.
006.
006.
006.
006.
256.
236.
236.
236.
236.
236.
23
A
ny o
ther
8.
758.
257.
257.
257.
257.
257.
257.
257.
257.
257.
757.
757.
757.
75
(b)
Len
ding
Rat
es
Agr
icul
ture
, For
estr
y &
Fish
ing
27.6
327
.51
25.9
325
.93
25.9
325
.93
25.9
324
.65
24.6
524
.51
25.7
225
.72
25.7
225
.72
Exp
ort T
rade
27.6
327
.51
25.9
325
.93
25.9
325
.93
25.9
324
.65
24.6
524
.51
25.7
225
.72
25.7
225
.72
Man
ufac
turin
g27
.63
27.5
125
.93
25.9
325
.93
25.9
325
.93
24.6
524
.65
24.5
125
.72
25.7
225
.72
25.7
2
Min
ing
and
Qua
rryi
ng27
.63
27.5
125
.93
25.9
325
.93
25.9
325
.93
24.6
524
.65
24.5
125
.72
25.7
225
.72
25.7
2
Con
stru
ctio
n27
.63
27.5
125
.93
25.9
325
.93
25.9
325
.93
24.6
524
.65
24.5
125
.72
25.7
225
.72
25.7
2
Oth
er S
ecto
rs27
.63
27.5
125
.93
25.9
325
.93
25.9
325
.93
24.6
524
.65
24.5
125
.72
25.7
225
.72
25.7
2
Av
erag
e Le
ndin
g R
ates
27.6
327
.51
25.9
325
.93
25.9
325
.93
25.9
324
.65
24.6
524
.51
25.7
225
.72
25.7
225
.72
(c)
Bas
e R
ates
25
.79
24.5
422
.43
22.3
422
.07
21.2
020
.64
20.3
921
.05
21.1
422
.82
21.5
021
.57
21.5
2
Tabl
e 11
: Mon
ey M
arke
t & D
MBs
Rat
es (%
)
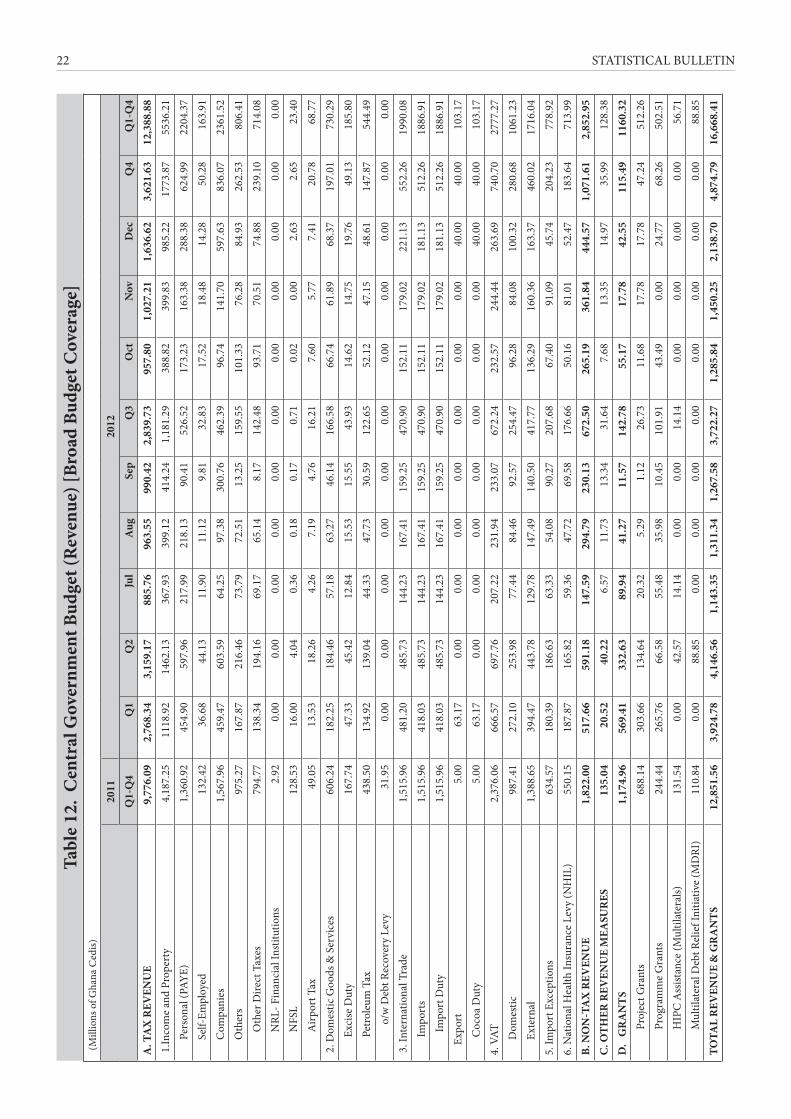
STATISTICAL BULLETIN22
(M
illio
ns o
f Gha
na C
edis)
2011
2012
Q1-
Q4
Q1
Q2
Jul
Aug
Sep
Q3
Oct
Nov
Dec
Q4
Q1-
Q4
A. T
AX
REV
ENU
E9,
776.
092,
768.
343,
159.
1788
5.76
963.
5599
0.42
2,83
9.73
957.
801,
027.
211,
636.
623,
621.
6312
,388
.88
1.In
com
e an
d Pr
oper
ty4,
187.
2511
18.9
214
62.1
336
7.93
399.
1241
4.24
1,1
81.2
9 38
8.82
399.
8398
5.22
1773
.87
5536
.21
Pers
onal
(PAY
E)1,
360.
9245
4.90
597.
9621
7.99
218.
1390
.41
526.
5217
3.23
163.
3828
8.38
624.
9922
04.3
7
Se
lf-Em
ploy
ed13
2.42
36.6
844
.13
11.9
011
.12
9.81
32.8
317
.52
18.4
814
.28
50.2
816
3.91
Com
pani
es1,
567.
9645
9.47
603.
5964
.25
97.3
830
0.76
462.
3996
.74
141.
7059
7.63
836.
0723
61.5
2
O
ther
s97
5.27
167.
8721
6.46
73.7
972
.51
13.2
515
9.55
101.
3376
.28
84.9
326
2.53
806.
41
Oth
er D
irect
Tax
es79
4.77
138.
3419
4.16
69.1
765
.14
8.17
142.
4893
.71
70.5
174
.88
239.
1071
4.08
N
RL- F
inan
cial
Inst
itutio
ns2.
920.
000.
000.
000.
000.
000.
000.
000.
000.
000.
000.
00
NFS
L 12
8.53
16.0
04.
040.
360.
180.
170.
710.
020.
002.
632.
6523
.40
A
irpor
t Tax
49.0
513
.53
18.2
64.
267.
194.
7616
.21
7.60
5.77
7.41
20.7
868
.77
2. D
omes
tic G
oods
& S
ervi
ces
606.
2418
2.25
184.
4657
.18
63.2
746
.14
166.
5866
.74
61.8
968
.37
197.
0173
0.29
Exc
ise D
uty
167.
7447
.33
45.4
212
.84
15.5
315
.55
43.9
314
.62
14.7
519
.76
49.1
318
5.80
Pet
role
um T
ax43
8.50
134.
9213
9.04
44.3
347
.73
30.5
912
2.65
52.1
247
.15
48.6
114
7.87
544.
49
o/
w D
ebt R
ecov
ery
Levy
31.9
50.
000.
000.
000.
000.
000.
000.
000.
000.
000.
000.
00 3
. Int
erna
tiona
l Tra
de1,
515.
9648
1.20
485.
7314
4.23
167.
4115
9.25
470.
9015
2.11
179.
0222
1.13
552.
2619
90.0
8
Im
port
s1,
515.
9641
8.03
485.
7314
4.23
167.
4115
9.25
470.
9015
2.11
179.
0218
1.13
512.
2618
86.9
1
Impo
rt D
uty
1,51
5.96
418.
0348
5.73
144.
2316
7.41
159.
2547
0.90
152.
1117
9.02
181.
1351
2.26
1886
.91
E
xpor
t5.
0063
.17
0.00
0.00
0.00
0.00
0.00
0.00
0.00
40.0
040
.00
103.
17
C
ocoa
Dut
y5.
0063
.17
0.00
0.00
0.00
0.00
0.00
0.00
0.00
40.0
040
.00
103.
174.
VAT
2,37
6.06
666.
5769
7.76
207.
2223
1.94
233.
0767
2.24
232.
5724
4.44
263.
6974
0.70
2777
.27
Dom
estic
987.
4127
2.10
253.
9877
.44
84.4
692
.57
254.
4796
.28
84.0
810
0.32
280.
6810
61.2
3
Ex
tern
al1,
388.
6539
4.47
443.
7812
9.78
147.
4914
0.50
417.
7713
6.29
160.
3616
3.37
460.
0217
16.0
45.
Impo
rt E
xcep
tions
634.
5718
0.39
186.
6363
.33
54.0
890
.27
207.
6867
.40
91.0
945
.74
204.
2377
8.92
6. N
atio
nal H
ealth
Insu
ranc
e Le
vy (N
HIL
)55
0.15
187.
8716
5.82
59.3
647
.72
69.5
817
6.66
50.1
681
.01
52.4
718
3.64
713.
99B.
NO
N-T
AX
REV
ENU
E1,
822.
0051
7.66
591.
18 1
47.5
9 2
94.7
9 2
30.1
3 6
72.5
0 2
65.1
9 3
61.8
4 4
44.5
7 1
,071
.61
2,8
52.9
5 C
. OTH
ER R
EVEN
UE
MEA
SUR
ES13
5.04
20.5
240
.22
6.57
11.7
313
.34
31.6
47.
6813
.35
14.9
735
.99
128.
38D
. G
RA
NTS
1,17
4.96
569.
4133
2.63
89.9
441
.27
11.5
714
2.78
55.1
717
.78
42.5
511
5.49
1160
.32
P
roje
ct G
rant
s68
8.14
303.
6613
4.64
20.3
25.
291.
1226
.73
11.6
817
.78
17.7
847
.24
512.
26
Pro
gram
me
Gra
nts
244.
4426
5.76
66.5
855
.48
35.9
810
.45
101.
9143
.49
0.00
24.7
768
.26
502.
51
HIP
C A
ssist
ance
(Mul
tilat
eral
s)13
1.54
0.00
42.5
714
.14
0.00
0.00
14.1
40.
000.
000.
000.
0056
.71
M
ultil
ater
al D
ebt R
elie
f Ini
tiativ
e (M
DRI
)11
0.84
0.00
88.8
50.
000.
000.
000.
000.
000.
000.
000.
0088
.85
TOTA
L R
EVEN
UE
& G
RA
NTS
12,8
51.5
63,
924.
784,
146.
561,
143.
351,
311.
341,
267.
583,
722.
271,
285.
841,
450.
252,
138.
704,
874.
7916
,668
.41
Tabl
e 12
. C
entr
al G
over
nmen
t Bud
get (
Rev
enue
) [Br
oad
Budg
et C
over
age]
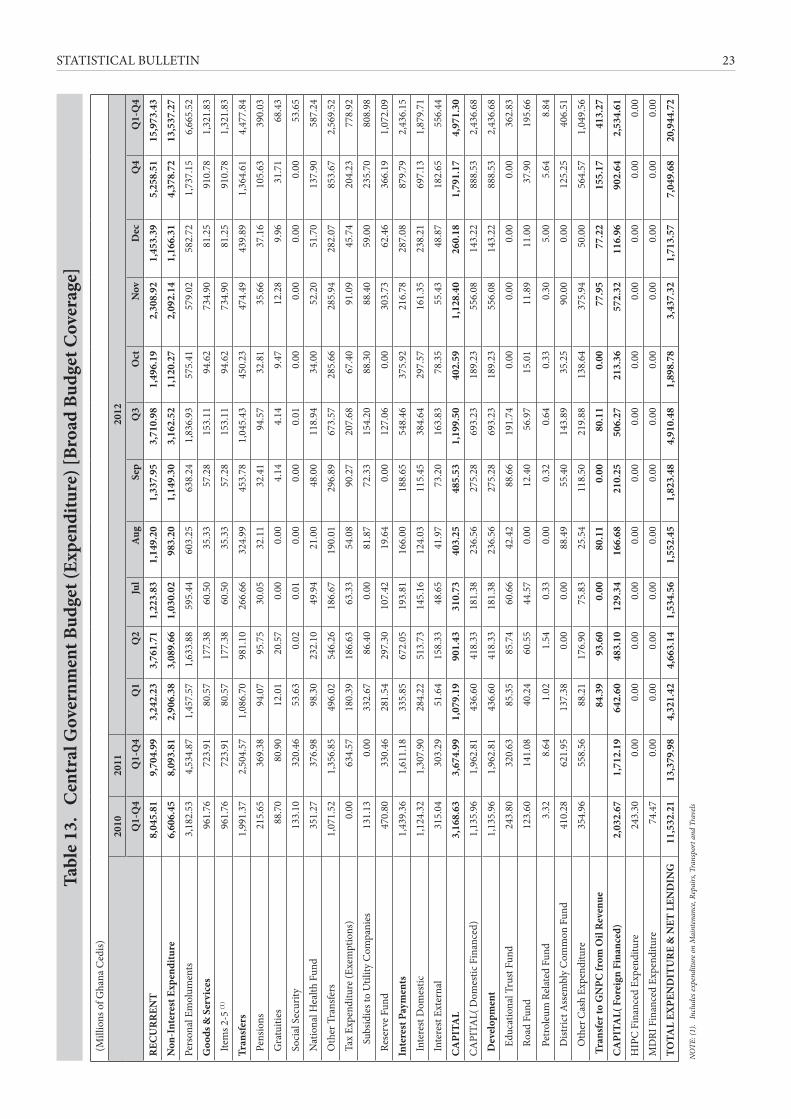
STATISTICAL BULLETIN 23
(M
illio
ns o
f Gha
na C
edis)
2010
2011
2012
Q1-
Q4
Q1-
Q4
Q1
Q2
Jul
Aug
Sep
Q3
Oct
Nov
Dec
Q4
Q1-
Q4
REC
UR
REN
T8,
045.
819,
704.
993,
242.
233,
761.
711,
223.
831,
149.
201,
337.
953,
710.
981,
496.
192,
308.
921,
453.
395,
258.
5115
,973
.43
Non
-Int
eres
t Exp
endi
ture
6,60
6.45
8,09
3.81
2,90
6.38
3,08
9.66
1,03
0.02
983.
201,
149.
303,
162.
521,
120.
272,
092.
141,
166.
314,
378.
7213
,537
.27
Pers
onal
Em
olum
ents
3,18
2.53
4,53
4.87
1,45
7.57
1,63
3.88
595.
4460
3.25
638.
241,
836.
9357
5.41
579.
0258
2.72
1,73
7.15
6,66
5.52
Goo
ds &
Ser
vice
s96
1.76
723.
9180
.57
177.
3860
.50
35.3
357
.28
153.
1194
.62
734.
9081
.25
910.
781,
321.
83
Ite
ms 2
-5 (1
)96
1.76
723.
9180
.57
177.
3860
.50
35.3
357
.28
153.
1194
.62
734.
9081
.25
910.
781,
321.
83
Tran
sfer
s1,
991.
372,
504.
571,
086.
7098
1.10
266.
6632
4.99
453.
781,
045.
4345
0.23
474.
4943
9.89
1,36
4.61
4,47
7.84
Pen
sions
215.
6536
9.38
94.0
795
.75
30.0
532
.11
32.4
194
.57
32.8
135
.66
37.1
610
5.63
390.
03
Gra
tuiti
es88
.70
80.9
012
.01
20.5
70.
000.
004.
144.
149.
4712
.28
9.96
31.7
168
.43
Soc
ial S
ecur
ity13
3.10
320.
4653
.63
0.02
0.01
0.00
0.00
0.01
0.00
0.00
0.00
0.00
53.6
5
Nat
iona
l Hea
lth F
und
351.
2737
6.98
98.3
023
2.10
49.9
421
.00
48.0
011
8.94
34.0
052
.20
51.7
013
7.90
587.
24
Oth
er T
rans
fers
1,07
1.52
1,35
6.85
496.
0254
6.26
186.
6719
0.01
296.
8967
3.57
285.
6628
5.94
282.
0785
3.67
2,56
9.52
Tax
Exp
endi
ture
(Exe
mpt
ions
)0.
0063
4.57
180.
3918
6.63
63.3
354
.08
90.2
720
7.68
67.4
091
.09
45.7
420
4.23
778.
92
S
ubsid
ies t
o U
tility
Com
pani
es13
1.13
0.00
332.
6786
.40
0.00
81.8
772
.33
154.
2088
.30
88.4
059
.00
235.
7080
8.98
Res
erve
Fun
d47
0.80
330.
4628
1.54
297.
3010
7.42
19.6
40.
0012
7.06
0.00
303.
7362
.46
366.
191,
072.
09
Inte
rest
Pay
men
ts1,
439.
361,
611.
1833
5.85
672.
0519
3.81
166.
0018
8.65
548.
4637
5.92
216.
7828
7.08
879.
792,
436.
15
Int
eres
t Dom
estic
1,12
4.32
1,30
7.90
284.
2251
3.73
145.
1612
4.03
115.
4538
4.64
297.
5716
1.35
238.
2169
7.13
1,87
9.71
Int
eres
t Ext
erna
l31
5.04
303.
2951
.64
158.
3348
.65
41.9
773
.20
163.
8378
.35
55.4
348
.87
182.
6555
6.44
CA
PITA
L3,
168.
633,
674.
991,
079.
1990
1.43
310.
7340
3.25
485.
531,
199.
5040
2.59
1,12
8.40
260.
181,
791.
174,
971.
30
CA
PITA
L( D
omes
tic F
inan
ced)
1,13
5.96
1,96
2.81
436.
6041
8.33
181.
3823
6.56
275.
2869
3.23
189.
2355
6.08
143.
2288
8.53
2,43
6.68
Dev
elop
men
t1,
135.
961,
962.
8143
6.60
418.
3318
1.38
236.
5627
5.28
693.
2318
9.23
556.
0814
3.22
888.
532,
436.
68
E
duca
tiona
l Tru
st F
und
243.
8032
0.63
85.3
585
.74
60.6
642
.42
88.6
619
1.74
0.00
0.00
0.00
0.00
362.
83
R
oad
Fund
123.
6014
1.08
40.2
460
.55
44.5
70.
0012
.40
56.9
715
.01
11.8
911
.00
37.9
019
5.66
P
etro
leum
Rel
ated
Fun
d3.
328.
641.
021.
540.
330.
000.
320.
640.
330.
305.
005.
648.
84
D
istric
t Ass
embl
y C
omm
on F
und
410.
2862
1.95
137.
380.
000.
0088
.49
55.4
014
3.89
35.2
590
.00
0.00
125.
2540
6.51
O
ther
Cas
h Ex
pend
iture
354.
9655
8.56
88.2
117
6.90
75.8
325
.54
118.
5021
9.88
138.
6437
5.94
50.0
056
4.57
1,04
9.56
Tra
nsfe
r to
GN
PC fr
om O
il R
even
ue84
.39
93.6
00.
0080
.11
0.00
80.1
10.
0077
.95
77.2
215
5.17
413.
27
CA
PITA
L( F
orei
gn F
inan
ced)
2,03
2.67
1,71
2.19
642.
6048
3.10
129.
3416
6.68
210.
2550
6.27
213.
3657
2.32
116.
9690
2.64
2,53
4.61
HIP
C F
inan
ced
Expe
nditu
re24
3.30
0.00
0.00
0.00
0.00
0.00
0.00
0.00
0.00
0.00
0.00
0.00
0.00
MD
RI F
inan
ced
Expe
nditu
re74
.47
0.00
0.00
0.00
0.00
0.00
0.00
0.00
0.00
0.00
0.00
0.00
0.00
TOTA
L EX
PEN
DIT
UR
E &
NET
LEN
DIN
G11
,532
.21
13,3
79.9
84,
321.
424,
663.
141,
534.
561,
552.
451,
823.
484,
910.
481,
898.
783,
437.
321,
713.
577,
049.
6820
,944
.72
Tabl
e 13
. C
entr
al G
over
nmen
t Bud
get (
Expe
nditu
re) [
Broa
d Bu
dget
Cov
erag
e]
NO
TE: (
1).
Inclu
des e
xpen
ditu
re o
n M
aint
enan
ce, R
epai
rs, T
rans
port
and
Tra
vels
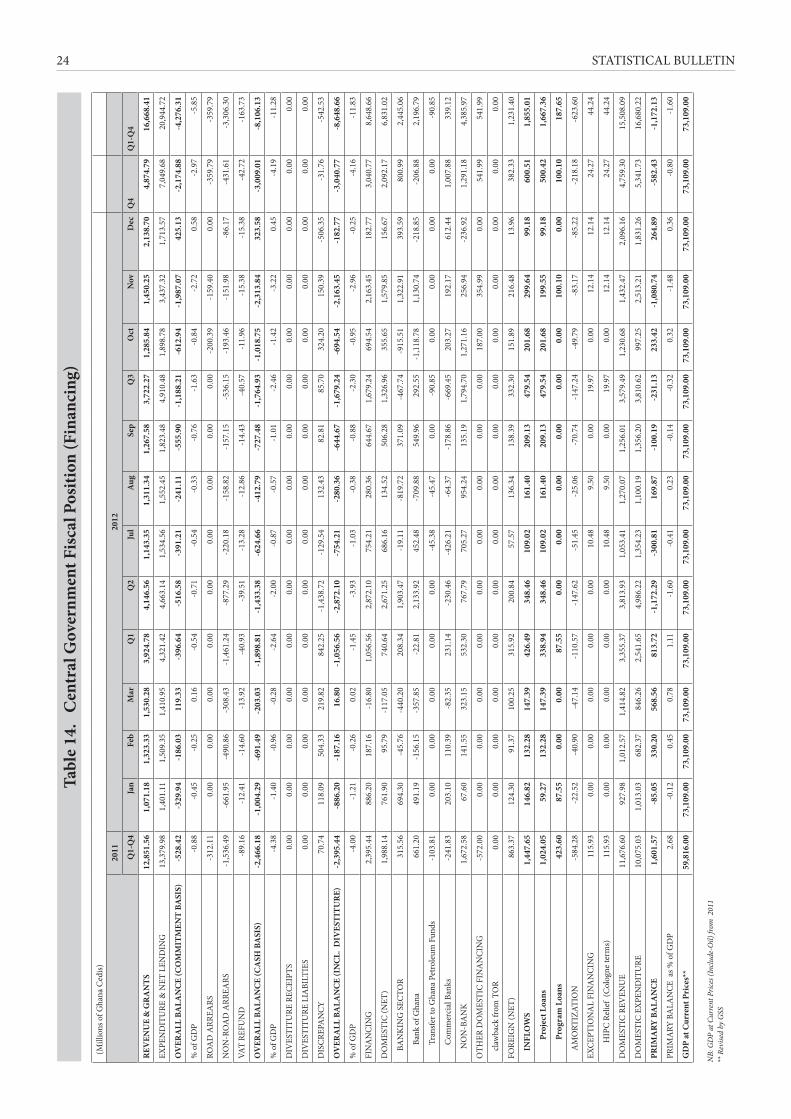
STATISTICAL BULLETIN24
(M
illio
ns o
f Gha
na C
edis)
2011
2012
Q1-
Q4
Jan
Feb
Mar
Q1
Q2
Jul
Aug
Sep
Q3
Oct
Nov
Dec
Q4
Q1-
Q4
REV
ENU
E &
GR
AN
TS12
,851
.56
1,07
1.18
1,32
3.33
1,53
0.28
3,92
4.78
4,14
6.56
1,14
3.35
1,31
1.34
1,26
7.58
3,72
2.27
1,28
5.84
1,45
0.25
2,13
8.70
4,87
4.79
16,6
68.4
1
EXPE
ND
ITU
RE &
NET
LEN
DIN
G13
,379
.98
1,40
1.11
1,50
9.35
1,41
0.95
4,32
1.42
4,66
3.14
1,53
4.56
1,55
2.45
1,82
3.48
4,91
0.48
1,89
8.78
3,43
7.32
1,71
3.57
7,04
9.68
20,9
44.7
2
OV
ERA
LL B
ALA
NC
E (C
OM
MIT
MEN
T BA
SIS)
-528
.42
-329
.94
-186
.03
119.
33-3
96.6
4-5
16.5
8-3
91.2
1-2
41.1
1-5
55.9
0-1
,188
.21
-612
.94
-1,9
87.0
742
5.13
-2,1
74.8
8-4
,276
.31
% o
f GD
P-0
.88
-0.4
5-0
.25
0.16
-0.5
4-0
.71
-0.5
4-0
.33
-0.7
6-1
.63
-0.8
4-2
.72
0.58
-2.9
7-5
.85
ROA
D A
RREA
RS
-312
.11
0.00
0.00
0.00
0.00
0.00
0.00
0.00
0.00
0.00
-200
.39
-159
.40
0.00
-359
.79
-359
.79
NO
N-R
OA
D A
RREA
RS-1
,536
.49
-661
.95
-490
.86
-308
.43
-1,4
61.2
4-8
77.2
9-2
20.1
8-1
58.8
2-1
57.1
5-5
36.1
5-1
93.4
6-1
51.9
8-8
6.17
-431
.61
-3,3
06.3
0
VAT
REFU
ND
-89.
16-1
2.41
-14.
60-1
3.92
-40.
93-3
9.51
-13.
28-1
2.86
-14.
43-4
0.57
-11.
96-1
5.38
-15.
38-4
2.72
-163
.73
OV
ERA
LL B
ALA
NC
E (C
ASH
BA
SIS)
-2,4
66.1
8-1
,004
.29
-691
.49
-203
.03
-1,8
98.8
1-1
,433
.38
-624
.66
-412
.79
-727
.48
-1,7
64.9
3-1
,018
.75
-2,3
13.8
432
3.58
-3,0
09.0
1-8
,106
.13
% o
f GD
P-4
.38
-1.4
0-0
.96
-0.2
8-2
.64
-2.0
0-0
.87
-0.5
7-1
.01
-2.4
6-1
.42
-3.2
20.
45-4
.19
-11.
28
DIV
ESTI
TURE
REC
EIPT
S0.
000.
000.
000.
000.
000.
000.
000.
000.
000.
000.
000.
000.
000.
000.
00
DIV
ESTI
TURE
LIA
BILT
IES
0.00
0.00
0.00
0.00
0.00
0.00
0.00
0.00
0.00
0.00
0.00
0.00
0.00
0.00
0.00
DIS
CRE
PAN
CY
70.7
411
8.09
504.
3321
9.82
842.
25-1
,438
.72
-129
.54
132.
4382
.81
85.7
032
4.20
150.
39-5
06.3
5-3
1.76
-542
.53
OV
ERA
LL B
ALA
NC
E (I
NC
L. D
IVES
TITU
RE)
-2,3
95.4
4-8
86.2
0-1
87.1
616
.80
-1,0
56.5
6-2
,872
.10
-754
.21
-280
.36
-644
.67
-1,6
79.2
4-6
94.5
4-2
,163
.45
-182
.77
-3,0
40.7
7-8
,648
.66
% o
f GD
P-4
.00
-1.2
1-0
.26
0.02
-1.4
5-3
.93
-1.0
3-0
.38
-0.8
8-2
.30
-0.9
5-2
.96
-0.2
5-4
.16
-11.
83
FIN
AN
CIN
G2,
395.
4488
6.20
187.
16-1
6.80
1,05
6.56
2,87
2.10
754.
2128
0.36
644.
671,
679.
2469
4.54
2,16
3.45
182.
773,
040.
778,
648.
66
DO
MES
TIC
(NET
)1,
988.
1476
1.90
95.7
9-1
17.0
574
0.64
2,67
1.25
686.
1613
4.52
506.
281,
326.
9635
5.65
1,57
9.85
156.
672,
092.
176,
831.
02
B
AN
KIN
G S
ECTO
R31
5.56
694.
30-4
5.76
-440
.20
208.
341,
903.
47-1
9.11
-819
.72
371.
09-4
67.7
4-9
15.5
11,
322.
9139
3.59
800.
992,
445.
06
Ban
k of
Gha
na66
1.20
491.
19-1
56.1
5-3
57.8
5-2
2.81
2,13
3.92
452.
48-7
09.8
854
9.96
292.
55-1
,118
.78
1,13
0.74
-218
.85
-206
.88
2,19
6.79
Tra
nsfe
r to
Gha
na P
etro
leum
Fun
ds-1
03.8
10.
000.
000.
000.
000.
00-4
5.38
-45.
470.
00-9
0.85
0.00
0.00
0.00
0.00
-90.
85
Com
mer
cial
Ban
ks-2
41.8
320
3.10
110.
39-8
2.35
231.
14-2
30.4
6-4
26.2
1-6
4.37
-178
.86
-669
.45
203.
2719
2.17
612.
441,
007.
8833
9.12
N
ON
-BA
NK
1,
672.
5867
.60
141.
5532
3.15
532.
3076
7.79
705.
2795
4.24
135.
191,
794.
701,
271.
1625
6.94
-236
.92
1,29
1.18
4,38
5.97
OTH
ER D
OM
ESTI
C F
INA
NC
ING
-572
.00
0.00
0.00
0.00
0.00
0.00
0.00
0.00
0.00
0.00
187.
0035
4.99
0.00
541.
9954
1.99
cl
awba
ck fr
om T
OR
0.00
0.00
0.00
0.00
0.00
0.00
0.00
0.00
0.00
0.00
0.00
0.00
0.00
0.00
0.00
FORE
IGN
(NET
)86
3.37
124.
3091
.37
100.
2531
5.92
200.
8457
.57
136.
3413
8.39
332.
3015
1.89
216.
4813
.96
382.
331,
231.
40
IN
FLO
WS
1,44
7.65
146.
8213
2.28
147.
3942
6.49
348.
4610
9.02
161.
4020
9.13
479.
5420
1.68
299.
6499
.18
600.
511,
855.
01
Pro
ject
Loa
ns1,
024.
0559
.27
132.
2814
7.39
338.
9434
8.46
109.
0216
1.40
209.
1347
9.54
201.
6819
9.55
99.1
850
0.42
1,66
7.36
Pro
gram
Loa
ns42
3.60
87.5
50.
000.
0087
.55
0.00
0.00
0.00
0.00
0.00
0.00
100.
100.
0010
0.10
187.
65
A
MO
RTIZ
ATIO
N-5
84.2
8-2
2.52
-40.
90-4
7.14
-110
.57
-147
.62
-51.
45-2
5.06
-70.
74-1
47.2
4-4
9.79
-83.
17-8
5.22
-218
.18
-623
.60
EXC
EPTI
ON
AL
FIN
AN
CIN
G11
5.93
0.00
0.00
0.00
0.00
0.00
10.4
89.
500.
0019
.97
0.00
12.1
412
.14
24.2
744
.24
HIP
C R
elie
f (C
olog
ne te
rms)
115.
930.
000.
000.
000.
000.
0010
.48
9.50
0.00
19.9
70.
0012
.14
12.1
424
.27
44.2
4
DO
MES
TIC
REV
ENU
E11
,676
.60
927.
981,
012.
571,
414.
823,
355.
373,
813.
931,
053.
411,
270.
071,
256.
013,
579.
491,
230.
681,
432.
472,
096.
164,
759.
3015
,508
.09
DO
MES
TIC
EX
PEN
DIT
URE
10,0
75.0
31,
013.
0368
2.37
846.
262,
541.
654,
986.
221,
354.
231,
100.
191,
356.
203,
810.
6299
7.25
2,51
3.21
1,83
1.26
5,34
1.73
16,6
80.2
2
PRIM
ARY
BA
LAN
CE
1,60
1.57
-85.
0533
0.20
568.
5681
3.72
-1,1
72.2
9-3
00.8
116
9.87
-100
.19
-231
.13
233.
42-1
,080
.74
264.
89-5
82.4
3-1
,172
.13
PRIM
ARY
BA
LAN
CE
as %
of G
DP
2.68
-0.1
20.
450.
781.
11-1
.60
-0.4
10.
23-0
.14
-0.3
20.
32-1
.48
0.36
-0.8
0-1
.60
GD
P at
Cur
rent
Pri
ces*
*59
,816
.00
73,1
09.0
073
,109
.00
73,1
09.0
073
,109
.00
73,1
09.0
073
,109
.00
73,1
09.0
073
,109
.00
73,1
09.0
073
,109
.00
73,1
09.0
073
,109
.00
73,1
09.0
073
,109
.00
Tabl
e 14
. C
entr
al G
over
nmen
t Fis
cal P
ositi
on (F
inan
cing
)
NB:
GD
P at
Cur
rent
Pric
es (I
nclu
de-O
il) fr
om 2
011
** R
evise
d by
GSS

STATISTICAL BULLETIN 25 (
Mill
ions
of G
hana
Ced
is)
2011
2012
*
Jan-
Dec
Jan
Feb
Mar
Jan-
Mar
chA
prM
ayJu
nJa
n-Ju
nJu
lA
ugSe
pJa
n-Se
pO
ctN
ovD
ecJa
n-D
ec
TOTA
L R
ECEI
PTS
10,6
78.6
665
1.27
1,20
5.86
1,29
1.80
3,14
8.93
808.
031,
132.
081,
418.
736,
507.
7789
5.30
972.
491,
007.
459,
383.
011,
100.
081,
079.
551,
817.
9913
,380
.62
C
EPS
3,51
0.58
303.
6235
4.70
373.
701,
032.
0231
2.27
401.
7644
6.20
2,19
2.24
348.
7239
3.47
359.
273,
293.
7037
1.42
420.
6542
5.51
4,51
1.29
IR
S3,
762.
7427
9.62
255.
6053
2.81
1,06
8.04
329.
9545
2.84
618.
182,
469.
0136
7.93
351.
7741
4.24
3,60
2.94
388.
8234
4.34
929.
905,
266.
00
V
AT1,
283.
6645
.93
163.
7413
1.01
340.
6875
.95
107.
3318
9.10
713.
0671
.29
110.
5017
7.87
1,07
2.71
62.4
113
9.75
209.
491,
484.
37
O
IL R
EVEN
UE
(ABF
A)
253.
670.
000.
0098
.37
98.3
70.
0012
6.15
0.00
224.
520.
0044
.99
0.00
269.
500.
0012
1.58
123.
4451
4.52
C
OC
OA
5.00
0.00
0.00
0.00
0.00
0.00
0.00
0.00
0.00
0.00
0.00
0.00
0.00
187.
000.
0040
.00
227.
00
G
RAN
TS34
0.58
0.00
191.
4240
.27
231.
6966
.58
0.00
0.00
298.
2755
.48
35.9
810
.45
400.
1843
.49
0.00
24.7
746
8.44
H
IPC
ASS
ISTA
NC
E99
.98
0.00
0.00
0.00
0.00
0.00
0.00
42.5
742
.57
14.1
40.
000.
0056
.71
0.00
0.00
0.00
56.7
1
M
DRI
ASS
ISTA
NC
E30
.67
0.00
0.00
0.00
0.00
0.00
0.00
88.8
588
.85
0.00
0.00
0.00
88.8
50.
000.
000.
0088
.85
D
IVES
TITU
RE0.
000.
000.
000.
000.
000.
000.
000.
000.
000.
000.
000.
000.
000.
000.
000.
000.
00
N
ON
-TA
X R
ECEI
PTS
618.
7122
.10
27.4
520
.62
70.1
623
.29
27.9
726
.52
147.
9324
.25
35.7
823
.50
231.
4746
.93
23.1
564
.87
366.
42
N
HIL
78.5
10.
0037
.95
10.9
048
.84
0.00
16.0
37.
3272
.20
13.5
00.
0022
.13
107.
820.
0030
.07
0.00
137.
89
O
THER
REC
EIPT
S69
4.56
0.00
175.
0084
.13
259.
130.
000.
000.
0025
9.13
0.00
0.00
0.00
259.
130.
000.
000.
0025
9.13
T
AX
EX
EMPT
ION
S0.
000.
000.
000.
000.
000.
000.
000.
000.
000.
000.
000.
000.
000.
000.
000.
000.
00
TOTA
L PA
YMEN
TS12
,743
.73
1,47
8.19
1,26
0.74
1,12
7.61
3,86
6.55
1,80
2.43
1,88
5.13
2,19
4.91
9,74
9.02
1,57
5.39
1,12
7.42
1,44
3.00
13,8
94.8
31,
405.
942,
676.
321,
889.
4319
,866
.53
IN
TERE
ST (D
OM
ESTI
C)
1,30
7.90
89.4
172
.14
122.
6728
4.22
192.
3310
0.25
221.
1579
7.94
145.
1612
4.03
115.
451,
182.
5829
7.57
161.
3523
8.21
1,87
9.71
IN
TERE
ST (E
XTER
NA
L)24
9.93
24.5
913
.51
13.5
351
.64
69.7
455
.62
32.9
720
9.96
48.6
541
.97
73.2
037
3.79
78.3
555
.43
48.8
755
6.44
O
THER
S11
,185
.90
1,36
4.20
1,17
5.09
991.
413,
530.
691,
540.
361,
729.
271,
940.
808,
741.
121,
381.
5896
1.42
1,25
4.35
12,3
38.4
61,
030.
022,
459.
541,
602.
3617
,430
.38
SUM
MA
RY
R
ECEI
PTS
10,6
78.6
665
1.27
1,20
5.86
1,29
1.80
3,14
8.93
808.
031,
132.
081,
418.
736,
507.
7789
5.30
972.
491,
007.
459,
383.
011,
100.
081,
079.
551,
817.
9913
,380
.62
P
AYM
ENTS
12,7
43.7
31,
478.
191,
260.
741,
127.
613,
866.
551,
802.
431,
885.
132,
194.
919,
749.
021,
575.
391,
127.
421,
443.
0013
,894
.83
1,40
5.94
2,67
6.32
1,88
9.43
19,8
66.5
3
SUR
PLU
S/D
EFIC
IT (-
)-2
,065
.07
-826
.93
-54.
8816
4.19
-717
.62
-994
.40
-753
.06
-776
.18
-3,2
41.2
6-6
80.0
9-1
54.9
3-4
35.5
5-4
,511
.82
-305
.86
-1,5
96.7
8-7
1.45
-6,4
85.9
1
FIN
AN
CIN
G2,
065.
0782
6.93
54.8
8-1
64.1
971
7.62
994.
4075
3.06
776.
183,
241.
2668
0.09
154.
9343
5.55
4,51
1.82
305.
861,
596.
7871
.45
6,48
5.91
DO
MES
TIC
(NET
)2,
091.
9576
1.90
95.7
9-1
17.0
574
0.64
1,02
7.51
816.
6882
7.07
3,41
1.89
731.
5417
9.99
506.
284,
829.
7035
5.65
1,57
9.85
156.
676,
921.
87
B
AN
KIN
G41
9.37
694.
30-4
5.76
-440
.20
208.
341,
006.
5632
6.94
569.
972,
111.
8026
.27
-774
.26
371.
091,
734.
91-9
15.5
11,
322.
9139
3.59
2,53
5.90
BA
NK
OF
GH
AN
A66
1.20
491.
19-1
56.1
5-3
57.8
5-2
2.81
1,25
6.96
187.
9668
9.00
2,11
1.12
452.
48-7
09.8
854
9.96
2,40
3.67
-1,1
18.7
81,
130.
74-2
18.8
52,
196.
79
DEP
OSI
T M
ON
EY B
AN
KS
-2
41.8
320
3.10
110.
39-8
2.35
231.
14-2
50.4
113
8.99
-119
.03
0.69
-426
.21
-64.
37-1
78.8
6-6
68.7
620
3.27
192.
1761
2.44
339.
12
N
ON
-BA
NK
1,67
2.58
67.6
014
1.55
323.
1553
2.30
20.9
548
9.73
257.
101,
300.
0970
5.27
954.
2413
5.19
3,09
4.79
1,27
1.16
256.
94-2
36.9
24,
385.
97
N
ON
-RES
IDEN
TS81
2.56
15.8
2-0
.51
195.
4221
0.74
-68.
1343
4.87
9.72
587.
1942
8.66
822.
2070
.78
1,90
8.83
1,18
8.20
38.9
5-4
64.6
62,
671.
32
FOR
EIG
N (N
ET)
-26.
8765
.03
-40.
90-4
7.14
-23.
02-3
3.10
-63.
62-5
0.89
-170
.63
-51.
45-2
5.06
-70.
74-3
17.8
7-4
9.79
16.9
3-8
5.22
-435
.96
INFL
OW
S32
6.99
87.5
50.
000.
0087
.55
0.00
0.00
0.00
87.5
50.
000.
000.
0087
.55
0.00
100.
100.
0018
7.65
LOA
N R
EPAY
MEN
T-3
53.8
6-2
2.52
-40.
90-4
7.14
-110
.57
-33.
10-6
3.62
-50.
89-2
58.1
8-5
1.45
-25.
06-7
0.74
-405
.43
-49.
79-8
3.17
-85.
22-6
23.6
0
Oth
er D
omes
tic F
inan
cing
0.00
0.00
0.00
0.00
0.00
0.00
0.00
0.00
0.00
0.00
0.00
0.00
0.00
0.00
0.00
0.00
0.00
MEM
OR
AN
DU
M IT
EMS
GD
P AT
CU
RREN
T PR
ICES
(NO
N-O
IL)
53,4
11.0
071
,847
.00
71,8
47.0
071
,847
.00
73,1
09.0
073
,109
.00
73,1
09.0
073
,109
.00
73,1
09.0
073
,109
.00
73,1
09.0
073
,109
.00
73,1
09.0
073
,109
.00
73,1
09.0
073
,109
.00
73,1
09.0
0
GD
P AT
CU
RREN
T PR
ICES
59,8
16.0
073
,109
.00
73,1
09.0
073
,109
.00
73,1
09.0
073
,109
.00
73,1
09.0
073
,109
.00
73,1
09.0
073
,109
.00
73,1
09.0
073
,109
.00
73,1
09.0
073
,109
.00
73,1
09.0
073
,109
.00
73,1
09.0
0
DO
MES
TIC
PRI
M. B
ALA
NC
E-3
49.3
0-7
12.9
3-1
60.6
626
0.13
-613
.46
-798
.91
-597
.19
-653
.48
-2,6
63.0
4-5
55.8
9-2
4.92
-257
.34
-3,5
01.1
926
.57
-1,3
79.9
919
0.86
-4,6
63.7
5
(I
n Pe
rcen
t of G
DP)
-0.5
8-0
.98
-0.2
20.
36-0
.84
-1.0
9-0
.82
-0.8
9-3
.64
-0.7
6-0
.03
-0.3
5-4
.79
0.04
-1.8
90.
26-6
.38
BUD
GET
BA
LAN
CE
-2,0
65.0
7-8
26.9
3-5
4.88
164.
19-7
17.6
2-9
94.4
0-7
53.0
6-7
76.1
8-3
,241
.26
-680
.09
-154
.93
-435
.55
-4,5
11.8
2-3
05.8
6-1
,596
.78
-71.
45-6
,485
.91
(I
n Pe
rcen
t of G
DP)
-3.4
5-1
.13
-0.0
80.
22-0
.98
-1.3
6-1
.03
-1.0
6-4
.43
-0.9
3-0
.21
-0.6
0-6
.17
-0.4
2-2
.18
-0.1
0-8
.87
Dom
estic
Rev
enue
10,2
07.4
365
1.27
1,01
4.43
1,25
1.54
2,91
7.24
741.
451,
132.
081,
287.
326,
078.
0882
5.68
936.
5099
7.01
8,83
7.28
1,05
6.59
1,07
9.55
1,79
3.22
12,7
66.6
3
Dom
estic
Exp
endi
ture
10,5
56.7
31,
364.
201,
175.
0999
1.41
3,53
0.69
1,54
0.36
1,72
9.27
1,94
0.80
8,74
1.12
1,38
1.58
961.
421,
254.
3512
,338
.46
1,03
0.02
2,45
9.54
1,60
2.36
17,4
30.3
8
Net
Dom
estic
Fin
anci
ng2,
091.
9576
1.90
95.7
9-1
17.0
574
0.64
1,02
7.51
816.
6882
7.07
3,41
1.89
731.
5417
9.99
506.
284,
829.
7035
5.65
1,57
9.85
156.
676,
921.
87
Net
Cha
nges
in R
oad
Arr
ears
569.
110.
000.
000.
000.
000.
000.
000.
000.
000.
000.
000.
000.
000.
000.
000.
000.
00
Net
Cha
nges
in N
on-R
oad
Arr
ears
60.0
60.
000.
000.
000.
000.
000.
000.
000.
000.
000.
000.
000.
000.
000.
000.
000.
00
Tabl
e 15
. Fi
scal
Pos
ition
- N
arro
w C
over
age
* Pro
visio
nal
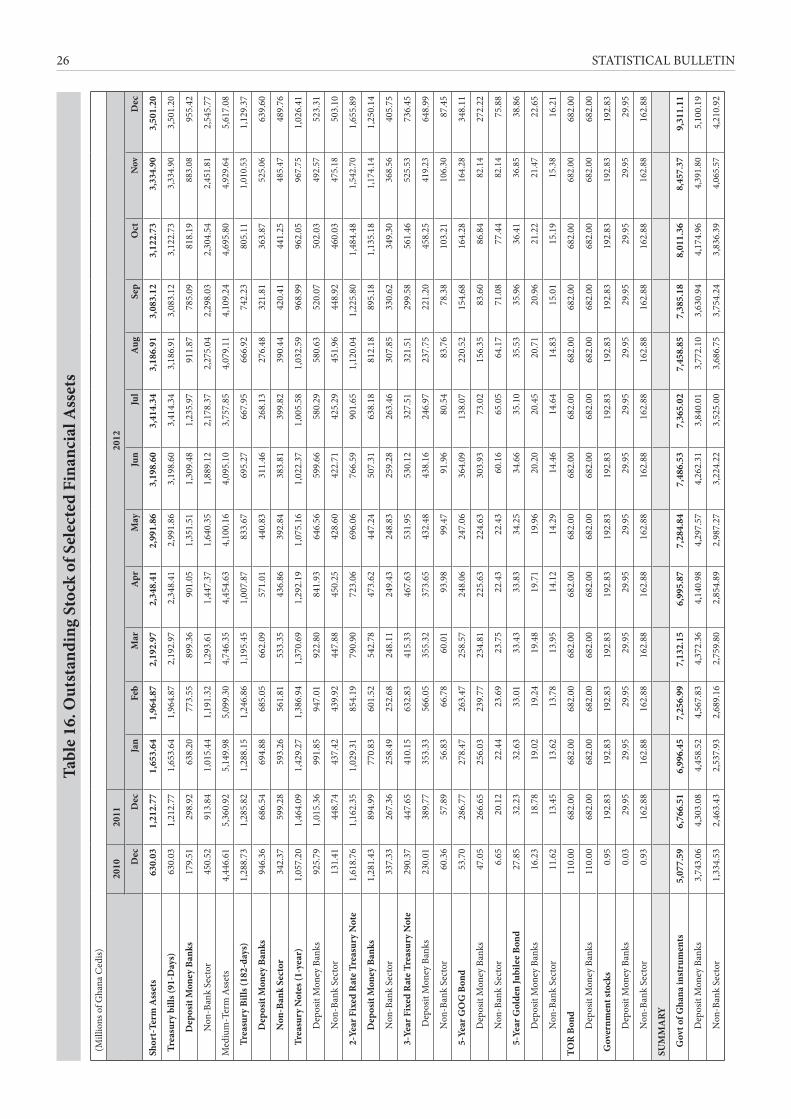
STATISTICAL BULLETIN26
(M
illio
ns o
f Gha
na C
edis)
2010
2011
2012
Dec
Dec
Jan
Feb
Mar
Apr
May
Jun
Jul
Aug
Sep
Oct
Nov
Dec
Shor
t-Te
rm A
sset
s63
0.03
1,21
2.77
1,65
3.64
1,96
4.87
2,19
2.97
2,34
8.41
2,99
1.86
3,19
8.60
3,41
4.34
3,18
6.91
3,08
3.12
3,12
2.73
3,33
4.90
3,50
1.20
Tre
asur
y bi
lls (9
1-D
ays)
630.
031,
212.
771,
653.
641,
964.
872,
192.
972,
348.
412,
991.
863,
198.
603,
414.
343,
186.
913,
083.
123,
122.
733,
334.
903,
501.
20
Dep
osit
Mon
ey B
anks
179.
5129
8.92
638.
2077
3.55
899.
3690
1.05
1,35
1.51
1,30
9.48
1,23
5.97
911.
8778
5.09
818.
1988
3.08
955.
42
N
on-B
ank
Sect
or45
0.52
913.
841,
015.
441,
191.
321,
293.
611,
447.
371,
640.
351,
889.
122,
178.
372,
275.
042,
298.
032,
304.
542,
451.
812,
545.
77
Med
ium
-Ter
m A
sset
s4,
446.
615,
360.
925,
149.
985,
099.
304,
746.
354,
454.
634,
100.
164,
095.
103,
757.
854,
079.
114,
109.
244,
695.
804,
929.
645,
617.
08
T
reas
ury
Bills
(182
-day
s)1,
288.
731,
285.
821,
288.
151,
246.
861,
195.
451,
007.
8783
3.67
695.
2766
7.95
666.
9274
2.23
805.
111,
010.
531,
129.
37
D
epos
it M
oney
Ban
ks94
6.36
686.
5469
4.88
685.
0566
2.09
571.
0144
0.83
311.
4626
8.13
276.
4832
1.81
363.
8752
5.06
639.
60
N
on-B
ank
Sect
or34
2.37
599.
2859
3.26
561.
8153
3.35
436.
8639
2.84
383.
8139
9.82
390.
4442
0.41
441.
2548
5.47
489.
76
T
reas
ury
Not
es (1
-yea
r)1,
057.
201,
464.
091,
429.
271,
386.
941,
370.
691,
292.
191,
075.
161,
022.
371,
005.
581,
032.
5996
8.99
962.
0596
7.75
1,02
6.41
Dep
osit
Mon
ey B
anks
925.
791,
015.
3699
1.85
947.
0192
2.80
841.
9364
6.56
599.
6658
0.29
580.
6352
0.07
502.
0349
2.57
523.
31
Non
-Ban
k Se
ctor
131.
4144
8.74
437.
4243
9.92
447.
8845
0.25
428.
6042
2.71
425.
2945
1.96
448.
9246
0.03
475.
1850
3.10
2
-Yea
r Fix
ed R
ate
Trea
sury
Not
e1,
618.
761,
162.
351,
029.
3185
4.19
790.
9072
3.06
696.
0676
6.59
901.
651,
120.
041,
225.
801,
484.
481,
542.
701,
655.
89
D
epos
it M
oney
Ban
ks1,
281.
4389
4.99
770.
8360
1.52
542.
7847
3.62
447.
2450
7.31
638.
1881
2.18
895.
181,
135.
181,
174.
141,
250.
14
Non
-Ban
k Se
ctor
337.
3326
7.36
258.
4925
2.68
248.
1124
9.43
248.
8325
9.28
263.
4630
7.85
330.
6234
9.30
368.
5640
5.75
3
-Yea
r Fix
ed R
ate
Trea
sury
Not
e29
0.37
447.
6541
0.15
632.
8341
5.33
467.
6353
1.95
530.
1232
7.51
321.
5129
9.58
561.
4652
5.53
736.
45
Dep
osit
Mon
ey B
anks
230.
0138
9.77
353.
3356
6.05
355.
3237
3.65
432.
4843
8.16
246.
9723
7.75
221.
2045
8.25
419.
2364
8.99
Non
-Ban
k Se
ctor
60.3
657
.89
56.8
366
.78
60.0
193
.98
99.4
791
.96
80.5
483
.76
78.3
810
3.21
106.
3087
.45
5
-Yea
r GO
G B
ond
53.7
028
6.77
278.
4726
3.47
258.
5724
8.06
247.
0636
4.09
138.
0722
0.52
154.
6816
4.28
164.
2834
8.11
Dep
osit
Mon
ey B
anks
47.0
526
6.65
256.
0323
9.77
234.
8122
5.63
224.
6330
3.93
73.0
215
6.35
83.6
086
.84
82.1
427
2.22
Non
-Ban
k Se
ctor
6.65
20.1
222
.44
23.6
923
.75
22.4
322
.43
60.1
665
.05
64.1
771
.08
77.4
482
.14
75.8
8
5
-Yea
r Gol
den
Jubi
lee
Bond
27.8
532
.23
32.6
333
.01
33.4
333
.83
34.2
534
.66
35.1
035
.53
35.9
636
.41
36.8
538
.86
Dep
osit
Mon
ey B
anks
16.2
318
.78
19.0
219
.24
19.4
819
.71
19.9
620
.20
20.4
520
.71
20.9
621
.22
21.4
722
.65
Non
-Ban
k Se
ctor
11.6
213
.45
13.6
213
.78
13.9
514
.12
14.2
914
.46
14.6
414
.83
15.0
115
.19
15.3
816
.21
TOR
Bon
d11
0.00
682.
0068
2.00
682.
0068
2.00
682.
0068
2.00
682.
0068
2.00
682.
0068
2.00
682.
0068
2.00
682.
00
Dep
osit
Mon
ey B
anks
110.
0068
2.00
682.
0068
2.00
682.
0068
2.00
682.
0068
2.00
682.
0068
2.00
682.
0068
2.00
682.
0068
2.00
Gov
ernm
ent s
tock
s0.
9519
2.83
192.
8319
2.83
192.
8319
2.83
192.
8319
2.83
192.
8319
2.83
192.
8319
2.83
192.
8319
2.83
Dep
osit
Mon
ey B
anks
0.03
29.9
529
.95
29.9
529
.95
29.9
529
.95
29.9
529
.95
29.9
529
.95
29.9
529
.95
29.9
5
Non
-Ban
k Se
ctor
0.93
162.
8816
2.88
162.
8816
2.88
162.
8816
2.88
162.
8816
2.88
162.
8816
2.88
162.
8816
2.88
162.
88
SUM
MA
RY
G
ovt o
f Gha
na in
stru
men
ts5,
077.
596,
766.
516,
996.
457,
256.
997,
132.
156,
995.
877,
284.
847,
486.
537,
365.
027,
458.
857,
385.
188,
011.
368,
457.
379,
311.
11
Dep
osit
Mon
ey B
anks
3,74
3.06
4,30
3.08
4,45
8.52
4,56
7.83
4,37
2.36
4,14
0.98
4,29
7.57
4,26
2.31
3,84
0.01
3,77
2.10
3,63
0.94
4,17
4.96
4,39
1.80
5,10
0.19
Non
-Ban
k Se
ctor
1,33
4.53
2,46
3.43
2,53
7.93
2,68
9.16
2,75
9.80
2,85
4.89
2,98
7.27
3,22
4.22
3,52
5.00
3,68
6.75
3,75
4.24
3,83
6.39
4,06
5.57
4,21
0.92
Tabl
e 16
. Out
stan
ding
Sto
ck o
f Sel
ecte
d Fi
nanc
ial A
sset
s
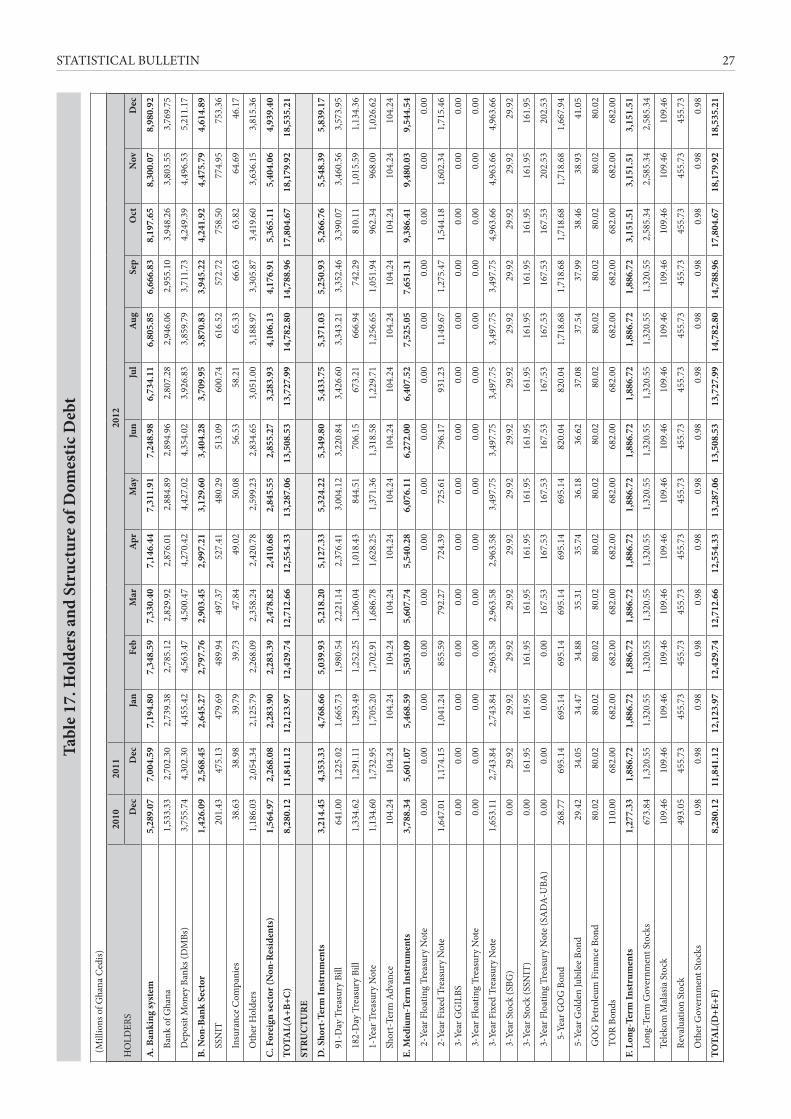
STATISTICAL BULLETIN 27
(M
illio
ns o
f Gha
na C
edis)
HO
LDER
S20
1020
1120
12
Dec
Dec
Jan
Feb
Mar
Apr
May
Jun
Jul
Aug
Sep
Oct
Nov
Dec
A. B
anki
ng sy
stem
5,28
9.07
7,00
4.59
7,1
94.8
0 7
,348
.59
7,3
30.4
0 7
,146
.44
7,3
11.9
1 7
,248
.98
6,7
34.1
1 6
,805
.85
6,6
66.8
3 8
,197
.65
8,3
00.0
7 8
,980
.92
B
ank
of G
hana
1,53
3.33
2,70
2.30
2,7
39.3
8 2
,785
.12
2,8
29.9
2 2
,876
.01
2,8
84.8
9 2
,894
.96
2,8
07.2
8 2
,946
.06
2,9
55.1
0 3
,948
.26
3,8
03.5
5 3
,769
.75
D
epos
it M
oney
Ban
ks (D
MBs
)3,
755.
744,
302.
30 4
,455
.42
4,5
63.4
7 4
,500
.47
4,2
70.4
2 4
,427
.02
4,3
54.0
2 3
,926
.83
3,8
59.7
9 3
,711
.73
4,2
49.3
9 4
,496
.53
5,2
11.1
7
B. N
on-B
ank
Sect
or1,
426.
092,
568.
45 2
,645
.27
2,7
97.7
6 2
,903
.45
2,9
97.2
1 3
,129
.60
3,4
04.2
8 3
,709
.95
3,8
70.8
3 3
,945
.22
4,2
41.9
2 4
,475
.79
4,6
14.8
9
S
SNIT
201.
4347
5.13
479
.69
489
.94
497
.37
527
.41
480
.29
513
.09
600
.74
616
.52
572
.72
758
.50
774
.95
753
.36
In
sura
nce
Com
pani
es38
.63
38.9
8 3
9.79
3
9.73
4
7.84
4
9.02
5
0.08
5
6.53
5
8.21
6
5.33
6
6.63
6
3.82
6
4.69
4
6.17
O
ther
Hol
ders
1,18
6.03
2,05
4.34
2,1
25.7
9 2
,268
.09
2,3
58.2
4 2
,420
.78
2,5
99.2
3 2
,834
.65
3,0
51.0
0 3
,188
.97
3,3
05.8
7 3
,419
.60
3,6
36.1
5 3
,815
.36
C. F
orei
gn se
ctor
(Non
-Res
iden
ts)
1,56
4.97
2,2
68.0
8 2
,283
.90
2,2
83.3
9 2
,478
.82
2,4
10.6
8 2
,845
.55
2,8
55.2
7 3
,283
.93
4,1
06.1
3 4
,176
.91
5,3
65.1
1 5
,404
.06
4,9
39.4
0
TOTA
L(A
+B+C
)8,
280.
1211
,841
.12
12,1
23.9
7 1
2,42
9.74
1
2,71
2.66
1
2,55
4.33
1
3,28
7.06
1
3,50
8.53
1
3,72
7.99
1
4,78
2.80
1
4,78
8.96
1
7,80
4.67
1
8,17
9.92
1
8,53
5.21
STRU
CTU
RE
D. S
hort
-Ter
m In
stru
men
ts3,
214.
454,
353.
334,
768.
665,
039.
935,
218.
205,
127.
335,
324.
225,
349.
805,
433.
755,
371.
035,
250.
935,
266.
765,
548.
395,
839.
17
9
1-D
ay T
reas
ury
Bill
641.
001,
225.
021,
665.
731,
980.
542,
221.
142,
376.
413,
004.
123,
220.
843,
426.
603,
343.
213,
352.
463,
390.
073,
460.
563,
573.
95
1
82-D
ay T
reas
ury
Bill
1,33
4.62
1,29
1.11
1,29
3.49
1,25
2.25
1,20
6.04
1,01
8.43
844.
5170
6.15
673.
2166
6.94
742.
2981
0.11
1,01
5.59
1,13
4.36
1
-Yea
r Tre
asur
y N
ote
1,13
4.60
1,73
2.95
1,70
5.20
1,70
2.91
1,68
6.78
1,62
8.25
1,37
1.36
1,31
8.58
1,22
9.71
1,25
6.65
1,05
1.94
962.
3496
8.00
1,02
6.62
S
hort
-Ter
m A
dvan
ce10
4.24
104.
2410
4.24
104.
2410
4.24
104.
2410
4.24
104.
2410
4.24
104.
2410
4.24
104.
2410
4.24
104.
24
E. M
ediu
m-T
erm
Inst
rum
ents
3,78
8.34
5,60
1.07
5,46
8.59
5,50
3.09
5,60
7.74
5,54
0.28
6,07
6.11
6,27
2.00
6,40
7.52
7,52
5.05
7,65
1.31
9,38
6.41
9,48
0.03
9,54
4.54
2
-Yea
r Flo
atin
g Tr
easu
ry N
ote
0.00
0.00
0.00
0.00
0.00
0.00
0.00
0.00
0.00
0.00
0.00
0.00
0.00
0.00
2
-Yea
r Fix
ed T
reas
ury
Not
e1,
647.
011,
174.
151,
041.
2485
5.59
792.
2772
4.39
725.
6179
6.17
931.
231,
149.
671,
275.
471,
544.
181,
602.
341,
715.
46
3
-Yea
r GG
ILBS
0.
000.
000.
000.
000.
000.
000.
000.
000.
000.
000.
000.
000.
000.
00
3
-Yea
r Flo
atin
g Tr
easu
ry N
ote
0.00
0.00
0.00
0.00
0.00
0.00
0.00
0.00
0.00
0.00
0.00
0.00
0.00
0.00
3
-Yea
r Fix
ed T
reas
ury
Not
e1,
653.
112,
743.
842,
743.
84 2
,963
.58
2,96
3.58
2,96
3.58
3,49
7.75
3,49
7.75
3,49
7.75
3,49
7.75
3,49
7.75
4,96
3.66
4,96
3.66
4,96
3.66
3
-Yea
r Sto
ck (S
BG)
0.00
29.9
229
.92
29.9
229
.92
29.9
229
.92
29.9
229
.92
29.9
229
.92
29.9
229
.92
29.9
2
3
-Yea
r Sto
ck (S
SNIT
)0.
0016
1.95
161.
9516
1.95
161.
9516
1.95
161.
9516
1.95
161.
9516
1.95
161.
9516
1.95
161.
9516
1.95
3
-Yea
r Flo
atin
g Tr
easu
ry N
ote
(SA
DA-
UBA
)0.
000.
000.
000.
0016
7.53
167.
5316
7.53
167.
5316
7.53
167.
5316
7.53
167.
5320
2.53
202.
53
5-Y
ear G
OG
Bon
d26
8.77
695.
1469
5.14
695.
1469
5.14
695.
1469
5.14
820.
0482
0.04
1,71
8.68
1,71
8.68
1,71
8.68
1,71
8.68
1,66
7.94
5
-Yea
r Gol
den
Jubi
lee
Bond
29.4
234
.05
34.4
734
.88
35.3
135
.74
36.1
836
.62
37.0
837
.54
37.9
938
.46
38.9
341
.05
G
OG
Pet
role
um F
inan
ce B
ond
80.0
280
.02
80.0
280
.02
80.0
280
.02
80.0
280
.02
80.0
280
.02
80.0
280
.02
80.0
280
.02
T
OR
Bond
s11
0.00
682.
0068
2.00
682.
0068
2.00
682.
0068
2.00
682.
0068
2.00
682.
0068
2.00
682.
0068
2.00
682.
00
F. L
ong-
Term
Inst
rum
ents
1,27
7.33
1,88
6.72
1,88
6.72
1,88
6.72
1,88
6.72
1,88
6.72
1,88
6.72
1,88
6.72
1,88
6.72
1,88
6.72
1,88
6.72
3,15
1.51
3,15
1.51
3,15
1.51
L
ong-
Term
Gov
ernm
ent S
tock
s67
3.84
1,32
0.55
1,
320.
551,
320.
551,
320.
551,
320.
551,
320.
551,
320.
551,
320.
551,
320.
551,
320.
552,
585.
342,
585.
342,
585.
34
T
elek
om M
alas
ia S
tock
109.
4610
9.46
10
9.46
109.
4610
9.46
109.
4610
9.46
109.
4610
9.46
109.
4610
9.46
109.
4610
9.46
109.
46
R
eval
uatio
n St
ock
493.
0545
5.73
45
5.73
455.
7345
5.73
455.
7345
5.73
455.
7345
5.73
455.
7345
5.73
455.
7345
5.73
455.
73
O
ther
Gov
ernm
ent S
tock
s0.
980.
98
0.98
0.98
0.98
0.98
0.98
0.98
0.98
0.98
0.98
0.98
0.98
0.98
TOTA
L(D
+E+F
)8,
280.
1211
,841
.12
12,1
23.9
712
,429
.74
12,7
12.6
612
,554
.33
13,2
87.0
613
,508
.53
13,7
27.9
914
,782
.80
14,7
88.9
617
,804
.67
18,1
79.9
218
,535
.21
Tabl
e 17
. Hol
ders
and
Str
uctu
re o
f Dom
estic
Deb
t
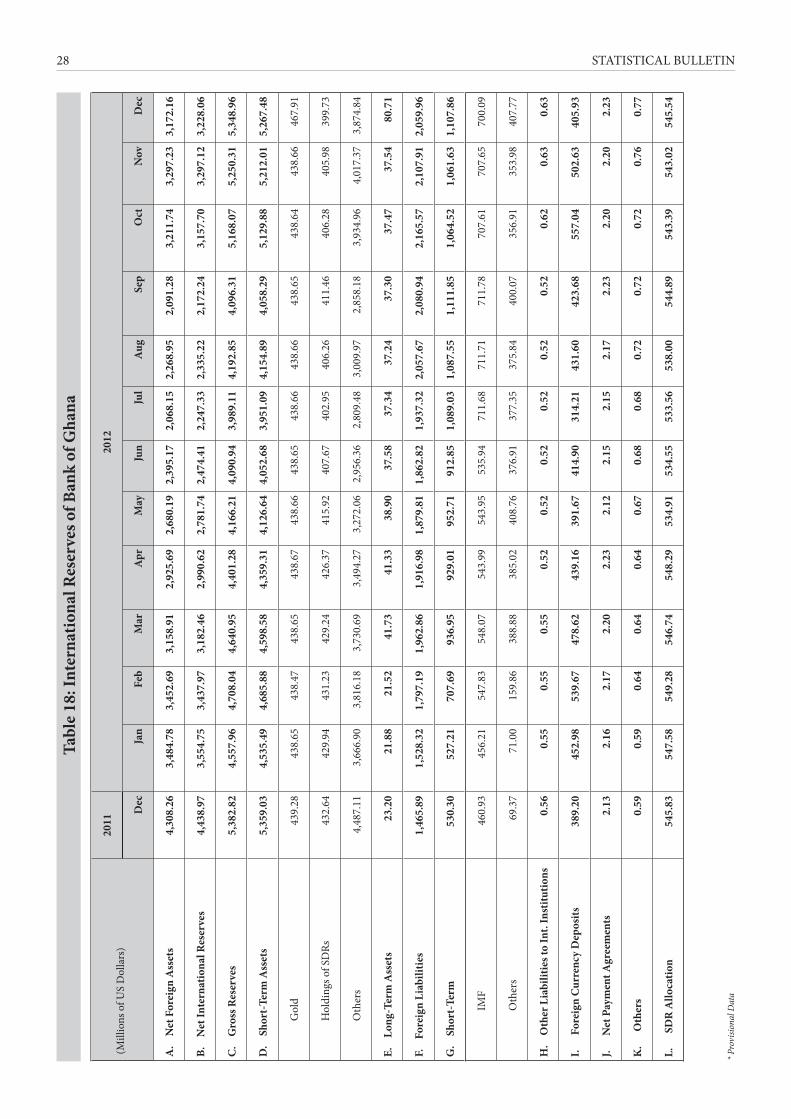
STATISTICAL BULLETIN28
(Mill
ions
of U
S D
olla
rs)
2011
2012
Dec
Jan
Feb
Mar
Apr
May
Jun
Jul
Aug
Sep
Oct
Nov
Dec
A.
Net
For
eign
Ass
ets
4,3
08.2
6 3
,484
.78
3,4
52.6
9 3
,158
.91
2,9
25.6
9 2
,680
.19
2,3
95.1
7 2
,068
.15
2,2
68.9
5 2
,091
.28
3,2
11.7
4 3
,297
.23
3,1
72.1
6
B.
Net
Inte
rnat
iona
l Res
erve
s 4
,438
.97
3,5
54.7
5 3
,437
.97
3,1
82.4
6 2
,990
.62
2,7
81.7
4 2
,474
.41
2,2
47.3
3 2
,335
.22
2,1
72.2
4 3
,157
.70
3,2
97.1
2 3
,228
.06
C.
Gro
ss R
eser
ves
5,3
82.8
2 4
,557
.96
4,7
08.0
4 4
,640
.95
4,4
01.2
8 4
,166
.21
4,0
90.9
4 3
,989
.11
4,1
92.8
5 4
,096
.31
5,1
68.0
7 5
,250
.31
5,3
48.9
6
D.
Sho
rt-T
erm
Ass
ets
5,3
59.0
3 4
,535
.49
4,6
85.8
8 4
,598
.58
4,3
59.3
1 4
,126
.64
4,0
52.6
8 3
,951
.09
4,1
54.8
9 4
,058
.29
5,1
29.8
8 5
,212
.01
5,2
67.4
8
Gol
d 4
39.2
8 4
38.6
5 4
38.4
7 4
38.6
5 4
38.6
7 4
38.6
6 4
38.6
5 4
38.6
6 4
38.6
6 4
38.6
5 4
38.6
4 4
38.6
6 4
67.9
1
Hol
ding
s of S
DRs
432
.64
429
.94
431
.23
429
.24
426
.37
415
.92
407
.67
402
.95
406
.26
411
.46
406
.28
405
.98
399
.73
Oth
ers
4,4
87.1
1 3
,666
.90
3,8
16.1
8 3
,730
.69
3,4
94.2
7 3
,272
.06
2,9
56.3
6 2
,809
.48
3,0
09.9
7 2
,858
.18
3,9
34.9
6 4
,017
.37
3,8
74.8
4
E.
Long
-Ter
m A
sset
s 2
3.20
2
1.88
2
1.52
4
1.73
4
1.33
3
8.90
3
7.58
3
7.34
3
7.24
3
7.30
3
7.47
3
7.54
8
0.71
F.
Fore
ign
Liab
ilitie
s 1
,465
.89
1,5
28.3
2 1
,797
.19
1,9
62.8
6 1
,916
.98
1,8
79.8
1 1
,862
.82
1,9
37.3
2 2
,057
.67
2,0
80.9
4 2
,165
.57
2,1
07.9
1 2
,059
.96
G.
Sho
rt-T
erm
530
.30
527
.21
707
.69
936
.95
929
.01
952
.71
912
.85
1,0
89.0
3 1
,087
.55
1,1
11.8
5 1
,064
.52
1,0
61.6
3 1
,107
.86
IMF
460
.93
456
.21
547
.83
548
.07
543
.99
543
.95
535
.94
711
.68
711
.71
711
.78
707
.61
707
.65
700
.09
Oth
ers
69.
37
71.
00
159
.86
388
.88
385
.02
408
.76
376
.91
377
.35
375
.84
400
.07
356
.91
353
.98
407
.77
H.
Oth
er L
iabi
litie
s to
Int.
Inst
itutio
ns 0
.56
0.5
5 0
.55
0.5
5 0
.52
0.5
2 0
.52
0.5
2 0
.52
0.5
2 0
.62
0.6
3 0
.63
I.
For
eign
Cur
renc
y D
epos
its 3
89.2
0 4
52.9
8 5
39.6
7 4
78.6
2 4
39.1
6 3
91.6
7 4
14.9
0 3
14.2
1 4
31.6
0 4
23.6
8 5
57.0
4 5
02.6
3 4
05.9
3
J.
Net
Pay
men
t Agr
eem
ents
2.1
3 2
.16
2.1
7 2
.20
2.2
3 2
.12
2.1
5 2
.15
2.1
7 2
.23
2.2
0 2
.20
2.2
3
K.
O
ther
s 0
.59
0.5
9 0
.64
0.6
4 0
.64
0.6
7 0
.68
0.6
8 0
.72
0.7
2 0
.72
0.7
6 0
.77
L.
SD
R A
lloca
tion
545
.83
547
.58
549
.28
546
.74
548
.29
534
.91
534
.55
533
.56
538
.00
544
.89
543
.39
543
.02
545
.54
Tab
le 1
8: In
tern
atio
nal R
eser
ves o
f Ban
k of
Gha
na
* Pro
visio
nal D
ata
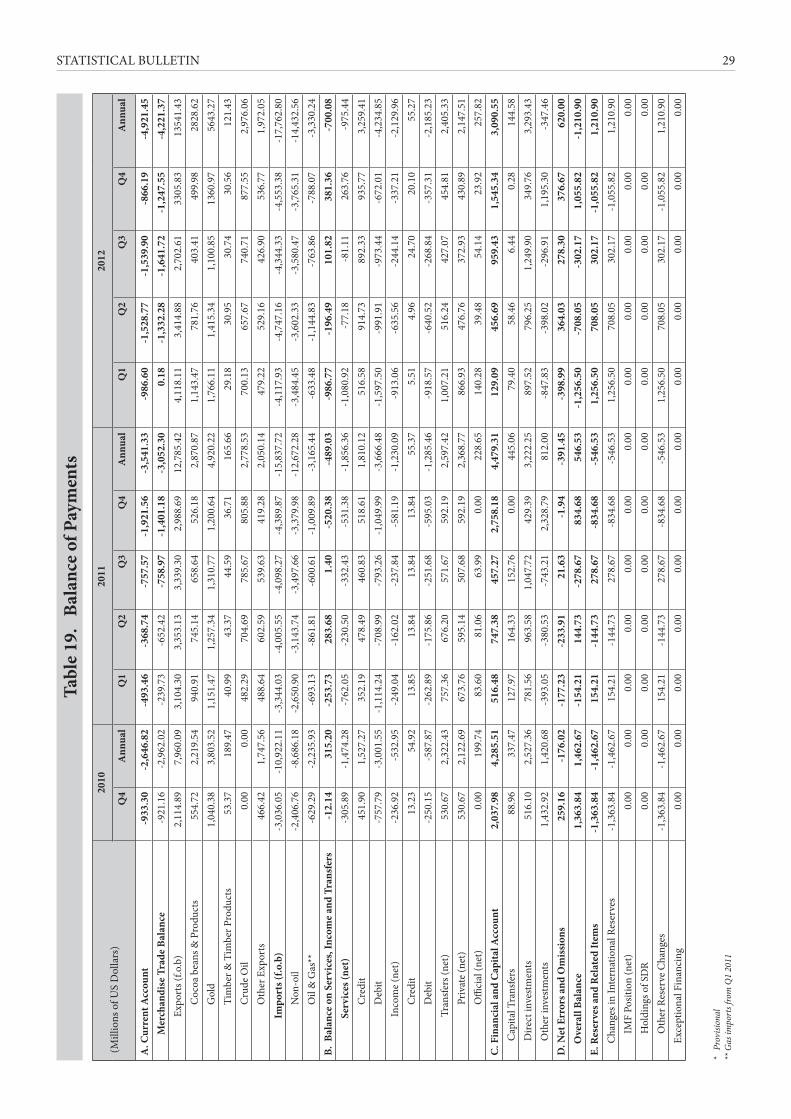
STATISTICAL BULLETIN 29
* P
rovi
siona
l**
Gas
impo
rts f
rom
Q1
2011
(Mill
ions
of U
S D
olla
rs)
2010
2011
2012
Q4
Ann
ual
Q1
Q2
Q3
Q4
Ann
ual
Q1
Q2
Q3
Q4
Ann
ual
A. C
urre
nt A
ccou
nt-9
33.3
0-2
,646
.82
-493
.46
-368
.74
-757
.57
-1,9
21.5
6-3
,541
.33
-986
.60
-1,5
28.7
7-1
,539
.90
-866
.19
-4,9
21.4
5
M
erch
andi
se T
rade
Bal
ance
-921
.16
-2,9
62.0
2-2
39.7
3-6
52.4
2-7
58.9
7-1
,401
.18
-3,0
52.3
00.
18-1
,332
.28
-1,6
41.7
2-1
,247
.55
-4,2
21.3
7
Exp
orts
(f.o
.b)
2,11
4.89
7,96
0.09
3,10
4.30
3,35
3.13
3,33
9.30
2,98
8.69
12,7
85.4
24,
118.
113,
414.
882,
702.
6133
05.8
313
541.
43
Coc
oa b
eans
& P
rodu
cts
554.
722,
219.
5494
0.91
745.
1465
8.64
526.
182,
870.
871,
143.
4778
1.76
403.
4149
9.98
2828
.62
G
old
1,04
0.38
3,80
3.52
1,15
1.47
1,25
7.34
1,31
0.77
1,20
0.64
4,92
0.22
1,76
6.11
1,41
5.34
1,10
0.85
1360
.97
5643
.27
Ti
mbe
r & T
imbe
r Pro
duct
s53
.37
189.
4740
.99
43.3
744
.59
36.7
116
5.66
29.1
830
.95
30.7
430
.56
121.
43
Cru
de O
il0.
00
0.00
48
2.29
704.
6978
5.67
805.
882,
778.
5370
0.13
657.
6774
0.71
877.
552,
976.
06
Oth
er E
xpor
ts46
6.42
1,74
7.56
488.
6460
2.59
539.
6341
9.28
2,05
0.14
479.
2252
9.16
426.
9053
6.77
1,97
2.05
Impo
rts (
f.o.b
)-3
,036
.05
-10,
922.
11-3
,344
.03
-4,0
05.5
5-4
,098
.27
-4,3
89.8
7-1
5,83
7.72
-4,1
17.9
3-4
,747
.16
-4,3
44.3
3-4
,553
.38
-17,
762.
80
Non
-oil
-2,4
06.7
6-8
,686
.18
-2,6
50.9
0-3
,143
.74
-3,4
97.6
6-3
,379
.98
-12,
672.
28-3
,484
.45
-3,6
02.3
3-3
,580
.47
-3,7
65.3
1-1
4,43
2.56
O
il &
Gas
**-6
29.2
9-2
,235
.93
-693
.13
-861
.81
-600
.61
-1,0
09.8
9-3
,165
.44
-633
.48
-1,1
44.8
3-7
63.8
6-7
88.0
7-3
,330
.24
B. B
alan
ce o
n Se
rvic
es, I
ncom
e an
d Tr
ansf
ers
-12.
1431
5.20
-253
.73
283.
681.
40-5
20.3
8-4
89.0
3-9
86.7
7-1
96.4
910
1.82
381.
36-7
00.0
8
Se
rvic
es (n
et)
-305
.89
-1,4
74.2
8-7
62.0
5-2
30.5
0-3
32.4
3-5
31.3
8-1
,856
.36
-1,0
80.9
2-7
7.18
-81.
1126
3.76
-975
.44
C
redi
t45
1.90
1,52
7.27
352.
1947
8.49
460.
8351
8.61
1,81
0.12
516.
5891
4.73
892.
3393
5.77
3,25
9.41
D
ebit
-757
.79
-3,0
01.5
5-1
,114
.24
-708
.99
-793
.26
-1,0
49.9
9-3
,666
.48
-1,5
97.5
0-9
91.9
1-9
73.4
4-6
72.0
1-4
,234
.85
In
com
e (n
et)
-236
.92
-532
.95
-249
.04
-162
.02
-237
.84
-581
.19
-1,2
30.0
9-9
13.0
6-6
35.5
6-2
44.1
4-3
37.2
1-2
,129
.96
C
redi
t13
.23
54.9
213
.85
13.8
413
.84
13.8
455
.37
5.51
4.96
24.7
020
.10
55.2
7
Deb
it-2
50.1
5-5
87.8
7-2
62.8
9-1
75.8
6-2
51.6
8-5
95.0
3-1
,285
.46
-918
.57
-640
.52
-268
.84
-357
.31
-2,1
85.2
3
Tra
nsfe
rs (n
et)
530.
672,
322.
4375
7.36
676.
2057
1.67
592.
192,
597.
421,
007.
2151
6.24
427.
0745
4.81
2,40
5.33
Pr
ivat
e (n
et)
530.
672,
122.
6967
3.76
595.
1450
7.68
592.
192,
368.
7786
6.93
476.
7637
2.93
430.
892,
147.
51
Offi
cial
(net
)0.
0019
9.74
83.6
081
.06
63.9
90.
0022
8.65
140.
2839
.48
54.1
423
.92
257.
82C
. Fin
anci
al a
nd C
apita
l Acc
ount
2,03
7.98
4,28
5.51
516.
4874
7.38
457.
272,
758.
184,
479.
3112
9.09
456.
6995
9.43
1,54
5.34
3,09
0.55
Cap
ital T
rans
fers
88.9
633
7.47
127.
9716
4.33
152.
760.
0044
5.06
79.4
058
.46
6.44
0.28
144.
58
D
irect
inve
stm
ents
516.
102,
527.
3678
1.56
963.
581,
047.
7242
9.39
3,22
2.25
897.
5279
6.25
1,24
9.90
349.
763,
293.
43
O
ther
inve
stm
ents
1,43
2.92
1,42
0.68
-393
.05
-380
.53
-743
.21
2,32
8.79
812.
00-8
47.8
3-3
98.0
2-2
96.9
11,
195.
30-3
47.4
6D
. Net
Err
ors a
nd O
mis
sion
s25
9.16
-176
.02
-177
.23
-233
.91
21.6
3-1
.94
-391
.45
-398
.99
364.
0327
8.30
376.
6762
0.00
O
vera
ll Ba
lanc
e1,
363.
841,
462.
67-1
54.2
114
4.73
-278
.67
834.
6854
6.53
-1,2
56.5
0-7
08.0
5-3
02.1
71,
055.
82-1
,210
.90
E. R
eser
ves a
nd R
elat
ed It
ems
-1,3
63.8
4-1
,462
.67
154.
21-1
44.7
327
8.67
-834
.68
-546
.53
1,25
6.50
708.
0530
2.17
-1,0
55.8
21,
210.
90
Cha
nges
in In
tern
atio
nal R
eser
ves
-1,3
63.8
4-1
,462
.67
154.
21-1
44.7
327
8.67
-834
.68
-546
.53
1,25
6.50
708.
0530
2.17
-1,0
55.8
21,
210.
90
IMF
Posit
ion
(net
)0.
000.
000.
000.
000.
000.
000.
000.
000.
000.
000.
000.
00
Hol
ding
s of S
DR
0.00
0.00
0.00
0.00
0.00
0.00
0.00
0.00
0.00
0.00
0.00
0.00
O
ther
Res
erve
Cha
nges
-1,3
63.8
4-1
,462
.67
154.
21-1
44.7
327
8.67
-834
.68
-546
.53
1,25
6.50
708.
0530
2.17
-1,0
55.8
21,
210.
90
Exc
eptio
nal F
inan
cing
0.00
0.00
0.00
0.00
0.00
0.00
0.00
0.00
0.00
0.00
0.00
0.00
Tabl
e 19
. B
alan
ce o
f Pay
men
ts
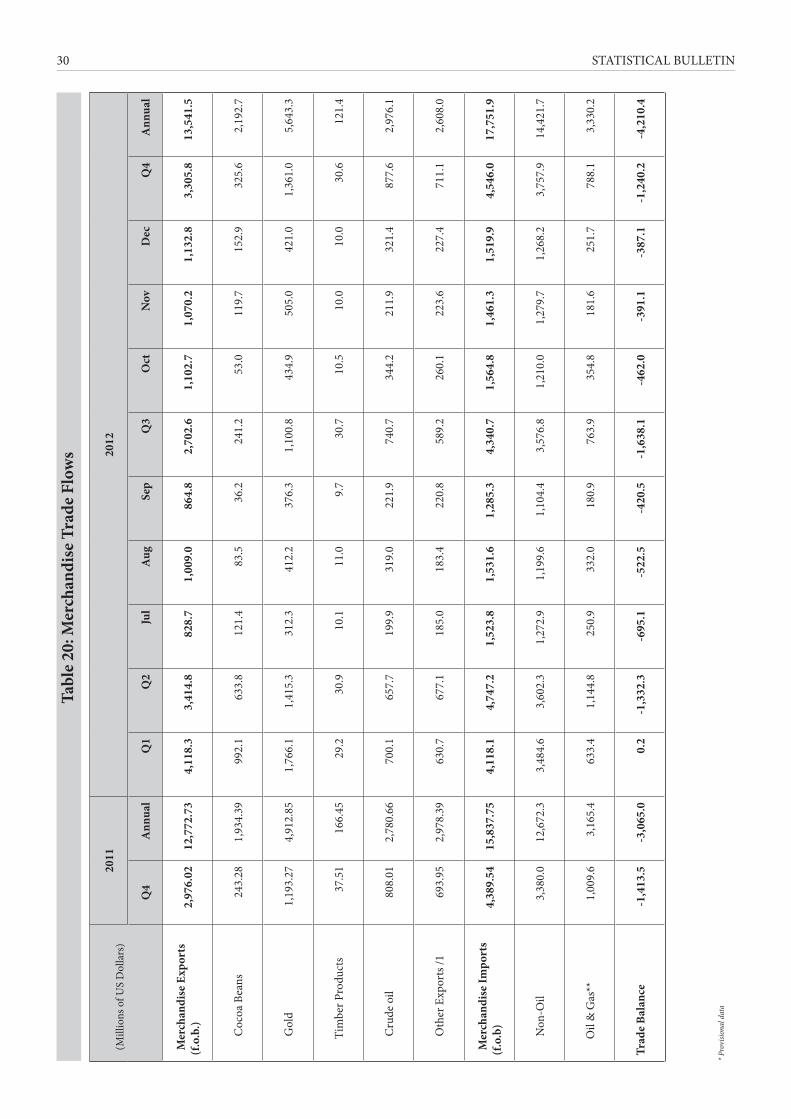
STATISTICAL BULLETIN30
(M
illio
ns o
f US
Dol
lars
)20
1120
12
Q4
Ann
ual
Q1
Q2
Jul
Aug
Sep
Q3
Oct
Nov
Dec
Q4
Ann
ual
Mer
chan
dise
Exp
orts
(f
.o.b
.) 2
,976
.02
12,
772.
73
4,11
8.3
3,41
4.8
828.
71,
009.
086
4.8
2,70
2.6
1,10
2.7
1,07
0.2
1,13
2.8
3,30
5.8
13,5
41.5
Coc
oa B
eans
2
43.2
8 1
,934
.39
992.
163
3.8
121.
483
.536
.224
1.2
53.0
119.
715
2.9
325.
62,
192.
7
Gol
d 1
,193
.27
4,9
12.8
5 1,
766.
11,
415.
331
2.3
412.
237
6.3
1,10
0.8
434.
950
5.0
421.
01,
361.
05,
643.
3
Tim
ber P
rodu
cts
37.
51
166
.45
29.2
30.9
10.1
11.0
9.7
30.7
10.5
10.0
10.0
30.6
121.
4
Cru
de o
il 8
08.0
1 2
,780
.66
700.
165
7.7
199.
931
9.0
221.
974
0.7
344.
221
1.9
321.
487
7.6
2,97
6.1
Oth
er E
xpor
ts /1
693
.95
2,9
78.3
9 63
0.7
677.
118
5.0
183.
422
0.8
589.
226
0.1
223.
622
7.4
711.
12,
608.
0
Mer
chan
dise
Impo
rts
(f.o
.b)
4,3
89.5
4 1
5,83
7.75
4,
118.
14,
747.
21,
523.
81,
531.
61,
285.
34,
340.
71,
564.
81,
461.
31,
519.
94,
546.
017
,751
.9
Non
-Oil
3,38
0.0
12,6
72.3
3,48
4.6
3,60
2.3
1,27
2.9
1,19
9.6
1,10
4.4
3,57
6.8
1,21
0.0
1,27
9.7
1,26
8.2
3,75
7.9
14,4
21.7
Oil
& G
as**
1,00
9.6
3,16
5.4
633.
41,
144.
825
0.9
332.
018
0.9
763.
935
4.8
181.
625
1.7
788.
13,
330.
2
Trad
e Ba
lanc
e-1
,413
.5-3
,065
.00.
2-1
,332
.3-6
95.1
-522
.5-4
20.5
-1,6
38.1
-462
.0-3
91.1
-387
.1-1
,240
.2-4
,210
.4
Tabl
e 20
: Mer
chan
dise
Tra
de F
low
s
* Pro
visio
nal d
ata

STATISTICAL BULLETIN 31
Petroleum Imports by Value in million US$ (f.o.b)2011 2012*
Annual Q1 Q2 Jul Aug Sep Q3 Oct Nov Dec Q4 Annual
Crude Oil 1,465.51 139.89 370.48 66.67 104.87 0.00 171.54 111.34 41.32 51.15 203.81 885.72
Premium 695.54 178.26 295.80 74.07 83.97 58.54 216.58 69.91 69.23 68.29 207.43 898.07
Gas Oil 808.13 223.86 377.39 80.42 102.43 100.96 283.81 153.28 49.11 111.31 313.70 1198.76
LPG 153.04 46.53 59.83 8.59 19.49 21.43 49.51 20.30 22.47 20.93 63.70 219.57
Aviation Fuel - 0.00 0.00 0.00 0.00 0.00 0.00 0.00 0.00 0.00 0.00 0.00
Gas (West Africa) 173.92
Total 3,296.14 588.54 1103.50 229.75 310.76 180.93 721.44 354.83 182.13 251.68 788.64 3202.12
Petroleum Imports by Value in US$ million (c.i.f.) 2011 2012*
Q1 Q2 Jul Aug Sep Q3 Oct Nov Dec Q4 Annual
Crude Oil 1,500.70 143.24 379.38 68.27 107.39 0.00 175.66 114.01 42.31 52.38 208.70 906.98
Premium 693.96 182.53 302.90 75.85 85.99 59.94 221.78 71.59 70.89 69.93 212.41 919.62
Gas Oil 812.88 229.24 386.45 82.35 104.89 103.38 290.63 156.96 50.29 113.99 321.24 1,227.56
LPG 151.58 47.64 61.27 8.80 19.95 21.94 50.70 20.79 23.01 21.43 65.23 224.84
Aviation Fuel 0.00 0.00 0.00 0.00 0.00 0.00 0.00 0.00 0.00 0.00 0.00 0.00
Total 3,159.13 602.65 1,130.00 235.27 318.22 185.27 738.76 363.35 186.50 257.73 807.58 3,278.99
Crude oil Imports ( f. o. b.) by importer, value in US$ million2011 2012*
Annual Q1 Q2 Jul Aug Sep Q3 Oct Nov Dec Q4 Annual
TOR 1,159.08 84.23 161.07 66.67 54.27 0.00 120.94 0.00 0.00 0.00 0.00 366.24
VRA 259.11 100.56 209.44 21.18 71.86 0.00 93.04 111.34 41.32 51.15 203.81 403.04
Total 1,418.19 184.79 370.51 87.85 126.13 0.00 213.98 111.34 41.32 51.15 203.81 769.28
Petroleum Imports by Volumes2011 2012*
Annual Q1 Q2 Jul Aug Sep Q3 Oct Nov Dec Q4 Annual
Crude oil (bbl) 11,397,312 1,154,638 3,029,215 695,253 939,634 0.00 1,634,887 939,334 349,281 440,317 1,728,932 7,547,672
Premium (MT) 695,401 177,376 276,341 77,192 81,219 51,823 210,234 63,348 71,303 70,913 205,564 869,515
Gas oil (MT) 870,643 230,656 385,962 96,055 112,244 103,565 311,864 155,454.68 52,031 119,346 326,832 1,255,313
LPG (MT) 172,293 48,317 67,569 13,617 25,188 23,600 62,405 21,348 22,117 21,070 64,534 242,825
Aviation Fuel (MT) - 5,969 40,895 5,053 11,974 0.00 17,027 9,864 14,951 6,991 31,805 95,697
* ProvisionalSource: Tema Oil Refinery, National Petroleum Authority and Volta River Authority
* Provisional Source: Tema Oil Refinery, National Petroleum Authority and Volta River Authority
* Provisional Source: Tema Oil Refinery and Volta River Authority
* Provisional- No importation for the periodSource: Tema Oil Refinery, National Petroleum Authority and Volta River Authority
Table 21: Crude oil and Petroleum Products Imports 2011 - 2012

STATISTICAL BULLETIN32
(In millions of US dollars, unless otherwise specified
20102011 2012*
Q4 Annual Q1 Q2 Q3 Q4 Annual
Gold
Value 3,803.52 1,200.64 4,920.21 1,766.10 1,415.34 1,100.85 1,360.97 5,643.26
Volume (fine ounces) 3,117,566 705,610 3,144,376 1,057,749 880,137 666,792 825,179 3,429,857
Unit Value (US dollars per ounce) 1,220.03 1,701.56 1,564.76 1,669.68 1,608.09 1,650.96 1,649.30 1,645.33
Cocoa Beans
Value 1,660.01 336.82 2,027.94 992.10 633.82 241.15 325.63 2,192.70
Volume (metric tons) 547,421 117,739 630,216 296,481 207,037 87,496 127,620 718,634
Unit Value (US dollars per ton) 3,032.42 2,860.73 3,217.85 3,346.26 3,061.39 2,756.13 2,551.54 3,051.21
Cocoa products
Value 625.19 189.36 842.94 151.37 147.94 162.26 174.35 635.92
Volume (metric tons) 164,073 54,899 226,232 42,841 38,828 47,995 50,822 180,486
Unit Value (US dollars per ton) 3,810.41 3,449.24 3,725.98 3,533.27 3,810.14 3,380.77 3,430.60 3,523.37
Crude Oil Exports
Value - 805.88 2,778.52 700.11 657.68 740.72 877.54 2,976.05
Volume (barrels) - 7,166,177 24,731,475 5,871,464 5,873,709 6,816,863 7,868,898 26,430,934
Unit value (US dollars per barrel) - 112.46 112.35 119.24 111.97 108.66 111.52 112.60
Timber and Timber Products
Value 189.47 36.71 165.66 29.179748 30.95 30.74 30.56 121.43
Volume (cubic meters) 427,131 76,008 355,620 61,360 61,377 57,084 57,786 237,607
Unit Value (US dollars per cubic meter) 443.58 482.98 465.84 475.55 504.26 538.50 528.85 511.05
Aluminium
Value 0.00 15.29 88.78 25.68 18.16 15.35 12.58 71.77
Volume (metric tons) 0.00 6,053 35,213 11,275 8,014 7,023 5,883 32,195
Unit Value (US dollars per ton) 0.00 2,526.02 2,521.09 2,277.61 2,266.03 2,185.68 2,138.36 2,229.23
Residual oil
Value 68.37 0.00 21.52 - - - - -
Volume (metric tons) 116,907 0.00 89,285 - - - - -
Unit Value (US dollars per ton) 584.81 0.00 241.08 - - - - -
Manganese
Value 58.21 28.58 117.17 20.31 27.27 22.64 22.55 92.77
Volume (metric tons) 893,513 442,490 1,783,929 307,386 402,585 348,068 349,457 1,407,496
Unit Value (US dollars per ton) 65.14 64.59 65.68 66.06 67.74 65.05 64.53 65.91
Electricity
Value 124.94 16.29 65.71 16.27 15.69 8.28 11.58 51.82
Volume (millions of kilowatt-hours) 1,053.62 180.30 728.60 196.93 190.23 97.55 138.34 623.05
Unit Value (US$' 000/kilowatt-hour) 0.12 0.09 0.09 0.08 0.08 0.08 0.08 0.08
Diamond
Value 11.31 1.05 18.32 4.68162412 2.36 1.95 1.38 10.37
Volume (carats) 311,347 22,953 317,539 80551 38,956 47,798 27,642 194,947
Unit Value (US dollars per carat) 36.32 45.75 57.69 58.12 60.58 40.80 49.92 53.20
Bauxite
Value 15.15 1.12 7.09 5.32 4.36 6.03 6.54 22.25
Volume (metric tons) 512,146 37,403 236,304 166,712 129,281 168,110 186,230 650,333
Unit Value (US dollars per ton) 29.58 29.94 30.00 31.91 33.72 35.87 35.12 34.21
Other Non-traditional Exports
Value 1,469.58 356.95 1,731.40 407.15 461.30 372.67 482.19 1,723.31
* Provisional
Table 22. Ghana:Value, Volume and Unit Price of Exports (2010-2012)
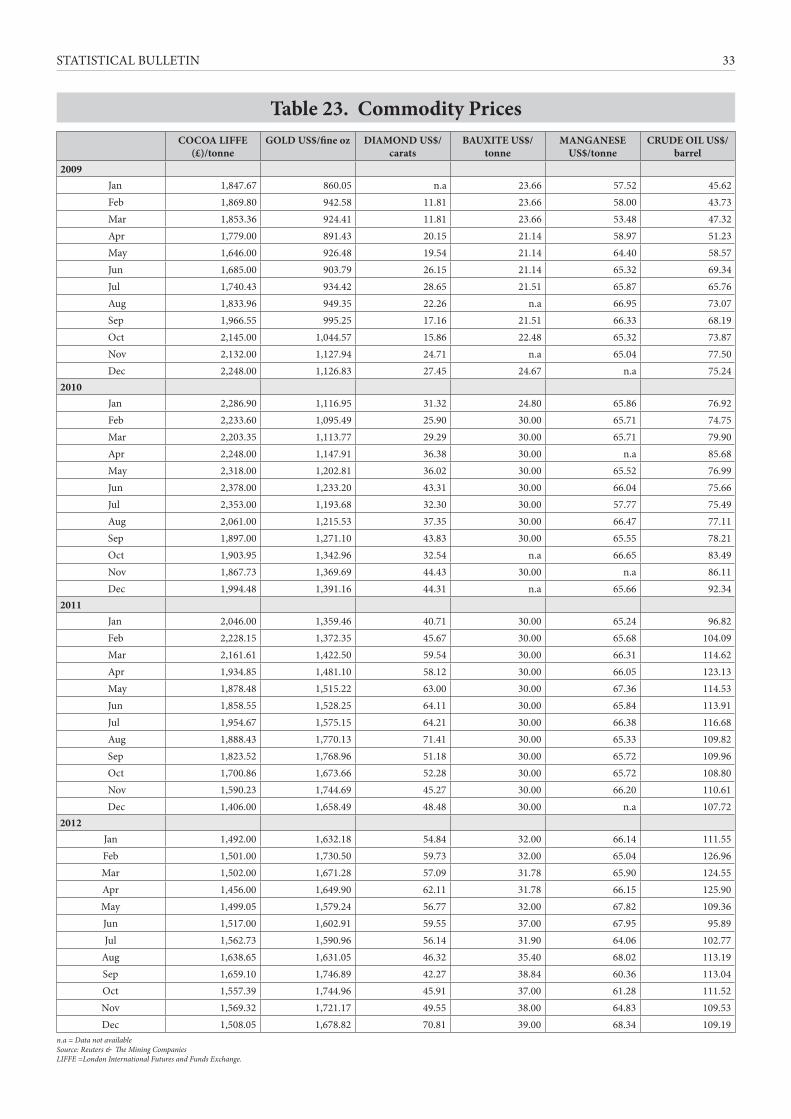
STATISTICAL BULLETIN 33
COCOA LIFFE (£)/tonne
GOLD US$/fine oz DIAMOND US$/carats
BAUXITE US$/tonne
MANGANESE US$/tonne
CRUDE OIL US$/barrel
2009 Jan 1,847.67 860.05 n.a 23.66 57.52 45.62 Feb 1,869.80 942.58 11.81 23.66 58.00 43.73 Mar 1,853.36 924.41 11.81 23.66 53.48 47.32 Apr 1,779.00 891.43 20.15 21.14 58.97 51.23 May 1,646.00 926.48 19.54 21.14 64.40 58.57 Jun 1,685.00 903.79 26.15 21.14 65.32 69.34 Jul 1,740.43 934.42 28.65 21.51 65.87 65.76 Aug 1,833.96 949.35 22.26 n.a 66.95 73.07 Sep 1,966.55 995.25 17.16 21.51 66.33 68.19 Oct 2,145.00 1,044.57 15.86 22.48 65.32 73.87 Nov 2,132.00 1,127.94 24.71 n.a 65.04 77.50 Dec 2,248.00 1,126.83 27.45 24.67 n.a 75.242010 Jan 2,286.90 1,116.95 31.32 24.80 65.86 76.92 Feb 2,233.60 1,095.49 25.90 30.00 65.71 74.75 Mar 2,203.35 1,113.77 29.29 30.00 65.71 79.90 Apr 2,248.00 1,147.91 36.38 30.00 n.a 85.68 May 2,318.00 1,202.81 36.02 30.00 65.52 76.99 Jun 2,378.00 1,233.20 43.31 30.00 66.04 75.66 Jul 2,353.00 1,193.68 32.30 30.00 57.77 75.49 Aug 2,061.00 1,215.53 37.35 30.00 66.47 77.11 Sep 1,897.00 1,271.10 43.83 30.00 65.55 78.21 Oct 1,903.95 1,342.96 32.54 n.a 66.65 83.49 Nov 1,867.73 1,369.69 44.43 30.00 n.a 86.11 Dec 1,994.48 1,391.16 44.31 n.a 65.66 92.342011 Jan 2,046.00 1,359.46 40.71 30.00 65.24 96.82 Feb 2,228.15 1,372.35 45.67 30.00 65.68 104.09 Mar 2,161.61 1,422.50 59.54 30.00 66.31 114.62 Apr 1,934.85 1,481.10 58.12 30.00 66.05 123.13 May 1,878.48 1,515.22 63.00 30.00 67.36 114.53 Jun 1,858.55 1,528.25 64.11 30.00 65.84 113.91 Jul 1,954.67 1,575.15 64.21 30.00 66.38 116.68 Aug 1,888.43 1,770.13 71.41 30.00 65.33 109.82 Sep 1,823.52 1,768.96 51.18 30.00 65.72 109.96 Oct 1,700.86 1,673.66 52.28 30.00 65.72 108.80 Nov 1,590.23 1,744.69 45.27 30.00 66.20 110.61 Dec 1,406.00 1,658.49 48.48 30.00 n.a 107.722012
Jan 1,492.00 1,632.18 54.84 32.00 66.14 111.55Feb 1,501.00 1,730.50 59.73 32.00 65.04 126.96Mar 1,502.00 1,671.28 57.09 31.78 65.90 124.55Apr 1,456.00 1,649.90 62.11 31.78 66.15 125.90May 1,499.05 1,579.24 56.77 32.00 67.82 109.36Jun 1,517.00 1,602.91 59.55 37.00 67.95 95.89Jul 1,562.73 1,590.96 56.14 31.90 64.06 102.77
Aug 1,638.65 1,631.05 46.32 35.40 68.02 113.19Sep 1,659.10 1,746.89 42.27 38.84 60.36 113.04Oct 1,557.39 1,744.96 45.91 37.00 61.28 111.52Nov 1,569.32 1,721.17 49.55 38.00 64.83 109.53Dec 1,508.05 1,678.82 70.81 39.00 68.34 109.19
n.a = Data not available Source: Reuters & The Mining Companies LIFFE =London International Futures and Funds Exchange.
Table 23. Commodity Prices

STATISTICAL BULLETIN34
(In
per c
ent o
f tot
al)
Trad
e Pa
rtne
rs
Expo
rts
Impo
rts
2010
2011
2012
2010
2011
2012
Ann
ual
Ann
ual
Q1
Q2
Q3
Q4
Ann
ual
Ann
ual
Ann
ual
Q1
Q2
Q3
Q4
Ann
ual
Indu
stri
al C
ount
ries
28.0
43.4
44.6
30.8
27.0
23.2
31.4
47.5
47.7
39.2
44.5
47.5
52.4
45.9
Fr
ance
3.4
13.8
13.4
7.9
8
.7
5.4
8
.8
6.8
2.8
2.3
1
.7
2.2
3
.4
2.4
G
erm
any
1.8
1.5
0.9
2.7
1.0
0.9
1.4
2.9
3.1
2.7
2
.6
2.7
2
.9
2.7
Ita
ly0.
86.
612
.83.
66.
35.
77.
12.
31.
9 1
.6
2.4
3
.0
1.7
2
.2
Ja
pan
1.0
0.5
0.2
0.6
0.9
0.6
0.6
1.8
1.6
1.3
1
.3
1.2
2
.2
1.5
N
ethe
rland
s9.
48.
36.
27.
33.
55.
75.
72.
83.
4 6
.1
8.1
7
.4
11.
4 8
.2
U
nite
d K
ingd
om4.
03.
53.
42.
61.
51.
22.
24.
54.
9 3
.2
4.1
4
.2
5.0
4
.1
U
nite
d St
ates
3.0
4.0
3.2
2.1
2.2
1.0
2.1
8.3
10.1
8.4
9
.5
9.6
9
.0
9.1
O
ther
s4.
75.
34.
54.
02.
92.
53.
518
.120
.0 1
3.6
14.
8 1
7.2
16.
7 1
5.6
Oth
er E
urop
eans
13.3
14.6
12.9
15.0
15.6
15.9
14.8
8.8
9.0
8.1
8.7
9.8
8.1
8.7
Res
t of t
he w
orld
58.7
42.0
42.5
54.2
57.4
60.9
53.8
43.7
43.3
52.7
46.8
42.7
39.5
45.4
Tabl
e 24
. G
hana
: Dir
ectio
n of
Tra
de, (
2010
-201
2)
Sour
ce: I
MF-
Dire
ctio
n of
Tra
de S
tatis
tics,
(var
ious
issu
es) &
Ban
k of
Gha
na es
timat
es

STATISTICAL BULLETIN 35
Interbank MarketUS Dollar Pound
SterlingEURO Japanese Yen Swiss Franc
2009 Jan 1.2828 1.8382 1.7067 0.0142 1.0949 Feb 1.3402 1.9411 1.7469 0.0136 1.1349 Mar 1.3832 1.9909 1.8357 0.0140 1.2039 Apr 1.4042 2.0492 1.8454 0.0143 1.2344 May 1.4396 2.2064 1.9973 0.0147 1.3126 Jun 1.4725 2.4141 2.0658 0.0152 1.3446 Jul 1.4858 2.3952 2.0857 0.0154 1.3510 Aug 1.4613 2.3473 2.0775 0.0158 1.3805 Sep 1.4514 2.3298 2.1176 0.0162 1.4082 Oct 1.4416 2.3775 2.1388 0.0160 1.4254 Nov 1.4322 2.3800 2.1529 0.0167 1.4348 Dec 1.4284 2.2991 2.0484 0.0156 1.39182010 Jan 1.4257 2.3100 2.0058 0.0158 1.3574 Feb 1.4266 2.9135 1.9338 0.0160 1.3259 Mar 1.4168 2.1357 1.9108 0.0152 1.3347 Apr 1.4170 2.1706 1.8747 0.0151 1.3159 May 1.4206 2.0593 1.7470 0.0155 1.2274 Jun 1.4267 2.1191 1.7277 0.0161 1.3160 Jul 1.4353 2.2396 1.8526 0.0167 1.3835 Aug 1.4307 2.1950 1.8082 0.0170 1.4024 Sep 1.4269 2.2503 1.9440 0.0172 1.4648 Oct 1.4293 2.2493 1.9752 0.0178 1.4464 Nov 1.4367 2.1806 1.8896 0.0171 1.4440 Dec 1.4738 2.2709 1.9407 0.0179 1.54932011 Jan 1.5013 2.3571 2.0402 0.0180 1.5695 Feb 1.4937 2.4197 2.0643 0.0185 1.6263 Mar 1.5021 2.4338 2.1625 0.0183 1.6584 Apr 1.4972 2.4874 2.2180 0.0186 1.7438 May 1.5018 2.4401 2.1506 0.0185 1.7703 Jun 1.5064 2.4166 2.1523 0.0188 1.8082 Jul 1.5055 2.4528 2.1547 0.0194 1.8817 Aug 1.5104 2.4757 2.1829 0.0197 1.8604 Sep 1.5224 2.4308 2.1266 0.0200 1.7005 Oct 1.5326 2.5020 2.1949 0.0198 1.7890 Nov 1.5412 2.5078 2.1851 0.2010 1.6987 Dec 1.5505 2.4946 2.1076 0.0205 1.68382012 Jan 1.6475 2.6233 2.1781 0.0218 1.8196 Feb 1.6735 2.6764 2.2736 0.0207 1.8568 Mar 1.6888 2.26 2.3025 0.0211 1.9192 Apr 1.7030 2.3372 2.3916 0.0224 1.9805 May 1.8103 2.3938 2.3814 0.0238 1.9277 Jun 1.8735 2.3919 2.4121 0.0239 1.9914 Jul 1.8843 2.3833 2.3756 0.0246 1.9665 Aug 1.8907 3.0450 2.4191 0.0245 2.0052 Sep 1.8887 3.0411 2.4501 0.0246 2.0312 Oct 1.8789 3.0313 2.4265 0.0236 2.0159 Nov 1.8772 2.9989 2.4467 0.0229 2.0387 Dec 1.8800 3.0574 2.4769 0.0219 2.0585
Forex Bureaux MarketUS Dollar Pound Sterling EURO
1.3368 1.8573 1.7314 1.3937 1.9246 1.7612 1.4109 1.9990 1.8614 1.4368 2.0909 1.8636 1.4507 2.2496 1.9643 1.4807 2.3904 2.0402 1.4841 2.4118 2.0762 1.4757 2.3859 2.0805 1.4757 2.3946 2.1230 1.4614 2.3634 2.1382 1.4625 2.3805 2.1532 1.4624 2.3305 2.0810
1.4546 2.3285 2.0359 1.4524 2.2678 1.9768 1.4489 2.1755 1.9691 1.4437 2.2344 1.9282 1.4337 2.0691 1.7732 1.4400 2.1012 1.7630 1.4505 2.2191 1.8541 1.4497 2.2314 1.8250 1.4498 2.2312 1.8791 1.4459 2.2521 1.9528 1.4530 2.2848 1.9666 1.4775 2.2683 1.9550
1.5052 2.3491 2.0073 1.5141 2.3482 2.0209 1.5277 2.4341 2.1128 1.5286 2.4387 2.1319 1.5195 2.4396 2.1291 1.5173 2.4341 2.1400 1.5146 2.4309 2.1241 1.5235 2.4505 2.1387 1.5789 2.4691 2.1469 1.6030 2.4223 2.2112 1.6355 2.5323 2.1900 1.6596 2.5473 2.1591
1.6957 2.6509 2.20771.7003 2.6778 2.24191.7666 2.7882 2.34231.8600 2.9632 2.44731.9323 3.0168 2.44681.9491 3.0327 2.44732.0435 3.1446 2.47142.0318 3.1705 2.49141.9900 3.1773 2.54231.9437 3.0546 2.51271.9309 3.0555 2.46911.9628 3.1060 2.5550
Table 25. Foreign Exchange Rates (GH¢ per Currency); End Period

STATISTICAL BULLETIN36
(In
mill
ions
of U
.S. d
olla
rs)
Stoc
k A
s At E
nd
2010
2011
2012
*
Q1
Q2
Q3
Q4
Q1
Q2
Q3
Q4
Q1
Q2
Q3
Q4
Tota
l Ext
erna
l Deb
t5,
362.
215,
619.
905,
998.
336,
254.
55 6
,828
.82
7,3
57.7
2 7
,345
.38
7,5
89.4
5 7
,821
.26
7,7
04.3
4 7
,843
.16
8,83
5.56
Mul
tilat
eral
Cre
dito
rs2,
690.
402,
786.
612,
916.
193,
057.
693,
434.
133,
854.
903,
853.
463,
891.
783,
802.
723,
638.
373,
659.
004,
225.
14
O
f whi
ch:
IM
F26
2.59
375.
6039
4.59
388.
0240
0.82
495.
8148
5.84
481.
7148
0.21
452.
7347
3.75
704.
79
Bila
tera
l Cre
dito
rs1,
816.
461,
846.
422,
031.
782,
169.
192,
372.
662,
501.
222,
498.
552,
712.
322,
653.
602,
678.
042,
789.
312,
906.
53
O
f whi
ch:
Pa
ris C
lub
1,17
7.20
1,11
1.28
1,24
3.51
1,36
3.03
1,55
6.86
1,64
6.45
1,65
4.90
1,83
0.49
559.
3853
7.21
547.
6559
6.81
N
on-P
aris
Clu
b63
9.25
735.
1478
8.27
806.
1681
5.80
854.
7784
3.65
881.
8335
8.79
337.
3231
7.82
340.
16
Ex
port
Cre
dit A
genc
ies
870.
9188
5.54
893.
4695
0.01
O
ther
Con
cess
iona
l86
4.52
917.
971,
030.
381,
019.
55
Com
mer
cial
Cre
dito
rs85
5.35
986.
871,
050.
361,
027.
671,
022.
031,
001.
6099
3.37
985.
351,
364.
941,
387.
931,
394.
851,
703.
89
O
f whi
ch:
In
tern
atio
nal C
apita
l Mar
ket
750.
0075
0.00
750.
0075
0.00
750.
0075
0.00
750.
0075
0.00
750.
0075
0.00
750.
0075
0.00
Tabl
e 26
: Gha
na: P
ublic
and
Pub
licly
Gua
rant
eed
Exte
rnal
Deb
t
* Pro
visio
nal E
stim
ate
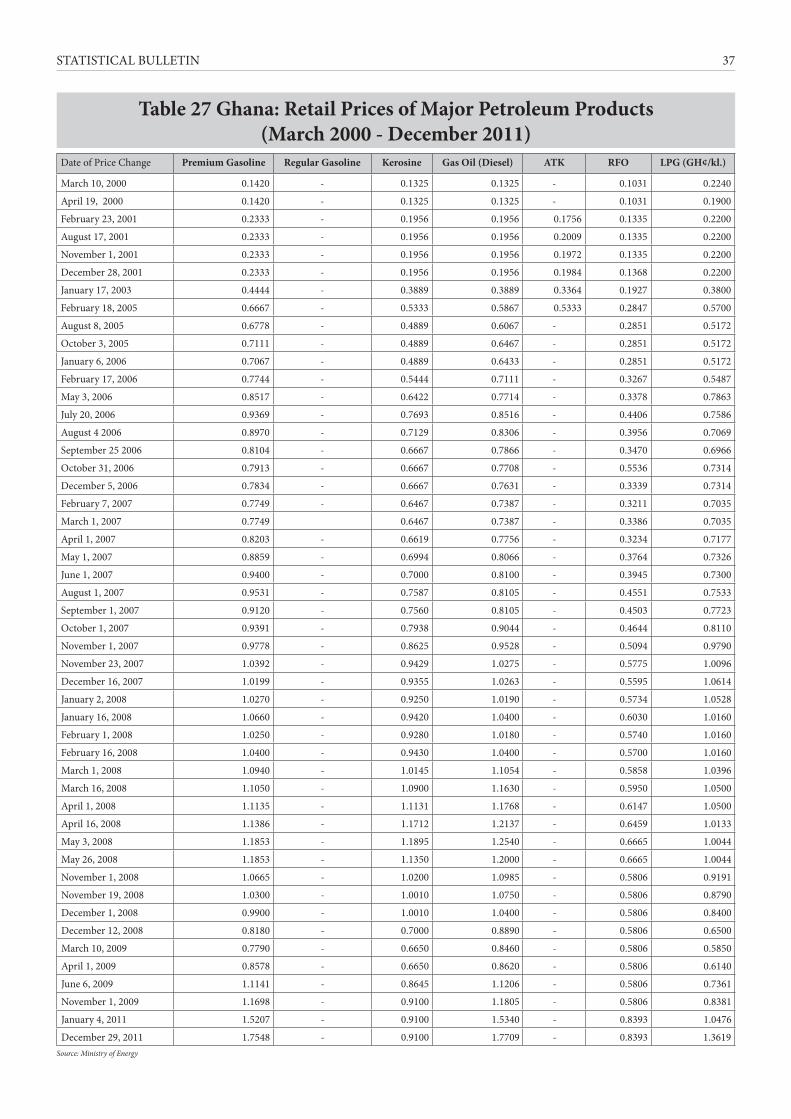
STATISTICAL BULLETIN 37
Date of Price Change Premium Gasoline Regular Gasoline Kerosine Gas Oil (Diesel) ATK RFO LPG (GH¢/kl.)
March 10, 2000 0.1420 - 0.1325 0.1325 - 0.1031 0.2240
April 19, 2000 0.1420 - 0.1325 0.1325 - 0.1031 0.1900
February 23, 2001 0.2333 - 0.1956 0.1956 0.1756 0.1335 0.2200
August 17, 2001 0.2333 - 0.1956 0.1956 0.2009 0.1335 0.2200
November 1, 2001 0.2333 - 0.1956 0.1956 0.1972 0.1335 0.2200
December 28, 2001 0.2333 - 0.1956 0.1956 0.1984 0.1368 0.2200
January 17, 2003 0.4444 - 0.3889 0.3889 0.3364 0.1927 0.3800
February 18, 2005 0.6667 - 0.5333 0.5867 0.5333 0.2847 0.5700
August 8, 2005 0.6778 - 0.4889 0.6067 - 0.2851 0.5172
October 3, 2005 0.7111 - 0.4889 0.6467 - 0.2851 0.5172
January 6, 2006 0.7067 - 0.4889 0.6433 - 0.2851 0.5172
February 17, 2006 0.7744 - 0.5444 0.7111 - 0.3267 0.5487
May 3, 2006 0.8517 - 0.6422 0.7714 - 0.3378 0.7863
July 20, 2006 0.9369 - 0.7693 0.8516 - 0.4406 0.7586
August 4 2006 0.8970 - 0.7129 0.8306 - 0.3956 0.7069
September 25 2006 0.8104 - 0.6667 0.7866 - 0.3470 0.6966
October 31, 2006 0.7913 - 0.6667 0.7708 - 0.5536 0.7314
December 5, 2006 0.7834 - 0.6667 0.7631 - 0.3339 0.7314
February 7, 2007 0.7749 - 0.6467 0.7387 - 0.3211 0.7035
March 1, 2007 0.7749 0.6467 0.7387 - 0.3386 0.7035
April 1, 2007 0.8203 - 0.6619 0.7756 - 0.3234 0.7177
May 1, 2007 0.8859 - 0.6994 0.8066 - 0.3764 0.7326
June 1, 2007 0.9400 - 0.7000 0.8100 - 0.3945 0.7300
August 1, 2007 0.9531 - 0.7587 0.8105 - 0.4551 0.7533
September 1, 2007 0.9120 - 0.7560 0.8105 - 0.4503 0.7723
October 1, 2007 0.9391 - 0.7938 0.9044 - 0.4644 0.8110
November 1, 2007 0.9778 - 0.8625 0.9528 - 0.5094 0.9790
November 23, 2007 1.0392 - 0.9429 1.0275 - 0.5775 1.0096
December 16, 2007 1.0199 - 0.9355 1.0263 - 0.5595 1.0614
January 2, 2008 1.0270 - 0.9250 1.0190 - 0.5734 1.0528
January 16, 2008 1.0660 - 0.9420 1.0400 - 0.6030 1.0160
February 1, 2008 1.0250 - 0.9280 1.0180 - 0.5740 1.0160
February 16, 2008 1.0400 - 0.9430 1.0400 - 0.5700 1.0160
March 1, 2008 1.0940 - 1.0145 1.1054 - 0.5858 1.0396
March 16, 2008 1.1050 - 1.0900 1.1630 - 0.5950 1.0500
April 1, 2008 1.1135 - 1.1131 1.1768 - 0.6147 1.0500
April 16, 2008 1.1386 - 1.1712 1.2137 - 0.6459 1.0133
May 3, 2008 1.1853 - 1.1895 1.2540 - 0.6665 1.0044
May 26, 2008 1.1853 - 1.1350 1.2000 - 0.6665 1.0044
November 1, 2008 1.0665 - 1.0200 1.0985 - 0.5806 0.9191
November 19, 2008 1.0300 - 1.0010 1.0750 - 0.5806 0.8790
December 1, 2008 0.9900 - 1.0010 1.0400 - 0.5806 0.8400
December 12, 2008 0.8180 - 0.7000 0.8890 - 0.5806 0.6500
March 10, 2009 0.7790 - 0.6650 0.8460 - 0.5806 0.5850
April 1, 2009 0.8578 - 0.6650 0.8620 - 0.5806 0.6140
June 6, 2009 1.1141 - 0.8645 1.1206 - 0.5806 0.7361
November 1, 2009 1.1698 - 0.9100 1.1805 - 0.5806 0.8381
January 4, 2011 1.5207 - 0.9100 1.5340 - 0.8393 1.0476
December 29, 2011 1.7548 - 0.9100 1.7709 - 0.8393 1.3619Source: Ministry of Energy
Table 27 Ghana: Retail Prices of Major Petroleum Products(March 2000 - December 2011)
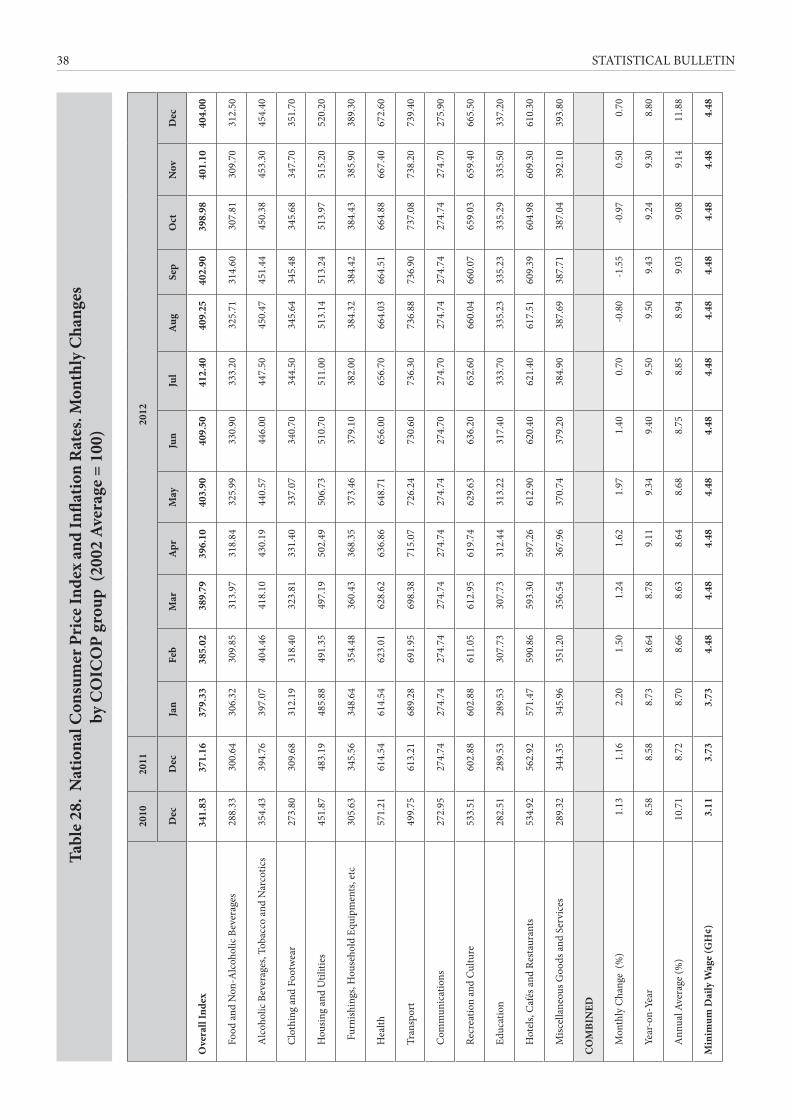
STATISTICAL BULLETIN38
2010
2011
2012
Dec
Dec
Jan
Feb
Mar
Apr
May
Jun
Jul
Aug
Sep
Oct
Nov
Dec
Ove
rall
Inde
x34
1.83
371.
1637
9.33
385.
0238
9.79
396.
1040
3.90
409.
5041
2.40
409.
2540
2.90
398.
9840
1.10
404.
00
F
ood
and
Non
-Alc
ohol
ic B
ever
ages
288.
3330
0.64
306.
3230
9.85
313.
9731
8.84
325.
9933
0.90
333.
2032
5.71
314.
6030
7.81
309.
7031
2.50
A
lcoh
olic
Bev
erag
es, T
obac
co a
nd N
arco
tics
354.
4339
4.76
397.
0740
4.46
418.
1043
0.19
440.
5744
6.00
447.
5045
0.47
451.
4445
0.38
453.
3045
4.40
C
loth
ing
and
Foot
wea
r27
3.80
309.
6831
2.19
318.
4032
3.81
331.
4033
7.07
340.
7034
4.50
345.
6434
5.48
345.
6834
7.70
351.
70
H
ousin
g an
d U
tiliti
es45
1.87
483.
1948
5.88
491.
3549
7.19
502.
4950
6.73
510.
7051
1.00
513.
1451
3.24
513.
9751
5.20
520.
20
Furn
ishin
gs, H
ouse
hold
Equ
ipm
ents
, etc
305.
6334
5.56
348.
6435
4.48
360.
4336
8.35
373.
4637
9.10
382.
0038
4.32
384.
4238
4.43
385.
9038
9.30
H
ealth
57
1.21
614.
5461
4.54
623.
0162
8.62
636.
8664
8.71
656.
0065
6.70
664.
0366
4.51
664.
8866
7.40
672.
60
T
rans
port
49
9.75
613.
2168
9.28
691.
9569
8.38
715.
0772
6.24
730.
6073
6.30
736.
8873
6.90
737.
0873
8.20
739.
40
C
omm
unic
atio
ns27
2.95
274.
7427
4.74
274.
7427
4.74
274.
7427
4.74
274.
7027
4.70
274.
7427
4.74
274.
7427
4.70
275.
90
R
ecre
atio
n an
d Cu
lture
53
3.51
602.
8860
2.88
611.
0561
2.95
619.
7462
9.63
636.
2065
2.60
660.
0466
0.07
659.
0365
9.40
665.
50
E
duca
tion
282.
5128
9.53
289.
5330
7.73
307.
7331
2.44
313.
2231
7.40
333.
7033
5.23
335.
2333
5.29
335.
5033
7.20
H
otel
s, C
afés
and
Res
taur
ants
534.
9256
2.92
571.
4759
0.86
593.
3059
7.26
612.
9062
0.40
621.
4061
7.51
609.
3960
4.98
609.
3061
0.30
M
iscel
lane
ous G
oods
and
Ser
vice
s28
9.32
344.
3534
5.96
351.
2035
6.54
367.
9637
0.74
379.
2038
4.90
387.
6938
7.71
387.
0439
2.10
393.
80
CO
MBI
NED
M
onth
ly C
hang
e (%
)1.
131.
162.
201.
501.
241.
621.
971.
400.
70-0
.80
-1.5
5-0
.97
0.50
0.70
Y
ear-
on-Y
ear
8.58
8.58
8.73
8.64
8.78
9.11
9.34
9.40
9.50
9.50
9.43
9.24
9.30
8.80
A
nnua
l Ave
rage
(%)
10.7
18.
728.
708.
668.
638.
648.
688.
758.
858.
949.
039.
089.
1411
.88
Min
imum
Dai
ly W
age
(GH
¢)3.
113.
733.
734.
484.
484.
484.
484.
484.
484.
484.
484.
484.
484.
48
Tab
le 2
8. N
atio
nal C
onsu
mer
Pri
ce In
dex
and
Infla
tion
Rat
es. M
onth
ly C
hang
es
by C
OIC
OP
grou
p (2
002
Aver
age
= 10
0)
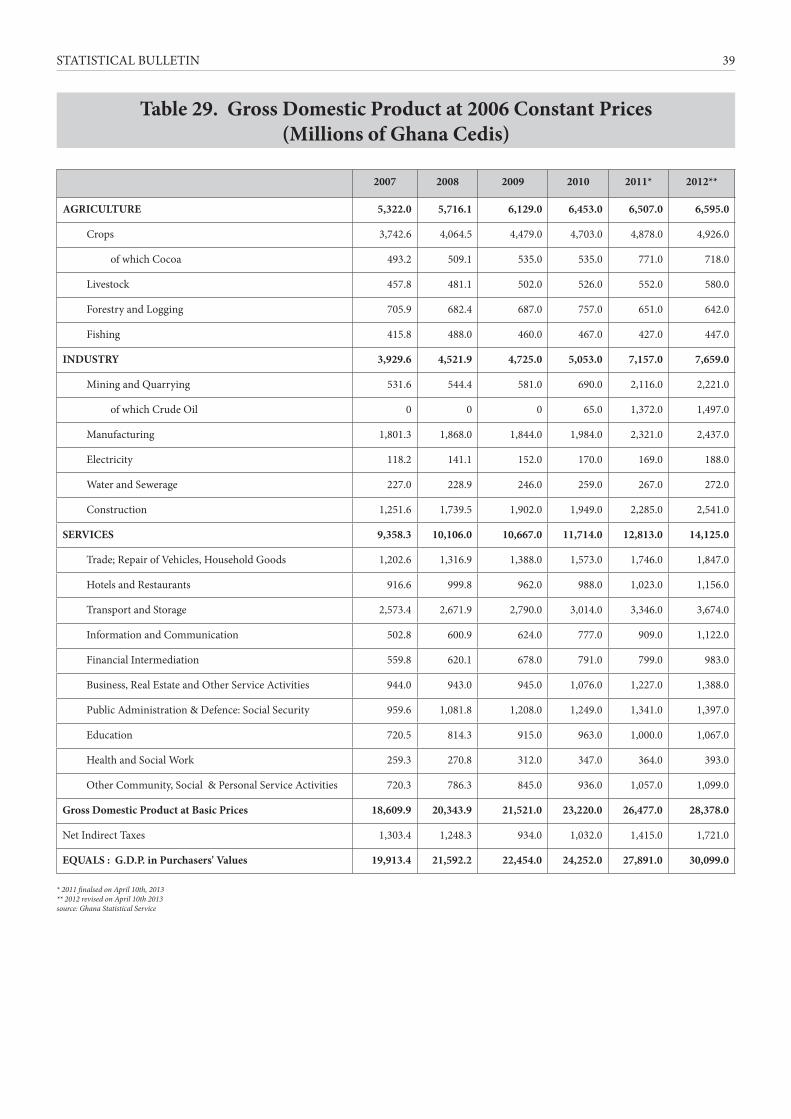
STATISTICAL BULLETIN 39
2007 2008 2009 2010 2011* 2012**
AGRICULTURE 5,322.0 5,716.1 6,129.0 6,453.0 6,507.0 6,595.0
Crops 3,742.6 4,064.5 4,479.0 4,703.0 4,878.0 4,926.0
of which Cocoa 493.2 509.1 535.0 535.0 771.0 718.0
Livestock 457.8 481.1 502.0 526.0 552.0 580.0
Forestry and Logging 705.9 682.4 687.0 757.0 651.0 642.0
Fishing 415.8 488.0 460.0 467.0 427.0 447.0
INDUSTRY 3,929.6 4,521.9 4,725.0 5,053.0 7,157.0 7,659.0
Mining and Quarrying 531.6 544.4 581.0 690.0 2,116.0 2,221.0
of which Crude Oil 0 0 0 65.0 1,372.0 1,497.0
Manufacturing 1,801.3 1,868.0 1,844.0 1,984.0 2,321.0 2,437.0
Electricity 118.2 141.1 152.0 170.0 169.0 188.0
Water and Sewerage 227.0 228.9 246.0 259.0 267.0 272.0
Construction 1,251.6 1,739.5 1,902.0 1,949.0 2,285.0 2,541.0
SERVICES 9,358.3 10,106.0 10,667.0 11,714.0 12,813.0 14,125.0
Trade; Repair of Vehicles, Household Goods 1,202.6 1,316.9 1,388.0 1,573.0 1,746.0 1,847.0
Hotels and Restaurants 916.6 999.8 962.0 988.0 1,023.0 1,156.0
Transport and Storage 2,573.4 2,671.9 2,790.0 3,014.0 3,346.0 3,674.0
Information and Communication 502.8 600.9 624.0 777.0 909.0 1,122.0
Financial Intermediation 559.8 620.1 678.0 791.0 799.0 983.0
Business, Real Estate and Other Service Activities 944.0 943.0 945.0 1,076.0 1,227.0 1,388.0
Public Administration & Defence: Social Security 959.6 1,081.8 1,208.0 1,249.0 1,341.0 1,397.0
Education 720.5 814.3 915.0 963.0 1,000.0 1,067.0
Health and Social Work 259.3 270.8 312.0 347.0 364.0 393.0
Other Community, Social & Personal Service Activities 720.3 786.3 845.0 936.0 1,057.0 1,099.0
Gross Domestic Product at Basic Prices 18,609.9 20,343.9 21,521.0 23,220.0 26,477.0 28,378.0
Net Indirect Taxes 1,303.4 1,248.3 934.0 1,032.0 1,415.0 1,721.0
EQUALS : G.D.P. in Purchasers' Values 19,913.4 21,592.2 22,454.0 24,252.0 27,891.0 30,099.0
Table 29. Gross Domestic Product at 2006 Constant Prices(Millions of Ghana Cedis)
* 2011 finalsed on April 10th, 2013 ** 2012 revised on April 10th 2013 source: Ghana Statistical Service

STATISTICAL BULLETIN40
Table 30. Gross Domestic Product at Current Prices(Millions of Ghana Cedis)
* 2011 finalsed on April 10th, 2013 ** 2012 revised on April 10th 2013 source: Ghana Statistical Service
2007 2008 2009 2010 2011* 2012**
AGRICULTURE 6,320.0 8,875.0 11,343.0 12,910.0 14,155.0 15,399.0
Crops 4,409.0 6,435.0 8,425.0 9,422.0 10,650.0 11,477.0
of which Cocoa 581.0 706.0 874.0 1,392.0 1,996.0 2,044.0
Livestock 501.0 606.0 729.0 873.0 1,004.0 1,159.0
Forestry and Logging 910.0 1,072.0 1,314.0 1,614.0 1,549.0 1,705.0
Fishing 500.0 762.0 874.0 1,001.0 952.0 1,057.0
INDUSTRY 4,513.0 5,855.0 6,776.0 8,294.0 14,274.0 18,580.0
Mining and Quarrying 602.0 693.0 740.0 1,013.0 4,690.0 5,956.0
of which Crude Oil 0.0 0.0 0.0 178.0 3,746.0 4,645.0
Manufacturing 1,990.0 2,277.0 2,478.0 2,941.0 3,842.0 4,680.0
Electricity 130.0 155.0 167.0 266.0 280.0 329.0
Water and Sewerage 227.0 229.0 246.0 368.0 467.0 505.0
Construction 1,564.0 2,500.0 3,144.0 3,706.0 4,995.0 7,110.0
SERVICES 10,922.0 13,935.0 17,543.0 22,184.0 27,423.0 33,963.0
Trade; Repair of Vehicles, Household Goods 1,335.0 1,710.0 2,109.0 2,701.0 3,282.0 3,784.0
Hotels and Restaurants 1,210.0 1,716.0 2,196.0 2,593.0 3,007.0 3,611.0
Transport and Storage 2,849.0 3,262.0 3,758.0 4,578.0 5,997.0 7,704.0
Information and Communication 511.0 622.0 657.0 831.0 989.0 1,233.0
Financial Intermediation 739.0 1,089.0 1,547.0 2,240.0 2,466.0 3,385.0
Business, Real Estate and Other Service Activities 1,018.0 1,185.0 1,462.0 1,945.0 2,591.0 3,279.0
Public Administration & Defence: Social Security 1,289.0 1,799.0 2,479.0 3,024.0 3,897.0 4,871.0
Education 8,556.0 1,132.0 1,506.0 1,877.0 2,307.0 2,732.0
Health and Social Work 308.0 381.0 513.0 674.0 728.0 872.0
Other Community, Social & Personal Service Activities
807.0 1,039.0 1,318.0 1,722.0 2,159.0 2,492.0
Gross Domestic Product at Basic Prices 21,755.0 28,664.0 35,662.0 43,388.0 55,852.0 67,942.0
Net Indirect Taxes 1,400.0 1,514.0 936.0 2,654.0 3,964.0 5,167.0
EQUALS : G.D.P. in Purchasers' Values 23,154.0 30,179.0 36,598.0 46,042.0 59,816.0 73,109.0