bangladesh association of publicly listed companies report 2013.pdf4 annual report 2013 notice of...
TRANSCRIPT

bangladesh association of publicly listed companies i


2 annual RepoRt 2013
August 1, 2014
All Member-CompaniesofBangladesh Association of Publicly Listed Companies (BAPLC)
subject: annual Report for the year ended as at december 31, 2013.
Dear Sirs,
We are pleased to enclose a copy of the Annual Report 2013 together with the Audited Financial Statements including Balance Sheet as at December 31, 2013 and Income Statement, Cash Flow Statement for the year ended December 31, 2013 along with notes thereon of Bangladesh Association of Publicly Listed Companies (BAPLC).
Looking forward to your active participation in the AGM, we remain.
Yours sincerely,
K.M. Abdul HaiSecretary-General
BANGLADESH ASSOCIATION OF PUBLICLY LISTED COMPANIESBlock B, Road 1, House 17, Unit A, Niketan Eastern Housing Complex, Gulshan 1 Dhaka 1212
FORW
ARD
bangladesh association of publicly listed companies 3
Notice of the 15th Annual General Meeting 4
Photo Gallery 5
Corporate Structure 2013 7
Report of the Executive Committee 8
Table of Information / Statistics 29
Financial Report 51
Auditors’ Report 52
Statement of Financial Position 53
Income & Expenditure Statement 54
Statement of Cash Flows 55
Notes to the Financial Statements 56
Table ofContents

4 annual RepoRt 2013
notice of the 15th annual geneRal meeting
Notice is hereby given that the 15th Annual General Meeting of the Members of Bangladesh Association of Publicly Listed Companies will be held on Monday, 25th August, 2014 at 5:00 P.M. at Green Delta AIMs Tower, (8th Floor), 51-52 Mohakhali, Dhaka – 1212, to transact the following business:
agenda
ordinary business
1. To receive, consider and adopt the Annual Report of the Executive Committee of the Association for the year ended 31st December 2013.
2. To receive, consider and adopt the Financial Statements of the Association and the Auditors’ Report thereon for the year ended 31st December 2013.
3. To announce the result of Election of the New Executive Committee for two-year term 2014-2015.4. To appoint Auditors for the year 2014 and fix their remuneration.
special businessTo consider and if thought fit to pass the following resolution, with or without amendments, as Special Resolution relating to the - (a) Change of amount of Admission Fees for Membership. (b) Clause 18(b) shall be deleted as it contradicts with clause18(c).
present clauses of the articles to be amended as & substituted by
7(ii) Any Listed Company eligible to become a member and applying for membership shall pay, along with application an Admission fee of Tk. 20,000/- plus the Annual Subscription as follows:
Any Listed Company eligible to become member and applying for membership shall pay, along with application an Admission fee of Tk. 50,000/- plus the Annual Subscription as follows:
Having paid up capital up to Tk. 3 Crore - Tk. 5,000 per year.Having paid up capital up to Tk. 10 Crore - Tk. 15,000 per year.Having paid up capital up to above Tk. 10 Crore - Tk. 30,000 per year.
Having paid up capital up to Tk. 3 Crore - Tk. 5,000 per year.Having paid up capital up to Tk. 10 Crore - Tk. 15,000 per year.Having paid up capital up to Tk. 10 Crore - Tk. 30,000 per year.
However, members joining during the second half of any calendar year shall be required to pay 50% of the Annual subscription.
However, members joining during the second half of any calendar year shall be required to pay 50% of the Annual subscription.
The Executive Committee may increase or reduce the rate of Admission fee and Annual subscription from time to time in future.
The Executive Committee may increase or reduce the rate of Admission fee and Annual subscription from time to time in future.
18(b) On retirement from the Committee, the retiring representative or any other representative from the same firm/company/corporation shall remain eligible to stand for re-election.
To be deleted
By order of the Executive Committee
K. m. abdul haiSecretary-General
Ref: AGM – BAPLC/15/2014 1st August, 2014
all members - companies of baplc
BANGLADESH ASSOCIATION OF PUBLICLY LISTED COMPANIESBlock B, Road 1, House 17, Unit A, Niketan Eastern Housing Complex, Gulshan 1 Dhaka 1212
NO
TICE
bangladesh association of publicly listed companies 5
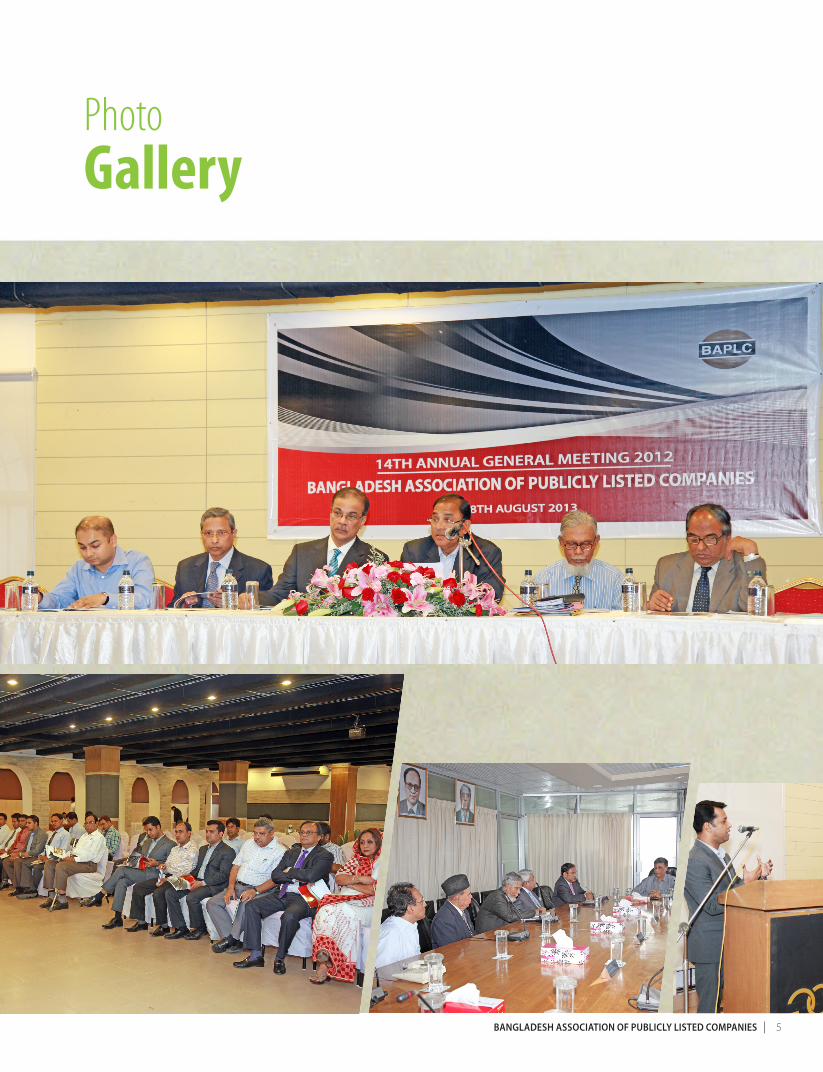
PhotoGallery

6 annual RepoRt 2013
pResident Mr. Tapan Chowdhury, Managing Director, Square Textiles Ltd.
Vice-pResident Mr. Mohammed Younus, Managing Director, Sonali Paper & Board Mills Ltd.
membeRs of the eXecutiVe committee Mr. Azam J. Chowdhury, Managing Director, MJL Bangladesh Ltd. Mr. Md. Abdur Rob, Managing Director, National Housing Finance and Inv. Ltd. Mr. Syed Nasim Manzur, Managing Director, Apex Footwear Ltd. Mr. A.K.M. Azizur Rahman, Chairman, Sonargaon Textiles Limited Mr. Manzurul Islam, Chairman, Eastern Housing Ltd. Mr. A. Matin Chowdhury, Managing Director, Malek Spinning Mills Ltd. Mr. Syed Tareque Md. Ali, Managing Director, Modern Industries (Bangladesh) Ltd. Mr. Md. Hashmat Ali, Managing Director, Continental Insurance Ltd. Mr. Matiur Rahman, Vice-Chairman, Uttara Finance & Investments Ltd. Mrs. Rokeya Quader, Chairman, Desh Garments Limited Ms. Farzana Chowdhury, Managing Director & CEO, Green Delta Insurance Co. Ltd. Mr. Md. Nazrul Islam, Chairman, Fareast Islami Life Ins. Co. Ltd. Mr. Abul Bashar, Deputy Managing Director, Prime Textile Spinning Mills Ltd. Mr. Shahriar Ahmed, Director, Apex Spinning & Knitting Mills Ltd. Mr. Anwer Hossain Khan, Director, Shahjalal Islami Bank Ltd.
secRetaRy-geneRal Mr. K.M. Abdul Hai
auditoRs A. Qasem & Co. Chartered Accountants Pink City, Gulshan-2, Dhaka-1212
banKeR Mutual Trust Bank Ltd. Panthapath Branch, Dhaka-1205
CorporateStructure - 2014
CORP
ORAT
E STR
UCTU
RE
bangladesh association of publicly listed companies 7
pResident Mr. Tapan Chowdhury, Managing Director, Square Textiles Ltd.
Vice-pResident Mr. Mohammed Younus, Managing Director, Sonali Paper & Board Mills Ltd.
membeRs of the eXecutiVe committee Mr. Salman F. Rahman, Vice-Chairman, Beximco Pharmaceuticals Ltd. Mr. Azam J. Chowdhury, Managing Director, MJL Bangladesh Ltd. Mr. A.M. Hamim Rahmatullah, Managing Director, Singer Bangladesh Ltd. Mr. Manzurul Islam, Chairman, Eastern Housing Ltd. Mr. Md. Abdur Rob, Managing Director, National Housing Finance and Inv. Ltd. Mr. Md. Hashmat Ali, Managing Director, Continental Insurance Ltd. Mr. Mohammad Lutfar Rahman, Chairman, Executive Committee, IFIC Bank Ltd. Mr. Nazrul Islam Mazumder, Chairman, Export Import Bank of Bangladesh Ltd. Mr. Muhammed Aziz Khan, Chairman, Summit Power Ltd. Mr. Mohammad Nazrul Islam, Chairman, Fareast Islami Life Ins. Co. Ltd. Mr. Motiur Rahman, Vice-Chairman, Uttara Finance & Investments Ltd. Mr. Hasan Mahmood Raja, Chairman, Khulna Power Company Ltd. Mr. Tore Johnsen (upto January 6, 2013), Chief Executive Officer, Grameenphone Ltd. Mr. Iftekheruddin, Executive Director, Kay & Que (Bangladesh) Limited Mr. Shahriar Ahmed, Director, Apex Spinning & Knitting Mills Ltd.
secRetaRy-geneRal Mr. K.M. Abdul Hai
auditoRs A. Qasem & Co. Chartered Accountants Pink City, Gulshan-2, Dhaka-1212
banKeR Mutual Trust Bank Ltd. Panthapath Branch, Dhaka-1205
CorporateStructure - 2013
8 annual RepoRt 2013
Report of theExecutive Committee To the Members for the year 2013
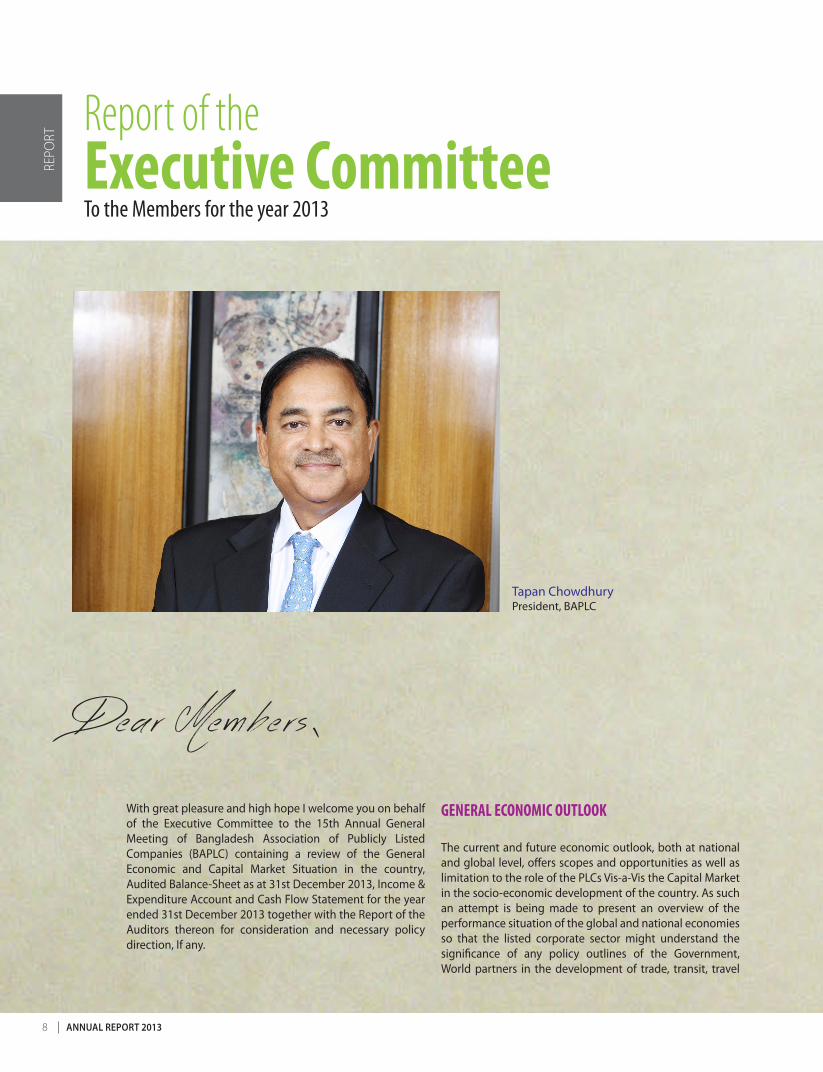
With great pleasure and high hope I welcome you on behalf of the Executive Committee to the 15th Annual General Meeting of Bangladesh Association of Publicly Listed Companies (BAPLC) containing a review of the General Economic and Capital Market Situation in the country, Audited Balance-Sheet as at 31st December 2013, Income & Expenditure Account and Cash Flow Statement for the year ended 31st December 2013 together with the Report of the Auditors thereon for consideration and necessary policy direction, If any.
GENERAL ECONOMIC OUTLOOK
The current and future economic outlook, both at national and global level, offers scopes and opportunities as well as limitation to the role of the PLCs Vis-a-Vis the Capital Market in the socio-economic development of the country. As such an attempt is being made to present an overview of the performance situation of the global and national economies so that the listed corporate sector might understand the significance of any policy outlines of the Government, World partners in the development of trade, transit, travel
Tapan ChowdhuryPresident, BAPLC
Dear Members,
REPO
RT
bangladesh association of publicly listed companies 9
as well as social activities in various areas such as Human Rights, Environment Protection, Natural Habitats, Gender Protection, Child Labour and other CSR obligations that are likely to have various dimensional effects on the individual or sectoral Corporate entities.
GLOBAL ECONOMIC OUTLOOK
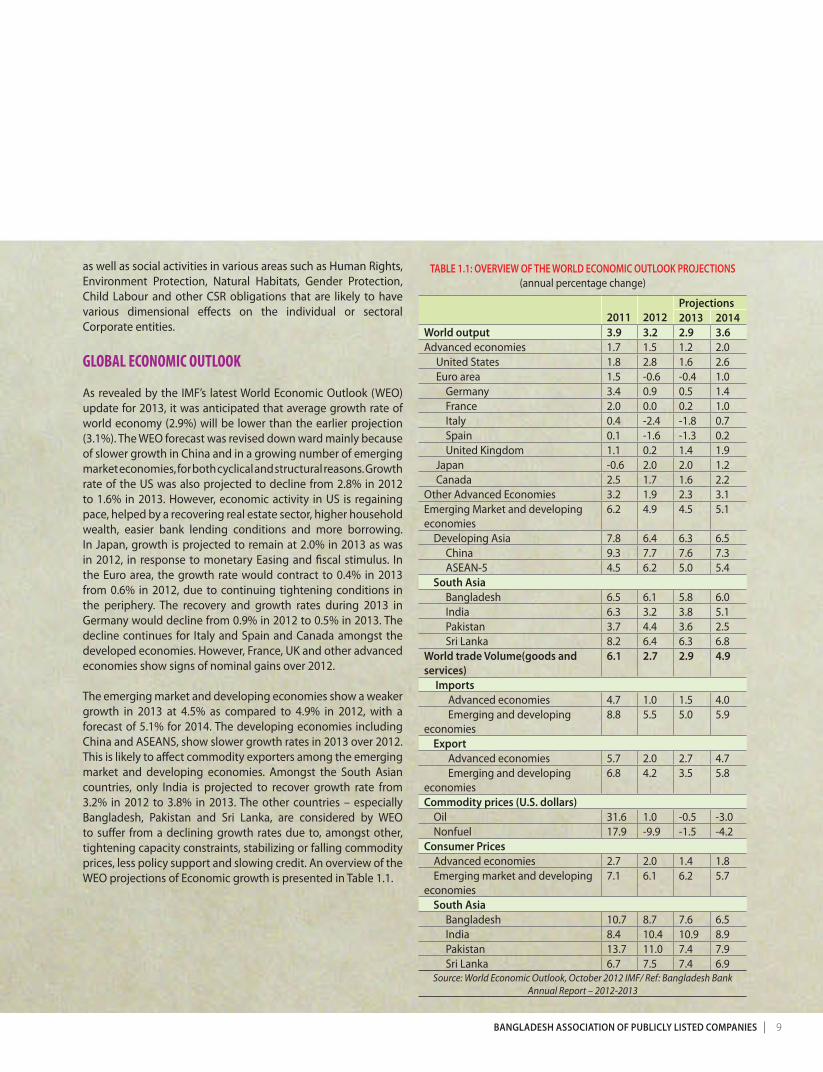
As revealed by the IMF’s latest World Economic Outlook (WEO) update for 2013, it was anticipated that average growth rate of world economy (2.9%) will be lower than the earlier projection (3.1%). The WEO forecast was revised down ward mainly because of slower growth in China and in a growing number of emerging market economies, for both cyclical and structural reasons. Growth rate of the US was also projected to decline from 2.8% in 2012 to 1.6% in 2013. However, economic activity in US is regaining pace, helped by a recovering real estate sector, higher household wealth, easier bank lending conditions and more borrowing. In Japan, growth is projected to remain at 2.0% in 2013 as was in 2012, in response to monetary Easing and fiscal stimulus. In the Euro area, the growth rate would contract to 0.4% in 2013 from 0.6% in 2012, due to continuing tightening conditions in the periphery. The recovery and growth rates during 2013 in Germany would decline from 0.9% in 2012 to 0.5% in 2013. The decline continues for Italy and Spain and Canada amongst the developed economies. However, France, UK and other advanced economies show signs of nominal gains over 2012.
The emerging market and developing economies show a weaker growth in 2013 at 4.5% as compared to 4.9% in 2012, with a forecast of 5.1% for 2014. The developing economies including China and ASEANS, show slower growth rates in 2013 over 2012. This is likely to affect commodity exporters among the emerging market and developing economies. Amongst the South Asian countries, only India is projected to recover growth rate from 3.2% in 2012 to 3.8% in 2013. The other countries – especially Bangladesh, Pakistan and Sri Lanka, are considered by WEO to suffer from a declining growth rates due to, amongst other, tightening capacity constraints, stabilizing or falling commodity prices, less policy support and slowing credit. An overview of the WEO projections of Economic growth is presented in Table 1.1.
table 1.1: oVeRVieW of the WoRld economic outlooK pRoJections(annual percentage change)
2011 2012projections2013 2014
World output 3.9 3.2 2.9 3.6Advanced economies 1.7 1.5 1.2 2.0 United States 1.8 2.8 1.6 2.6 Euro area 1.5 -0.6 -0.4 1.0 Germany 3.4 0.9 0.5 1.4 France 2.0 0.0 0.2 1.0 Italy 0.4 -2.4 -1.8 0.7 Spain 0.1 -1.6 -1.3 0.2 United Kingdom 1.1 0.2 1.4 1.9 Japan -0.6 2.0 2.0 1.2 Canada 2.5 1.7 1.6 2.2Other Advanced Economies 3.2 1.9 2.3 3.1Emerging Market and developing economies
6.2 4.9 4.5 5.1
Developing Asia 7.8 6.4 6.3 6.5 China 9.3 7.7 7.6 7.3 ASEAN-5 4.5 6.2 5.0 5.4 south asia Bangladesh 6.5 6.1 5.8 6.0 India 6.3 3.2 3.8 5.1 Pakistan 3.7 4.4 3.6 2.5 Sri Lanka 8.2 6.4 6.3 6.8World trade Volume(goods and services)
6.1 2.7 2.9 4.9
imports Advanced economies 4.7 1.0 1.5 4.0 Emerging and developing economies
8.8 5.5 5.0 5.9
export Advanced economies 5.7 2.0 2.7 4.7 Emerging and developing economies
6.8 4.2 3.5 5.8
commodity prices (u.s. dollars) Oil 31.6 1.0 -0.5 -3.0 Nonfuel 17.9 -9.9 -1.5 -4.2consumer prices Advanced economies 2.7 2.0 1.4 1.8 Emerging market and developing economies
7.1 6.1 6.2 5.7
south asia Bangladesh 10.7 8.7 7.6 6.5 India 8.4 10.4 10.9 8.9 Pakistan 13.7 11.0 7.4 7.9 Sri Lanka 6.7 7.5 7.4 6.9
Source: World Economic Outlook, October 2012 IMF/ Ref: Bangladesh Bank Annual Report – 2012-2013

10 annual RepoRt 2013
Though the World output growth rate would be lower in 2013 than that of 2012, the World Trade volume (goods and services) would increase in 2013 by 2.9% over that of 2.7% in 2012. As the Table 1.1 above shows, the advanced economies show higher rates of growth both in import and exports during 2013 over 2012 while the emerging and developing economies show a lower growth rates for the same period. This disparity in the share of growth rates in World Trade Volume between the advanced Economies and the Emerging / Developing Economies would need to be attended properly as this restricts transfer of capital from the advanced economies so critically needed by the emerging and developing economies for alleviation of their poverty.
As regards commodity prices, both oil & non-fuel items show a negative growth rates which would benefit both the advanced economies and the emerging nations. However, though the consumer prices in advanced economies show a decline in 2013 over 2012, the same for the emerging nations show an increase for the same period from 6.1 % in 2012 to 6.2 % in 2013, though, again, except India all the south Asia countries show a declining trend, including declining forecast for 2014. This seems to be a strengthening phenomenon for the exports from those countries.
Accordingly, to IMF Global Financial Stability Report, financial stability risks are broadly under control. Accommodative monetary policies and precautionary policy measures have eased monetary and financial conditions and reduced near-term stability risks. However, it is felt that the key advanced economies should maintain a supportive macro-economic policy mix, anchored by credible plans for medium term public debt sustainability. The main downside risks are related to the possibility of a longer growth slowdown in emerging market economies, especially given risks of lower potential growth, slowing credit and weak external conditions.
DOMESTIC ECONOMIC SITUATION: KEY INDICATORS
a) General Situation:
Despite several adverse socio-economic factors, the macroeconomic situation continued to remain stable over a considerable period of time and proved resilient to global financial crisis posting GDP growth rate averaging 6.2% during past 5 years and attaining GDP growth of 6.0% and 6.2% based on 1995-96 and 2005-06 as base years respectively. Substantial increased remittance inflows and export earnings helped achieve this solid growth rate. Export diversification to the newly
discovered markets improved earnings from exports to record a satisfactory growth of 10.7% in FY-13 as against 6.2% in FY-12. The growth of imports decreased from 2.4% in FY-12 to 0.8% in FY13 due mainly to major reduction in imports of food grain, some consumer goods and capital machinery. A lower trade deficit and higher growth of worker remittances led the current account balance to significant surplus of USD 2525 mn in FY-13. The overall balance also showed a huge surplus of USD 5128 mn in FY-13 with substantial contributions from current account balance, capital account and financial account. In the monetary sector, Broad Money (M2) as well as credit to private sector were kept under control having a declining effect on price level.
b) Growth Performance:
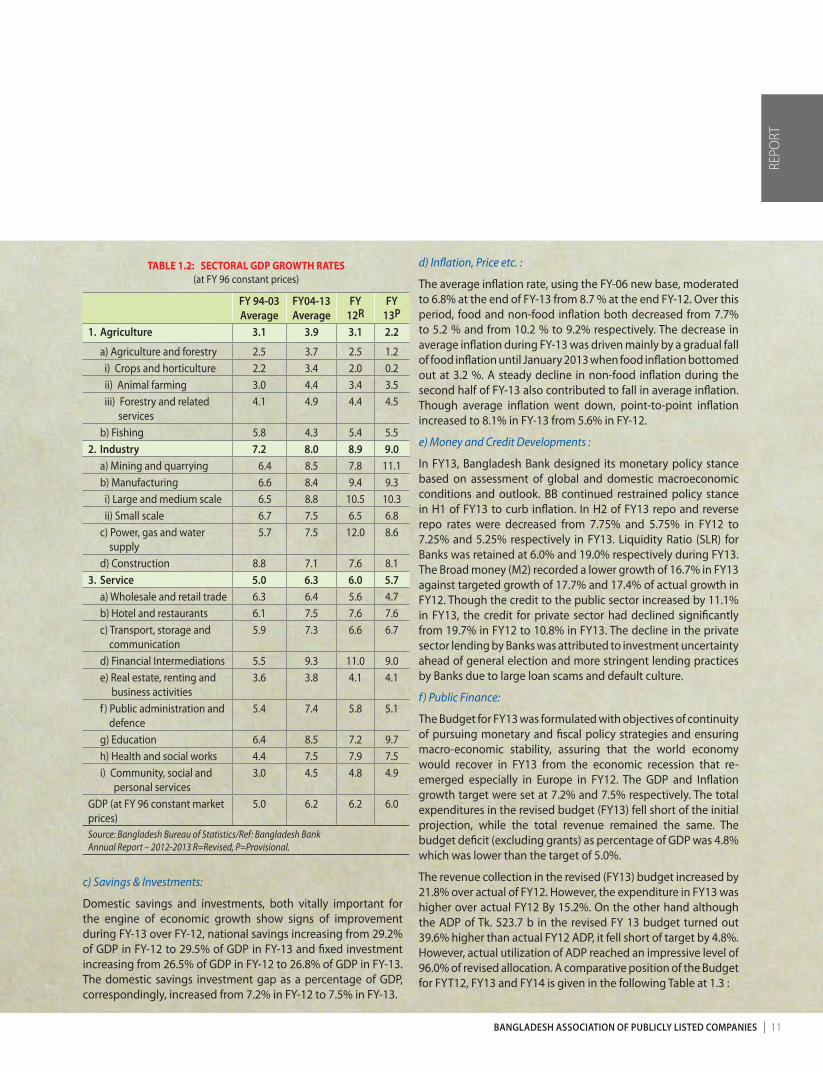
The overall GDP growth of 6.2% during FY-13 using 2005-06 base, remains impressive, though growth in agriculture sector marginally declined from 3.1% in FY-12 to 2.2% in FY-13 and horticulture declined to 0.2% from 2.0% in FY-12. However, industry sector had a marginally high rate of growth at 9.0% in FY-13 than 8.9% in FY-12. The services sector also had seen a fall to 5.7% in FY-13 from 6.0% in FY-12. The main areas of decline are wholesale / retail trade (from 5.6% to 4.7%) financial intermediaries (from 11.0% to 9.0%), Public Administration and defence (from 5.8% to 5.1%), health & social works (from 7.9% to 7.5%). However, the most gains were in the areas of transport & communication (from 6.6% to 6.7%), education (from 7.2% to 9.7%) and community, social & personal services (from 4.8% to 4.9%). Other sub-sectors however, showed static position. Amongst the GDP growth sub-sectors, education grew strongly over the years at a higher pace than any other sub-sectors as shown below in Table 1.2 :
Report of theExecutive Committee To the Members for the year 2013 [cont...]
REPO
RT
bangladesh association of publicly listed companies 11
TABLE 1.2: SECTORAL GDP GROWTH RATES (at FY 96 constant prices)
fy 94-03average
fy04-13average
fy 12R
fy 13p
1. agriculture 3.1 3.9 3.1 2.2
a) Agriculture and forestry 2.5 3.7 2.5 1.2 i) Crops and horticulture 2.2 3.4 2.0 0.2 ii) Animal farming 3.0 4.4 3.4 3.5 iii) Forestry and related services
4.1 4.9 4.4 4.5
b) Fishing 5.8 4.3 5.4 5.52. industry 7.2 8.0 8.9 9.0 a) Mining and quarrying 6.4 8.5 7.8 11.1 b) Manufacturing 6.6 8.4 9.4 9.3 i) Large and medium scale 6.5 8.8 10.5 10.3 ii) Small scale 6.7 7.5 6.5 6.8 c) Power, gas and water supply
5.7 7.5 12.0 8.6
d) Construction 8.8 7.1 7.6 8.13. service 5.0 6.3 6.0 5.7 a) Wholesale and retail trade 6.3 6.4 5.6 4.7 b) Hotel and restaurants 6.1 7.5 7.6 7.6 c) Transport, storage and communication
5.9 7.3 6.6 6.7
d) Financial Intermediations 5.5 9.3 11.0 9.0 e) Real estate, renting and business activities
3.6 3.8 4.1 4.1
f ) Public administration and defence
5.4 7.4 5.8 5.1
g) Education 6.4 8.5 7.2 9.7 h) Health and social works 4.4 7.5 7.9 7.5 i) Community, social and personal services
3.0 4.5 4.8 4.9
GDP (at FY 96 constant market prices)
5.0 6.2 6.2 6.0
Source: Bangladesh Bureau of Statistics/Ref: Bangladesh BankAnnual Report – 2012-2013 R=Revised, P=Provisional.
c) Savings & Investments:
Domestic savings and investments, both vitally important for the engine of economic growth show signs of improvement during FY-13 over FY-12, national savings increasing from 29.2% of GDP in FY-12 to 29.5% of GDP in FY-13 and fixed investment increasing from 26.5% of GDP in FY-12 to 26.8% of GDP in FY-13. The domestic savings investment gap as a percentage of GDP, correspondingly, increased from 7.2% in FY-12 to 7.5% in FY-13.
d) Inflation, Price etc. :
The average inflation rate, using the FY-06 new base, moderated to 6.8% at the end of FY-13 from 8.7 % at the end FY-12. Over this period, food and non-food inflation both decreased from 7.7% to 5.2 % and from 10.2 % to 9.2% respectively. The decrease in average inflation during FY-13 was driven mainly by a gradual fall of food inflation until January 2013 when food inflation bottomed out at 3.2 %. A steady decline in non-food inflation during the second half of FY-13 also contributed to fall in average inflation. Though average inflation went down, point-to-point inflation increased to 8.1% in FY-13 from 5.6% in FY-12.
e) Money and Credit Developments :
In FY13, Bangladesh Bank designed its monetary policy stance based on assessment of global and domestic macroeconomic conditions and outlook. BB continued restrained policy stance in H1 of FY13 to curb inflation. In H2 of FY13 repo and reverse repo rates were decreased from 7.75% and 5.75% in FY12 to 7.25% and 5.25% respectively in FY13. Liquidity Ratio (SLR) for Banks was retained at 6.0% and 19.0% respectively during FY13. The Broad money (M2) recorded a lower growth of 16.7% in FY13 against targeted growth of 17.7% and 17.4% of actual growth in FY12. Though the credit to the public sector increased by 11.1% in FY13, the credit for private sector had declined significantly from 19.7% in FY12 to 10.8% in FY13. The decline in the private sector lending by Banks was attributed to investment uncertainty ahead of general election and more stringent lending practices by Banks due to large loan scams and default culture.
f ) Public Finance:
The Budget for FY13 was formulated with objectives of continuity of pursuing monetary and fiscal policy strategies and ensuring macro-economic stability, assuring that the world economy would recover in FY13 from the economic recession that re-emerged especially in Europe in FY12. The GDP and Inflation growth target were set at 7.2% and 7.5% respectively. The total expenditures in the revised budget (FY13) fell short of the initial projection, while the total revenue remained the same. The budget deficit (excluding grants) as percentage of GDP was 4.8% which was lower than the target of 5.0%.
The revenue collection in the revised (FY13) budget increased by 21.8% over actual of FY12. However, the expenditure in FY13 was higher over actual FY12 By 15.2%. On the other hand although the ADP of Tk. 523.7 b in the revised FY 13 budget turned out 39.6% higher than actual FY12 ADP, it fell short of target by 4.8%. However, actual utilization of ADP reached an impressive level of 96.0% of revised allocation. A comparative position of the Budget for FYT12, FY13 and FY14 is given in the following Table at 1.3 :
REPO
RT
12 annual RepoRt 2013
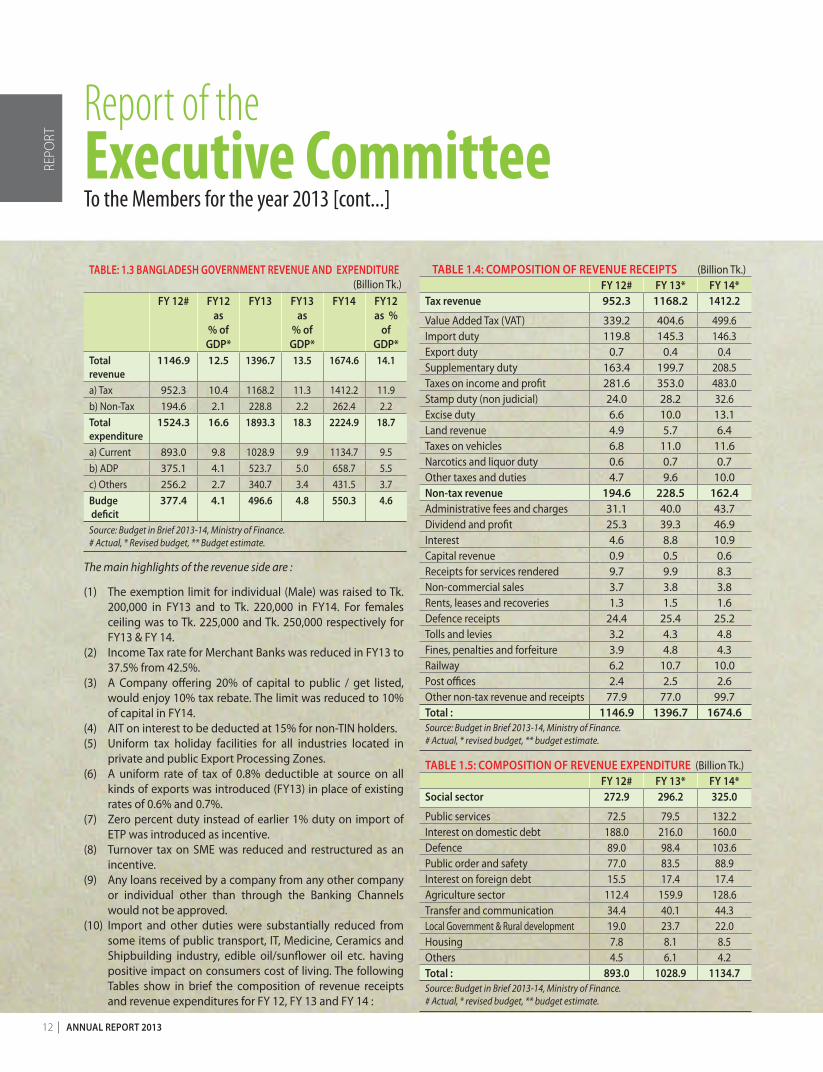
table: 1.3 bangladesh goVeRnment ReVenue and eXpendituRe(Billion Tk.)
fy 12# fy12 as
% of gdp*
fy13 fy13 as
% of gdp*
fy14 fy12 as %
of gdp*
totalrevenue
1146.9 12.5 1396.7 13.5 1674.6 14.1
a) Tax 952.3 10.4 1168.2 11.3 1412.2 11.9b) Non-Tax 194.6 2.1 228.8 2.2 262.4 2.2total expenditure
1524.3 16.6 1893.3 18.3 2224.9 18.7
a) Current 893.0 9.8 1028.9 9.9 1134.7 9.5b) ADP 375.1 4.1 523.7 5.0 658.7 5.5c) Others 256.2 2.7 340.7 3.4 431.5 3.7budge deficit
377.4 4.1 496.6 4.8 550.3 4.6
Source: Budget in Brief 2013-14, Ministry of Finance. # Actual, * Revised budget, ** Budget estimate.
The main highlights of the revenue side are :
(1) The exemption limit for individual (Male) was raised to Tk. 200,000 in FY13 and to Tk. 220,000 in FY14. For females ceiling was to Tk. 225,000 and Tk. 250,000 respectively for FY13 & FY 14.
(2) Income Tax rate for Merchant Banks was reduced in FY13 to 37.5% from 42.5%.
(3) A Company offering 20% of capital to public / get listed, would enjoy 10% tax rebate. The limit was reduced to 10% of capital in FY14.
(4) AIT on interest to be deducted at 15% for non-TIN holders.(5) Uniform tax holiday facilities for all industries located in
private and public Export Processing Zones.(6) A uniform rate of tax of 0.8% deductible at source on all
kinds of exports was introduced (FY13) in place of existing rates of 0.6% and 0.7%.
(7) Zero percent duty instead of earlier 1% duty on import of ETP was introduced as incentive.
(8) Turnover tax on SME was reduced and restructured as an incentive.
(9) Any loans received by a company from any other company or individual other than through the Banking Channels would not be approved.
(10) Import and other duties were substantially reduced from some items of public transport, IT, Medicine, Ceramics and Shipbuilding industry, edible oil/sunflower oil etc. having positive impact on consumers cost of living. The following Tables show in brief the composition of revenue receipts and revenue expenditures for FY 12, FY 13 and FY 14 :
table 1.4: composition of ReVenue Receipts (Billion Tk.)fy 12# fy 13* fy 14*
tax revenue 952.3 1168.2 1412.2
Value Added Tax (VAT) 339.2 404.6 499.6Import duty 119.8 145.3 146.3Export duty 0.7 0.4 0.4Supplementary duty 163.4 199.7 208.5Taxes on income and profit 281.6 353.0 483.0Stamp duty (non judicial) 24.0 28.2 32.6Excise duty 6.6 10.0 13.1Land revenue 4.9 5.7 6.4Taxes on vehicles 6.8 11.0 11.6Narcotics and liquor duty 0.6 0.7 0.7Other taxes and duties 4.7 9.6 10.0non-tax revenue 194.6 228.5 162.4Administrative fees and charges 31.1 40.0 43.7Dividend and profit 25.3 39.3 46.9Interest 4.6 8.8 10.9Capital revenue 0.9 0.5 0.6Receipts for services rendered 9.7 9.9 8.3Non-commercial sales 3.7 3.8 3.8Rents, leases and recoveries 1.3 1.5 1.6Defence receipts 24.4 25.4 25.2Tolls and levies 3.2 4.3 4.8Fines, penalties and forfeiture 3.9 4.8 4.3Railway 6.2 10.7 10.0Post offices 2.4 2.5 2.6Other non-tax revenue and receipts 77.9 77.0 99.7total : 1146.9 1396.7 1674.6Source: Budget in Brief 2013-14, Ministry of Finance.# Actual, * revised budget, ** budget estimate.
table 1.5: composition of ReVenue eXpendituRe (Billion Tk.)fy 12# fy 13* fy 14*
social sector 272.9 296.2 325.0
Public services 72.5 79.5 132.2Interest on domestic debt 188.0 216.0 160.0Defence 89.0 98.4 103.6Public order and safety 77.0 83.5 88.9Interest on foreign debt 15.5 17.4 17.4Agriculture sector 112.4 159.9 128.6Transfer and communication 34.4 40.1 44.3Local Government & Rural development 19.0 23.7 22.0Housing 7.8 8.1 8.5Others 4.5 6.1 4.2total : 893.0 1028.9 1134.7Source: Budget in Brief 2013-14, Ministry of Finance.# Actual, * revised budget, ** budget estimate.
REPO
RT
Report of theExecutive Committee To the Members for the year 2013 [cont...]
bangladesh association of publicly listed companies 13
(i) It may be noted that excluding grants the overall budget deficit to GDP ratio increased from 4.1 % in FY 12 to 4.8% in FY13. However, domestic financing of the deficit decreased to 3.1% of GDP to 3.1% of GDP in FY13 from 3.3% in FY12.
(ii) Revenue receipts in FY13 were 13.5% of GDP, its growth was 21.8% in FY13 compared to 23.3% in FY12.
(iii) Public expenditure in FY13 was 18.3% of GDP. In nominal terms it grew by 24.2% compared to 18.8% growth in FY12. Current expenditure in FY13 was 9.9% of GDP.
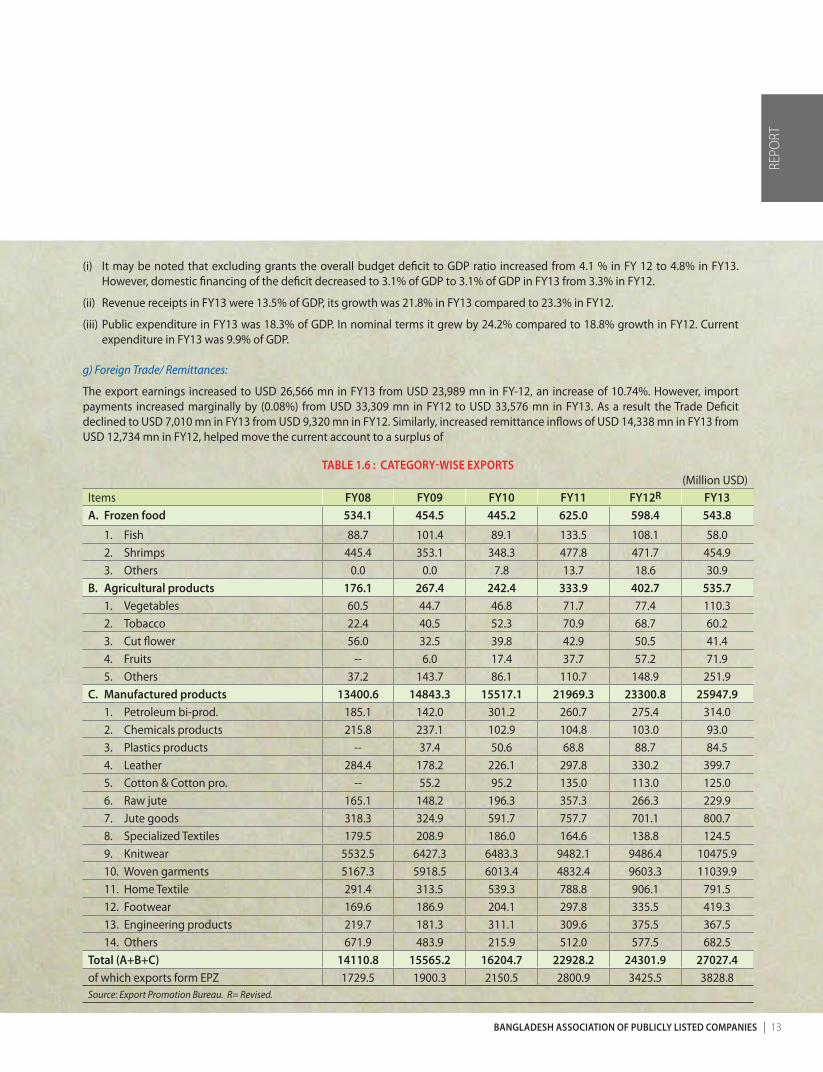
g) Foreign Trade/ Remittances:
The export earnings increased to USD 26,566 mn in FY13 from USD 23,989 mn in FY-12, an increase of 10.74%. However, import payments increased marginally by (0.08%) from USD 33,309 mn in FY12 to USD 33,576 mn in FY13. As a result the Trade Deficit declined to USD 7,010 mn in FY13 from USD 9,320 mn in FY12. Similarly, increased remittance inflows of USD 14,338 mn in FY13 from USD 12,734 mn in FY12, helped move the current account to a surplus of
table 1.6 : categoRy-Wise eXpoRts(Million USD)
Items fy08 fy09 fy10 fy11 fy12R fy13a. frozen food 534.1 454.5 445.2 625.0 598.4 543.8
1. Fish 88.7 101.4 89.1 133.5 108.1 58.0 2. Shrimps 445.4 353.1 348.3 477.8 471.7 454.9 3. Others 0.0 0.0 7.8 13.7 18.6 30.9b. agricultural products 176.1 267.4 242.4 333.9 402.7 535.7 1. Vegetables 60.5 44.7 46.8 71.7 77.4 110.3 2. Tobacco 22.4 40.5 52.3 70.9 68.7 60.2 3. Cut flower 56.0 32.5 39.8 42.9 50.5 41.4 4. Fruits -- 6.0 17.4 37.7 57.2 71.9 5. Others 37.2 143.7 86.1 110.7 148.9 251.9c. manufactured products 13400.6 14843.3 15517.1 21969.3 23300.8 25947.9 1. Petroleum bi-prod. 185.1 142.0 301.2 260.7 275.4 314.0 2. Chemicals products 215.8 237.1 102.9 104.8 103.0 93.0 3. Plastics products -- 37.4 50.6 68.8 88.7 84.5 4. Leather 284.4 178.2 226.1 297.8 330.2 399.7 5. Cotton & Cotton pro. -- 55.2 95.2 135.0 113.0 125.0 6. Raw jute 165.1 148.2 196.3 357.3 266.3 229.9 7. Jute goods 318.3 324.9 591.7 757.7 701.1 800.7 8. Specialized Textiles 179.5 208.9 186.0 164.6 138.8 124.5 9. Knitwear 5532.5 6427.3 6483.3 9482.1 9486.4 10475.9 10. Woven garments 5167.3 5918.5 6013.4 4832.4 9603.3 11039.9 11. Home Textile 291.4 313.5 539.3 788.8 906.1 791.5 12. Footwear 169.6 186.9 204.1 297.8 335.5 419.3 13. Engineering products 219.7 181.3 311.1 309.6 375.5 367.5 14. Others 671.9 483.9 215.9 512.0 577.5 682.5total (a+b+c) 14110.8 15565.2 16204.7 22928.2 24301.9 27027.4of which exports form EPZ 1729.5 1900.3 2150.5 2800.9 3425.5 3828.8Source: Export Promotion Bureau. R= Revised.
REPO
RT

14 annual RepoRt 2013
table 1.7 : categoRy-Wise impoRts(Million USD)
items fy08 fy09 fy10 fy11 fy12R fy13
a. food grain 534.1 454.5 445.2 625.0 598.4 543.8
1. Rice 88.7 101.4 89.1 133.5 108.1 58.0
2. Wheat 445.4 353.1 348.3 477.8 471.7 454.9
b. other commodities 0.0 0.0 7.8 13.7 18.6 30.9
1. Milk & cream 176.1 267.4 242.4 333.9 402.7 535.7
2. Spices 60.5 44.7 46.8 71.7 77.4 110.3
3. Oil seeds 22.4 40.5 52.3 70.9 68.7 60.2
4. Edible oil 56.0 32.5 39.8 42.9 50.5 41.4
5. Pulses (all sorts) -- 6.0 17.4 37.7 57.2 71.9
6. Sugar 37.2 143.7 86.1 110.7 148.9 251.9
7. Clinker 13400.6 14843.3 15517.1 21969.3 23300.8 25947.9
8. Crude petroleum 185.1 142.0 301.2 260.7 275.4 314.0
9. POL 215.8 237.1 102.9 104.8 103.0 93.0
10. Chemicals -- 37.4 50.6 68.8 88.7 84.5
11. Pharmaceuticals Products 284.4 178.2 226.1 297.8 330.2 399.7
12. Fertilizer -- 55.2 95.2 135.0 113.0 125.0
13. Dyeing & tanning materials 165.1 148.2 196.3 357.3 266.3 229.9
14. Plastic rubber & articles thereof 318.3 324.9 591.7 757.7 701.1 800.7
15. Raw cotton 179.5 208.9 186.0 164.6 138.8 124.5
16. Yarn 5532.5 6427.3 6483.3 9482.1 9486.4 10475.9
17. Textile & Articles thereof 5167.3 5918.5 6013.4 4832.4 9603.3 11039.9
18. Staple fibre 291.4 313.5 539.3 788.8 906.1 791.5
19. Iron, Steel & other base metal 169.6 186.9 204.1 297.8 335.5 419.3
20. Chemical machinery 219.7 181.3 311.1 309.6 375.5 367.5
21. Others 671.9 483.9 215.9 512.0 577.5 682.5
c. imports by epZ 14110.8 15565.2 16204.7 22928.2 24301.9 27027.4Total imports (c.i.f) 21629 22507 23738 33657 35516 34084
total imports (f.o.b) 19481 20291 21388 32527 33309 33576Source: Statistics Department, Bangladesh Bank. R=Revised.
REPO
RT
Report of theExecutive Committee To the Members for the year 2013 [cont...]

bangladesh association of publicly listed companies 15
table 1.8 : countRy-Wise WoRKeRs Remittance (Million USD)
countries fy07 fy08 fy09 fy10 fy11 fy12 fy13
Saudi Arabia 1735.0 2324.2 2859.1 3427.0 3290.0 3684.4 3829.5
UAE 804.8 1135.1 1754.9 1890.3 2002.6 2404.8 2829.4
UK 886.9 896.1 789.7 827.5 889.6 987.5 991.6
Kuwait 680.7 863.7 970.8 1019.2 1075.8 1190.1 1186.9
USA 930.3 1380.1 1575.2 1451.9 1848.5 1498.5 1859.8
Italy 149.6 214.5 186.9 182.2 215.6 244.8 233.2
Qatar 233.2 289.8 343.4 360.9 319.4 335.3 286.9
Oman 196.5 220.6 290.1 349.1 334.3 400.9 610.1
Singapore 80.2 130.1 165.1 193.5 202.3 311.5 498.8
Germany 14.9 26.9 19.3 16.5 25.6 35.0 25.8
Bahrain 80.0 138.2 157.4 170.1 185.9 298.5 361.7
Japan 10.2 16.3 14.1 14.7 15.2 22.2 21.2
Malaysia 11.8 92.4 282.2 587.1 703.7 847.5 997.4
Others countries 164.4 186.8 281.1 497.4 541.8 582.7 728.9
total 5978.5 7914.8 9689.3 10987.4 11650.3 12843.4 14461.2Source: Foreign Exchange Policy Department, Bangladesh Bank.
table 1.9 : gRoss foReign eXchange ReseRVes of the bangladesh banK (end month, million USD)
months fy09 fy10 fy11 fy12 fy13
July 5820 7741 10749 10381 10750
August 5966 9156 10992 10914 11435
September 5863 9363 10834 9884 11252
October 5551 9545 11160 10338 12340
November 5245 10336 10700 9285 11754
December 5788 10345 11174 9635 12751
January 5577 10098 10382 9386 13077
February 5872 10555 11159 10067 13848
March 5953 10142 10731 9579 13971
April 6509 10602 11316 10193 14829
May 6563 10146 10431 9520 14531
June 7471 10750 10912 10364 15315Source: Foreign Exchange Policy Department, Bangladesh Bank.
REPO
RT

16 annual RepoRt 2013
table 1.10 : teRms of tRade of bangladesh(Base:FY96=100)
year export price index import price index commodity terms of trade
FY 00 120.3 136.2 88.4
FY 01 123.2 146.4 84.1
FY 02 126.2 157.8 80.0
FY 03 135.2 164.2 82.4
FY 04 139.6 170.0 82.1
FY 05 142.4 176.7 80.6
FY 06 149.3 183.1 81.5
FY 07 165.7 232.5 71.3
FY 08 171.3 241.2 71.0
FY 09 178.2 248.3 71.8
FY 10 188.9 262.4 72.0
FY 11 208.5 294.6 70.8
FY 12 225.6 321.0 70.3
FY 13 242.9 345.6 70.3Source: Bangladesh Bureau of Statistics. * estimated.
The above statistics reveal an impressive growth of exports by 91.54% in 6 (six) years, while imports (c.i.f ) increased by 57.58% over the same period. The Worker’s Remittances increased at a rate of 141.97% over the previous 6 (six) years to FY13. These outstanding performances in foreign trade/services had an impressive effect on foreign Exchange Reserves (which increased by 163.14%) and term of Trade which also improved in favour of Bangladesh from 88.4 in FY-00 to 70.3 in FY 13. It may be mentioned that by end March 2014, the Foreign Exchange Reserves had exceeded 19 million marks.
h) Foreign Exchange Operation:
In order to protect the interest of exporters and remitting workers, Bangladesh Bank adopts a policy of exchanges rate stabilization process buying and selling foreign currencies. As a result Taka appreciated by 5.2% in FY13 as against a depreciation of 10.0% in FY12. The weighted average inter-bank rate stood at Tk. 77.8 per USD as of 30 June 2013 against 81.8 as 30 June 2012. While Bangladesh Bank purchased USD 4,539 mn, the volume of inter-bank foreign exchange transaction in FY13 stood at USD 18,579.8 mn (in spot, forward & swap transactions) as against USD 29,606.6 mn in FY12.
i) Financial Sector Issues:
In the light of the global economic slowdown, the financial sector of the country has been closely monitored to maintain macro-economic stability which remained sound and resilient throughout 2013 though it had to address a number of serious issues related to financial sector fraud and corruption. Several measures have been introduced by the Central Bank as both preventive as well as corrective action which has started showing signs of positive results in the financial stability of the country.
The impressive GDP growth rate of over 6 percent over the previous 4 years despite global crises and the proactive policies of the advanced countries are expected to act as a further strengthening of our economic performance during FY-13 onward enabling achievement of a growth rate of 8-10 percent following the regional giants namely China and India. However, the main hurdles, namely power/gas shortages, roads & ports, law & order and the classical political crises would have to be resolved simultaneously for increased investments, production, exports, remittances, employment etc that are essential elements of progress and prosperity .
REPO
RT
Report of theExecutive Committee To the Members for the year 2013 [cont...]
bangladesh association of publicly listed companies 17
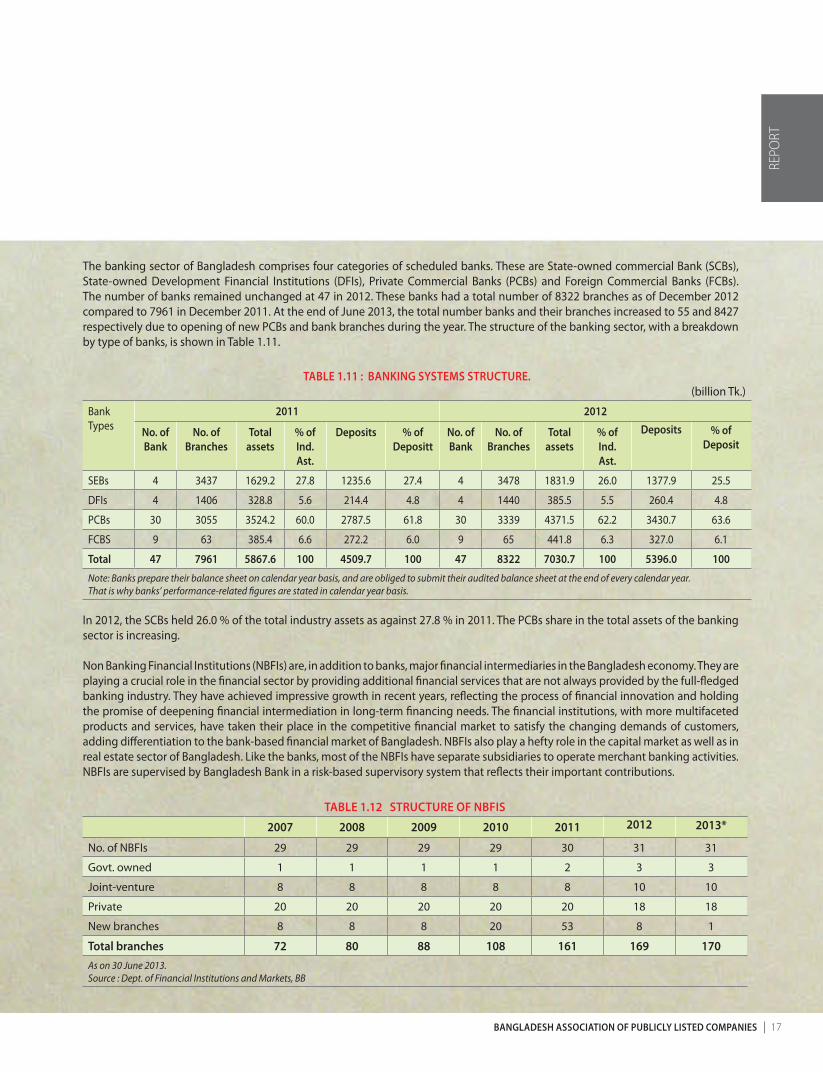
The banking sector of Bangladesh comprises four categories of scheduled banks. These are State-owned commercial Bank (SCBs), State-owned Development Financial Institutions (DFIs), Private Commercial Banks (PCBs) and Foreign Commercial Banks (FCBs). The number of banks remained unchanged at 47 in 2012. These banks had a total number of 8322 branches as of December 2012 compared to 7961 in December 2011. At the end of June 2013, the total number banks and their branches increased to 55 and 8427 respectively due to opening of new PCBs and bank branches during the year. The structure of the banking sector, with a breakdown by type of banks, is shown in Table 1.11.
table 1.11 : banKing systems stRuctuRe.(billion Tk.)
BankTypes
2011 2012
no. of bank
no. of branches
total assets
% of ind. ast.
deposits % of depositt
no. of bank
no. of branches
total assets
% of ind. ast.
deposits % of deposit
SEBs 4 3437 1629.2 27.8 1235.6 27.4 4 3478 1831.9 26.0 1377.9 25.5
DFIs 4 1406 328.8 5.6 214.4 4.8 4 1440 385.5 5.5 260.4 4.8
PCBs 30 3055 3524.2 60.0 2787.5 61.8 30 3339 4371.5 62.2 3430.7 63.6
FCBS 9 63 385.4 6.6 272.2 6.0 9 65 441.8 6.3 327.0 6.1
total 47 7961 5867.6 100 4509.7 100 47 8322 7030.7 100 5396.0 100
Note: Banks prepare their balance sheet on calendar year basis, and are obliged to submit their audited balance sheet at the end of every calendar year.That is why banks’ performance-related figures are stated in calendar year basis.
In 2012, the SCBs held 26.0 % of the total industry assets as against 27.8 % in 2011. The PCBs share in the total assets of the banking sector is increasing.
Non Banking Financial Institutions (NBFIs) are, in addition to banks, major financial intermediaries in the Bangladesh economy. They are playing a crucial role in the financial sector by providing additional financial services that are not always provided by the full-fledged banking industry. They have achieved impressive growth in recent years, reflecting the process of financial innovation and holding the promise of deepening financial intermediation in long-term financing needs. The financial institutions, with more multifaceted products and services, have taken their place in the competitive financial market to satisfy the changing demands of customers, adding differentiation to the bank-based financial market of Bangladesh. NBFIs also play a hefty role in the capital market as well as in real estate sector of Bangladesh. Like the banks, most of the NBFIs have separate subsidiaries to operate merchant banking activities. NBFIs are supervised by Bangladesh Bank in a risk-based supervisory system that reflects their important contributions.
table 1.12 stRuctuRe of nbfis
2007 2008 2009 2010 2011 2012 2013*
No. of NBFIs 29 29 29 29 30 31 31
Govt. owned 1 1 1 1 2 3 3
Joint-venture 8 8 8 8 8 10 10
Private 20 20 20 20 20 18 18
New branches 8 8 8 20 53 8 1
total branches 72 80 88 108 161 169 170As on 30 June 2013.Source : Dept. of Financial Institutions and Markets, BB
REPO
RT
18 annual RepoRt 2013
CAPITAL MARKET SITUATION:
(I) Issues Involved :
The conceptual aspects and outlines of the development of capital market were briefly described in our previous year’s report wherein the thematic issues relating to “market-mechanism” and use of “non-market” weapons were highlighted without any ambiguity. The basic features and the operational policy characteristics, however, remain unchanged as a “Controlled”, “Regulated” or “Manipulated” market threatening the re-appearance of the chaotic and mayhem situation again. As in the past, the issuers, investors, intermediaries, financiers, facilitators, regulators and the Government do not seem to be understanding each other as no one would like to play the game based on the rules of market mechanism.
Capital market, which is sine-quo-non to economic / industrial development, is in a weak, uncertain and unstable position to offer adequate scope for raising capital, primarily equity capital by the industrial / business entrepreneurs on synthesized road to development due to frequent changes in a non-market-oriented mechanism. The BSEC regulations relating to minimum number of Directors of 5(five) persons, shareholding of minimum 2% by a Director, Discriminatory rule of IPO size of 30% for locally owned companies and 10% for foreign-owned companies, Independent Directors and their specific qualifications (academic/experience), limited tenure, approval process of Prospectus and determination of IPO share-prices are creating obstacles to the new issuers, thus limiting the supply of investible securities. On the other hand, inadequate or absence of adequate experience of investors, both individual as well as institutional, in stock-analysis, dominance of dishonest/ speculative intermediaries, regulators and sometimes, issuers, create un-natural growth or fall out in may a case. Government’s decision to create fund for compensating the so-called “small-investors” (no definition exits) with tax-money is luring. Controlling and regulating of lending operations of FIs/NBFIs/Merchant Banks by BSEC and changing of the margin rules disrupt the demand phenomenon of the investors who then find reasons to blame them and demand compensation. The terms of lending / borrowing should have been better designed by the lenders/ borrowers on a market-mechanism concept.
It is disheartening to observe that BSEC had been mingling with price-determination for IPO at different times though “open-secret” mechanism resulting in a fewer issues and shortage of investible securities and abnormally higher times of over-subscriptions. The numbers of IPO during the past years have averaged only a mere 15 or 16, a very poor performance which The BSEC/GOB should attempt to reverse for rapid industrial development and creating depth in the Capital Market. The IPO pricing should be left to the issuers and the underwriters who are licensed by BSEC. Similarly, in case of Right Issue also, as per decision of the Board of Directors as provided for in the companies Act 1994, the quantum and price should be allowed to be decided by the Issuer and the Underwriters. BSEC regulation for taking approval of shareholders is unjustified, as, if a shareholder is unable or unwilling to exercise his “Right” he may choose to “Sell” his “Right” taking the premium, if any.
Like Proprietorship or Partnership, the Private limited companies raise capital from their own sources. They cannot sell shares to outsiders unless all existing shareholders agree. As such there is no element of “exchange” in the shareholding of a Private limited company. As such share issues, initial or subsequent, including Right or Bonus should not come under the purview of BSEC. The present practice by BSEC of regulating issue of capital for the Private limited companies is not only creating un-necessary burden for them (though offers scope of income for them), it is disrupting the operations of the Private Sector whose growth is largely attributed to the mechanism of Private Limited Companies. It is therefore felt that the capital issues by the Private limited companies should be exempted, as was in the past, if needed by enacting laws, from the jurisdiction of Securities and Exchange Ordinance 1969 and empowerment of BSEC vide section 2CC under it. There is a well-known saying that “it is not the business of the Government to run business”. However, almost every Government in the World had to undertake some kinds of business, especially industrial ventures, in consideration of social interest. Running of such a business, though in public interest, is run at public expense. Investment in such socially needed ventures survives on subsidy or other reliefs or monopolistic advantages of the Government. Some of the ventures, designed on corporate character though, operate on “profit” earned not on commercial risks but on protected price mechanism, are considered to be offered to public and get listed with stock exchange for increasing supply of shares as demanded by certain vested interest groups to have a cooling effect on rising price trend. We feel that the GOB should instead consider redesigning of BSEC. Regulations to encourage entrepreneurs who run and operate Private limited companies to go public as well as bring out “Green Field” companies for raising capital for investment. This process is expected to strengthen the engine of economic and industrial growth for creating new dimension in the Capital Market.
REPO
RT
Report of theExecutive Committee To the Members for the year 2013 [cont...]
bangladesh association of publicly listed companies 19
STOCK MARKET – A REVIEW:
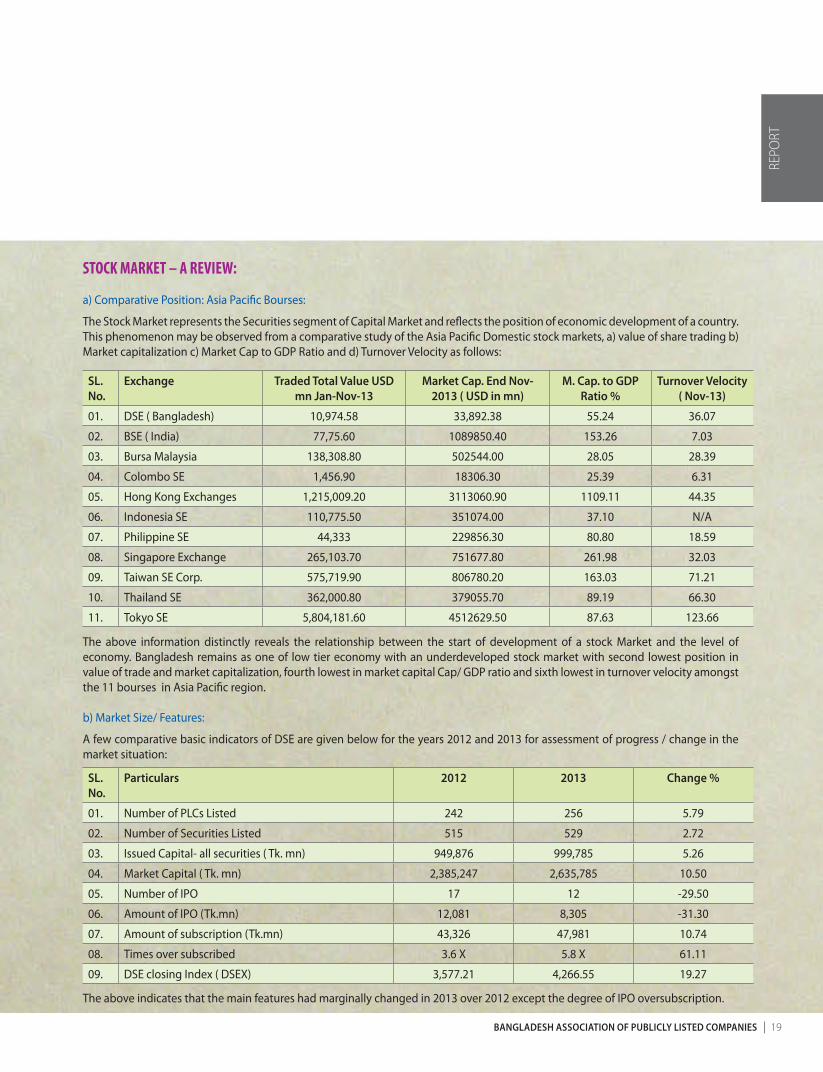
a) Comparative Position: Asia Pacific Bourses:
The Stock Market represents the Securities segment of Capital Market and reflects the position of economic development of a country. This phenomenon may be observed from a comparative study of the Asia Pacific Domestic stock markets, a) value of share trading b) Market capitalization c) Market Cap to GDP Ratio and d) Turnover Velocity as follows:
sl. no.
exchange traded total Value usd mn Jan-nov-13
market cap. end nov-2013 ( usd in mn)
m. cap. to gdp Ratio %
turnover Velocity ( nov-13)
01. DSE ( Bangladesh) 10,974.58 33,892.38 55.24 36.07
02. BSE ( India) 77,75.60 1089850.40 153.26 7.03
03. Bursa Malaysia 138,308.80 502544.00 28.05 28.39
04. Colombo SE 1,456.90 18306.30 25.39 6.31
05. Hong Kong Exchanges 1,215,009.20 3113060.90 1109.11 44.35
06. Indonesia SE 110,775.50 351074.00 37.10 N/A
07. Philippine SE 44,333 229856.30 80.80 18.59
08. Singapore Exchange 265,103.70 751677.80 261.98 32.03
09. Taiwan SE Corp. 575,719.90 806780.20 163.03 71.21
10. Thailand SE 362,000.80 379055.70 89.19 66.30
11. Tokyo SE 5,804,181.60 4512629.50 87.63 123.66
The above information distinctly reveals the relationship between the start of development of a stock Market and the level of economy. Bangladesh remains as one of low tier economy with an underdeveloped stock market with second lowest position in value of trade and market capitalization, fourth lowest in market capital Cap/ GDP ratio and sixth lowest in turnover velocity amongst the 11 bourses in Asia Pacific region.
b) Market Size/ Features:
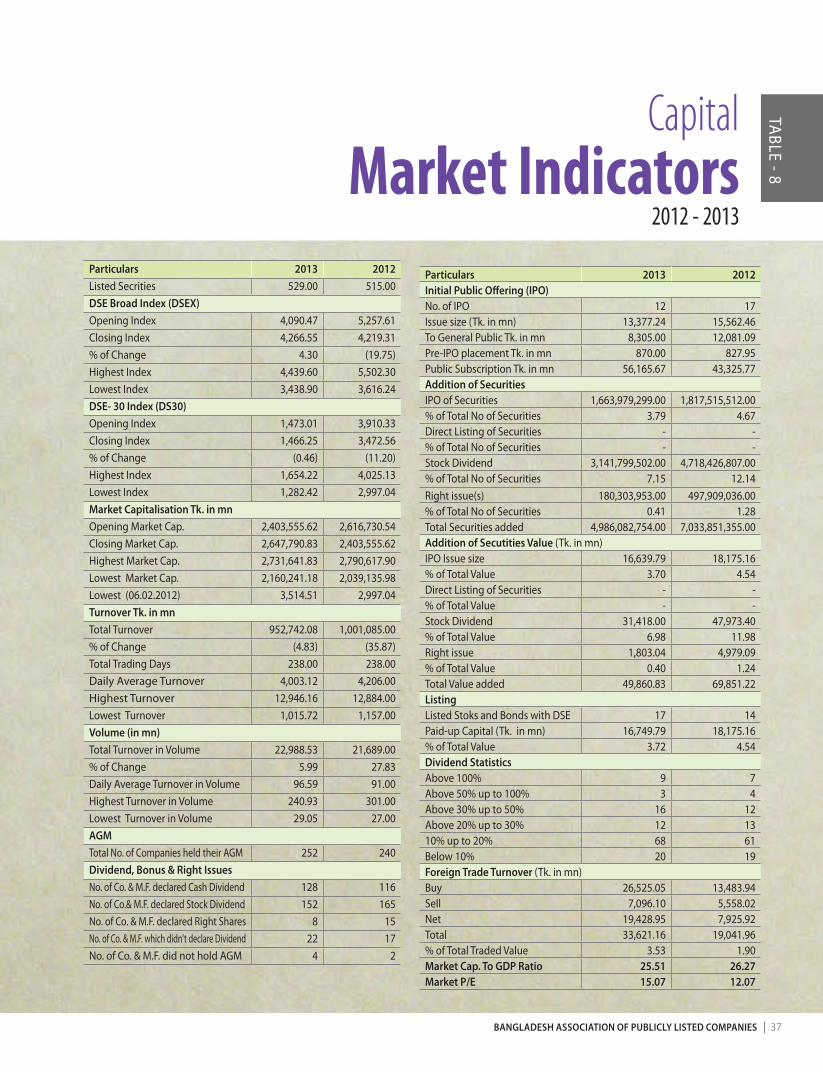
A few comparative basic indicators of DSE are given below for the years 2012 and 2013 for assessment of progress / change in the market situation:
sl. no.
particulars 2012 2013 change %
01. Number of PLCs Listed 242 256 5.79
02. Number of Securities Listed 515 529 2.72
03. Issued Capital- all securities ( Tk. mn) 949,876 999,785 5.26
04. Market Capital ( Tk. mn) 2,385,247 2,635,785 10.50
05. Number of IPO 17 12 -29.50
06. Amount of IPO (Tk.mn) 12,081 8,305 -31.30
07. Amount of subscription (Tk.mn) 43,326 47,981 10.74
08. Times over subscribed 3.6 X 5.8 X 61.11
09. DSE closing Index ( DSEX) 3,577.21 4,266.55 19.27
The above indicates that the main features had marginally changed in 2013 over 2012 except the degree of IPO oversubscription.
REPO
RT

20 annual RepoRt 2013
c) Sectoral comparative performance :
A sectoral comparative performance on DSE (CSE) during 2012 and 2013 are analyzed below:
sector /sub-sector
2012 2013
no.of lstd sec
puc mc to peR peRRange
no.of lstd sec
puc mc to peR peRRange
financial sector
Banks 30 181 490 157 8.68 (2.8)-16.1 30 196 424 79 10.01 (3.8)-41.7
Financial Institute 22 27 154 81 15.19 (60.8)-182 23 33 154 47 19.50 11.5-248.9
Insurance 45 14 48 63 22.25 10.8-139.3 46 17 211 51 18.53 12.9-36.3
Mutual Fund 41 37 40 33 12.42 (15.3)-43.3 41 41 35 40 8.99 (356)-81.1
manufacturing
Engineering 23 11 76 86 19.08 (17.7)-121.4 26 17 115 83 23.71 (66.4)-106.3
Foods 16 3 65 20 20.99 (158.2)-64.2 17 4 127 42 27.15 (393.6)-532.1
Jute 3 0.06 0.44 0.05 23.62 (1.4)-31.5 3 .06 .56 8 47.44 (59)-47.4
Textile 28 19 66 95 17.50 (72.7)-262.2 31 22 90 152 17.97 (5.7)-134.2
Pharma & Chemicals 20 15 150 76 18.67 (5.5)-59.5 24 21 229 97 22.45 (29.6)-334.9
Paper & Printing 1 0.19 .36 0.06 29.85 29.8 1 .19 .69 .01 71.9 71.1
Cement 6 15 74 44 21.81 (13.3)-35.5 7 16 93 39 19.42 6.6-27.9
Tannery 5 0.59 11 4 11.74 (146.5)-17.2 5 .6 17 10 15.97 14.1-96.9
Ceramics 5 5 22 16 20.62 15.8-38.4 5 6 22 7 28.36 26.8-85.8
miscellaneous & service
Fuel & Power 14 31 218 150 11.44 1.2-57.0 15 36 256 141 11.90 8.0-69.8
Service & Real Estate 4 3 9 8 18.28 15.4-22.6 3 3 10 7 22.77 17.3-38.0
IT 6 2 5 15 22.92 14.1-31.3 6 2 5 15 23.18 17.2-69.3
Telecommunication 2 15 254 54 12.91 12.5-23.1 2 15 296 58 16.13 25.5-28.9
Travel & Leisure 3 9 48 58 25.36 2.6-31.8 3 9 33 53 17.82 2.8-19.4
Miscellaneous 9 6 48 39 5.8 3.9-139.3 9 7 46 30 17.17 9.7-249.9
total: 283 394 1828 1001 12.07 - 297 444 2079 953 15.7
PUC/MC Ratio 4.6 x 4.7 x
PUC/TO Ratio 2.5 x 2.1 x
PUC = Paid Up Capital, MC= Market Capitalization, TO= Turn Over.
The above companies / Securities in 19 sub-sec tors of which 10 in 2012 and 7 in 2013 show a range of PER with negative digits. While PUC/MC ratio has increased from 4.6 times in 2012 to 4.7 times in 2013, the PUC/TO ratio has declined from 2.5 times in 2012 to 2.1 time in 2013.
REPO
RT
Report of theExecutive Committee To the Members for the year 2013 [cont...]

bangladesh association of publicly listed companies 21
d) Sectoral Private Structure:
The variation in sectoral price structure as reflected by PER is highly confusing and misleading as the factors for a rational investment decision by an investor or pricing of issues of shares by an issuer remain largely dependent on individual personal preferences or prejudices. This may be observed from an examination of the PER movements in various sub-sectors since 2010 year-ends as given below:
Sectoral P/E
sector p/e as in dec.13 p/e as in dec.12 p/e as in dec.11 p/e as in dec.10
Bank 10.01 8.68 10.50 25.24
Financial Institutions 19.50 15.19 12.15 47.27
Mutual Funds 8.99 12.42 6.24 17.53
Engineering 23.71 19.08 26.40 50.10
Food & Allied 27.95 20.99 16.41 27.30
Fuel & Power 11.90 11.44 13.95 21.57
Jute 47.44 23.62 32.64 55.66
Textile 17.97 17.50 22.66 52.44
Pharmaceuticals 22.48 18.67 22.52 34.12
Paper & Printing 71.91 29.85 42.23 126.93
Service & Real estate 22.77 18.28 25.82 43.93
Cement 19.42 21.81 21.60 33.44
IT 23.18 22.92 38.93 64.91
Tannery 15.97 11.74 15.60 20.66
Ceramic 28.36 20.62 30.20 106.86
Insurance 18.53 22.25 20.37 64.64
Telecommunication 16.13 12.91 20.62 20.35
Travel and Leisure 17.02 25.36 23.07 65.45
Miscellaneous 17.17 5.84 8.02 19.54
market p/e 15.07 12.07 13.68 29.16
highest 71.91 29.85 42.23 126.93
lowest 8.99 5.84 6.24 17.53
The above reveals how widely the PER has varied since 2010 to end of 2013. The range of variation between the sub-sectors and during the last 4 years presents an irrational character of the market. The reasons are perhaps the wild speculative operations of vested interest groups and scam makers for which the regulators are required to be more vigilant.
e) Market Dominance:
The market dominance, as measured by turnover (value) and market capitalization (DSE based) as detailed below, reflects a shift in 2013 over 2012 in favour of Manufacturing Sector from that of Financial Sector:
REPO
RT

22 annual RepoRt 2013
sector% of total
market cap ( 2011)
% of total market cap
( 2011)
% of total market cap
( 2011)
% of total market cap
( 2011
% of total market cap
( 2011)
peRdec-12
peRdec-13
financial sector
Banks 32.30 26.72 20.34 15.67 8.34 8.68 10.01
Financial Institutions 9.26 8.40 7.60 8.13 4.95 15.19 19.50
Insurance 5.40 5.35 5.79 6.33 5.40 22.25 18.53
Mutual Funds 1.61 2.16 1.70 3.30 4.09 12.42 8.99
total 48.57 42.63 35.42 33.43 22.78
manufacturing
Foods 2.74 3.54 6.10 8.60 8.67 20.99 27.95
Pharmaceuticals 8.26 8.16 10.97 2.09 4.39 18.67 22.48
Textile 2.74 3.59 4.34 0.05 0.09 17.50 17.97
Engineering 4.96 4.17 5.53 9.56 15.96 10.08 23.71
Ceramics 1.41 1.19 1.05 7.55 10.14 20.62 28.36
Tannery 0.67 0.62 0.80 0.01 0.01 11.74 15.97
Paper & Printing 0.04 0.02 0.03 4.43 4.07 29.85 71.91
Jute 0.04 0.02 0.03 0.39 1.00 23.62 47.44
Cement 3.40 4.01 4.45 1.61 0.75 21.81 19.42
total 24.25 25.33 33.27 34.29 45.08
service & misc.
Fuel & Power 11.61 11.87 12.26 14.95 14.85 11.44 11.90
Service & Real-estate 0.71 0.49 0.47 0.82 0.77 18.28 22.77
IT 0.20 0.26 0.26 1.48 1.57 22.97 23.18
Telecommunication 10.74 13.82 14.21 5.36 6.06 12.91 16.13
Travel & Leisure 0.54 2.63 1.58 5.75 5.58 25.36 17.02
Miscellaneous 3.05 2.60 2.22 3.86 3.18 5.84 17.17
total 26.84 31.67 31.00 32.22 32.01
bond
Govt. T-Bond 21.09 23.03 26.34 0.05 0.03 - -
Corporate Bond 0.34 0.38 0.31 - - - -
total 21.42 23.41 26.64 0.05 0.03 - -
grand total 100.00 100.00
From the above it transpires, that the share of Market Capitalization ( MC) has varied due to variation in the rise or fall in the stock prices of different sub-sectors / securities , addition/ deletion in listing , additional capital by Right / Bonus issues etc. As regards changes in the share of Turnover, it is largely due to differential increase / decrease in the relative PER . This is especially true in case of Banks and Financial Institutions sub-sectors which show a declining share of Turnover in 2013 over 2012 due to increase in their PERs.
REPO
RT
Report of theExecutive Committee To the Members for the year 2013 [cont...]

bangladesh association of publicly listed companies 23
In case of MF, the relative share in Turnover has increased in 2013 over 2012 due to a fall in PER in 2013 over 2012. However, insurance sub-sector indicates a fall in Turnover in 2013 over 2012 despite fall in PER in 2013 over 2012. In the case of manufacturing sector, the market phenomenon seems to be in different direction. Though PER has increased in 2013 over 2012 in 8 (Eight) sub- sectors out of 9 ( Nine) the total share of Turnover ( of 9 sub-sectors) has rather increased from 34.29% in 2012 to 45.08% in 2013. On the cement sub-sector appears to have followed result of market mechanism with a fall in Turnover in 2013 over 2012 based on decline in its PER in 2013 over 2012. In the service and miscellaneous sectors, the PER has increased in 2013 over 2012, for 5 ( Five ) sub-sector out of 6 ( Six) , without any significant fall in the share of Turnover in 2013 over 2012.
f ) Contrasting Character:
The market offers a contrasting character with regard to performance of individual companies as would be found from the following two tables:
20 Companies by highest P/E December 2013.
sl. no. name of the securities category p/e eps (tK.) dividend (%)
cash / stock
01. CVO Petrochemical Ref. Z 1,161.03 0.53 1B:10
02. Fine Foods B 532.12 0.04 1B:50
03. Beacon Pharmaceuticals Z 333.94 0.04 -
04. Usmania Glass A 281.17 0.50 1B: 5
05. Savar Refractories Z 249.90 0.23 -
06. MIDAS Financing Z 248.92 0.16 -
07. BSC A 233.40 1.77 10
08. Miracle Industries B 215.50 0.09 1B:20
09. JMI Syringes & Medical Devices A 185.13 1.12 12%
10. Maksons Spinning Mills B 134.20 0.15 1B:20
11. Rahima Food Z 131.37 0.52 10%
12. Pharma Aids A 113.68 1.39 15X
13. Bangladesh Industrial Fin.Co. B 113.08 0.15 1B:20
14. Bangas A 112.65 4.24 7B:10
15. National Tubes A 106.31 0.67 10%
16. Premier Leasing & Fin. Z 98.61 0.10 -
17. Samata Leather Complex Z 96.85 0.22 -
18. Libra Infusions A 96.17 4.21 20%
19. Monno Ciramic B 95.79 0.35 5%
20. Deshbandhu Polymer B 90.51 0.25 1B:20
REPO
RT
24 annual RepoRt 2013
sl. no. name of the securities category p/e eps (tK.) dividend (%) cash/ stock
01. ICB 2nd NRB M.F A 3.85 2.49 23.00
02. 8th ICB M.F A 4.18 12.47 110.00
03. 6th ICB M.F A 4.78 10.99 105.00
04. 2nd ICB M.F A 5.82 44.10 375.00
05. ICB 1st NRB M.F A 6.26 4.06 37.00
06. Standard Bank A 6.34 2.33 1.7B: 10
07. 7th ICB M.F A 6.36 13.53 120
08. Social Islami Bank A 6.38 2.08 5, 1B: 10
09. Shahjalal Islami Bank A 6.43 2.61 1B:5
10. 4th ICB M.F A 6.50 29.24 240
11. Jamuna Bank A 6.59 2.47 140
12. Reliance One Mutual Fund A 6.68 1.29 3.50
13. One Bank Limited A 6.73 2.35 5, 1.5B:10
14. 5th ICB M.F A 6.80 23.45 200.00
15. NCCBL A 6.91 1.90 1B:10
16. First Bangladesh Fixed in .F A 7.16 1.30 1.2B:10(RIU)
17. Export Import ( EXIM) Bank A 7.16 1.80 1B:10
18. 3rd ICB M.F A 7.28 26.16 240.00
19. EBL NRB Mutual Fund A 7.29 1.07 1B:10(RIU)
20. Eastern Bank A 7.43 3.91 20.00
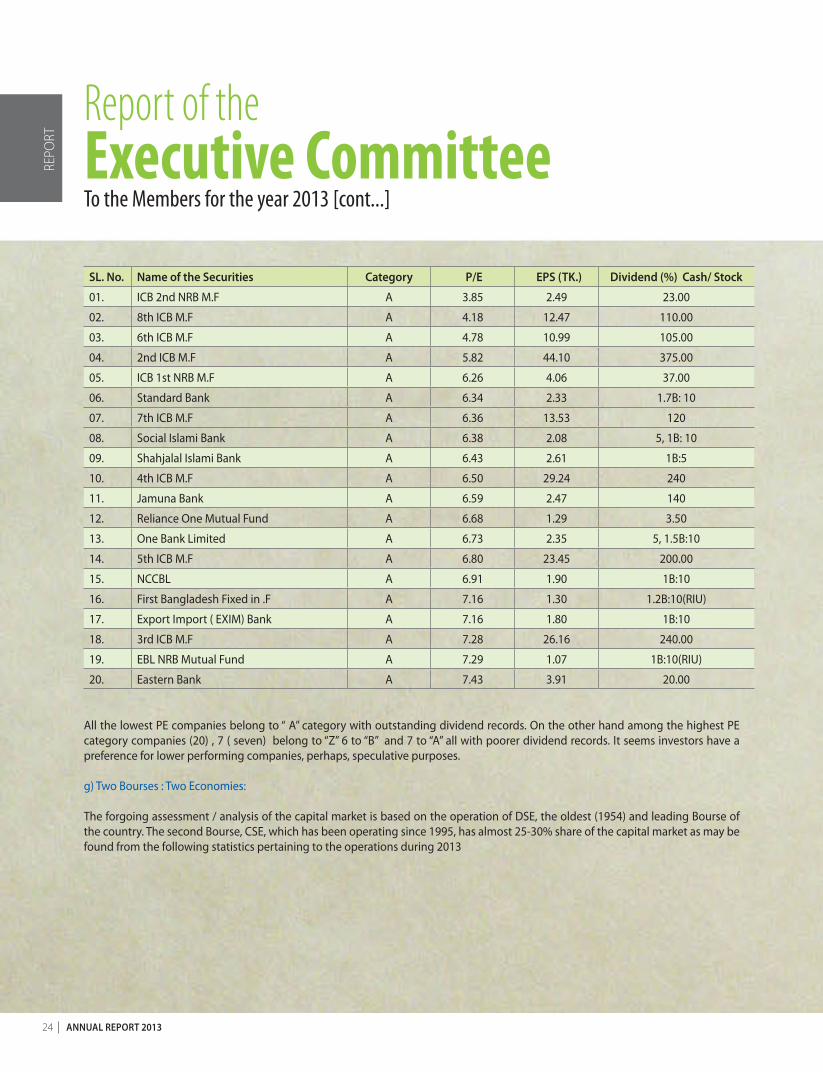
All the lowest PE companies belong to “ A” category with outstanding dividend records. On the other hand among the highest PE category companies (20) , 7 ( seven) belong to “Z” 6 to “B” and 7 to “A” all with poorer dividend records. It seems investors have a preference for lower performing companies, perhaps, speculative purposes.
g) Two Bourses : Two Economies:
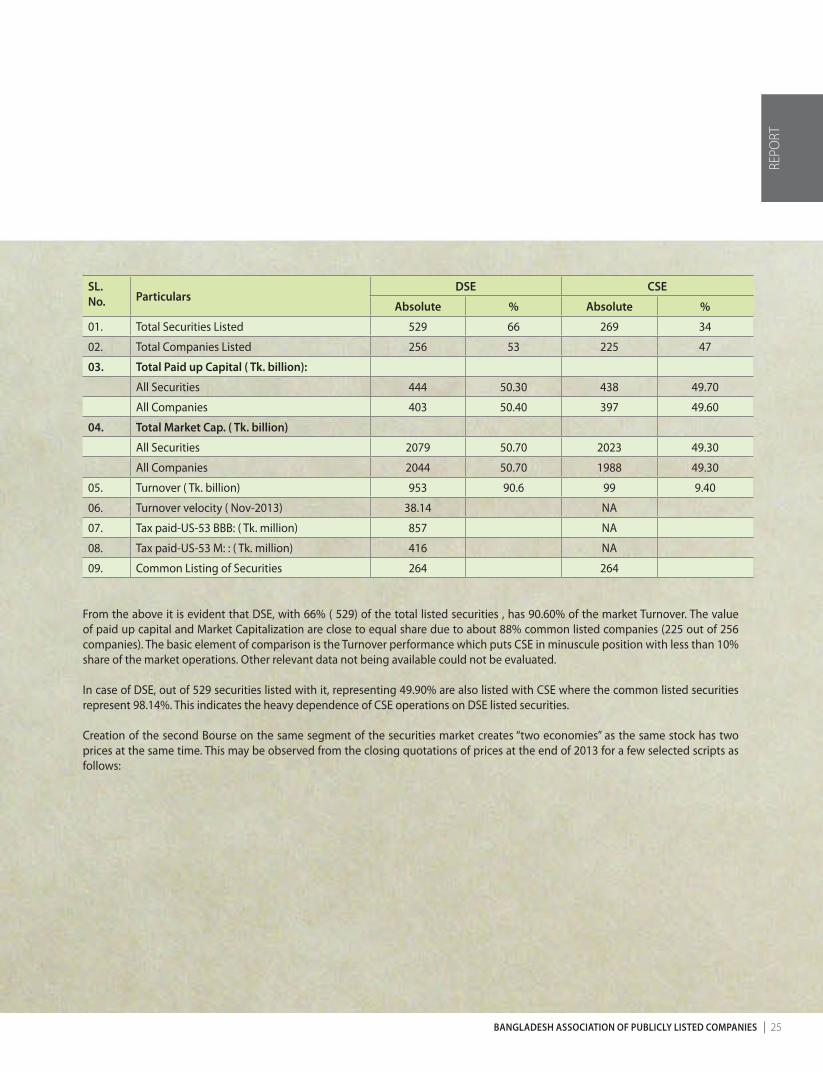
The forgoing assessment / analysis of the capital market is based on the operation of DSE, the oldest (1954) and leading Bourse of the country. The second Bourse, CSE, which has been operating since 1995, has almost 25-30% share of the capital market as may be found from the following statistics pertaining to the operations during 2013
REPO
RT
Report of theExecutive Committee To the Members for the year 2013 [cont...]
bangladesh association of publicly listed companies 25
sl. no. particulars
dse cse
absolute % absolute %
01. Total Securities Listed 529 66 269 34
02. Total Companies Listed 256 53 225 47
03. total paid up capital ( tk. billion):
All Securities 444 50.30 438 49.70
All Companies 403 50.40 397 49.60
04. total market cap. ( tk. billion)
All Securities 2079 50.70 2023 49.30
All Companies 2044 50.70 1988 49.30
05. Turnover ( Tk. billion) 953 90.6 99 9.40
06. Turnover velocity ( Nov-2013) 38.14 NA
07. Tax paid-US-53 BBB: ( Tk. million) 857 NA
08. Tax paid-US-53 M: : ( Tk. million) 416 NA
09. Common Listing of Securities 264 264
From the above it is evident that DSE, with 66% ( 529) of the total listed securities , has 90.60% of the market Turnover. The value of paid up capital and Market Capitalization are close to equal share due to about 88% common listed companies (225 out of 256 companies). The basic element of comparison is the Turnover performance which puts CSE in minuscule position with less than 10% share of the market operations. Other relevant data not being available could not be evaluated.
In case of DSE, out of 529 securities listed with it, representing 49.90% are also listed with CSE where the common listed securities represent 98.14%. This indicates the heavy dependence of CSE operations on DSE listed securities.
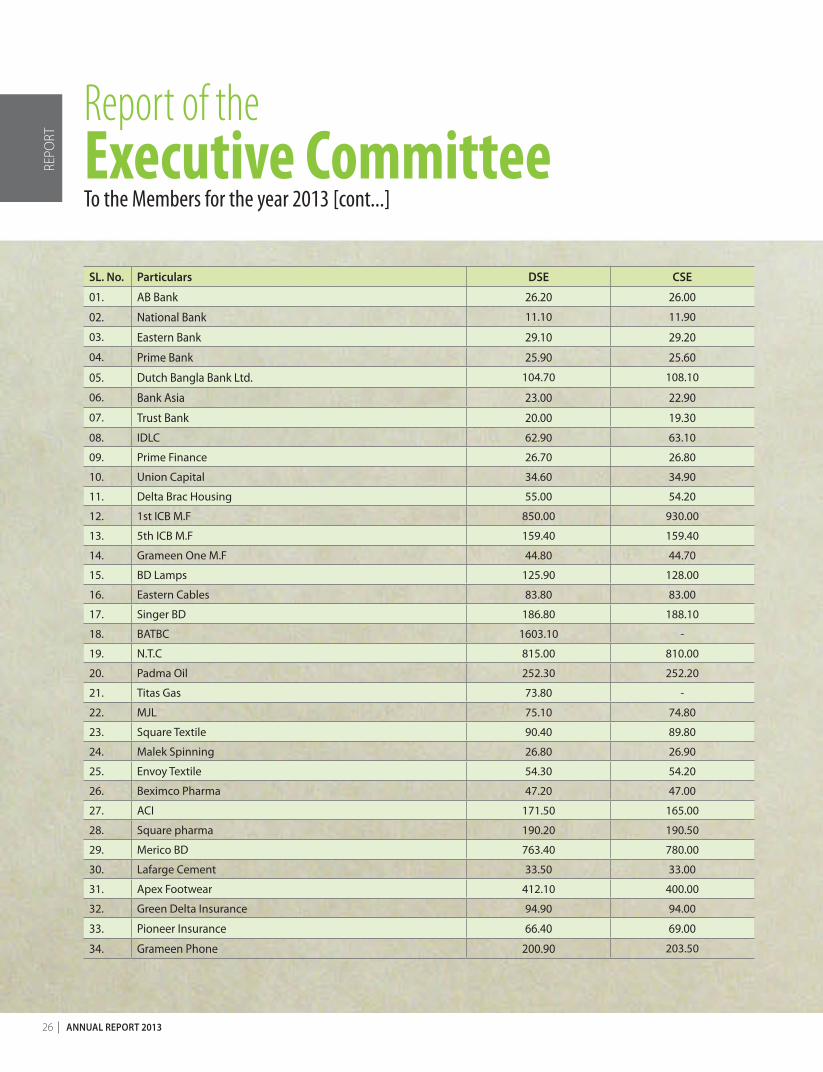
Creation of the second Bourse on the same segment of the securities market creates “two economies” as the same stock has two prices at the same time. This may be observed from the closing quotations of prices at the end of 2013 for a few selected scripts as follows:
REPO
RT
26 annual RepoRt 2013
sl. no. particulars dse cse
01. AB Bank 26.20 26.00
02. National Bank 11.10 11.90
03. Eastern Bank 29.10 29.20
04. Prime Bank 25.90 25.60
05. Dutch Bangla Bank Ltd. 104.70 108.10
06. Bank Asia 23.00 22.90
07. Trust Bank 20.00 19.30
08. IDLC 62.90 63.10
09. Prime Finance 26.70 26.80
10. Union Capital 34.60 34.90
11. Delta Brac Housing 55.00 54.20
12. 1st ICB M.F 850.00 930.00
13. 5th ICB M.F 159.40 159.40
14. Grameen One M.F 44.80 44.70
15. BD Lamps 125.90 128.00
16. Eastern Cables 83.80 83.00
17. Singer BD 186.80 188.10
18. BATBC 1603.10 -
19. N.T.C 815.00 810.00
20. Padma Oil 252.30 252.20
21. Titas Gas 73.80 -
22. MJL 75.10 74.80
23. Square Textile 90.40 89.80
24. Malek Spinning 26.80 26.90
25. Envoy Textile 54.30 54.20
26. Beximco Pharma 47.20 47.00
27. ACI 171.50 165.00
28. Square pharma 190.20 190.50
29. Merico BD 763.40 780.00
30. Lafarge Cement 33.50 33.00
31. Apex Footwear 412.10 400.00
32. Green Delta Insurance 94.90 94.00
33. Pioneer Insurance 66.40 69.00
34. Grameen Phone 200.90 203.50
REPO
RT
Report of theExecutive Committee To the Members for the year 2013 [cont...]
bangladesh association of publicly listed companies 27
Duplication of listing causes not only price dilemma for sellers /buyers, it increases cost to issuers in various forms. It may be suggested that companies with larger Paid-up Capital may be listed with DSE while companies with lower paid-up Capital may be listed with CSE as is in practice in many countries.
h) CDBL Membership:
As on 31st December 2013, listed securities in the Central Depository System (CDS) of Central Depository Bangladesh Ltd. (CDBL) were 312 consisting of 3 corporate bonds, 41 mutual funds and 268 publicly listed company shares. Number of demated securities in the CDS was 41,211.92 million out of total number of 43,918.79 million (source: DSE monthly Review) listed securities issued. CDBL as on 31st December 2013 had 2,795,970 operable BO Accounts and 2,519,699 closed BO Accounts as against 2,475,594 operable BO Accounts and 2,293,292 closed BO Accounts in the previous year as on 31st December 2012. Activities of the Association:
During the year under review, the activities of the Association generally covered the following:
a) The membership drive continued with greater intensity which helped increase the membership from 200 at the year end 2012 to 210 at year end 2013.
b) The Executive Committee led 01 Delegations during 2013 to BSEC to discussed possibility of Annual Report on Website in replace of traditional method of printing form.
FINANCIAL POSITION:
(i) Income:
The total accrued income of the Association for the year amounted to Tk. 5,728,101 and the total outstanding receivable income at the beginning of the year was Tk. 2,217,875 and during the year Tk. 5,522,500 out of which the total receipts amounted to Tk. 4,789,492 during the year 2013 Taka 33,008 was adjustment against advanced Annual Subscription leaving an outstanding of Tk. 2,917,875 at close of the year.
(ii) Expenditure:
The total expenditure for the year amounted to Tk. 3,210,337
(iii) Fund balance:
The year end fund balance was Tk. 9,665,990 as against Tk. 7,146,651 for the year 2012.
(iv) Amount receivable:
Tk. 2,917,875 was receivable from the members as on 31st December 2013 as against Tk. 2,217,875 of 2012. The audited Statement of Financial Position as at 31st December 2013 as compared with that of 2012 along with comparative income and expenditure statement for the year are enclosed.
REPO
RT
28 annual RepoRt 2013
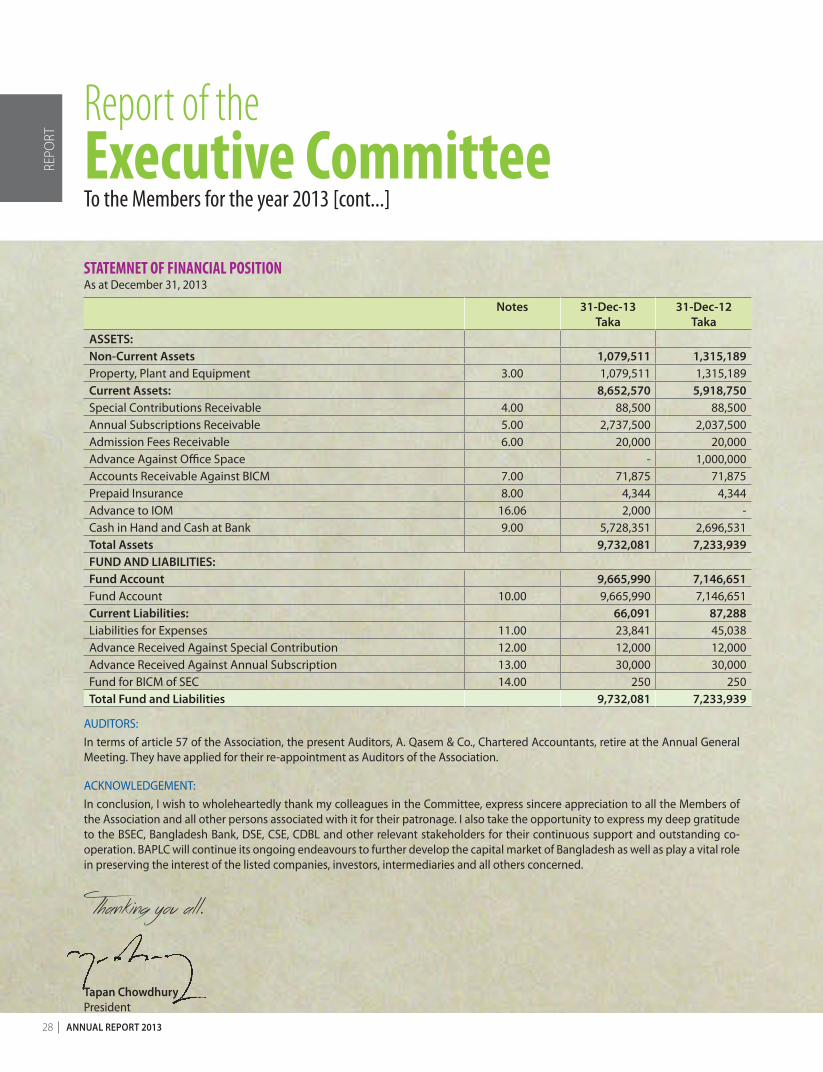
STATEMNET OF FINANCIAL POSITIONAs at December 31, 2013
notes 31-dec-13taka
31-dec-12taka
assets:non-current assets 1,079,511 1,315,189Property, Plant and Equipment 3.00 1,079,511 1,315,189current assets: 8,652,570 5,918,750Special Contributions Receivable 4.00 88,500 88,500Annual Subscriptions Receivable 5.00 2,737,500 2,037,500Admission Fees Receivable 6.00 20,000 20,000Advance Against Office Space - 1,000,000Accounts Receivable Against BICM 7.00 71,875 71,875Prepaid Insurance 8.00 4,344 4,344Advance to IOM 16.06 2,000 -Cash in Hand and Cash at Bank 9.00 5,728,351 2,696,531total assets 9,732,081 7,233,939fund and liabilities:fund account 9,665,990 7,146,651Fund Account 10.00 9,665,990 7,146,651current liabilities: 66,091 87,288Liabilities for Expenses 11.00 23,841 45,038Advance Received Against Special Contribution 12.00 12,000 12,000Advance Received Against Annual Subscription 13.00 30,000 30,000Fund for BICM of SEC 14.00 250 250total fund and liabilities 9,732,081 7,233,939
AUDITORS:In terms of article 57 of the Association, the present Auditors, A. Qasem & Co., Chartered Accountants, retire at the Annual General Meeting. They have applied for their re-appointment as Auditors of the Association.
ACKNOWLEDGEMENT:In conclusion, I wish to wholeheartedly thank my colleagues in the Committee, express sincere appreciation to all the Members of the Association and all other persons associated with it for their patronage. I also take the opportunity to express my deep gratitude to the BSEC, Bangladesh Bank, DSE, CSE, CDBL and other relevant stakeholders for their continuous support and outstanding co-operation. BAPLC will continue its ongoing endeavours to further develop the capital market of Bangladesh as well as play a vital role in preserving the interest of the listed companies, investors, intermediaries and all others concerned.
Thanking you all.
tapan chowdhuryPresident
REPO
RT
Report of theExecutive Committee To the Members for the year 2013 [cont...]

bangladesh association of publicly listed companies 29
01. Initial Public Offerings (IPOs) in 2012 .......................................................................................................... 30
02. Newly Listed Securities-2013 ......................................................................................................................... 31
03. Sector-wise Turnover Performance .............................................................................................................. 32
04. Price Movement Pattern: Indices .................................................................................................................. 33
05. Market Capitalisation ........................................................................................................................................ 34
06. Sector-wise Market Category of PLCs ......................................................................................................... 35
07. Sector-wise PLC AGMs held & Dividend Declared .................................................................................. 36
08. Capital Market Indicators ................................................................................................................................. 37
09. Top 20 Companies in terms of DSE Turnover ........................................................................................... 38
10. Monthly Average Index & Market Capital Status .................................................................................... 39
11. Sectoral Position of PLC Membership ......................................................................................................... 40
12. Business Growth of DSE ................................................................................................................................... 41
13. Securities Turnover............................................................................................................................................. 42
14. Capital Raised through Right Issue-2013 ................................................................................................... 43
15. Individual Market Cap. on 31.12.2013 ......................................................................................................... 44
Table ofInformation / Statistics
INFO
RMAT
ION/
STAT
ISTIC
S

30 annual RepoRt 2013
InitialPublic Offerings(IPOs of Listed Companies) in 2012
name of the issuessubscription issued cap
tk. in mnsponsors tk. in mn
public offertk. in mn
public subs
tk. mn
public subs. over/
underopening closing
Orion Pharmaceuticals Ltd. 06.01.13 10.01.13 1,950.00 1,550.00 2,400.00 128.84 (2,271.16)
Bengal Windsor Thermoplastics 27.01.13 31.01.13 700.00 220.00 400.00 4,827.28 4,427.28
Familytex (Bangladesh) Ltd. 07.04.13 11.04.13 1,390.62 1,050.62 340.00 5,796.91 5,456.91
ICB Sonali Bank 1st M. F. 21.04.13 25.04.13 1,000.00 250.00 500.00 20.07 (479.93)
Exim Bank 1st M. F. 28.04.13 05.05.13 1,000.00 200.00 500.00 5.76 (494.24)
Central Pharmaceuticals 26.05.13 30.05.13 620.00 480.00 140.00 6,065.85 5,925.85
Fareast Finance & Investment 14.07.13 18.07.13 1,600.62 1,150.62 450.00 7,450.32 7,000.32
Bangladesh Building Systems 21.07.13 25.07.13 640.00 500.00 140.00 6,292.88 6,152.88
Paramount Textile Ltd. 01.09.13 05.09.13 851.25 551.25 840.00 7,855.47 7,015.47
Appollo Ispat Complex 06.10.13 10.10.13 2,500.00 1,500.00 2,200.00 2,803.17 603.17
Mozaffar Hossain Spinning Mills 03.11.13 07.11.13 624.75 349.75 275.00 6,734.15 6,459.15
AFC Agro Biotech 08.12.13 12.12.13 500.00 380.00 120.00 - (120.00)
Total - - 13,377.24 8,182.24 8,305.00 47,980.70 39,675.70
TABL
E - 1
bangladesh association of publicly listed companies 31
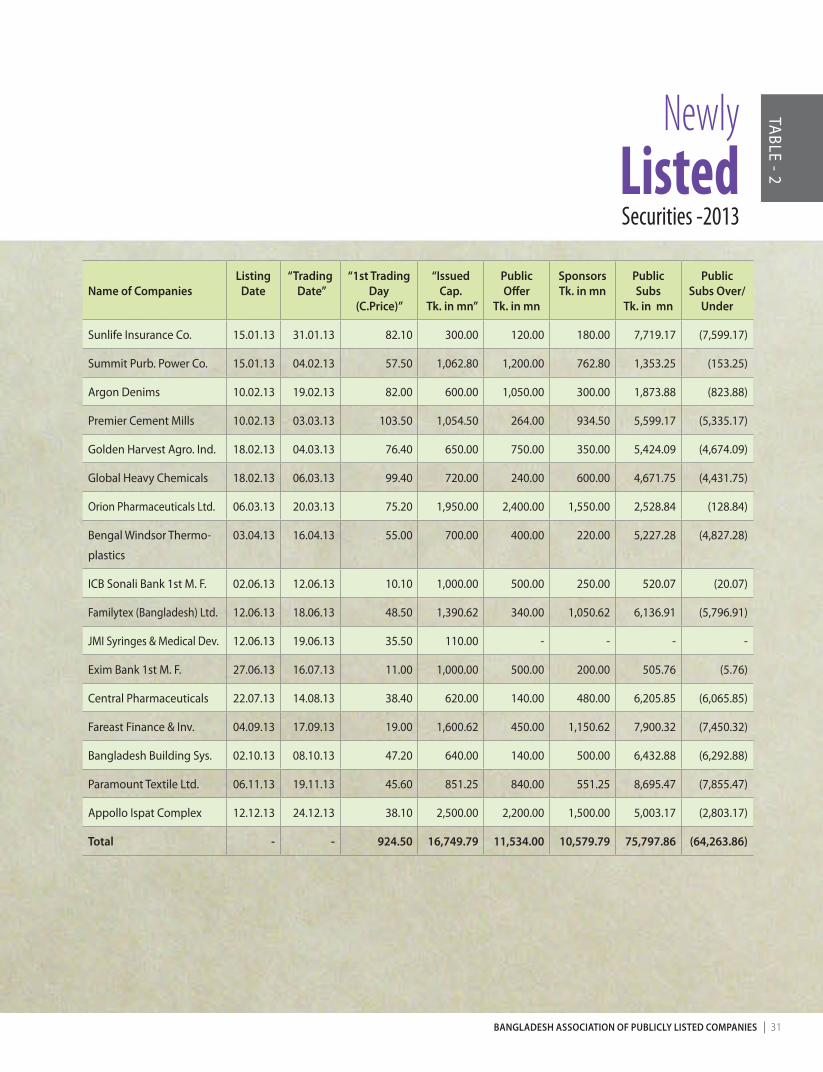
NewlyListedSecurities -2013
name of companieslisting
date“trading
date”“1st trading
day (c.price)”
“issued cap.
tk. in mn”
public offer
tk. in mn
sponsors tk. in mn
public subs
tk. in mn
public subs over/
under
Sunlife Insurance Co. 15.01.13 31.01.13 82.10 300.00 120.00 180.00 7,719.17 (7,599.17)
Summit Purb. Power Co. 15.01.13 04.02.13 57.50 1,062.80 1,200.00 762.80 1,353.25 (153.25)
Argon Denims 10.02.13 19.02.13 82.00 600.00 1,050.00 300.00 1,873.88 (823.88)
Premier Cement Mills 10.02.13 03.03.13 103.50 1,054.50 264.00 934.50 5,599.17 (5,335.17)
Golden Harvest Agro. Ind. 18.02.13 04.03.13 76.40 650.00 750.00 350.00 5,424.09 (4,674.09)
Global Heavy Chemicals 18.02.13 06.03.13 99.40 720.00 240.00 600.00 4,671.75 (4,431.75)
Orion Pharmaceuticals Ltd. 06.03.13 20.03.13 75.20 1,950.00 2,400.00 1,550.00 2,528.84 (128.84)
Bengal Windsor Thermo-
plastics
03.04.13 16.04.13 55.00 700.00 400.00 220.00 5,227.28 (4,827.28)
ICB Sonali Bank 1st M. F. 02.06.13 12.06.13 10.10 1,000.00 500.00 250.00 520.07 (20.07)
Familytex (Bangladesh) Ltd. 12.06.13 18.06.13 48.50 1,390.62 340.00 1,050.62 6,136.91 (5,796.91)
JMI Syringes & Medical Dev. 12.06.13 19.06.13 35.50 110.00 - - - -
Exim Bank 1st M. F. 27.06.13 16.07.13 11.00 1,000.00 500.00 200.00 505.76 (5.76)
Central Pharmaceuticals 22.07.13 14.08.13 38.40 620.00 140.00 480.00 6,205.85 (6,065.85)
Fareast Finance & Inv. 04.09.13 17.09.13 19.00 1,600.62 450.00 1,150.62 7,900.32 (7,450.32)
Bangladesh Building Sys. 02.10.13 08.10.13 47.20 640.00 140.00 500.00 6,432.88 (6,292.88)
Paramount Textile Ltd. 06.11.13 19.11.13 45.60 851.25 840.00 551.25 8,695.47 (7,855.47)
Appollo Ispat Complex 12.12.13 24.12.13 38.10 2,500.00 2,200.00 1,500.00 5,003.17 (2,803.17)
total - - 924.50 16,749.79 11,534.00 10,579.79 75,797.86 (64,263.86)
TABLE - 2
32 annual RepoRt 2013
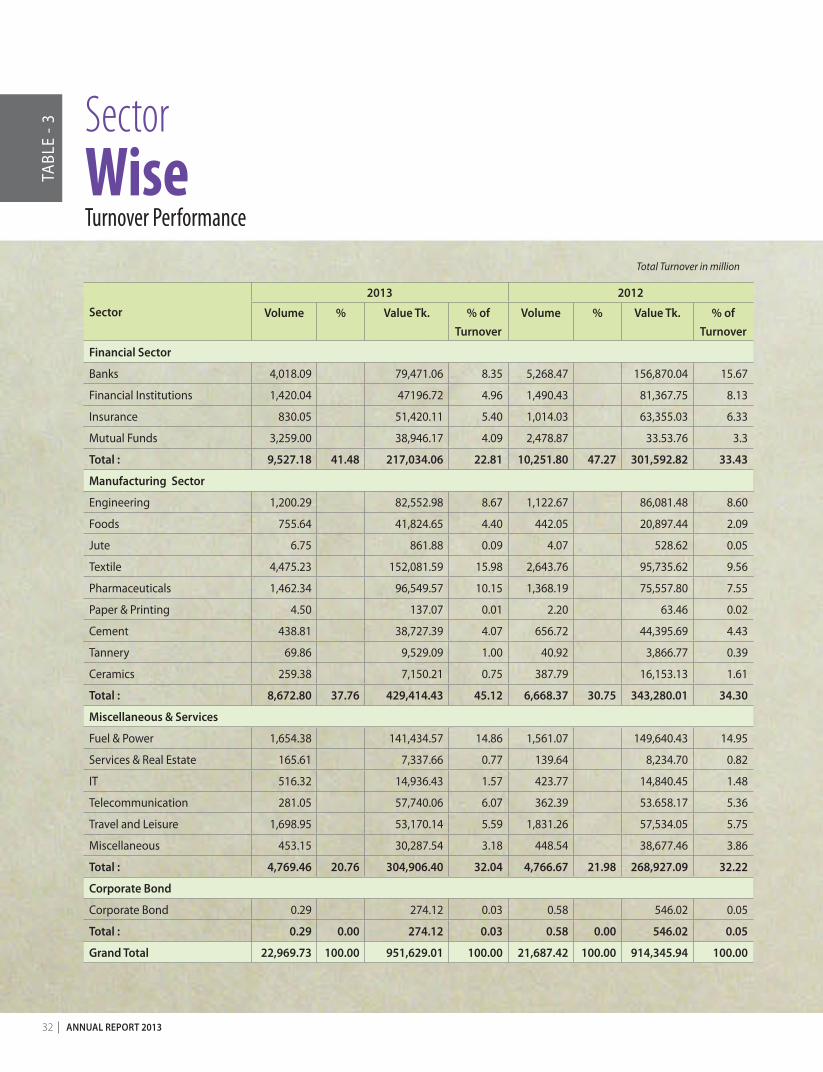
SectorWiseTurnover Performance
Total Turnover in million
sector
2013 2012
Volume % Value tk. % of turnover
Volume % Value tk. % of turnover
financial sector
Banks 4,018.09 79,471.06 8.35 5,268.47 156,870.04 15.67
Financial Institutions 1,420.04 47196.72 4.96 1,490.43 81,367.75 8.13
Insurance 830.05 51,420.11 5.40 1,014.03 63,355.03 6.33
Mutual Funds 3,259.00 38,946.17 4.09 2,478.87 33.53.76 3.3
total : 9,527.18 41.48 217,034.06 22.81 10,251.80 47.27 301,592.82 33.43
manufacturing sector
Engineering 1,200.29 82,552.98 8.67 1,122.67 86,081.48 8.60
Foods 755.64 41,824.65 4.40 442.05 20,897.44 2.09
Jute 6.75 861.88 0.09 4.07 528.62 0.05
Textile 4,475.23 152,081.59 15.98 2,643.76 95,735.62 9.56
Pharmaceuticals 1,462.34 96,549.57 10.15 1,368.19 75,557.80 7.55
Paper & Printing 4.50 137.07 0.01 2.20 63.46 0.02
Cement 438.81 38,727.39 4.07 656.72 44,395.69 4.43
Tannery 69.86 9,529.09 1.00 40.92 3,866.77 0.39
Ceramics 259.38 7,150.21 0.75 387.79 16,153.13 1.61
total : 8,672.80 37.76 429,414.43 45.12 6,668.37 30.75 343,280.01 34.30
miscellaneous & services
Fuel & Power 1,654.38 141,434.57 14.86 1,561.07 149,640.43 14.95
Services & Real Estate 165.61 7,337.66 0.77 139.64 8,234.70 0.82
IT 516.32 14,936.43 1.57 423.77 14,840.45 1.48
Telecommunication 281.05 57,740.06 6.07 362.39 53.658.17 5.36
Travel and Leisure 1,698.95 53,170.14 5.59 1,831.26 57,534.05 5.75
Miscellaneous 453.15 30,287.54 3.18 448.54 38,677.46 3.86
total : 4,769.46 20.76 304,906.40 32.04 4,766.67 21.98 268,927.09 32.22
corporate bond
Corporate Bond 0.29 274.12 0.03 0.58 546.02 0.05
total : 0.29 0.00 274.12 0.03 0.58 0.00 546.02 0.05
grand total 22,969.73 100.00 951,629.01 100.00 21,687.42 100.00 914,345.94 100.00
TABL
E - 3
bangladesh association of publicly listed companies 33
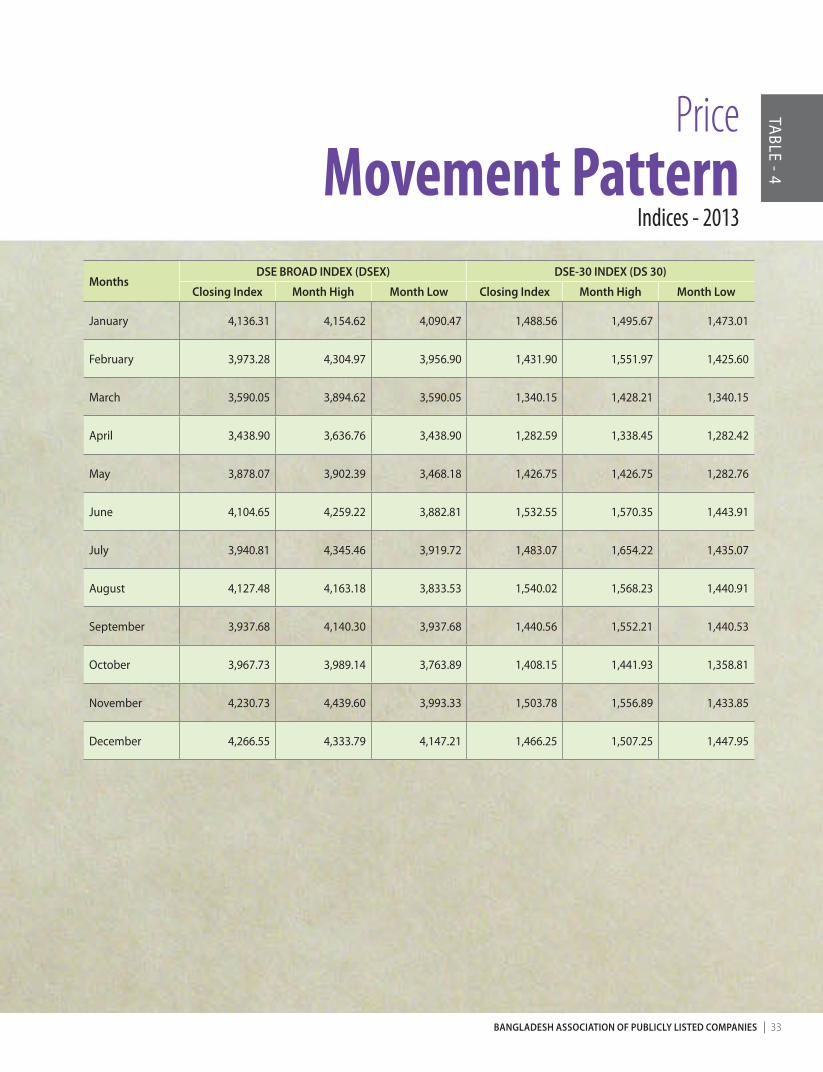
monthsdse bRoad indeX (dseX) dse-30 indeX (ds 30)
closing index month high month low closing index month high month low
January 4,136.31 4,154.62 4,090.47 1,488.56 1,495.67 1,473.01
February 3,973.28 4,304.97 3,956.90 1,431.90 1,551.97 1,425.60
March 3,590.05 3,894.62 3,590.05 1,340.15 1,428.21 1,340.15
April 3,438.90 3,636.76 3,438.90 1,282.59 1,338.45 1,282.42
May 3,878.07 3,902.39 3,468.18 1,426.75 1,426.75 1,282.76
June 4,104.65 4,259.22 3,882.81 1,532.55 1,570.35 1,443.91
July 3,940.81 4,345.46 3,919.72 1,483.07 1,654.22 1,435.07
August 4,127.48 4,163.18 3,833.53 1,540.02 1,568.23 1,440.91
September 3,937.68 4,140.30 3,937.68 1,440.56 1,552.21 1,440.53
October 3,967.73 3,989.14 3,763.89 1,408.15 1,441.93 1,358.81
November 4,230.73 4,439.60 3,993.33 1,503.78 1,556.89 1,433.85
December 4,266.55 4,333.79 4,147.21 1,466.25 1,507.25 1,447.95
PriceMovement Pattern
Indices - 2013
TABLE - 4
34 annual RepoRt 2013
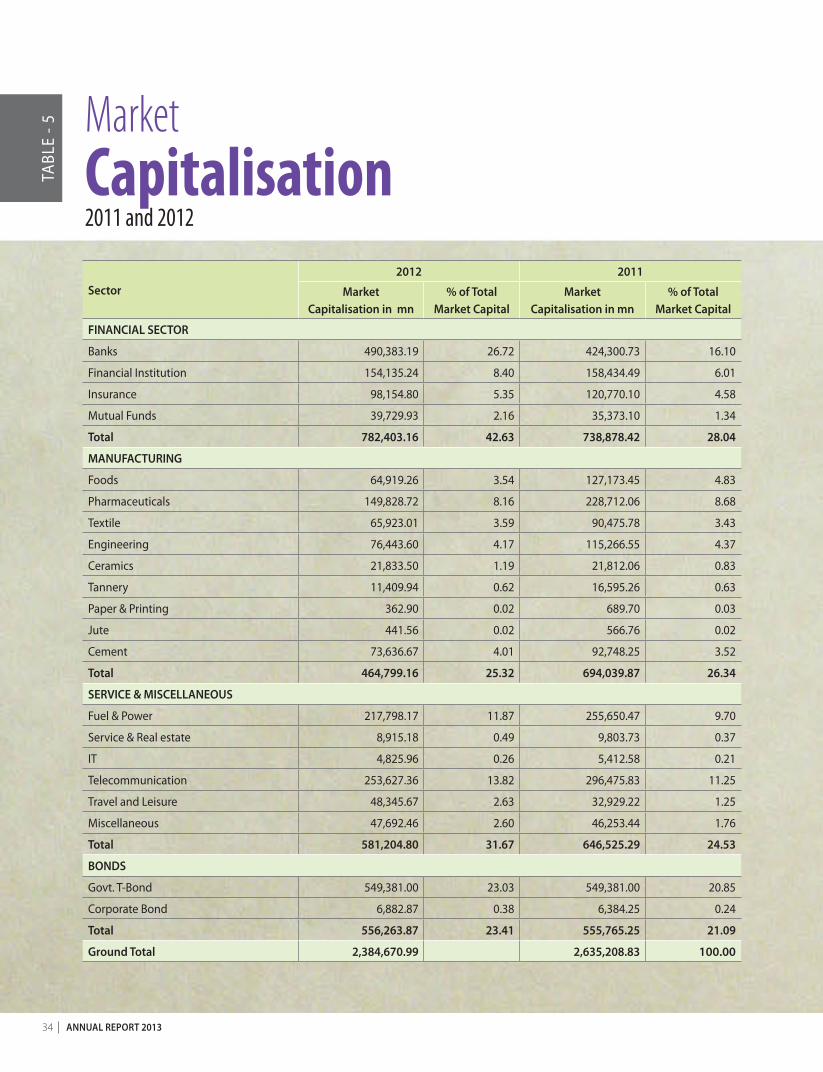
sector2012 2011
marketcapitalisation in mn
% of totalmarket capital
marketcapitalisation in mn
% of totalmarket capital
financial sectoR
Banks 490,383.19 26.72 424,300.73 16.10
Financial Institution 154,135.24 8.40 158,434.49 6.01
Insurance 98,154.80 5.35 120,770.10 4.58
Mutual Funds 39,729.93 2.16 35,373.10 1.34
total 782,403.16 42.63 738,878.42 28.04
manufactuRing
Foods 64,919.26 3.54 127,173.45 4.83
Pharmaceuticals 149,828.72 8.16 228,712.06 8.68
Textile 65,923.01 3.59 90,475.78 3.43
Engineering 76,443.60 4.17 115,266.55 4.37
Ceramics 21,833.50 1.19 21,812.06 0.83
Tannery 11,409.94 0.62 16,595.26 0.63
Paper & Printing 362.90 0.02 689.70 0.03
Jute 441.56 0.02 566.76 0.02
Cement 73,636.67 4.01 92,748.25 3.52
total 464,799.16 25.32 694,039.87 26.34
seRVice & miscellaneous
Fuel & Power 217,798.17 11.87 255,650.47 9.70
Service & Real estate 8,915.18 0.49 9,803.73 0.37
IT 4,825.96 0.26 5,412.58 0.21
Telecommunication 253,627.36 13.82 296,475.83 11.25
Travel and Leisure 48,345.67 2.63 32,929.22 1.25
Miscellaneous 47,692.46 2.60 46,253.44 1.76
total 581,204.80 31.67 646,525.29 24.53
bonds
Govt. T-Bond 549,381.00 23.03 549,381.00 20.85
Corporate Bond 6,882.87 0.38 6,384.25 0.24
total 556,263.87 23.41 555,765.25 21.09
ground total 2,384,670.99 2,635,208.83 100.00
TABL
E - 5 Market
Capitalisation2011 and 2012

bangladesh association of publicly listed companies 35
sector
market category
2013 2012
a b Z n total a b Z n total
Banks 28 1 1 - 30 29 - 1 - 30
Financial Institutions 15 5 2 1 23 18 3 1 - 22
Mutual Funds 41 - - - 41 41 - - - 41
Engineering 17 3 4 2 26 18 4 1 - 23
Food & Allied Products 10 1 6 - 17 12 - 4 - 16
Fuel & Power 14 1 - - 15 13 1 - - 14
Jute 1 - 2 - 3 2 - 1 - 3
Textile 23 3 4 1 31 21 2 2 3 28
Pharmaceuticals & Chemicals 21 1 2 - 24 17 1 2 - 20
Paper & Printing - 1 - - 1 - 1 - - 1
Service & Real Estate 3 - - - 3 4 - - - 4
Cement 5 - 1 1 7 5 - 1 - 6
IT-Sector 5 1 - - 6 5 1 - - 6
Tannery Industries 3 1 1 - 5 4 - 1 - 5
Ceramic 4 1 - - 5 3 2 - - 5
Insurance 44 2 - - 46 41 1 3 - 45
Telecommunication 2 - - - 2 2 - - - 2
Travel and Leisure 3 - - - 3 3 - - - 3
Miscellaneous 7 1 1 - 9 6 2 1 - 9
total 246 22 24 5 297 244 18 18 3 283
% 83 7 8 2 100 86 6 6 1 100
TABLE - 6
SectorWise Market
Category of Listed Companies:
36 annual RepoRt 2013
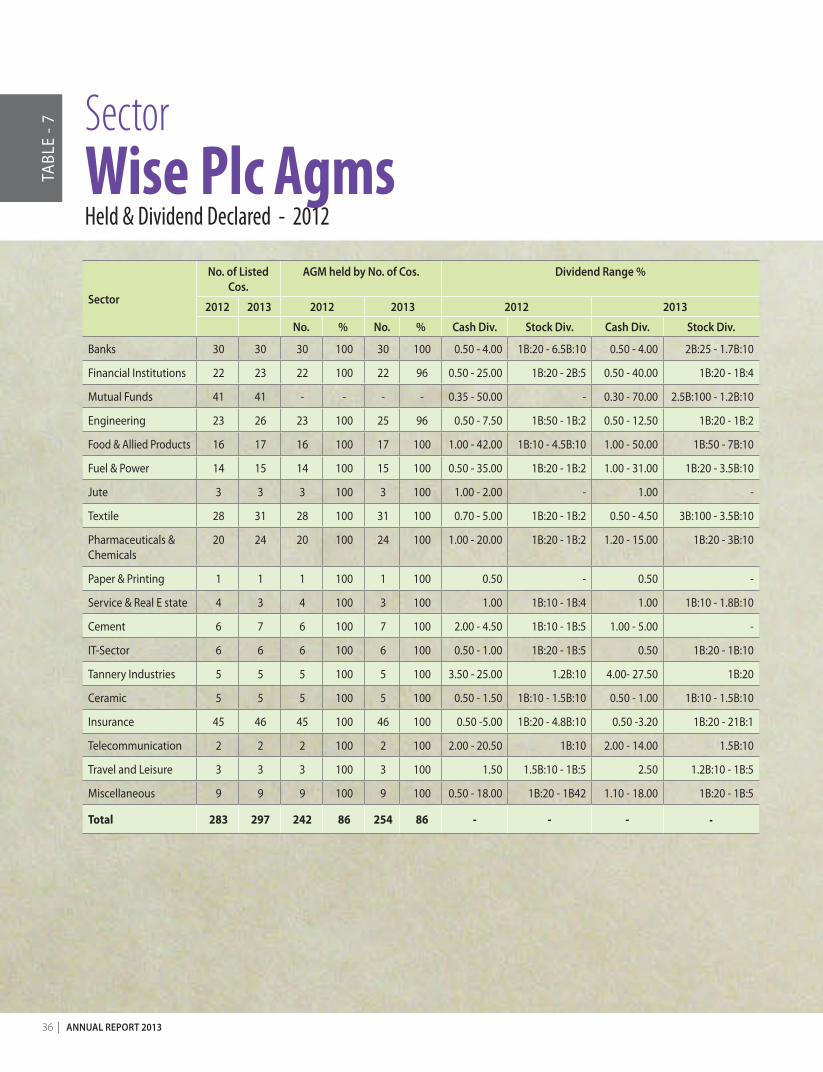
sector
no. of listed cos.
agm held by no. of cos. dividend Range %
2012 2013 2012 2013 2012 2013
no. % no. % cash div. stock div. cash div. stock div.
Banks 30 30 30 100 30 100 0.50 - 4.00 1B:20 - 6.5B:10 0.50 - 4.00 2B:25 - 1.7B:10
Financial Institutions 22 23 22 100 22 96 0.50 - 25.00 1B:20 - 2B:5 0.50 - 40.00 1B:20 - 1B:4
Mutual Funds 41 41 - - - - 0.35 - 50.00 - 0.30 - 70.00 2.5B:100 - 1.2B:10
Engineering 23 26 23 100 25 96 0.50 - 7.50 1B:50 - 1B:2 0.50 - 12.50 1B:20 - 1B:2
Food & Allied Products 16 17 16 100 17 100 1.00 - 42.00 1B:10 - 4.5B:10 1.00 - 50.00 1B:50 - 7B:10
Fuel & Power 14 15 14 100 15 100 0.50 - 35.00 1B:20 - 1B:2 1.00 - 31.00 1B:20 - 3.5B:10
Jute 3 3 3 100 3 100 1.00 - 2.00 - 1.00 -
Textile 28 31 28 100 31 100 0.70 - 5.00 1B:20 - 1B:2 0.50 - 4.50 3B:100 - 3.5B:10
Pharmaceuticals & Chemicals
20 24 20 100 24 100 1.00 - 20.00 1B:20 - 1B:2 1.20 - 15.00 1B:20 - 3B:10
Paper & Printing 1 1 1 100 1 100 0.50 - 0.50 -
Service & Real E state 4 3 4 100 3 100 1.00 1B:10 - 1B:4 1.00 1B:10 - 1.8B:10
Cement 6 7 6 100 7 100 2.00 - 4.50 1B:10 - 1B:5 1.00 - 5.00 -
IT-Sector 6 6 6 100 6 100 0.50 - 1.00 1B:20 - 1B:5 0.50 1B:20 - 1B:10
Tannery Industries 5 5 5 100 5 100 3.50 - 25.00 1.2B:10 4.00- 27.50 1B:20
Ceramic 5 5 5 100 5 100 0.50 - 1.50 1B:10 - 1.5B:10 0.50 - 1.00 1B:10 - 1.5B:10
Insurance 45 46 45 100 46 100 0.50 -5.00 1B:20 - 4.8B:10 0.50 -3.20 1B:20 - 21B:1
Telecommunication 2 2 2 100 2 100 2.00 - 20.50 1B:10 2.00 - 14.00 1.5B:10
Travel and Leisure 3 3 3 100 3 100 1.50 1.5B:10 - 1B:5 2.50 1.2B:10 - 1B:5
Miscellaneous 9 9 9 100 9 100 0.50 - 18.00 1B:20 - 1B42 1.10 - 18.00 1B:20 - 1B:5
Total 283 297 242 86 254 86 - - - -
TABL
E - 7 Sector
Wise Plc AgmsHeld & Dividend Declared - 2012
bangladesh association of publicly listed companies 37
particulars 2013 2012Listed Secrities 529.00 515.00 dse broad index (dseX)Opening Index 4,090.47 5,257.61 Closing Index 4,266.55 4,219.31 % of Change 4.30 (19.75)Highest Index 4,439.60 5,502.30 Lowest Index 3,438.90 3,616.24 dse- 30 index (ds30)Opening Index 1,473.01 3,910.33 Closing Index 1,466.25 3,472.56 % of Change (0.46) (11.20)Highest Index 1,654.22 4,025.13 Lowest Index 1,282.42 2,997.04 market capitalisation tk. in mn Opening Market Cap. 2,403,555.62 2,616,730.54 Closing Market Cap. 2,647,790.83 2,403,555.62 Highest Market Cap. 2,731,641.83 2,790,617.90 Lowest Market Cap. 2,160,241.18 2,039,135.98 Lowest (06.02.2012) 3,514.51 2,997.04 turnover tk. in mn Total Turnover 952,742.08 1,001,085.00 % of Change (4.83) (35.87)Total Trading Days 238.00 238.00 Daily Average Turnover 4,003.12 4,206.00 Highest Turnover 12,946.16 12,884.00 Lowest Turnover 1,015.72 1,157.00 Volume (in mn)Total Turnover in Volume 22,988.53 21,689.00 % of Change 5.99 27.83 Daily Average Turnover in Volume 96.59 91.00 Highest Turnover in Volume 240.93 301.00 Lowest Turnover in Volume 29.05 27.00 agmTotal No. of Companies held their AGM 252 240 dividend, bonus & Right issuesNo. of Co. & M.F. declared Cash Dividend 128 116 No. of Co.& M.F. declared Stock Dividend 152 165 No. of Co. & M.F. declared Right Shares 8 15 No. of Co. & M.F. which didn't declare Dividend 22 17 No. of Co. & M.F. did not hold AGM 4 2
particulars 2013 2012initial public offering (ipo)No. of IPO 12 17 Issue size (Tk. in mn) 13,377.24 15,562.46 To General Public Tk. in mn 8,305.00 12,081.09 Pre-IPO placement Tk. in mn 870.00 827.95 Public Subscription Tk. in mn 56,165.67 43,325.77 addition of securitiesIPO of Securities 1,663,979,299.00 1,817,515,512.00 % of Total No of Securities 3.79 4.67 Direct Listing of Securities - - % of Total No of Securities - - Stock Dividend 3,141,799,502.00 4,718,426,807.00 % of Total No of Securities 7.15 12.14 Right issue(s) 180,303,953.00 497,909,036.00 % of Total No of Securities 0.41 1.28 Total Securities added 4,986,082,754.00 7,033,851,355.00 addition of secutities Value (Tk. in mn)IPO Issue size 16,639.79 18,175.16 % of Total Value 3.70 4.54 Direct Listing of Securities - - % of Total Value - - Stock Dividend 31,418.00 47,973.40 % of Total Value 6.98 11.98 Right issue 1,803.04 4,979.09 % of Total Value 0.40 1.24 Total Value added 49,860.83 69,851.22 listing Listed Stoks and Bonds with DSE 17 14 Paid-up Capital (Tk. in mn) 16,749.79 18,175.16 % of Total Value 3.72 4.54 dividend statisticsAbove 100% 9 7 Above 50% up to 100% 3 4 Above 30% up to 50% 16 12 Above 20% up to 30% 12 13 10% up to 20% 68 61 Below 10% 20 19 foreign trade turnover (Tk. in mn)Buy 26,525.05 13,483.94 Sell 7,096.10 5,558.02 Net 19,428.95 7,925.92 Total 33,621.16 19,041.96 % of Total Traded Value 3.53 1.90 market cap. to gdp Ratio 25.51 26.27 market p/e 15.07 12.07
TABLE - 8
CapitalMarket Indicators
2012 - 2013
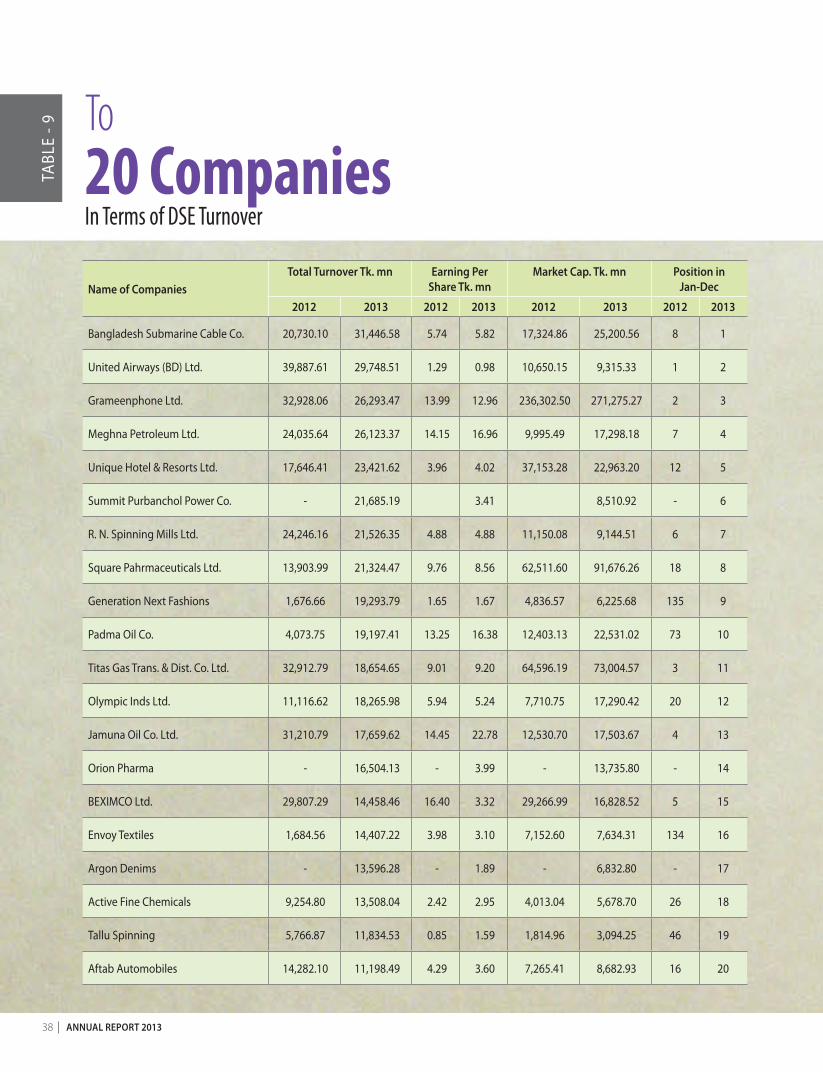
38 annual RepoRt 2013
name of companiestotal turnover tk. mn earning per
share tk. mnmarket cap. tk. mn position in
Jan-dec
2012 2013 2012 2013 2012 2013 2012 2013
Bangladesh Submarine Cable Co. 20,730.10 31,446.58 5.74 5.82 17,324.86 25,200.56 8 1
United Airways (BD) Ltd. 39,887.61 29,748.51 1.29 0.98 10,650.15 9,315.33 1 2
Grameenphone Ltd. 32,928.06 26,293.47 13.99 12.96 236,302.50 271,275.27 2 3
Meghna Petroleum Ltd. 24,035.64 26,123.37 14.15 16.96 9,995.49 17,298.18 7 4
Unique Hotel & Resorts Ltd. 17,646.41 23,421.62 3.96 4.02 37,153.28 22,963.20 12 5
Summit Purbanchol Power Co. - 21,685.19 3.41 8,510.92 - 6
R. N. Spinning Mills Ltd. 24,246.16 21,526.35 4.88 4.88 11,150.08 9,144.51 6 7
Square Pahrmaceuticals Ltd. 13,903.99 21,324.47 9.76 8.56 62,511.60 91,676.26 18 8
Generation Next Fashions 1,676.66 19,293.79 1.65 1.67 4,836.57 6,225.68 135 9
Padma Oil Co. 4,073.75 19,197.41 13.25 16.38 12,403.13 22,531.02 73 10
Titas Gas Trans. & Dist. Co. Ltd. 32,912.79 18,654.65 9.01 9.20 64,596.19 73,004.57 3 11
Olympic Inds Ltd. 11,116.62 18,265.98 5.94 5.24 7,710.75 17,290.42 20 12
Jamuna Oil Co. Ltd. 31,210.79 17,659.62 14.45 22.78 12,530.70 17,503.67 4 13
Orion Pharma - 16,504.13 - 3.99 - 13,735.80 - 14
BEXIMCO Ltd. 29,807.29 14,458.46 16.40 3.32 29,266.99 16,828.52 5 15
Envoy Textiles 1,684.56 14,407.22 3.98 3.10 7,152.60 7,634.31 134 16
Argon Denims - 13,596.28 - 1.89 - 6,832.80 - 17
Active Fine Chemicals 9,254.80 13,508.04 2.42 2.95 4,013.04 5,678.70 26 18
Tallu Spinning 5,766.87 11,834.53 0.85 1.59 1,814.96 3,094.25 46 19
Aftab Automobiles 14,282.10 11,198.49 4.29 3.60 7,265.41 8,682.93 16 20
TABL
E - 9 To
20 CompaniesIn Terms of DSE Turnover

bangladesh association of publicly listed companies 39
year month daily index(average)
index changein points
average marketcap. (tk. in mn)
% changeof avg. mkt. cap
2013
January 4127.04 - 104,507.52 (17.39)
February 4169.72 42.68 122,935.36 17.63
March 3793.60 (376.11) 122,872.71 (0.05)
April 3526.49 (267.11) 103,170.35 (16.03)
May 3694.31 167.82 119,204.47 15.54
June 4093.40 399.09 126,512.30 6.13
July 4154.83 61.42 113,789.70 (10.06)
August 4031.21 (123.61) 176,049.25 54.71
September 4072.74 41.53 114,965.86 (34.70)
October 3879.19 (193.55) 139,592.33 21.42
November 4239.30 360.11 131,756.62 (5.61)
December 4263.95 24.66 132,389.54 0.48
TABLE - 10
MonthlyAverage Index & Market
Capital Status
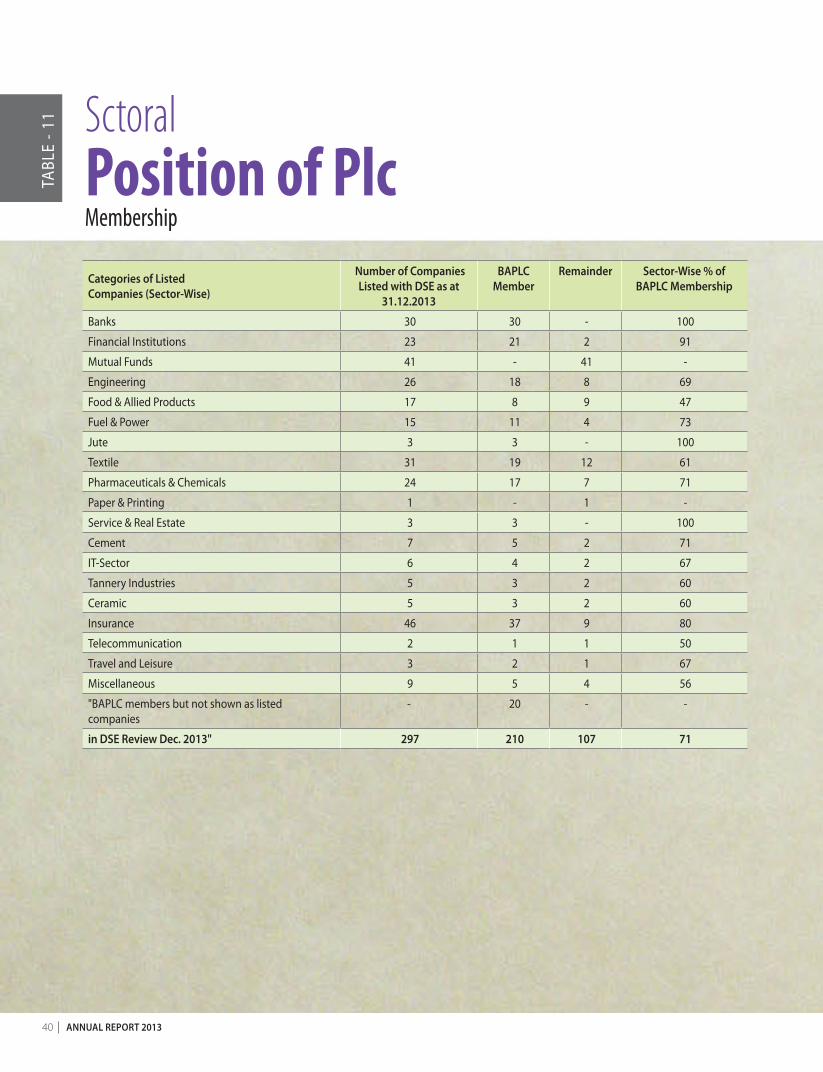
40 annual RepoRt 2013
categories of listedcompanies (sector-Wise)
number of companies listed with dse as at
31.12.2013
baplcmember
Remainder sector-Wise % ofbaplc membership
Banks 30 30 - 100
Financial Institutions 23 21 2 91
Mutual Funds 41 - 41 -
Engineering 26 18 8 69
Food & Allied Products 17 8 9 47
Fuel & Power 15 11 4 73
Jute 3 3 - 100
Textile 31 19 12 61
Pharmaceuticals & Chemicals 24 17 7 71
Paper & Printing 1 - 1 -
Service & Real Estate 3 3 - 100
Cement 7 5 2 71
IT-Sector 6 4 2 67
Tannery Industries 5 3 2 60
Ceramic 5 3 2 60
Insurance 46 37 9 80
Telecommunication 2 1 1 50
Travel and Leisure 3 2 1 67
Miscellaneous 9 5 4 56
"BAPLC members but not shown as listedcompanies
- 20 - -
in dse Review dec. 2013" 297 210 107 71
TABL
E - 1
1 SctoralPosition of PlcMembership
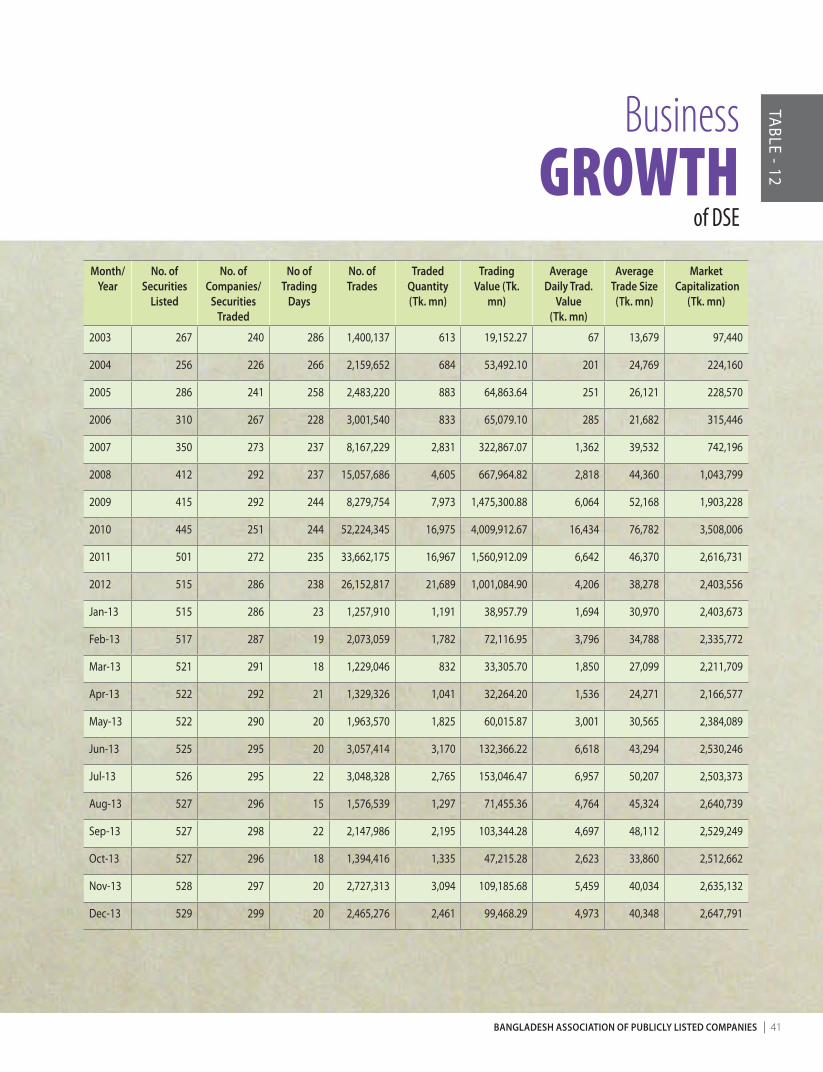
bangladesh association of publicly listed companies 41
month/ year
no. of securities
listed
no. of companies/
securities traded
no of trading
days
no. of trades
traded Quantity (tk. mn)
trading Value (tk.
mn)
average daily trad.
Value(tk. mn)
average trade size
(tk. mn)
market capitalization
(tk. mn)
2003 267 240 286 1,400,137 613 19,152.27 67 13,679 97,440
2004 256 226 266 2,159,652 684 53,492.10 201 24,769 224,160
2005 286 241 258 2,483,220 883 64,863.64 251 26,121 228,570
2006 310 267 228 3,001,540 833 65,079.10 285 21,682 315,446
2007 350 273 237 8,167,229 2,831 322,867.07 1,362 39,532 742,196
2008 412 292 237 15,057,686 4,605 667,964.82 2,818 44,360 1,043,799
2009 415 292 244 8,279,754 7,973 1,475,300.88 6,064 52,168 1,903,228
2010 445 251 244 52,224,345 16,975 4,009,912.67 16,434 76,782 3,508,006
2011 501 272 235 33,662,175 16,967 1,560,912.09 6,642 46,370 2,616,731
2012 515 286 238 26,152,817 21,689 1,001,084.90 4,206 38,278 2,403,556
Jan-13 515 286 23 1,257,910 1,191 38,957.79 1,694 30,970 2,403,673
Feb-13 517 287 19 2,073,059 1,782 72,116.95 3,796 34,788 2,335,772
Mar-13 521 291 18 1,229,046 832 33,305.70 1,850 27,099 2,211,709
Apr-13 522 292 21 1,329,326 1,041 32,264.20 1,536 24,271 2,166,577
May-13 522 290 20 1,963,570 1,825 60,015.87 3,001 30,565 2,384,089
Jun-13 525 295 20 3,057,414 3,170 132,366.22 6,618 43,294 2,530,246
Jul-13 526 295 22 3,048,328 2,765 153,046.47 6,957 50,207 2,503,373
Aug-13 527 296 15 1,576,539 1,297 71,455.36 4,764 45,324 2,640,739
Sep-13 527 298 22 2,147,986 2,195 103,344.28 4,697 48,112 2,529,249
Oct-13 527 296 18 1,394,416 1,335 47,215.28 2,623 33,860 2,512,662
Nov-13 528 297 20 2,727,313 3,094 109,185.68 5,459 40,034 2,635,132
Dec-13 529 299 20 2,465,276 2,461 99,468.29 4,973 40,348 2,647,791
TABLE - 12
BusinessGROWTH
of DSE
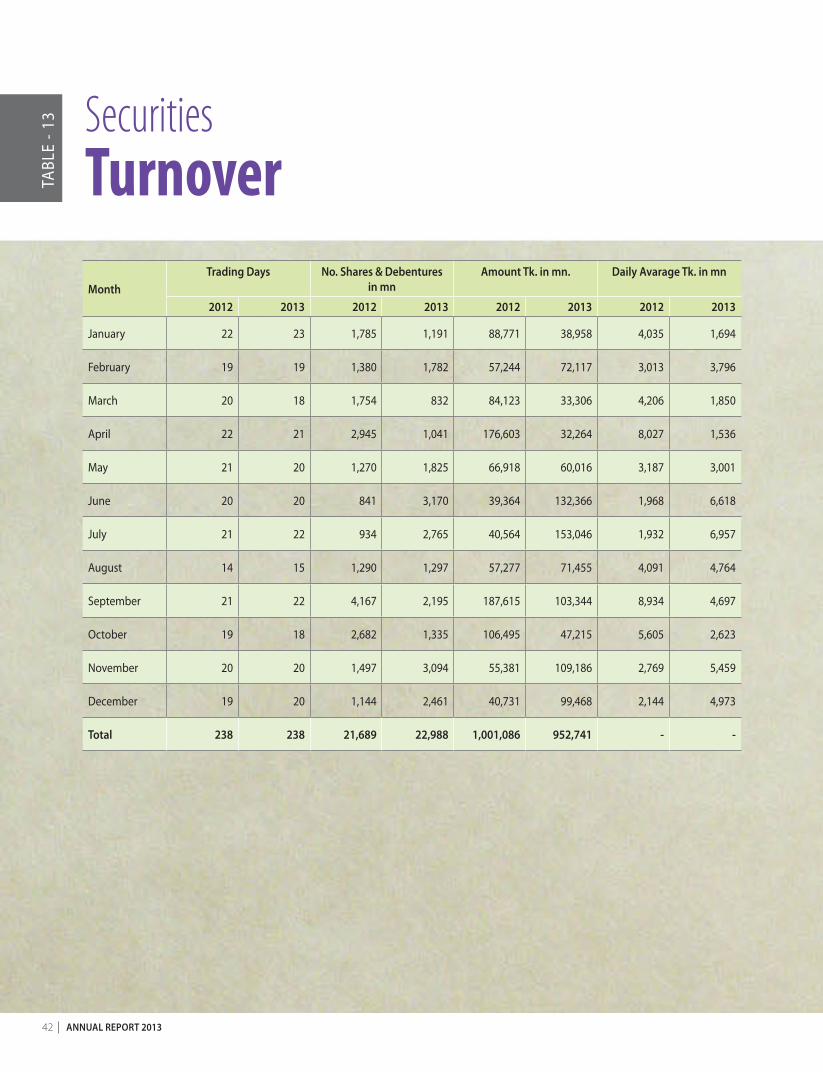
42 annual RepoRt 2013
monthtrading days no. shares & debentures
in mnamount tk. in mn. daily avarage tk. in mn
2012 2013 2012 2013 2012 2013 2012 2013
January 22 23 1,785 1,191 88,771 38,958 4,035 1,694
February 19 19 1,380 1,782 57,244 72,117 3,013 3,796
March 20 18 1,754 832 84,123 33,306 4,206 1,850
April 22 21 2,945 1,041 176,603 32,264 8,027 1,536
May 21 20 1,270 1,825 66,918 60,016 3,187 3,001
June 20 20 841 3,170 39,364 132,366 1,968 6,618
July 21 22 934 2,765 40,564 153,046 1,932 6,957
August 14 15 1,290 1,297 57,277 71,455 4,091 4,764
September 21 22 4,167 2,195 187,615 103,344 8,934 4,697
October 19 18 2,682 1,335 106,495 47,215 5,605 2,623
November 20 20 1,497 3,094 55,381 109,186 2,769 5,459
December 19 20 1,144 2,461 40,731 99,468 2,144 4,973
total 238 238 21,689 22,988 1,001,086 952,741 - -
TABL
E - 1
3 SecuritiesTurnover
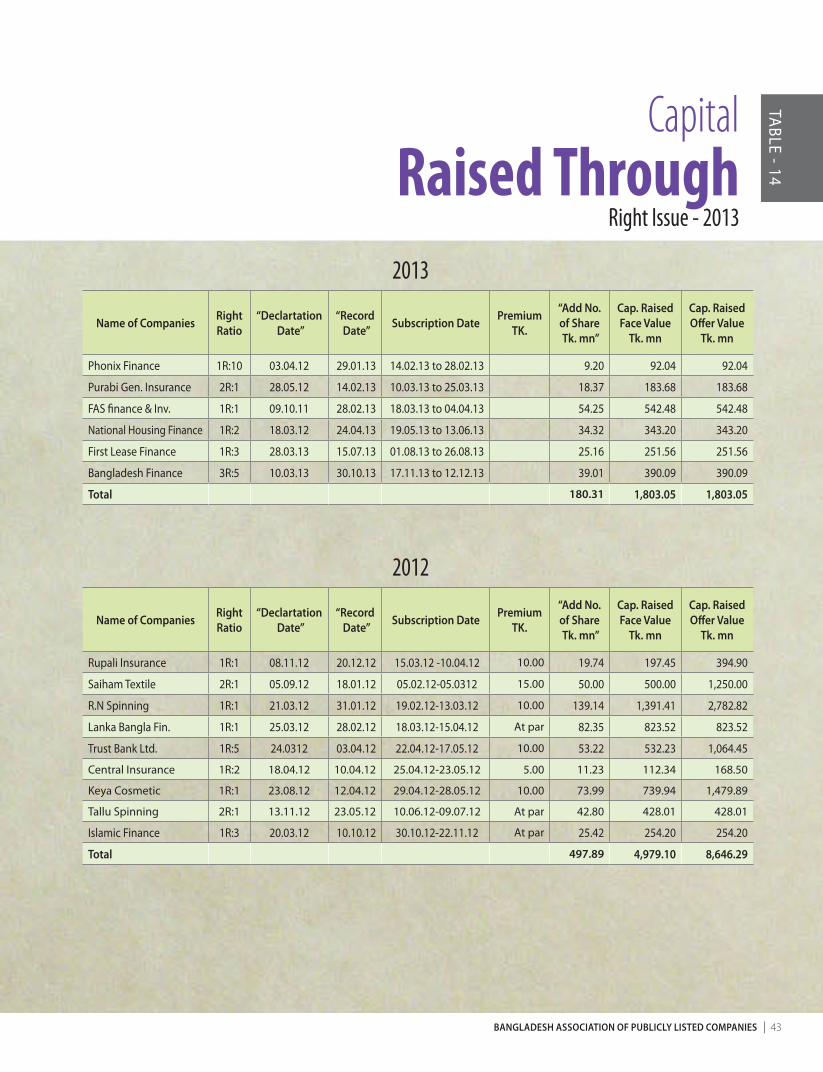
bangladesh association of publicly listed companies 43
2013
name of companies Right Ratio
“declartation date”
“Record date” subscription date premium
tK.
“add no. of share tk. mn”
cap. Raised face Value
tk. mn
cap. Raised offer Value
tk. mn
Phonix Finance 1R:10 03.04.12 29.01.13 14.02.13 to 28.02.13 9.20 92.04 92.04
Purabi Gen. Insurance 2R:1 28.05.12 14.02.13 10.03.13 to 25.03.13 18.37 183.68 183.68
FAS finance & Inv. 1R:1 09.10.11 28.02.13 18.03.13 to 04.04.13 54.25 542.48 542.48
National Housing Finance 1R:2 18.03.12 24.04.13 19.05.13 to 13.06.13 34.32 343.20 343.20
First Lease Finance 1R:3 28.03.13 15.07.13 01.08.13 to 26.08.13 25.16 251.56 251.56
Bangladesh Finance 3R:5 10.03.13 30.10.13 17.11.13 to 12.12.13 39.01 390.09 390.09
total 180.31 1,803.05 1,803.05
2012
name of companies Right Ratio
“declartation date”
“Record date” subscription date premium
tK.
“add no. of share tk. mn”
cap. Raised face Value
tk. mn
cap. Raised offer Value
tk. mn
Rupali Insurance 1R:1 08.11.12 20.12.12 15.03.12 -10.04.12 10.00 19.74 197.45 394.90
Saiham Textile 2R:1 05.09.12 18.01.12 05.02.12-05.0312 15.00 50.00 500.00 1,250.00
R.N Spinning 1R:1 21.03.12 31.01.12 19.02.12-13.03.12 10.00 139.14 1,391.41 2,782.82
Lanka Bangla Fin. 1R:1 25.03.12 28.02.12 18.03.12-15.04.12 At par 82.35 823.52 823.52
Trust Bank Ltd. 1R:5 24.0312 03.04.12 22.04.12-17.05.12 10.00 53.22 532.23 1,064.45
Central Insurance 1R:2 18.04.12 10.04.12 25.04.12-23.05.12 5.00 11.23 112.34 168.50
Keya Cosmetic 1R:1 23.08.12 12.04.12 29.04.12-28.05.12 10.00 73.99 739.94 1,479.89
Tallu Spinning 2R:1 13.11.12 23.05.12 10.06.12-09.07.12 At par 42.80 428.01 428.01
Islamic Finance 1R:3 20.03.12 10.10.12 30.10.12-22.11.12 At par 25.42 254.20 254.20
total 497.89 4,979.10 8,646.29
TABLE - 14
CapitalRaised Through
Right Issue - 2013
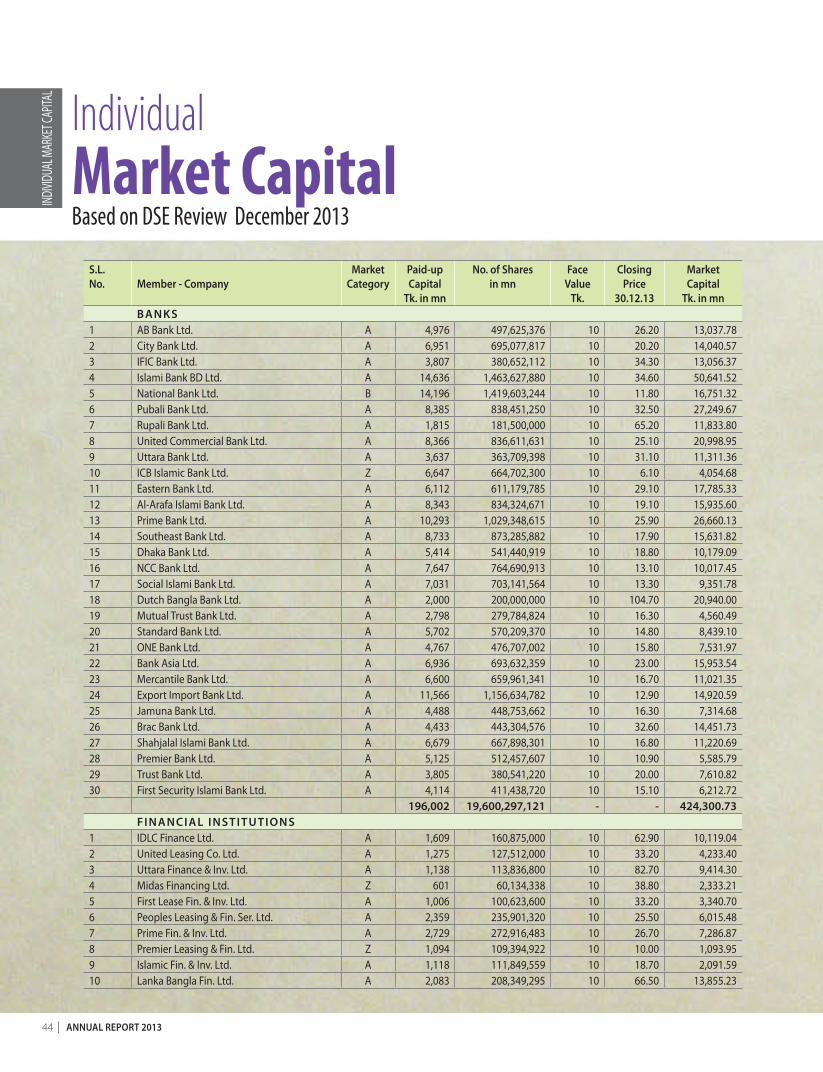
44 annual RepoRt 2013
s.l. no. member - company
marketcategory
paid-upcapital
tk. in mn
no. of sharesin mn
faceValue
tk.
closingprice
30.12.13
marketcapital
tk. in mnbanKs
1 AB Bank Ltd. A 4,976 497,625,376 10 26.20 13,037.78 2 City Bank Ltd. A 6,951 695,077,817 10 20.20 14,040.57 3 IFIC Bank Ltd. A 3,807 380,652,112 10 34.30 13,056.37 4 Islami Bank BD Ltd. A 14,636 1,463,627,880 10 34.60 50,641.52 5 National Bank Ltd. B 14,196 1,419,603,244 10 11.80 16,751.32 6 Pubali Bank Ltd. A 8,385 838,451,250 10 32.50 27,249.67 7 Rupali Bank Ltd. A 1,815 181,500,000 10 65.20 11,833.80 8 United Commercial Bank Ltd. A 8,366 836,611,631 10 25.10 20,998.95 9 Uttara Bank Ltd. A 3,637 363,709,398 10 31.10 11,311.36 10 ICB Islamic Bank Ltd. Z 6,647 664,702,300 10 6.10 4,054.68 11 Eastern Bank Ltd. A 6,112 611,179,785 10 29.10 17,785.33 12 Al-Arafa Islami Bank Ltd. A 8,343 834,324,671 10 19.10 15,935.60 13 Prime Bank Ltd. A 10,293 1,029,348,615 10 25.90 26,660.13 14 Southeast Bank Ltd. A 8,733 873,285,882 10 17.90 15,631.82 15 Dhaka Bank Ltd. A 5,414 541,440,919 10 18.80 10,179.09 16 NCC Bank Ltd. A 7,647 764,690,913 10 13.10 10,017.45 17 Social Islami Bank Ltd. A 7,031 703,141,564 10 13.30 9,351.78 18 Dutch Bangla Bank Ltd. A 2,000 200,000,000 10 104.70 20,940.00 19 Mutual Trust Bank Ltd. A 2,798 279,784,824 10 16.30 4,560.49 20 Standard Bank Ltd. A 5,702 570,209,370 10 14.80 8,439.10 21 ONE Bank Ltd. A 4,767 476,707,002 10 15.80 7,531.97 22 Bank Asia Ltd. A 6,936 693,632,359 10 23.00 15,953.54 23 Mercantile Bank Ltd. A 6,600 659,961,341 10 16.70 11,021.35 24 Export Import Bank Ltd. A 11,566 1,156,634,782 10 12.90 14,920.59 25 Jamuna Bank Ltd. A 4,488 448,753,662 10 16.30 7,314.68 26 Brac Bank Ltd. A 4,433 443,304,576 10 32.60 14,451.73 27 Shahjalal Islami Bank Ltd. A 6,679 667,898,301 10 16.80 11,220.69 28 Premier Bank Ltd. A 5,125 512,457,607 10 10.90 5,585.79 29 Trust Bank Ltd. A 3,805 380,541,220 10 20.00 7,610.82 30 First Security Islami Bank Ltd. A 4,114 411,438,720 10 15.10 6,212.72
196,002 19,600,297,121 - - 424,300.73 financial institutions
1 IDLC Finance Ltd. A 1,609 160,875,000 10 62.90 10,119.04 2 United Leasing Co. Ltd. A 1,275 127,512,000 10 33.20 4,233.40 3 Uttara Finance & Inv. Ltd. A 1,138 113,836,800 10 82.70 9,414.30 4 Midas Financing Ltd. Z 601 60,134,338 10 38.80 2,333.21 5 First Lease Fin. & Inv. Ltd. A 1,006 100,623,600 10 33.20 3,340.70 6 Peoples Leasing & Fin. Ser. Ltd. A 2,359 235,901,320 10 25.50 6,015.48 7 Prime Fin. & Inv. Ltd. A 2,729 272,916,483 10 26.70 7,286.87 8 Premier Leasing & Fin. Ltd. Z 1,094 109,394,922 10 10.00 1,093.95 9 Islamic Fin. & Inv. Ltd. A 1,118 111,849,559 10 18.70 2,091.59 10 Lanka Bangla Fin. Ltd. A 2,083 208,349,295 10 66.50 13,855.23
IndividualMarket CapitalBased on DSE Review December 2013
INDIVI
DUAL
MAR
KET C
APITA
L
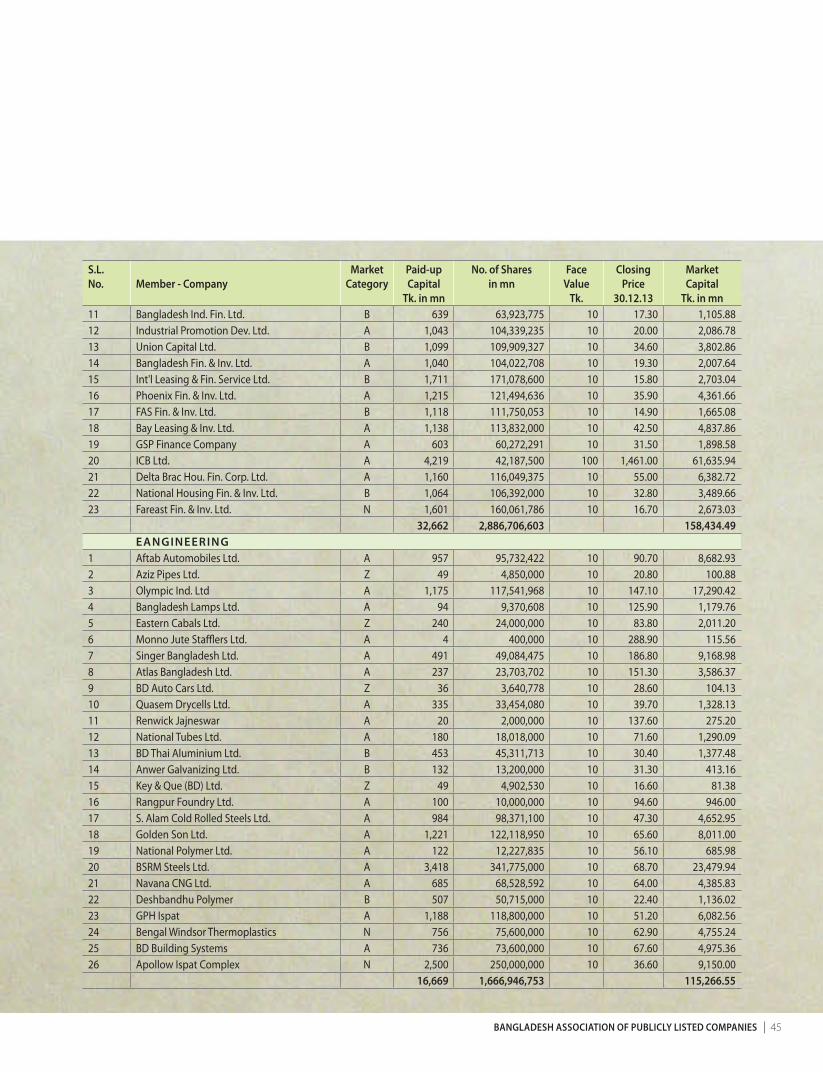
bangladesh association of publicly listed companies 45
s.l. no. member - company
marketcategory
paid-upcapital
tk. in mn
no. of sharesin mn
faceValue
tk.
closingprice
30.12.13
marketcapital
tk. in mn11 Bangladesh Ind. Fin. Ltd. B 639 63,923,775 10 17.30 1,105.88 12 Industrial Promotion Dev. Ltd. A 1,043 104,339,235 10 20.00 2,086.78 13 Union Capital Ltd. B 1,099 109,909,327 10 34.60 3,802.86 14 Bangladesh Fin. & Inv. Ltd. A 1,040 104,022,708 10 19.30 2,007.64 15 Int'l Leasing & Fin. Service Ltd. B 1,711 171,078,600 10 15.80 2,703.04 16 Phoenix Fin. & Inv. Ltd. A 1,215 121,494,636 10 35.90 4,361.66 17 FAS Fin. & Inv. Ltd. B 1,118 111,750,053 10 14.90 1,665.08 18 Bay Leasing & Inv. Ltd. A 1,138 113,832,000 10 42.50 4,837.86 19 GSP Finance Company A 603 60,272,291 10 31.50 1,898.58 20 ICB Ltd. A 4,219 42,187,500 100 1,461.00 61,635.94 21 Delta Brac Hou. Fin. Corp. Ltd. A 1,160 116,049,375 10 55.00 6,382.72 22 National Housing Fin. & Inv. Ltd. B 1,064 106,392,000 10 32.80 3,489.66 23 Fareast Fin. & Inv. Ltd. N 1,601 160,061,786 10 16.70 2,673.03
32,662 2,886,706,603 158,434.49 eangineeRing
1 Aftab Automobiles Ltd. A 957 95,732,422 10 90.70 8,682.93 2 Aziz Pipes Ltd. Z 49 4,850,000 10 20.80 100.88 3 Olympic Ind. Ltd A 1,175 117,541,968 10 147.10 17,290.42 4 Bangladesh Lamps Ltd. A 94 9,370,608 10 125.90 1,179.76 5 Eastern Cabals Ltd. Z 240 24,000,000 10 83.80 2,011.20 6 Monno Jute Stafflers Ltd. A 4 400,000 10 288.90 115.56 7 Singer Bangladesh Ltd. A 491 49,084,475 10 186.80 9,168.98 8 Atlas Bangladesh Ltd. A 237 23,703,702 10 151.30 3,586.37 9 BD Auto Cars Ltd. Z 36 3,640,778 10 28.60 104.13 10 Quasem Drycells Ltd. A 335 33,454,080 10 39.70 1,328.13 11 Renwick Jajneswar A 20 2,000,000 10 137.60 275.20 12 National Tubes Ltd. A 180 18,018,000 10 71.60 1,290.09 13 BD Thai Aluminium Ltd. B 453 45,311,713 10 30.40 1,377.48 14 Anwer Galvanizing Ltd. B 132 13,200,000 10 31.30 413.16 15 Key & Que (BD) Ltd. Z 49 4,902,530 10 16.60 81.38 16 Rangpur Foundry Ltd. A 100 10,000,000 10 94.60 946.00 17 S. Alam Cold Rolled Steels Ltd. A 984 98,371,100 10 47.30 4,652.95 18 Golden Son Ltd. A 1,221 122,118,950 10 65.60 8,011.00 19 National Polymer Ltd. A 122 12,227,835 10 56.10 685.98 20 BSRM Steels Ltd. A 3,418 341,775,000 10 68.70 23,479.94 21 Navana CNG Ltd. A 685 68,528,592 10 64.00 4,385.83 22 Deshbandhu Polymer B 507 50,715,000 10 22.40 1,136.02 23 GPH Ispat A 1,188 118,800,000 10 51.20 6,082.56 24 Bengal Windsor Thermoplastics N 756 75,600,000 10 62.90 4,755.24 25 BD Building Systems A 736 73,600,000 10 67.60 4,975.36 26 Apollow Ispat Complex N 2,500 250,000,000 10 36.60 9,150.00
16,669 1,666,946,753 115,266.55
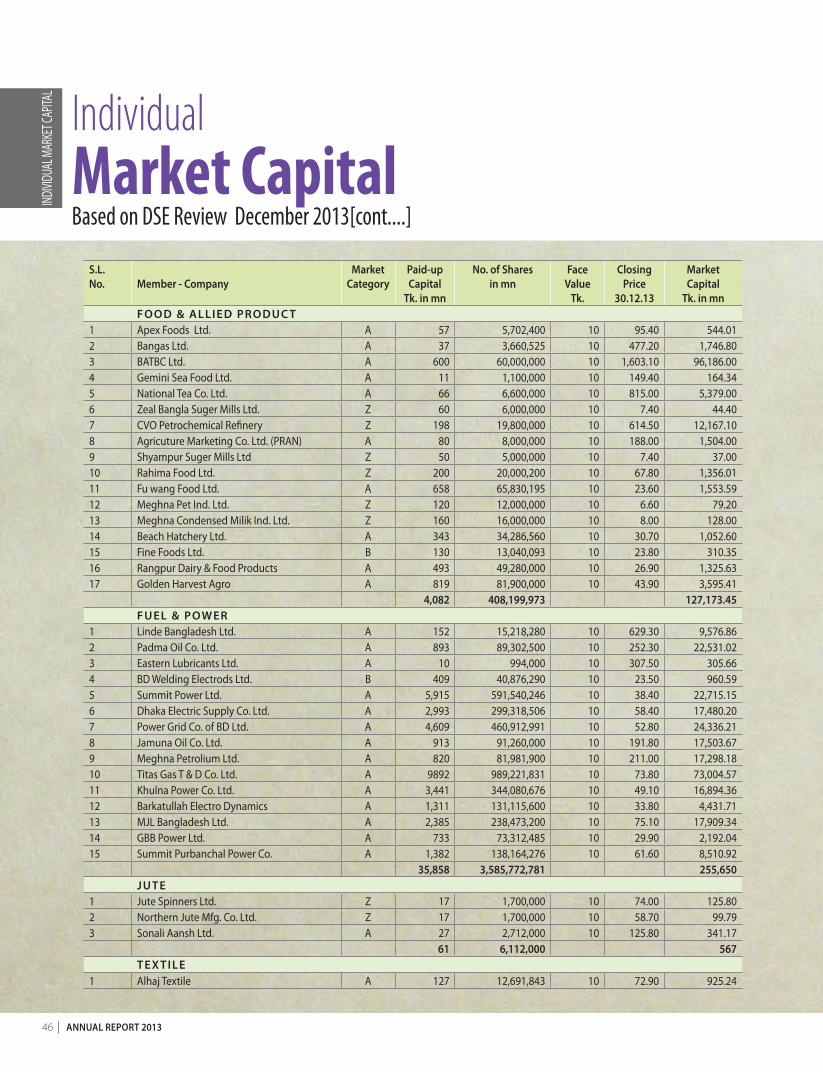
46 annual RepoRt 2013
s.l. no. member - company
marketcategory
paid-upcapital
tk. in mn
no. of sharesin mn
faceValue
tk.
closingprice
30.12.13
marketcapital
tk. in mnfood & allied pRoduc t
1 Apex Foods Ltd. A 57 5,702,400 10 95.40 544.01 2 Bangas Ltd. A 37 3,660,525 10 477.20 1,746.80 3 BATBC Ltd. A 600 60,000,000 10 1,603.10 96,186.00 4 Gemini Sea Food Ltd. A 11 1,100,000 10 149.40 164.34 5 National Tea Co. Ltd. A 66 6,600,000 10 815.00 5,379.00 6 Zeal Bangla Suger Mills Ltd. Z 60 6,000,000 10 7.40 44.40 7 CVO Petrochemical Refinery Z 198 19,800,000 10 614.50 12,167.10 8 Agricuture Marketing Co. Ltd. (PRAN) A 80 8,000,000 10 188.00 1,504.00 9 Shyampur Suger Mills Ltd Z 50 5,000,000 10 7.40 37.00 10 Rahima Food Ltd. Z 200 20,000,200 10 67.80 1,356.01 11 Fu wang Food Ltd. A 658 65,830,195 10 23.60 1,553.59 12 Meghna Pet Ind. Ltd. Z 120 12,000,000 10 6.60 79.20 13 Meghna Condensed Milik Ind. Ltd. Z 160 16,000,000 10 8.00 128.00 14 Beach Hatchery Ltd. A 343 34,286,560 10 30.70 1,052.60 15 Fine Foods Ltd. B 130 13,040,093 10 23.80 310.35 16 Rangpur Dairy & Food Products A 493 49,280,000 10 26.90 1,325.63 17 Golden Harvest Agro A 819 81,900,000 10 43.90 3,595.41
4,082 408,199,973 127,173.45 fuel & poWeR
1 Linde Bangladesh Ltd. A 152 15,218,280 10 629.30 9,576.86 2 Padma Oil Co. Ltd. A 893 89,302,500 10 252.30 22,531.02 3 Eastern Lubricants Ltd. A 10 994,000 10 307.50 305.66 4 BD Welding Electrods Ltd. B 409 40,876,290 10 23.50 960.59 5 Summit Power Ltd. A 5,915 591,540,246 10 38.40 22,715.15 6 Dhaka Electric Supply Co. Ltd. A 2,993 299,318,506 10 58.40 17,480.20 7 Power Grid Co. of BD Ltd. A 4,609 460,912,991 10 52.80 24,336.21 8 Jamuna Oil Co. Ltd. A 913 91,260,000 10 191.80 17,503.67 9 Meghna Petrolium Ltd. A 820 81,981,900 10 211.00 17,298.18 10 Titas Gas T & D Co. Ltd. A 9892 989,221,831 10 73.80 73,004.57 11 Khulna Power Co. Ltd. A 3,441 344,080,676 10 49.10 16,894.36 12 Barkatullah Electro Dynamics A 1,311 131,115,600 10 33.80 4,431.71 13 MJL Bangladesh Ltd. A 2,385 238,473,200 10 75.10 17,909.34 14 GBB Power Ltd. A 733 73,312,485 10 29.90 2,192.04 15 Summit Purbanchal Power Co. A 1,382 138,164,276 10 61.60 8,510.92
35,858 3,585,772,781 255,650 Jute
1 Jute Spinners Ltd. Z 17 1,700,000 10 74.00 125.80 2 Northern Jute Mfg. Co. Ltd. Z 17 1,700,000 10 58.70 99.79 3 Sonali Aansh Ltd. A 27 2,712,000 10 125.80 341.17
61 6,112,000 567 teX tile
1 Alhaj Textile A 127 12,691,843 10 72.90 925.24
INDIVI
DUAL
MAR
KET C
APITA
L
IndividualMarket CapitalBased on DSE Review December 2013[cont....]
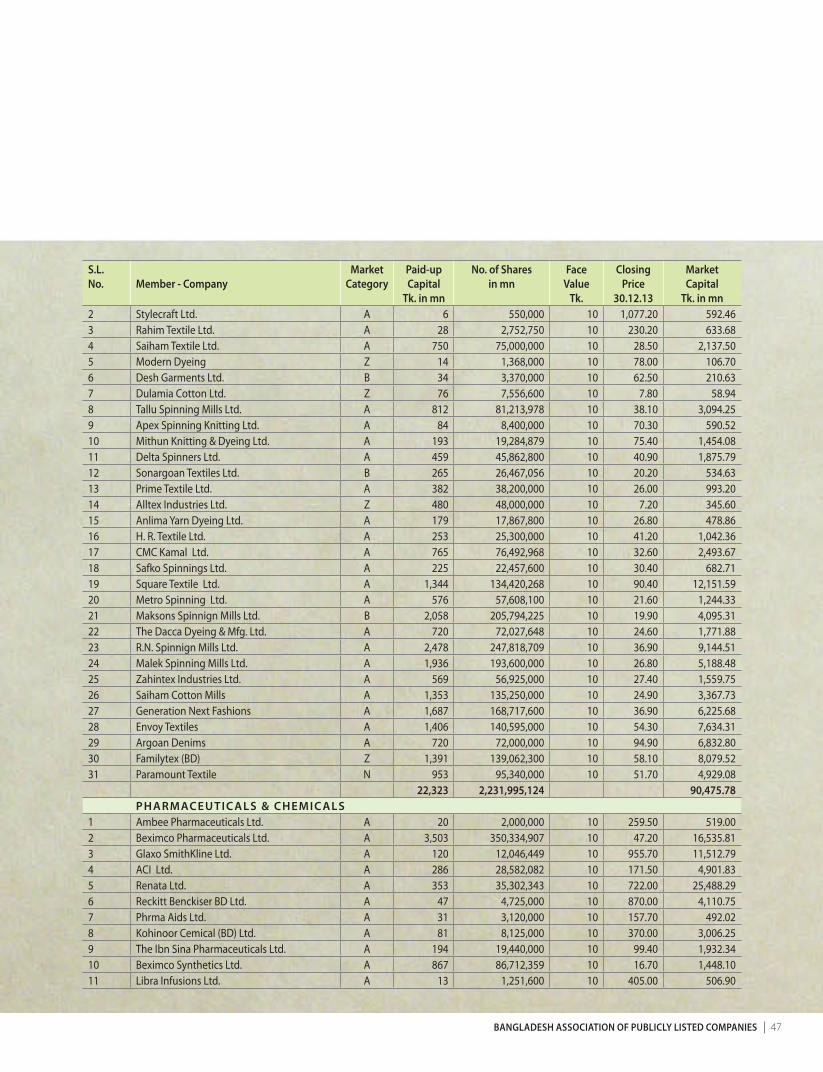
bangladesh association of publicly listed companies 47
s.l. no. member - company
marketcategory
paid-upcapital
tk. in mn
no. of sharesin mn
faceValue
tk.
closingprice
30.12.13
marketcapital
tk. in mn2 Stylecraft Ltd. A 6 550,000 10 1,077.20 592.46 3 Rahim Textile Ltd. A 28 2,752,750 10 230.20 633.68 4 Saiham Textile Ltd. A 750 75,000,000 10 28.50 2,137.50 5 Modern Dyeing Z 14 1,368,000 10 78.00 106.70 6 Desh Garments Ltd. B 34 3,370,000 10 62.50 210.63 7 Dulamia Cotton Ltd. Z 76 7,556,600 10 7.80 58.94 8 Tallu Spinning Mills Ltd. A 812 81,213,978 10 38.10 3,094.25 9 Apex Spinning Knitting Ltd. A 84 8,400,000 10 70.30 590.52 10 Mithun Knitting & Dyeing Ltd. A 193 19,284,879 10 75.40 1,454.08 11 Delta Spinners Ltd. A 459 45,862,800 10 40.90 1,875.79 12 Sonargoan Textiles Ltd. B 265 26,467,056 10 20.20 534.63 13 Prime Textile Ltd. A 382 38,200,000 10 26.00 993.20 14 Alltex Industries Ltd. Z 480 48,000,000 10 7.20 345.60 15 Anlima Yarn Dyeing Ltd. A 179 17,867,800 10 26.80 478.86 16 H. R. Textile Ltd. A 253 25,300,000 10 41.20 1,042.36 17 CMC Kamal Ltd. A 765 76,492,968 10 32.60 2,493.67 18 Safko Spinnings Ltd. A 225 22,457,600 10 30.40 682.71 19 Square Textile Ltd. A 1,344 134,420,268 10 90.40 12,151.59 20 Metro Spinning Ltd. A 576 57,608,100 10 21.60 1,244.33 21 Maksons Spinnign Mills Ltd. B 2,058 205,794,225 10 19.90 4,095.31 22 The Dacca Dyeing & Mfg. Ltd. A 720 72,027,648 10 24.60 1,771.88 23 R.N. Spinnign Mills Ltd. A 2,478 247,818,709 10 36.90 9,144.51 24 Malek Spinning Mills Ltd. A 1,936 193,600,000 10 26.80 5,188.48 25 Zahintex Industries Ltd. A 569 56,925,000 10 27.40 1,559.75 26 Saiham Cotton Mills A 1,353 135,250,000 10 24.90 3,367.73 27 Generation Next Fashions A 1,687 168,717,600 10 36.90 6,225.68 28 Envoy Textiles A 1,406 140,595,000 10 54.30 7,634.31 29 Argoan Denims A 720 72,000,000 10 94.90 6,832.80 30 Familytex (BD) Z 1,391 139,062,300 10 58.10 8,079.52 31 Paramount Textile N 953 95,340,000 10 51.70 4,929.08
22,323 2,231,995,124 90,475.78 phaRmaceutic als & chemic als
1 Ambee Pharmaceuticals Ltd. A 20 2,000,000 10 259.50 519.00 2 Beximco Pharmaceuticals Ltd. A 3,503 350,334,907 10 47.20 16,535.81 3 Glaxo SmithKline Ltd. A 120 12,046,449 10 955.70 11,512.79 4 ACI Ltd. A 286 28,582,082 10 171.50 4,901.83 5 Renata Ltd. A 353 35,302,343 10 722.00 25,488.29 6 Reckitt Benckiser BD Ltd. A 47 4,725,000 10 870.00 4,110.75 7 Phrma Aids Ltd. A 31 3,120,000 10 157.70 492.02 8 Kohinoor Cemical (BD) Ltd. A 81 8,125,000 10 370.00 3,006.25 9 The Ibn Sina Pharmaceuticals Ltd. A 194 19,440,000 10 99.40 1,932.34 10 Beximco Synthetics Ltd. A 867 86,712,359 10 16.70 1,448.10 11 Libra Infusions Ltd. A 13 1,251,600 10 405.00 506.90
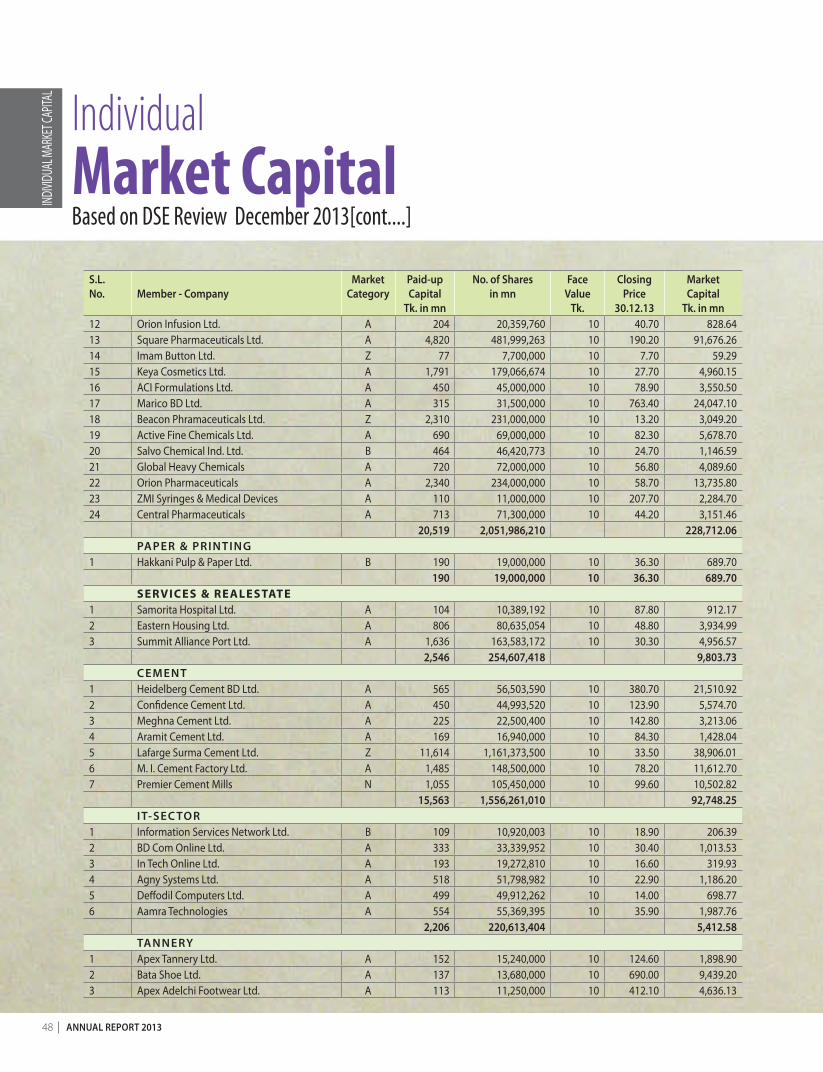
48 annual RepoRt 2013
s.l. no. member - company
marketcategory
paid-upcapital
tk. in mn
no. of sharesin mn
faceValue
tk.
closingprice
30.12.13
marketcapital
tk. in mn12 Orion Infusion Ltd. A 204 20,359,760 10 40.70 828.64 13 Square Pharmaceuticals Ltd. A 4,820 481,999,263 10 190.20 91,676.26 14 Imam Button Ltd. Z 77 7,700,000 10 7.70 59.29 15 Keya Cosmetics Ltd. A 1,791 179,066,674 10 27.70 4,960.15 16 ACI Formulations Ltd. A 450 45,000,000 10 78.90 3,550.50 17 Marico BD Ltd. A 315 31,500,000 10 763.40 24,047.10 18 Beacon Phramaceuticals Ltd. Z 2,310 231,000,000 10 13.20 3,049.20 19 Active Fine Chemicals Ltd. A 690 69,000,000 10 82.30 5,678.70 20 Salvo Chemical Ind. Ltd. B 464 46,420,773 10 24.70 1,146.59 21 Global Heavy Chemicals A 720 72,000,000 10 56.80 4,089.60 22 Orion Pharmaceuticals A 2,340 234,000,000 10 58.70 13,735.80 23 ZMI Syringes & Medical Devices A 110 11,000,000 10 207.70 2,284.70 24 Central Pharmaceuticals A 713 71,300,000 10 44.20 3,151.46
20,519 2,051,986,210 228,712.06 papeR & pRinting
1 Hakkani Pulp & Paper Ltd. B 190 19,000,000 10 36.30 689.70 190 19,000,000 10 36.30 689.70
SERVICES & REALESTATE 1 Samorita Hospital Ltd. A 104 10,389,192 10 87.80 912.17 2 Eastern Housing Ltd. A 806 80,635,054 10 48.80 3,934.99 3 Summit Alliance Port Ltd. A 1,636 163,583,172 10 30.30 4,956.57
2,546 254,607,418 9,803.73 cement
1 Heidelberg Cement BD Ltd. A 565 56,503,590 10 380.70 21,510.92 2 Confidence Cement Ltd. A 450 44,993,520 10 123.90 5,574.70 3 Meghna Cement Ltd. A 225 22,500,400 10 142.80 3,213.06 4 Aramit Cement Ltd. A 169 16,940,000 10 84.30 1,428.04 5 Lafarge Surma Cement Ltd. Z 11,614 1,161,373,500 10 33.50 38,906.01 6 M. I. Cement Factory Ltd. A 1,485 148,500,000 10 78.20 11,612.70 7 Premier Cement Mills N 1,055 105,450,000 10 99.60 10,502.82
15,563 1,556,261,010 92,748.25 it-sec toR
1 Information Services Network Ltd. B 109 10,920,003 10 18.90 206.39 2 BD Com Online Ltd. A 333 33,339,952 10 30.40 1,013.53 3 In Tech Online Ltd. A 193 19,272,810 10 16.60 319.93 4 Agny Systems Ltd. A 518 51,798,982 10 22.90 1,186.20 5 Deffodil Computers Ltd. A 499 49,912,262 10 14.00 698.77 6 Aamra Technologies A 554 55,369,395 10 35.90 1,987.76
2,206 220,613,404 5,412.58 tanneRy
1 Apex Tannery Ltd. A 152 15,240,000 10 124.60 1,898.90 2 Bata Shoe Ltd. A 137 13,680,000 10 690.00 9,439.20 3 Apex Adelchi Footwear Ltd. A 113 11,250,000 10 412.10 4,636.13
INDIVI
DUAL
MAR
KET C
APITA
L
IndividualMarket CapitalBased on DSE Review December 2013[cont....]
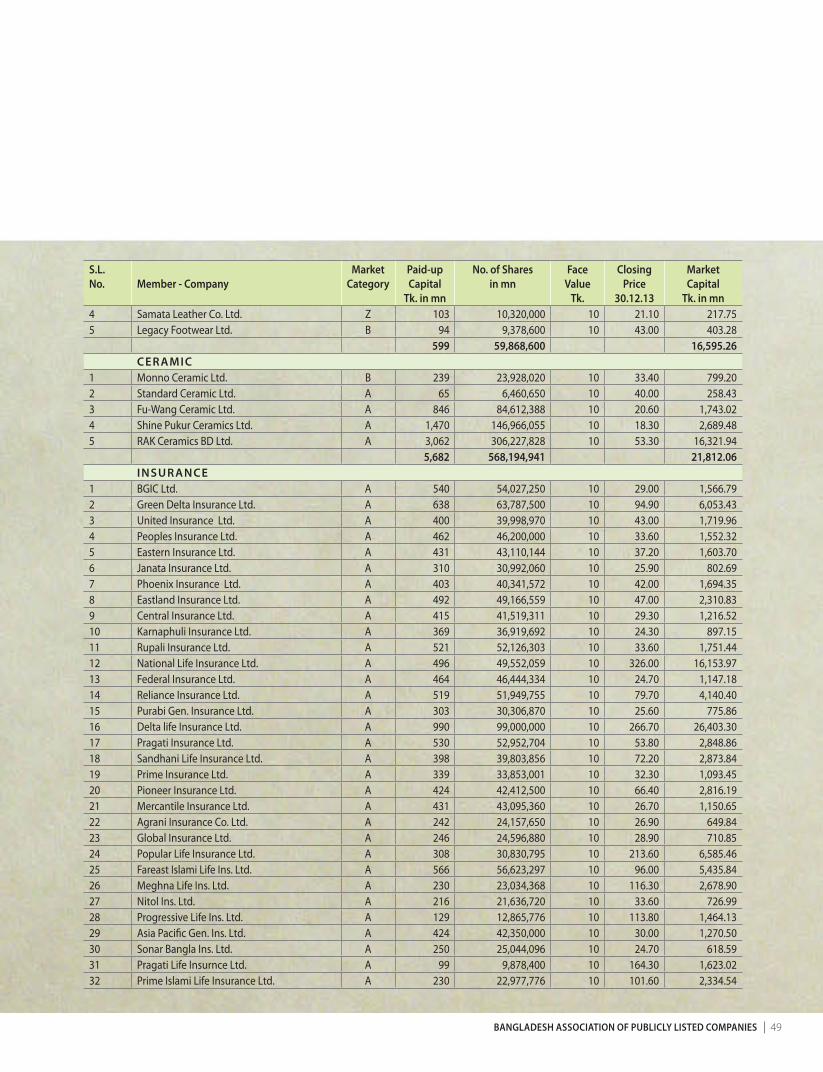
bangladesh association of publicly listed companies 49
s.l. no. member - company
marketcategory
paid-upcapital
tk. in mn
no. of sharesin mn
faceValue
tk.
closingprice
30.12.13
marketcapital
tk. in mn4 Samata Leather Co. Ltd. Z 103 10,320,000 10 21.10 217.75 5 Legacy Footwear Ltd. B 94 9,378,600 10 43.00 403.28
599 59,868,600 16,595.26 ceR amic
1 Monno Ceramic Ltd. B 239 23,928,020 10 33.40 799.20 2 Standard Ceramic Ltd. A 65 6,460,650 10 40.00 258.43 3 Fu-Wang Ceramic Ltd. A 846 84,612,388 10 20.60 1,743.02 4 Shine Pukur Ceramics Ltd. A 1,470 146,966,055 10 18.30 2,689.48 5 RAK Ceramics BD Ltd. A 3,062 306,227,828 10 53.30 16,321.94
5,682 568,194,941 21,812.06 insuR ance
1 BGIC Ltd. A 540 54,027,250 10 29.00 1,566.79 2 Green Delta Insurance Ltd. A 638 63,787,500 10 94.90 6,053.43 3 United Insurance Ltd. A 400 39,998,970 10 43.00 1,719.96 4 Peoples Insurance Ltd. A 462 46,200,000 10 33.60 1,552.32 5 Eastern Insurance Ltd. A 431 43,110,144 10 37.20 1,603.70 6 Janata Insurance Ltd. A 310 30,992,060 10 25.90 802.69 7 Phoenix Insurance Ltd. A 403 40,341,572 10 42.00 1,694.35 8 Eastland Insurance Ltd. A 492 49,166,559 10 47.00 2,310.83 9 Central Insurance Ltd. A 415 41,519,311 10 29.30 1,216.52 10 Karnaphuli Insurance Ltd. A 369 36,919,692 10 24.30 897.15 11 Rupali Insurance Ltd. A 521 52,126,303 10 33.60 1,751.44 12 National Life Insurance Ltd. A 496 49,552,059 10 326.00 16,153.97 13 Federal Insurance Ltd. A 464 46,444,334 10 24.70 1,147.18 14 Reliance Insurance Ltd. A 519 51,949,755 10 79.70 4,140.40 15 Purabi Gen. Insurance Ltd. A 303 30,306,870 10 25.60 775.86 16 Delta life Insurance Ltd. A 990 99,000,000 10 266.70 26,403.30 17 Pragati Insurance Ltd. A 530 52,952,704 10 53.80 2,848.86 18 Sandhani Life Insurance Ltd. A 398 39,803,856 10 72.20 2,873.84 19 Prime Insurance Ltd. A 339 33,853,001 10 32.30 1,093.45 20 Pioneer Insurance Ltd. A 424 42,412,500 10 66.40 2,816.19 21 Mercantile Insurance Ltd. A 431 43,095,360 10 26.70 1,150.65 22 Agrani Insurance Co. Ltd. A 242 24,157,650 10 26.90 649.84 23 Global Insurance Ltd. A 246 24,596,880 10 28.90 710.85 24 Popular Life Insurance Ltd. A 308 30,830,795 10 213.60 6,585.46 25 Fareast Islami Life Ins. Ltd. A 566 56,623,297 10 96.00 5,435.84 26 Meghna Life Ins. Ltd. A 230 23,034,368 10 116.30 2,678.90 27 Nitol Ins. Ltd. A 216 21,636,720 10 33.60 726.99 28 Progressive Life Ins. Ltd. A 129 12,865,776 10 113.80 1,464.13 29 Asia Pacific Gen. Ins. Ltd. A 424 42,350,000 10 30.00 1,270.50 30 Sonar Bangla Ins. Ltd. A 250 25,044,096 10 24.70 618.59 31 Pragati Life Insurnce Ltd. A 99 9,878,400 10 164.30 1,623.02 32 Prime Islami Life Insurance Ltd. A 230 22,977,776 10 101.60 2,334.54
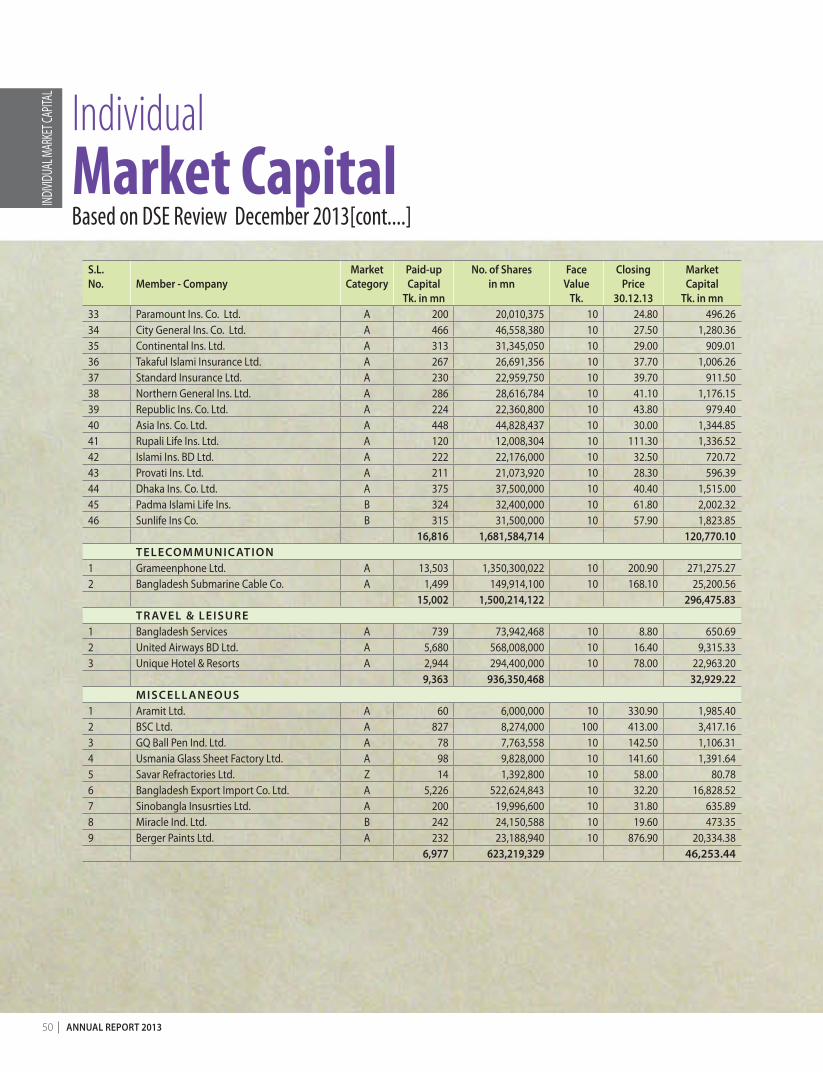
50 annual RepoRt 2013
s.l. no. member - company
marketcategory
paid-upcapital
tk. in mn
no. of sharesin mn
faceValue
tk.
closingprice
30.12.13
marketcapital
tk. in mn33 Paramount Ins. Co. Ltd. A 200 20,010,375 10 24.80 496.26 34 City General Ins. Co. Ltd. A 466 46,558,380 10 27.50 1,280.36 35 Continental Ins. Ltd. A 313 31,345,050 10 29.00 909.01 36 Takaful Islami Insurance Ltd. A 267 26,691,356 10 37.70 1,006.26 37 Standard Insurance Ltd. A 230 22,959,750 10 39.70 911.50 38 Northern General Ins. Ltd. A 286 28,616,784 10 41.10 1,176.15 39 Republic Ins. Co. Ltd. A 224 22,360,800 10 43.80 979.40 40 Asia Ins. Co. Ltd. A 448 44,828,437 10 30.00 1,344.85 41 Rupali Life Ins. Ltd. A 120 12,008,304 10 111.30 1,336.52 42 Islami Ins. BD Ltd. A 222 22,176,000 10 32.50 720.72 43 Provati Ins. Ltd. A 211 21,073,920 10 28.30 596.39 44 Dhaka Ins. Co. Ltd. A 375 37,500,000 10 40.40 1,515.00 45 Padma Islami Life Ins. B 324 32,400,000 10 61.80 2,002.32 46 Sunlife Ins Co. B 315 31,500,000 10 57.90 1,823.85
16,816 1,681,584,714 120,770.10 telecommunic ation
1 Grameenphone Ltd. A 13,503 1,350,300,022 10 200.90 271,275.27 2 Bangladesh Submarine Cable Co. A 1,499 149,914,100 10 168.10 25,200.56
15,002 1,500,214,122 296,475.83 tR aVel & leisuRe
1 Bangladesh Services A 739 73,942,468 10 8.80 650.69 2 United Airways BD Ltd. A 5,680 568,008,000 10 16.40 9,315.33 3 Unique Hotel & Resorts A 2,944 294,400,000 10 78.00 22,963.20
9,363 936,350,468 32,929.22 miscell aneous
1 Aramit Ltd. A 60 6,000,000 10 330.90 1,985.40 2 BSC Ltd. A 827 8,274,000 100 413.00 3,417.16 3 GQ Ball Pen Ind. Ltd. A 78 7,763,558 10 142.50 1,106.31 4 Usmania Glass Sheet Factory Ltd. A 98 9,828,000 10 141.60 1,391.64 5 Savar Refractories Ltd. Z 14 1,392,800 10 58.00 80.78 6 Bangladesh Export Import Co. Ltd. A 5,226 522,624,843 10 32.20 16,828.52 7 Sinobangla Insusrties Ltd. A 200 19,996,600 10 31.80 635.89 8 Miracle Ind. Ltd. B 242 24,150,588 10 19.60 473.35 9 Berger Paints Ltd. A 232 23,188,940 10 876.90 20,334.38
6,977 623,219,329 46,253.44
INDIVI
DUAL
MAR
KET C
APITA
L
IndividualMarket CapitalBased on DSE Review December 2013[cont....]
FINANCIALS
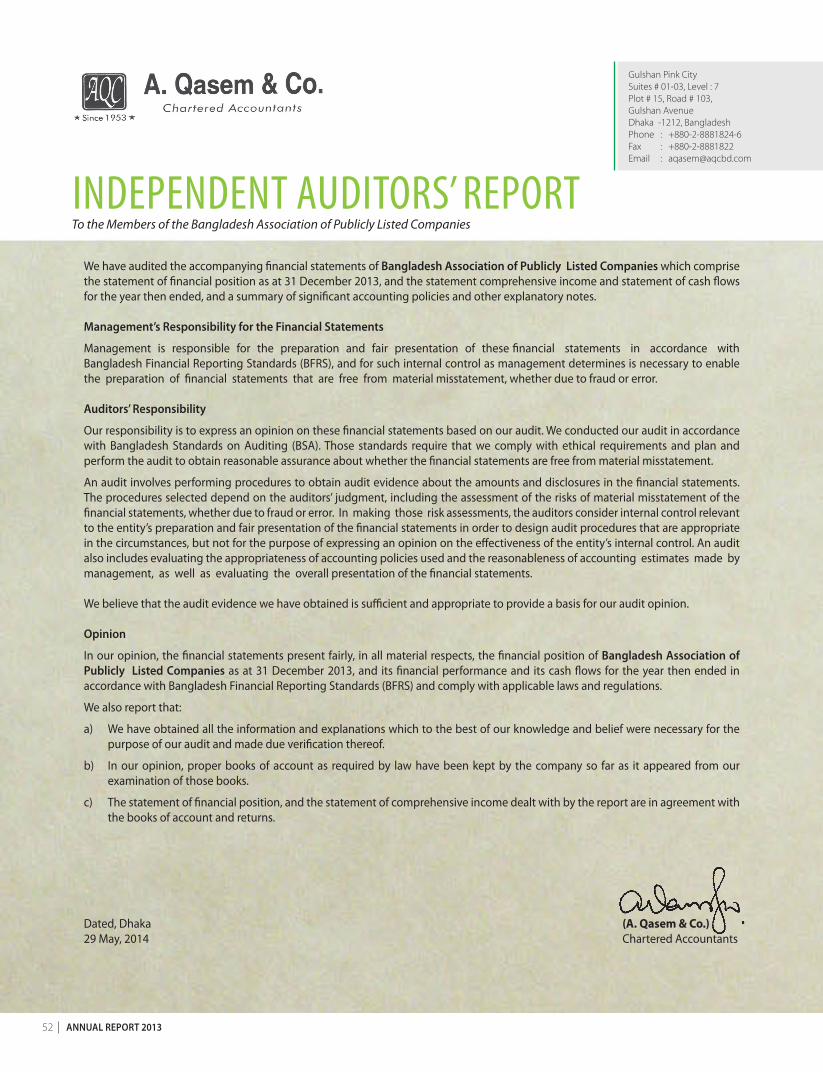
52 annual RepoRt 2013
We have audited the accompanying financial statements of bangladesh association of publicly listed companies which comprise the statement of financial position as at 31 December 2013, and the statement comprehensive income and statement of cash flows for the year then ended, and a summary of significant accounting policies and other explanatory notes.
management’s Responsibility for the financial statements
Management is responsible for the preparation and fair presentation of these financial statements in accordance with Bangladesh Financial Reporting Standards (BFRS), and for such internal control as management determines is necessary to enable the preparation of financial statements that are free from material misstatement, whether due to fraud or error.
auditors’ Responsibility
Our responsibility is to express an opinion on these financial statements based on our audit. We conducted our audit in accordance with Bangladesh Standards on Auditing (BSA). Those standards require that we comply with ethical requirements and plan and perform the audit to obtain reasonable assurance about whether the financial statements are free from material misstatement.
An audit involves performing procedures to obtain audit evidence about the amounts and disclosures in the financial statements. The procedures selected depend on the auditors’ judgment, including the assessment of the risks of material misstatement of the financial statements, whether due to fraud or error. In making those risk assessments, the auditors consider internal control relevant to the entity’s preparation and fair presentation of the financial statements in order to design audit procedures that are appropriate in the circumstances, but not for the purpose of expressing an opinion on the effectiveness of the entity’s internal control. An audit also includes evaluating the appropriateness of accounting policies used and the reasonableness of accounting estimates made by management, as well as evaluating the overall presentation of the financial statements. We believe that the audit evidence we have obtained is sufficient and appropriate to provide a basis for our audit opinion.
opinion
In our opinion, the financial statements present fairly, in all material respects, the financial position of bangladesh association of publicly listed companies as at 31 December 2013, and its financial performance and its cash flows for the year then ended in accordance with Bangladesh Financial Reporting Standards (BFRS) and comply with applicable laws and regulations.
We also report that:
a) We have obtained all the information and explanations which to the best of our knowledge and belief were necessary for the purpose of our audit and made due verification thereof.
b) In our opinion, proper books of account as required by law have been kept by the company so far as it appeared from our examination of those books.
c) The statement of financial position, and the statement of comprehensive income dealt with by the report are in agreement with the books of account and returns.
Dated, Dhaka (A. Qasem & Co.)29 May, 2014 Chartered Accountants
InDEPEnDEnT AuDITORS’ REPORTTo the Members of the Bangladesh Association of Publicly Listed Companies
Gulshan Pink CitySuites # 01-03, Level : 7Plot # 15, Road # 103,Gulshan AvenueDhaka -1212, BangladeshPhone : +880-2-8881824-6Fax : +880-2-8881822Email : [email protected]

bangladesh association of publicly listed companies 53
BAnGLADESH ASSOCIATIOn OF PuBLICLY LISTED COMPAnIES
STATEMEnT OF FInAnCIAL POSITIOn As at 31 December 2013
notes 31-dec-2013 31-dec-2012 taka taka
assets:
non-current assets 1,079,511 1,315,189
Property, plant and equipment 3.00 1,079,511 1,315,189
current assets 8,652,570 5,918,750
Special contributions receivable 4.00 88,500 88,500 Annual subscriptions receivable 5.00 2,737,500 2,037,500 Admission fee outstanding 6.00 20,000 20,000 Advance against office space - 1,000,000 Accounts receivable against BICM 7.00 71,875 71,875 Prepaid insurance 8.00 4,344 4,344 Advance to IOM 16.06 2,000 - Cash & cash equivalents 9.00 5,728,351 2,696,531
total assets 9,732,081 7,233,939
fund and liabilities
fund account 9,665,990 7,146,651
Fund account 10.00 9,665,990 7,146,651
current liabilities 66,091 87,288
Liabilities for expenses 11.00 23,841 45,038 Advance received against special contribution 12.00 12,000 12,000 Advance received against annual subscription 13.00 30,000 30,000 Fund for BICM of SEC 14.00 250 250
total fund and liabilities 9,732,081 7,233,939
The annexed notes 1 to 17 form an integral part of these financial statements.
secretary general Vice-president president
Signed in terms of our report of even date annexed.
Dated: Dhaka (a. Qasem & co.) 29 May 2014 Chartered Accountants
FIN
ANCI
ALS
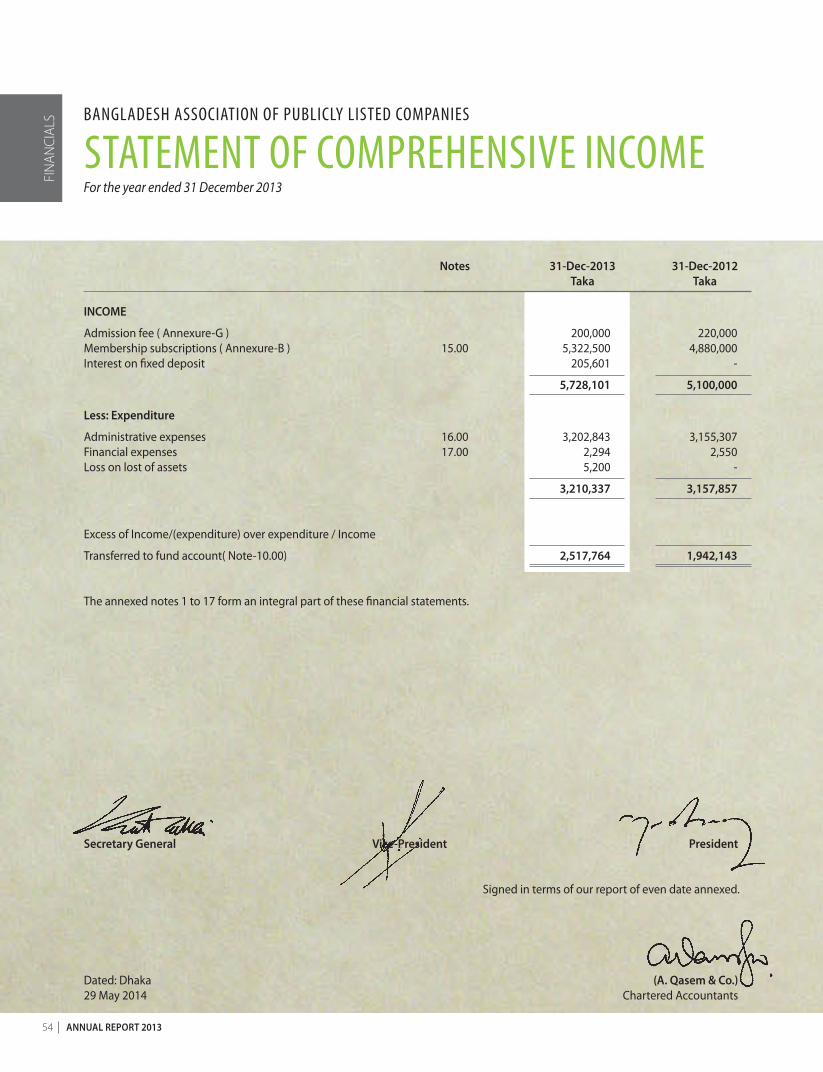
54 annual RepoRt 2013
notes 31-dec-2013 31-dec-2012 taka taka
income
Admission fee ( Annexure-G ) 200,000 220,000 Membership subscriptions ( Annexure-B ) 15.00 5,322,500 4,880,000 Interest on fixed deposit 205,601 -
5,728,101 5,100,000
less: expenditure
Administrative expenses 16.00 3,202,843 3,155,307 Financial expenses 17.00 2,294 2,550 Loss on lost of assets 5,200 -
3,210,337 3,157,857
Excess of Income/(expenditure) over expenditure / Income
Transferred to fund account( Note-10.00) 2,517,764 1,942,143
The annexed notes 1 to 17 form an integral part of these financial statements.
secretary general Vice-president president
Signed in terms of our report of even date annexed.
Dated: Dhaka (a. Qasem & co.) 29 May 2014 Chartered Accountants
BAnGLADESH ASSOCIATIOn OF PuBLICLY LISTED COMPAnIES
STATEMEnT OF COMPREHEnSIvE InCOMEFor the year ended 31 December 2013
FIN
ANCI
ALS
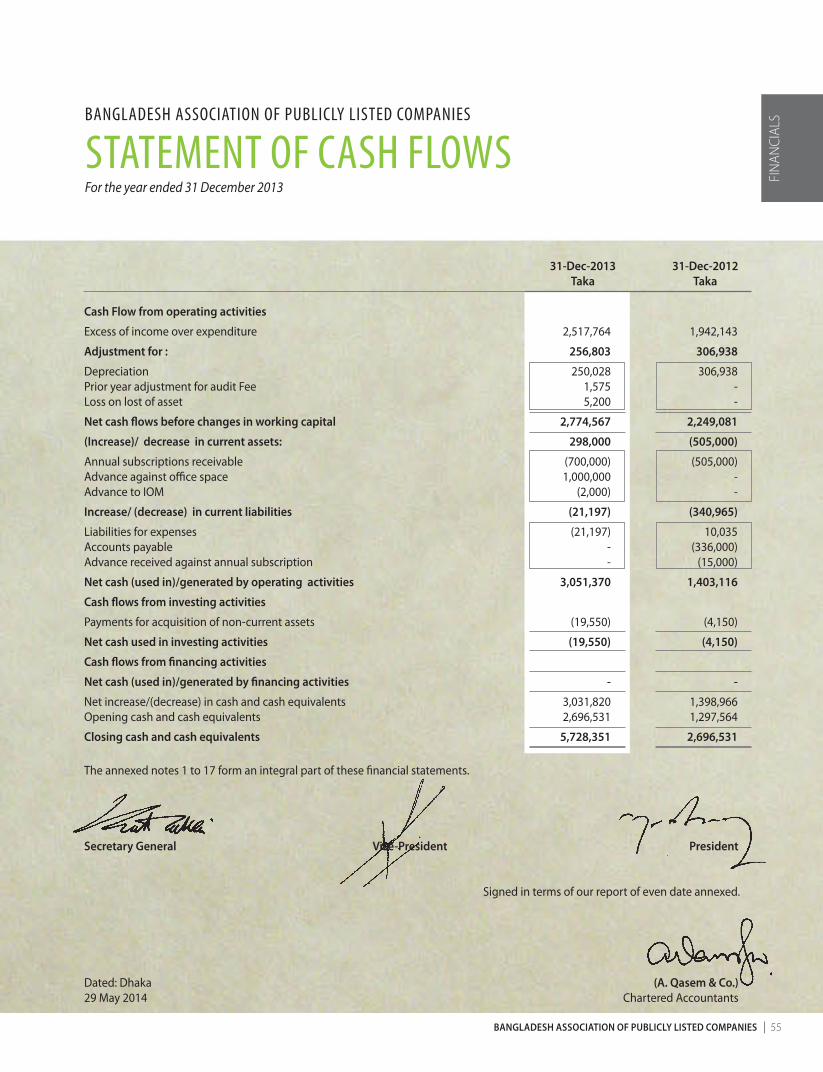
bangladesh association of publicly listed companies 55
31-dec-2013 31-dec-2012 taka taka
cash flow from operating activities
Excess of income over expenditure 2,517,764 1,942,143
adjustment for : 256,803 306,938
Depreciation 250,028 306,938 Prior year adjustment for audit Fee 1,575 -Loss on lost of asset 5,200 -
net cash flows before changes in working capital 2,774,567 2,249,081
(increase)/ decrease in current assets: 298,000 (505,000)
Annual subscriptions receivable (700,000) (505,000)Advance against office space 1,000,000 - Advance to IOM (2,000) -
increase/ (decrease) in current liabilities (21,197) (340,965)
Liabilities for expenses (21,197) 10,035 Accounts payable - (336,000)Advance received against annual subscription - (15,000)
net cash (used in)/generated by operating activities 3,051,370 1,403,116
cash flows from investing activities
Payments for acquisition of non-current assets (19,550) (4,150)
net cash used in investing activities (19,550) (4,150)
cash flows from financing activities
net cash (used in)/generated by financing activities - -
Net increase/(decrease) in cash and cash equivalents 3,031,820 1,398,966 Opening cash and cash equivalents 2,696,531 1,297,564
closing cash and cash equivalents 5,728,351 2,696,531
The annexed notes 1 to 17 form an integral part of these financial statements.
secretary general Vice-president president
Signed in terms of our report of even date annexed.
Dated: Dhaka (a. Qasem & co.) 29 May 2014 Chartered Accountants
BAnGLADESH ASSOCIATIOn OF PuBLICLY LISTED COMPAnIES
STATEMEnT OF CASH FLOwSFor the year ended 31 December 2013
FIN
ANCI
ALS

56 annual RepoRt 2013
1.00 bacKgRound of the association The Association was incorporated on August 30, 1999 as a Company Limited by guarantee under section 28 of the
Companies Act, 1994. The members of the Association are the publicly listed companies of the country. There are two classes of members i.e., Ordinary Member and Associate Member. The main objective of the Association is to promote, protect and safeguard the interest of the Listed Companies in Bangladesh. The income or property of the Association shall not be paid or transferred directly or indirectly by way of profit or dividend to the members of the Association.
2.00 summaRy of significant accounting policies 2.01 accounting policy The financial statements of the Association have been prepared on going concern basis under historical cost
convention following accrual basis of accounting except for cash flow information in accordance with Bangladesh Accounting Standards (BAS).
2.02 property plant and equipment Property plant and equipment are shown at cost less accumulated depreciation.
2.03 depreciation Depreciation is charged using reducing balance method at the rates varying from 10% to 20% depending on the
nature and estimated useful lives of the property plant and equipment. Calculation of depreciation on addition to property plant and equipment is taken from the date of acquisition of the property plant and equipment.
2.04 income The main income of the Association is admission fee and membership subscription, which is accounted for on due
basis.
2.05 Reporting period The reporting period of the Association covers twelve months from 01 January 2013 to 31 December 2013.
2.06 changes in accounting policies The Association has applied Bangladesh Accounting Standard (BAS) 1 (Revised) from the year of 2011. This BAS has
had no material impact on the financial position of the Association.
2.07 Responsibility of the preparation and presentation of the financial statements The Executive Committee of the Association is responsible for the preparation and presentation of these financial
statements.
2.08 investment in fixed deposit receipts (fdR) The company has the positive intent and ability to hold FDR to maturity, and as such financial assets are classified as
held to maturity. Held-to-maturity financial assets are recognised initially at fair value plus any directly attributable transaction costs. Subsequent to initial recognition, held-to-maturity financial assets are measured at amortised cost using the effective interest method, less any impairment losses.
2.09 cash and cash equivalents Cash and cash equivalents comprise cash and bank balances. Bank overdrafts that are repayable on demand form an
integral part of the company’s cash management are included as a component of cash and cash equivalents for the purpose only of the statement of cash flows.
2.10 general i. The financial statements are expressed in Bangladesh Taka and rounded off to the nearest integer. ii. Previous year’s figures have been rearranged wherever considered necessary to conform to current year’s
presentation.
BAnGLADESH ASSOCIATIOn OF PuBLICLY LISTED COMPAnIES
nOTES TO THE FInAnCIAL STATEMEnTSFor the year ended 31 December 2013
FIN
ANCI
ALS
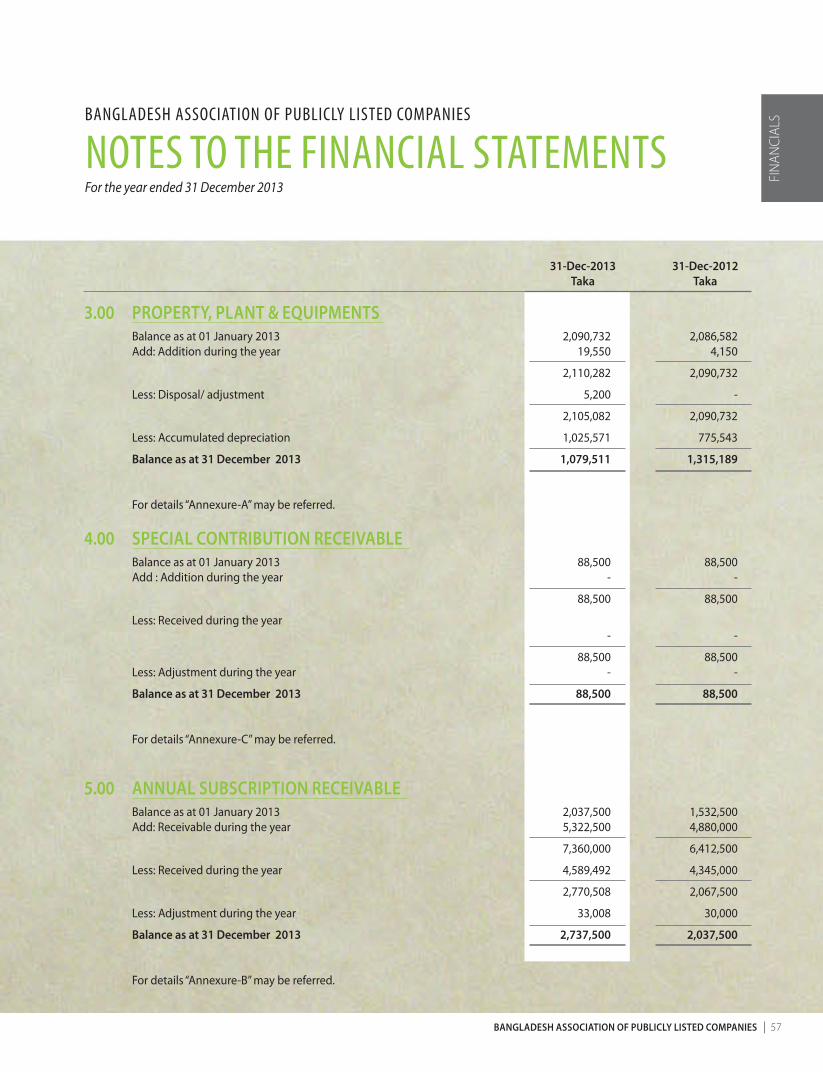
bangladesh association of publicly listed companies 57
31-dec-2013 31-dec-2012 taka taka
3.00 pRopeRty, plant & eQuipments Balance as at 01 January 2013 2,090,732 2,086,582 Add: Addition during the year 19,550 4,150
2,110,282 2,090,732
Less: Disposal/ adjustment 5,200 -
2,105,082 2,090,732
Less: Accumulated depreciation 1,025,571 775,543
balance as at 31 december 2013 1,079,511 1,315,189
For details “Annexure-A” may be referred.
4.00 special contRibution ReceiVable Balance as at 01 January 2013 88,500 88,500 Add : Addition during the year - -
88,500 88,500
Less: Received during the year - -
88,500 88,500 Less: Adjustment during the year - -
balance as at 31 december 2013 88,500 88,500
For details “Annexure-C” may be referred.
5.00 annual subscRiption ReceiVable Balance as at 01 January 2013 2,037,500 1,532,500 Add: Receivable during the year 5,322,500 4,880,000
7,360,000 6,412,500
Less: Received during the year 4,589,492 4,345,000
2,770,508 2,067,500
Less: Adjustment during the year 33,008 30,000
balance as at 31 december 2013 2,737,500 2,037,500
For details “Annexure-B” may be referred.
BAnGLADESH ASSOCIATIOn OF PuBLICLY LISTED COMPAnIES
nOTES TO THE FInAnCIAL STATEMEnTSFor the year ended 31 December 2013
FIN
ANCI
ALS
58 annual RepoRt 2013
31-dec-2013 31-dec-2012 taka taka
6.00 admission fees ReceiVable Mona Food Industries Limited 20,000 20,000
20,000 20,000
For details “Annexure-G” may be referred.
7.00 accounts ReceiVable against bicm Balance as at 01 January 2013 71,875 71,875 Less. Received during the year - -
71,875 71,875
Less: Adjustment during the year - -
balance as at 31 december 2013 71,875 71,875
For details “Annexure-E” may be referred
8.00 pRepaid insuRance Balance as at 01 January 2013 4,344 4,344 Add: Paid during the Year 24,022 24,022
28,366 28,366
Less : Current year expenses 24,022 24,022
balance as at 31 december 2013 4,344 4,344
9.00 cash and cash eQuiValents Cash in hand 1,257 708 Cash at bank 1,521,493 2,695,823 (Mutual Trust Bank Limited., Panthapath Branch Account No. 00030210002224) Fixed deposit receipt (FDR) for three Months 4,205,601 -
5,728,351 2,696,531
10.00 fund account Balance as at 01 January 2013 7,146,651 5,234,508 Add: Excess of income over expenditure 2,517,764 1,942,143
9,664,415 7,176,651
Add: Prior year adjustment 1575 (30,000)
balance as at 31 december 2013 9,665,990 7,146,651
FIN
ANCI
ALS BAnGLADESH ASSOCIATIOn OF PuBLICLY LISTED COMPAnIES
nOTES TO THE FInAnCIAL STATEMEnTSFor the year ended 31 December 2013
bangladesh association of publicly listed companies 59
31-dec-2013 31-dec-2012 taka taka
11.00 liabilities foR eXpenses Audit Fee 17,250 18,825 Newspaper Bill 1,450 1,268 Telephone Bill 4,442 1,945 Electricity Bill 699 - Consultancy Fee - 23,000
23,841 45,038
12.00 adVance ReceiVed against special contRibution Advance special contribution (Note-12.01) 12,000 12,000
12,000 12,000
12.01 Advance special contribution
Bangas Limited 6,000 6,000 Alpha Tobacco Mfg Co Ltd. 6,000 6,000
12,000 12,000
For details “Annexure-D” may be referred.
13.00 adVance ReceiVed against annual subscRiption Balance as at 01 January 2013 30,000 -
add: Beacon Pharmaceuticals Ltd. 30,000 -
Brac Bank Ltd. - 15,000 Rangpur Dairy & Food Products - 15,000
60,000 30,000
less: Adjustment during the year 30,000 -
balance as at 31 december 2013 30,000 30,000
For details “Annexure-F” may be referred.
14.00 fund foR bicm of sec According to the requirement of SEC for the establishment of BICM (Bangladesh Institute of Capital Market) Tk. 5,00,000 is
required for payment to SEC and BAPLC will manage the fund for BICM from its present members (87) as equal contribution that means Tk. 5,00,250 (as equal round figure of contribution).
15.00 membeRship subscRiption Each and every Member has to pay annual subscription as per following rates prescribed in the Articles of Association:
FIN
ANCI
ALSBAnGLADESH ASSOCIATIOn OF PuBLICLY LISTED COMPAnIES
nOTES TO THE FInAnCIAL STATEMEnTSFor the year ended 31 December 2013
60 annual RepoRt 2013
31-dec-2013 31-dec-2012 taka taka
Amount in Taka Having paid up capital upto Tk. 3 crore 5,000 Per year Having paid up capital upto Tk. 10 crore 15,000 Per year Having paid up capital above Tk. 10 crore 30,000 Per year
The members joining during the second half of any calendar year is required to pay 50% of the annual subscription. The detailed amount is, however, shown as follows: 158Members @ Tk. 30,000 4,740,000 4,140,000 05 Members @ Tk. 15000 (2nd half Membership) 75,000 150,000 27 Members @ Tk. 15,000 405,000 495,000 01 Members @ Tk. 7500 (2nd half Membership) 7,500 - 19 Members @ Tk. 5,000 95,000 95,000 5,322,500 4,880,000
16.00 administRatiVe eXpenses Salary & allowances 1,318,400 1,113,250 Office stationery 165,195 150,086 Entertainment 6,120 6,175 Conveyance 48,290 50,370 Audit fee 17,250 17,250 Consultancy fee (Note-16.01) 30,000 11,500 Fuel & lubricants 223,639 210,278 Printing 227,250 218,475 Postage & courier 44,699 43,425 Computer maintenance 10,200 17,900 News paper bill (Note-16.02) 55,190 14,565 Telephone bill (Note-16.03) 16,005 44,679 Electricity bill (Note-16.04) 6,464 5,122 Office rent(Note-16.05) 420,000 420,000 Office maintenance 54,418 40,312 AGM expenses 70,163 47,149 Advertisement 7,838 - Car maintenance 90,506 63,374 Photocopier maintenance (Note-16.06) 5,800 - T.D.S 3,008 - Crockeries 10,000 - Subscription to FBCCI 25,000 25,000 Insurance premium 24,022 24,022 Internet bill 26,000 26,000 Gas oven 4,100 - Telephone maintenance 4,000 4,300 FBCCI election - 12,500 ECM expenses 22,628 29,707 Annual return expenses - 147,342 Business award expenses - 63,868 Photographs & videos 11,000 15,800 Miscellaneous 5,630 25,920 Depreciation (Annexure-A) 250,028 306,938 3,202,843 3,155,307
FIN
ANCI
ALS BAnGLADESH ASSOCIATIOn OF PuBLICLY LISTED COMPAnIES
nOTES TO THE FInAnCIAL STATEMEnTSFor the year ended 31 December 2013
bangladesh association of publicly listed companies 61
31-dec-2013 31-dec-2012 taka taka
16.01 consultancy fee Paid during the year 53,000 11,500 Add: Current year due - 11,500 53,000 23,000 Less : Last year due 23,000 -
30,000 23,000
16.02 neWspapeR bill Paid during the year 15,823 14,427 Add: Current year due 1,450 1,268
17,273 15,695
Less : Last year due 1,268 1,130
16,005 14,565
16.03 telephone bill Paid during the year 52,693 47,857 Add: Current year due 4,442 1,945
57,135 49,802
Less : Last year due 1,945 5,123
55,190 44,679
16.04 electRicity bill Paid during the year 5,765 5,122 Add: Current year due 699 -
6,464 5,122 Less : Last year due - -
6,464 5,122
16.05 office Rent Paid during the year 420,000 420,000 Add: Current year due - - 420,000 420,000 Less : Last year due - - 420,000 420,000
FIN
ANCI
ALSBAnGLADESH ASSOCIATIOn OF PuBLICLY LISTED COMPAnIES
nOTES TO THE FInAnCIAL STATEMEnTSFor the year ended 31 December 2013
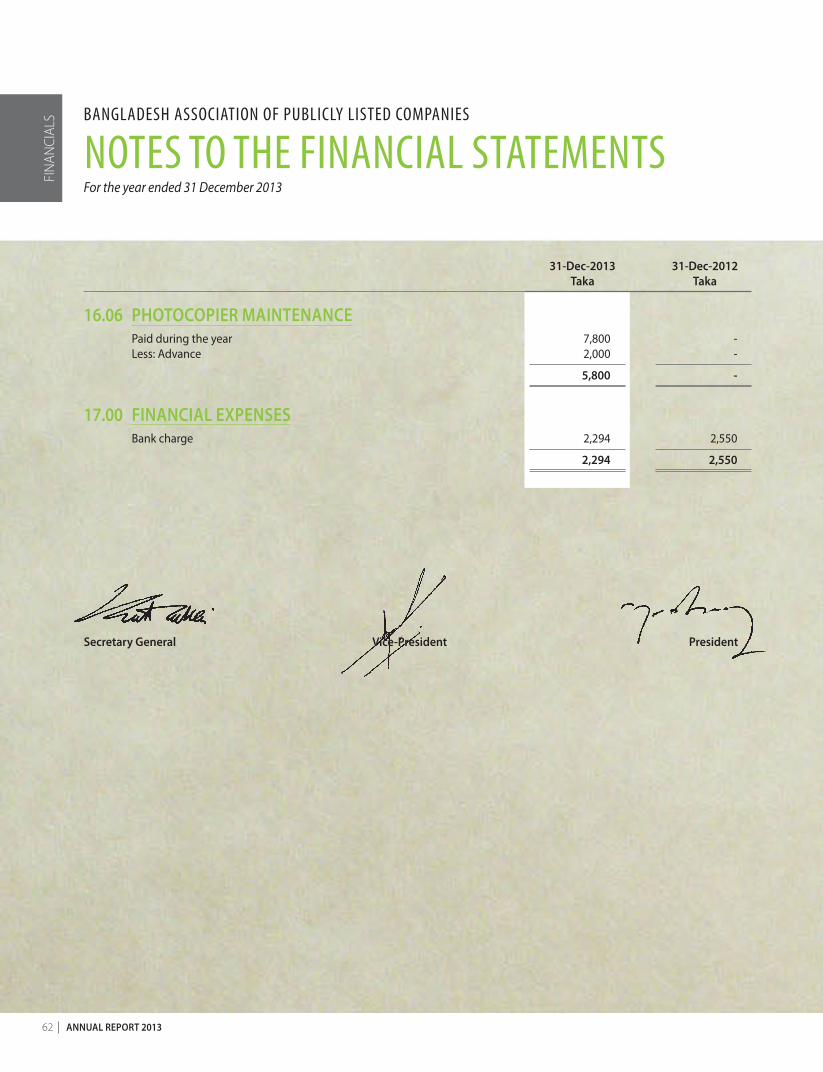
62 annual RepoRt 2013
31-dec-2013 31-dec-2012 taka taka
16.06 photocopieR maintenance Paid during the year 7,800 - Less: Advance 2,000 -
5,800 -
17.00 financial eXpenses Bank charge 2,294 2,550
2,294 2,550
secretary general Vice-president president
FIN
ANCI
ALS BAnGLADESH ASSOCIATIOn OF PuBLICLY LISTED COMPAnIES
nOTES TO THE FInAnCIAL STATEMEnTSFor the year ended 31 December 2013
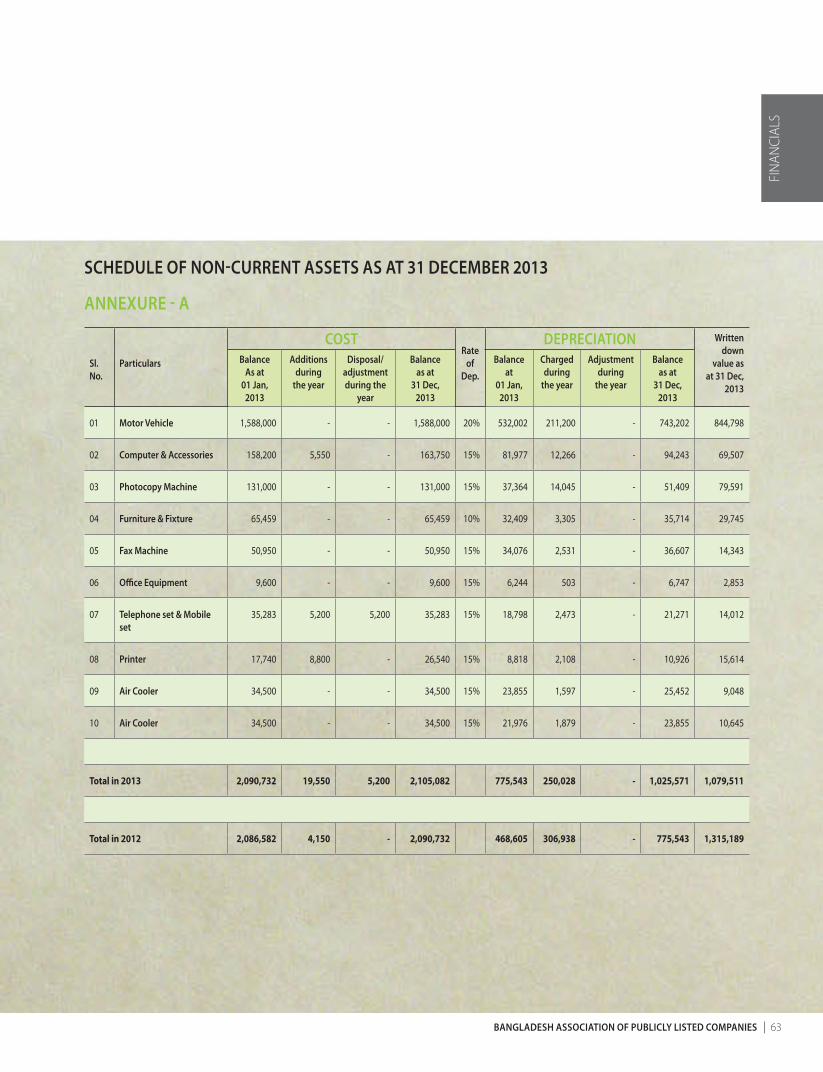
bangladesh association of publicly listed companies 63
schedule of non-cuRRent assets as at 31 decembeR 2013
anneXuRe - a
sl.no.
particulars
costRate
ofdep.
depReciation Written down
value as at 31 dec,
2013
balanceas at
01 Jan, 2013
additionsduring
the year
disposal/ adjustment during the
year
balanceas at
31 dec, 2013
balance at
01 Jan, 2013
chargedduring
the year
adjustmentduring
the year
balanceas at
31 dec, 2013
01 motor Vehicle 1,588,000 - - 1,588,000 20% 532,002 211,200 - 743,202 844,798
02 computer & accessories 158,200 5,550 - 163,750 15% 81,977 12,266 - 94,243 69,507
03 photocopy machine 131,000 - - 131,000 15% 37,364 14,045 - 51,409 79,591
04 furniture & fixture 65,459 - - 65,459 10% 32,409 3,305 - 35,714 29,745
05 fax machine 50,950 - - 50,950 15% 34,076 2,531 - 36,607 14,343
06 office equipment 9,600 - - 9,600 15% 6,244 503 - 6,747 2,853
07 telephone set & mobile set
35,283 5,200 5,200 35,283 15% 18,798 2,473 - 21,271 14,012
08 printer 17,740 8,800 - 26,540 15% 8,818 2,108 - 10,926 15,614
09 air cooler 34,500 - - 34,500 15% 23,855 1,597 - 25,452 9,048
10 air cooler 34,500 - - 34,500 15% 21,976 1,879 - 23,855 10,645
Total in 2013 2,090,732 19,550 5,200 2,105,082 775,543 250,028 - 1,025,571 1,079,511
Total in 2012 2,086,582 4,150 - 2,090,732 468,605 306,938 - 775,543 1,315,189
FIN
ANCI
ALS
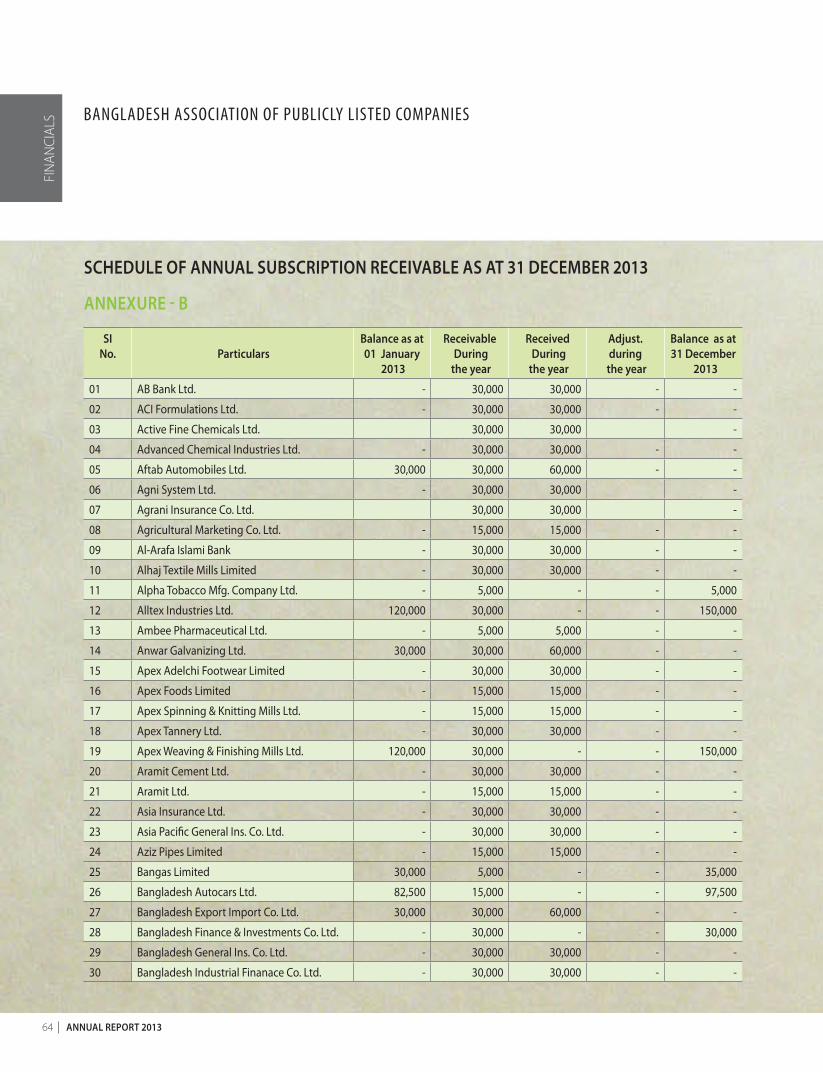
64 annual RepoRt 2013
schedule of annual subscRiption ReceiVable as at 31 decembeR 2013
anneXuRe - b
si no. particulars
balance as at 01 January
2013
Receivable during
the year
Received during
the year
adjust.during
the year
balance as at 31 december
2013
01 AB Bank Ltd. - 30,000 30,000 - -
02 ACI Formulations Ltd. - 30,000 30,000 - -
03 Active Fine Chemicals Ltd. 30,000 30,000 -
04 Advanced Chemical Industries Ltd. - 30,000 30,000 - -
05 Aftab Automobiles Ltd. 30,000 30,000 60,000 - -
06 Agni System Ltd. - 30,000 30,000 -
07 Agrani Insurance Co. Ltd. 30,000 30,000 -
08 Agricultural Marketing Co. Ltd. - 15,000 15,000 - -
09 Al-Arafa Islami Bank - 30,000 30,000 - -
10 Alhaj Textile Mills Limited - 30,000 30,000 - -
11 Alpha Tobacco Mfg. Company Ltd. - 5,000 - - 5,000
12 Alltex Industries Ltd. 120,000 30,000 - - 150,000
13 Ambee Pharmaceutical Ltd. - 5,000 5,000 - -
14 Anwar Galvanizing Ltd. 30,000 30,000 60,000 - -
15 Apex Adelchi Footwear Limited - 30,000 30,000 - -
16 Apex Foods Limited - 15,000 15,000 - -
17 Apex Spinning & Knitting Mills Ltd. - 15,000 15,000 - -
18 Apex Tannery Ltd. - 30,000 30,000 - -
19 Apex Weaving & Finishing Mills Ltd. 120,000 30,000 - - 150,000
20 Aramit Cement Ltd. - 30,000 30,000 - -
21 Aramit Ltd. - 15,000 15,000 - -
22 Asia Insurance Ltd. - 30,000 30,000 - -
23 Asia Pacific General Ins. Co. Ltd. - 30,000 30,000 - -
24 Aziz Pipes Limited - 15,000 15,000 - -
25 Bangas Limited 30,000 5,000 - - 35,000
26 Bangladesh Autocars Ltd. 82,500 15,000 - - 97,500
27 Bangladesh Export Import Co. Ltd. 30,000 30,000 60,000 - -
28 Bangladesh Finance & Investments Co. Ltd. - 30,000 - - 30,000
29 Bangladesh General Ins. Co. Ltd. - 30,000 30,000 - -
30 Bangladesh Industrial Finanace Co. Ltd. - 30,000 30,000 - -
FIN
ANCI
ALS BAnGLADESH ASSOCIATIOn OF PuBLICLY LISTED COMPAnIES
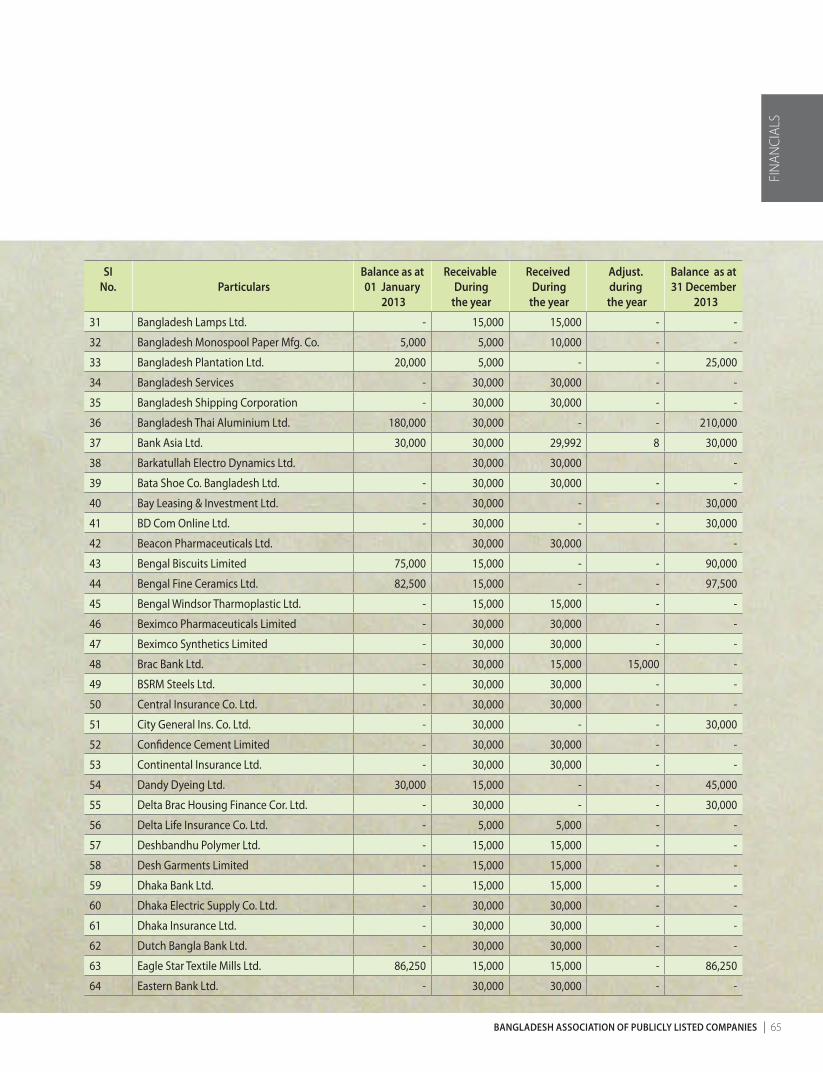
bangladesh association of publicly listed companies 65
si no. particulars
balance as at 01 January
2013
Receivable during
the year
Received during
the year
adjust.during
the year
balance as at 31 december
2013
31 Bangladesh Lamps Ltd. - 15,000 15,000 - -
32 Bangladesh Monospool Paper Mfg. Co. 5,000 5,000 10,000 - -
33 Bangladesh Plantation Ltd. 20,000 5,000 - - 25,000
34 Bangladesh Services - 30,000 30,000 - -
35 Bangladesh Shipping Corporation - 30,000 30,000 - -
36 Bangladesh Thai Aluminium Ltd. 180,000 30,000 - - 210,000
37 Bank Asia Ltd. 30,000 30,000 29,992 8 30,000
38 Barkatullah Electro Dynamics Ltd. 30,000 30,000 -
39 Bata Shoe Co. Bangladesh Ltd. - 30,000 30,000 - -
40 Bay Leasing & Investment Ltd. - 30,000 - - 30,000
41 BD Com Online Ltd. - 30,000 - - 30,000
42 Beacon Pharmaceuticals Ltd. 30,000 30,000 -
43 Bengal Biscuits Limited 75,000 15,000 - - 90,000
44 Bengal Fine Ceramics Ltd. 82,500 15,000 - - 97,500
45 Bengal Windsor Tharmoplastic Ltd. - 15,000 15,000 - -
46 Beximco Pharmaceuticals Limited - 30,000 30,000 - -
47 Beximco Synthetics Limited - 30,000 30,000 - -
48 Brac Bank Ltd. - 30,000 15,000 15,000 -
49 BSRM Steels Ltd. - 30,000 30,000 - -
50 Central Insurance Co. Ltd. - 30,000 30,000 - -
51 City General Ins. Co. Ltd. - 30,000 - - 30,000
52 Confidence Cement Limited - 30,000 30,000 - -
53 Continental Insurance Ltd. - 30,000 30,000 - -
54 Dandy Dyeing Ltd. 30,000 15,000 - - 45,000
55 Delta Brac Housing Finance Cor. Ltd. - 30,000 - - 30,000
56 Delta Life Insurance Co. Ltd. - 5,000 5,000 - -
57 Deshbandhu Polymer Ltd. - 15,000 15,000 - -
58 Desh Garments Limited - 15,000 15,000 - -
59 Dhaka Bank Ltd. - 15,000 15,000 - -
60 Dhaka Electric Supply Co. Ltd. - 30,000 30,000 - -
61 Dhaka Insurance Ltd. - 30,000 30,000 - -
62 Dutch Bangla Bank Ltd. - 30,000 30,000 - -
63 Eagle Star Textile Mills Ltd. 86,250 15,000 15,000 - 86,250
64 Eastern Bank Ltd. - 30,000 30,000 - -
FIN
ANCI
ALS

66 annual RepoRt 2013
si no. particulars
balance as at 01 January
2013
Receivable during
the year
Received during
the year
adjust.during
the year
balance as at 31 december
2013
65 Eastern Housing Limited - 30,000 30,000 - -
66 Eastern Insurance Co. Ltd. 165,000 30,000 - - 195,000
67 Eastern Lubricants Blenders Ltd. - 5,000 5,000 - -
68 Eastland Insurance Co. Ltd. - 30,000 30,000 - -
69 Envoy Textiles Ltd. - 30,000 30,000 - -
70 Excelsior Shoes Ltd. 60,000 30,000 - - 90,000
71 Export Imoprt Bank of Bangladesh Ltd. - 30,000 30,000 - -
72 Fareast Islami Life Ins. Co. Ltd. - 30,000 30,000 - -
73 Federal Insurance Co. Ltd. - 30,000 - - 30,000
74 FAS Finance & Investment Ltd. - 30,000 30,000 - -
75 First Lease Finance & Investment Ltd. 30,000 - - 30,000
76 First Security Islamic Bank - 30,000 30,000 - -
77 Fu-Wang Ceramic Ltd. - 30,000 30,000 - -
78 GBB Power Ltd. - 30,000 30,000 - -
79 Gemini Sea Food Ltd. - 5,000 5,000 - -
80 GlaxoSmithKline Bangladesh Ltd. 30,000 30,000 - -
81 Global Insurance Ltd. - 30,000 30,000 - -
82 Golden Son Ltd. - 30,000 30,000 - -
83 GQ Ball Pen Industries Ltd. - 15,000 15,000 - -
84 Grameenphone Ltd. - 30,000 30,000 - -
85 Green Delta Insurance Co. Limited - 30,000 30,000 - -
86 GSP Finance Co. (BD) Ltd. 30,000 27,000 3,000 -
87 GULF Foods Ltd. 30,000 15,000 15,000 - 30,000
88 Himadri Ltd. - 5,000 5,000 - -
89 ICB (Investment Corporation of BD.) - 30,000 30,000 - -
90 ICB Islamic Bank Ltd. - 30,000 30,000 - -
91 IDLC Finance Ltd. - 30,000 30,000 - -
92 IFIC Bank Limited - 30,000 30,000 - -
93 Information Services Network Ltd. - 30,000 30,000 - -
94 InTech Online Ltd. 30,000 30,000 - - 60,000
95 International Leasing & Fin. Services Ltd. - 30,000 30,000 - -
96 Islami Bank Bangladesh Ltd. - 30,000 30,000 - -
97 Islamic Finance and Investment Ltd. - 30,000 30,000 - -
98 Islami Insurance Bangladesh Ltd. - 30,000 30,000 - -
FIN
ANCI
ALS BAnGLADESH ASSOCIATIOn OF PuBLICLY LISTED COMPAnIES
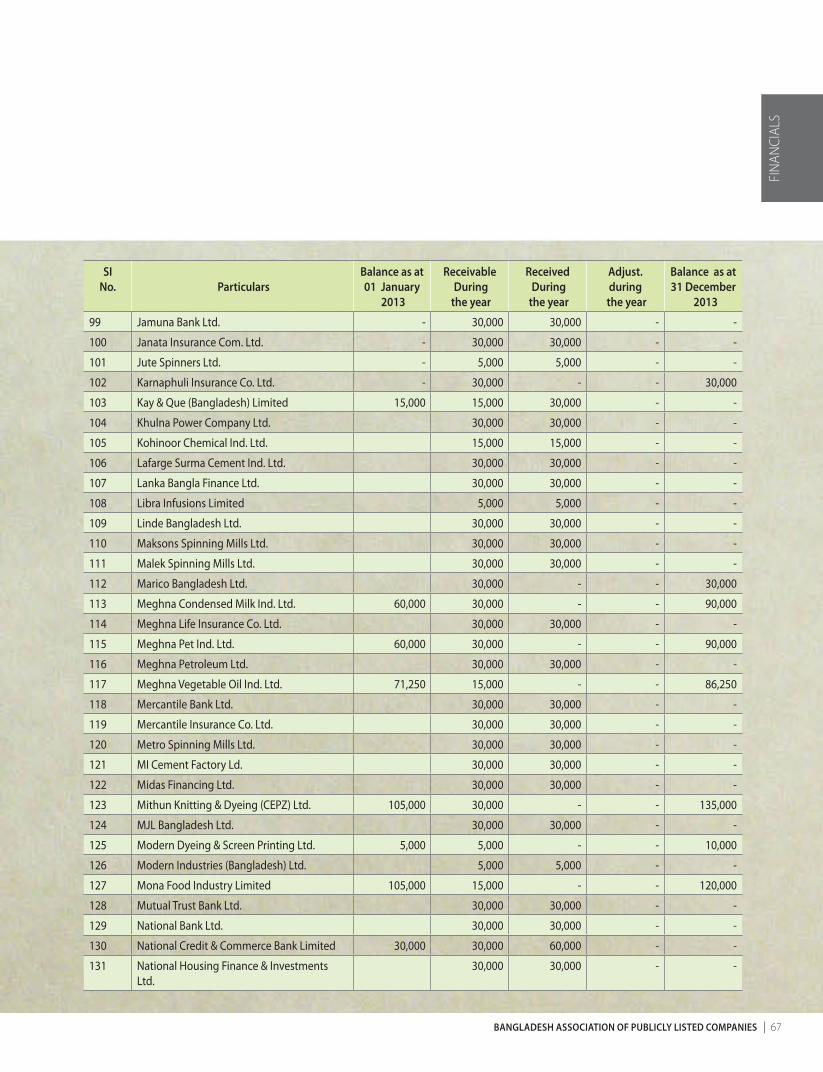
bangladesh association of publicly listed companies 67
si no. particulars
balance as at 01 January
2013
Receivable during
the year
Received during
the year
adjust.during
the year
balance as at 31 december
2013
99 Jamuna Bank Ltd. - 30,000 30,000 - -
100 Janata Insurance Com. Ltd. - 30,000 30,000 - -
101 Jute Spinners Ltd. - 5,000 5,000 - -
102 Karnaphuli Insurance Co. Ltd. - 30,000 - - 30,000
103 Kay & Que (Bangladesh) Limited 15,000 15,000 30,000 - -
104 Khulna Power Company Ltd. 30,000 30,000 - -
105 Kohinoor Chemical Ind. Ltd. 15,000 15,000 - -
106 Lafarge Surma Cement Ind. Ltd. 30,000 30,000 - -
107 Lanka Bangla Finance Ltd. 30,000 30,000 - -
108 Libra Infusions Limited 5,000 5,000 - -
109 Linde Bangladesh Ltd. 30,000 30,000 - -
110 Maksons Spinning Mills Ltd. 30,000 30,000 - -
111 Malek Spinning Mills Ltd. 30,000 30,000 - -
112 Marico Bangladesh Ltd. 30,000 - - 30,000
113 Meghna Condensed Milk Ind. Ltd. 60,000 30,000 - - 90,000
114 Meghna Life Insurance Co. Ltd. 30,000 30,000 - -
115 Meghna Pet Ind. Ltd. 60,000 30,000 - - 90,000
116 Meghna Petroleum Ltd. 30,000 30,000 - -
117 Meghna Vegetable Oil Ind. Ltd. 71,250 15,000 - - 86,250
118 Mercantile Bank Ltd. 30,000 30,000 - -
119 Mercantile Insurance Co. Ltd. 30,000 30,000 - -
120 Metro Spinning Mills Ltd. 30,000 30,000 - -
121 MI Cement Factory Ld. 30,000 30,000 - -
122 Midas Financing Ltd. 30,000 30,000 - -
123 Mithun Knitting & Dyeing (CEPZ) Ltd. 105,000 30,000 - - 135,000
124 MJL Bangladesh Ltd. 30,000 30,000 - -
125 Modern Dyeing & Screen Printing Ltd. 5,000 5,000 - - 10,000
126 Modern Industries (Bangladesh) Ltd. 5,000 5,000 - -
127 Mona Food Industry Limited 105,000 15,000 - - 120,000
128 Mutual Trust Bank Ltd. 30,000 30,000 - -
129 National Bank Ltd. 30,000 30,000 - -
130 National Credit & Commerce Bank Limited 30,000 30,000 60,000 - -
131 National Housing Finance & Investments Ltd.
30,000 30,000 - -
FIN
ANCI
ALS
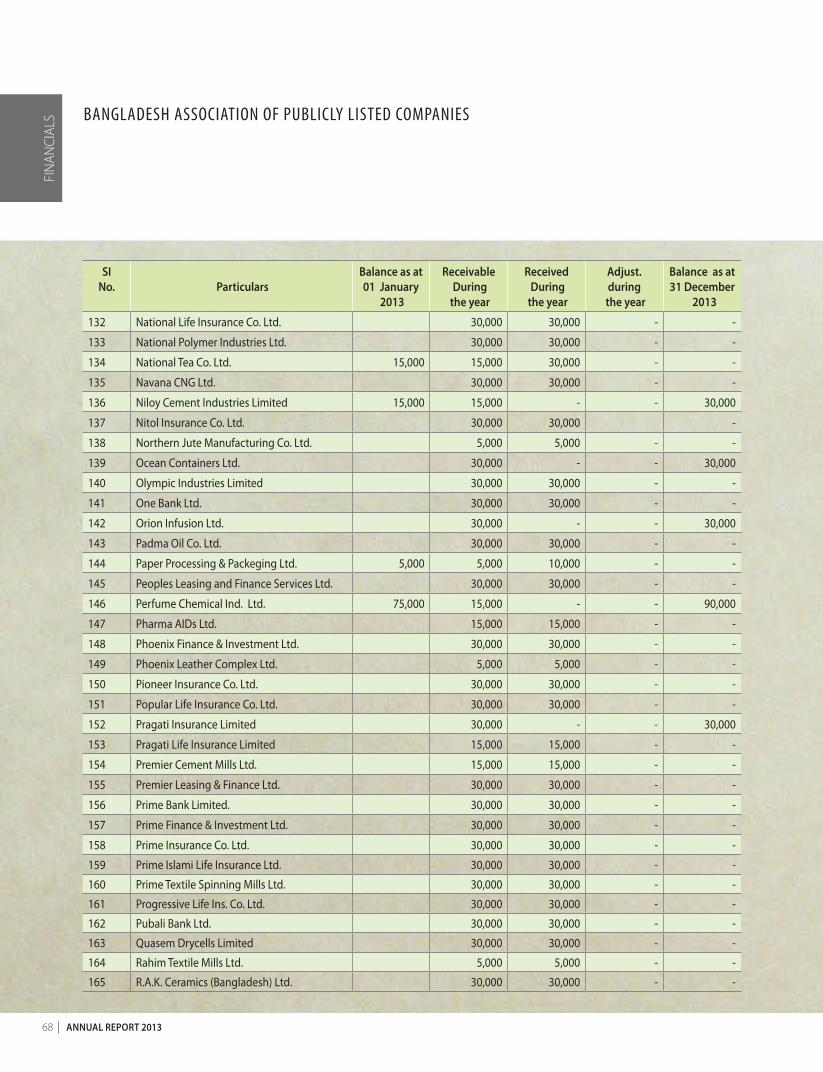
68 annual RepoRt 2013
si no. particulars
balance as at 01 January
2013
Receivable during
the year
Received during
the year
adjust.during
the year
balance as at 31 december
2013
132 National Life Insurance Co. Ltd. 30,000 30,000 - -
133 National Polymer Industries Ltd. 30,000 30,000 - -
134 National Tea Co. Ltd. 15,000 15,000 30,000 - -
135 Navana CNG Ltd. 30,000 30,000 - -
136 Niloy Cement Industries Limited 15,000 15,000 - - 30,000
137 Nitol Insurance Co. Ltd. 30,000 30,000 -
138 Northern Jute Manufacturing Co. Ltd. 5,000 5,000 - -
139 Ocean Containers Ltd. 30,000 - - 30,000
140 Olympic Industries Limited 30,000 30,000 - -
141 One Bank Ltd. 30,000 30,000 - -
142 Orion Infusion Ltd. 30,000 - - 30,000
143 Padma Oil Co. Ltd. 30,000 30,000 - -
144 Paper Processing & Packeging Ltd. 5,000 5,000 10,000 - -
145 Peoples Leasing and Finance Services Ltd. 30,000 30,000 - -
146 Perfume Chemical Ind. Ltd. 75,000 15,000 - - 90,000
147 Pharma AIDs Ltd. 15,000 15,000 - -
148 Phoenix Finance & Investment Ltd. 30,000 30,000 - -
149 Phoenix Leather Complex Ltd. 5,000 5,000 - -
150 Pioneer Insurance Co. Ltd. 30,000 30,000 - -
151 Popular Life Insurance Co. Ltd. 30,000 30,000 - -
152 Pragati Insurance Limited 30,000 - - 30,000
153 Pragati Life Insurance Limited 15,000 15,000 - -
154 Premier Cement Mills Ltd. 15,000 15,000 - -
155 Premier Leasing & Finance Ltd. 30,000 30,000 - -
156 Prime Bank Limited. 30,000 30,000 - -
157 Prime Finance & Investment Ltd. 30,000 30,000 - -
158 Prime Insurance Co. Ltd. 30,000 30,000 - -
159 Prime Islami Life Insurance Ltd. 30,000 30,000 - -
160 Prime Textile Spinning Mills Ltd. 30,000 30,000 - -
161 Progressive Life Ins. Co. Ltd. 30,000 30,000 - -
162 Pubali Bank Ltd. 30,000 30,000 - -
163 Quasem Drycells Limited 30,000 30,000 - -
164 Rahim Textile Mills Ltd. 5,000 5,000 - -
165 R.A.K. Ceramics (Bangladesh) Ltd. 30,000 30,000 - -
FIN
ANCI
ALS BAnGLADESH ASSOCIATIOn OF PuBLICLY LISTED COMPAnIES
bangladesh association of publicly listed companies 69
si no. particulars
balance as at 01 January
2013
Receivable during
the year
Received during
the year
adjust.during
the year
balance as at 31 december
2013
166 Rangpur Dairy & Food Products Ltd. 30,000 15,000 15,000 -
167 Rangpur Foundry Ltd. 15,000 15,000 - -
168 Reckitt Benckiser (BD) Ltd. 7,500 7,500 - -
169 Reliance Insurance Ltd. 30,000 30,000 - -
170 Renata Limited 30,000 30,000 - -
171 Republic Insurance Co. Ltd. 30,000 30,000 - -
172 R.N. Spinning Mills Ltd. 30,000 30,000 -
173 Rupali Bank Ltd. 30,000 30,000 - -
174 Rupali Insurance Co. Ltd. 30,000 30,000 - -
175 Rupali Life Insurance Co. Ltd. 30,000 30,000 - -
176 Saiham Textile Mills Ltd. 30,000 - - 30,000
177 S. Alam Cold Rolled Steels Ltd. 30,000 30,000 - -
178 Samorita Hospital Limited 15,000 15,000 - -
179 Sandhani Life Insurance Co. Ltd. 30,000 30,000 - -
180 Shahjalal Islami Bank Ltd. 15,000 15,000 - -
181 Shinepukur Ceramics Ltd. 30,000 30,000 60,000 - -
182 Singer Bangladesh Ltd. 30,000 30,000 - -
183 Social Islami Bank Ltd. 30,000 30,000 - -
184 Sonali Aansh Industries Ltd. 5,000 5,000 - -
185 Sonali Paper & Board Mills Ltd. 15,000 15,000 - -
186 Sonargaon Textiles Limited 30,000 30,000 - -
187 Southeast Bank Ltd. 30,000 30,000 - -
188 Square Pharmaceuticals Limited 30,000 30,000 - -
189 Square Textiles Ltd. 30,000 30,000 - -
190 Standard Bank Ltd. 30,000 30,000 - -
191 Standard Insurance Ltd. 30,000 30,000 - -
192 Stylecraft Limited 5,000 5,000 - -
193 Summit Alliance Port Ltd. 30,000 30,000 - -
194 Summit Power Ltd. 30,000 30,000 - -
195 Takaful Islami Insurance Ltd. 30,000 30,000 - -
196 Tallu Spinning Mills Limited 120,000 30,000 - - 150,000
197 The City Bank Ltd. 90,000 30,000 - - 120,000
198 The Ibn Sina Pharmaceutical Ind. Ltd. 30,000 30,000 - -
199 The Premier Bank Ltd. 30,000 30,000 - -
200 Titas Gas Transmission & Distribution Co. Ltd. 30,000 - - 30,000
FIN
ANCI
ALS
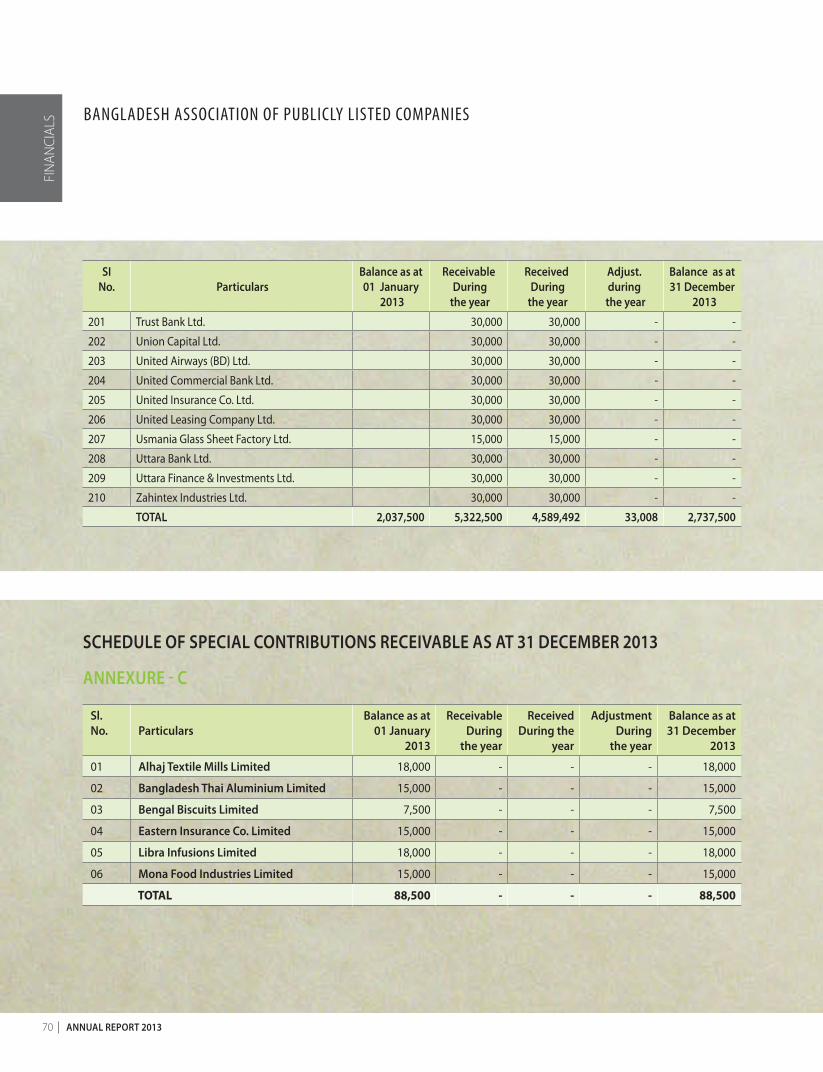
70 annual RepoRt 2013
si no. particulars
balance as at 01 January
2013
Receivable during
the year
Received during
the year
adjust.during
the year
balance as at 31 december
2013
201 Trust Bank Ltd. 30,000 30,000 - -
202 Union Capital Ltd. 30,000 30,000 - -
203 United Airways (BD) Ltd. 30,000 30,000 - -
204 United Commercial Bank Ltd. 30,000 30,000 - -
205 United Insurance Co. Ltd. 30,000 30,000 - -
206 United Leasing Company Ltd. 30,000 30,000 - -
207 Usmania Glass Sheet Factory Ltd. 15,000 15,000 - -
208 Uttara Bank Ltd. 30,000 30,000 - -
209 Uttara Finance & Investments Ltd. 30,000 30,000 - -
210 Zahintex Industries Ltd. 30,000 30,000 - -
total 2,037,500 5,322,500 4,589,492 33,008 2,737,500
schedule of special contRibutions ReceiVable as at 31 decembeR 2013
anneXuRe - c
sl. no. particulars
balance as at 01 January
2013
Receivable during
the year
Received during the
year
adjustment during
the year
balance as at 31 december
2013
01 alhaj textile mills limited 18,000 - - - 18,000
02 bangladesh thai aluminium limited 15,000 - - - 15,000
03 bengal biscuits limited 7,500 - - - 7,500
04 eastern insurance co. limited 15,000 - - - 15,000
05 libra infusions limited 18,000 - - - 18,000
06 mona food industries limited 15,000 - - - 15,000
TOTAL 88,500 - - - 88,500
FIN
ANCI
ALS BAnGLADESH ASSOCIATIOn OF PuBLICLY LISTED COMPAnIES
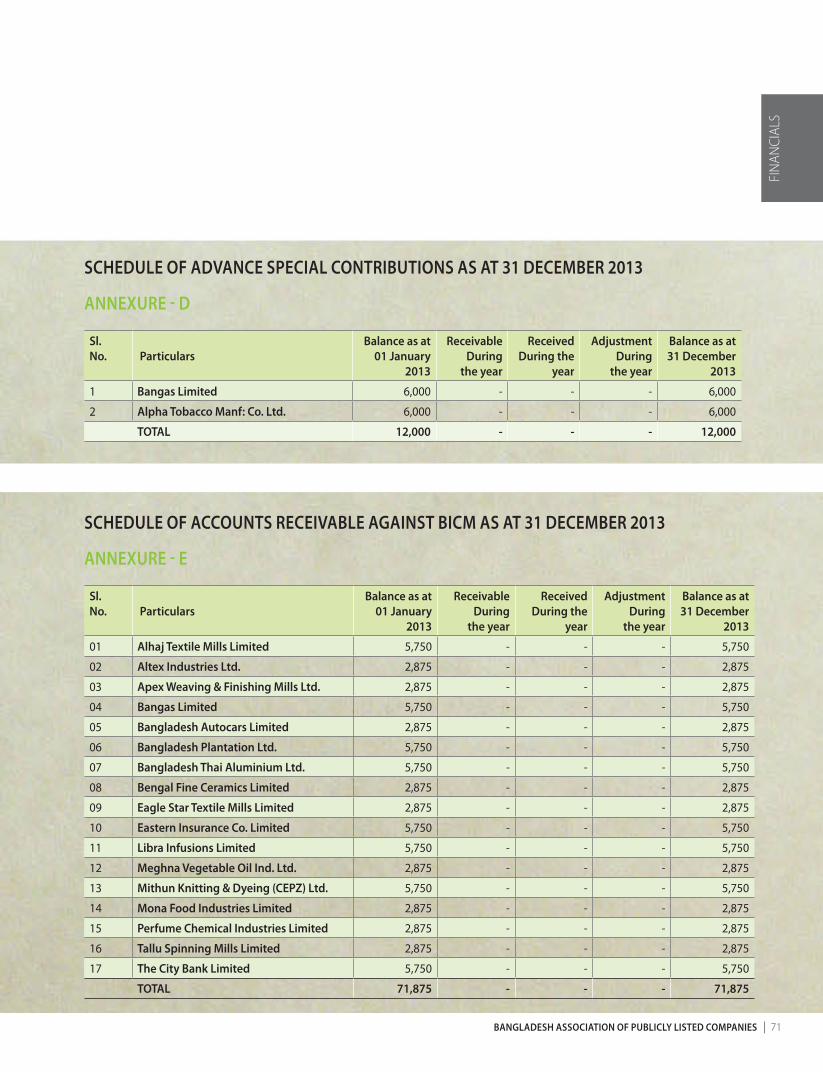
bangladesh association of publicly listed companies 71
schedule of adVance special contRibutions as at 31 decembeR 2013
anneXuRe - d
sl.no. particulars
balance as at 01 January
2013
Receivable during
the year
Received during the
year
adjustment during
the year
balance as at 31 december
2013
1 bangas limited 6,000 - - - 6,000
2 alpha tobacco manf: co. ltd. 6,000 - - - 6,000
total 12,000 - - - 12,000
schedule of accounts ReceiVable against bicm as at 31 decembeR 2013
anneXuRe - e
sl.no. particulars
balance as at 01 January
2013
Receivable during
the year
Received during the
year
adjustment during
the year
balance as at 31 december
2013
01 alhaj textile mills limited 5,750 - - - 5,750
02 altex industries ltd. 2,875 - - - 2,875
03 apex Weaving & finishing mills ltd. 2,875 - - - 2,875
04 bangas limited 5,750 - - - 5,750
05 bangladesh autocars limited 2,875 - - - 2,875
06 bangladesh plantation ltd. 5,750 - - - 5,750
07 bangladesh thai aluminium ltd. 5,750 - - - 5,750
08 bengal fine ceramics limited 2,875 - - - 2,875
09 eagle star textile mills limited 2,875 - - - 2,875
10 eastern insurance co. limited 5,750 - - - 5,750
11 libra infusions limited 5,750 - - - 5,750
12 meghna Vegetable oil ind. ltd. 2,875 - - - 2,875
13 mithun Knitting & dyeing (cepZ) ltd. 5,750 - - - 5,750
14 mona food industries limited 2,875 - - - 2,875
15 perfume chemical industries limited 2,875 - - - 2,875
16 tallu spinning mills limited 2,875 - - - 2,875
17 the city bank limited 5,750 - - - 5,750
total 71,875 - - - 71,875
FIN
ANCI
ALS

72 annual RepoRt 2013
schedule of adVance annual subscRiption as at 31 decembeR 2013
anneXuRe - f
sl.no. particulars
balance as at 01 January
2013
Receivable during
the year
Received during the
year
adjustment during
the year
balance as at 31 december
2013
01 brac bank ltd. 15,000 - - 15,000 -
02 Rangpur dairy & food products 15,000 - - 15,000 -
03 beacon pharmaceuticals ltd. - 30,000.00 30,000
total 30,000 30,000 - 30,000 30,000
schedule of admission fee as at 31 decembeR 2013
anneXuRe - g
sl.no. particulars Received during the year
01 gbb power ltd. 20,000
02 envoy textiles ltd. 20,000
03 the premier bank ltd. 20,000
04 dhaka bank ltd. 20,000
05 standard bank ltd. 20,000
06 shahjalal islami bank ltd. 20,000
07 deshbandhu polymer ltd. 20,000
08 bengal Windsor thermoplastics ltd. 20,000
09 premier cement mills ltd. 20,000
10 Reckitt benckiser (bd) ltd. 20,000
total 200,000
outstanding admission fee
01 mona food industries ltd. 20,000
total 20,000
BAnGLADESH ASSOCIATIOn OF PuBLICLY LISTED COMPAnIES
FIN
ANCI
ALS


BANGLADESH ASSOCIATION OF PUBLICLY LISTED COMPANIESBlock B, Road 1, House 17, Unit A, Niketan Eastern Housing Complex, Gulshan 1 Dhaka 1212Tel : +(880) 2 - 8824926 Fax : +(880) 2 - 9887245 Email : [email protected], [email protected]