bangchak corporation plc -...
TRANSCRIPT

Bangchak Corporation PLC
Opportunity Day Q3/2017
November 22, 2017

Performance Summary

BCP Group Portfolios
Bangchak Corporation Plc. 3
Bio - Based Products ResourcesGreen Power Plant
Marketing
• Retail Sales Volume continue to grow (6%YoY)
• Net MKM was squeezed from the lag time in retail price adjustment for higher global crude oil price
Refinery
• High Crude Run at 110 KBD
• Satisfactory Market GRM at 6.66 $/BBL
• Inventory Gain of 450 MB
• Low season for solar projects in Thailand & Japan
• Geothermal plant in Indonesia started contribute to EBITDA performance
Accounting
3,580 MB
3Q17 EBITDA Performance
Operating
3,165 MB
28%
YoY
• Cycle for cassava based ethanol continue to have cost advantage
• Biodiesel performance recovered from higher sales volume and decreased stock loss
• BCPI paid for additional investment in LAC (current shareholding 16.1%)
• Nido recorded impairment cost of 1,368 MB from its withdrawal from Mid-Galocappraisal well
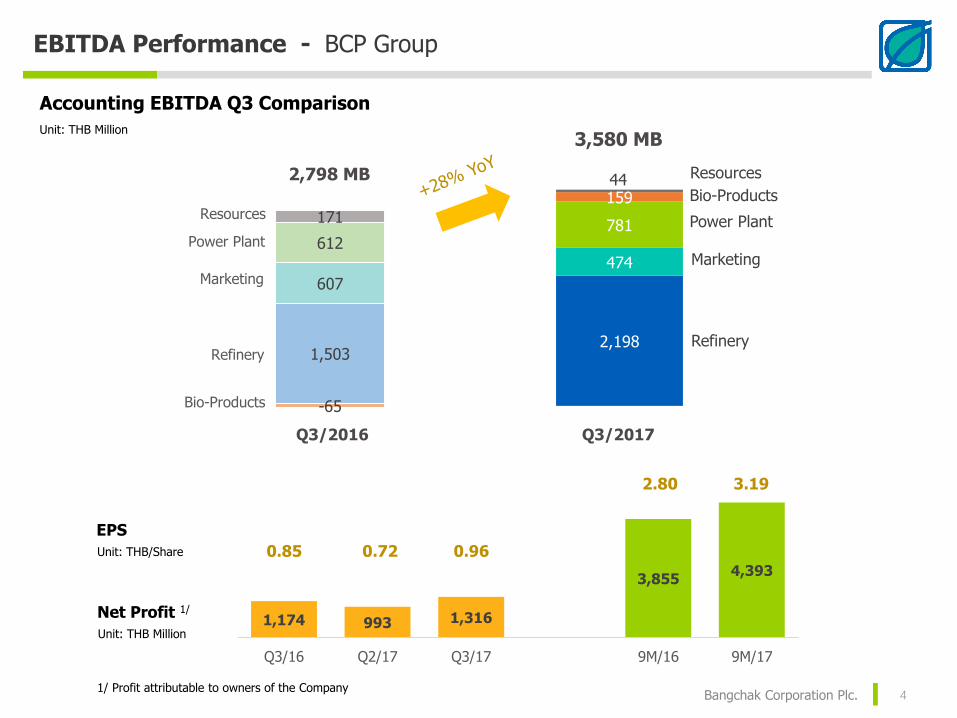
EBITDA Performance - BCP Group
Bangchak Corporation Plc. 41/ Profit attributable to owners of the Company
Unit: THB Million
Accounting EBITDA Q3 Comparison
1,174 993 1,316
3,8554,393
01002003004005006007008009001,0001,1001,2001,3001,4001,5001,6001,7001,8001,9002,0002,1002,2002,3002,4002,5002,6002,7002,8002,9003,0003,1003,2003,3003,4003,5003,6003,7003,8003,9004,0004,1004,2004,3004,4004,5004,6004,7004,8004,9005,000
Q3/16 Q2/17 Q3/17 9M/16 9M/17
Unit: THB Million
Net Profit 1/
2.80 3.19
0.85 0.72 0.96Unit: THB/Share
EPS
2,198
474
781
15944
1,503
607
612
-65
171
2,798 MB
3,580 MB
Q3/2017
Refinery
Marketing
Power Plant
Bio-Products
Resources
Refinery
Marketing
Power Plant
Bio-Products
Resources
Q3/2016

EBITDA Performance - BCP Group
Bangchak Corporation Plc. 51/ Profit attributable to owners of the Company
Unit: THB Million
Accounting EBITDA 9M Comparison
1,174 993 1,316
3,8554,393
01002003004005006007008009001,0001,1001,2001,3001,4001,5001,6001,7001,8001,9002,0002,1002,2002,3002,4002,5002,6002,7002,8002,9003,0003,1003,2003,3003,4003,5003,6003,7003,8003,9004,0004,1004,2004,3004,4004,5004,6004,7004,8004,9005,000
Q3/16 Q2/17 Q3/17 9M/16 9M/17
Unit: THB Million
Net Profit 1/
2.80 3.19
0.85 0.72 0.96Unit: THB/Share
EPS
5,340
1,999
2,276
397270
3,389
2,531
1,991
195252
8,302 MB10,169 MB
9M/2017
Refinery
Marketing
Power Plant
Bio-ProductsResources
Refinery
Marketing
Power Plant
Bio-Products
Resources
9M/2016

BCP Group Portfolios
Bangchak Corporation Plc. 6
Bio - Based Products ResourcesGreen Power Plant
Refinery Marketing

Refinery Business – Going beyond limit
Bangchak Corporation Plc. 7
64
112 116 114 110 114 110.0353%
93% 96% 95% 92% 95% 92%
0%10%20%30%40%50%60%70%80%90%100%
0102030405060708090
100110120130140
Q1/16 Q2/16 Q3/16 Q4/16 Q1/17 Q2/17 Q3/17
Crude Run
Utilization
44%
29% 22%
46%
71% 78%
Q3/16 Q2/17 Q3/17
12% 15% 10%1%
2% 3%
55% 50% 52%
11% 12% 13%
19% 17% 20%
3%2%
3%
3Q/16 2Q/17 3Q/17
TAM =Turnaround Maintenance Period
Production ProfileActual Crude Run Unit: KBD
TAM
Product Yield
LPG
Gasoline
Jet
Diesel
Fuel Oil
UCO
Maximize high value product
Crude Sourcing
Diversify Crude Sourcing: Satisfactory GRM regardless of the changing crude sources
Domestic
Import
(TAM)
2017 Target 111 KBD
Still running at an optimal high rate

Accounting GRM
5.62 6.38 6.66
0.030.63 0.200.32
-2.82
1.32
Refinery Business – Going strong
Bangchak Corporation Plc. 8
Refinery EBITDA
Unit: THB MillionUnit: THB Million
GRM Performance
Unit: $/BBL8.184.18
Inventory Gain Loss
Oil Hedging
Market GRM
5.97
Most product crack spread was higher, boosted higher Market GRM, despite widening DTD/DB
Completion of COGEN power plant help with refinery stability and lower electricity cost
Hydrocracker unit malfunction result in its operation to run sub-optimally
BCP Trading Pte. Ltd. contribute EBITDA 7 MB
Q3/17: Performance going strong
Crude Price & Crack Spreads ($/BBL)
1,5
03
91
6
2,1
98
1,3
83 1
,92
6
1,7
48
Q3/16 Q2/17 Q3/17
Accounting Operating
Q3/16 Q2/17 Q3/17
-2
0
2
4
20
40
60
80
Q3/16 Q4 Q1/17 Q2 Q3
DB DTD/DB
-5
0
5
10
15
20
Q3/16 Q4 Q1/17 Q2 Q3
GO/DB
UNL95/DB
FO/DB

Distribution channel – Retail market is our main priority
Bangchak Corporation Plc. 9
Push forward higher sales volume through the highest margin channel
Total Sales Volume
235
251259
284
307311
163
181 186 179190
161
4564 47 51
86
5755
69
92 93
82
98
0
50
100
150
200
250
300
350
Unit: Million Litre / Month
Total Sales Volume
Retail Market
Industrial Market
Wholesales
Exports
Unit: % Portion of total sales volume in 3Q2017
9%
26%
50%
16%
RetailMarket
IndustrialMarket
Wholesales
Export
Marketing Business
934 ML
483 ML
170 ML
295 ML

Marketing Performance – Retail market is our main priority
Bangchak Corporation Plc. 10
Marketing EBITDA
Unit: THB MillionUnit: THB Million6
07
66
9
47
460
9 67
4
45
5
Q3/16 Q2/17 Q3/17
Accounting Operating
Net Marketing Margin
Unit: Baht/Litre
1.04 1.060.94
0.38 0.430.33
Q3/16 Q2/17 Q3/17
Net Retail Margin Net Industrial Margin
0.80 0.83
0.73
Retail sales volume grew 6% YoY, but declined 2% QoQ due to rainy season
Industrial sales volume declined from the higher sales push through retail market, flooding in some areas, and temporary intense price competition
Marketing Margin declined from the lag time of retail price adjustment when global crude oil price increase
Q3/17: Slight decline from seasonal effect

Marketing Network – Increasing Market Share & Thruput per station
Bangchak Corporation Plc. 11
Market Share (Retail Channel)
Jan-Sep’16 Jan-Sep’17 ∆
37.0% 36.5%
15.0% 15.3%
12.9% 12.5%
12.9% 13.0%
5.7% 5.1%
5.0% 4.7%
1.8% 1.8%
7.9% 9.4%
1.6% 1.6%
Unit: K.Litre/Station/ Month
Thruput per station
15.3%
348392
435479
504
416 416450 464 452
494528 540
573 570
2013 2014 2015 2016 9M2017
BCP Standard AVG Major Oil BCP COCO
Several initiatives to boost BCP’s thruput:
optimize current network partnership with SPAR new premium products etc.
*AVG Major Oil : PTT, ESSO, SHELL, CALTEX

Bangchak Service Station - Greenovative Experience
Bangchak Corporation Plc. 12
Standard Type 481 sites
COOP Type 612 sites
+35 New Service Stations
9M2017
service stations as of September 20171,093

Bangchak Non-Oil Business – Progression
Bangchak Corporation Plc. 13
421
9M17
+50 branches
branches
branches
9M17
+19 branches
25 stores
stores

R&M PerformanceRefinery and Marketing business to extract benefit of the value chain
Bangchak Corporation Plc. 14
Refinery Business earning was volatile due to market conditions and Turnaround maintenance (TAM)
Marketing Business Captures a Demand Surge During Low Oil Price Environment
R&M as a fully integrated model
profit can be optimized through business cycle
8.345.88 6.96
9.05
5.99 6.70
3.31
2.68
3.47
3.53
3.533.69
2012 2013 2014 2015 2016 9M2017
Net MKM
Market GRM
Unit: $/BBL
Normalize Integrated Margin
$11.66 $ 8.56 $ 10.43 $ 12.58 $ 9.52 $ 10.39

BCP Group Portfolios
Bangchak Corporation Plc. 15
Bio - Based Products ResourcesGreen Power Plant
Refinery Marketing

Green Power Plant – Growing Capacity
Bangchak Corporation Plc. 16
Green Power Plant EBITDAUnit: THB Million
6168 65
8
1413
Q3/16 Q2/17 Q3/17
Thailand Japan
Electricity Sales of solar power plant
Q3/17: Expanding coverage as planned
Wind
PPA: Philippines 14.4 MW (net to BCPG)
Low season led to less wind speed at project site
PPA: Thailand 130 MW / Japan 30 MW
QoQ lower performance from low season (rainy season) both in TH and JP led to lower irradiation
YoY higher performance from operation commencement of various projects both in TH and JP
Solar
Geothermal
PPA: Indonesia 182 MW (net to BCPG)
Share of profit from Jan – Sep’17 was recorded in Q3/17 altogether
Unit: Million kWh
61
2
78
9
78
1Q3/16 Q2/17 Q3/17
Accounting

Bio-Based Products – Biodiesel business back on good track
Bangchak Corporation Plc. 17
Bio-Based Products EBITDA
Unit: THB MillionUnit: THB Million
-60
93
8
88 68
121
41
41 74
74
-3
-3
9
917
17
-70
-20
30
80
130
180
230
Q3/17
Acc
ounting
Opera
ting
Biodiesel Bangchak BioEthanol Ubon BioEthanol
Q2/17Q3/16
-65
8959
139159
213
Performance recovered from higher sales volume
and decreased inventory loss
B7 mixing portion throughout all quarter
Biodiesel
452
669 689
478
672 682
Q3/16 Q2/17 Q3/17
Daily Production Sales Volume
Biodiesel Plant: Production and Sales Volume
Unit: K. Litre per day
B7B5-B7
B3-B5
127
91
129118
94
121
Q1/17 Q2/17 Q3/17
Daily Production Sales Volume
BBE Ethanol Plant Production and Sales Volume
Unit: K. Litre per day
Ethanol
Both plants benefit from declining cassava price
while ethanol price increased

0.0
0.5
1.0
1.5
2.0
2.5
Resources Business
Bangchak Corporation Plc. 18
o EBITDA contribution positive at 44 MB
o Galoc oil filed uptime was 99.98%
o Nido Sales Volume was lower corresponding to the Natural-Decline Production Curve
o Impairment cost of 1,368 MB
3Q/17: E&P Target
G7 impairment of USD 40 million (Mid Galoc Area)
o G7 (appraisal well) showed lower than expected resource
o Not Economic to develop
(based on oil price at 55-65 $/BBL)
o Impair all G7 (Mid Galoc) value in the book
Lithium Mining Business Progression
3Q/17: Cauchari-Olaroz project in progress
o BCPI signed offtake agreement for 20% of LAC’s right in Lithium produced from Cauchari-Olaroz (Phase I) for 20 years
o Unrealized profit from holding LAC shares as asset available for sale booked in Other comprehensive income of 1,684 MB for 9M2017
o As of 8 Nov 2017, LAC made 1-for-5 reverse stock split. Numbers of BCPI shares in LAC changed from 70.28 M shares to 14.06 M shares, % of shareholding is unchanged at 16.1%
LAC share price movement (adjusted for reverse stock split effect)
BCP invested 37 [email protected] CAD/Share

Financial Performance

3Q/17 Quarterly Remarks – From Financial Aspects
Bangchak Corporation Plc. 20
BCPG Plc.
Invest 356 MUSD in Star Energy group
Loan draw down of 8,851 MB for foreign operations
2017 Interim dividend paid of 299 MB
Loss from FX forward contract of 255 MB
BBGI Co., Ltd.
Amalgamation with KSLGI completed in 31 Oct’17 (BCP holds 60% in the amalgamated company) effect of the amalgamation will be realized in 4Q/17 performance for 2 months
BIO
Bangchak Corporation Plc.
Gross Profit increased from Inventory gain of 450 MB (company only)
Assets growth by 5,572 MB compared to 31 Dec’16
Corporate Income Tax return of 671 MB Tax refund for the year 2009 and 2010

3Q/17 Quarterly Remarks – From Financial Aspects
Bangchak Corporation Plc. 21
BCP Innovation Pte. Ltd.
Increased registered share capital by 1,100 MB
Invested 32 MUSD to increase shareholding in Lithium America Corp. (LAC) from 5.2% to 16.1% (2nd largest shareholder)
BCP Energy International Pte. Ltd.
Increased registered share capital by 37 MB

Key Financial Performance - Consolidated
Bangchak Corporation Plc. 22
Gross Profit
Mainly increased from Refinery 450 MB inventory gain compare to 35 MB and 1,096 MB inventory loss in Q3/16 and Q2/17 respectively
Remark:
Other Income
Mainly increased from a compensation from construction project of 141 MB.
(Q2/2017 record a gain from the reversal of provisions from SunEdison acquisition of 140 MB)
SG&A
Increased from expenses in Non-oil business, HR-related, financial advisory expenses, and higher depreciation
Loss on FX forward contracts
Mainly from BCPG forward contracts resulting from THB appreciation
Gain on Foreign Exchange
Mainly from the company group’s foreign currency liability, resulting in a gain as THB appreciated
Statement of Income3Q16
(Restated)2Q17 3Q17
Revenue 36,686 42,828 39,009
Cost of goods sold (33,780) (40,465) (35,450)
Gross Profit 2,906 2,363 3,559
Investment income and dividend income 51 44 45
Other income 62 236 238
Selling and administrative expenses (1,473) (1,648) (1,785)
Gain (loss) from oil hedging contract 11 233 86
Gain (loss) from FX forward contracts 13 (19) (259)
Gain on foreign exchange 156 92 299
Loss from impairment of assets 3 19 (1,358)
Share of profit of associate and joint venture (1) 54 420
EBIT 1,728 1,375 1,244
Finance costs (369) (339) (379)
Income tax expense (232) 109 630
Profit for the period 1,127 1,145 1,495
Owners of the Company 1,174 993 1,316
Non-controlling interests (47) 153 179
Earnings per share (Baht per Share) 0.85 0.72 0.96
Unit: THB Million

Key Financial Performance - Consolidated
Bangchak Corporation Plc. 23
Remark:
Share of Profit from associates and JV
Higher from better performance of Ubon Bio Ethanol, and BCPG recent acquisition in Star Energy Group Holding Pte. Ltd
Unit: THB Million
Loss from Impairment of assets
Mainly from Nido’s impairment from the exploration and appraisal expenses, as a result of its withdrawal from Mid-Galoc area
Income Tax revenue
Tax expense was credited from 2009 and 2010 income tax return of 671 MB
Statement of Income3Q16
(Restated)2Q17 3Q17
Revenue 36,686 42,828 39,009
Cost of goods sold (33,780) (40,465) (35,450)
Gross Profit 2,906 2,363 3,559
Investment income and dividend income 51 44 45
Other income 62 236 238
Selling and administrative expenses (1,473) (1,648) (1,785)
Gain (loss) from oil hedging contract 11 233 86
Gain (loss) from FX forward contracts 13 (19) (259)
Gain on foreign exchange 156 92 299
Loss from impairment of assets 3 19 (1,358)
Share of profit of associate and joint venture (1) 54 420
EBIT 1,728 1,375 1,244
Finance costs (369) (339) (379)
Income tax expense (232) 109 630
Profit for the period 1,127 1,145 1,495
Owners of the Company 1,174 993 1,316
Non-controlling interests (47) 153 179
Earnings per share (Baht per Share) 0.85 0.72 0.96

Key Financial Position - Consolidated
Bangchak Corporation Plc.tment 24
43,909 47,075
3,353 3,303
32,14337,345
6,1684,2868,7668,3137,4447,033
31 D EC 16 30 SEP 17
Liabilities & Equity
31 Dec 16 30 Sep 17
24Bangchak Corporation Plc
Assets:
Cash and Equivalents decreased 9,968 MBmainly from the change in working capital, cash paid for asset / acquisition, debt repayment,dividend payment
Unit: THB Million
11,17026,722
46,462
45,614
2,562
2,17414,560
15,5346,022
5,77221,006
11,539
31 D EC 16 30 SEP 17
Cash and Equivalents & Short term Investment
Other Current Assets
Inventory
PP&E
Other Non Current Assets
101,783
Assets
31 Dec 16 30 Sep 17
PP&E decreased 848 MB mainly from Refinery machinery, marketing, and office equipment increased
by THB 2,194million
Purchased other assets at 616 MB FX differences on translating financial statement resulting in
asset lower by 226 MB Depreciation for 9M/17 3,498 MB
Inventory increased by 973 MB
mainly due to petroleum products inventories,
of which its average cost rose
Trade Account Receivable decreased 250 MB from lower finished product sales volume & price
Account Receivable
107,355101,783
Other Non Current Assets increased 15,552 MB mainly from
Investment in Associates and JV increased 13,349 MB
Investment in LAC increased by 1,099 MB, and net fair value increase in LAC investment of 1,664 MB
Intangible Assets decreased 1,289 MB mainly from Mid-Galoc oil field impairment
107,355
Current Liabilities
Long Term Debt
Total Equity
Other Non Current Liabilities
(Including current portion of L/T debt)
Account Payable
Short term loan

Key Financial Position - Consolidated
Bangchak Corporation Plc. 2525Bangchak Corporation Plc
Liabilities:
Short term loan decreased 411 MB mainly from
Estimate of short term loan decreased 502 MB from BCPG
deferred payment settlement in relation with solar japan
acquisition
Account Payable decrease 454 MB from
trade payables in Sep 17 was paid within the month,
although purchase volume was higher than in Dec’16
Other Current Liabilities decreased 1,882 MB mainly from
Accrued expenses reduced 464 MB
Paid for construction expense payable 322 MB
BCPG paid remaining liabilities from SunEdison acquisition
Long-term debt increased 4,791 MB
Debt repayment 3,545 MB
Loan drawdown of BCPG & BBF 9,031 MB
Decreased from effect of THB appreciation 494 MB
Equity:
Equities increased mainly from
Retained Earnings rose 4,393 MB from 9M/17 Net Profit
Dividend Payment 2,822 MB
Other component of equity increased by 1,435 MB fromchange of FX translation differences for foreign operations and fair value increase in available-for-sale investment
43,909 47,075
3,353 3,303
32,14337,345
6,1684,2868,7668,3137,4447,033
31 D EC 16 30 SEP 17
Liabilities & Equity
31 Dec 16 30 Sep 17
Unit: THB Million
11,17026,722
46,462
45,614
2,562
2,17414,560
15,5346,022
5,77221,006
11,539
31 D EC 16 30 SEP 17
Cash and Equivalents & Short term Investment
Other Current Assets
Inventory
PP&E
Other Non Current Assets
101,783
Assets
31 Dec 16 30 Sep 17
Account Receivable
107,355101,783
107,355
Other Current Liabilities
Long Term Debt
Total Equity
Other Non Current Liabilities
(Including current portion of L/T debt)
Account Payable
Short term loan

Cash Flow - Consolidated
Bangchak Corporation Plc. 26
Beginning Cash19,287 MB
Change in Cash(9,756 MB)
Ending Cash9,319 MB
FX adjustment(211) MB
9,75813,394
8,959 3,198
500 1,989
185 535
4,340
3,222 2,480
Cash From Operation
(CFO)
Selling of PPE
Funding
19,402
Sources of Cash Uses of Cash
29,158
Q3/17 Sources and Uses of Cash
Unit: THB Million
Investment in intangible & other assets
Investment in subsidiaries & JV
Change in working cap
ST Investment
Dividend & Interest Received and others
Debt Service
Investment in PPE
Dividend Paid

Oil Market Outlook

Surplus stock reduction moderates, higher U.S. oil production looming
28
Continue non-OPEC supply growth keeps call on OPEC near 32.5 MBD in 2018Big closer in gap between total OECD stock & 5yrs-Avg. with
strong demand and producer cut production
Source: Argus Media, Euroilstock, IEA, METI, OPEC and EIA – Oct’17
Better OPEC cuts compliance
Oil Production cuts [KBD]
Active U.S. rig start to decline
U.S. Oil Rig count
U.S. Oil Production[Right Axis]
Source: IEA – Oct’17Source: Baker Hughes and EIA
Source: IEA – Oct’17
57.38 58.05 59.60
6.81 6.91 7.04
32.80
96.13 97.71 99.12
30
40
50
60
70
80
90
100
2016 2017 2018
OPEC Supply OPEC NGLs
Non-OPEC Supply Total Demand
Wo
rld
oil
bal
ance
(M
BD
)Call on OPEC 32.48 MBD
Call on OPEC 32.75 MBD
+1.6% +1.4%
(+2.7%)(+1.2%)

0
20
40
60
80
Jan-15 Apr-15 Jul-15 Oct-15 Jan-16 Apr-16 Jul-16 Oct-16 Jan-17 Apr-17 Jul-17 Oct-17
$/BBL
Iran nuclear deal
reached
Greece Debt Default
U.S. Presidential
election
U.S. supply concern
29
Crude Oil Price Outlook: Tighter crude stock surplus support pricesbut oil prices capped by rising of U.S. production
Rig count drop
Upstream investment cut
China’s stock rout
No OPEC production ceiling
agreement
Iran’s sanction lifted
Possible of OPEC and Non-OPEC coordination
FED rate hike
Dubai AVG: Q1/17 = 53.0 Q2/17 = 49.7 Q3/17 = 50.4 Q4/17 (F) = 57.8
FY2016 = 41.4 $/BBL FY2017 (F) = 52.7 $/BBL FY2018 (F) = 56.5 $/BBL
Hurricane Season
OPEC and non-OPEC Deal
Fed Rate Hike
Expectation
• OPEC meeting in late-November likely to extent cut to lower excess crude inventories.
• Firm refining margins to support crude oil demand.
• Kurdistan-Iraq tension and security concerns
• Rising US-Iran tensions on compliance over nuclear deal
• U.S. oil supply continue to grow
Trump inauguration
[20 Jan]
OPEC meeting[30 Nov]
Tension in Iraq
Production cut begins
Focus on Q4-17:
Extension cut meeting
[May]
Summer demand
• Global demand growth due to strong economics.
• Expect OPEC will extent cut to end of 2018. Saudi Aramco IPO support.
• Surplus inventory will moderate decrease
• Non-OPEC supply growth, lead by U.S. , Canada & Brazil
• Libya and Nigeria production increase.
Market Highlights in 2018:

18.8
14.411.6
14.5 14.714.2
16.1 14.6
18.3 14.8
14.9
14.6
9.7
10.510.9 11.5 11.8 11.3
13.812.2
13.6
10.612.3
12.5
-5.2
-8.7
-4.3-2.5 -3.2
-1.8 -1.4 -2.2
-5.0 -5.2-2.1
-2.5
-15
-10
-5
0
5
10
15
20
25
Q1-16 Q2-16 Q3-16 Q4-16 Q1-17 Q2-17 Q3-17 Q4-17 2015 2016 2017 2018
ULG95 - Dubai
Gas oil 0.05%S - Dubai
Fuel Oil - Dubai
30
Singapore Product Cracks Spread Outlook
• High margins incentivize lower maintenance in Q4.
• Higher oil products export from China after refiners receive an unusual fifth round of export quotas and new refinery startup.
• Seasonal downward gasoline demand in winter.
• Winter stockpiling activities should protect downside risk of gasoil cracks
• Limited fuel oil arbitrage from West to Asia and tighter fuel oil in Asia on higher demand from bunkering sector support fuel oil crack.
Market Highlights in 2018:
• The incremental demand growth in Asia will offset supply increase from the recently commissioned refinery projects.
• Continuation of relative light end support compared to middle distillates on still strong demand.
• Supply side still driving fuel oil tightness
Focus on Q4-17:
Softer refining margins in Q4 from earlier strong in Q3 but remain supported by winter demand
$/BBL

Going Forward

Refinery - On-going value enhancement projects
Bangchak Corporation Plc. 32
YES-RProject
3E Project
Y2016 Y2017 Y2018 Y2019 Y2020
In operation
(Aug’17)
EPC Award(Q1/18)
Completion
EPC Award(Q1/18)
Completion
FEED & ITB Completion
(Q2/17)
EPC AwardCompletion
Co-Gen #3 (≈12 MW)
1st Provisional Acceptance and under
commission process (Progress: 99%)
Benefit ≈0.20 $/bbl
Continuous Catalyst Regeneration Unit (CCR)
(CCR: Higher Capacity & maintenance cycle extension)
Prepare for Bid Evaluation
Debottlenecking
#1: Hydrocracker Unit (HCU) Revamping
(Higher Optimal Crude Run: Distillate)
Prepare for Bid Evaluation
#2: Debottlenecking CDU & NPU & ISOU & KTU
(Higher Optimal Crude Run: Light & Middle Distillate)
Front end engineering design & invitation to bid
YES-R Project:
Continuous Improvements that focused on reliability, enhanced efficiency, safety, and yield improvement
Automation & Digitalization
Project Timeline
3Q/17 Refinery actual Power usage :
• 90% self reliance• 10% purchased from MEA
COGEN in operation - Performance Recap

Refinery – 2018 Turnaround Maintenance Plan
Bangchak Corporation Plc. 33
Bangchak Refinery TAM 2018 Plan Period: 45 days
Project Tie-in:
• Continuous Catalyst Regeneration Unit (CCR)• Hydrocracker Unit (HCU)• Crude Distillation Unit (CDU) 3
Expected Utilization Rate 85%

Retail & Non-oil Networks – Current Network Optimization
Bangchak Corporation Plc. 34
To improve customer experience and advocacy, BCP focus on network coverage,
service and non oil benefit with the concept of “Greenovative Experience”
Service Station Design - Flagship Service station- Environmental friendly- Custom design for each segment- Existing service stations renovation
Competency Improvement (Customized by Sites)
Current Network Optimization- Loyalty program improvement- High quality & Environmental friendly products- Standardized & Fast service

Retail Networks – Geographical expansion
Bangchak Corporation Plc. 35
Metro & Central Cluster
ie. BKK and Vicinity, Ayutthaya, Nakornsawan,
Samut sakorn
East Cluster
ie. Rayong, Chonburi
South Clusterie. Suratthani, Phuket, Songkha, Trang, Krabi
North East Cluster
ie. Khonkaen, Udonthani, Nakornrachasrima
North Cluster
ie. Chiangmai, Chiangrai, Lampang
Network expansion as a cluster
Create brand impact
Improve management efficiency
Fulfilling Bangchakservice station in main roads

BCP Bio-based Business Unit – Amalgamation completed
Bangchak Corporation Plc. 36
Current shareholding structure
BBGITimeline
31 Oct’ 2017 Q4/2017 End 2018
Amalgamation Completed
Amalgamated company performance realization
(2 months)
BBGI IPO

BBGI – Expansion Plan (Tentative Target)
Bangchak Corporation Plc. 37
Current Business
Biodiesel business
Capacity 810,000 Lt./d
PCM plant (PCM: Phase change material)
Refined Glycerin
Ethanol business
Capacity 150,000 Lt./dDebottleneck (45->50 ML/Yr)
Ethanol business
Capacity 350,000 Lt./d
KSLGI-BoPloy Capacity Expansion (200->300 kL/D)
KSLGI-Nampong Capacity Expansion (150->350 kL/D)
New Business
Astaxanthin
Ne
w P
rod
ucts
Ca
pa
cit
y E
xp
an
sio
n

Lithium Americas – Progress Update
Bangchak Corporation Plc. 38
Cauchari-Olaroz project timeline
Complete Preliminary Feasibility Study
Jun’18

THANK [email protected] Tel. +662 335 4390, 365 8518
www.bangchak.co.th
click Investor Relations
Disclaimer : The information contained herein is being furnished on a confidential basis for discussion purposes only and only for the use
of the recipient, and may be subject to completion or amendment through the delivery of additional documentation. Except as otherwise
provided herein, this document does not constitute an offer to sell or purchase any security or engage in any transaction. The information
contained herein has been obtained from sources that Bangchak Corporation Public Company Limited (“BCP”) considers to be reliable;
however, BCP makes no representation as to, and accepts no responsibility or liability for, the accuracy or completeness of the information
contained herein. Any projections, valuations and statistical analyses contained herein have been provided to assist the recipient in the
evaluation of the matters described herein; such projections, valuations and analyses may be based on subjective assessments and
assumptions and may utilize one among alternative methodologies that produce differing results; accordingly, such projections, valuations
and statistical analyses are not to be viewed as facts and should not be relied upon as an accurate representation of future events. The
recipient should make an independent evaluation and judgment with respect to the matters contained herein.