banerjee 2010 advances in heat transfer
DESCRIPTION
High-intensity focused ultrasound (HIFU) is a minimally invasive medical procedure which has shown considerable potential for a variety of therapeuticapplications. Some of the medical applications of HIFU include thermal ablation of tumors and uterine fibroids, vessel cauterization, thrombolysis, drug delivery, and gene activation (Curra and Crum [1]). HIFU ablation, unlike other minimally invasive hyperthermia techniques, is completely noninvasive with minimum patient recovery time (ter Haar [2]).TRANSCRIPT

ADVANCES IN HEAT TRANSFER VOL. 42
Characterization Methods of High-Intensity Focused Ultrasound-Induced Thermal Field
RUPAK K. BANERJEE1,2,* and SUBHASHISH DASGUPTA1
1Department of Mechanical Engineering, University of Cincinnati, Cincinnati, OH 45221 2Department of Biomedical Engineering, University of Cincinnati, Cincinnati, OH 45221
I. Introduction
High-intensity focused ultrasound (HIFU) is a minimally invasive medical procedure which has shown considerable potential for a variety of therapeutic applications. Some of the medical applications of HIFU include thermal ablation of tumors and uterine fibroids, vessel cauterization, thrombolysis, drug delivery, and gene activation (Curra and Crum [1]). HIFU ablation, unlike other minimally invasive hyperthermia techniques, is completely noninvasive with minimum patient recovery time (ter Haar [2]).
Tissue damage via ultrasound is achieved by the conversion of the mechanical energy of acoustic waves to thermal energy as the ultrasound propagates through the tissue (Fig. 1(a)). Temperature rise of the order of 40–60�C is achieved within a few seconds, causing immediate cell death or necrosis in the targeted region (ter Haar [2]). Since the size of the single lesion is small (few centimeters in length � few millimeters in width) in comparison to the tumor (Fig. 1), multiple sonications are typically required to completely destroy the tumor (Fig. 1 (b)).
Unlike other hyperthermia techniques such as radio frequency (RF) and laser ablation procedures, during a typical HIFU procedure, a large amount of energy is deposited in a short duration causing sudden, drastic, and localized rise in tissue temperature. Cell necrosis time for a typical HIFU procedure is a few seconds, while it is of the order of several minutes for other hyperthermia techniques (Hariharan et al. [3]). Consequently, to prevent excessive or collateral tissue damage, the HIFU beam should
* Current address: Department of Mechanical, Industrial and Nuclear Engineering, University of Cincinnati, 593 Rhodes Hall, ML 0072, Cincinnati, OH 45221
Advances in Heat Transfer 137 Copyright � 2010 Elsevier Inc. Volume 42 ISSN 0065-2717 All rights reserved DOI: 10.1016/S0065-2717(10)42002-X

=
(a) (b)
Tumor TransducerTransducer
LesionLesion
Multiple lesions obtained bySkin Liver steering the HIFU beam
(c)
HIFU beam direction
Lesions
Test sec
~2 cm
~2 mm
HIFU lesions obtained on ex vivo porcine liver at different depths and sonication times
Acoustic power 70 W
138 R. K. BANERJEE AND S. DASGUPTA
FIG. 1. Schematic of the HIFU tumor ablation procedure describing the formation of (a) single and (b) multiple lesions [2]. (c) HIFU lesions: MRI image showing different shapes of necrosed tissue volumes obtained using HIFU in an ex vivo porcine liver. A typical lesion is ellipsoidal in shape with more tissue ablated along the axis of the HIFU beam than in the lateral direction.
be focused at the exact location with correct dosage level. Application of the correct dosage level is critical to avoid damage to sensitive tissues and organ systems anterior or posterior to the ultrasound focal region [4–6]. Several instances of nerve, skin, and bone damage have been reported by previous studies during HIFU treatments. Ren et al. [4] reported damage of sciatic nerve due to elevated temperature in the pelvic bone located in the

CHARACTERIZATION METHODS OF HIFU-INDUCED THERMAL FIELD 139
far field of the HIFU beam while treating uterine fibroids. Nell and Myers [5] showed that temperature rise at the bone surface can exceed the threshold for necrosis even when the HIFU beam focus is more than 4 cm (�10 times the beam width; Fig. 1 (c)) from the bone. Civale et al. [6] noted that when the targeted organ in the HIFU procedure is the liver or kidneys, ultrasound absorption in the ribs can produce damage to the skin. Several studies have also shown that presence of structures such as blood vessels near the vicinity of the HIFU ablation zone can act as a heat sink and minimize the efficacy of the ablation procedure [7–9]. Consequently, preclinical evaluations of the thermal and acoustic field generated by the HIFU transducers, using computational, bench-top, in vitro, and in vivo animal experiments, are critical and necessary to ensure safety and efficacy of this new treatment modality.
Pre-clinical testing of HIFU devices typically include the following elements: (1) measurement of ultrasonic power and focusing characteristics in a liquid medium and (2) measurement or prediction of tissue temperature distribution in a tissue or tissue-mimicking material by in vitro and in vivo measurements or by using computational modeling [10]. Temperature rise measurements made in tissue-mimicking materials or by using computational modeling are useful to demonstrate that the device is capable of producing enough heat to destroy tumor cells at the intended locations. This test is also essential to demonstrate that the temperature rise in nontargeted tissues, both proximal and distal to the targeted region, is below the prescribed safety limits.
A majority of the commonly used pre-clinical testing methods for HIFU were derived from the standardized techniques developed for diagnostic and imaging ultrasound devices. The acoustic power and focal intensities at the highest HIFU levels (power �200 W, acoustic intensity > 1000 W/cm2) are several orders of magnitude more than the intensities (power < 3 W, intensity < 100 W/cm2) used for diagnostic purposes [2,11]. Similarly, temperature rise obtained at HIFU energy levels is severalfold higher than the safety limit imposed for the diagnostic devices. Consequently, use of the diagnostic ultrasound testing methods for HIFU devices introduces complex issues such as sensor interference and damage due to cavitation and heating, sensor bandwidth limitations, and acoustic nonlinear effects. To address these issues, several HIFU-specific test methods are currently under development.
The goal of this chapter is to present some of the promising new preclinical testing methods developed for acoustic intensity and temperature measurements at HIFU energy levels. This chapter is broadly divided into two sections with the first section focusing on the free field characterization in the liquid medium and the second section on the thermal field

140 R. K. BANERJEE AND S. DASGUPTA
characterization methods in tissue-mimicking materials and ex vivo tissues. In the initial sections, the commonly used methods for measuring acoustic power, intensity, and thermal fields are presented with their limitations at HIFU power levels outlined. Subsequently, two new optimization-based preclinical testing methods, one for free field and the other for thermal field, to characterize HIFU devices in clinically relevant power levels are presented and discussed in detail.
A. HIFU FREE-FIELD CHARACTERIZATION IN LIQUID MEDIUM
A preliminary step in the analysis of new medical devices involving high-intensity ultrasound is the determination of the acoustic intensity field in a liquid medium (mainly in water). There are several national and international standards available [12–15] to streamline the characterization of an ultrasound field generated by diagnostic and imaging ultrasound devices in the liquid medium. However, there are no such standards available for measuring HIFU fields (Harris et al. [16]). Currently, the majority of HIFU devices are characterized using standards written for low power diagnostic and imaging applications.
1. Established Characterization Methods
Medical ultrasound fields generated by focused transducers are usually characterized in water using (1) calorimetry methods, (2) hydrophones, and (3) radiation force balance techniques [11].
Calorimetry method. A method to measure the HIFU acoustic power in the liquid medium is the calorimetry method (Hallez et al. [17]). The method works on the principle that acoustic power dissipated in liquid is linked to increase in temperature of the bulk of the liquid, due to conversion of acoustic energy to heat. The temperature rise, dT, of the liquid as a result of HIFU sonication is measured using thermocouples. The power Pcal is given as Pcal ¼ mcpðdT=dtÞ, where m is mass of the liquid, cp is specific heat capacity and t is time.
Hydrophones. Polyvinylidene fluoride (PVDF) hydrophones are used as a gold standard for measuring acoustic pressure fields generated by diagnostic and HIFU transducers. In this technique, a membrane or a needle PVDF hydrophone (Fig. 2(a) and (b)) with tip diameter ranging between 0.05 and 1 mm is scanned across the focal region using a tri-axis positioning system. A scanning step size varying between 0.05 and 1 mm is used and the scanning motion is usually controlled by a stepper motor. Data obtained from hydrophone scans can be used to determine focal position, peak pressure, and width of the HIFU beam. The hydrophone measurements are typically made

CHARACTERIZATION METHODS OF HIFU-INDUCED THERMAL FIELD 141
(a) (b)
(c)
HIFU transducer
Absorbing brush target
Force-sensing Mechanism
FIG. 2. (a) Piezoelectric ceramic hydrophone used to characterize physiotherapy equipment [16]: tip diameter = 1.6 mm. (b) PVDF membrane hydrophones [16]: membrane thickness = 25 mm, spot size = 0.3 mm. (c) Radiation force balance.
at lower transducer power levels than the output levels used in clinical therapy in order to avoid sensor damage. From the acoustic pressure (or intensity) field, total ultrasound power can be calculated indirectly by integrating the measured intensity over any plane perpendicular to the ultrasound beam.
Radiation Force Balance. Direct measurement of total time-averaged acoustic power can be made using a radiation force balance (Fig. 2 (c) [18]). This instrument is essentially a weighing balance and consists of a highly absorbing or reflecting target suspended in a water bath. The transducer to be calibrated is mounted directly above the target. When the ultrasound is turned on, the target experiences a net force arising due to the momentum associated with the ultrasound wave. The target is connected to a sensitive balance, which measures the force acting on it. From the measured force, acoustic power is obtained by multiplying it with the sound speed. However, radiation force balance can only measure the total acoustic power contained

142 R. K. BANERJEE AND S. DASGUPTA
in the beam and is not capable of obtaining the complete acoustic pressure or intensity field.
Limitations. The calorimetric method discussed above assumes that (1) no ultrasonic energy leaves the container, (2) the amount of energy absorbed by the container walls is negligible, (3) heat transmission between the solution and the walls is negligible, and (4) the energy loss due to acoustic streaming is negligible. These assumptions make the reliability and accuracy of the power measurement method questionable.
Though the radiation force balance and hydrophones techniques are well established and widely used, there are some well-known limitations in both these methods. As mentioned earlier, most of these methods are developed primarily for diagnostic ultrasound applications. Acoustic focal intensities at the highest HIFU levels (>1000 W/cm2) are several orders of magnitude greater than the intensities used for diagnostic ultrasound [2]. These high intensities introduce limitations which are summarized below.
When the acoustic pressure near the focus exceeds the cavitation threshold of the medium (water), two main problems arise. The first is that dissolved gases are drawn out of solution producing bubbles. These bubbles can shield the sensor from the HIFU beam, thereby preventing accurate measurement of the acoustic pressure and intensity field. The second problem is that the collapse of these bubbles can ultimately damage the sensor itself. Sensor damage can also occur due to direct mechanical effects caused by large compressional and tensional forces.
In addition, the energy absorbed by the sensor can add heat that may cause thermal damage to the sensor. Moreover, the sensitivity of the hydrophone can change significantly when heated close to its Curie temperature. As a result, at high output levels, i.e., at clinically relevant power levels, the intensity and the pressure fields obtained from this technique become unreliable.
Another limitation of using hydrophones is that they can measure only the pressure field and the actual acoustic intensity is calculated based on the plane wave assumption. However, for strongly focused beams, the acoustic intensity is not proportional to the square of pressure field as the acoustic pressure and velocity are no longer in phase with each other. This will introduce significant errors in the calculation of intensity field.
As mentioned earlier, hydrophone scan data are only obtained at low transducer output levels to prevent sensor damage. At these power levels, acoustic waves usually travel undistorted in water and the acoustic spectrum at the focus does not contain significant spread of frequencies. However, at clinically relevant power levels, pressure amplitudes of the acoustic pulses become very high and sound waves begin to propagate nonlinearly in water. This results in the distortion of sinusoidal waves and generation of higher

CHARACTERIZATION METHODS OF HIFU-INDUCED THERMAL FIELD 143
harmonics. Since the acoustic absorption coefficient of water is proportional to the square of the frequency of the sound wave, the higher harmonic components are absorbed faster than the fundamental frequency resulting in nonlinear losses. As a result, extrapolating the low-power hydrophone data to clinically relevant high power levels will not provide an accurate estimation of the ultrasound field.
In addition, when the acoustic spectrum contains a lot of higher harmonics, the frequency response of the hydrophone is no longer smooth and the output signal from the hydrophone becomes very different from the actual pressure waveform [11]. Several alternative measurement methods are being developed to overcome the existing limitations and characterize the ultrasound fields at high power levels.
2. Alternate Characterization Methods
Robust Hydrophones. One possible alternative being researched is development of more robust sensors and hydrophones that can withstand high-intensity sound fields emitted by HIFU beams. Shaw et al. [18] designed a novel minimally perturbing pyroelectric sensor to measure acoustic power emitted from HIFU transducers during the actual treatment procedure. The sensor, made from PVDF, is placed in the path of the beam and operates on the pyroelectric principle. A small fraction of the power in the ultrasound beam is absorbed by the sensor resulting in a temperature increase. Due to the pyroelectric properties of the membrane, there is a separation of electrical charge which, when connected to an appropriate electrical circuit, can be measured.
Instead of directly measuring the pressure field, Schafer et al. [19] scattered the ultrasound main field using a fused silica optical fiber with polyamide-protecting coating. The scattered signal was then measured using a PVDF detector. Zanelli and Howard [20] developed a metal-coated hydrophone to minimize the risk of cavitation damage. The thin metallic coating over the piezoelectric sensing element provides a smooth outer surface which minimizes nucleation sites for cavitation. Shaw et al. [21] developed a device that measured acoustic power by estimating buoyancy forces induced in castor oil placed in the path of the HIFU beam. Ultrasound was focused on a thin container filled with castor oil and sealed with acoustically transparent plastic membrane. The device measured change in the buoyancy of the castor oil when heated by the absorption of ultrasound from which total acoustic power was estimated.
Currently, fiber-optic hydrophones are being developed and are commercially available (RP acoustics, Leutenbach, Germany; Onda Corp., Sunnyvale, CA, USA) as a viable alternative for traditional hydrophones

(a) (c)
~125 μm
~8 − 10 μm ~125 μm
100 μm
100 μm(b) (d)
~8 − 10 μm~8 − 10 μm ~125 μm
100 μm 100 μm
144 R. K. BANERJEE AND S. DASGUPTA
FIG. 3. Raman spectroscopy images of fiber-optic hydrophones with different tip diameters [25].
[22–25]. The sensitive element for measuring pressure in this device is an optic glass fiber with tip diameter varying between 7 and 100 �m (Fig. 3 [25]). This device measures the Fresnel reflectance at the glass fiber tip caused by change in optical refractive index of the medium in the presence of sound waves. The laser light is coupled into the optical fiber which is placed in the path of ultrasound. With the ultrasound turned on, the acoustic pressure waves change the density and the optical refractive index of the medium surrounding the fiber tip. This causes modulation of the laser light signal reflected by the fiber tip and is picked up by the photodetector and converted to acoustic pressure data. Advantages of this device are small tip diameter (�7 �m [23,25]), large bandwidth (up to 150 MHz), and low cost of optic fiber which can be easily repaired, if damaged, by recleaving. In addition, Morris et al. [24] developed a technique that can simultaneously measure both acoustic pressure and temperature using these hydrophones.
Nonintrusive Alternate Characterization Methods. Measurement techniques discussed above involved developing sensors which are more robust and accurate than the conventional hydrophones and radiation force balances. An alternative approach to overcome the sensor-induced inaccuracies would be to eliminate the use of sensors in the beam and nonintrusively measure the acoustic power and intensity field. One such commercially available noninvasive method is the schlieren imaging technique [26,27] which utilizes

CHARACTERIZATION METHODS OF HIFU-INDUCED THERMAL FIELD 145
changes in the optical index of refraction to qualitatively define the ultrasound field. Unlike hydrophones, which capture pressure information only at one point, the schlieren system can image the entire focal region of the ultrasound beam instantaneously. Consequently, the visual display of HIFU field provides a quick and comprehensive overview of the transducer performance. However, for quantitative evaluation, the pressure field must be reconstructed tomographically.
3. Acoustic Streaming-Based Method
To obtain quantitative estimation of the ultrasound field nonintrusively, the present authors developed a new noninvasive method which is capable of determining the acoustic power and intensity field at drive levels where conventional hydrophones become unreliable [28,29]. This new method is based on a phenomenon called acoustic streaming, which is the bulk fluid movement generated when an acoustic wave propagates through a viscous fluid medium. As the ultrasound propagates through the medium, it gets attenuated due to the viscous dissipation of energy in the medium. The momentum lost by the ultrasound wave is gained by the streaming fluid.
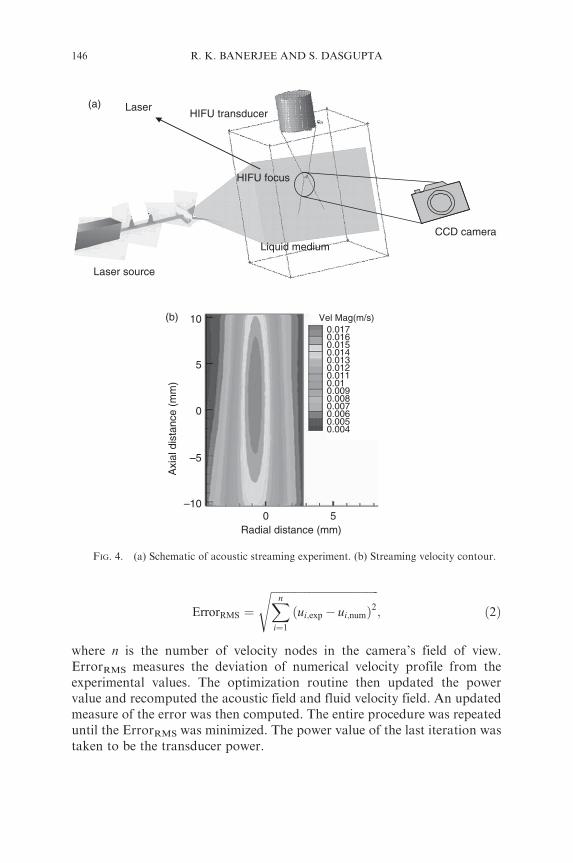
The first step in the method involved measuring the streaming velocity. As depicted in Fig. 4(a), the streaming velocity was measured using digital particle image velocimetry (DPIV). An iterative numerical algorithm (Fig. 5) was employed to back calculate the acoustic intensity field giving rise to the measured streaming field (Fig. 4 (b)). The algorithm is briefly outlined below.
The power output for the transducer to be characterized was assumed to be unknown. For the first iteration, a guess was made for the acoustic power, enabling the Khokhlov–Zabolotskaya–Kuznetsov (KZK) acoustic wave equation to be solved. From the KZK equation, the axial component of the driving force Fz was calculated from the equation:
2� � 2� p�2 p2
Fz ¼ p2 ¼ I where I ¼ ¼ ; ð1Þ2ð�0c0Þ �0c0 �0c0 2�0c0
where � is the absorption coefficient of the medium, I is time-averaged acoustic intensity, p is acoustic pressure, and “�” indicates average value. The continuity and momentum equation incorporating Fz were then solved to obtain the first iterate of the velocity field. Streaming velocity fields obtained from both experiment and computation were then used as inputs to a Nelder–Mead multidimensional optimization algorithm (Matlab 2002). The objective function in this algorithm is:
(a) Laser HIFU transducer
HIFU focus
(b) 10 Vel Mag(m/s) 0.017 0.016 0.015 0.014
5 0.013 0.012 0.011 0.01 0.009 0.008
0 0.007 0.006 0.005 0.004
Axi
al d
ista
nce
(mm
)
CCD camera Liquid medium
Laser source
–5
–10 0 5
Radial distance (mm)
146 R. K. BANERJEE AND S. DASGUPTA
FIG. 4. (a) Schematic of acoustic streaming experiment. (b) Streaming velocity contour.
sffiffiffiffiffiffiffiffiffiffiffiffiffiffiffiffiffiffiffiffiffiffiffiffiffiffiffiffiffiffiffiffiffiffiffiffiffiffiffi n
ErrorRMS ¼ ðui;exp � ui;numÞ2; ð2Þ i¼1
X
where n is the number of velocity nodes in the camera’s field of view. ErrorRMS measures the deviation of numerical velocity profile from the experimental values. The optimization routine then updated the power value and recomputed the acoustic field and fluid velocity field. An updated measure of the error was then computed. The entire procedure was repeated until the ErrorRMS was minimized. The power value of the last iteration was taken to be the transducer power.

Measure Vexperiment
(DPIV)
Guess acoustic power
Numerically calculate streaming velocity (Vnumerical)
Calculate Error = Vexperiment –Vnumerical
Is error < tolerance?
Yes
No
Refine guess for acoustic power using
optimization algorithm
Intensity field (I(r,z))
Compute intensity field using KZK equation
CHARACTERIZATION METHODS OF HIFU-INDUCED THERMAL FIELD 147
FIG. 5. Flowchart summarizing the inverse methodology used to determine acoustic power and intensity from streaming velocity field.
A HIFU beam axial intensity profile determined by the streaming technique is compared with results from hydrophone scanning in Fig. 6(a). The streaming method matches the hydrophone within 10% at this low power, in terms of both the maximum intensity and the location of the secondary maxima. The total power predicted by the streaming method also matched the power predictions based upon radiation force balance (Fig. 6 (b)). Though this noninvasive acoustic streaming technique allows characterization of HIFU transducers to be performed in an intensity range that may be harmful to conventional hydrophones, it can only be used to characterize the HIFU transducer in a liquid medium. Since the properties of tissue can vary significantly relative to water, especially the absorption and the absorption frequency dependence, noninvasive techniques for characterizing transducers in tissue-mimicking materials or in tissues are needed for improved characterization of HIFU transducers.
The streaming technique as presented in this chapter was able to characterize HIFU transducers when the acoustic power was less than about 30 W, and the corresponding intensity less than around 1400 W/cm2. These intensities, though below the levels encountered in some HIFU procedures, nonetheless represent an important clinical range [9] and are above

(a) 80 (b) 35.00 HIFU-1 (streaming) HIFU-3 (streaming)
70 HIFU-1 (RFB)Book oaloulation 30.00 HIFU-3 (RFB)
60 Hydrophone Boaning
Inte
nsity
(W
/cm
2 )
25.00
50
40
30 Pow
er (
W) 20.00
15.00
10.00 20
10 5.00
0 0.00
−4 −3 −2 −1 0 1 2 3 4 0 5 10 15 20 25 30 35 40 50 45
Axial distance (cm) Vrms
148 R. K. BANERJEE AND S. DASGUPTA
FIG. 6. (a) Intensity vs axial distance along beam measured by back calculation using streaming and hydrophone scanning. (b) Acoustic power vs voltage measured by streaming and radiation force balance (RFB).
intensities which may be damaging to conventional hydrophones. Hariharan et al. [9] label this intensity range as being just below the cavitation threshold, the “moderate” intensity regime. The streaming method provides only the intensity distribution data mea
sured in a free field. It does not give any information about the temperature field or the corresponding bio-effects which are the parameters of interest during the actual clinical procedures. Consequently, the temperature rise and the bio-effects have to be estimated computationally, using the measured intensity data, by solving bio-heat or energy equations [3,9].
The characterization methods discussed so far are applicable to liquid media which have significantly lower acoustic absorption than solid tissue media. In a tissue medium, acoustic energy is converted to heat, a phenomenon which is used for noninvasive therapeutic procedures. Hence, reliable and accurate methods are required to characterize the HIFU-induced thermal field in solid tissue media.
B. HIFU THERMAL FIELD CHARACTERIZATION IN TISSUE MEDIUM
Characterization of the HIFU thermal field involves multiple assessments, including prescription of the intensity field, quantification of temperature rise (in spatial and temporal coordinates), and lesion volume in a tissue-mimicking material or excised animal organ, determination of the location of the beam focus relative to the desired target and especially for phased arrays, and the angular orientation of the beam. Several methods for
CHARACTERIZATION METHODS OF HIFU-INDUCED THERMAL FIELD 149
assessing the HIFU-induced thermal effect in tissues or tissue phantoms are available. A popular cost-effective method to measure temperature rise is to use thermocouples embedded in excised tissues or tissue-mimicking materials (Chen et al. [31], Huang et al. [32]) subject to direct HIFU sonication at selected intensity levels. However, the use of thermocouples is an invasive procedure and highly inconvenient in clinical practice. Besides, thermocouple artifacts generated by interference of the thermocouples with the beam (Fry and Fry [33,34], Huang et al. [32], Morris et al. [35]) and manual errors in positioning the beam on the thermocouple junctions (O’Neill et al.[36]) affect the accuracy of the measured data.
In view of inaccuracies associated with direct sonication of thermocouples by the beam, nonperturbing methods have been developed to assess the thermal field. The thermal field is measured without having to focus the beam directly on the thermocouple junctions to prevent artifacts (O’Neill et al. [36]). The temperature rise measured by thermocouples that are remote from the beam is used to back calculate important characterization parameters such as the beam location and angular orientation. Determination of the beam location and orientation enables prediction of temperature rise at desired locations within the tissue phantom including the temperature at the focus.
A noninvasive method, avoiding the use of thermocouples, is to assess the temperature rise and lesion size by the MR thermometry and MR imaging methods (Dasgupta et al. [37], Qian et al. [38], Melodelima et al. [39], Anzai et al. [40]). HIFU ablations are performed on tissue samples positioned in the MRI scanner. In contrast to the method using thermocouples, the MRI thermometry method is used to noninvasively measure the spatial and temporal temperature rise and size of the HIFU lesion.
The following section discusses the existing and improved methods to characterize the HIFU thermal field in greater details.
II. HIFU Thermal Field Characterization
A. INVASIVE METHOD
1. Use of Thermocouples: Direct Sonication of Thermocouple Junction
Thin wire thermocouples embedded in tissue-mimicking materials or excised tissues have been popularly used as a cost-effective method for measuring the HIFU-induced transient temperature rise. For temperature measurement the HIFU beam is focused on the thermocouple junctions at selected power levels. Using tissue-mimicking materials with thermocouples,

150 R. K. BANERJEE AND S. DASGUPTA
bench-top HIFU experiments have been performed. Huang et al. [8] used a tissue-mimicking material provided with an artificial blood vessel to determine the effect of blood flow on HIFU procedures and also studied the effect of acoustic streaming. The HIFU beam was focused on a thermocouple placed within the vessel. Temperature rise was recorded at varying flow rate to estimate the effect of flow on temperature rise. King et al. [41] developed a gelrite-based tissue-mimicking phantom which could accurately mimic the thermal and acoustic properties of the actual tissue. The material was embedded with thermocouples to study cavitation thresholds for HIFU procedures (Maruvada et al. [42]). More recently, Chen et al. [31] used a tissue-mimicking phantom with embedded thermocouples to study acoustic cavitation in HIFU ablation. The present authors measured temperature rise in a tissue phantom (King et al. [41]), modified to include an artificial blood vessel (Fig. 7 (a), with thermocouples embedded in the material close to the vessel (Fig. 7 (b)). The purpose of the study was to investigate the effect of blood flow on HIFU-induced thermal effects by comparison of temperature measured with and without simulated blood flow through the vessel. The beam was focused on thermocouple T1, 2 mm away from the vessel, at selected power levels 5, 10.3, 17.3, and 24.8 W. At each power level, sonications were performed at flow rates 0, 400, and 600 ml/min. Temperature rise was also recorded at thermocouples T2 and T3, which are 4 and 6 mm away from the vessel, respectively. However, the method of temperature measurement using thermocouples suffers several limitations which are discussed below.
2. Limitations in Use of Thermocouples
The following limitations encountered in using thermocouples for HIFU studies have been reported by the present as well as previous researchers:
Invasive Process. The insertion of thermocouples in real tissues is an invasive process and hence inconvenient in a clinical setting. For HIFU studies, thin wire thermocouples (of diameter 20–75 �m) are used. These are fragile thermocouples and vulnerable to breakage due to mishandling. Such technical difficulties associated with the use of thermocouples limit their use.
Beam Positioning Error. For temperature measurement, the HIFU beam needs to be placed atop the thermocouple junction. A common method for positioning the beam is to move the beam until the position of maximum temperature rise during a brief sonication period is located. However, there exists a possibility of the beam to be displaced from the thermocouple junction during the manual positioning process. As noted by O’Neill et al. [36], this can lead to significant underestimates of temperature in HIFU

Transducer
Blood vessel 2 mm T1 T2 T3
HIFU beam
Thermocouple locations
Tissue phantom
(a)
Tissue-mimicking material
Vessel outlet
(b)
CHARACTERIZATION METHODS OF HIFU-INDUCED THERMAL FIELD 151
FIG. 7. (a) Photograph of fabricated tissue phantom. (b) Diagram of tissue phantom with artificial blood vessel and embedded thermocouples.
applications, due to the small widths of the HIFU beams across which temperature profiles are steep. The present authors used the manual positioning procedure to place the beam on the thermocouple junction (7B). The beam was focused on thermocouple 2 mm from the vessel. Due to the beam positioning error, which varied from day to day, there was a wide variation of temperature rise under a similar setting of power level and flow rate conditions. Figure 8(a) shows the transient temperature profiles at flow rates 0 and 400 ml/min at power level 17.3 W, in order to quantify the effect of blood flow on temperature rise. There is a rise in temperature during the 30-s heating period followed by temperature decay when the transducer is powered off. As seen in Fig. 8 (a), there is a significant standard deviation of the data (�11%) about the average of 3 days, depicted in the form of error

(a) 45
17.3 W40 Experimental (0 ml/min) Average of days 1, 2, and 3
Experimental (400 ml/min) 35
Tem
pera
ture
ris
e (°
C)
30
25 Cooling phase
20
15 Heating phase
10
5
0 0 10 20 30 40 50
Time (s)
(b) 25
Power level: 10.3 W at focus
20 0.5 mm away
1 mm away
1.5 mm away15
ΔT (
°C )
2 mm away
10
5
0 0 10 20 30 40 50 60
Time (s)
60
152 R. K. BANERJEE AND S. DASGUPTA
FIG. 8. (a) Experimental transient temperature profiles at 2 and 4 mm thermocouples at power 17.3 W (blood flow rates: 0 and 400 ml/min). Data averaged over days 1, 2, and 3 (three trials per day). Standard deviation about average is shown by error bars. (b) Computed transient temperature profile as a function of beam-thermocouple displacement at power level 10.3 W. Indicates sensitivity of temperature rise to beam-thermocouple displacement.

CHARACTERIZATION METHODS OF HIFU-INDUCED THERMAL FIELD 153
bars. Furthermore, the error bars of the no flow (0 ml/min) and flow profiles (400 ml/min) overlap each other, making it impossible to quantify the decrease in temperature rise due to blood flow cooling effect, the goal of the investigation. The sensitivity of measured temperature rise to beam positioning error was confirmed by a numerical investigation. In Fig. 8 (b) transient temperature profiles computed at various beam-thermocouple displacements show that a displacement of just 0.5 mm causes a 13% [(24 – 21)/24�C � 100] decrease in measured temperature rise. The numerical study, in conjunction with experimental data, leads to the conclusion that beam positioning error in the use of thermocouples results in significant inaccuracy in temperature measurements.
Thermocouple Artifacts. Several studies have revealed that temperature rise measured using thermocouples can be inaccurate because of thermocouple artifacts which impose an additional temperature rise over the temperature rise of the tissue material caused by pure absorption of acoustic energy. Thermocouple artifacts are primarily due to viscous heating, a phenomenon which was initially reported in the studies by Fry and Fry [33,34]. Hynynen et al. [43] performed experimental investigations to determine inaccuracies due to artifacts in HIFU-induced temperature measurements. When the temperature measurement errors were studied, even the smallest thermocouples showed some self-heating artifact and its magnitude depended on the probe size, material, structure, orientation, and the operating frequency. The experimental studies by Huang et al. [32] employed thermocouples to measure the temperature rise. Additionally, heating due to artifacts was measured by focusing the HIFU beam on a thermocouple in a low-absorbing medium. Figure 9(a), obtained from the studies by Huang et al. [32], shows that the measured profile (profile A) is higher than the calculated temperature profile (profile C) by almost three times, due to additional heating by artifacts. The calculated profile (profile C) and measured thermocouple artifact profile (profile D) were added to yield profile B, which was in close agreement with the measured temperature profile. More recently, Morris et al. [35] evaluated the proportion of thermocouple artifacts in temperature rise measured using thermocouples. A novel thin film thermocouple (TFT) was employed which could measure temperature rise without artifacts. The temperature rise measured using the TFT was subtracted from temperature measured using conventional thin wire thermocouples to estimate the artifacts.
The present authors also found the experimental temperature rise to be higher than the computed temperature rise (Fig. 9 (b)) because of artifacts. During the cooling phase, the effect of artifacts no longer exist because of the absence of the beam on the junction, and there is a close agreement between

10
30
40
50
(a) 2
1.8 a (a) measurement
Tem
pera
ture
ris
e (°
C)
1
1.2
1.4
1.6 b
(c) calculation (d) TC artifact
(b) calculation + TC artifact
0.8 c
0.6
0.4 d
0.2
00
0.5 1 1.5 2 2.5 3 3.5 4 4.5 5 Time (s)
(b) (c)60
70Exp 0 ml/min17.3 W %
Art
ifact
[(T
−
T
)/ T
]
exp
num
exp 70% 5 WExp 400 ml/min
66%60 10.3 W 17.3 W 50 24.8 W
40 38%
Num 0 ml/min
Num 400 ml/min
Tem
pera
ture
(°C
)
at 2 mm from 20 vessel
30 36% Heating Cooling20
at 2 mm from 10Heating Cooling vessel 00
0 10 20 30 40 0 10 20 30 40 Time (s) Sonication time (s)
154 R. K. BANERJEE AND S. DASGUPTA
FIG. 9. (a) Measured temperature profile (using thermocouple) and calculated profile (Huang et al. [8]). (b) Experimental and computational transient temperature profiles at 0 and 400 ml/min flow rates. Power level is 17.3 W. (c) Percent artifact vs sonication time.
the numerical and experimental temperature decay profiles. Figure 9 (c) shows percentage artifact as a function of sonication time. Percentage artifact, given as % Artifact = {[(experimental temperature rise – numerical temperature rise)/experimental temperature rise] � 100%}, shows a sharp increase in the initial few seconds of sonication (66–70%) and is comparatively lower at the end of sonications (5–12%) which is still a significant amount of inaccuracy. It is also seen that the maximum percentage artifacts, within the initial few seconds, increase with power level. A similar relation between the proportion of artifacts and sonication time was observed by Morris et al. [35], though a lower range of power levels was considered. Overall it can be concluded that direct sonication of thermocouples by the HIFU beam leads to significant inaccuracies in the measured temperature data due to artifacts.
The other source of thermocouple artifacts is mismatch of thermal conductivity between the thermocouple junction and the surrounding tissue

CHARACTERIZATION METHODS OF HIFU-INDUCED THERMAL FIELD 155
material (Nell et al. [5]). The thermocouple junction is made of metals such as copper, constantine, and cromega which have higher conductivity than the surrounding tissue material. This causes a distortion of the induced thermal field. However, conductivity artifacts can be reduced by using thermocouples with smaller junction diameters.
Localized Temperature Measurement. Thermocouples can measure temperature rise only at specific points where they are embedded or inserted and are not capable of measuring the temperature rise over the entire ablation zone. In order to determine the lesion size or to estimate the extent of tissue damage, it is required to record the spatial temperature rise at the HIFU focal zone, which necessitates an array of thermocouples to be inserted in the tissue. It is inconvenient to insert too many thermocouples in ex vivo or in vivo animal tissues to measure the spatial temperature rise.
The above limitations in the use of thermocouples call for improved methods to measure HIFU-induced thermal effects for field characterization. Improved and alternative methods to characterize the HIFU thermal field are discussed in Sections II and III.
B. NONPERTURBING METHOD
An improvement in HIFU characterization studies is the development of nonperturbing methods, to assess the thermal field in a tissue medium. In this method direct sonication of thermocouple junctions is avoided to prevent artifacts in the temperature data. The beam is focused at locations off the thermocouple junctions and the temperature rise at the remote junctions is measured. O’Neill et al. [36] performed HIFU sonications within an array of six thermocouples in the same plane. The artifact-free temperature rise measured by the thermocouples was used in a curve-fitting technique to extrapolate the temperature rise at the focus. As a result, temperature rise at the focus was more accurately estimated.
1. Inverse Method: Application in Heat Transfer Analysis
The present authors employed the inverse heat transfer method, a non-perturbing iterative method, to predict the temperature rise within a tissue-mimicking material (King et al. [41]). The method has been successfully applied outside ultrasound applications. For example, Farhanieh et al. [44] back calculated the heat transfer coefficient in a partially filled rotating cylinder, on the basis of the error between the measured and estimated temperatures on the shell. More recently, Paredes et al. [45] used a feedback strategy to solve an inverse heat transfer problem to back calculate the

156 R. K. BANERJEE AND S. DASGUPTA
unperturbed formation temperature (UFT) in well bores. The feedback system used the error between the measured and estimated temperatures during the well shut-in process to obtain the UFT.
2. Inverse Method: Application Specific to HIFU Studies
A few researchers have applied the inverse method specifically to HIFU studies. As discussed above, Hariharan et al. [28] employed an inverse algorithm to back calculate the acoustic intensity on the basis of the HIFU-induced streaming velocities measured in a liquid medium. More recently, an inverse heat transfer method to predict the temperature rise in a tissue phantom was developed by the present authors. Details of the method are discussed below.
Thermocouples Remote from Beam. In the inverse method, HIFU sonications were targeted at selected locations within a 3D array of eight thermocouples embedded in a solid medium or the tissue phantom. Direct sonication of the thermocouple junctions was avoided to overcome the possibility of artifacts corrupting temperature measurements.
Figure 10(a) shows the tissue-mimicking material (King et al. [41]) held in a cylindrical test section. An array of eight thermocouples (T1–T8) was embedded in the material (Fig. 10 (b)), forming a 3D array. Thermocouples were arranged in four layers with two thermocouples in each layer separated by a distance of 4 mm. Each layer is 2 mm from the adjacent layer. The HIFU beam was positioned at selected targets within the array while avoiding direct sonication of thermocouples. The transducer was operated at selected power levels, 5, 17.3, and 24.8 W, at each target; the temperature rise at the thermocouples T1–T8 was recorded.
The location of the HIFU beam in a tissue medium is an important parameter in assessment of the thermal field as it influences the temperature rise in the tissue. The inverse method, discussed next, uses the temperature rise measured at the remote thermocouples to back calculate the location of the beam with respect to the thermocouple array using an iterative approach.
Derivation of Beam Location and Angular Orientation. Figure 11 depicts the inverse heat transfer optimization algorithm in the form of a flowchart. As a first step, the beam location, which is an unknown parameter, was assumed and is supplied to the algorithm as an initial prediction. Based on the initial beam location temperature rise, Tnum was numerically calculated at selected thermocouples such as T3, T6, and T7, forming a subarray. The following method was employed to calculate the temperature rise at T3, T6, and T7.

� � � �
CHARACTERIZATION METHODS OF HIFU-INDUCED THERMAL FIELD 157
Tissue-mimicking Material
(a)
(b)
HIFU transducer
T1
T2 T4
T3 HIFU T5 beam
T6
T8
T7
Tissue phanton
FIG.10. (a) Tissue-mimicking material or tissue phantom held in test section. (b) Schematic of thermocouples embedded in tissue phantom.
a. Calculation of HIFU Heat Source. Sound propagation was modeled using the linearized KZK parabolic wave equation:
@ @p D @2p c0 @2p 1 @p� ¼ þ : ð3Þ3@t @z 2c @t2 2 @r2 r @r0

� �
158 R. K. BANERJEE AND S. DASGUPTA
Assume beam location (initial prediction) (xi, yi, zi)
Compute HIFU temperature rise, ΔTnum, at thermocouple nodes based on beam loca
tion
Compute optimization error metric %, δ*, at subarray nodes
Measure temperature rise, ΔTexp, at
Thermocouple junctions
Is δ min?
Final location (xf, yf, zf)
Refine assumption for beam location
Yes
No
FIG. 11. Flowchart depicting inverse heat transfer algorithm.
Here, p is the acoustic pressure, t is the retarded time, c0 is the speed of sound in tissue, r is the radial distance from the center of the beam, and D is the sound diffusivity of tissue. Equation (3) was solved using the KZK Texas finite-difference code (Lee et al. [46]) to obtain the pressure field, p (r, z).
The time-averaged acoustic intensity I (r, z) was calculated from the pressure field using the relation Iðr; zÞ ¼< p2 > =�0c0, �0 being the mean density. The HIFU-induced power deposition rate, Q, was then calculated from the relation:
Q ¼ 2:�:I ; ð4Þ where � is absorption coefficient of tissue.
b. Calculation of Tissue Temperature Rise. To determine the tissue temperature rise T(x, y, z, t), the heat equation was solved:
ð�0cpÞ@T ¼
@ k @T þ Q; ð5Þ
@t @xj @xj
where cp is the specific heat and Q is the absorbed energy obtained from Eq. (4). Equation 5 was solved using the Galerkin finite-element (FE) method as implemented in the FIDAP software (Fluent Inc., 10 Cavendish Court Lebanon, NH 03766 U.S.A).

CHARACTERIZATION METHODS OF HIFU-INDUCED THERMAL FIELD 159
The optimization error metric, d, between the measured temperature rise, Texp, and the computed temperature rise, Tnum, corresponding to the assumed beam location was calculated. d is given as:
vffiffiffiffiffiffiffiffiffiffiffiffiffiffiffiffiffiffiffiffiffiffiffiffiffiffiffiffiffiffiffiffiffiffiffiffiffiffiffiffiffiffiffiffiffiffiffiffiffiffiffiffiffiffiffiffiffiffiffiffiffiffiffiffiffiffi u n t¼150s1 X 1 u X ðTðn; tÞ � Tðn; tÞ Þ2 t exp num
� ¼ 2 ; ð6Þ n
1 150
t¼1s Tðn; tÞnum
where n is the number of thermocouples used to derive beam position. d is calculated over 100 s of heating and 50 s of the cooling profiles.
Next, the optimization algorithm refined the beam location, using the Nelder–Mead scheme (Nelder and Mead [47]), to reduce d. In this way a series of iterations were performed until d dropped to a minimum value. The location corresponding to minimum d value was taken to be the converged or derived location of the beam. In both the inverse methods (Hariharan et al. [28] and present study), the Nelder–Mead multidimensional optimization algorithm (Lagarias et al. [48], Matlab 2008) was used. Besides determining the location of the beam in three dimensions, the algorithm was also employed to calculate the angular orientation of the beam. The algorithm was modified to include the beam angle as an additional parameter, which was optimized in a series of iterations in order to minimize the error metric, d.
Results. The results of applying the inverse method is depicted in Fig. 12. Figure 12 (a) is a schematic showing the position of the thermocouples in the tissue phantom. The focal locations derived by the inverse method (black diamonds) are compared with the targeted coordinates (unfilled diamonds), in Fig. 12 (b) (z-coordinate) and Fig. 12 (c) (x,y coordinates). For example in case 1, the target location is (0,0,0) which is in between T5 and T6 thermocouples and in the plane containing these thermocouples. The derived location is shifted to (0.25,0,3). In addition to plotting convenience, the axial (z) and transverse (x,y) positions are separated due to the fact that the transverse coordinates have a much stronger influence on the temperature field than the axial coordinate, given the small transverse beam dimension relative to the axial size. (For the HIFU transducer used in the experiments, the –6 dB beam width is 1.7 mm in the radial direction compared to 24 mm in the axial direction.) The difference between the targeted axial coordinates and the derived axial coordinates is approximately 3 mm for all three cases (Fig. 12 (b)). The radial [= (x 2 þ y 2)0.5] difference varies between about 0.25 and 0.5 mm (Fig. 12 (c)). The inverse method is also extended to enhance its capability to derive the angular orientation of the beam. This is important in the characterization of transducers with phased arrays.
With knowledge of the beam location, the artifact-free temperature rise at desired locations within the phantom is predicted. In the calculations,

Power level: 17.3 W T5
1.5
y Case 3
1 Case 2
0.5
0 Case 1 x
–1.5 –1 –0.5 0 0.5 1 1.5
–0.5
–1 Derived location
Target location –1.5
T6
(a) (b)
HIFU beam z
y
Tissue−mimicking material
Transducer
T1
T2
T3
T4
T5
T6
T7 T8
6
5
4
z 3
0
Derived location
Target location
T5 T6
T2T1
Power level: 17.3 W
Case 1 Case 2 Case 3
Target locations
Axi
al lo
catio
n (m
m)
2
1
0
–1
–2
x
–3
–4
–5
–6
(c) (d) 2 20
15
10
5
0
Experimental Inverse method
Thermocouple, T1
Thermocouple, T5
Power level: 17.3 W Case 1
0 20 40 60 80 100 120 140
Tem
pera
ture
ris
e (°
C)
–2 2
–2 Time (s)
160 R. K. BANERJEE AND S. DASGUPTA
FIG. 12. (a) Schematic diagram of HIFU ablation procedure with thermocouple array. (b) Targeted and derived axial (z) beam location for cases 1, 2, and 3. (c) Targeted and derived radial (x,y) beam location for cases 1, 2, and 3. (d) Measured and predicted (inverse method) temperature profiles at thermocouples T1 and T5.
a subarray of n = 3 thermocouples, T3, T6, and T7, was used to derive the 3D beam location. The measured and predicted transient temperature profiles at thermocouples T1 and T5, not used in the calculations, are shown in Fig. 12 (d), for the case where the targeted focal location is midway between T5 and T6 (case 1). The temperature prediction error metric, ", at thermocouples T1 and T5 is approximately 4%, indicating the efficiency of the inverse method in predicting temperature rise in the tissue phantom.
C. NONINVASIVE METHOD
This section describes the imaging-based thermal field characterization methods that are suitable for measuring temperature during in vivo animal experiments or during actual clinical procedures.

Main control computer Degassed water device
256-Element therapeutic Therapeutic
phased array bed
Image acquisition
β α x
DiagnosticDiagnostic ultrasound image probe
256-Channel phased-array driving system z x 3D robotic
y positioner
Robotic electrical controller
CHARACTERIZATION METHODS OF HIFU-INDUCED THERMAL FIELD 161
1. Diagnostic Ultrasound
Diagnostic ultrasound can also be used for monitoring HIFU treatment procedures. HIFU and conventional diagnostic ultrasound imaging can be synchronized to develop a system for real-time visualization of HIFU treatment. The system was tested in vivo in pig liver by Vaezy et al. [49]. The HIFU application resulted in the appearance of a hyperechoic spot at the focus that faded gradually after cessation of HIFU exposure. The duration of HIFU exposure needed for a hyperechoic spot to appear was inversely related to the HIFU intensity.
Figure 13 shows an image-guided 256-element phased-array ultrasound surgery system (Lu et al. [50]). The system employs an extracorporeal therapy transducer, a 256-element phased-array applicator, for noninvasive focused ultrasound surgery. A diagnostic ultrasound device is introduced in the system for image guidance in surgery. The therapeutic phased arrays combined with the diagnostic probe are mounted in a water bag of degassed water, below the center of the therapeutic bed. The ultrasound is directed upward, and the degassed water provides acoustic coupling between the transducer and the patient. The integration of the therapeutic transducer and the image probe mounted on the 3D robotic positioner can move in three dimensions to target and identify tumors precisely. The surgeon can perform the ultrasound surgery conveniently on the current diagnostic image in the main control computer through the surgery procedures of 3D navigation, targeting, and monitoring. The main control computer with the main
FIG. 13. The schematic block diagram of an image-guided 256-element phased-array focused ultrasound surgery system.

162 R. K. BANERJEE AND S. DASGUPTA
operative program controls the main subsystems: the 256-channel phased-array driving system that drives the 256-element phased array, the robotic electrical controller that controls the 3D robotic positioner’s movement, the image acquisition that acquires the image from the diagnostic ultrasound image system, and the degassed water device.
2. Thermography Method
Thermal imaging can be used to investigate the localized heating effect of HIFU, to monitor temperature rise in real time. In order to visualize thermally induced protein coagulation, a phantom of polyacrylamide (PAA) gel containing fresh egg albumin was used by Song et al. [51] as a tissue-mimicking material. A high-resolution thermal camera was positioned directly over the samples to record thermal fluctuations. Two modes of ultrasound were investigated, i.e., continuous wave and pulsed wave. Through imaging processing and thermal analysis, the temperature profile of the phantoms during HIFU heating was obtained, and the optimized parameters for protein coagulation were identified. The experiments have shown that thermal imaging is an effective way to measure the bioheating effect of HIFU.
The experimental setup used by Song et al. [51] is illustrated in Fig. 14. A Merlin thermal camera with high resolution of 320 � 256 pixels focal plane arrays and 25 mm lens (FLIR Systems Inc., Boston, MA, U.S.A) was positioned directly over the phantoms to record the HIFU heating. The camera was able to measure the temperature difference as small as 0.018�C. A specially constructed HIFU tank was devised to quickly obtain the exact focal point on the phantom sample. This development dispenses with the
Thermal camera
Sono chamber
HIFU transducer
Water tank
Computer
Signal generator
RF amplifier
FIG. 14. The schematic block diagram of an image-guided 256-element phased-array focused ultrasound surgery system.

CHARACTERIZATION METHODS OF HIFU-INDUCED THERMAL FIELD 163
need to search, locate, and position with the membrane hydrophone. A specially constructed sono – chamber was devised to hold the gel phantoms, and acoustic energy could pass through the chamber without attenuation. The water temperature was 37�C.
Two modes of ultrasound waves, i.e., continuous and pulse waves, were compared to investigate the HIFU heating effect in term of temperature difference measured by the thermal camera. The continuous wave was at a frequency of 1.0 MHz, with different amplitudes. The pulsed wave was at the same frequency of 1 MHz, with 0.5, 1.0, 2.0, and 3.0 V amplitude, but only 1000 pulses within 1 s.
When PAA gel containing egg white was subjected HIFU irradiation, the focal lesion of the phantom was heated and finally coagulated. It was easy to confirm the development of a white color of the coagulated lesion under direct observation, with the increase of electrical power, the diameter of the coagulated area increased from 0 to 5.33 mm There were no temperature changes for samples 1 and 2 under continuous wave, and no temperature change was recorded for any sample under pulsed wave. But there was dramatic heating effect starting from sample 3, the most powerful heating was observed with sample 8, the maximum temperature reached nearly 60�C at 60 s (Fig. 15 (a) and (b)), and then temperature dropped slightly after that. Under visual observation, the hot spot turned white and some of the gel was even blown off by the intensive heat generated by HIFU.
The high-resolution thermal camera was used in the experiments of HIFU heating, to monitor the phantom temperature in real-time, noncontact, and noninvasive way. Different parameters for HIFU irradiation were evaluated, and it was of interest to note that HIFU continuous wave of 0.5 V amplitude, or below, demonstrated no significant heating, therefore no protein
(b) 60.0
55.0
50.0
45.0
40.0
35.0
30.0 0 20 40 60 80 100 120
Time (s)
(a)
Tem
pera
ture
(°C
)
FIG. 15. (a) Thermographic results of HIFU heating of continuous wave. (b) Heating effect of continuous wave ultrasound.

(a)
MRI orifice
Tissue sample
HIFU transducer
(b) LesionHIFU
transducer Porcine liver
Degassed water
Oscilloscope
Amplifier Signal generator
164 R. K. BANERJEE AND S. DASGUPTA
coagulation, while the highest temperature was recorded nearly 60�C in a confined coagulation area by continuous wave of 2 V amplitude.
3. Magnetic Resonance Imaging Method
A relatively recent and noninvasive method to monitor thermal therapeutic procedures such as radio-frequency (RF) and HIFU therapy is use of the magnetic resonance imaging (MRI) technique (Fig. 16(a)), for both thermometry and imaging (Qian et al. [38]). In the investigations led by Anzai et al. [40], the feasibility of MRI-guided RF ablations was evaluated for the
FIG. 16. (a) Photograph of experimental setup showing HIFU transducer aligned with tissue sample in the MRI machine. (b) Schematic of experimental setup.

CHARACTERIZATION METHODS OF HIFU-INDUCED THERMAL FIELD 165
treatment of brain tumors. Bohris et al. [52] employed the MRI method in HIFU ablation studies and validated the results by comparing the temperature maps with fiber-optic measurements in heated muscle tissue. The accuracy of the MR method for temperature measurements was found to be better than 1�C. Hynynen et al. [53] tested the feasibility of MRI-guided HIFU ablation of benign fibroadenomas in the breast. HIFU ablation under MRI guidance was performed with 64 transducers at 4.6 MHz to create lesions on 47 porcine liver samples in experiments performed by Melodelima et al. [39]. There was an 11% agreement between the HIFU-induced lesion sizes measured visually and using MR thermal dose maps.
Ultrasound imaging does not provide the high-resolution images, real-time temperature monitoring, and adequate post treatment lesion assessment required for fast and effective therapy. In contrast to ultrasound, MRI offers excellent soft tissue contrast, noninvasive temperature measurement techniques, and 3D imaging capabilities. In a separate study, the present authors validated the temperature measured by the MR thermometry method by comparing with the histology data and the numerical calculations. The MRI-monitored HIFU experimental setup used in our validation study is depicted in Fig. 16. The signal generator (Agilent technologies 33220A) generates a signal of required frequency. The signal is magnified by the amplifier (Amplifier Research 100A200B) which powers the transducer. The power input to the transducer is monitored by the oscilloscope (Model 54615B, Agilent). Freshly excised tissue samples are held in a Plexi glass tank containing degassed water and subject to HIFU ablations at selected power levels and sonication times. Experiments are performed in the 3T MRI SIEMENS scanner. The induced temperature rise and lesion size are measured by the scanner as described in the following sections:
Noninvasive Temperature Measurement. In the present study, MRI-monitored HIFU ablations were performed at varying sonication times, 20, 30 and 40 s, at a constant acoustic power level of 70 W. Prior to each sonication, three-plane localization imaging was performed to determine the position of the tissue with respect to the HIFU transducer center. Temperature measurement was performed based on the proton resonance frequency (PRF) shift thermometry (Ishihara et al. [54], De Poorter et al. [55], Rieke et al. [56]).
Prior to the execution of the HIFU ablation experiments, the MR procedure required calibration for temperature measurement. The PRF method uses changes in the phase of gradient echo images to estimate the relative temperature change DT, as given by:
’ � ’ baselineDT ¼ ; ð7Þ ��B0TE

Thermocouple
MRI orifice
Hot air
(a)
y = 3.8373x R 2 = 0.975
0
20
40
60
80
100
120
0 5 10 15 20 25 30
ΔT (°C)
Δφ (D
egre
es)
(b)
166 R. K. BANERJEE AND S. DASGUPTA
where � is the PRF change coefficient for aqueous tissue, � is the gyromagnetic ratio, B0 is the main magnetic field (= 3.0 Tesla), TE is the echo time, and �baseline is the initial phase before heating. �baseline was the phase angle of a pixel outside the heated area which corresponded to the base temperature of 22�C.
Figure 17(a) shows schematic of the experimental setup used to calibrate the scanner. The aim of the experiment was to determine the constant of proportionality relating magnetic phase change to temperature rise.
FIG. 17. (a) Experimental setup used in caliberation of MRI scanner for temperature measurement. (b) MRI calibration curve showing linear relationship between magnetic phase angle (D�) and temperature rise (DT) (R2= 0.975).

CHARACTERIZATION METHODS OF HIFU-INDUCED THERMAL FIELD 167
This constant is the product of �, �, B0, and TE in Eq. (7). To record temperature of an insulated copper–constantine fine wire, thermocouple (diameter 0.075 mm) was inserted in the tissue. The tissue was held in an MRI compatible test section and heated by hot air through a duct at the base. The temperature rise of the tissue was recorded by the thermocouple and the corresponding phase shift was recorded by the scanner every 2 s. The phase shift at each time point was obtained by averaging the phase shifts over pixels around the thermocouple junction and not on the junction, to avoid junction artifacts in the signal. The pixels chosen were very close to the junction to ensure that they experienced the same temperature rise as the junction. In this way it was ensured that a reliable MR signal was obtained at each time point. Figure 17 (b) shows the calibration curve relating phase change and temperature rise. The linear relationship y = 3.8373 � (R2 = 0.975) was found between the magnetic phase change and the temperature rise. The calibration experiment was repeated three times to ensure repeatability of the results. The standard deviation of the data was within 6% of the average.
Figure 18(a) and (b) shows the HIFU-induced transient temperature profiles in the liver sample at sonication times 20 and 40 s, respectively. When the transducer is powered on during the ablation procedure, there is a rise in temperature. This is followed by decay in temperature when the transducer is powered off. The calculated profiles (shown as solid lines) are compared to the experimental profiles (shown as black symbols). The error bars seen in the experimental data represent the standard deviation of the data about the mean of three measurements and is within +5�C. The measured average temperature rise after 20 s ablation is 62�C and that after 40 s is 72�C. The measured and the computed temperature rise at the end of the heating phase are within 11% [(70 – 62) / 70 � 100] agreement at sonication time 20 s (Fig. 18 (a)) which indicates the capability of the MRI scanner to assess the HIFU-induced temperature field within acceptable accuracy. At the highest sonication time of 40 s, the measured temperature rise is limited to �72�C (above a room temperature of 20�C), whereas the computed temperature rise is 83�C, indicating a 13% agreement. This is attributed to boiling of the tissue at higher energy levels, studied by Khokhlova et al. [57], which is not accounted for in the computations. In this study, noise filtering was achieved by using a low-pass filter, as recommended in the studies by Oshiro et al. [58]. Noise is caused by RF sources such as the RF amplifier used in the study. However, due to the filter used in the study, the temperature rise could be recorded even when the electronic components were powered on, which was not possible in the initial experiments without adequate filtering.

(a) 100
Tem
pera
ture
ris
e (°
C)
90
80
70
60
50
40
30
20
10
0
Computational Experimental
70 W: 20 s
Heating Cooling
0 10 20 30 40 50 60
Time (s)
(b)
0
10
20
30
40
50
60
70
80
90
100
Tem
pera
ture
ris
e (°
C)
Computational Experimental
Cooling
70 W: 40 s
Heating
0 10 20 30 40 50 60 70 80
Time (s)
168 R. K. BANERJEE AND S. DASGUPTA
FIG. 18. Temperature rise as a function of time for (a) 20 s and (b) 40 s ablations at 70 W power. Numerical and experimental (MR) temperature data compared.
Lesion Size Measurement. MRI was used for imaging the HIFU-induced lesions at selected depths within the tissue. Figure 19 shows MRI-recorded lesions in the liver sample at sonication times 20, 30, and 40 s at three

=
HIFU lesion on ex vivo procine liver at different Acoustic power 70 W
40 s 20 s 30 s
20 s 30 s 40 s
40 s 30 s 20 s
HIFU beam
CHARACTERIZATION METHODS OF HIFU-INDUCED THERMAL FIELD 169
FIG. 19. MRI images of lesions (in white) and numerically generated lesions (black outline) are superimposed for 20, 30, and 40 s sonications at three depths.
different depths (rows 1, 2, and 3) within the tissue. Rows 1, 2, and 3 correspond to intensity levels: 1704, 1220, and 817 W/cm2. The MRI lesions are compared to the calculated lesion contours (shown as black outlines). It is seen that at a given depth, the size of the lesion increases with sonication time. Also lesion size at a given sonication time decreases with depth from the tissue surface. This is because with increasing depth there is an increase in the attenuation of HIFU energy by the intervening medium between the focus and the tissue surface. It is also seen that the lesions at high-intensity levels (row 1) possess a tadpole shape instead of the typical cigar shape. This is attributed to the redistribution of HIFU energy by bubbles formed as a result of tissue boiling, a phenomenon observed by Khokhlova et al. [57].
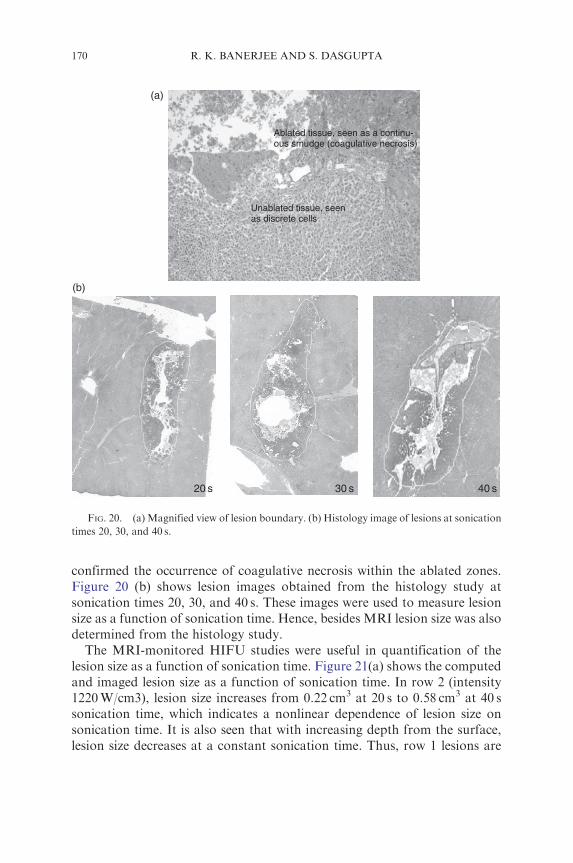
After the ablation experiments, the liver samples were subjected to histology examination of the exposed tissue zones. Figure 20(a) shows the magnified view of the lesion boundary. The tissue region subjected to HIFU exposure appears as a continuous smudge of cells indicative of coagulative necrosis and is clearly demarcated from the surrounding undamaged tissue which appears as a collection of discrete cells. Thus, the examination
(a)
Unablated tissue, seen as discrete cells
Ablated tissue, seen as a continuous smudge (coagulative necrosis)
(b)
20 s 30 s s
170 R. K. BANERJEE AND S. DASGUPTA
FIG. 20. (a) Magnified view of lesion boundary. (b) Histology image of lesions at sonication times 20, 30, and 40 s.
40
confirmed the occurrence of coagulative necrosis within the ablated zones. Figure 20 (b) shows lesion images obtained from the histology study at sonication times 20, 30, and 40 s. These images were used to measure lesion size as a function of sonication time. Hence, besides MRI lesion size was also determined from the histology study.
The MRI-monitored HIFU studies were useful in quantification of the lesion size as a function of sonication time. Figure 21(a) shows the computed and imaged lesion size as a function of sonication time. In row 2 (intensity 1220 W/cm3), lesion size increases from 0.22 cm3 at 20 s to 0.58 cm3 at 40 s sonication time, which indicates a nonlinear dependence of lesion size on sonication time. It is also seen that with increasing depth from the surface, lesion size decreases at a constant sonication time. Thus, row 1 lesions are

CHARACTERIZATION METHODS OF HIFU-INDUCED THERMAL FIELD 171
(a) 1
0.9
0.8
Lesi
on v
olum
e (c
m3 ) 0.7
0.6
0.5
0.4
0.3
0.2
0.1
0
expt 1st row num 1st row expt 2nd row num 2nd row expt 3rd row num 3rd row
0 5 10 15 20 25 30 35 40 45 Sonication time (s)
0.19
0.51
0.21
0.37 0.33
0.22
0.58
0.38
0.63
0
0.1
0.2
0.3
0.4
0.5
0.6
0.7
Lesi
on v
olum
e (c
m3 )
Histology
Numerical
MRI
(b)
20 30 40 Sonication time (s)
FIG. 21. (a) HIFU lesion volume vs sonication time for numerical and MR methods. (b) Lesion volume for different sonication times, as determined by histology, numerical simulation, and MR imaging.
larger than the lesions in rows 2 and 3. This is because of decrease of focal intensity with depth.
In Fig. 21 (b), lesion size obtained from three methods, histology, numerical, and MRI, are compared at sonication times 20, 30, and 40 s in row 2.

172 R. K. BANERJEE AND S. DASGUPTA
It is seen that there is a 13% agreement among the lesion size obtained by using all the three methods. Hence, this is for the first time that all the three methods were used to determine the HIFU lesion size as a function of operating parameters like sonication time and acoustic intensity.
Validation of Computational Models. Computational modeling is an important tool in HIFU studies for predicting the induced thermal effects. Several studies have used numerical models to calculate the HIFU-induced temperature rise and lesion size (Hariharan et al. [9]). For reliable prediction of the thermal effects, it is necessary to validate the models. Subsequent to the MRI-monitored HIFU studies, computations were performed to calculate the temperature rise and lesion size in the excised liver, at the selected sonication times 20, 30, and 40 s. Equations 3–5, as described before, are solved to obtain the transient temperature rise in the tissue medium. The transient temperature field was used in thermal-dose and lesion-volume calculations. Thermal dose, used for calculation of lesion size, was computed throughout the tissue medium, using the method developed by Sapareto and Dewey [59]. They showed that an exponential relation exists between the tissue temperature and the exposure time required to coagulate the tumor cells. The thermal-dose parameter is expressed as:
t¼tfinal Z t43ðx; y; zÞ ¼ R43 � TðtÞdt; ð8Þ
t¼0
where t43 is the thermal dose at the reference temperature of 43�C, and tfinal is the treatment time.
T(t) is the temperature (in degree Celsius) as a function of time obtained experimentally, and, ( )
0:5 if TðtÞ � 43oCR ¼ :
0:25 otherwise
According to this relation, thermal dose resulting from heating the tissue to 43�C for 240 min is equivalent to that achieved by heating to 56�C for 1.76 s. The bounding surface of the HIFU lesion was taken to be the surface where the thermal dose attained a value of 240 equivalent minutes at 43�C. The lesion volume is the amount of tissue within the surface. He et al. [60] found that the thermal-dose threshold values and the R values are different for different urological systems. In principle, the threshold established for the particular organ and species should be used in thermal-dose calculations. As these values are often not available, a value of 240 equivalent minutes is usually used. For example, in the HIFU ablation studies by Righetti et al.

CHARACTERIZATION METHODS OF HIFU-INDUCED THERMAL FIELD 173
[61] involving excised livers, a thermal dose of 243 min (�240 min) was used as the threshold for cell necrosis.
The temperature rise and lesion volume obtained from the calculations were compared with results of MRI thermometry and a 13% agreement was found (Figs. 18 and 21). Thus, besides measuring the temperature rise and lesion volume noninvasively, the MRI and histology methods were also useful in validating results of computational methods.
III. Future Direction
In order to ensure safety of patients during HIFU therapy and to enhance effectiveness of the procedure, proper characterization of HIFU devices, for accurate prediction of the induced thermal field, is necessary. The MRI thermometry method and the inverse heat transfer method have both been found useful in the characterization of the HIFU thermal field. Such methods will be useful to device manufacturers as well as regulatory bodies like the FDA, to better evaluate the performance of HIFU devices. However, the present studies can be extended or modified for enhancing the accuracy of thermal field characterization.
A. IMPROVEMENT IN CALCULATIONS: ACCOUNTING FOR BOILING, CAVITATION, AND NONLINEARITY
The computational method to calculate temperature rise and lesion size, under a given set of operating parameters, is usually limited by the assumption of linearity and the inability to treat cavitation or boiling. The computational method employed by the present authors has the capability to calculate the HIFU-induced temperature rise and lesion volumes within acceptable accuracy especially at low or moderate energy levels. The authors feel that for a greater accuracy in predicting temperature rise and lesion size at high energy levels, in future HIFU studies, the computational method should account for boiling, cavitation, and nonlinearity. The HIFU heat source can be modified to account for the redistribution of energy due to the bubbles.
B. EXTENSION OF INVERSE HEAT TRANSFER METHOD: CALCULATION OF
INTENSITY AND ACOUSTIC ABSORPTIVITY
The inverse method developed in the study derives the location of the HIFU beam. The method can also be applied to derive other variables, such

174 R. K. BANERJEE AND S. DASGUPTA
as the acoustic power. In this instance, it is essential that a nonlinear propagation model be used by the optimization scheme. The propagation model, used in recent studies, is the linearized KZK algorithm, but any appropriate propagation model can be incorporated into the inverse procedure. In the iterative procedure, the acoustic power would be combined with the focal coordinates as a fourth parameter. Alternatively, a subsequent optimization based upon power can be performed once the focal coordinates have been determined, though any influence of the power on the focal position would not be captured adequately.
Disclaimer: The mention of commercial products, their sources, or their use in connection with material reported herein is not to be construed as either an actual or an implied endorsement of such products by the US Department of Health and Human Services.
References
1. Curra, F. P. and Crum, L. A. (2003). Therapeutic ultrasound: surgery and drug delivery. Acoust. Sci. Technol. 24(6), 343–348.
2. ter Haar, G. R. (2001). Acoustic surgery. Phys. Today 54(12), 29–34.
3. Hariharan, P., Chang, I., Banerjee, R. K., and Myers, M. R. (2007). Radio frequency (RF) ablation in a realistic reconstructed hepatic tissue. J. Biomech. Eng. 129, 354–364.
4. Ren, X. L., Zhou, X. D., Yan, R. L., Liu, D., Zhang, J., He, G. B., Han, Z. H., Zheng, M. J., and Yu, M. (2009). Sonographically guided extracorporeal ablation of uterine fibroids with high -intensity focused ultrasound: midterm results. J. Ultrasound Med. [Letters to the Editor]. 28, 95–103.
5. Nell, D. M. and Myers, M. R. (2010). Thermal effects generated by high-intensity focused ultrasound beams at normal incidence to a bone surface. J. Acoust. Soc. Am. 127(1), 549–559.
6. Civale, J., Clarke, R., Rivens, I., and ter Haar, G. (2006). The use of a segmented transducer for rib sparing in HIFU treatments. Ultrasound Med. Biol. 32(11), 1753–1761.
7. Kolios, M. C., Sherar, M. D., and Hunt, J. W. (1996). Blood flow cooling and ultrasonic lesion formation. Med. Phys. 23, 287–1298.
8. Huang, J., Holt, R. G., Cleveland, R. O., and Roy, R. A. (2004). Experimental validation of a tractable numerical model for focused ultrasound heating in flow-through tissue phantoms. J. Acoust. Soc. Am. 116, 2451–2458.
9. Hariharan, P., Banerjee, R. K., and Myers, M. R. (2007). HIFU procedures at moderate intensities—effect of large blood vessels. Phys. Med. Biol. 52, 3493–3513.
10. Harris, G. R. (2010). FDA regulation of clinical high intensity focused ultrasound (HIFU) devices. In “2009 Proceedings of IEEE Ultrasonic Symposium.” Rome, Italy pp. 145–148.
11. Shaw, A. ter Haar, G. R. (2006). “Requirements for Measurement Standards in High Intensity Focused (HIFU) Ultrasound Fields.” National Physical Laboratory (NPL) report. ISSN 1744–0599.
12. IEC 61157. (1992). Requirements for the declaration of the acoustic output of medical diagnostic ultrasonic equipment. International Electrotechnical Commission. Geneva, Switzerland.

CHARACTERIZATION METHODS OF HIFU-INDUCED THERMAL FIELD 175
13. IEC 61161. (1992). Ultrasonic power measurements in liquids in the frequency range 0.5 MHz to 25 MHz. International Electrotechnical Commission. Geneva, Switzerland.
14. Preston, R. C. (2000). Standards for measurement. Ultrasound Med. Biol. 26(Suppl. I), S63–S67.
15. Zeqiri, B. and Hodenett, M. (2010). Measurements, phantoms, and standardization. J. Eng. Med. 224, 375–391.
16. Harris, G. R. (2005). Progress in medical ultrasound exposimetry. IEEE Trans. Ultrason. Ferroelectr. Freq. Control 52(5), 717–736.
17. Hallez, L., Touyeras, F., Hihn, J. Y., and Klima, J. (2007). Energetic balance in an ultrasonic reactor using focused or flat high frequency transducers. Ultrasonics 14, 739–749.
18. Shaw, A. (2004). Delivering the right dose, advanced metrology for ultrasound in medicine. J. Phys. Conf. Ser. 1, 174–179.
19. Schafer, M. E., Gessert, J. E., and Moore, W. (2006). Development of a High Intensity Focused Ulrasound (HIFU) Hydrophone System. Proc. Int. Symp. Ther. Ultrasound 2005. 829, 609–613.
20. Zanelli, C. I. and Howard, S. M. (2006). A robust hydrophone for HIFU metrology. Proc. Int. Symp. Ther. Ultrasound 2006 829, 618–622.
21. Shaw, A. (2006). How to measure HIFU output properly. Proc. Int. Symp. Ther. Ultrasound 2005 829, 628–632.
22. Wang, Z. Q., Lauxmann, P., Wurster, C., Kohler, M., Gompf, B., and Eisenmenger, W. (1999). Impulse response of a fiber optic hydrophone determined with shock waves in water. J. Appl. Phys. 85(5), 2514–2516.
23. Lewin, P. A., Mu, C., Umchid, S., Daryoush, A., and El-Sherif, M. (2005). Acousto-optic, point receiver hydrophone probe for operation up to 100 MHz. Ultrasonics 43, 815–821.
24. Morris, P., Hurrell, A., Shaw, A., Zhang, E., and Beard, P. (2009). A Fabry-Perot fiber-optic ultrasonic hydrophone for the simultaneous measurement of temperature and acoustic pressure. J. Acoust. Soc. Am. 125(6), 3611–3622.
25. Gopinath, R., Arora, P., Gandhi, G., Daryoush, A. S., El-Sherif, M., and Lewin, P. A. (2009). Thin film metal coated fiber optic hydrophone probe. Appl. Opt. 48(31), G77–G82.
26. Harland, A. R., Petzing, J. N., and Tyrer, J. R. (2002). Non-invasive measurements of underwater pressure fields using laser Doppler velocimetry. J. Sound Vib. 252(1), 169–177.
27 27. Theobald, P., Thompson, A., Robinson, S., Preston, R., Lepper, P., Swift, C., Yuebing, W., and Tyrer, J. (2004). “Fundamental Standards for Acoustics Based on Opti
calo Methods—Phase Three Report for Sound in Water.” National Physical Laboratory (NPL) report 2004. CAIR9 ISSN 1740-0953.
28. Hariharan, P., Myers, M. R., and Banerjee, R. K. (2008). Characterizing medical ultrasound fields using acoustic streaming. J. Acoust. Soc. Am. 123(3), 1706–1719.
29. Myers, M. R., Hariharan, P., and Banerjee, R. K. (2008). Direct methods for characterizing high-intensity focused ultrasound transducers using acoustic streaming. J. Acoust. Soc. Am. 124(3), 1790–1802.
30. MATLAB 2008, Mathworks INC. 31. Chen, D., Fan, T., Zhang, D., and Wu, J. (2009). A feasibility study of temperature rise
measurement in a tissue phantom as an alternative way for characterization of the ther
apeutic high intensity focused ultrasonic field. Ultrasonics 49(8), 733–742. 32. Huang, J., Holt, R. G., Cleveland, R. O., and Roy, R. A. (2004). Experimental validation of
a tractable numerical model for focused ultrasound heating in flow-through tissue phantoms. J. Acoust. Soc. Am. 116, 2451–2458.
33. Fry, W. J. and Fry, R. B. (1954). Determination of absolute sound levels and acoustic absorption coefficients by thermocouple probes-theory. J. Acoust. Soc. Am. 26, 294–310.

176 R. K. BANERJEE AND S. DASGUPTA
34. Fry, W. J. and Fry, R. B. (1954). Determination of absolute sound levels and acoustic absorption coefficients by thermocouple probes-experiments. J. Acoust. Soc. Am. 26, 311–317.
35. Morris, H., Rivens, I., Shaw, A., and ter Haar, G. (2008). Investigation of the viscous heating artifact arising from the use of thermocouples in a focused ultrasound field. Phys. Med. Biol. 53, 4759.
36. O’Neill, B., Vo, H., Angstadt, M., Li, K. P.C., Quinn, T., and Frenkel, V. (2009). Pulsed high intensity focused ultrasound mediated nanoparticle delivery: mechanisms and efficacy in murine muscle. Ultrasound Med. Biol. 35, 416–424.
37. Dasgupta, S., Wansapura, J., Hariharan, P., Pratt, R., Witte, D., Myers, M. R., and Banerjee, R. K. (2010). HIFU lesion volume as a function of sonication time, as determined by MRI, histology, and computations. J. Biomech. Eng. Aug; 132(8).
38. Qian, Z. W., Xiong, L., Yu, J., Shao, D., Zhu, H., and Wu, X. (2006). Non-invasive thermometer for HIFU and its scaling. Ultrasonics 44, 31–35.
39. Melodelima, D., Salomir, R., Mougenot, C., Moonen, C., and Cathignol, D. (2006). 64-element intraluminal ultrasound cylindrical phased array for transesophageal thermal ablation under fast MR temperature mapping: an ex vivo study. Med. Phys. 33, 2926–2934.
40. Anzai, Y., Luftkin, R., DeSalles, A., Hamilton, D. R., Farahani, K., and Black, K. L. (2005). Preliminary experience with MR-guided thermal ablation of brain tumors. Am. J. Neuroradiol. 16, 39–48.
41. King, R. L., Herman, B. A., Maruvada, S., Wear, K. A., and Harris, G. R. (2006). Development of a HIFU phantom. Proc. 6th Int. Symp. Ther. Ultrasound 911, 351–356.
42. Maruvada, S., Liu, Y., Herman, B., Pritchard, W. F., and Harris, G. R. (2008). Tempera
ture measurements and determination of cavitation thresholds during High Intensity Focused Ultrasound (HIFU) exposures in ex-vivo porcine muscle. J. Acoust. Soc. Am. 123, 2995.
43. Hynynen, K. and Edwards, D. K. (1989). Temperature measurements during ultrasound hyperthermia. Med. Phys. 16, 618–626.
44. Farhanieh, B. and Heydari, M. M. (2008). An inverse problem method for overall heat transfer coefficient estimation in a partially filled rotating cylinder. Heat Transf. Eng. 29, 272–283.
45. Paredes, G. E. and Martinez, E. G. E. (2009). A feedback-based inverse heat transfer method to estimate unperturbed temperatures in wellbores. Energy Convers. Manageme. 50, 140–148.
46. Lee, Y. S. (1993). Numerical solution of the KZK equation for pulsed finite amplitude sound beams in thermoviscous fluids, PhD dissertation University of Texas at Austin.
47. Nelder, J. A. and Mead, R. (1965). A simplex method for function minimization. Comput. J. 7, 308–313.
48. Lagarias, J. C., Reeds, J. A., Wright, M. H., and Wright, P. E. (1995). “Convergence Properties of the Nelder-Mead Algorithm in Low Dimensions.” AT&T Bell Laboratories, Tech. Rep. Murray Hill, NJ.
49. Vaezy, S., Shi, X., Martin, R. W., Chi, E., Nelson, P. I., Bailey, M. R., and Crum, L. A. (2001). Real-time visualization of high-intensity focused ultrasound treatment using ultrasound imaging. Ultrasound Med. Biol. 27(1), 33–42.
50. Mingzhu, Lu., Wan, M., Xu, F., Wang, X., and Chang, X. (2006). Design and experiment of 256-element ultrasound phased array for noninvasive focused ultrasound surgery. Ultrasonics 44(1), e325–e330.
51. Song, C., Marshall, B., McLean, D., Frank, T., Cuschieri, A., Campbell, P., and Sibbet, W. (2005). Thermo graphic investigation of the heating effect of high intensity focused ultrasound. Conf. Proc. IEEE. Eng. Med. Biol. Soc. 4, 3456–3458.

CHARACTERIZATION METHODS OF HIFU-INDUCED THERMAL FIELD 177
52. Bohris, C., Schreiber, W. G., and Jenne, J. (1995). Quantitative MR temperature monitor
ing of high intensity focused ultrasound therapy. Magn. Reson. Imaging 17, 603–610. 53. Hynynen, K., Pomeroy, O., Smith, D. N., Huber, P. E., McDannold, N. J., Kettenbach, J.,
Baum, J., Singer, S., and Jolesz, F. A. (2001). MR imaging-guided focused ultrasound surgery of fibroadenomas in the breast: a feasibility study. Radiology 219, 176–185.
54. Ishihara, Y., Calderon, A., Watanabe, H., Okamoto, K., Suzuki, Y., Kuroda, K., and Suzuki, Y. (1995). A precise fast temperature mapping using water proton chemical shift. Magn. Reson. Med. 34, 814–823.
55. De Poorter, J., Wagter, C. D., Deene, Y. D., Thomsen, C., Sta� hlberg, F., Achten, E., and Noninvasive MR, I. (2005). Thermometry with the proton resonance frequency (PRF) method: in vivo results in human muscle. Magn. Reson. Med. 33, 74–81.
56. Rieke, V., Vigen, K., Sommer, G., Daniel, B. L., Pauly, J. M., and Butts, K. (2004). Referenceless PRF shift thermometry. Magn. Reson. Med. 51(6), 1223–1231.
57. Khokhlova, V. A., Bailey, M. R., Reed, J. A., Cunitz, B. W., and Kaczkowski, P. J. (2006). Effects of nonlinear propagation, cavitation, and boiling in lesion formation by high intensity focused ultrasound in a gel phantom. J. Acoust. Soc. Am. 119(3), 1834–1848.
58. Oshiro, T., Sinha, U., Lu, D., and Sinha, S. (2002). Reduction of electronic noise from radiofrequency generator during radiofrequency ablation in interventional MRI. J. Comput. Assist. Tomogr. 26(2), 308–316.
59. Saperato, S. and Dewey, W. C. (1984). Thermal dose determination in cancer therapy. Int. J. Radiat. Oncol. Biol. Phys. 10(6), 787–800.
60. He, X., Bhowmick, S., and Bischof, J. C. (2009). Thermal therapy in urologic systems: a comparison of Arrhenius and thermal isoeffective dose models in predicting hyperthermia injury. J. Biomech. Eng. 131(7), 74507.
61. Righetti, R., Kallel, F., Stafford, R. J., Price, R. E., Krouskop, T. A., Hazle, J. D., and Ophir, J. (1999). Elastographic characterization of HIFU-induced lesions in canine livers. Ultrasound Med. Biol. 25(7), 1099–1113.