banaskantha, gujaratbanaskantha, gujarat banaskantha pradhan mantri krishi sinchayee yojana (pmksy)...
TRANSCRIPT

Pradhan Mantri Krishi Sinchayee Yojana (PMKSY)
District Irrigation Plan (2016-2020)BANASKANTHA, GUJARAT
BANASKANTHA

Pradhan Mantri Krishi Sinchayee Yojana (PMKSY)
District Irrigation Plan (2016-2020)BANASKANTHA, GUJARAT
BANASKANTHA

Contents
INTRODUCTION .................................................................................................................... 9
i. Background ....................................................................................................................... 9
ii. Vision .............................................................................................................................. 14
iii. Objective ....................................................................................................................... 14
iv. Strategy/approach ....................................................................................................... 15
v. Programme Components ............................................................................................. 15
v. Rationale/ Justification ................................................................................................ 17
vi. Methodology ................................................................................................................. 17
1 General Information of the District ............................................................................ 19
1.1 District Profile ......................................................................................................... 19
1.2 Demography ............................................................................................................ 21
1.3 Biomass and Livestock ........................................................................................... 24
1.4 Agro-Ecology, Climate, Hydrology and Topography......................................... 25
1.5 Soil Profile ............................................................................................................... 27
1.6 Land Use Pattern .................................................................................................... 30
2 District Water Profile .................................................................................................... 33
2.1 Area Wise, Crop Wise Irrigation Status .............................................................. 33
2.2 Production and Productivity of Major Crops ..................................................... 35
2.2.1 Agricultural Crops ............................................................................................ 35
2.2.2 Horticultural Crops ........................................................................................... 37
2.3 Irrigation Based Classification ............................................................................. 39
3 Water Availability .......................................................................................................... 40
3.1 Status of Water Availability .................................................................................. 41
3.2 Status of Ground Water Availability .................................................................... 42
3.3 Status of Command Area ....................................................................................... 45
3.4 Existing type of Irrigation ..................................................................................... 46
4 Water Requirement /Demand..................................................................................... 49

1
4.1 Domestic Water Demand ...................................................................................... 49
4.2 Crop Water Requirement ...................................................................................... 50
4.3 Livestock Water Requirement .............................................................................. 51
4.4 Industrial Water Requirement ............................................................................. 52
4.5 Water Demand for Power Generation ................................................................. 53
4.6 Total Water Demand of the district for various sectors .................................... 53
4.7 Water Budget .......................................................................................................... 53
5 Strategic Action Plan for Irrigation in District under PMKSY ............................... 55
5.1 Component wise Strategic Action Plan ............................................................... 55
5.2 Department wise allocation of budget ................................................................. 57
5.3 Year wise Strategic Action Plan .............................................................................. 58
5.4 Abstract of Strategic Action Plan ......................................................................... 59
5.5 Monitoring and Evaluation ................................................................................... 64
5.6 Output & Outcome ................................................................................................. 64
5.6.1 Additional Area to be irrigated ...................................................................... 64
5.6.2 Employment Generation ................................................................................ 65
5.6.3 Increase in the income of farmers ................................................................ 65
5.7 Suggestions .............................................................................................................. 66
5.8 Annexure - Department wise strategic action plans .......................................... 66
5.8.1 Nodal Irrigation Department ........................................................................ 66
5.8.2 SSNNL .............................................................................................................. 71
5.8.3 GWRDC ............................................................................................................ 73
5.8.4 GLDC ................................................................................................................. 75
5.8.5 GGRC ................................................................................................................ 77
5.8.6 GSWMA ............................................................................................................ 82
5.8.7 ATMA ................................................................................................................ 87

2
List of Tables
Table 1.1: Information of district ........................................................................................ 20
Table 1.2: Administrative Division ..................................................................................... 20
Table 1.3: Gender wise Classification of Population ........................................................ 21
Table 1.4: Category wise population ................................................................................... 22
Table 1.5: Locality wise population ..................................................................................... 23
Table 1.6: Population of small animals .............................................................................. 24
Table 1.7: Population of large animals & draft animals ................................................... 24
Table 1.8: Agro-Ecological Situations ................................................................................ 25
Table 1.9: Agro-Ecology data ............................................................................................... 27
Table 1.10: Land Use Pattern ............................................................................................... 30
Table 2.1: Irrigation status of Agriculture Crops (2013-14) - District Summary ......... 33
Table 2.2: Crop wise irrigation status ................................................................................ 34
Table 2.3 Status of Irrigation for Horticulture Crops (2014-15) .......................................... 35
Table 2.4: Production & Productivity in Kharif Season ....................................................... 35
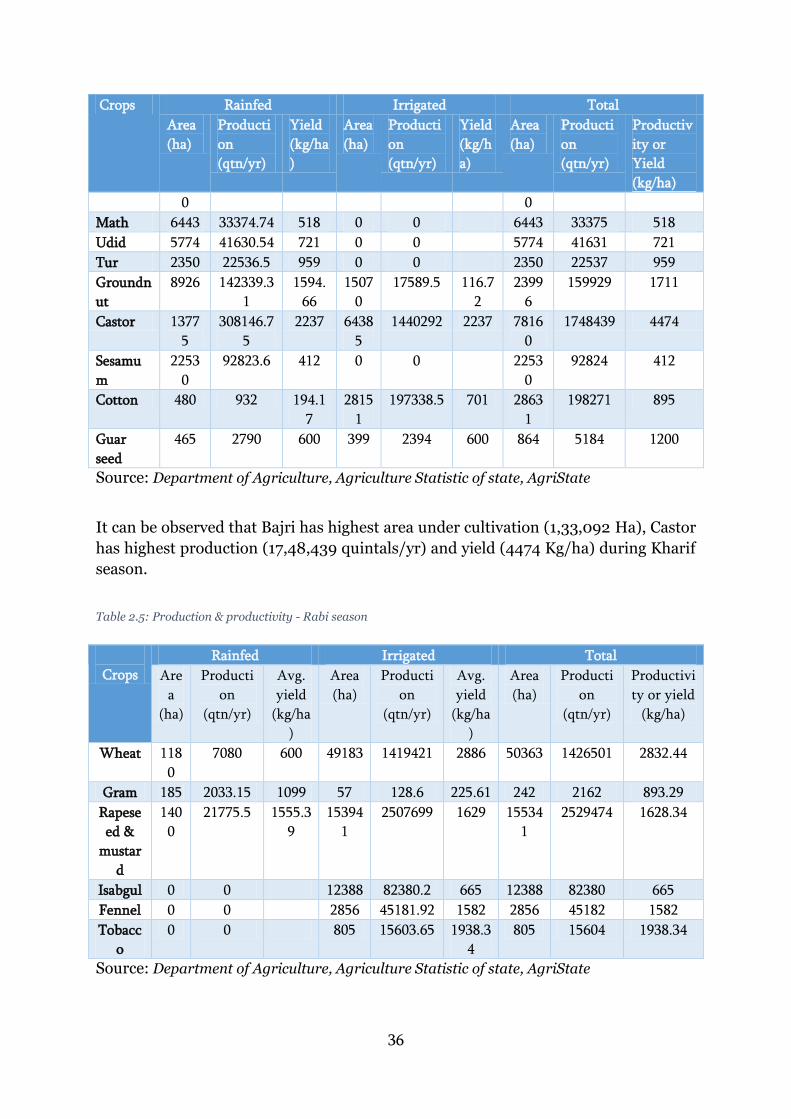
Table 2.5: Production & productivity - Rabi season ........................................................ 36
Table 2.6: Production & Productivity - Summer Season ................................................. 37
Table 2.7: Production & Productivity of Horticulture Crops in Banaskantha .................... 37
Table 2.8: Irrigation based classification ........................................................................... 39
Table 3.1: Status of water availability ................................................................................. 41
Table 3.2: Status of ground water availability .................................................................. 44
Table 3.3: Status of Canal Command ................................................................................. 45
Table 3.4: Status of other services command .................................................................... 45
Table 3.5: Existing type of irrigation .................................................................................. 47
Table 4.1: Present domestic water demand ....................................................................... 49
Table 4.2: Projected domestic water demand (2020) ...................................................... 49
Table 4.3: Crop Water Requirement .................................................................................. 50
Table 4.4 Crop wise water requirement ................................................................................ 51
Table 4.5: Livestock water demand .................................................................................... 51
Table 4.6: Industrial water demand ................................................................................... 53
Table 4.7: Total water demand of district .......................................................................... 53
Table 4.8: Water budget ....................................................................................................... 53

3
Table 5.1 Component wise plan ........................................................................................... 55
Table 5.2 Department wise allocation of plan ................................................................... 57
Table 5.3 GSWMA Plan Abstract .......................................................................................... 57
Table 5.4 Convergence with MNREGA ................................................................................ 58
Table 5.5 Abstract of Strategic Action Plan .......................................................................... 59
Table 5.6 Additional Area to be irrigated .............................................................................. 65
Table 5.7 Employment Generation ..................................................................................... 65
Table 5.8 Strategic plan of Nodal Irrigation Department - district level ...................... 66
Table 5.9 Strategic plan of Nodal Irrigation Department - taluka level ........................ 67
Table 5.10 Strategic action plan SSNNL - district summary .......................................... 71
Table 5.11 Strategic action plan SSNNL CE Mehsana - Taluka level ............................. 72
Table 5.12 Strategic action plan SSNNL CE Patan - Taluka level ........................................ 72
Table 5.13 Strategic action plan GWRDC- district summary .............................................. 73
Table 5.14 Strategic action plan GWRDC- Taluka Summary .............................................. 73
Table 5.15 Strategic action plan GLDC district summary .................................................... 75
Table 5.16 Strategic Action Plan of GLDC Taluka Summary ............................................... 75
Table 5.17 Strategic Action Plan of GGRC district summary .............................................. 77
Table 5.18 Strategic Action Plan of GGRC Taluka Summary .............................................. 78

4
List of Figures
Figure 1.1 Population wise Classification in Banaskantha District ...................................... 22
Figure 1.2 Category wise population ..................................................................................... 23
Figure 1.3 Population of dairy animals .................................................................................. 25
Figure 2.1: Area wise irrigation status ................................................................................ 34
Figure 3.1: Sources of Water Availability ........................................................................... 42
Figure 5.1 Component wise allocation of budget .............................................................. 56
Figure 5.2 Yearly budget requirement................................................................................... 58
List of Maps
Map 1-1 Location Map of Banaskantha district .................................................................... 21
Map 1-2 District Soil Map ...................................................................................................... 28
Map 1-3 District Watershed map ........................................................................................... 29
Map 1-4 Land use classification map ..................................................................................... 32
Map 3-2 Canal Map of district ............................................................................................... 46

5
Executive Summary
In an agrarian economy like India, agriculture utilizes the major share of country‟s
exploitable water resources. Though the sector utilizes the maximum share of
exploitable water resources, availability of the same at different locations to different
extent makes it vital to adopt effective utilization of water through storage,
channelizing and judicial use. At some places like Punjab and Haryana, the
environmental and socio-economic rationale for this capture by the sector is now
being questioned. Accordingly, it is needed to challenge and change the
fundamentals of the prevailing view of water resources exploitation. A new and more
suitable approach to water resources allocation is necessary if the population is to be
adequately fed, without further degradation and destruction of the critical ecosystem
services. Water productivity needs to be enhanced considerably, and economic cost-
benefit analysis and pricing regimes can play a significant role in such a process.
However, these economic measures will not be sufficient on their own. They will
need to be buttressed by technological innovation and institutional changes in order
to encourage a more equitable distribution of resources and to mitigate potential
international conflicts across 'shared' water basins.
Water has unique characteristics that determine both its allocation and use as a
resource by agriculture. Agricultural use of water for irrigation is itself contingent on
land resources. In a situation of growing water scarcity and rising demands for non-
agricultural (household and industrial) use of water, reassessment of sectoral
allocations of water are inevitable. In developing countries, irrigated agriculture
plays a vital role in contributing towards domestic food security and poverty
alleviation. Therefore, achievement of these objectives is dependent on adequate
allocations of water to agriculture. Justification of such allocations requires that
irrigated agriculture be a cost-effective means of achieving stated political or social
objectives, such as food security or poverty alleviation, and that all externalities be
taken into account in the pricing mechanism. Improved allocation of irrigation water
is required within the agriculture sectors in order to achieve greater efficiency in the
use of irrigation water and existing irrigation infrastructure. Reallocation is also
required in order to reduce waterlogging and salinization of irrigated land, to
decrease the negative environmental impacts and other externalities of irrigation
(caused by over extraction of groundwater and depletion and pollution of surface
water).
Government of India launched Pradhan Mantri Krishi Sinchayee Yojana (PMKSY) to
address the constraints in providing assured irrigation as well as increasing efficiency
and productivity of current water use to bring more prosperity to the rural areas.
Priorities of Government of India were reflected in the Hon‟ble President‟s address to
the joint Session of the Parliament of 16th Lok Sabha where it was emphasized that
“Each drop of water is precious. Government is committed to giving high priority to
water security. It will complete the long pending irrigation projects on priority and
launch the „Pradhan Mantri Krishi Sinchayee Yojana‟ with the motto of „Har Khet Ko

6
Pani‟. There is a need for seriously considering all options including linking of rivers,
where feasible; for ensuring optimal use of our water resources to prevent the
recurrence of floods and drought. By harnessing rain water through „Jal Sanchay‟ and
„Jal Sinchan‟, water conservation and ground water recharge will be nurtured. Micro
irrigation will be popularized to ensure „Per drop-More crop”.
PMKSY has been approved with an indicative outlay of Rs.50,000 crore over a period
of five years from 2015-16 to 2019-20. The scheme seeks convergence with scheme
like Mahatma Gandhi National Rural Employment Guarantee Scheme (MGNRES),
Rashtriya Krishi Vikas Yojana (RKVY), Jawaharlal Nehru National Solar Mission and
Rural Electrification programmes (JLNNSM&REP), Rural Infrastructure
Development Fund (RIDF), Members of Parliament Local Area Development
Scheme (MPLAD), Members of Legislative Assembly Local Area Development Fund
(MLALAD), Local Body Funds (LBF), Working Plan of State Forest Department
(WPSFD) etc. The PMKSY will be implemented in an area development mode only by
adopting a decentralized state level planning and projectised execution structure that
will allow the state to draw up their own irrigation development plans based on DIPs
and SIPs with a horizon of 5-7 years. The program will be supervised and
coordinated utilizing the existing mechanism and structure available under Rashtriya
Krishi Vikas Yojana (RKVY) program with state agriculture department acting as the
State Nodal Agency for implementation of PMKSY. However, the implementing
departments for the four components like AIBP, PMKSY (Har Khet Ko Pani), PMKSY
(Per drop more crop) and PMKSY (watershed development) will be decided by the
respective program ministry/department.
The 05 chapters along with introduction chapter, explains the profile of district, its
water requirement for agriculture and allied sector, water availability, assessment of
water requirement for various sectors and strategic action plan for augmentation and
effective management of available water resources.
District Profile: As per Census of India (2011), the total population of Banaskantha
district is 31,20, 506 out of which male population is 16,15,175 and female population
is 15,14,705. Deesa is the highest populated taluka with population of 5,88,123 and
Dantiwada is the least populated taluka with a population of 1,15,221 individuals. The
majority of population in the district belong to general category. The proportion of
SC and ST population is 10.53% and 9.16% respectively in the district. Banaskantha
district falls under North Gujarat Agro-climatic Zone IV and North West Gujarat
Agro-climatic Zone V, which is subdivided into five agro-ecological situations.
The district has arid and semi-arid climate with three distinguished seasons i.e.
kharif (June to September), winter (October to February) and summer (March to
June). The majority of the soils of the district is alluvial type and texturally loamy
sand.

7
Agriculture in Banskantha: The main Kharif crops in district are castor, bajara
and jowar, Rabi crops are wheat, Rapeseed and Mustard. Owing to the availability of
irrigation water, district is going towards summer crop cultivation mainly Bajra and
Groundnut. As per 2013-14 data, out of gross cropped area of 12,41,839 ha under
agriculture crops in the district, 7,34,285 ha (or 59.12%) is irrigated while 5,07,554
ha (40.88%) is rainfed. Kharif crops have a share of 6,87,859 ha (or 55.39%), Rabi
crops have a share of 3,92,313 ha (or 31.59%) and Summer crops have a share of
1,61,667 ha (or 13.02%). During the year 2013-14, total production of major
agricultural crops and the productivity were recorded as 37,98,823 quintals &
1110.819 kg/ ha (Kharif season), 41,01,303 quintals & 1847.47 kg/ ha (Rabi season),
and 17,84,272 quintals & 2408.57 kg/ ha (Summer season).
District Water Profile: The drainage network in the district is constituted mainly
by the Banas and Sarashwati rivers and their tributaries. Important Irrigation
schemes of the districts are Dantiwada, Mukteshvar Irrigation Project, Sipu
Reservoir Project and Hadmatiya Irrigation Scheme. Major & medium irrigation
canals, Minor irrigation tanks, Diversion channels, Rain water harvesting structures
and Ground water extraction structures such as bore wells etc. are the major sources
of water supply in the district. The surface water resources of the district are very
limited. Groundwater is the main source of irrigation. However, overexploitation of
groundwater has been observed in the district with the draft considerably exceeding
the recharge. As per Central Ground Water Board notification 2011, the status
ground water in 6 Talukas of the district is over exploited, critical in 1 Taluka, saline
in 2 Talukas and safe in only 3 Talukas.
During the year 2014-15, total canal command of the district was 2,27,376.25 Ha, out
of which 1,72,453.5 Ha is developed and 54,922.75 Ha is undeveloped. Further, total
other services command of the district was 9,524 Ha, out of which the entire area
was developed. There were 23 nos. of government canals, 105 nos. of community
ponds, 1304 nos. of private ponds, 31 nos. of reservoirs, 193 nos. of WHS and 409
nos. of government bore wells, in the Banaskantha district.
The total annual water availability of the district is 2344.31 MCM, out of which share
of surface water is 54% and ground water is 46%. Presently, there are no running
sewage treatment plants (STP) in the district, and hence the water availability from
treated effluents is zero However, there is 1 proposed project of Sewage Treatment
Plant (STP) of 28.67 MLD capacity in the district. On completion of the STP project,
the treated water will be mainly used for irrigation and industrial purposes. Thus, it
can be assumed that annual water availability of 10.464 MCM will be added by the
year 2020.
Demand for water sources and the gap: The present & projected water demand
from various sectors such as domestic, livestock, agriculture, industrial and power in

8
the district is assessed. The total water demand from various sectors (2015) was
3762.8 MCM, while future water demand (2020) shall be 3781.5 MCM. During the
year 2014-15, total of 1266.436 MCM surface water and 1077.87 MCM ground water
was available in the district. Further, water availability of 10.464 MCM will be added
by 2020 through ongoing STP unit. Based on present (2015) and projected water
demand (2020), and present water availability (surface & ground), the present water
gap is to the tune of 1418.49 MCM, and projected water gap (2020) is to the tune of
1437.19 MCM. Strategic action plan has been prepared to meet the water
requirement from various sectors and expand the coverage of irrigated area.
Proposed plan: Total plan for four years works out to be Rs. 1984.0507 Crores.
Maximum share is of Per Drop More Crop of Rs 927.236 Crores (46.73%), followed
by Har Khet Ko Pani of Rs. 829.694 Crores (41.82%), followed by PMKSY Watershed
of Rs. 126.2513 Crores (6.36%), followed by AIBP of Rs 63.213 Crores (3.19%),
Convergence component of Rs 35.84 Crs (1.81%) and marginal shares of Extension of
Rs 1.816 Crores. Considering department wise fund requirement, maximum share is
of GGRC of Rs 871.956 Crores (43.95%), followed by SSNNL of Rs. 522.995 Crores
(26.36%), followed by Nodal Irrigation Department of Rs 319.40 Crores (16.1%),
followed by GSWMA of Rs 162.091 Crores (8.17%), followed by GWRDC of Rs. 76.32
Crs (3.85%) and marginal shares of GLDC (Rs 29.472 Crs) and ATMA (1.81 Crs). The
budget requirement of GSWMA includes component of convergence with MNREGA
of Rs 3584.067 Lakhs.
The Strategic Action Plan of PMKSY will be monitored by the respective departments
through the regular reporting system and component wise progress will be
monitored by the District Level Irrigation Committee. During the upcoming four
financial years, an additional area of 2,98,704 ha area will be covered under PMKSY.
This will generate additional total number of man days of 2,40,93,549 and increase
in the income of agricultural labourers in the district by Rs 843.3193 Lakhs over the
period of 4 years.

9
INTRODUCTION i. Background Preparation of decentralized area specific district planning process visualized in
various plans took concrete shape through the years and initiatives like specific
guidelines on methodologies and processes for preparation of district plans;
framework for preparation of perspective plan, medium term and annual plans by
then planning commission in 1969 and the 73rd and 74th constitutional amendments
conferring constitutional status to Panchayats at district and sub district level; local
self-government in urban areas; constitution of district planning committee to
consolidate the plans prepared at Panchayats and municipalities and prepare a draft
development plan for the whole district.
The decentralized planning process was further strengthened through emphasis by
planning commission on preparation of district level plans and making it an integral
part of the process of preparation of the states 11th five year plan. The Planning
commission issued guidelines in August 2006 for preparation of the district plans.
The guidelines define the District Planning as „the process of preparing an integrated
plan for the local government sector in a district taking into account the resources
(natural, human and financial) available and covering the sectorial activities and
schemes assigned to the district level and below and those implemented through
local governments in a state. The document that embodies this statement of
resources and their allocation for various purposes is known as the District Plan”.
Government of India through a resolution in National Development Council on 29th
May 2007 conceived a special Additional Central Assistance Scheme (ACAS) to
address the slow growth of agriculture and allied sectors by incentivizing states to
draw up plans for their agriculture sectors more comprehensively. The NDC
resolution states "GoI introduced a new Additional Central Assistance Scheme to
incentivize states to draw up plans for their agriculture sector more comprehensively,
taking agro-climatic conditions, natural resource issues and technology into account,
and integrating livestock, poultry and fisheries, etc. This involved a new scheme for
Additional Central Assistance (ACA) to State Plans, administered by the Union
Ministry of Agriculture over and above its existing Centrally Sponsored Schemes, to
supplement the State-specific strategies including special schemes for beneficiaries
of land reforms. The newly created National Rainfed Area Authority on request, was
to assist States in planning for rainfed areas".
The NDC in its resolution advised the states to prepare a comprehensive district
agriculture plans (C-DAP) that will fully utilize available resources and include allied
agriculture sectors. Further, GOI issued a manual on preparation of comprehensive
district agriculture plans to help the states prepare C-DAP. As per these guidelines,
the objective of district planning is „to design an integrated and participatory action
plan for the development of local area in general and agriculture and allied sectors in
particular‟. The objectives of Comprehensive District Agriculture Plan (C-DAP) were:

10
To prepare a Comprehensive District Agriculture Plan (C-DAP) through
participatory process involving various organisations and stakeholders.
To enable optimum utilisation of scarce natural, physical & financial
resources.
To assess and plan for the infrastructure required to support the agriculture
development.
To establish linkages with the required institutional support services, like
credit, technology transfer, ICT, research etc.
To evolve an action plan for achieving sustainable agricultural growth with
food security and cropping system that will improve farmers‟ income.
The guidelines required the state/district authorities to (i) ensure that the
agricultural plans are prepared for the district and then integrated into the
agricultural plans of the State based on the agro-climatic conditions, availability of
technology, trained manpower and natural resources; (ii) local needs / crops / feed
and fodder / animal husbandry / dairying / fisheries / priorities are reflected in the
plan; (iii) productivity gaps for important crops and livestock and fisheries are
reduced; and (iv) the returns to the farmers from these are maximized.
The latest move in the process of strengthening of decentralized planning process
was the Government of India guidelines issued in 2015 in the form of a template for
the preparation of District Irrigation Plan (DIP) and State Irrigation Plan (SIP) as
part of the Pradhan Mantri Krishi Sinchayee Yojana (PMKSY) program and made the
preparation of DIP and SIP mandatory for the states to receive funds from the
program. The present report is a product of these long drawn efforts of Government
of India to strengthen the decentralized planning process in the country focusing on
the vital resource i.e., water.
Water is of vital importance for human & animal life, maintenance of ecological
balance and promotion of developmental activities. Considering its vital importance
and ever increasing demand for water, in the face of population growth, urbanization
& industrialization and considerations of climatic change, making water, an
increasingly a scarce resource, available to multiple uses, planning and management
of this vital resources, utilization of water economically, optimally and equitably
assumes greater importance.
According to the 12th Five year Plan the water budget estimates of India by Ministry
of Water Resources suggests an availability of 1123 billion cubic meters (BCM)
against a current estimated demand of 710 BCM. The Standing Committee of the
Ministry of Water Resources estimates that this water demand will rise to 1093 BCM
by 2025. Though the existing water availability in the immediate future seems to be
adequate, with the near constant supply of water resources in the face of increasing

11
demand on account of population growth, urbanisation and industrialization will
strain the water supply-demand balance.
The per capita water availability which stood at 5,177 cubic meters in 1951 was
reduced to 1820 cubic meters in 2001 while the international prescribed limit is 1800
cubic meters. The projected per capita availability of water is 1341 cubic meters in
2025 and 1140 cubic meters in 2050 suggesting shortage of water in the medium
term1. Further, the all India water balance estimates does not reflect the variations in
water balance across time and space- certain areas having a positive water balance
and the others facing acute shortage. The problem is further accentuated by water
quality related issues.
With the abundant surface and ground water supply in the first five decades since
independence, more than 80 percent of the total available water resources were
allocated for irrigation purposes and the rest meeting the domestic and industrial
demands. In a recent study2on the demand for water from agriculture, domestic and
industrial uses in 2000, 2025 and 2050 seems to suggest that domestic demand (34
BCM in 2000, 66 BCM in 2025 and 101 BCM in 2050) and industrial demand (42
BCM in 2000, 92 BCM in 2025 and 161 BCM in 2050) for water will utilize the total
balance water available while agriculture demand for water will be (605 BCM in
2000, 675 BCM in 2025 and 637 BCM in 2050). This change is partly because of the
changing sectorial contributions of India‟s GDP and also partly because of dynamics
of irrigation development in the country where the initial expansion in area under
irrigation is propelled by the availability of abundant water resources and availability
of good quality land. This is no longer the case in many of the states where the
availability of land and water are serious constraints for further expansion of
irrigation. Further, as per the erstwhile planning commission up to March 2012 out
of 141 million hectares of net sown area in the country 114 (or 81%) million hectares
is Irrigation Potential Created (IPC) and 88 (or 62%) million hectares is Irrigation
Potential Utilised (IPU) leaving almost 20% of irrigated potential unutilized. This
leaves 40 percent of the net sown area in the country dependent on rainfall which
makes farming a high risk and less productive.
The competing demands for water resources and the emerging issues and concerns
were to be addressed through certain basic principles and commonality in
approaches in dealing with planning, development and management of water
resources3 under an Integrated Water Resource Management framework. The main
objectives of water resource management as delineated in National Water Policy
2012 are:
1Ministry of Water Resources (2011), Strategic Plan for Ministry of Water Resources, Government of India,
New Delhi. 2Amarasinghe, U.A., Shah T., Turral, H. and Anand, B.K. 2007. India’s water future to 2025-
2050:Business-as-usual scenario and deviations. Research Report 123, International Water
Management Institute, Colombo. 3Ministry of Water Resources, National Water Policy, 2012, Government of India, New Delhi.

12
a) Planning, development and management of water resources need to be
governed by common integrated perspective considering local, regional, State
and national context, having an environmentally sound basis, keeping in view
the human, social and economic needs.
b) Principle of equity and social justice must inform use and allocation of water.
c) Good governance through transparent informed decision making is crucial to
the objectives of equity, social justice and sustainability. Meaningful intensive
participation, transparency and accountability should guide decision making
and regulation of water resources.
d) Water needs to be managed as a common pool community resource held, by
the state, under public trust doctrine to achieve food security, support
livelihood, and ensure equitable and sustainable development for all.
e) Water is essential for sustenance of eco-system, and therefore, minimum
ecological needs should be given due consideration.
f) Safe Water for drinking and sanitation should be considered as pre-emptive
needs, followed by high priority allocation for other basic domestic needs
(including needs of animals), achieving food security, supporting sustenance
agriculture and minimum eco-system needs. Available water, after meeting
the above needs, should be allocated in a manner to promote its conservation
and efficient use.
g) All the elements of the water cycle, i.e., evapo-transpiration, precipitation,
runoff, river, lakes, soil moisture, and ground water, sea, etc., are
interdependent and the basic hydrological unit is the river basin, which should
be considered as the basic hydrological unit for planning.
h) Given the limits on enhancing the availability of utilizable water resources and
increased variability in supplies due to climate change, meeting the future
needs will depend more on demand management, and hence, this needs to be
given priority, especially through (a) evolving an agricultural system which
economizes on water use and maximizes value from water, and (b) bringing in
maximum efficiency in use of water and avoiding wastages.
i) Water quality and quantity are interlinked and need to be managed in an
integrated manner, consistent with broader environmental management
approaches inter-alia including the use of economic incentives and penalties
to reduce pollution and wastage.
j) The impact of climate change on water resources availability must be factored
into water management related decisions. Water using activities need to be
regulated keeping in mind the local geo climatic and hydrological situation.
The National Water Policy 2012 drives the water resource management program
planning and management in the country. Government of India launched Pradhan
Mantri Krishi Sinchayee Yojana (PMKSY) to address the constraints in providing
assured irrigation as well as increasing efficiency and productivity of current water
use to bring more prosperity to the rural areas. Priorities of Government of India
were reflected in the Hon‟ble President‟s address to the joint Session of the

13
Parliament of 16th Lok Sabha where he indicated that “Each drop of water is
precious. Government is committed to giving high priority to water
security. It will complete the long pending irrigation projects on priority
and launch the ‘Pradhan Mantri Krishi Sinchayee Yojana’ with the motto
of ‘Har Khet Ko Pani’. There is a need for seriously considering all
options including linking of rivers, where feasible; for ensuring optimal
use of our water resources to prevent the recurrence of floods and
drought. By harnessing rain water through ‘Jal Sanchay’ and ‘Jal
Sinchan’, we will nurture water conservation and ground water
recharge. Micro irrigation will be popularised to ensure ‘Per drop-More
crop”.
PMKSY has been approved with an indicative outlay of Rs.50,000 Crs over a period
of five years from 2015-16 to 2019-20. The programme is an amalgamation of on-
going schemes of Ministry of Water Resources, River Development and Ganga
Rejuvenation, Ministry of Agriculture & Cooperation and Ministry of Rural
Development. The existing schemes AIBP, CADWM, MI, SWMA, Watershed &
Convergence with MGNREGA were brought together under the umbrella program of
PMKSY. Further the scheme seeks convergence with scheme likeMahatma Gandhi
National Rural Employment Guarantee Scheme (MGNRES), Rashtriya Krishi Vikas
Yojana (RKVY), Jawaharlal Nehru National Solar Mission and Rural Electrification
programmes (JLNNSM&REP), Rural Infrastructure Development Fund (RIDF),
Members of Parliament Local Area Development Scheme (MPLAD), Members of
Legislative Assembly Local Area Development Fund (MLALAD), Local Body Funds
(LBF), Working Plan of State Forest Department (WPSFD) etc.
The PMKSY will be implemented in an area development mode only by adopting a
decentralized state level planning and projectised execution structure that will allow
the state to draw up their own irrigation development plans based on DIPs and SIPs
with a horizon of 5-7 years. The program will be implemented as part of Rashtriya
Krishi Vikas Yojana (RKVY) with state agriculture department acting as the State
Nodal Agency. However, the implementing departments for the four components like
AIBP, PMKSY (Har Khet Ko Pani), PMKSY (Per drop more crop) and PMKSY
(watershed development) will be decided by the respective program
ministry/department.
The funds under this program would be provided to the states as per the pattern of
assistance of Centrally Sponsored Schemes (CSS) decided by the Ministry of Finance
and NITI Aayog. During 2015-16 the existing pattern of assistance of ongoing scheme
was continued. An outlay of Rs. 50,000 crore has been approved for 2015-20. The
financial assistance provided to the state governments from this centrally sponsored
scheme is subject to fulfilment of certain conditions. Firstly, a state will become
eligible to access PMKSY fund only if it has prepared the District Irrigation Plans
(DIP) and State Irrigation Plan (SIP), excepting for the initial year, and the

14
expenditure in water resource development for agriculture sector in the year under
consideration is not less than the baseline expenditure, which is defined as the
average of the expenditure in irrigation sector irrespective of the department in the
state plan in three years prior to the year under consideration. Secondly, States will
be given additional weightage for levying charges on water and electricity for
irrigation purposes, so as to ensure sustainability of the programme. Thirdly,
interstate allocation of PMKSY fund will be decided based on
Share of percentage of unirrigated area in the state vis-à-vis national average
including prominence of areas classified under Desert Development
Programme (DDP) and Drought Prone Area Development Programme
(DPAP)
Increase in percentage share of expenditure on water resource development
for agriculture sector in State Plan expenditure in the previous year over three
years prior to it and
Improvement in irrigation efficiency in the state.
ii. Vision The overreaching vision of Pradhan Mantri Krishi Sinchayee Yojana (PMKSY) will be
to ensure access to some means of protective irrigation to all agricultural farms in the
country, to produce „per drop more crop‟, thus bringing much desired rural
prosperity.
iii. Objective The objectives of the PMKSY are to:
a) Achieve convergence of investments in irrigation at the field level (preparation
of district level and, if required, sub district level water use plans).
b) Enhance the physical access of water on the farm and expand cultivable area
under assured irrigation (Har Khet Ko Pani),
c) Integration of water source, distribution and its efficient use, to make best use
of water through appropriate technologies and practices.
d) Improve on-farm water use efficiency to reduce wastage and increase
availability both in duration and extent,
e) Enhance the adoption of precision-irrigation and other water saving
technologies (More crop per drop).
f) Enhance recharge of aquifers and introduce sustainable water conservation
practices
g) Ensure the integrated development of rainfed areas using the watershed
approach towards soil and water conservation, regeneration of ground water,
arresting runoff, providing livelihood options and other NRM activities.
h) Promote extension activities relating to water harvesting, water management
and crop alignment for farmers and grass root level field functionaries.

15
i) Explore the feasibility of reusing treated municipal waste water for peri-urban
agriculture, and
j) Attract greater private investments in irrigation.
iv. Strategy/approach To achieve these objectives PMKSY adopted strategies that include
a) Creation of new water sources; repair, restoration and renovation of defunct
water sources; construction of water harvesting structures, secondary & micro
storage, groundwater development, enhancing potentials of traditional water
bodies at village level like Jal Mandir (Gujarat); Khatri, Kuhl (H.P.); Zabo
(Nagaland); Eri, Ooranis (T.N.); Dongs (Assam); Katas, Bandhas (Odisha and
M.P.) etc.
b) Developing/augmenting distribution network where irrigation sources (both
assured and protective) are available or created;
c) Promotion of scientific moisture conservation and run off control measures to
improve ground water recharge so as to create opportunities for farmers to
access recharged water through shallow tube/dug wells;
d) Promoting efficient water conveyance and field application devices within the
farm viz, underground piping system, Drip & Sprinklers, pivots, rain-guns and
other application devices etc.;
e) Encouraging community irrigation through registered user groups/farmer
producers‟ organisations/ NGOs; and
f) Farmer oriented activities like capacity building, training and exposure visits,
demonstrations, farm schools, skill development in efficient water and crop
management practices (crop alignment) including large scale awareness on
more crop per drop of water through mass media campaign, exhibitions, field
days, and extension activities through short animation films etc.
v. Programme Components PMKSY has following four components:
1. Accelerated Irrigation Benefit Programme (AIBP): To focus on faster
completion of ongoing Major and Medium Irrigation including National Projects
2. PMKSY (Har Khet ko Pani):
a) Creation of new water sources through Minor Irrigation (both surface and ground
water)
b) Repair, restoration and renovation of water bodies; strengthening carrying
capacity of traditional water sources, construction rain water harvesting structures
(Jal Sanchay)
c) Command area development, strengthening and creation of distribution network
from source to the farm
d) Ground water development in the areas where it is abundant, so that sink is
created to store runoff/ flood water during peak rainy season

16
e) Improvement in water management and distribution system for water bodies to
take advantage of the available source which is not tapped to its fullest capacity
(deriving benefits from low hanging fruits). At least 10% of the command area to be
covered under micro/precision irrigation
f) Diversion of water from source of different location where it is plenty to nearby
water scarce areas, lift irrigation from water bodies/rivers at lower elevation to
supplement requirements beyond IWMP and MGNREGS irrespective of irrigation
command
g) Creating and rejuvenating traditional water storage systems like Khatri, Kuhl etc.
at feasible locations.
3. PMKSY (Per Drop More Crop)
a) Programme management, preparation of State/District Irrigation Plan,
approval of annual action plan, Monitoring etc.
b) Promoting efficient water conveyance and precision water application devices
like drips, sprinklers, pivots, rain-guns in the farm (Jal Sinchan)
c) Topping up of input cost particularly under civil construction beyond
permissible limit (40%), under MGNREGS for activities like lining inlet,
outlet, silt traps, distribution system etc.
d) Construction of micro irrigation structures to supplement source creation
activities including tube wells and dug wells (in areas where ground water is
available and not under semi critical/ critical/ over exploited category of
development) which are not supported under AIBP, PMKSY (Har Khet Ko
Pani), PMKSY (Watershed) and MGNREGS as per block/district irrigation
plan.
e) Secondary storage structures at tail end of canal system to store water when
available in abundance (rainy season) or from perennial sources like streams
for use during dry periods through effective on-farm water management;
f) Water lifting devices like diesel/ electric/ solar pumpsets including water
carriage pipes, underground piping system.
g) Extension activities for promotion of scientific moisture conservation and
agronomic measures including cropping alignment to maximise use of
available water including rainfall and minimise irrigation requirement (Jal
Sarankchan);
h) Capacity building, training and awareness campaign including low cost
publications, use of pico projectors and low cost films for encouraging
potential use water source through technological, agronomic and management
practices including community irrigation.
i) The extension workers will be empowered to disseminate relevant
technologies under PMKSY only after requisite training is provided to them
especially in the area of promotion of scientific moisture conservation and
agronomic measures, improved/ innovative distribution system like pipe and
box outlet system, etc. Appropriate Domain Experts will act as Master
Trainers.

17
j) Information Communication Technology (ICT) interventions through NeGP-A
to be made use in the field of water use efficiency, precision irrigation
technologies, on farm water management, crop alignment etc. and also to do
intensive monitoring of the Scheme.
4. PMKSY (Watershed Development)
a) Effective management of runoff water and improved soil & moisture
conservation activities such as ridge area treatment, drainage line treatment,
rain water harvesting, in-situ moisture conservation and other allied activities
on watershed basis.
b) Converging with MGNREGS for creation of water source to full potential in
identified backward rainfed blocks including renovation of traditional water
bodies
v. Rationale/ Justification In reference to the status and need of irrigation, the water resource management
including irrigation related priorities was identified for Banskantha district by the
peoples‟ representatives of district with support from administration and technical
experts. For instance the reports of Strategic Research and Extension Plan (SREP)
prepared under ATMA program, Comprehensive District Agriculture Plan (C-DAP)
prepared as part of Rashtriya Krishi Vikas Yojana (RKVY), Potential Linked Credit
Plans (PLP) of NABARD and the Integrated District Development Plan etc. identified
number of irrigation related issues for Banskantha district including (i) promoting
water use efficiency through sprinkler and drip irrigation; (iii) promoting protected
polyhouse cultivation to minimize risk factors and enhance quality and productivity;
(iv) Improvement of on-farm water delivery and efficiency of existing irrigation
systems; (v) promotion of soil conservation of arable & non-arable land through
engineering measures; (vi) creation of new water harvesting structures, check dams,
ponds, tanks, etc. (vii) increase the forest cover in the district and (viii) land
improvement measures
vi. Methodology During the course of preparation of District Irrigation Plan (DIP) the team visited
Banskantha district to collect data and have interaction with all the stakeholders.
Methodology adopted to prepare DIP is outlined in brief as under:
Collection of primary and secondary data from multiple sources including
Season and Crop Reports, Statistical Handbook, District Census Handbook and
other published documents and websites of different departments.
Meetings with state government departments and related institutions were held
and meeting through VC was also held with state level authorities.
GIS maps of the area‟s/clusters were studied to understand the land
morphology, topography of the district.

18
Discussions and interviews were held with officers of agriculture department,
horticulture department, sub division soil conservation office, Agriculture
Technology Management Agency (ATMA), District Watershed Development
Agnecy (DWDA) of District Rural Development Authority (DRDA), Animal
Husbandry department, Water resource department and identified the key
issues and key focus areas of the region. Discussion with District Development
Manager of NABARD for Banskantha district was also held during the visit.
During the course of field visit, facilitation support was provided by GGRC field
executive.
Team members also participated in the State Level workshop and held active
discussions with GoI officers, State Level officers and scientists of various
institutions including Indian Meteorological Department (IMD) and Krishi
Vigyan Kendra (KVK) office etc.
On the basis of detailed discussion and analysis of data, the team arrived at the
projections of various components of PMKSY and Department wise plan for four
years from 2016-17 to 2019-20 was prepared which is given in Annexure.

19
CHAPTER 1
1 General Information of the District
1.1 District Profile
Modern-day Gujarat is derived from Sanskrit (Gurjar-Rashtra), the Gurjar nation.
Parts of Rajasthan and Gujarat have been known as Gurjaratra (country Gurjars's
most populous region) or Gurjarabhumi (land of the Gurjars) for centuries before the
Mughal period.Banaskantha is one among the thirty-three districts of the Gujarat
state of India. The administrative headquarters of the district is at Palanpur which is
also its largest city. The district is located in the Northeast of Gujarat and is
presumably named after the West Banas River which runs through the valley
between Mount Abu and Aravalli Range, flowing to the plains of Gujarat in this
region and towards the Rann of Kutch. The district is famous for the Ambaji temple
and the Balaram temple which draw many tourists.
Palanpur and Deesa, the two major cities of the district are well connected to other
cities and towns of Gujarat. National Highway 15 connects the district with
Pathankot, Amritsar, Bhatinda, Ganganagar, Bikaner and Jaisalmer and Kandla.
National Highway 27 connecting Beawar in Rajasthan with Radhanpur in Gujarat
passes through Palanpur and Deesa. Gujarat State Highway 41 connects the district
to important cities of Ahmedabad, Patan and State Highway 9 connects Palanpur
with Ambaji, the most famous tourist destination in the state. Other state highways
passing through the district are 41, 54, 56, 63, 72, 127, 128, 129, 130 and 132 linking
it most parts of the state.
Palanpur Junction railway station is the largest railway station of the district. It is
connected to Mumbai-Ahmedabad-Jaipur-Delhi corridor thus linking it with four
major cities of India. It is also connected to other towns of the district such as
Chhapi,Deesa, Deodar, Dhanera and Bhabhar. Sardar Vallabhbhai Patel
International Airport in Ahmedabad is the nearest International airport.
Latitude and longitude:
The District is situated between 23.33 to 24.45 north latitude and72.15 to 73.87 east
longitude. Banaskantha District lies on north-west side of Gujarat State. The District
is surrounded by Marwad and Sirohi regions of Rajasthan State in the north,
Sabarkantha District in the east, Mehshana District in the south and Patan District in
the west. Border of Pakistan touches the desert. Strategically, Banaskantha District is
of much importance because of its sensitive borders. Banaskantha District includes
the area around the Bank of Banas river.

20
Table 1.1: Information of district
Name of the District District Code Latitude Longitude
Banaskantha 469 23.33 – 24.45 ˚N 72.15 – 73.87 ˚E
Source: Census of India, 2011
Administrative Setup
The district is divided in 14 Talukas. There are 6 Town places in the District. The
district is rural dominated district with seven talukas out of total twelve talukas
having no urban population.
Table 1.2: Administrative Division
No. of Tehsils 14 (Vav, Tharad, Dhanera, Dantiwada, Amirgadh, Danta, Vadgam, Palanpur, Deesa, Deodar, Bhabhar, Kankrej, Suigam and Lakhani)
No. of Town 6 No. of Panchayats 783
No. of Villages 1237 Source: Census of India, 2011
The Collector is head of district administration and is assisted by one Resident
Additional Collector. A team of Mamlatdar, Chitnish, and other officers support the
collector in discharging administrative, regulatory and other functions.
The other district officers are District and Session Judge, Chief Judicial Magistrate,
Superintendent of Police, Chief Executive Officer of Zila Parishad. Chief Medical
Officer and Senior officers of the state Government look after the developmental and
regulatory functions in the district. All departments of the state government such as
public works department, agriculture, horticulture, irrigation & public health,
forests, education, animal husbandry and fisheries etc. have district level officers.
Sub-Divisional Magistrate is the head of subdivision while Block Development
Officer is the head of Community Development Block. At the Tehsil/sub-Tehsil level,
the Tehsildar/Naib Tehsildar and other officers look after their respective
jurisdiction for developmental and regulatory functions.

21
Map 1-1 Location Map of Banaskantha district
Source: BISAG
1.2 Demography
As per Census of India (2011), the total population of Banaskantha district is 31,20,
506 out of which male population is 16,15,175 and female population is 15,14,705.
Deesa is the highest populated taluka with population of 5,88,123 and Dantiwada is
the least populated taluka with a population of 1,15,221 individuals.
Table 1.3: Gender wise Classification of Population
S. No Name of Taluka Population M F CH* Total
1 Vav 128166 117990 41637 246156 2 Tharad 169166 158123 57373 327289 3 Dhanera 119504 111237 40759 230741 4 Dantiwada 59846 55375 19051 115221 5 Amirgadh 67100 65254 28030 132354 6 Danta 114836 110003 46737 224839 7 Vadgam 127050 122650 33775 240326 8 Palanpur 226487 212286 56326 438773 9 Deesa 304122 284001 94341 588123
10 Deodar 92157 85762 29161 177919 11 Bhabhar 63892 59260 21149 123152 12 Kankrej 142849 132764 44364 275613
Total 1615175 1514705 512703 3120506 Source: Census of India, 2011 * < 6 years of age

22
Figure 1.1 Population wise Classification in Banaskantha District
Table 1.4: Category wise population
S. No Name of the Taluka
Category-wise population
Total
SC ST General No. of Households
No. of members
1 Vav 44071 2215 199870 44267 246156 2 Tharad 47474 7996 271819 54915 327289 3 Dhanera 28678 20909 181154 37893 230741 4 Dantiwada 11996 5966 97259 20852 115221 5 Amirgadh 3545 77462 51347 22118 132354 6 Danta 8551 128607 87681 39613 224839 7 Vadgam 38858 5913 195555 47642 240326 8 Palanpur 46836 17651 374286 87108 438773 9 Deesa 53511 14506 520106 105016 588123
10 Deodar 17928 3981 156010 30481 177919 11 Bhabhar 7705 178 115269 21527 123152 12 Kankrej 19448 650 255515 48979 275613
Total 328601 286034 2505871 560411 3120506 Source: Census of India, 2011
*2 new blocks, Suigam formed out of Vav and Lakhani from Deesa block
It can be observed that the majority of population in the district belong to general
category. The proportion of SC and ST population is 10.53% and 9.16% respectively
in the district. The total no of households is 5,60,411 in the district.
0
50000
100000
150000
200000
250000
300000
350000
Population Classification
Male Female Children

23
Figure 1.2 Category wise population
Table 1.5: Locality wise population
S. No Taluka Locality wise population Percentage of Rural
Population
Percentage of Urban
Population Rural Urban Total
1 Vav 246156 0 246156 100 0 2 Tharad 299335 27954 327289 91.4589 8.54108 3 Dhanera 201163 29578 230741 87.1813 12.8187 4 Dantiwada 115221 0 115221 100 0 5 Amirgadh 132354 0 132354 100 0 6 Danta 207086 17753 224839 92.1041 7.89587 7 Vadgam 231947 8379 240326 96.5135 3.48651 8 Palanpur 278542 160231 438773 63.482 36.518 9 Deesa 471969 116154 588123 80.25 19.75
10 Deodar 163007 14912 177919 91.6187 8.38134 11 Bhabhar 101258 21894 123152 82.222 17.778 12 Kankrej 257553 18060 275613 93.4473 6.55267
Total 2705591 414915 3120506 89.85649 10.14351 Source: Census of India, 2011
*2 new blocks, Suigam formed out of Vav and Lakhani from Deesa block
It can be observed that the district is predominantly rural, with rural population
proportion being 89.85% of the total population. Three talukas namely Vav,
Dantiwada & Amirgadh have cent percent rural population. Only Palanpur taluka has
Urban population of more than 30% of the total population of the taluka. The urban
population of the taluka is 1,60,231 or 36.51%.
0
100000
200000
300000
400000
500000
600000
Catogery wise Population
SC ST General
24
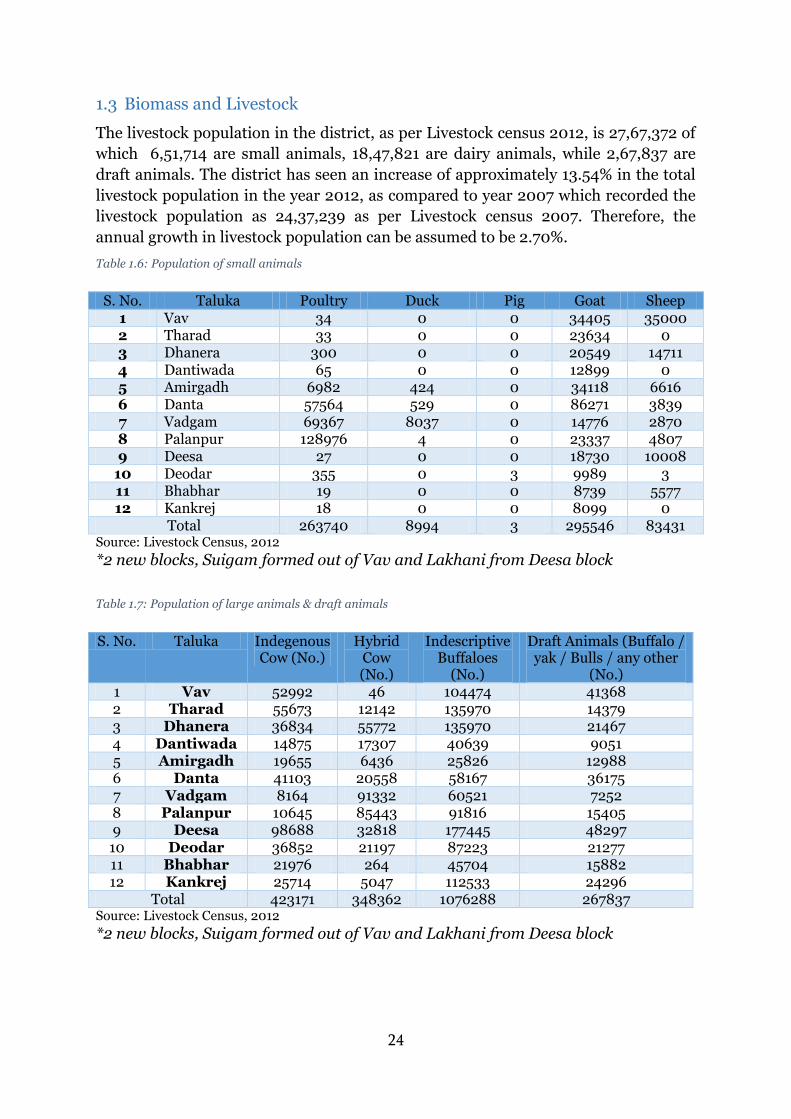
1.3 Biomass and Livestock
The livestock population in the district, as per Livestock census 2012, is 27,67,372 of
which 6,51,714 are small animals, 18,47,821 are dairy animals, while 2,67,837 are
draft animals. The district has seen an increase of approximately 13.54% in the total
livestock population in the year 2012, as compared to year 2007 which recorded the
livestock population as 24,37,239 as per Livestock census 2007. Therefore, the
annual growth in livestock population can be assumed to be 2.70%.
Table 1.6: Population of small animals
S. No. Taluka Poultry Duck Pig Goat Sheep 1 Vav 34 0 0 34405 35000 2 Tharad 33 0 0 23634 0 3 Dhanera 300 0 0 20549 14711 4 Dantiwada 65 0 0 12899 0 5 Amirgadh 6982 424 0 34118 6616 6 Danta 57564 529 0 86271 3839 7 Vadgam 69367 8037 0 14776 2870 8 Palanpur 128976 4 0 23337 4807 9 Deesa 27 0 0 18730 10008
10 Deodar 355 0 3 9989 3 11 Bhabhar 19 0 0 8739 5577 12 Kankrej 18 0 0 8099 0
Total 263740 8994 3 295546 83431 Source: Livestock Census, 2012
*2 new blocks, Suigam formed out of Vav and Lakhani from Deesa block
Table 1.7: Population of large animals & draft animals
S. No. Taluka Indegenous Cow (No.)
Hybrid Cow (No.)
Indescriptive Buffaloes
(No.)
Draft Animals (Buffalo / yak / Bulls / any other
(No.) 1 Vav 52992 46 104474 41368 2 Tharad 55673 12142 135970 14379 3 Dhanera 36834 55772 135970 21467 4 Dantiwada 14875 17307 40639 9051 5 Amirgadh 19655 6436 25826 12988 6 Danta 41103 20558 58167 36175 7 Vadgam 8164 91332 60521 7252 8 Palanpur 10645 85443 91816 15405 9 Deesa 98688 32818 177445 48297 10 Deodar 36852 21197 87223 21277 11 Bhabhar 21976 264 45704 15882 12 Kankrej 25714 5047 112533 24296
Total 423171 348362 1076288 267837 Source: Livestock Census, 2012
*2 new blocks, Suigam formed out of Vav and Lakhani from Deesa block

25
Figure 1.3 Population of dairy animals
It can be observed that in the category of dairy animals, the proportion of population
of Buffaloes is highest (58.24%), followed by Indigenous Cows (22.90%) and Hybrid
Cows (18.85%), in the district. Further, Deesa taluka has highest population
(3,08,951) of dairy animals in the district.
1.4 Agro-Ecology, Climate, Hydrology and Topography
Banaskantha district falls under North Gujarat Agro-climatic Zone IV and North
West Gujarat Agro-climatic Zone V. The district is subdivided into five agro-
ecological situations as follows.
Table 1.8: Agro-Ecological Situations
Sr. No
.
Agro-ecologica
l situation
Soil texture
Rainfall (mm)
Special features
Principal crops Taluka covered
1 Alluvial sandy soils with low rainfall
Deep and
sandy to
loamy sand
Medium
Low rainfall, dry climate, and absence of vegetative cover
Maize, tur, green gram, groundnut, castor, cotton.
Dhanera 38.34 %, Deesa 79.9%, Palanpur 81.52% Vadgam 100%, Amirgadh 10% and Dantiwada100%
2 Medium black soil with high rainfall
Medium
black, sandy clay
loam to
Medium
Flat area with 1.3 % slopes.
Maize, wheat, castor, pearl millet, tur clusterbean ,G'nut,
Danta 69.99%
020000400006000080000
100000120000140000160000180000200000
Cattle Population
Indegenous Cow (No.)
Hybrid Cow (No.)
Indescriptive Buffaloes (No.)

26
Sr. No
.
Agro-ecologica
l situation
Soil texture
Rainfall (mm)
Special features
Principal crops Taluka covered
clay 3 Hilly and
sloppy soils with high rainfall
Sandy clay
loam , shallow in depth
Medium
Due to steep slope profile is not well developed.
Groundnut, wheat, castor, pearl millet, clusterbean,maize, tur
Danta 30.01% Palanpur 18.48%
4 Riverbed area
Sandy loamy sand
Medium
Flat within riverbed
with 1.3 % slope,
Topography
undergoes a change each year
due to flooding during
monsoon as a result of
silt deposition
Groundnut, wheat, castor,
pearl mill, cluster bean, Potato
Cotton , mustard, green gram
Dhanera 61.66%, Deesa
20%
5 High rainfall sandy
soil
Deep, light
texture
Medium
The sodium and
chloride are dominant cation and
anion in soils, poor
water quality (Salty)
Pearl millet cumin, Isabgol,
castor, Clusterbean
cotton,greengram
Vav 100%, Tharad 100%, Deadar
100%, Kankarej 100%
Bhabhar 100%
Source: CDAP, 2012
Climate and Rainfall
The climate of the district is sub-tropical monsoon type and falls under semi-arid
region. The annual rainfall in the district is received during the south-west monsoon
season from June to September, July being the month with the highest rainfall. In
general, monsoons are warm and moderately humid; winters are fairly cold and dry,
while summers are largely hot and dry. The temperature starts rising during
February and reaches at the maximum in the month of May or June. May and June
are the hottest months of the year. After mid-November both day and night
temperature drop rapidly till January, Monsoon begins from mid June and retreats
by end of September.
The district has arid and semi-arid climate with three distinguished seasons i.e.
kharif (June to September), winter (October to February) and summer (March to

27
June). The district receives the rainfall through South-West monsoon which
normally starts from end of June. July and August are the months of rainfall. The
normal annual rainfall is 585.1 mm, and total no of rainy days is 24.1. However,
scanty and uneven rainfall pattern is common. The maximum weekly temperature
varies from 38.8 oC to 43.8 oC, and minimum temperature varies from 6.3 oC to 21.8 oC during the year, depending upon the season of the year.
Table 1.9: Agro-Ecology data
Normal Annual Rainfall (mm)
Average Monthly Rainfall (mm)
No. of Rainy Days (No.)
Average Weekly Temperature (oC) Summer (April-May)
Winter (Oct.-March)
Rainy (June-Sept.)
Min.
Max.
Mean
Min.
Max.
Mean
Min.
Max.
Mean
585.1 140.65 24.1 17.6 43.8 31.4 6.3 39.4 22.8 21.8 38.8 30.8
Source: Climatological table, Station Deesa
1.5 Soil Profile
Banaskantha district lies to the northern part of Gujarat. The district is subdivided
into six sub-micro regions on the basis of physiography, climate, geology, soils and
natural vegetation, namely (1) Vav Sandy Plain (2) Sandy Plain (3) Banas Valley (4)
Banaskantha Aravalli Range (5) Jasor Hills and (6) Umardasi Saraswati Plain.
The majority of the soils of the district is alluvial type and texturally loamy sand. It
has low in water holding capacity. The soil of Banaskantha district in general
posses neutral to alkaline (in reaction) soil pH (7.25 to 8.25). The electrical
conductivity of the soil is low (<1.0 dS m-1). Organic carbon and nitrogen content of
the soil is low, phosphorus content of the soil is medium and high in potassium.
Some part of the district, soil is deficient in multi-micronutrients, particularly zinc
and iron. So, overall, the soil fertility indices are medium from the point of view of
agriculture.

28
Map 1-2 District Soil Map
Source: BISAG

29
Map 1-3 District Watershed map
Source: BISAG

1.6 Land Use Pattern
Table 1.10: Land Use Pattern
(Area in Ha) Name of
block Total
Geographical Area
Area under Agriculture Area under Forest
Area under other uses Gross
Cropped Area (1)
Net Sown
Area (2)
Area Sown more than
once (1-2)
Cropping Intensity
(%)
Barren / not fit
for crops
Pastures Land under Misc.
trees / groves
Cultivable waste land
Palanpur 79231 88395 59079 29316 150 6018.1 1685 4768 0 1230
Vadgam 56242 63749 42041 21708 152 1320 633 4250 0 1222
Deesa 146024 202255 113683 88572 178 393 3296 13212 0 1872
Danta 85901 26402 22698 3704 116 50702 2935 1535 0 2220
Dhanera 84298 99298 67350 31948 147 382 3480 5503 0 924
Amirgadh 60899 22724 17560 5164 129 37238 644 2703 0 185
Kankarej 82517 199810 64810 135000 308 0 3576 4560 0 2346
Dantiwada 41795 39696 25950 13746 153 7032 467 2543 0 563
Tharad 135100 149694 115800 33894 129 20 3241 10214 0 1380
Vav 170960 134195 126705 7490 106 8077 9397 7915 0 6211
Deodar 59305 81982 50568 31414 162 0 1057 5110 0 882
Bhabhar 42925 43806 35510 8296 123 0 528 2826 0 160
Total 1045197 1152006 741754 410252 155.3 111182 30939 65139 0 19195 Source: C-DAP, 2012
*2 new blocks, Suigam formed out of Vav and Lakhani from Deesa block
Total geographical area of the district is about 10.45 lakh ha. It is noteworthy to find that almost 70% of the geographical area is
under cultivation in the district. The coverage of forest area is almost 10% in the district. However in Kankarej, Deodar & Bhabhar
talukas no area is under forest and hence, there is need to increase the coverage of forest. The district has 2.9% of their land as

31
barren land and the same may be effectively used under various watershed projects. Pasture land forms 6.23% of geographical area
and it is very significant from the point of view of growth of animal husbandry.
32
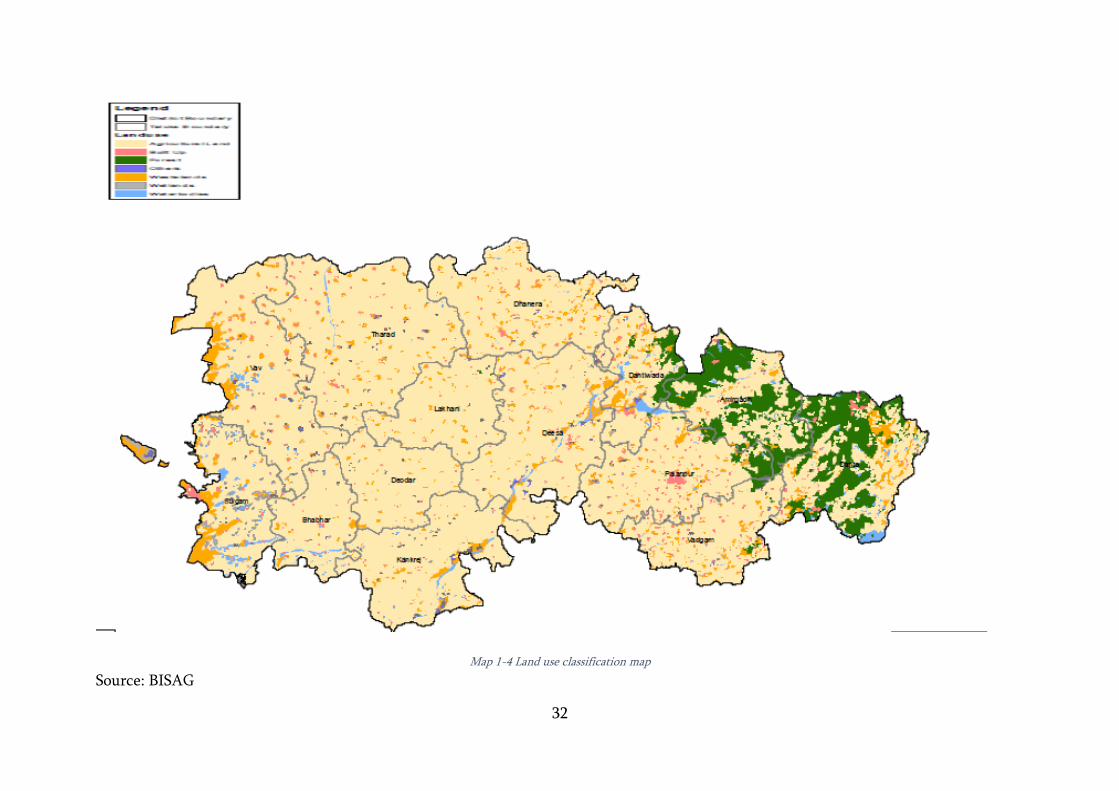
Map 1-4 Land use classification map
Source: BISAG

CHAPTER 2:
2 District Water Profile Agriculture is the main source of livelihood for the rural people of the district. The
cows and buffalos population is instrumental in collection of the highest milk in
district co-operative in Asia. The district falls under North Gujarat Agro-climatic
Zone and North –west Gujarat Agro-Climatic Zone.
2.1 Area Wise, Crop Wise Irrigation Status
Table 2.1: Irrigation status of Agriculture Crops (2013-14) - District Summary
(Area in Ha.)
Taluka Kharif Rabi Summer Total
Irrigate
d
Rainfe
d
Irrigate
d
Rainfe
d
Irrigate
d
Rainfe
d
Irrigate
d
Rainfe
d
Palanpur 17085 47170 41700 0 23295 0 82080 47170
Vadgam 8357 35576 20711 0 9320 0 38388 35576
Deesa 48840 67135 60019 0 36600 0 145459 67135
Danta 650 28125 5541 370 535 0 6726 28495
Dhanera 10582 34316 44810 0 10570 0 65962 34316
Amirgadh 6485 14524 9382 0 2569 0 18436 14524
Kankarej 34403 29423 45782 0 24520 0 104705 29423
Dantiwad
a
7719 4485 19273 0 1510 0 28502 4485
Tharad 21200 85687 79067 0 33760 0 134027 85687
Vav 3048 127141 29748 0 6610 0 39406 127141
Deodar 14855 15364 19830 800 8410 0 43095 16164
Bhabhar 8751 16938 14780 500 3968 0 27499 17438
Total 181975 50588
4
390643 1670 161667 0 734285 507554
Source: Department of Agriculture, Agriculture Statistic of state, AgriState
It can be observed that total Irrigated land under crop cultivation is 734285 Ha. and
that under Rainfed irrigation is 507554 Ha.

34
Figure 2.1: Area wise irrigation status
It can be observed that the total rainfed area exceeds the irrigated area for 2 Talukas
out of 12 Talukas but not overall for the district. Only 59.17% of total cultivated area
during the year is irrigated, and 40.82% of cultivated area is rainfed in the district.
The extent of irrigation is very limited during Kharif season, and majority of
cultivation is practiced under rainfed conditions. However, irrigation water is
available for crop cultivation during Rabi and Summer season, to a larger extent. The
proportion of irrigated area to total cultivated area is only 14.63% during Kharif
season, and 31.42% during Rabi season. Further, area of 1,61,667 hectares (about
13%) is irrigated for cultivation during summer season in the district.
Table 2.2: Crop wise irrigation status
(Area in Ha.)
Crop Type Kharif Rabi Summer Total
Irrigated Rainfed Irrigated Rainfed Irrigated Rainfed Irrigated Rainfed Total
(A) Cereals 0 119011 63476 0 93028 0 156504 0 156504
(B) Coarse
Cereals
0 2295 205 0 0 0 205 0 205
(C) Pulses 0 39385 2786 0 681 0 3467 0 3467
(D) Oil
Seeds
100303 16348 95600 0 3320 0 199223 0 199223
(E) Fibre 27080 0 0 0 0 0 27080 0 27080
(F) Any
other
crops.
12035 229617 129747 0 39645 0 181427 0 181427
Source: Department of Agriculture, Agriculture Statistic of state, AgriState
It can be observed that cereals, coarse cereals and pulses are cultivated only under
rainfed conditions during Kharif season, while partial irrigation is provided for
cultivation of Oil seeds, Fibre and other crops during Kharif season. Further, coarse
cereals and fibres are not cultivated during Rabi season, and pulses are cultivated
020000400006000080000
100000120000140000160000
Are
a (H
a.)
Irrigation Status
Irrigated
Rainfed

35
only under rainfed conditions while other crops are cultivated under irrigated
conditions. During summer season, crops which are cultivated under irrigated
conditions include: Cereals, Pulses and other crops except coarse cereals, oil seeds
and fibers.
Table 2.3 Status of Irrigation for Horticulture Crops (2014-15)
(Area in Ha.)
S. No. Taluka Irrigated Rainfed Total
1 Palanpur 9776 96 9872
2 Vadgam 12717.8 101 12818.8
3 Deesa 49201.4 167 49368.4
4 Danta 4017 29 4046
5 Dhanera 11939 46 11985
6 Amirgadh 4125.8 26 4151.8
7 Kankarej 20128 22 20150
8 Dantiwada 9114 37 9151
9 Tharad 22310 254 22564
10 Vav 18204 8 18212
11 Deodar 9085 45 9130
12 Bhabhar 6842 19 6861
Total 177460 849 178309
Source: Department of horticulture
Horticulture and other crops are still gaining popularity. As may be observed in the
above table, Gross area under horticulture plantation is 178309 Ha.
2.2 Production and Productivity of Major Crops
2.2.1 Agricultural Crops
Table 2.4: Production & Productivity in Kharif Season
Crops Rainfed Irrigated Total
Area
(ha)
Producti
on
(qtn/yr)
Yield
(kg/ha
)
Area
(ha)
Producti
on
(qtn/yr)
Yield
(kg/h
a)
Area
(ha)
Producti
on
(qtn/yr)
Productiv
ity or
Yield
(kg/ha)
Jowar 8204 58479.72 712.8
2
0 0 8204 58480 713
Bajri 1330
92
1108656.
36
833 0 0 1330
92
1108656 833
Maize 9430 192636 2042.
8
0 0 9430 192636 2043
Mung 2251 136860.8 608 0 0 2251 136861 608
36
Crops Rainfed Irrigated Total
Area
(ha)
Producti
on
(qtn/yr)
Yield
(kg/ha
)
Area
(ha)
Producti
on
(qtn/yr)
Yield
(kg/h
a)
Area
(ha)
Producti
on
(qtn/yr)
Productiv
ity or
Yield
(kg/ha)
0 0
Math 6443 33374.74 518 0 0 6443 33375 518
Udid 5774 41630.54 721 0 0 5774 41631 721
Tur 2350 22536.5 959 0 0 2350 22537 959
Groundn
ut
8926 142339.3
1
1594.
66
1507
0
17589.5 116.7
2
2399
6
159929 1711
Castor 1377
5
308146.7
5
2237 6438
5
1440292 2237 7816
0
1748439 4474
Sesamu
m
2253
0
92823.6 412 0 0 2253
0
92824 412
Cotton 480 932 194.1
7
2815
1
197338.5 701 2863
1
198271 895
Guar
seed
465 2790 600 399 2394 600 864 5184 1200
Source: Department of Agriculture, Agriculture Statistic of state, AgriState
It can be observed that Bajri has highest area under cultivation (1,33,092 Ha), Castor
has highest production (17,48,439 quintals/yr) and yield (4474 Kg/ha) during Kharif
season.
Table 2.5: Production & productivity - Rabi season
Crops
Rainfed Irrigated Total
Are
a
(ha)
Producti
on
(qtn/yr)
Avg.
yield
(kg/ha
)
Area
(ha)
Producti
on
(qtn/yr)
Avg.
yield
(kg/ha
)
Area
(ha)
Producti
on
(qtn/yr)
Productivi
ty or yield
(kg/ha)
Wheat 118
0
7080 600 49183 1419421 2886 50363 1426501 2832.44
Gram 185 2033.15 1099 57 128.6 225.61 242 2162 893.29
Rapese
ed &
mustar
d
140
0
21775.5 1555.3
9
15394
1
2507699 1629 15534
1
2529474 1628.34
Isabgul 0 0 12388 82380.2 665 12388 82380 665
Fennel 0 0 2856 45181.92 1582 2856 45182 1582
Tobacc
o
0 0 805 15603.65 1938.3
4
805 15604 1938.34
Source: Department of Agriculture, Agriculture Statistic of state, AgriState
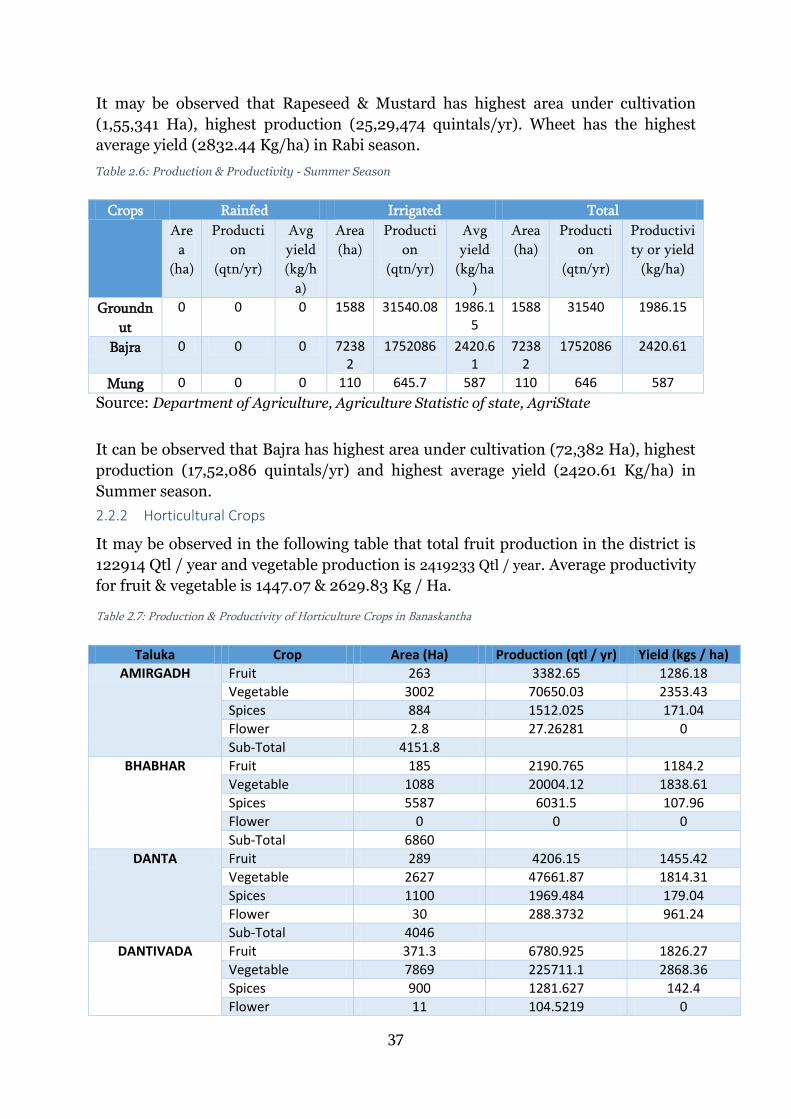
37
It may be observed that Rapeseed & Mustard has highest area under cultivation
(1,55,341 Ha), highest production (25,29,474 quintals/yr). Wheet has the highest
average yield (2832.44 Kg/ha) in Rabi season.
Table 2.6: Production & Productivity - Summer Season
Crops Rainfed Irrigated Total
Are
a
(ha)
Producti
on
(qtn/yr)
Avg
yield
(kg/h
a)
Area
(ha)
Producti
on
(qtn/yr)
Avg
yield
(kg/ha
)
Area
(ha)
Producti
on
(qtn/yr)
Productivi
ty or yield
(kg/ha)
Groundn
ut
0 0 0 1588 31540.08 1986.15
1588 31540 1986.15
Bajra 0 0 0 72382
1752086 2420.61
72382
1752086 2420.61
Mung 0 0 0 110 645.7 587 110 646 587
Source: Department of Agriculture, Agriculture Statistic of state, AgriState
It can be observed that Bajra has highest area under cultivation (72,382 Ha), highest
production (17,52,086 quintals/yr) and highest average yield (2420.61 Kg/ha) in
Summer season.
2.2.2 Horticultural Crops
It may be observed in the following table that total fruit production in the district is
122914 Qtl / year and vegetable production is 2419233 Qtl / year. Average productivity
for fruit & vegetable is 1447.07 & 2629.83 Kg / Ha.
Table 2.7: Production & Productivity of Horticulture Crops in Banaskantha
Taluka Crop Area (Ha) Production (qtl / yr) Yield (kgs / ha)
AMIRGADH Fruit 263 3382.65 1286.18
Vegetable 3002 70650.03 2353.43
Spices 884 1512.025 171.04
Flower 2.8 27.26281 0
Sub-Total 4151.8
BHABHAR Fruit 185 2190.765 1184.2
Vegetable 1088 20004.12 1838.61
Spices 5587 6031.5 107.96
Flower 0 0 0
Sub-Total 6860
DANTA Fruit 289 4206.15 1455.42
Vegetable 2627 47661.87 1814.31
Spices 1100 1969.484 179.04
Flower 30 288.3732 961.24
Sub-Total 4046
DANTIVADA Fruit 371.3 6780.925 1826.27
Vegetable 7869 225711.1 2868.36
Spices 900 1281.627 142.4
Flower 11 104.5219 0

38
Taluka Crop Area (Ha) Production (qtl / yr) Yield (kgs / ha)
Sub-Total 9151.3
DEESA Fruit 1671.2 21041.4 1259.06
Vegetable 45786 1301526 2842.63
Spices 1805 3194.584 176.99
Flower 106.4 1003.046 942.71
Sub-Total 49368.6
DEODAR Fruit 446 5241.032 1175.12
Vegetable 1615 34834.73 2156.95
Spices 7069 7635.907 108.02
Flower 0 0 0
Sub-Total 9130
DHANERA Fruit 458 6436.21 1405.29
Vegetable 4126 101258.4 2454.15
Spices 7401 8001.518 108.11
Flower 0 0 0
Sub-Total 11985
KANKREJ Fruit 220.5 2655.359 1204.24
Vegetable 6114 121985 1995.18
Spices 13816 14542.08 105.26
Flower 0 0 0
Sub-Total 20150.5
PALANPUR Fruit 955 17259.98 1807.33
Vegetable 7273 159945.7 2199.17
Spices 1563 2964.14 189.64
Flower 80 756.0955 945.12
Sub-Total 9871
THARAD Fruit 2542 28937.46 1138.37
Vegetable 937 15970.6 1704.44
Spices 19085 19333.24 101.3
Flower 0 0 0
Sub-Total 22564
VADGAM Fruit 1011 23672.97 2341.54
Vegetable 10931 309644.4 2832.72
Spices 814 1429.611 175.63
Flower 62.8 594.3195 946.37
Sub-Total 12818.8
VAV Fruit 82 1109.127 1352.59
Vegetable 624 10040.48 1609.05
Spices 17506 17790.6 101.63
Flower 0 0 0
Sub-Total 18212
Total for Banaskantha
District
Fruit 8494 122914 1447.07
Vegetable 91992 2419233 2629.83
Spices 77530 85686.32 110.52
Flower 293 2773.619 946.63
Sub-Total 178309
*2 new blocks, Suigam formed out of Vav and Lakhani from Deesa block

39
2.3 Irrigation Based Classification
It is an established fact that 20 to 25% water is lost during irrigation due to uneven
fields and poor farm designing. Over irrigation leaches soluble nutrients from the
crop root zone, makes the soil less productive and degrades ground water quality. On
the other hand, under irrigation of elevated parts of the fields results in accumulation
of salts in such patches besides causing water stress and injurious effects of
applied fertilizers. The fields being not properly leveled, cause wastage of water result
in low irrigation efficiencies and ultimately lesser yields than the potential. In the
present scenario of popularity of flood irrigation and decreasing irrigation water
availability, it has become imperative to develop strategies for efficient utilization of
valuable resource.
Some of the major departments that look after the irrigation in the district of
Banaskantha are State & District Irrigation Department, Panchayat Irrigation
Department and Gujarat Green Revolution Company (as Micro irrigation is an
important area for saving water). The micro-irrigation in different cropping systems,
especially horticulture based cropping system is now targeted. For irrigating the
farms, both bore well and canal irrigation facilities are available in the district.
Table 2.8: Irrigation based classification
(Area in Ha.)
Taluka Gross Irrigated Area Gross Rainfed Area Total Area Agriculture Horticulture Total Agriculture Horticulture Total
Amirgadh 18436 4125.8 22561.8 14524 26 14550 37111.8
Bhabhar 27499 6842 34341 17438 19 17457 51798
Danta 6726 4017 10743 28495 29 28524 39267
Dantivada 28502 9114 37616 4485 37 4522 42138
Deesa 145459 49201.4 194660.4 67135 167 67302 261962.4
Deodar 43095 9085 52180 16164 45 16209 68389
Dhanera 65962 11939 77901 34316 46 34362 112263
Kankrej 104705 20128 124833 29423 22 29445 154278
Palanpur 82080 9776 91856 47170 96 47266 139122
Tharad 134027 22310 156337 85687 254 85941 242278
Vadgam 38388 12717.8 51105.8 35576 101 35677 86782.8
Vav 39406 18204 57610 127141 8 127149 184759
Total 734285 177460 911745 507554 850 508404 1420149
Source: Department of Agriculture & Horticulture
*2 new blocks, Suigam formed out of Vav and Lakhani from Deesa block
It may be observed that total sown area of the district is 1420149 Ha., gross irrigated
area is 911745 Ha., gross rainfed area of the district is 508404 Ha.

40
CHAPTER 3
3 Water Availability The district can be divided in three main parts – the hilly- mountainous region
having high relief and rugged topography covering parts of Dhanera, Palanpur,
Vadgaon and entire Danta taluka in the east, the piedmont zone all along the
periphery of hilly area, and west and southwest of River Banas the area is flat plain
with occasional undulations given rise to by sand dunes and mounds in the west. The
western extension of this plain merges into the marshy area of Rann of Kutch.
Drainage Pattern
The district has semi-arid climate. Extreme temperatures, erratic rainfall and high
evaporation are the characteristic features of this type of climate. Since the district
experiences a semi-arid type of climate, the rivers flowing through it are of
ephemeral nature i.e. have water during monsoon only and dry up after monsoon.
The drainage network in the district is constituted mainly by the Banas and
Sarashwati rivers and their tributaries. Other important rivers passing through or
originating from the district are Arjuni, Sipu, Balaram, Khari, Khapra, Kalari, Gujudi,
Dholka, Umardashi, Chekaria, Selvam, Rel, Ravi and Sirinala.
In the extreme east, Sabarmati river forms district boundary with Sabarkantha
district and in part controls the drainage network of the hilly area east of Danta. The
surface water resources of the district are very limited. Groundwater is the main
source of irrigation. Important Irrigation schemes of the districts are Dantiwada,
Mukteshvar Irrigation Project, Sipu Reservoir Project and Hadmatiya Irrigation
Scheme. There are few important lakes in the district i.e Ganga Saragar near Jethi
Village in Palanpur taluka, Man Sarover near Chitrasani village and Dantiwala lake
constructed near Dantiwada Dam. Various canals drawn from the lakes irrigate the
land of the district.
Sources of water supply
Major & medium irrigation canals, Minor irrigation tanks, Diversion channels, Rain
water harvesting structures and Ground water extraction structures such as bore
wells etc. are the major sources of water supply in the district. There are four line
irrigation departments namely State Irrigation Department, Minor Irrigation
Department, SSNNL & GWRDC which are engaged in supply & distribution of water
mainly for irrigation, domestic and also for industrial purposes. Nagar Palika, Gram
Panchayats and Drinking water department are responsible for supplying drinking
water. However, to some extent domestic and industrial water requirement is also
met from the private sources.

41
Map 3-1 River and Waterbody Map
Source: BISAG
3.1 Status of Water Availability
Table 3.1: Status of water availability
S.No. Sources Kharif Rabi Summer Total (MCM)
1 Surface Irrigation i Canal(Major & Medium
Irrigation) 221.5126 869 107.4 1197.94
ii Minor Irrigation tanks 0 11.5 0 12 iii Lift Irrigation/Diversion 0 30 0 30 iv Rain Water Harvesting 0 27 0 27 Sub-total 221.5126 937.5229 107.4 1266.436 2 Ground Water i Deep Tube Well 1077.87 Grand Total 2344.31
Source: SSNNL, GWRDC and WRD, Govt. of Gujarat (2014-15)

42
It can be observed that the major sources of water availability are major & medium
irrigation canals, and deep tube wells. The total annual water availability of
the district is 2344.31 MCM, out of which share of surface water is 54% and
ground water is 46%. Within surface irrigation, water availability through canals is
highest as 1197.94 MCM, followed by diversion schemes as 30 MCM, followed by
RWH schemes as 27 MCM and minor irrigation tanks as 12 MCM.
Figure 3.1: Sources of Water Availability
The water availability in the district is assessed based on the average annual
discharge available in various surface and ground irrigation structures of various line
irrigation departments. The availability of water from treated effluents is also
assessed. Presently, there are no running sewage treatment plants (STP) in the
district, and hence the water availability from treated effluents is zero. However,
there is 1 proposed project of Sewage Treatment Plant (STP) of 28.67 MLD capacity
in the district. On completion of the STP project, the treated water will be mainly
used for irrigation and industrial purposes. Thus, it can be assumed that annual
water availability of 10.464 MCM will be added by the year 2020.
3.2 Status of Ground Water Availability Ground water exploration studies by test drilling in the district commenced during
1961-62 by ETO (now CGWB) and continued by CGWB under UNDP and regular
exploration programme of CGWB. CGWB also constructed tube wells under
Production well programme in Bhabhar area under Desert Development scheme
(DDS) under Crash programme and Economic area Development programme during
early seventies for the Government of Gujarat. Apart from the exploratory wells and
production wells Piezometers tapping aquifer at different depths are also constructed
for periodic monitoring of the ground water regime and quality in the district and is
1197.94
12 30 27
1077.87
0
200
400
600
800
1000
1200
1400
Canal Minor Irrigation tanks
Diversion RWH structure Deep Tube Well
Water Availability (MCM)

43
continued till date. Total 143 wells are constructed in the district (upto march 2010).
I.e. 42 EW, 14 OW, 47 PZ and 40 Deposit wells are constructed.
Hydrogeological studies and exploratory drilling carried out in the district broadly
indicated multi-aquifer system in the area. A phreatic and confined/semi-confined
aquifer system was deciphered down to the explored depth of 600m. In hard rock
area, there are strong evidences indicating presence of potential fracture zones at the
depth below 100m.
Geomorphology:
Geo-morphologically the district can be divided into six sub micro regions on the
basis of physiography, climate, geology, soils and natural vegetation.
a) Vav Sandy Plain: It is mostly sandy plain with an altitude of 100 m above mean sea
level. There are a few small channels, which merge into little Rann of Katchchh.
Geologically area is composed of Alluvium, blown sand etc.
b) Sandy Plain: The region mainly extends over the north and north western parts of
the district bounded by the state of Rajasthan in the north, Banas valley in the east
and south and Vav sandy plain in west. The region has the sloppy gradient, towards
the west in which the river Sukal flows. Geologically area is composed of Alluvium,
blown sand etc.
c) Banas Vally: This region extends over the central and south-western part of the
district, It is mainly formed by the Banas River which flows southwesterly direction
and ultimately merges into Rann of Katchchh. Northern part of this region is high in
elevation than the south and western portions. Geologically area is composed
predominantly of Alluvium, blown sand etc.
d) Banskantha Aravalli Range: The region spreads over the eastern part of
Banaskantha district, occupying Danta and part of Palanpur and small area of
Vadgaon talukas. It is bounded by the state of Rajasthan from north, Banas Valley
from west, Mehsana district from south and Sabarkantha district from east. This
region is highly elevated ranging between 100 and 300 m above mean sea level.
Saraswati River is the main river of the region. Geologically area is composed
Alluvium, blown sand etc
e) Jasor Chhotila Hills: The region lies in Dhanera and Palanpur taluks and is
enclosed by the state of Rajastahn from three sides while Banaskantha Aravalli range
makes its limit in the south. It is actually disrupted part of Aravalli range by the
Banas valley. It is an undulating terrain with an elevation of 300 m above mean sea
level and is covered by forest. Geologically this region is mainly composed of
Eranpura granite formation.
f) Umardasi – Sarawati Plain: This region mainly extends over the south –eastern
part of Banskantha district covering the taluks of Palanpur and Vadgaon. It is
bounded by Banas valley in the west and north, Banaskantha Aravalli range in the
east and Mehsana district in the south. This region is formed by the Umardasi and
Saraswati River and having an elevation of 100 m above mean sea level. Geologically
area is composed of alluvium, blown sand etc.

44
Hydrogeology
Precambrian hard rocks, semi-consolidated Mesozoic and tertiary formations and
unconsolidated quaternary alluvial deposits form multilayer aquifer system in the
district. Groundwater occurs both under phreatic and confined conditions, however
its development is restricted depending upon the aquifer geometry and yield
characteristic of individual aquifer and/or ground water quality of the formation
water.
Northern and central parts of the north Gujarat including major part of the
Banaskantha district is underlain by post Miocene alluvium and older semi
consolidated Mesozoic and Tertiary sedimentary formations. These sedimentary
formations form the most prolific multi-aquifer system comprising several confined
aquifers; these sediments are mainly consisted of Coarse sand, gravel, kankar, silt,
clay and clay stones. Groundwater occurs both under phreatic and confined
conditions in arenaceous horizons within sedimentaries. The occurrence and
movement of groundwater is mainly controlled by intergranular pore spaces. Two
major aquifer units have been identified the upper unit is mostly phreatic but
becomes semi confined to confined in some parts.
Table 3.2: Status of ground water availability
(As per GWRE-2011)
Sr No
Taluka Ground water (MCM) OE Critical Safe Saline Draft Recharge Gap
1 Amirgadh Safe 31.903 46.713 14.81 2 Danta Safe 49.98 75.385 25.405 3 Dantiwada Safe 51.137 76.415 25.278 4 Deesa O.E. 270.856 255.914 -14.942 5 Deodar O.E. 108.126 56.819 -51.307 6 Dhanera O.E. 176.85 87.777 -89.073 7 Kankrej O.E. 114.912 98.4 -16.512 8 Palanpur Critical 149.069 155.833 6.764 9 Tharad O.E. 109.18 73.547 -35.633 10 Vadgam O.E. 145.316 97.657 -47.659 11 Bhabhar Saline 12 Vaav Saline
Source: Central Ground Water Board, 2011
It can be observed that 6 out of 12 Talukas are overexploited. This is evident from the
figures of draft and recharge of ground water in these Talukas. The draft of ground
water considerably exceeds its recharge, and it indicates alarming situation for
ground water resource. Further, 2 Talukas are under Saline zone and 1 Taluka falls
under critical zone. Only 3 Talukas namely Amirgadh, Danta and Dantiwada fall
under safe zone. Thus, there is need to rejuvenate surface water sources and reliance
on groundwater needs to be minimized. More focus should be emphasized on ground
water recharge, water use efficiency and sustainable use of water.

45
3.3 Status of Command Area The command area in the district can be categorized as Canal command and other
services command, which encompasses command created by ponds, tanks and tube
wells.
Table 3.3: Status of Canal Command
S. No. Name of the Taluka Information of Canal Command Total Area Developed
Area Undeveloped Area
1 Amirgadh 4750 2375 2375 2 Suigaam 1400 700 700 3 Tharad 26316 15039.00 11277.00 4 Vaav 100294 80094.00 20200.00 5 Dhanera 150 75 75 6 Danta 3106 1553 1553 7 Deodar 588 463 125 8 Bhabhar 28176 27157.00 1019.00 9 Kankrej 14044 12646 1398 10 Lakhni 100 50 50 11 Deesa 23997.75 15998.50 7999.25 12 Vadgaam 5871 3914 1957 13 Dantiwada 1188 792 396 14 Palanpur 17395.5 11597 5798.5 Total 227376.25 172453.5 54922.75
Source: SSNNL, GWRDC and WRD, Govt. of Gujarat
*2 new blocks, Suigam formed out of Vav and Lakhani from Deesa block
Vaav Taluka has highest canal command in the district followed by Bhabhar taluka
and Tharad taluka. Total canal command of the district is 2,27,376.25 Ha, out of
which 1,72,453.5 Ha is developed and 54,922.75 Ha is undeveloped.
Table 3.4: Status of other services command
S.No. Name of the Taluka Information on the other Services Command Total Area Developed Area Undeveloped Area
1 Amirgadh 53 53 0 2 Suigaam 0 0 0 3 Tharad 450 450.00 0.00 4 Vaav 661 661.00 0.00 5 Dhanera 688 688 0 6 Danta 27 27 0 7 Deodar 688 688 0 8 Bhabhar 503 503.00 0.00 9 Kankrej 1666 1666 0 10 Lakhni 0 0 0 11 Deesa 2381 2381.00 0.00 12 Vadgaam 741 741 0

46
S.No. Name of the Taluka Information on the other Services Command Total Area Developed Area Undeveloped Area
13 Dantiwada 185 185 0 14 Palanpur 1481 1481 0 Total 9524 9524 0
Source: SSNNL, GWRDC and WRD, Govt. of Gujarat
*2 new blocks, Suigam formed out of Vav and Lakhani from Deesa block
Total other services command area of the district is 9,524 Ha, out of which the entire
area is developed. Further, there is no other services command in case of Suigaam
Taluka and Lakhni Taluka. Deesa Taluka has highest other services command in the
district followed by Kankrej taluka and Palanpur taluka.
Map 3-2 Canal Map of district
Source: BISAG
3.4 Existing type of Irrigation

47
Table 3.5: Existing type of irrigation
Name of Taluka
Source of Irrigation
Surface Irrigation (1) Ground Water (2)
Total
Govt. Canal
Community Ponds
Individual /Pvt. Ponds
Govt. Reservoirs
WHS Govt. Tube Wells
Dantewada
No 2 0 58 0 0 7 67 Command Area (ha)
1185 0 2.03 0 0 185 1372.03
Palanpur No 1 0 84 1 0 56 142 Command Area (ha)
6763 0 2.94 0.05 0 1481 8246.99
Deesa No 2 0 151 0 0 73 246 Command Area (ha)
19150 0 5.285 0 0 2381 21536.29
Kankrej No 5 0 0 6 0 63 75 Command Area (ha)
20526 0 0 0.3 0 1666 22192.3
Bhabhar No 2 34 5 1 19 19 80 Command Area (ha)
27926 170 0.175 0.05 67 503 28666.23
Deodar No 1 0 5 0 0 26 32 Command Area (ha)
338 0 0.175 0 0 688 1026.175
Vav No 6 40 16 1 145 11 233 Command Area (ha)
99194 212 0.56 0.05 309 661 100376.6
Tharad No 4 21 6 0 28 17 76 Command Area (ha)
26196 276 0.21 0 48 450 26970.21
Dhanera No 0 0 35 2 0 26 63 Command Area (ha)
0 0 1.225 0.1 0 688 689.325
Vadsgaon No 0 0 187 13 0 28 228 Command Area (ha)
0 0 6.545 0.65 0 741 748.195
Amirgarh No 0 0 42 0 0 2 44 Command Area (ha)
0 0 1.47 0 0 53 54.47
Danta No 0 4 696 2 1 1 704 Command Area (ha)
0 16 24.36 0.1 3 27 70.46
Suigam No 0 6 18 5 0 14 74 Command Area (ha)
0 27 0.63 0.25 0 80.5 108.38
Lakhani No 0 0 1 0 0 17 1 Command Area (ha)
0 0 0.035 0 0 0 0.035
Source: District level Irrigation Departments, GSWMA, GLDC
*2 new blocks, Suigam formed out of Vav and Lakhani from Deesa block

48
It can be observed that there are 23 nos. of government canals, 105 nos. of
community ponds, 1304 nos. of private ponds, 31 nos. of reservoirs, 193 nos. of WHS
and 409 nos. of government bore wells, in the Banaskantha district.

49
CHAPTER 4:
4 Water Requirement /Demand
4.1 Domestic Water Demand
To assess present population (2015) and future population (2020), an annual growth
rate of 2% is assumed. To assess water demand, requirement of 100lpcd for rural and
140 lpcd for urban is assumed.
Table 4.1: Present domestic water demand
Talukas Population in 2015 Present Gross Water Demand in (MCM)
Urban Rural Total Rural Urban Total Amirgadh 142942 0 142942 5.217 0 5.217 Bhabhar 109359 23646 133005 3.992 0.863 4.855 Danta 223653 19173 242826 8.163 0.7 8.863 Dantiwada 124439 0 124439 4.542 0 4.542 Deesa 393195 125446 518641 14.352 4.579 18.931 Deodar 157491 16105 173596 5.748 0.588 6.336 Dhanera 217256 31944 249200 7.93 1.166 9.096 Kankrej 278157 19505 297662 10.153 0.712 10.865 Lakhani 169816 0 169816 6.198 0 6.198 Palanpur 300825 173049 473874 10.98 6.316 17.296 Suigam 90341 0 90341 3.297 0 3.297 Tharad 288554 30190 318744 10.532 1.102 11.634 Vadgam 250503 9049 259552 9.143 0.33 9.473 Vav 175508 0 175508 6.406 0 6.406 Total 2922039 448107 3370146 106.65 16.356 123.01
*2 new blocks, Suigam formed out of Vav and Lakhani from Deesa block
It can be observed that total present domestic water demand is 123.01 MCM. There
are both Surface water sources and Ground Water sources (Government owned &
Individual) for supplying domestic water to rural areas. The surface water sources
include Dharoi Dam Base, Dantiwada dam base, Sipu dam base, Mukteshhwar dam
base and Narmada Canal base, with separate treatment plant location for each
source. Ground water sources include Tube Well, Well and individual hand pumps.
Table 4.2: Projected domestic water demand (2020)
Talukas Population in 2020 Future Gross Water Demand in MCM (2020 )
Urban Rural Total Rural Urban Total Amirgadh 156178 0 156178 5.7 0 5.7 Bhabhar 119484 25835 145319 4.361 0.943 5.304 Danta 244361 20949 265310 8.919 0.765 9.684 Dantiwada 135961 0 135961 4.963 0 4.963 Deesa 429601 137062 566663 15.68 5.003 20.683 Deodar 172074 17596 189670 6.281 0.642 6.923 Dhanera 237372 34902 272274 8.664 1.274 9.938 Kankrej 303913 21311 325224 11.093 0.778 11.871

50
Talukas Population in 2020 Future Gross Water Demand in MCM (2020 )
Urban Rural Total Rural Urban Total Lakhani 185540 0 185540 6.772 0 6.772 Palanpur 328680 189073 517753 11.997 6.901 18.898 Suigam 98706 0 98706 3.603 0 3.603 Tharad 315272 32986 348258 11.507 1.204 12.711 Vadgam 273697 9887 283584 9.99 0.361 10.351 Vav 191758 0 191758 6.999 0 6.999 Total 3192597 489601 3682198 116.529 17.871 134.4
*2 new blocks, Suigam formed out of Vav and Lakhani from Deesa block
It can be observed that projected future domestic water demand (2020) is 134.4
MCM, and will increase by 9.25%, as compared to present domestic water demand
(2015).
4.2 Crop Water Requirement
Water demand of different crops (agriculture + horticulture) has been worked out
based on the Area under different crops as discussed in Chapter 2.
Table 4.3: Crop Water Requirement
Taluka Area Sown (ha)
Irrigated area (ha)
Crop water demand (MCM)
Water Potential required (MCM)
Existing water potential (MCM)
Water potential to be created (MCM)
Amirgadh 37111.8 22561.8 70.38 70.38 54.85 15.53 Bhabhar 51798 34341 176.77 176.77 136.46 40.31 Danta 39267 10743 101.87 101.87 47.84 54.03 Dantivada 42138 37616 133.95 133.95 124.73 9.22 Deesa 261962.4 194660.4 849.27 849.27 804.6365 44.63 Deodar 68389 52180 235.30 235.30 211.1536 24.15 Dhanera 112263 77901 384.22 384.22 332.394 51.82 Kankrej 154278 124833 391.58 391.58 361.8124 29.76 Palanpur 139122 91856 212.38 212.38 187.6546 24.72 Tharad 242278 156337 445 445 231 213.93 Vadgam 86782.8 51105.8 260.9097 260.9097 208.901 52.01 Vav 184759 57610 312.1 312.1 89.115 222.99 TOTAL 1420149 911745 3573.308 3573.308 2790.211 783.0973
*2 new blocks, Suigam formed out of Vav and Lakhani from Deesa block
It has been assumed that water potential required is equal to the total crop water
requirement of cultivated area, while the existing water potential is equal to crop
water requirement of irrigated area. It can be observed that water potential to be
created is to the tune of 783.09 MCM for Banaskantha district.
The crop wise water requirement has been taken based upon discussion with
Agriculture Universities and department officials as per practice prevailing in the
State which is as under:

51
Table 4.4 Crop wise water requirement
Season Crops MCM/Ha Crops MCM/Ha kharif Paddy 0.005 GROUNDNUT 0.003
JOWAR 0.0035 CASTOR 0.005 BAJRI 0.0035 SESAMUM 0.002 MAIZE 0.0035 COTTON 0.005 RAGI 0.002 TOBACCO 0.0042 MUNG 0.0024 GUAR SEED 0.0035 MATH 0.0024 SOYABEAN 0.0024 UDID 0.0024 TUR 0.0024
Rabi WHEAT 0.0052 SUGARCANE 0.018 JOWAR 0.007 ISABGUL 0.0032 MAIZE 0.007 FENNEL 0.007 GRAM 0.003 TOBACCO 0.0063 RAPESEED & MUSTARD
0.0035
Summer GROUNDNUT 0.0075 MUNG 0.007 BAJRA 0.0065 UDID 0.007 PADDY 0.017 SESAMUM 0.0035 MAIZE 0.0098
Horticulture Chillies 0.009 Banana 0.025 Fennel 0.007 Other Fruits 0.012 Cumin 0.0032 Vegetables 0.006167 Fenugreek 0.0059 Flower 0.006 Other Spices 0.0032
4.3 Livestock Water Requirement
As mentioned in 1.3, the annual growth in livestock population can be assumed to be
2.7%, based on livestock census 2007 & 2012. Accordingly, the present livestock
population (2015) and future livestock population (2020) is assessed. For calculating
the livestock water demand, the daily water requirement per livestock has been
assumed as under:
i. Poultry & Ducks: 0.459 Litres
ii. Small (pigs + goats + ships): 7 Litres
iii. Dairy animals: 65 Litres
iv. Draft animals: 40 Litres
Table 4.5: Livestock water demand
Name of Taluka
Present Number of livestock (2015)
Present water Demand (MCM)
Water demand in 2020 (MCM)
Existing Water Potential (MCM)
Water potential to be created (MCM)
Vav 290053 4.885 5.494 4.885 0.609 Tharad 261420 5.518 6.207 5.518 0.689

52
Dhanera 308737 6.298 7.085 6.298 0.787 Dantiwada 102518 2.047 2.302 2.047 0.255 Amirgadh 122201 1.65 1.858 1.65 0.208 Danta 328847 3.904 4.391 3.904 0.487 Vadgam 283566 4.281 4.816 4.281 0.535 Palanpur 389628 5.163 5.807 5.163 0.644 Deesa 417280 8.765 9.859 8.765 1.094 Deodar 191228 4.09 4.6 4.09 0.510 Bhabhar 106112 2.034 2.286 2.034 0.252 Kankrej 189939 4.08 4.59 4.08 0.510 TOTAL 2991529 52.715 59.295 52.715 6.58
*2 new blocks, Suigam formed out of Vav and Lakhani from Deesa block
It has been assumed that the existing water potential is equal to present water
demand of livestock. Thus, the water potential to be created implies the quantum of
water availability to be created to meet livestock water demand in 2020. It can be
observed that water potential to be created is to the tune of 6.58 MCM for
Banaskantha district.
4.4 Industrial Water Requirement
As on 31.3.2011, there are 6 industrial areas in the district namely Palanpur, Ambaji,
Deesa, Shihori, Chandisar and Deodar. Details of micro& small enterprises and large
scale industries in the district are as follows:
Micro & Small Enterprises and Artisan Units:
1. Agro-based Industries– 64 Units
2. Chemical based industries – 31 Units
3. Rubber, Plastic & Petro based industries – 7 Units
4. Mineral based industries – 114 Units
5. Metal based (Steel Fab.) – 114 Units
6. Kachori making – 266 Units
Large Scale Industries/Public Sector Undertakings in the district:
1. B.K.District Co.Op.Milk Producer Union Ltd., Palanpur
2. Ihsedu Agrochem Pvt. Ltd., Ambaji
3. Hindusthan Marble, Ambaji
4. Vikash Greneriz Ltd., GIDC,Chandisar
5. Green Marble, Ambaji
6. B.K.Distric Oil Seeds Union Ltd., Badarpura
7. Royal Proteins Pvt. Ltd., Rajpur, Deesa
8. Shreeji Industries, Awal, Amirgadh
9.”Banas Dan” Cattle Feed Factory, Palanpur
10. Pawan Cement, Amirgadh
11. Shri Ram Cement, Hadad, Ambaji

53
As per data received from GWSSB, present industrial water requirement is 37.79
MLD i.e, annual water requirement of 13.793 MCM. The projected industrial water
requirement (2020) is 39.81 MLD i.e, annual water requirement of 14.53 MCM.
Thus, the water potential to be created is 0.737 MCM.
Table 4.6: Industrial water demand
Present Water demand (MCM)
Water Demand in 2020 (MCM)
Existing Water potential (MCM))
Water potential to be created (MCM)
13.793 14.53 13.793 0.737
4.5 Water Demand for Power Generation
The district is not having any thermal or nuclear power plant where water may be
consumed. Therefore, demand of water for power generation has been taken as nil.
4.6 Total Water Demand of the district for various sectors
Table 4.7: Total water demand of district
Components Total MCM Domestic Crop Livestock Industrial Power
Present (2015)
123.01 3573.308 52.715 13.793 0 3762.8
Future (2020)
134.4 3573.308 59.215 14.530 0 3781.5
It can be observed that the total present water demand from various sectors is 3762.8
MCM, while future water demand (2020) is 3781.5 MCM.
4.7 Water Budget
Table 4.8: Water budget
Existing water availability (MCM) Water demand (MCM) Water gap (MCM)
Surface water
Ground water
Total (MCM)
Present Projected (2020)
Present Projected (2020)
1266.436 1077.87 2344.31 3762.8 3781.5 1418.49 1437.19
It can be observed that based on present and projected water demand (2020), and
present water availability (surface & ground), the present water gap is to the tune of
1418.49 MCM, and projected water gap (2020) is to the tune of 1437.19 MCM.
However, water availability of 10.464 MCM will be added by 2020 through ongoing
STP unit. So, the projected water gap (2020) shall be to the tune of 1426.726 MCM.

54

55
5 Strategic Action Plan for Irrigation in District under PMKSY
A strategic plan for four years has been prepared starting from 2016-17 to 2019-20.
The strategic action plan is broadly prepared under five heads namely: AIBP, Har
Khet Ko Pani, PMKSY Watershed, Per Drop More Crop and Extension. Various
departments which have prepared the strategic action plan include:
i. Nodal irrigation departments including State Irrigation Department,
Sardar Sarovar Narmada Nigam Limited (SSNNL) and Gujarat Water
Resource Development Corporation ( GWRDC)
ii. Gujarat State Watershed Management Agency (GSWMA)
iii. Gujarat Land Development Corporation (GLDC)
iv. Gujarat Green Revolution Company Limited (GGRC)
v. Agriculture Technology Management Agency (ATMA)
5.1 Component wise Strategic Action Plan
Total plan for four years works out to be Rs. 1984.0507 Crores. Maximum share is
of Per Drop More Crop of Rs 927.236 Crores (46.73%), followed by Har Khet Ko Pani
of Rs. 829.694 Crores (41.82%), followed by PMKSY Watershed of Rs. 126.2513
Crores (6.36%), followed by AIBP of Rs 63.213 Crores (3.19%), Convergence
component of Rs 35.84 Crs (1.81%) and marginal shares of Extension of Rs 1.816
Crores. Detailed component wise break up of financial outlay can be observed in the
following table.
Table 5.1 Component wise plan
Component Yr16-17 Yr17-18 Yr18-19 Yr19-20
Total Budget (Rs Lakhs)
% Share
AIBP 6321.3 0 0 0 6321.3 3.19% Har Khet Ko Pani 32236.9 32236.9 9247.8 9247.8 82969.4 41.82% PMKSY Watershed
8656.738 2599.6692
1004.4108
364.31 12625.13
6.36%
Per Drop More Crop
28211.6 21504 21504 21504 92723.6 46.73%
Extension 40.786 43.267 47.208 50.347 181.608 0.09% MGNREGA Convergence
1924.162 413.0508
895.3892
351.465 3584.067 1.81%
Total 77391.46 56796.89
32698.81
31517.92
198405.076
AIBP component is to be executed mainly by Sardar Sarovar Narmada Nigam Ltd.
(SSNNL). Har Khet Ko Pani component will be implemented by Nodal Irrigation
Department, SSNNL, GWRDC and GLDC. Per drop more crop component will be
executed by GWRDC and GGRC. Water shed component will be taken care of by the
Rural Development Department through GSWMA and extension & training
component will be executed by ATMA. However, all the stakeholders need to have

56
coordination among themselves to have the maximum irrigation efficiency and to
avoid duplicity.
Figure 5.1 Component wise allocation of budget
Pradhan Mantri Krishi Sinchayee Yojana (PMKSY)-Watershed Component
PMKSY-Watershed Component (erstwhile named as Integrated Watershed
Management Programme) is one of the flagship program of Govt. of India. The main
objectives of this is to restore the ecological balance by harnessing, conserving and
developing degraded natural resources such as soil, vegetative cover and water.
Gujarat is one of the largest States in context of land area treatment under PMKSY-
Watershed project. The important activities carried out under this projects are Soil
moisture conservation, Water harvesting, Vegetative cover and Plantation,
Agricultural production and Productivity improvement, Dairy development, Agro
processing, Livelihood and Income Generating Activities etc. In Gujarat PMKSY-
Watershed component is implemented through a State Level Nodal Agency
constituted as Gujarat State Watershed Management Agency (GSWMA), an
autonomous society supported under the Rural Development Department (RDD) of
Government of Gujarat. GSWMA has vision of “Enhancing the quality of rural
population through Sustainable, Equitable and Participatory Natural resources
Management” and also has Mission of “Creating sustainable rural livelihoods
through scientific and Integrated Watershed Development Approach”. GSWMA
works in all the 33 districts of Gujarat. GSWMA planned to cover all the micro-
watersheds (at village level) of the state in the next 18 years.
Thus it will cover all the talukas of the state. Total 610 no. of PMKSY-Watershed
Component projects under six batches covering 31.04 lakh hectors of land are
currently under implementation. GSWMA has its own structural arrangements
(GSWMA, District Watershed Development Unit, PIA, and Watershed Committee)
from state to village level for implementation of program and has system of internal
3.19%
41.82%
6.36%
46.73%
0.09% 1.81%
AIBP Har Khet Ko Pani PMKSY Watershed
Per Drop More Crop Extension Convergence

57
monitoring of project activities through different means. GSWMA has its own web
based monitoring system as Soil Water Resource Management System (SWaRSys).
The said system is online and helps not only for the monitoring/documentation of all
the main project activities but also facilitates to collect and collate monthly and
quarterly data from District level offices. For preparation of DIP, the watershed
component information is collected from various levels and incorporated in this
document for the years 2016-20.
5.2 Department wise allocation of budget Out of total budget of Rs. 1984.0507 Crores, maximum share is of GGRC of Rs
871.956 Crores (43.95%), followed by SSNNL of Rs. 522.995 Crores (26.36%),
followed by Nodal Irrigation Department of Rs 319.40 Crores (16.1%), followed by
GSWMA of Rs 162.091 Crores (8.17%), followed by GWRDC of Rs. 76.32 Crs (3.85%)
and marginal shares of GLDC (Rs 29.472 Crs) and ATMA (1.81 Crs).
Table 5.2 Department wise allocation of plan
Department Yr16-17 Yr17-18 Yr18-19 Yr19-20 Total Budget (Rs Lakhs)
% Share
Nodal Dept. 7985 7985 7985 7985 31940.000 16.10 SSNNL 29310.4 22989.1 0 0 52299.500 26.36 GWRDC 1908 1908 1908 1908 7632.000 3.85 GSWMA* 10580.9 3012.72 1899.8 715.775 16209.168 8.17 GLDC 736.8 736.8 736.8 736.8 2947.200 1.49 GGRC 26829.6 20122 20122 20122 87195.600 43.95 ATMA 40.786 43.267 47.208 50.347 181.608 0.09 Total 77391.46 56796.89 32698.81 31517.92 198405.076
* The budget includes component of convergence with MNREGA of Rs 3584.067 Lakhs.
Table 5.3 GSWMA Plan Abstract
Block Fund Requirement (Rs Lakhs) Yr 2016-17 Yr 2017-18 Yr 2018-19 Yr 2019-20 Total
Vav 4922 1432 638.1 357.653 7350.184 Tharad 2663 407.6 442.6 0 3513.417 Suigam 1999 897.5 588.6 358.122 3843.17 Danta 675.8 275.4 230.5 0 1181.631 Bhabhar 320.8 0 0 0 320.7668 Total 10581 3013 1900 715.775 16209.168
The expenditure towards other components of Rs 516.05 Lakhs during year 16-17, Rs
345.38 Lakhs during year 17-18, Rs 175.99 Lakhs during year 18-19 and Rs 181.31
Lakhs during year 2019-20 have been proportionately divided into 5 blocks.
However, the actual fund requirement in each block may vary.
Convergence with MNREGA

58
GSWMA has proposed to execute land development activities and other activities
under convergence with MNREGA. Budget of Rs 3584.067 Lakhs will be utilized
under convergence with MNREGA, with break-up of Rs 1924.162 Lakhs during 1st
Year, Rs413.0508 Lakhs during 2nd Year, Rs 895.3892 Lakhs during 3rd Year and Rs
351.465 Lakhs during 4th Year.
Table 5.4 Convergence with MNREGA
Block Convergence with MNREGA (Rs Lakhs) Yr 2016-17 Yr 2017-18 Yr 2018-19 Yr 2019-20 Total
Vav 895.1117 196.3644 300.7444 175.6173 1567.838 Tharad 484.3105 55.88478 208.6018 0 748.7971 Suigam 363.5189 123.0436 277.4188 175.8477 939.829 Danta 122.8882 37.75795 108.6243 0 269.2704 Bhabhar 58.33235 0 0 0 58.33235 Total 1924.162 413.0508 895.3892 351.465 3584.067
5.3 Year wise Strategic Action Plan
Year wise financial outlay for the four years can be observed in Fig.5.2. In the first
year of implementation, i.e. in financial year 2016-17, a budget of Rs. 773.9145 Crores
is proposed. In the subsequent three years, Rs 567.968 Crores, Rs 326.988 Crores
and Rs. 315.179 Crores budget is estimated for various departments.
Figure 5.2 Yearly budget requirement
77391.458
56796.8878
32698.8082 31517.922
0
10000
20000
30000
40000
50000
60000
70000
80000
90000
Year 2016-17 Year 2017-18 Year 2018-19 Year 2019-20
Budget (Rs Lakhs)

5.4 Abstract of Strategic Action Plan
Table 5.5 Abstract of Strategic Action Plan
Sr.
No
Concerned
Department
Component Activity Total Number Command
Area
Potential
(Ha)
Estimated cost (in Rs. Lakhs)
Yr 16-
17
Yr 17-
18
Yr 18-
19
Yr 19-
20
Total
1 SSNNL - CE
Patan
AIBP Major Irrigation 89Km/174.618
Cusec
33009 6321.3 0 0 0 6321.3
2 Nodal
Irrigation
Dept.
Har khet ko
pani
Lined Field Channels 100 840 160 160 160 160 640
Drought proofing through
check dams
1179 5990 3281.25 3281.25 3281.25 3281.25 13125
Secondary Storage Structures
(Tank)
1170 4685 2910 2910 2910 2910 11640
Other Works 654 2854 1633.75 1633.75 1633.75 1633.75 6535
3 SSNNL - CE
Patan
Unlined Channels (UGPL) 1631
Km/414.334 cu
78324 22834 22834 0 0 45668
4 SSNNL - CE
mehsana
Lined Channels (UGPL) 21 Km/3.49
cuc
660 155.1 155.1 0 0 310.2
5 GWRDC Recharge Structure 164 820 410 410 410 410 1640
Recharge Tubewell in
Sujalam Suflam Canal
46 232 116 116 116 116 464
6 GLDC Farm pond 1445 1665 323.675 323.675 323.675 323.675 1294.7
Sim pond 300 1008 300 300 300 300 1200
WHS 505 2424 113.125 113.125 113.125 113.125 452.5
7 GWRDC Per drop
more crop
(Micro
DRIP on Exisitng Tubewells 157 953 788 788 788 788 3152
Exploratory Tubewell 12 26 24 24 24 24 96
New Tubewell with Drip 46 912 570 570 570 570 2280

60
Sr.
No
Concerned
Department
Component Activity Total Number Command
Area
Potential
(Ha)
Estimated cost (in Rs. Lakhs)
8 GGRC Irrigation) Drip Irrigation System (DIS) - 116779 24146.7 18109.8 18109.8 18109.8 78476.1
Sprinkler Irrigation System
(SIS)
- 77853 2682.9 2012.2 2012.2 2012.2 8719.5
9 GSWMA PMKSY
Watershed
Newly created WHS
Animal camp 25 0 9 5 1 0 15
Animal water trough
(Havada)
9 0 8 2 0 0 10
Causeway on connecting
roads
15 0 23 12 8 0 43
Check wall 96 0 18 0 0 0 18
Drinking water facility 41 0 33 3 0 0 36
Fencing 14 0 2 2 1 0 5
Grasslan 0 0 0 0 0 0 0
Improvised and energy
efficient smasan gruh
(Cemetery )
12 0 2 1 1 0 4
Sanitation facilities/Sewerage
line
1 0 2 0 0 0 2
Library/Computer Training 27 0 3 2 2 0 7
kharvat 6 0 9 9 0 0 18
GSWMA PMKSY
Watershed
sewerage line/Drainage line 10 0 16 2 0 0 18
Pipe culvert 15 0 34 3 0 0 37
Land Development 0 0 0
Farm Bunding 1E+07 0 3152 785 248 83 4268
Afforestation 26 1 77 4 1 0 82
Agriculture Demo 98056 0 13 0 0 0 13
Agro Forestry 94394 0 32 0 0 0 32
Horticulture 0 0 16 1 0 0 17
Land leveling 18996 0 634 134 29 11 808

61
Sr.
No
Concerned
Department
Component Activity Total Number Command
Area
Potential
(Ha)
Estimated cost (in Rs. Lakhs)
Pasture 14 0 15 0 0 0 15
Gramvatika 0 0 1 0 0 0 1
Live Fencing 5E+05 0 112 2 2 0 116
Tree fort 15216 0 5 0 0 0 5
Grass seed 58896 0 42 4 0 0 46
Crop Demonstration 3 0 9 0 0 0 9
Hybrid Seeds Distribution 3189 0 4 0 0 0 4
Tree Plant Destribution 3E+05 0 37 0 0 0 37
Horti Plant Destribution 19971 0 4 0 0 0 4
Check wall 53 16 53 7 0 0 60
Earthen bund 204 75 228 220 82 24 554
Protection Wall 18 0 48 25 9 0 82
Waste weir 34 35 7 0 0 18 25
Bench Terracing 11 0 18 12 8 0 38
Bori bandh 8 0 1 0 0 0 1
Countour Bunding 90300 0 29 22 5 0 56
Countour Trenches 25293 0 6 0 0 0 6
Field Outlet 6 0 15 0 0 0 15
Gully plug 57 0 17 12 4 0 33
Loose Boulder Checks 0 0 37 24 16 0 77
Stone bunding 8 0 6 1 0 0 7
Stone Pitching 4067 0 16 9 0 0 25
Water Harvesting Structures 0
Cause way cum Chek dam 7 100 17 0 0 0 17
Check dam 47 471 101 13 8 0 122
Farm Pond 270 0 23 8 3 0 34
Pond Inlet / Earthen bund
inlet
100 120 100 38 28 0 166
Pond Outlet 48 0 50 8 10 0 68
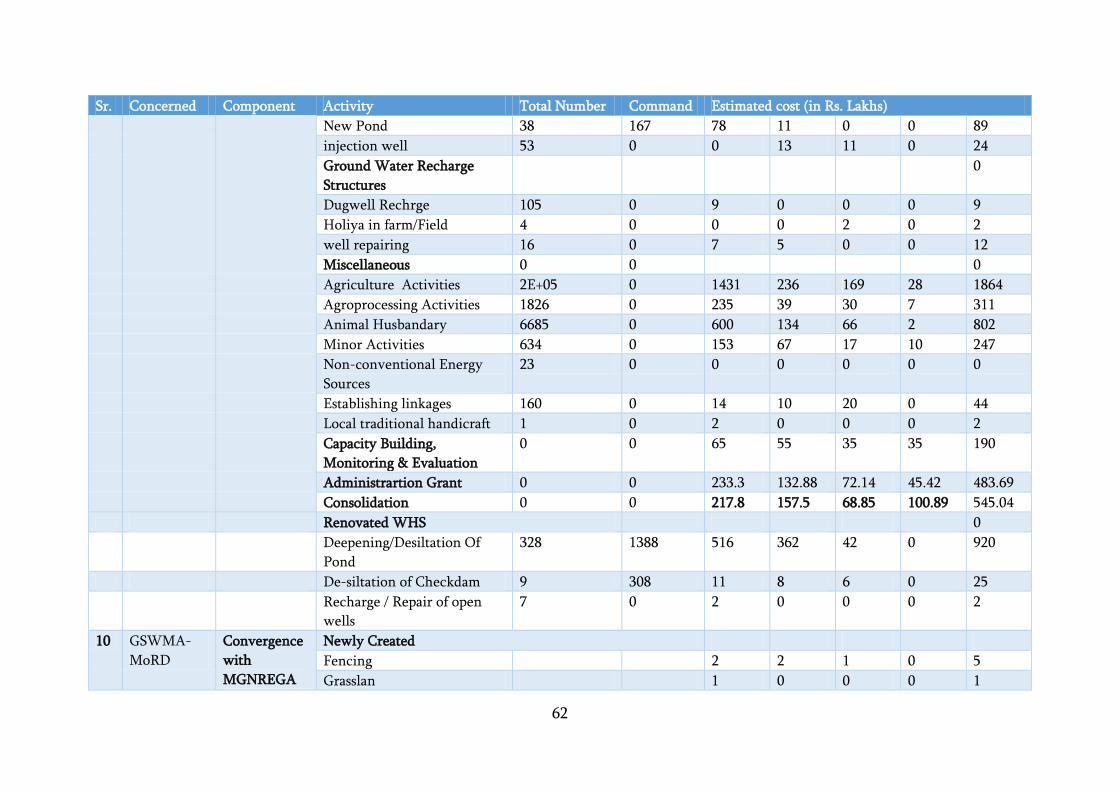
62
Sr.
No
Concerned
Department
Component Activity Total Number Command
Area
Potential
(Ha)
Estimated cost (in Rs. Lakhs)
New Pond 38 167 78 11 0 0 89
injection well 53 0 0 13 11 0 24
Ground Water Recharge
Structures
0
Dugwell Rechrge 105 0 9 0 0 0 9
Holiya in farm/Field 4 0 0 0 2 0 2
well repairing 16 0 7 5 0 0 12
Miscellaneous 0 0 0
Agriculture Activities 2E+05 0 1431 236 169 28 1864
Agroprocessing Activities 1826 0 235 39 30 7 311
Animal Husbandary 6685 0 600 134 66 2 802
Minor Activities 634 0 153 67 17 10 247
Non-conventional Energy
Sources
23 0 0 0 0 0 0
Establishing linkages 160 0 14 10 20 0 44
Local traditional handicraft 1 0 2 0 0 0 2
Capacity Building,
Monitoring & Evaluation
0 0 65 55 35 35 190
Administrartion Grant 0 0 233.3 132.88 72.14 45.42 483.69
Consolidation 0 0 217.8 157.5 68.85 100.89 545.04
Renovated WHS 0
Deepening/Desiltation Of
Pond
328 1388 516 362 42 0 920
De-siltation of Checkdam 9 308 11 8 6 0 25
Recharge / Repair of open
wells
7 0 2 0 0 0 2
10 GSWMA-
MoRD
Convergence
with
MGNREGA
Newly Created
Fencing 2 2 1 0 5
Grasslan 1 0 0 0 1

63
Sr.
No
Concerned
Department
Component Activity Total Number Command
Area
Potential
(Ha)
Estimated cost (in Rs. Lakhs)
Improvised and energy
efficient smasan gruh
(Cemetery )
1 1 1 0 3
Farm Bunding 25 36 7 6 74
Afforestation 9 0 0 4 13
Agro Forestry 2 0 0 0 2
Horticulture 9 0 0 0 9
Land leveling 416 64 20 6 506
Tree fort 1 0 0 0 1
Check wall 2 0 1 0 3
Earthen bund 46 11 0 1 58
Protection Wall 11 8 0 0 19
Countour Bunding 6 4 0 0 10
Bench Terracing 7 5 0 0 12
Check dam 11 8 6 0 25
Farm Pond 21 5 4 0 30
New Pond 17 0 0 0 17
Dugwell Rechrge 1 0 0 0 1
Agriculture Activities 1148 166 793 315 2422
Agroprocessing Activities 73 10 14 7 104
Animal Husbandary 67 21 35 2 125
Minor Activities 2 9 12 10 33
Renovated 0
Deepening/Desiltation Of
Pond
45 60 0 0 105
Recharge / Repair of open
wells
2 1 0 0 3
11 ATMA Capacity
Building
Training programmes 1877 - 40.78 43.26 47.2 50.34 181.58

5.5 Monitoring and Evaluation
The Strategic Action Plan of PMKSY will be monitored by the respective departments
through the regular reporting system and component wise progress will be
monitored by the District Level Irrigation Committee. Further, the activities, outputs
and outcomes will be reported in web based MIS of PMKSY for review at state and
national level. Some of the key indicators that will be used to monitor and evaluate
the progress of PMKSY include:
Annual irrigation water supply per unit irrigated area measured as the ratio of
total volume of irrigation water supplied at intake divided by total area
irrigated in all seasons
Potential created and utilized measured as the ratio of total potential utilized
(measured crop area) to irrigation potential created
Output (agricultural production) per unit irrigated area measured as the ratio
of total value of agriculture production divided by the total irrigated area.
Output (agricultural production) per unit irrigation water supply measured as
the ratio of total value of agriculture production divided by the total volume of
irrigated water supplied
Total Operations & Maintenance (O&M) cost per unit irrigated area measured
as the total Management, Operation and Maintenance (MOM) costs for the
system divided by total area irrigated (potential utilized).
Total Operations & Maintenance (O&M) cost per unit volume of water
supplied measured as total Management, Operation and Maintenance (MOM)
costs for the system divided Total volume of water supplied (all uses)
Equity performance measured as actual area irrigated in head, middle and tail
divided by Command area in head, middle and tail.
5.6 Output & Outcome
5.6.1 Additional Area to be irrigated
During the upcoming four financial years, an additional area of 2,98,704 ha area will
be irrigated under Pradhan Mantri Krishi Sinachyi Yojna. Out of 2,98,704 ha, area of
96,295.6 hectares will be covered by the various Water Resource Departments (State
Irrigation Department, GWRDC and SSNNL), area of 1,94,633 ha by Gujarat Green
Revolution Company Ltd. (GGRC), area of 5096 ha by GLDC and area of 2679 ha by
GSWMA.
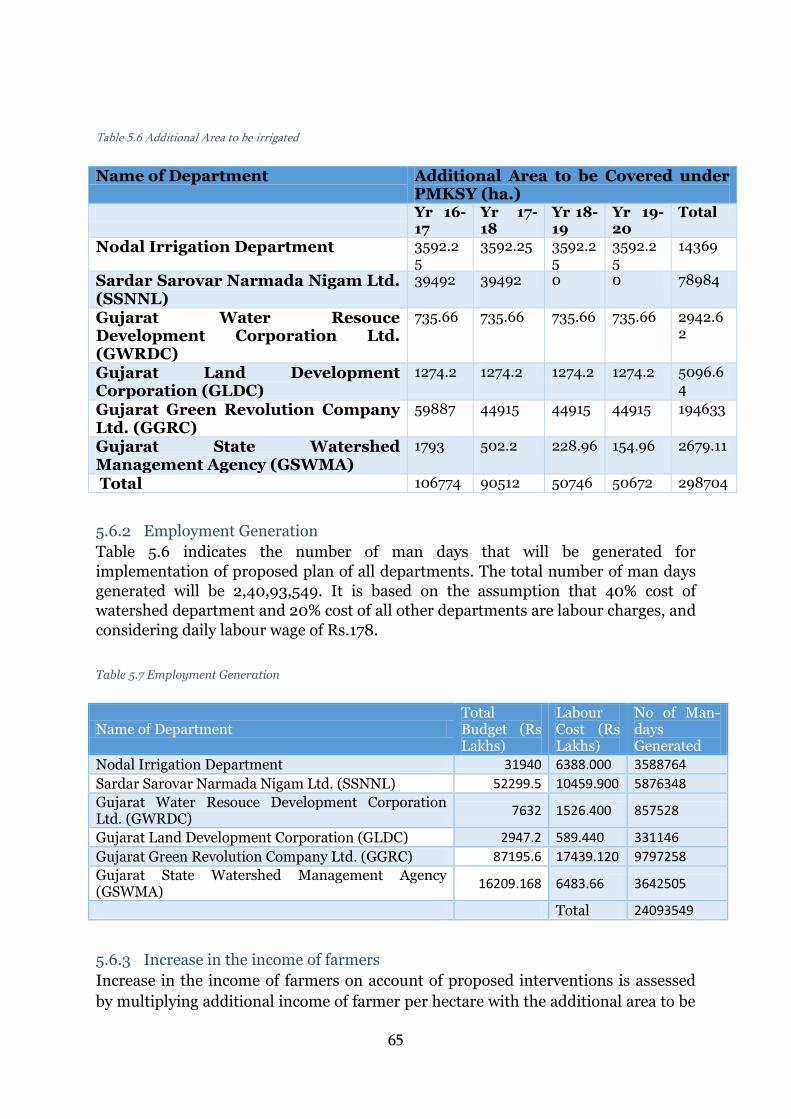
65
Table 5.6 Additional Area to be irrigated
Name of Department Additional Area to be Covered under PMKSY (ha.)
Yr 16-17
Yr 17-18
Yr 18-19
Yr 19-20
Total
Nodal Irrigation Department 3592.25
3592.25 3592.25
3592.25
14369
Sardar Sarovar Narmada Nigam Ltd. (SSNNL)
39492 39492 0 0 78984
Gujarat Water Resouce Development Corporation Ltd. (GWRDC)
735.66 735.66 735.66 735.66 2942.62
Gujarat Land Development Corporation (GLDC)
1274.2 1274.2 1274.2 1274.2 5096.64
Gujarat Green Revolution Company Ltd. (GGRC)
59887 44915 44915 44915 194633
Gujarat State Watershed Management Agency (GSWMA)
1793 502.2 228.96 154.96 2679.11
Total 106774 90512 50746 50672 298704
5.6.2 Employment Generation
Table 5.6 indicates the number of man days that will be generated for
implementation of proposed plan of all departments. The total number of man days
generated will be 2,40,93,549. It is based on the assumption that 40% cost of
watershed department and 20% cost of all other departments are labour charges, and
considering daily labour wage of Rs.178.
Table 5.7 Employment Generation
Name of Department Total Budget (Rs Lakhs)
Labour Cost (Rs Lakhs)
No of Man-days Generated
Nodal Irrigation Department 31940 6388.000 3588764 Sardar Sarovar Narmada Nigam Ltd. (SSNNL) 52299.5 10459.900 5876348 Gujarat Water Resouce Development Corporation Ltd. (GWRDC)
7632 1526.400 857528
Gujarat Land Development Corporation (GLDC) 2947.2 589.440 331146 Gujarat Green Revolution Company Ltd. (GGRC) 87195.6 17439.120 9797258 Gujarat State Watershed Management Agency (GSWMA)
16209.168 6483.66 3642505
Total 24093549
5.6.3 Increase in the income of farmers
Increase in the income of farmers on account of proposed interventions is assessed
by multiplying additional income of farmer per hectare with the additional area to be

66
brought under irrigation (ha). It is assumed that income of agriculture labourer
increases by Rs 284 per hectare of additional area irrigated, on account of
employment generated. Therefore, increase in the income of agricultural labourers is
assessed to be Rs 848.3193 Lakhs.
5.7 Suggestions
For successful implementation of PMKSY plan it is suggested that:
All the stakeholders should convene meeting of Panchayat Samities and then finalize the village plan and prepare DPR.
There should not be any duplicity of project.
The Department should supplement each other so that the maximum irrigation
efficiency is achieved.
Agriculture and Horticulture Department should take micro irrigation projects
in the command of minor irrigation projects which are either completed or
likely to be completed in near future.
All the irrigation projects should have a component of water conveyance so that
the each drop of water is judiciously utilized.
Where ever feasible, Solar pump sets should be installed.
All the structures planned should be geo tagged and marked on map, so that
social monitoring of the projects can be conducted. This will also avoid the
duplicity.
Priority should be given to projects to minimize the gap in potential created and
potential utilized.
Execution of the scheme should be expeditiously completed.
There should be smooth fund flow for timely completion of the project and to
avoid cost escalation.
5.8 Annexure - Department wise strategic action plans
5.8.1 Nodal Irrigation Department
i. District Summary
Table 5.8 Strategic plan of Nodal Irrigation Department - district level
Component
Activity Total Nos
CA (Ha)
Fund Requirement (in Rs. Lacs) Year 16-17
Year 17-18
Year 18-19
Year 19-20
Total
Har khet ko pani
Lined Field Channels
100 840 160 160 160 160 640
Drought Proofing through check
1179 5990 3281.25 3281.25 3281.25 3281.25 13125
Secondary Storage Structures (Tank)
1170 4685 2910 2910 2910 2910 11640
Other 654 2854 1633.75 1633.75 1633.75 1633.75 6535
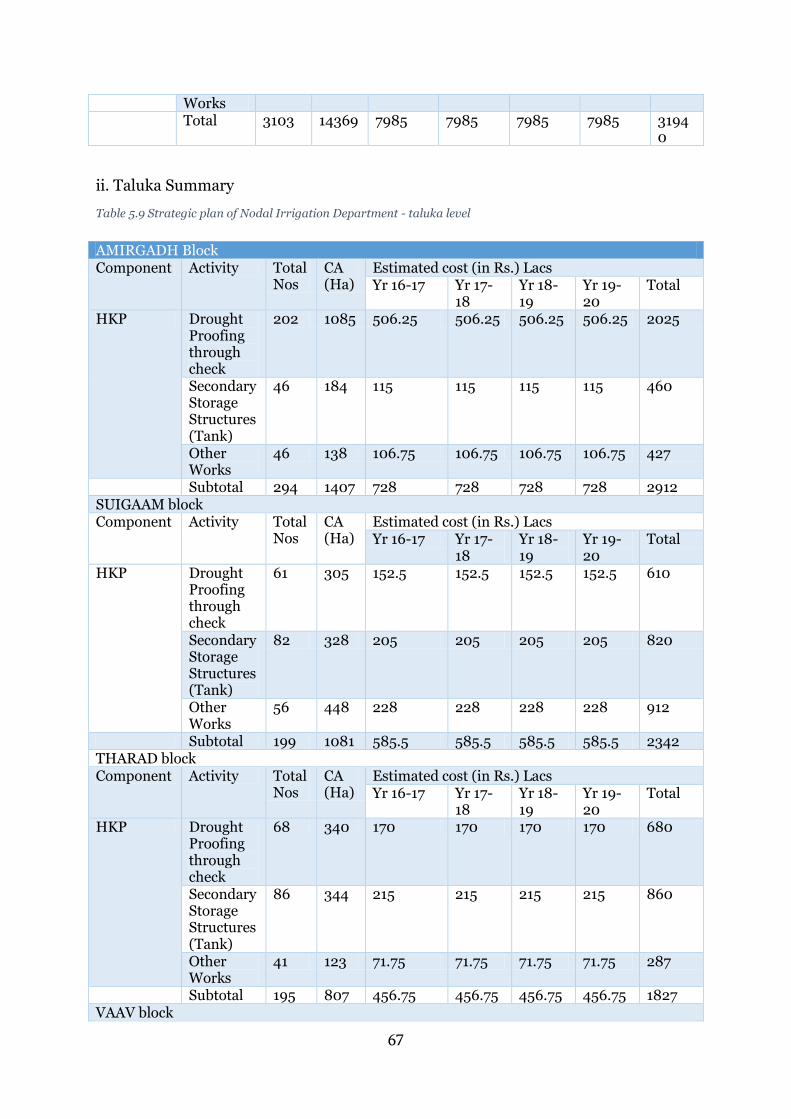
67
Works Total 3103 14369 7985 7985 7985 7985 3194
0
ii. Taluka Summary
Table 5.9 Strategic plan of Nodal Irrigation Department - taluka level
AMIRGADH Block Component Activity Total
Nos CA (Ha)
Estimated cost (in Rs.) Lacs Yr 16-17 Yr 17-
18 Yr 18-19
Yr 19-20
Total
HKP Drought Proofing through check
202 1085 506.25 506.25 506.25 506.25 2025
Secondary Storage Structures (Tank)
46 184 115 115 115 115 460
Other Works
46 138 106.75 106.75 106.75 106.75 427
Subtotal 294 1407 728 728 728 728 2912 SUIGAAM block Component Activity Total
Nos CA (Ha)
Estimated cost (in Rs.) Lacs Yr 16-17 Yr 17-
18 Yr 18-19
Yr 19-20
Total
HKP Drought Proofing through check
61 305 152.5 152.5 152.5 152.5 610
Secondary Storage Structures (Tank)
82 328 205 205 205 205 820
Other Works
56 448 228 228 228 228 912
Subtotal 199 1081 585.5 585.5 585.5 585.5 2342 THARAD block Component Activity Total
Nos CA (Ha)
Estimated cost (in Rs.) Lacs Yr 16-17 Yr 17-
18 Yr 18-19
Yr 19-20
Total
HKP Drought Proofing through check
68 340 170 170 170 170 680
Secondary Storage Structures (Tank)
86 344 215 215 215 215 860
Other Works
41 123 71.75 71.75 71.75 71.75 287
Subtotal 195 807 456.75 456.75 456.75 456.75 1827 VAAV block

68
Component Activity Total Nos
CA (Ha)
Estimated cost (in Rs.) Lacs Yr 16-17 Yr 17-
18 Yr 18-19
Yr 19-20
Total
HKP Drought Proofing through check
62 310 155 155 155 155 620
Secondary Storage Structures (Tank)
79 304 197.5 197.5 197.5 197.5 790
Other Works
56 448 228 228 228 228 912
Subtotal 197 1062 580.5 580.5 580.5 580.5 2322 PALANPUR block Component Activity Total
Nos CA (Ha)
Estimated cost (in Rs.) Lacs Yr 16-17 Yr 17-
18 Yr 18-19
Yr 19-20
Total
HKP Lined Field Channels
20 0 25 25 25 25 100
Drought Proofing through check
99 495 247.5 247.5 247.5 247.5 990
Secondary Storage Structures (Tank)
106 204 265 265 265 265 1060
Other Works
56 168 98 98 98 98 392
Subtotal 281 867 635.5 635.5 635.5 635.5 2542 DEESA block Component Activity Total
Nos CA (Ha)
Estimated cost (in Rs.) Lacs Yr 16-17 Yr 17-
18 Yr 18-19
Yr 19-20
Total
HKP Lined Field Channels
30 0 30 30 30 30 120
Drought Proofing through check
73 365 182.5 182.5 182.5 182.5 730
Secondary Storage Structures (Tank)
88 352 220 220 220 220 880
Other Works
60 180 138 138 138 138 552
Subtotal 251 897 570.5 570.5 570.5 570.5 2282 DHANERA block Component Activity Total
Nos CA (Ha)
Estimated cost (in Rs.) Lacs Yr 16-17 Yr 17-
18 Yr 18-19
Yr 19-20
Total

69
HKP Lined Field Channels
10 0 35 35 35 35 140
Drought Proofing through check
81 405 202.5 202.5 202.5 202.5 810
Secondary Storage Structures (Tank)
75 300 85 85 85 85 340
Other Works
35 105 60.25 60.25 60.25 60.25 241
Subtotal 201 810 382.75 382.75 382.75 382.75 1531 VADGAAM block Component Activity Total
Nos CA (Ha)
Estimated cost (in Rs.) Lacs Yr 16-17 Yr 17-
18 Yr 18-19
Yr 19-20
Total
Hark het ko pani
Lined Field Channels
20 0 25 25 25 25 100
Drought Proofing through check
94 470 235 235 235 235 940
Secondary Storage Structures (Tank)
71 424 265 265 265 265 1060
Other Works
47 141 110.75 110.75 110.75 110.75 443
Subtotal 232 1035 635.75 635.75 635.75 635.75 2543 DANTA block Component Activity Total
Nos CA (Ha)
Estimated cost (in Rs.) Lacs Yr 16-17 Yr 17-
18 Yr 18-19
Yr 19-20
Total
Hark het ko pani
Drought Proofing through check
50 270 457.5 457.5 457.5 457.5 1830
Secondary Storage Structures (Tank)
70 280 175 175 175 175 700
Other Works
58 174 131.5 131.5 131.5 131.5 526
Subtotal 178 724 764 764 764 764 3056 DANTIWADA block Component Activity Total
Nos CA (Ha)
Estimated cost (in Rs.) Lacs Yr 16-17 Yr 17-
18 Yr 18-19
Yr 19-20
Total
Hark het ko pani
Lined Field Channels
20 840 45 45 45 45 180

70
Drought Proofing through check
65 325 162.5 162.5 162.5 162.5 650
Secondary Storage Structures (Tank)
59 236 147.5 147.5 147.5 147.5 590
Other Works
36 108 78 78 78 78 312
Subtotal 180 1509 433 433 433 433 1732 DEODAR block Component Activity Total
Nos CA (Ha)
Estimated cost (in Rs.) Lacs Yr 16-17 Yr 17-
18 Yr 18-19
Yr 19-20
Total
HKP Drought Proofing through check
79 395 197.5 197.5 197.5 197.5 790
Secondary Storage Structures (Tank)
130 520 325 325 325 325 1300
Other Works
39 117 83.25 83.25 83.25 83.25 333
Subtotal 248 1032 605.75 605.75 605.75 605.75 2423 BHABHAR block Component Activity Total
Nos CA (Ha)
Estimated cost (in Rs.) Lacs Yr 16-17 Yr 17-
18 Yr 18-19
Yr 19-20
Total
HKP Drought Proofing through check
73 365 182.5 182.5 182.5 182.5 730
Secondary Storage Structures (Tank)
105 420 262.5 262.5 262.5 262.5 1050
Other Works
50 150 87.5 87.5 87.5 87.5 350
Subtotal 228 935 532.5 532.5 532.5 532.5 2130 KANKREJ block Component Activity Total
Nos CA (Ha)
Estimated cost (in Rs.) Lacs Yr 16-17 Yr 17-
18 Yr 18-19
Yr 19-20
Total
HKP Drought Proofing through check
100 500 250 250 250 250 1000
Secondary Storage Structures (Tank)
108 432 270 270 270 270 1080
Other 36 105 63 63 63 63 252

71
Works Subtotal 244 1037 583 583 583 583 2332 LAKHANI block Component Activity Total
Nos CA (Ha)
Estimated cost (in Rs.) Lacs Yr 16-17 Yr 17-
18 Yr 18-19
Yr 19-20
Total
HKP Drought Proofing through check
72 360 180 180 180 180 720
Secondary Storage Structures (Tank)
65 357 162.5 162.5 162.5 162.5 650
Other Works
38 449 149 149 149 149 596
Subtotal 175 1166 491.5 491.5 491.5 491.5 1966
5.8.2 SSNNL
i. District Summary
Table 5.10 Strategic action plan SSNNL - district summary
Component Activity Total Length (Km) / Capacity (Cum)
Command Area (Ha)
Fund requirement (Rs Lakhs) Year 16-17
Year 17-18
Total
SSNNL – CE Mehsana Har Khet Ko Pani
Lined Field Channels
21/3.49 660 155.1 155.1 310.2
SSNNL - CE Patan AIBP Major
Irrigation 89/174.618 33009 6321.3 0 6321.
3 Har Khet Ko Pani
Unlined Field Channels
1631/414.334
78324 22834 22834 45668
Grand Total
1741/592.442
111993 29310.4 22989.1 52300
ii. Taluka Summary:

72
a) SSNNL - CE Mehsana
Table 5.11 Strategic action plan SSNNL CE Mehsana - Taluka level
Name of the Block
Component
Activity
Total Number/Capacity(cum )
Command Area (Ha)
Fund requirement (in Rs Lakhs) Yr 16-17
Yr 17-18 Total
Kankrej / Banaskatha
Har khet ko pani (UGPL)
Lined Field Channels (UGPL)
21/3.49 660 155.1 155.1 310.2
b) SSNNL - CE Patan
Table 5.12 Strategic action plan SSNNL CE Patan - Taluka level
Name of the Block
Component
Activity
Total Number/Capacity(cum )
Command Area (Ha)
Estimated cost (in Rs. Lakhs)
Yr 16-17 Yr 17-18
Total
Bhabhar
AIBP Major Irrigation
6/4.729 894 171.1927 0 171.1927
Kankarej
3/6.602 1248 238.9965 0 238.9965
Tharad
33/59.338 11217 2148.072 0 2148.072
Vav 47/103.949 19650 3763.018 0 3763.018
subtotal
89/174.618 33009 6321.279 0 6321.279
Bhabhar
HKP Unlined Channels (UGPL)
132/33.586 6349 1848 1848 3696
Kankarej
186/47.277 8937 2604 2604 5208
Tharad
444/112.735 21311 6216 6216 12432

73
Vav 864/219.503 41494 12096 12096
24192
Deodar
5/1.232 233 70 70 140
subtotal
1631/414.334 78324 22834 22834
45668
Grand total 1720/ 588.952 111333 29155.28 22834
51989.28
5.8.3 GWRDC
i. District Summary
Table 5.13 Strategic action plan GWRDC- district summary
Component Activity Total Nos
CA (Ha)
Fund Requirement (in Rs Lacs) Yr 16-17
Yr 17-18
Yr 18-19
Yr 19-20
Total
Har Khet ko Pani
Recharge Structure 164 820 410 410 410 410 1640
Recharge Tubewell in Sujalam Suflam Canal
46 232 116 116 116 116 464
Per Drop more crop
DRIP on Exisitng Tubewells
157 953 788 788 788 788 3152
Exploratory Tubewell
12 26 24 24 24 24 96
New Tubewell with Drip
46 912 570 570 570 570 2280
Grand Total 425 2943
1908 1908 1908 1908 7632
ii. Taluka Summary
Table 5.14 Strategic action plan GWRDC- Taluka Summary
Taluka
Component
Activity Total Nos
CA(Ha)
Fund Requirement (in Rs Lacs) Yr 16-17
Yr 17-18
Yr 18-19
Yr 19-20
Total
Amirgadh
Har Khet ko Pani
Recharge Structure 4 20 10 10 10 10 40
Per Drop more crop
DRIP on Exisitng Tubewells
2 9.66 8 8 8 8 32
Exploratory Tubewell 10 20.8 19.5 19.5 19.5 19.5 78 New Tubewell with Drip 2 32 20 20 20 20 80
Bhabhar
Per Drop more crop
DRIP on Exisitng Tubewells
8 69.6 40 40 40 40 160
New Tubewell with Drip 2 32 20 20 20 20 80 Danta Per Drop
more crop DRIP on Exisitng Tubewells
1 1.6 4 4 4 4 16

74
Exploratory Tubewell 2 4.8 4.5 4.5 4.5 4.5 18 Dantiwada
Har Khet ko Pani
Recharge Structure 8 40 20 20 20 20 80
Per Drop more crop
DRIP on Exisitng Tubewells
3 10.64
16 16 16 16 64
Deesa Har Khet ko Pani
Recharge Structure 16 80 40 40 40 40 160
Recharge Tubewell in Sujalam Suflam Canal
1 4 2 2 2 2 8
Per Drop more crop
DRIP on Exisitng Tubewells
48 232.08
240 240 240 240 960
New Tubewell with Drip 10 208 130 130 130 130 520
Deodar
Har Khet ko Pani
Recharge Structure 20 100 50 50 50 50 200
Recharge Tubewell in Sujalam Suflam Canal
5 24 12 12 12 12 48
Per Drop more crop
DRIP on Exisitng Tubewells
14 104.74
72 72 72 72 288
New Tubewell with Drip 2 48 30 30 30 30 120
Dhanera
Har Khet ko Pani
Recharge Structure 24 120 60 60 60 60 240
Per Drop more crop
DRIP on Exisitng Tubewells
11 64.52
56 56 56 56 224
New Tubewell with Drip 7 144 90 90 90 90 360
Kankrej
Har Khet ko Pani
Recharge Structure 20 100 50 50 50 50 200
Recharge Tubewell in Sujalam Suflam Canal
12 60 30 30 30 30 120
Per Drop more crop
DRIP on Exisitng Tubewells
36 292.61
180 180 180 180 720
New Tubewell with Drip 2 32 20 20 20 20 80 Lakhani
Har Khet ko Pani
Recharge Structure 4 20 10 10 10 10 40 Recharge Tubewell in Sujalam Suflam Canal
18 92 46 46 46 46 184
Palanpur
Har Khet ko Pani
Recharge Structure 28 140 70 70 70 70 280
Per Drop more crop
DRIP on Exisitng Tubewells
18 59.06
88 88 88 88 352
New Tubewell with Drip 6 112 70 70 70 70 280
Tharad
Har Khet ko Pani
Recharge Structure 20 100 50 50 50 50 200
Recharge Tubewell in Sujalam Suflam Canal
10 52 26 26 26 26 104
Per Drop more crop
DRIP on Exisitng Tubewells
2 39.65
12 12 12 12 48
New Tubewell with Drip 4 80 50 50 50 50 200
Vadgam
Har Khet ko Pani
Recharge Structure 20 100 50 50 50 50 200
Per Drop DRIP on Exisitng 12 28.0 60 60 60 60 24

75
more crop Tubewells 6 0 New Tubewell with Drip 8 160 100 100 100 100 40
0 Wav Per Drop
more crop DRIP on Exisitng Tubewells
2 40.8 12 12 12 12 48
New Tubewell with Drip 3 64 40 40 40 40 160
5.8.4 GLDC
i. District Summary
Table 5.15 Strategic action plan GLDC district summary
Component Activity Total Numbers
Command area (Ha.)
Fund Requirement(in Rs. Lakhs)
Yr 16-17 Yr 17-18 Yr 18-19 Yr 19-20 Har Khet Ko Pani
Farm pond
1445 1665 323.675 323.675 323.675 323.675
Sim pond
300 1008 300 300 300 300
WHS 505 2424 113.125 113.125 113.125 113.125 Total 2250 5097 736.8 736.8 736.8 736.8
ii. Taluka Summary
Table 5.16 Strategic Action Plan of GLDC Taluka Summary
Name of the block
Component
Activity
Total Nos
Command Area(Ha.)
Budget Requirement for 4 Years (in Rs. lakh)
Yr 16-17
Yr 17-18
Yr 18-19
Yr 19-20
Amirgadh Har Khet ko Pani
Farm pond
110 126.7 24.64 24.64 24.64 24.64
Sim pond
25 84 25 25 25 25
WHS 40 192 8.96 8.96 8.96 8.96 Kankrej Har Khet ko
Pani Farm pond
105 121 23.52 23.52 23.52 23.52
Sim pond
20 67.2 20 20 20 20
WHS 40 192 8.96 8.96 8.96 8.96 Deesa Har Khet ko
Pani Farm pond
110 126.7 24.64 24.64 24.64 24.64
Sim pond
25 84 25 25 25 25
WHS 40 192 8.96 8.96 8.96 8.96 Tharad Har Khet ko
Pani Farm pond
90 103.7 20.16 20.16 20.16 20.16
Sim pond
20 67.2 20 20 20 20
WHS 30 144 6.72 6.72 6.72 6.72

76
Danta Har Khet ko Pani
Farm pond
90 103.7 20.16 20.16 20.16 20.16
Sim pond
15 50.4 15 15 15 15
WHS 40 192 8.96 8.96 8.96 8.96 Dantiwada
Har Khet ko Pani
Farm pond
100 115.2 22.4 22.4 22.4 22.4
Sim pond
20 67.2 20 20 20 20
WHS 30 144 6.72 6.72 6.72 6.72 Diyodar Har Khet ko
Pani Farm pond
105 121 23.52 23.52 23.52 23.52
Sim pond
25 84 25 25 25 25
WHS 30 144 6.72 6.72 6.72 6.72 Dhanera Har Khet ko
Pani Farm pond
115 132.5 25.76 25.76 25.76 25.76
Sim pond
20 67.2 20 20 20 20
WHS 35 168 7.84 7.84 7.84 7.84 Palanpur Har Khet ko
Pani Farm pond
100 115.2 22.4 22.4 22.4 22.4
Sim pond
15 50.4 15 15 15 15
WHS 30 144 6.72 6.72 6.72 6.72 Bhabhar Har Khet ko
Pani Farm pond
115 132.5 25.76 25.76 25.76 25.76
Sim pond
25 84 25 25 25 25
WHS 40 192 8.96 8.96 8.96 8.96 Lakhani Har Khet ko
Pani Farm pond
110 126.7 24.64 24.64 24.64 24.64
Sim pond
25 84 25 25 25 25
WHS 40 192 8.96 8.96 8.96 8.96 Vadgam Har Khet ko
Pani Farm pond
90 103.7 20.16 20.16 20.16 20.16
Sim pond
20 67.2 20 20 20 20
WHS 40 192 8.96 8.96 8.96 8.96 Vav Har Khet ko
Pani Farm pond
105 121 23.52 23.52 23.52 23.52
Sim pond
25 84 25 25 25 25
WHS 30 144 6.72 6.72 6.72 6.72 Suigam Har Khet ko
Pani Farm pond
100 115.2 22.4 22.4 22.4 22.4
Sim pond
20 67.2 20 20 20 20
WHS 40 192 8.96 8.96 8.96 8.96 TOTAL Farm
pond 1445 1665 323.
7 323.
7 323.
7 323.
7 Sim 300 1008 300 300 300 300

77
pond WHS 505 2424 113.1 113.1 113.1 113.1
5.8.5 GGRC
PER DROP MORE CROP Component
i. District Plan
Table 5.17 Strategic Action Plan of GGRC district summary
Yr 2016-17
Yr 2017-18
Yr 2018-19
Yr 2019-20
Total
Drip Irrigati
Number of Farmers 22457 16843 16843 16843 72986 Area (Ha.) 35932 26949 26949 26949 116779 Fund Req.(Rs. in Lakhs)
24146.7 18109.8 18109.8 18109.8 78476.1
Sprinkler Irrigation
Number of Farmers 14972 11229 11229 11229 48659 Area (Ha.) 23954 17966 17966 17966 77853 Fund Req. (Rs. In Lakhs)
2682.9 2012.2 2012.2 2012.2 8719.5

ii. Taluka Plan
Table 5.18 Strategic Action Plan of GGRC Taluka Summary
Taluka Target for 2016-17
Total Drip Irrigation System (DIS)
Sprinkler Irrigation System (SIS)
Total Number (Farmers)
Area (Ha.)
Estimated Assistance (Rs. in lakh)
Total Number (Farmers)
Area (Ha.)
Estimated Assistance (Rs. in lakh)
Total Number (Farmers)
Area (Ha.)
Estimated Assistance (Rs. in lakh)
AMIRGADH
1330 2128.33
953.49 798 1277.00
858.14 532 851.33
95.35
Bhambhar
227 363.87
163.01 136 218.32
146.71 91 145.55 16.30
DANTA 805 1288.10
577.07 483 772.86
519.36 322 515.24 57.71
Dantivada
2312 3699.48
1657.37
1387 2219.69
1491.63
925 1479.79
165.74
Deesa 7507 12010.85
5380.86
4504 7206.51
4842.77
3003 4804.34
538.09
Deodar 1446 2314.24
1036.78
868 1388.54
933.10 579 925.69
103.68
Dhanera
6923 11076.45
4962.25
4154 6645.87
4466.03
2769 4430.58
496.23
Kankrej 481 769.17 344.59 288 461.50
310.13 192 307.67
34.46
Lakhani 1933 3092.02
1385.23
1160 1855.21
1246.70
773 1236.81
138.52
Palanpur
3152 5043.32
2259.41
1891 3025.99
2033.47
1261 2017.33
225.94
Suigam 644 1029.83
461.36 386 617.90
415.23 257 411.93 46.14
Tharad 5377 8602.98
3854.14
3226 5161.79
3468.72
2151 3441.19
385.41
Vadgam 2889 4622.84
2071.03
1734 2773.70
1863.93
1156 1849.14
207.10
VAV 2403 3845.57
1722.81
1442 2307.34
1550.53
961 1538.23
172.28
TOTAL 37429 59887.06
26829.40
22458 35932.23
24146.46
14972 23954.82
2682.94
Taluka Target for 2017-18 Total Drip Irrigation
System (DIS) Sprinkler Irrigation System (SIS)

79
Total Number (Farmers)
Area (Ha.)
Estimated Assistance (Rs. in lakh)
Total Number (Farmers)
Area (Ha.)
Estimated Assistance (Rs. in lakh)
Total Number (Farmers)
Area (Ha.)
Estimated Assistance (Rs. in lakh)
AMIRGADH
998 1596.25
715.12 599 957.75 643.61 399 638.50
71.51
Bhambhar
171 272.90 122.26 102 163.74 110.03 68 109.16 12.23
DANTA 604 966.08 432.80 362 579.65 389.52 242 386.43
43.28
Dantivada
1734 2774.61
1243.03
1040 1664.77
1118.72
694 1109.85
124.30
Deesa 5630 9008.14
4035.64
3378 5404.88
3632.08
2252 3603.25
403.56
Deodar 1085 1735.68
777.58 651 1041.41
699.83 434 694.27 77.76
Dhanera 5192 8307.34
3721.69
3115 4984.40
3349.52
2077 3322.94
372.17
Kankrej 361 576.88 258.44 216 346.13 232.60 144 230.75 25.84 Lakhani 1449 2319.0
2 1038.92
870 1391.41
935.03 580 927.61 103.89
Palanpur
2364 3782.49
1694.56
1418 2269.50
1525.10
946 1513.00
169.46
Suigam 483 772.37 346.02 290 463.42 311.42 193 308.95
34.60
Tharad 4033 6452.24
2890.60
2420 3871.34
2601.54
1613 2580.89
289.06
Vadgam 2167 3467.13
1553.27
1300 2080.28
1397.95
867 1386.85
155.33
VAV 1803 2884.17
1292.11
1082 1730.50
1162.90
721 1153.67
129.21
TOTAL 28072
44915.29
20122.05
16843
26949.17
18109.85
11229 17966.12
2012.21
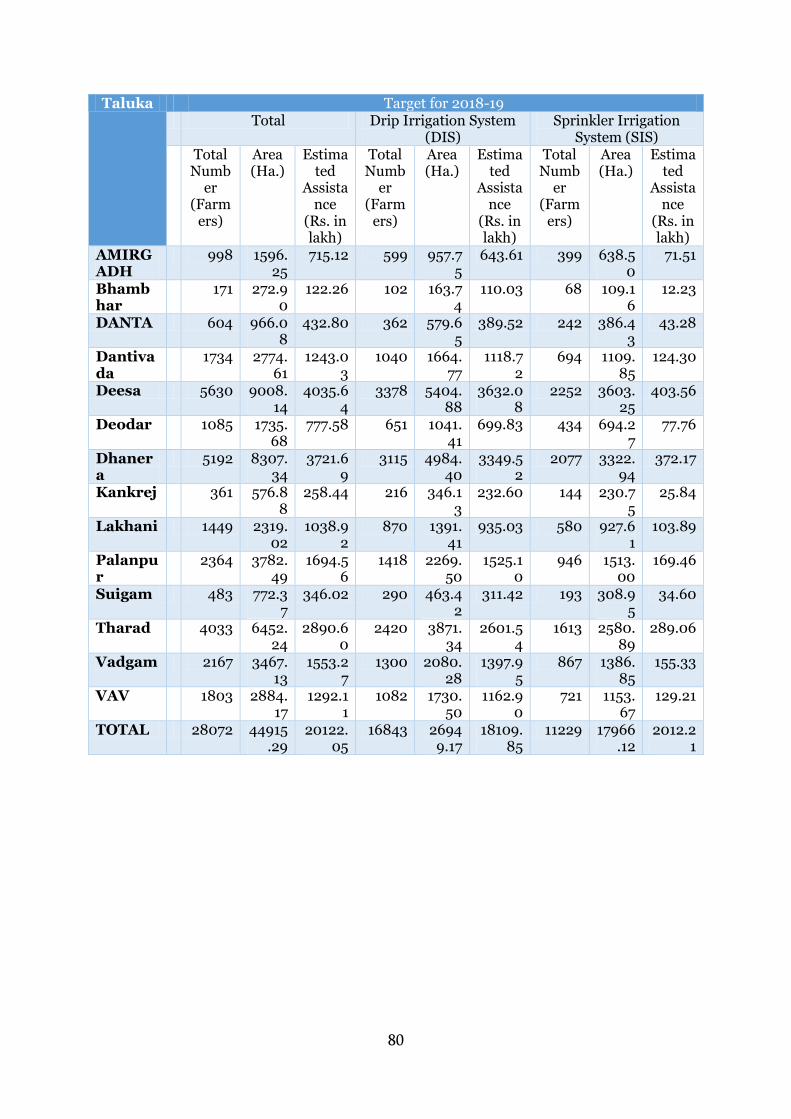
80
Taluka Target for 2018-19 Total Drip Irrigation System
(DIS) Sprinkler Irrigation
System (SIS) Total
Number
(Farmers)
Area (Ha.)
Estimated
Assistance
(Rs. in lakh)
Total Numb
er (Farm
ers)
Area (Ha.)
Estimated
Assistance
(Rs. in lakh)
Total Numb
er (Farm
ers)
Area (Ha.)
Estimated
Assistance
(Rs. in lakh)
AMIRGADH
998 1596.25
715.12 599 957.75
643.61 399 638.50
71.51
Bhambhar
171 272.90
122.26 102 163.74
110.03 68 109.16
12.23
DANTA 604 966.08
432.80 362 579.65
389.52 242 386.43
43.28
Dantivada
1734 2774.61
1243.03
1040 1664.77
1118.72
694 1109.85
124.30
Deesa 5630 9008.14
4035.64
3378 5404.88
3632.08
2252 3603.25
403.56
Deodar 1085 1735.68
777.58 651 1041.41
699.83 434 694.27
77.76
Dhanera
5192 8307.34
3721.69
3115 4984.40
3349.52
2077 3322.94
372.17
Kankrej 361 576.88
258.44 216 346.13
232.60 144 230.75
25.84
Lakhani 1449 2319.02
1038.92
870 1391.41
935.03 580 927.61
103.89
Palanpur
2364 3782.49
1694.56
1418 2269.50
1525.10
946 1513.00
169.46
Suigam 483 772.37
346.02 290 463.42
311.42 193 308.95
34.60
Tharad 4033 6452.24
2890.60
2420 3871.34
2601.54
1613 2580.89
289.06
Vadgam 2167 3467.13
1553.27
1300 2080.28
1397.95
867 1386.85
155.33
VAV 1803 2884.17
1292.11
1082 1730.50
1162.90
721 1153.67
129.21
TOTAL 28072 44915.29
20122.05
16843 26949.17
18109.85
11229 17966.12
2012.21

81
Taluka
Target for 2019-20 Total Drip Irrigation
System (DIS) Sprinkler Irrigation System (SIS)
Total Number (Farmers)
Area (Ha.)
Estimated Assistance (Rs. in lakh)
Total Number (Farmers)
Area (Ha.)
Estimated Assistance (Rs. in lakh)
Total Number (Farmers)
Area (Ha.)
Estimated Assistance (Rs. in lakh)
AMIRGADH
998 1596.25
715.12 599 957.75 643.61 399 638.50 71.51
Bhambhar
171 272.90
122.26 102 163.74 110.03 68 109.16 12.23
DANTA
604 966.08
432.80
362 579.65 389.52 242 386.43 43.28
Dantivada
1734 2774.61
1243.03
1040 1664.77
1118.72
694 1109.85
124.30
Deesa 5630 9008.14
4035.64
3378 5404.88
3632.08
2252 3603.25
403.56
Deodar
1085 1735.68
777.58 651 1041.41 699.83
434 694.27 77.76
Dhanera
5192 8307.34
3721.69
3115 4984.40
3349.52
2077 3322.94
372.17
Kankrej
361 576.88
258.44 216 346.13 232.60
144 230.75 25.84
Lakhani
1449 2319.02
1038.92
870 1391.41 935.03 580 927.61 103.89
Palanpur
2364 3782.49
1694.56
1418 2269.50
1525.10
946 1513.00
169.46
Suigam
483 772.37
346.02
290 463.42 311.42 193 308.95 34.60
Tharad 4033 6452.24
2890.60
2420 3871.34
2601.54
1613 2580.89
289.06
Vadgam
2167 3467.13
1553.27
1300 2080.28
1397.95
867 1386.85
155.33
VAV 1803 2884.17
1292.11
1082 1730.50
1162.90
721 1153.67 129.21
TOTAL
28072
44915.29
20122.05
16843
26949.17
18109.85
11229 17966.12
2012.21

5.8.6 GSWMA
S. N
Activity Physical Target for FY (2016-17)
Physical Target for FY (2017-18)
Physical Target for FY (2018-19)
Physical Target for FY (2019-20)
Unit
Cost CA (Ha)
Convergence Amount
Unit
Cost CA (Ha)
Convergence Amount
Unit
Cost CA (Ha)
Convergence Amount
Unit
Cost
CA (Ha)
Convergence Amount
1 Animal camp 16 9 0 0 7 5 0 0 2 1 0 0 0 0 0 0 2 Animal water
trough (Havada)
8 8 0 0 1 2 0 0 0 0 0 0 0 0 0 0
3 Causeway on connecting roads
8 23 0 0 4 12 0 0 3 8 0 0 0 0 0 0
4 Check wall 96 18 0 0 0 0 0 0 0 0 0 0 0 0 0 0 5 Drinking water
facility 30 33 0 0 7 3 0 0 4 0 0 0 0 0 0 0
6 Fencing 6 2 0 2 5 2 0 2 3 1 0 1 0 0 0 0 7 Grasslan 0 0 0 1 0 0 0 0 0 0 0 0 0 0 0 0 8 Improvised
and energy efficient smasan gruh (Cemetery )
5 2 0 1 4 1 0 1 3 1 0 1 0 0 0 0
9 Recharge / Repair of open wells
4 2 0 2 2 0 0 1 1 0 0 0 0 0 0 0
10 Sanitation facilities/Sewerage line
1 2 0 0 0 0 0 0 0 0 0 0 0 0 0 0
11 Library/Computer Training
12 3 0 0 9 2 0 0 6 2 0 0 0 0 0 0

83
S. N
Activity Physical Target for FY (2016-17)
Physical Target for FY (2017-18)
Physical Target for FY (2018-19)
Physical Target for FY (2019-20)
Unit
Cost CA (Ha)
Convergence Amount
Unit
Cost CA (Ha)
Convergence Amount
Unit
Cost CA (Ha)
Convergence Amount
Unit
Cost
CA (Ha)
Convergence Amount
12 kharvat 3 9 0 0 3 9 0 0 0 0 0 0 0 0 0 0 13 sewerage
line/Drainage line
8 16 0 0 1 2 0 0 1 0 0 0 0 0 0 0
14 Pipe culvert 14 34 0 0 1 3 0 0 0 0 0 0 0 0 0 0 Land
Development
1
Farm Bunding 8204478
3152 0 25 1439316
785 0 36 513513
248 0 7 125320
83 0 6
2 Afforestation 22 77 1 9 4 4 0 0 0 1 0 0 0 0 0 4 3 Agriculture
Demo 98056
13 0 0 0 0 0 0 0 0 0 0 0 0 0 0
4 Agro Forestry 94394
32 0 2 0 0 0 0 0 0 0 0 0 0 0 0
5 Horticulture 0 16 0 9 0 1 0 0 0 0 0 0 0 0 0 0 6 Land leveling 1635
5 634 0 416 1913 134 0 64 505 29 0 20 223 11 0 6
7 Pasture 14 15 0 0 0 0 0 0 0 0 0 0 0 0 0 0 8 Gramvatika 0 1 0 0 0 0 0 0 0 0 0 0 0 0 0 0 9 Live Fencing 5073
64 112 0 0 100
02 2 0 0 65
01 2 0 0 0 0 0 0
10 Tree fort 15207
5 0 1 5 0 0 0 4 0 0 0 0 0 0 0
11 Grass seed 58813
42 0 0 82 4 0 0 1 0 0 0 0 0 0 0
12 Crop Demonstration
3 9 0 0 0 0 0 0 0 0 0 0 0 0 0 0

84
S. N
Activity Physical Target for FY (2016-17)
Physical Target for FY (2017-18)
Physical Target for FY (2018-19)
Physical Target for FY (2019-20)
Unit
Cost CA (Ha)
Convergence Amount
Unit
Cost CA (Ha)
Convergence Amount
Unit
Cost CA (Ha)
Convergence Amount
Unit
Cost
CA (Ha)
Convergence Amount
13 Hybrid Seeds Distribution
3189 4 0 0 0 0 0 0 0 0 0 0 0 0 0 0
14 Tree Plant Destribution
318593
37 0 0 1 0 0 0 0 0 0 0 0 0 0 0
15 Horti Plant Destribution
18820
4 0 0 1151 0 0 0 0 0 0 0 0 0 0 0
16
Check wall 46 53 14 2 7 7 2 0 0 0 0 1 0 0 0 0
17
Earthen bund 96 228 57 46 69 220 6 11 31 82 6 0 8 24 6 1
18
Protection Wall
14 48 0 11 4 25 0 8 0 9 0 0 0 0 0 0
19
Waste weir 27 7 0 0 1 0 0 0 0 0 0 0 6 18 35 0
20
Bench Terracing
5 18 0 7 4 12 0 5 2 8 0 0 0 0 0 0
21 Bori bandh 8 1 0 0 0 0 0 0 0 0 0 0 0 0 0 0 22
Countour Bunding
49050
29 0 6 41250
22 0 4 0 5 0 0 0 0 0 0
2 Countour 2529 6 0 0 0 0 0 0 0 0 0 0 0 0 0 0

85
S. N
Activity Physical Target for FY (2016-17)
Physical Target for FY (2017-18)
Physical Target for FY (2018-19)
Physical Target for FY (2019-20)
Unit
Cost CA (Ha)
Convergence Amount
Unit
Cost CA (Ha)
Convergence Amount
Unit
Cost CA (Ha)
Convergence Amount
Unit
Cost
CA (Ha)
Convergence Amount
3 Trenches 3 24
Field Outlet 6 15 0 0 0 0 0 0 0 0 0 0 0 0 0 0
25
Gully plug 35 17 0 0 22 12 0 0 0 4 0 0 0 0 0 0
26
Loose Boulder Checks
0 37 0 0 0 24 0 0 0 16 0 0 0 0 0 0
27 Stone bunding 6 6 0 0 2 1 0 0 0 0 0 0 0 0 0 0 28
Stone Pitching 2032
16 0 0 2035
9 0 0 0 0 0 0 0 0 0 0
Water Harvesting Structures
1 Cause way cum Chek dam
7 17 100
0 0 0 0 0 0 0 0 0 0 0 0 0
2 Check dam 35 101 351
11 7 13 55 8 5 8 35 6 0 0 30 0
3 Farm Pond 193 23 0 21 66 8 0 5 11 3 0 4 0 0 0 0 4 Pond Inlet /
Earthen bund inlet
68 100 30 0 19 38 0 0 13 28 90 0 0 0 0 0
5 Pond Outlet 33 50 0 0 7 8 0 0 8 10 0 0 0 0 0 0 6
New Pond 34 78 157
17 4 11 10 0 0 0 0 0 0 0 0 0
injection well 0 0 0 0 29 13 0 0 24 11 0 0 0 0 0 0

86
S. N
Activity Physical Target for FY (2016-17)
Physical Target for FY (2017-18)
Physical Target for FY (2018-19)
Physical Target for FY (2019-20)
Unit
Cost CA (Ha)
Convergence Amount
Unit
Cost CA (Ha)
Convergence Amount
Unit
Cost CA (Ha)
Convergence Amount
Unit
Cost
CA (Ha)
Convergence Amount
7
Renovated 1 Deepening/De
siltation Of Pond
186 516 972
45 128 362 346
60 14 42 42 0 0 0 28 0
2 De-siltation of Checkdam
4 11 112
0 3 8 84 0 2 6 56 0 0 0 56 0
Ground Water Recharge Structures
1
Dugwell Rechrge
105 9 0 1 0 0 0 0 0 0 0 0 0 0 0 0
2
Holiya in farm/Field
0 0 0 0 0 0 0 0 4 2 0 0 0 0 0 0
3 well repairing 8 7 0 0 8 5 0 0 0 0 0 0 0 0 0 0 Miscellaneou
s
1 Agriculture
Activities
212971
1431 0 1148 12661
236 0 166 15163
169 0 793 121 28 0 315
2 Agroprocessing
Activities
1702 235 0 73 59 39 0 10 51 30 0 14 14 7 0 7
3 Animal Husbandary
4377 600 0 67 1220
134 0 21 1084
66 0 35 4 2 0 2
4 Minor 419 153 0 2 152 67 0 9 50 17 0 12 13 10 0 10

87
S. N
Activity Physical Target for FY (2016-17)
Physical Target for FY (2017-18)
Physical Target for FY (2018-19)
Physical Target for FY (2019-20)
Unit
Cost CA (Ha)
Convergence Amount
Unit
Cost CA (Ha)
Convergence Amount
Unit
Cost CA (Ha)
Convergence Amount
Unit
Cost
CA (Ha)
Convergence Amount
Activities 5 Non-
conventional Energy Sources
10 0 0 0 8 0 0 0 5 0 0 0 0 0 0 0
6 Establishing linkages
46 14 0 0 40 10 0 0 74 20 0 0 0 0 0 0
7 Local traditional handicraft
1 2 0 0 0 0 0 0 0 0 0 0 0 0 0 0
Capacity Building, Monitoring & Evaluation
65.00
55.00
35.00 35.00
Administrartion Grant
233.25
132.88
72.14 45.42
Consolidation
217.8
157.5
68.85
100.89
Total 8656.213
1793
1924.162
2599.714
502
413.051
1004.699
228
895.389
364.31
154.960
351.465
5.8.7 ATMA Yr 2016-17 Yr 2017-18 Yr 2018-19 Yr 2019-20 Total

88
No of Training 412 506 462 497 1877 No of Trainees 5577 5882 6296 6663 24418 Estimated Cost (In Rs.)
40,78,564 43,26,664 47,20,842 50,34,678 1,81,60,748
POTATO
BAJRA