ball launcher - welcome to nasa headquarters | nasa students were to draw a graph that represents...
TRANSCRIPT

www.nasa.gov
Museumin a
BOXMuseum
in a
BOXSeries
Aeronautics ResearchMission Directorate
5-12GRADES
prop
ulsi
on
Ball Launcher
National Aeronautics and Space Administration

propulsion2
MU
SE
UM
IN A
BO
X
Ball Launcher
Lesson OverviewThe Ball Launcher lesson is a hands-on activity designed to introduce students to the concept of a parabolic arc by throwing a ball and how NASA flies parabolic arcs to create periods of reduced gravity with the C-9B aircraft in the Reduced Gravity Research Program. In addition, students will measure their reaction time by using a meter stick.
Objectives
Students will:
1. Learn what a parabolic arc is and how it is used by NASA to create a microgravity environment.
2. Use a stopwatch and tape measure to gather data for each ball throw.
3. Use the equation for a falling body to calculate the highest point of the parabolic trajectory.
4. Use other equations to solve for different aspects of the ball’s flight such as the angle at which the ball was released.
Materials:
In the Box
Stop watch
Chuckit ball launcher
Tape measure or trundle wheel
Tape
Meter or yard sticks
Provided by User:
Strips of paper 1cm by 75cm)
Graph paper
GRADES 5-12 Time Requirements: 3 hours

3propulsion
MU
SE
UM
IN
A B
OX
propulsion
Parabola
In this lesson, students use a Chuckit Ball Launcher to throw a tennis ball and record data related to its flight. If the students were to photograph the path of the tennis ball flight, they would see that the ball goes up and comes down in an arc known as a parabola.
Students often see parabolas and may not recognize them. If the students were to draw a graph that represents the path of a projectile fired by a cannon, it would also represent a parabola. The golden arches on a favorite eating establishment are also parabolas.
Notice the drawing of the parabola in Figure 1. It looks like an upside down ‘U.’ Students taking a pre-calculus class learn terms associated with a parabola such as Axis of Symmetry, Vertex, Focus, Directrix, Quadratic Equation, Points, and Locus. For this lesson though, the following terms are important to understand: vertex, axis of symmetry, and range.
As shown in Figure 1, the vertex of a parabola represents the high point of the tennis ball flight. It is also the point where it crosses its axis, referred to as the axis of symmetry. The axis of symmetry is most often a vertical line that passes through the parabola’s vertex. It divides the parabola into two perfect halves. Range is the horizontal distance from where the ball was tossed to where it hits the ground.
An excellent example of a parabola in action is Alan Shepard’s sub-orbital Mercury Program flight aboard Freedom 7 on May 5, 1961. Shepard’s flight lasted 15 minutes and 22 seconds during which time his spacecraft reached an altitude of 187.5 kilometers (116.5 miles). Freedom 7 splashed down into the Atlantic Ocean 486 kilometers (302 miles) from the launch site. If Fig. 1 represented the Shepard’s flight, the distance from the vertex to the bottom of the parabola is 187.5 kilometers (116.5 miles). The range from liftoff to splashdown is 486 kilometers (302 miles). The left side of the parabola represents the ascent period, while the right side represents reentry.
Fig. 1 Parabola
Background
Axis of Symmetry
Vertex
Range
Img. 1 Mercury 3 at launch
(Photo courtesy of NASA)

propulsion4
MU
SE
UM
IN A
BO
X
Galileo’s Falling Bodies Equation
Galileo has been described as one of the greatest scientists that has ever lived. He was a world-renown mathematician, astronomer, physicist, and inventor. Though he really didn’t invent the telescope he improved upon it by building his own with a magnification of 30X. He was the first to use the telescope to observe the heavens and record what he saw such as craters on the moon; that Venus had phases, and that Jupiter had moons. He also built an early thermometer in the 1590s.
Among his many most significant contributions, Galileo demonstrated to us how he deduced laws to explain the results of his observations and experiments. Up until his time, most explanations were just in words. Galileo did something different. He showed the importance of mathematics in understanding natural phenomena and experimentation. It is remarkable to think that Galileo did all of his work without a reliable clock and less scientific equipment than found in today’s classrooms. His observation of swaying chandeliers enabled him to better understand the nature of a pendulum which ultimately led to the development of more accurate pendulum clocks.
Galileo’s study of projectile motion is one example of his work. Galileo knew that the trajectory of a projectile was a parabola. He realized for the first time that a projectile’s motion is influenced by two independent motions. One of the motions is influenced by gravity. He discovered that gravity pulls down a projectile according to the equation for a falling body. The second influence demonstrated that horizontal motion is uniform and constant, according to the principle of inertia. Inertia can be considered the tendency of an object to resist any change in its motion.
Galileo realized, even during his earliest experiments, that the speed of a falling body is independent of its weight. Galileo discovered that the nature of this motion is the same for an object that falls straight down as it is for one that moves forward and down at the same time. Therefore, an arrow shot horizontally from a bow falls at the same rate as one that is simply dropped from the same height that it was shot.
Galileo was able to derive an equation for a falling body:
From the above equation, you can also solve for the following:
Instantaneous velocity of a falling object after a certain elapsed time:
Average velocity of an object that has been falling for time (averaged over time):
Launch Angle: The angle that the ball was released when thrown.
Launch Velocity: The initial speed at which the ball was released.
Img. 2 Galileo Galilei by Justus Sustermans (1564-1642)
(Public Domain)
5propulsion
MU
SE
UM
IN
A B
OX
propulsion
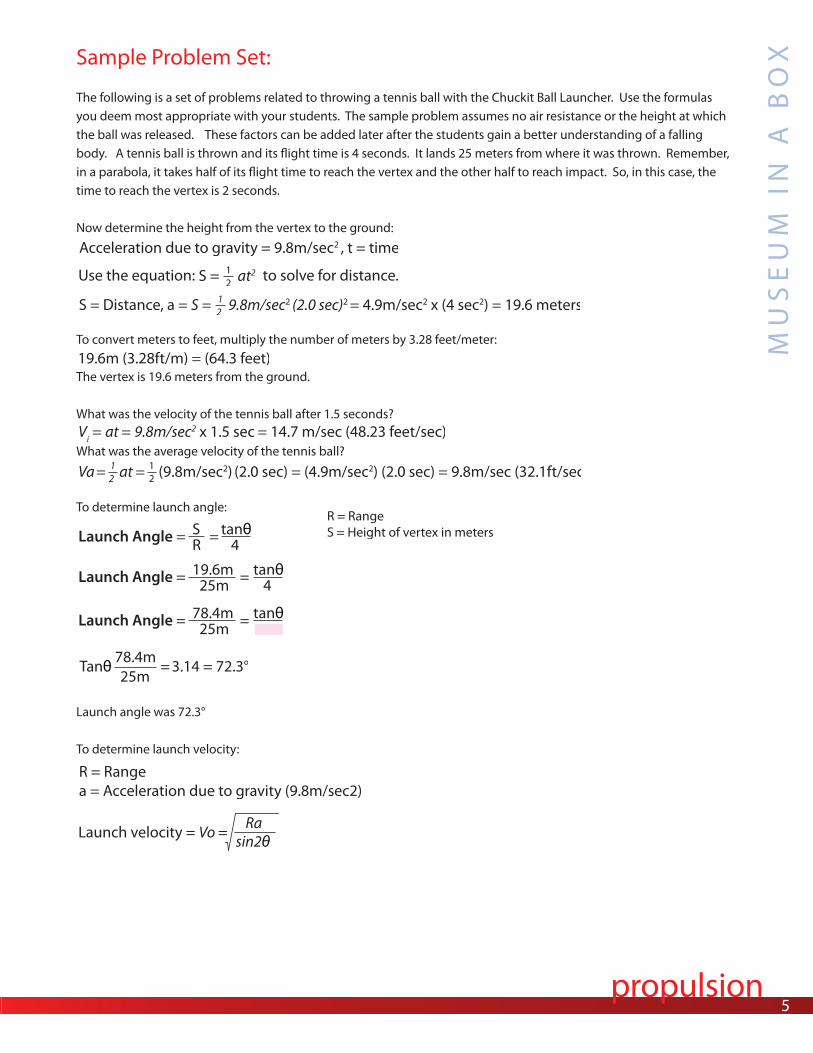
Sample Problem Set:
The following is a set of problems related to throwing a tennis ball with the Chuckit Ball Launcher. Use the formulas you deem most appropriate with your students. The sample problem assumes no air resistance or the height at which the ball was released. These factors can be added later after the students gain a better understanding of a falling body. A tennis ball is thrown and its flight time is 4 seconds. It lands 25 meters from where it was thrown. Remember, in a parabola, it takes half of its flight time to reach the vertex and the other half to reach impact. So, in this case, the time to reach the vertex is 2 seconds.
Now determine the height from the vertex to the ground:
To convert meters to feet, multiply the number of meters by 3.28 feet/meter: The vertex is 19.6 meters from the ground.
What was the velocity of the tennis ball after 1.5 seconds?
What was the average velocity of the tennis ball?
To determine launch angle:
Launch angle was 72.3°
To determine launch velocity:

6
MU
SE
UM
IN A
BO
X
propulsion
From trigonometry (trig), we know that:
Therefore, the launch velocity was 20.6 m/sec

7
MU
SE
UM
IN
A B
OX
propulsion
NASA’s Reduced Gravity Program (RGP)
Astronauts are in a weightless condition in space, but weightlessness can be created in an aircraft that flies a free fall trajectory, which is a parabola.
The Reduced Gravity Program (RGP) managed by the Johnson Space Center is a research area at NASA that uses a specially configured aircraft to simulate a reduced gravity environment by flying parabolas over the Gulf of Mexico. The Reduced Gravity Program enables scientists, engineers, and astronauts to become accustomed to a microgravity environment. In addition, during each parabola, scientists, engineers, astronauts, or university students can test equipment or hardware that may be used on a future space flight. Each flight includes 40 parabolas and as of 2011, over 140,000 parabolas have been flown in the Program. Also, some of the scenes from the Apollo 13 movie were shot aboard the KC-135, which was used to fly parabolas. The KC-135, known as, the ‘vomit comet,’ was retired in 2004 and has been replaced by a Navy C-9, a twin-jet variant of the McDonnell Douglas DC-9.
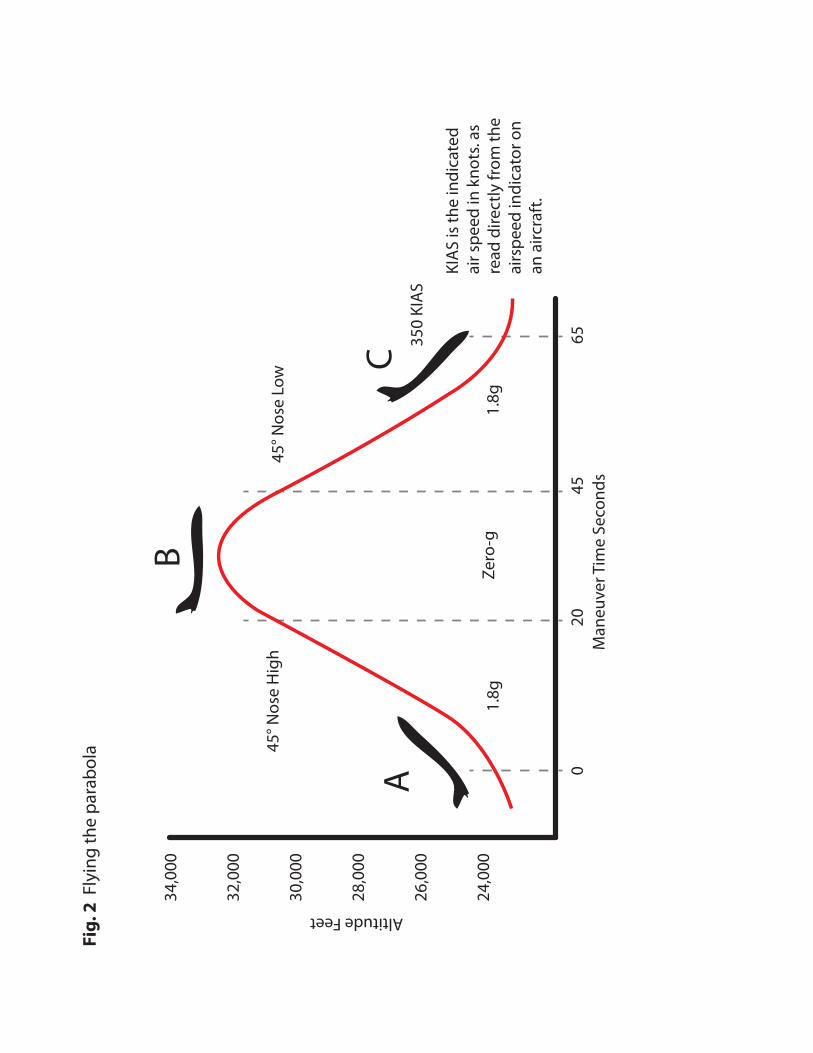
Note the diagram in Figure 2. The diagram shows a typical parabola flown in The Reduced Gravity Program. The following is a description of how a parabola is created by one of the RGP pilots: “We start at a “base” altitude of 8229.6 meters (27,000 feet) and airspeed of 250 knots (288 mph). When the test director is ready, and the autopilot is connected to the roll and yaw axes of the aircraft, the aircraft commander will push the nose over and power will be adjusted to reach 7010 meters (23,000 feet) (A) and 350 knots (403 mph) airspeed. At that point, the nose is pulled up at 1.8 g’s, power is advanced to max allowable, and this condition is continued until reaching 240 knots (276 mph) airspeed.
Normally this is between 40-50 degrees nose up attitude, and at that point the yoke is pushed forward to reach a ‘zero g’ condition (takes about 3-4 seconds for zero g to be reached). This forward push on the yoke is matched by a reduction in the throttle position to be at idle throttle when the aircraft reaches zero g. The minimum airspeed seen is usually about 140-160 knots (161-184 mph) and the peak altitude is approximately 9449 meters (31,000 feet) (B).
(Photo courtesy of NASA)
(Photo courtesy of NASA)
Img. 3 Astronaut Satoshi Furukawa in Space Aboard the ISS
Img. 4 “NASA 932” Weightless Wonder VI, Vomit Comet Completing a Parabola
Maneuver Time Seconds
Alti
tude
Fee
t
Zero-g
45° Nose Low45° Nose High
34,000
32,000
30,000
28,000
26,000
24,000
0 20 45 65
350 KIAS
1.8g 1.8g
A
B
C
KIAS is the indicated air speed in knots. as read directly from the airspeed indicator on an aircraft.
Fig. 2 Flying the parabola
propulsion8
MU
SE
UM
IN A
BO
X
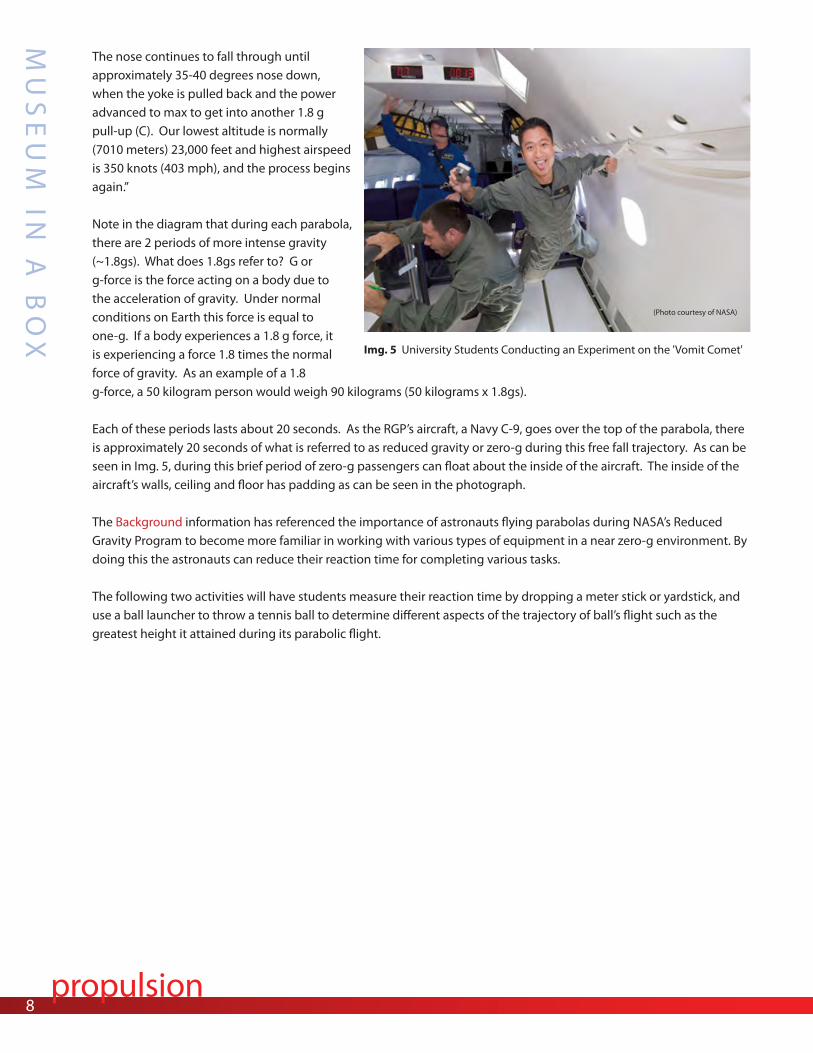
The nose continues to fall through until approximately 35-40 degrees nose down, when the yoke is pulled back and the power advanced to max to get into another 1.8 g pull-up (C). Our lowest altitude is normally (7010 meters) 23,000 feet and highest airspeed is 350 knots (403 mph), and the process begins again.”
Note in the diagram that during each parabola, there are 2 periods of more intense gravity (~1.8gs). What does 1.8gs refer to? G or g-force is the force acting on a body due to the acceleration of gravity. Under normal conditions on Earth this force is equal to one-g. If a body experiences a 1.8 g force, it is experiencing a force 1.8 times the normal force of gravity. As an example of a 1.8 g-force, a 50 kilogram person would weigh 90 kilograms (50 kilograms x 1.8gs).
Each of these periods lasts about 20 seconds. As the RGP’s aircraft, a Navy C-9, goes over the top of the parabola, there is approximately 20 seconds of what is referred to as reduced gravity or zero-g during this free fall trajectory. As can be seen in Img. 5, during this brief period of zero-g passengers can float about the inside of the aircraft. The inside of the aircraft’s walls, ceiling and floor has padding as can be seen in the photograph.
The Background information has referenced the importance of astronauts flying parabolas during NASA’s Reduced Gravity Program to become more familiar in working with various types of equipment in a near zero-g environment. By doing this the astronauts can reduce their reaction time for completing various tasks.
The following two activities will have students measure their reaction time by dropping a meter stick or yardstick, and use a ball launcher to throw a tennis ball to determine different aspects of the trajectory of ball’s flight such as the greatest height it attained during its parabolic flight.
(Photo courtesy of NASA)
Img. 5 University Students Conducting an Experiment on the 'Vomit Comet'

9propulsion
MU
SE
UM
IN
A B
OX
propulsion
GRADES Time Requirement: 1 hour 30 minutes
Activity 1 Reaction Time
Materials:
In the Box:
Tape
Meter or yard sticks
Provided by User:
Strips of paper (1cm by 75cm)
Worksheets:
Acceleration Table Worksheet (Worksheet 1)
Reaction Time Data Collection Worksheet
(Worksheet 2)
Reaction Time Bar Graph Worksheet
(Worksheet 3)
Reference Materials:
None
Key Terms:
Acceleration
Reaction Time
Bar Graph
5-12
Objective: Students will learn about motions and forces, specifically acceleration, by working in pairs to drop a meter stick calibrated to measure reaction time.
Activity Overview:
In this lesson, students will learn how the speed of a falling body increases over time. The concept of acceleration will be introduced by successfully dropping a meter or yard stick over increasingly short periods of time. The students will work in pairs —one student will drop the meter/yard stick and the other person is to catch it between his/her fingers when the fingers are positioned 5 cm (2 inches) apart.
The students will use the equation for a falling body to calculate the distance that an object will fall in .01 second intervals up to .39 seconds. They will use these data to make a calibrated scale that can be pasted on a meter/yard stick.
Next, students will use the calibrated meter/yard stick to determine their reaction time by dropping the meter/yard stick under varying conditions between their fingers. The students will record the results of each drop and then make bar graphs of the data. They will read and interpret the data on the bar graph and draw conclusions. Through discussion guided by the teacher, students will learn about the importance of training to reduce reaction time.
Act ivity:
1. Provide the students with the Acceleration Table Worksheet. Have the students work in pairs to create the calibration scale. The students are to create a reaction time scale on the long strip of paper. To begin, have one student find the measurement for acceleration of gravity on the meter/yard stick and the other student draw the line on the strip of paper and label the time on the strip of paper. It is easier to have the 0 seconds time at the bottom of the strip and move upward from there.

propulsion1 0
MU
SE
UM
IN A
BO
X
2. Once the reaction time scale has been completed, have the students tape the scale onto a meter/yard stick. Have them place the 0 sec mark approximately 5cm (2 inches)from the end of the meter/yard stick.
3. Now the students will work in pairs with one person dropping the meter/yard stick with the pasted reaction time scale for 4 categories of measurement. Students will drop with eyes open right hand; drop with eyes open left hand; drop with eyes closed right hand and drop with eyes closed left hand. There are to be 3 drops for each student for each of the categories. The students are to record their times on the Reaction Time Data Collection Worksheet.
4. For each drop of the meter/yard stick, the fingers should be 5 cm apart. The fingers should be at the 0 second mark on the meter /yard stick. The student is not to move the fingers together until the meter/yard stick is dropped. When their eyes are closed, the fingers should not start to move together until they hear the word ‘drop’ by the person dropping the meter/yard stick.
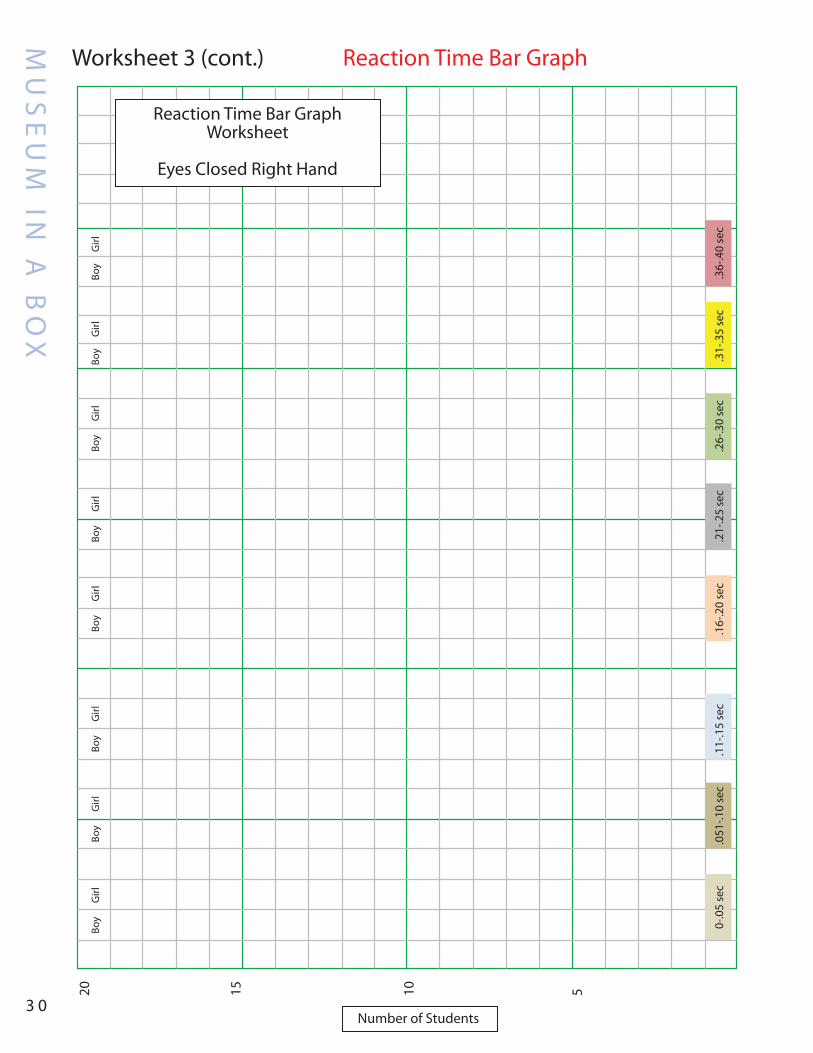
5. Once every team member has completed all of the drops, they are to calculate the average time for the four categories.
6. Each student should record their results on the Bar Graph Worksheet by filling in one of the boxes on the worksheet. The first student to record must shade in the bottom box and if another student has a result that also falls in that range, he or she would shade in the box above the previous one. Students need to be sure and record their results in either the boy or girl column on the worksheet.
7. Once all of the data has been recorded, have students share their final results with the rest of the class so that they can add them to their worksheet. Once all the data has been entered, create the bar graphs.
1 1propulsion
MU
SE
UM
IN
A B
OX
propulsion
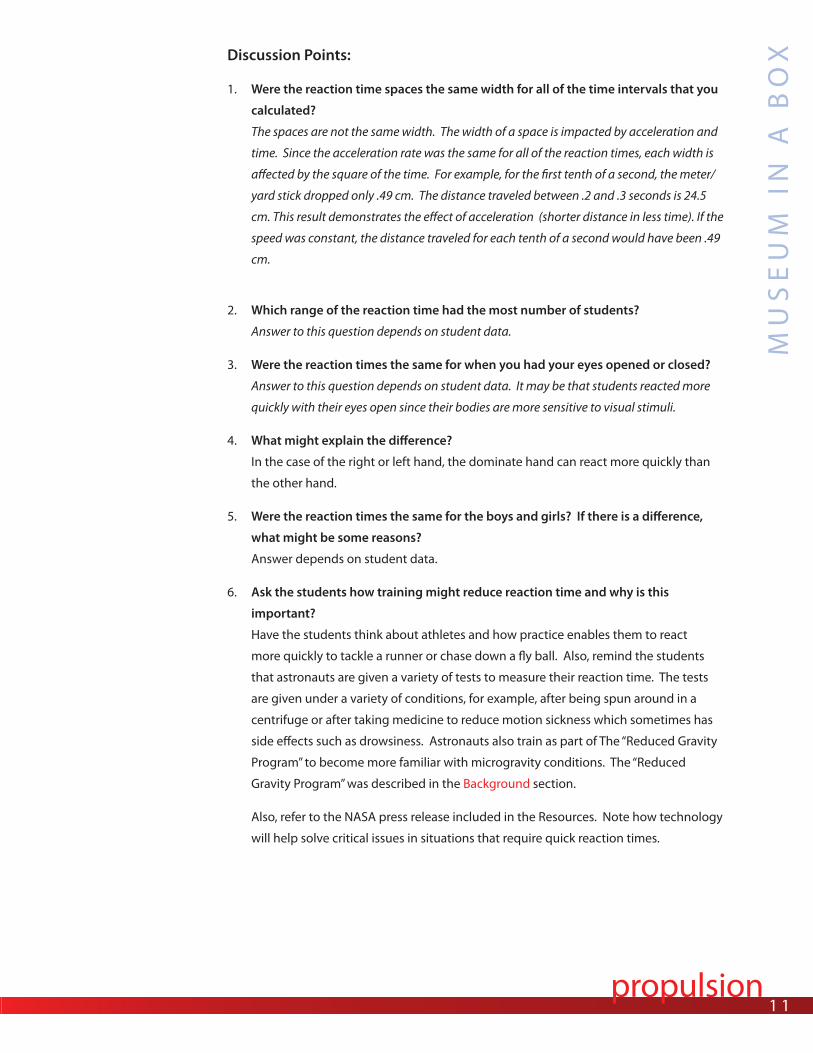
Discussion Points:
1. Were the reaction time spaces the same width for all of the time intervals that you
calculated?
The spaces are not the same width. The width of a space is impacted by acceleration and
time. Since the acceleration rate was the same for all of the reaction times, each width is
affected by the square of the time. For example, for the first tenth of a second, the meter/
yard stick dropped only .49 cm. The distance traveled between .2 and .3 seconds is 24.5
cm. This result demonstrates the effect of acceleration (shorter distance in less time). If the
speed was constant, the distance traveled for each tenth of a second would have been .49
cm.
2. Which range of the reaction time had the most number of students?
Answer to this question depends on student data.
3. Were the reaction times the same for when you had your eyes opened or closed?
Answer to this question depends on student data. It may be that students reacted more
quickly with their eyes open since their bodies are more sensitive to visual stimuli.
4. What might explain the difference?
In the case of the right or left hand, the dominate hand can react more quickly than
the other hand.
5. Were the reaction times the same for the boys and girls? If there is a difference,
what might be some reasons?
Answer depends on student data.
6. Ask the students how training might reduce reaction time and why is this
important?
Have the students think about athletes and how practice enables them to react
more quickly to tackle a runner or chase down a fly ball. Also, remind the students
that astronauts are given a variety of tests to measure their reaction time. The tests
are given under a variety of conditions, for example, after being spun around in a
centrifuge or after taking medicine to reduce motion sickness which sometimes has
side effects such as drowsiness. Astronauts also train as part of The “Reduced Gravity
Program” to become more familiar with microgravity conditions. The “Reduced
Gravity Program” was described in the Background section.
Also, refer to the NASA press release included in the Resources. Note how technology
will help solve critical issues in situations that require quick reaction times.

propulsion1 2
MU
SE
UM
IN A
BO
X
NATIONAL SCIENCE STANDARDS 5-8
NATIONAL SCIENCE STANDARDS 9-12
SCIENCE AS INQUIRY• Abilities necessary to do scientific inquiry
• Understandings about scientific inquiry
PHYSICAL SCIENCE• Motion of an object can be described by its position, direction, speed
SCIENCE AS INQUIRY• Abilities necessary to do scientific inquiry
• Understandings about scientific inquiry
PHYSICAL SCIENCE• Motion of an object can be described by its position, direction, and speed
1 3propulsion
MU
SE
UM
IN
A B
OX
propulsion
GRADES Time Requirement: 1 hour 15 minutes
Activity 2 Thrown Ball Observation
Materials:
In the Box:
Chuckit Ball Launcher
Stop watch
Tape measure or trundle wheel
Provided by User:
Graph paper
Worksheets:
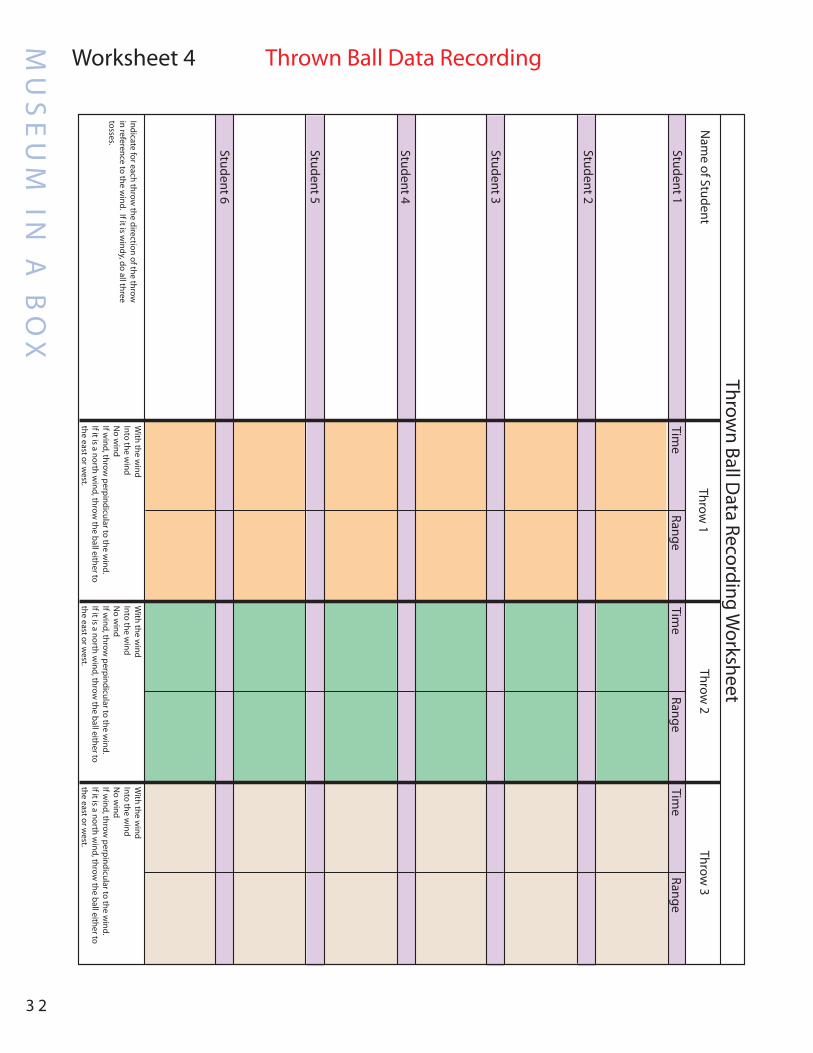
Thrown Ball Data Collection Worksheet
(Worksheet 4)
Thrown Ball Data Analysis Worksheet
(Worksheet 5)
Reference Materials
None
Key Terms:
Parabola
Trajectory
Range
Vertex
5-12
Objective:
Students will learn about motions and forces and transfer of energy as they learn
that the trajectory of a thrown tennis ball is a parabola that can vary in shape and size
from one throw to the next due to different external factors. The students will use the
equation for a falling body and other equations to calculate different aspects of the
parabola and trajectory of their thrown tennis ball.
Activity Overview:
This lesson will be conducted both in the classroom and outdoors. This activity
requires the students to observe the behavior of a thrown tennis ball as it relates to
time and distance the ball traveled. The students will take turns using a Chuckit Ball
Launcher to throw a tennis ball. In this lesson, students will observe how different
external factors influence the trajectory (parabola) of a thrown tennis ball. As the
students will discover in the lesson, the trajectory of the thrown tennis ball is affected
by several forces including the ball’s weight, the drag caused by air resistance, the
angle in which the ball was thrown, the launch velocity, and even its spin. Trajectory
problems involving the force of drag or spin rate requires more advanced math and
will not be included in this lesson. Also, the influence of air resistance or the height
that the ball is released is disregarded so as to make the problems less complex.
Students will record the time and range for each tennis ball throw. They will use this
information to solve for the highest point of the trajectory, the launch angle and the
release speed of the tennis ball.
Caution: Since students will be throwing a tennis ball during this lesson, it is important to stress the importance of safety. Remind the students not to throw the ball unless their team is ready and to be sure and alert everyone before the tennis ball is thrown.

propulsion1 4
MU
SE
UM
IN A
BO
X
Activity: In the Classroom
1. Before you start the lesson, locate an open area where the students can throw
the ball such as the school’s baseball or football field.
2. Introduce the lesson by displaying the graphic of the parabola, Galileo and the
equation for a falling body. Explain how NASA uses a parabola in their reduced
gravity program described in the Background section.
3. Discuss the equation for a falling body and use the sample problem to highlight
the math involved.
4. Explain the procedure for throwing a ball with the Chuckit Ball Launcher
stressing the importance of safety, and distribute the Ball Throw Data Collection
Worksheet. Explain that each person will make four throws—three with the
Ball Launcher and one regular style (student’s arm). If there is wind— students
will launch one with the wind, another into the wind, and another in a direction
perpendicular to which the wind is blowing. The regular throw can be in any
direction. If there is no wind, students can make their throws in any direction. Also,
point out to the teams that they are to enter the weather data at the time they are
doing the ball throws.
5. Divide the class into teams of seven. Explain when they do the activity one
person will be the thrower, another the timer, while another team member is the
data recorder. Two of the team members are to be positioned so that they can
accurately spot where the ball hits the ground, and two other team members are to
measure the distance from where the ball was thrown to where it hits the ground.
The stop watch is to be started when the ball is released and stopped when one of
the spotters raises his or her hand to indicate the ball has hit the ground. The time
should be given to the recorder
and once the distance has been
measured, that information is
provided to the recorder. Inform
the class that it might be easier
for one person to complete all
three throws and then rotate,
and if there is a problem with
the throw, redo it. REMIND THE
STUDENTS THAT IF THERE IS A
PROBLEM, ALERT THE TEACHER
IMMEDIATELY.
1 5propulsion
MU
SE
UM
IN
A B
OX
propulsion
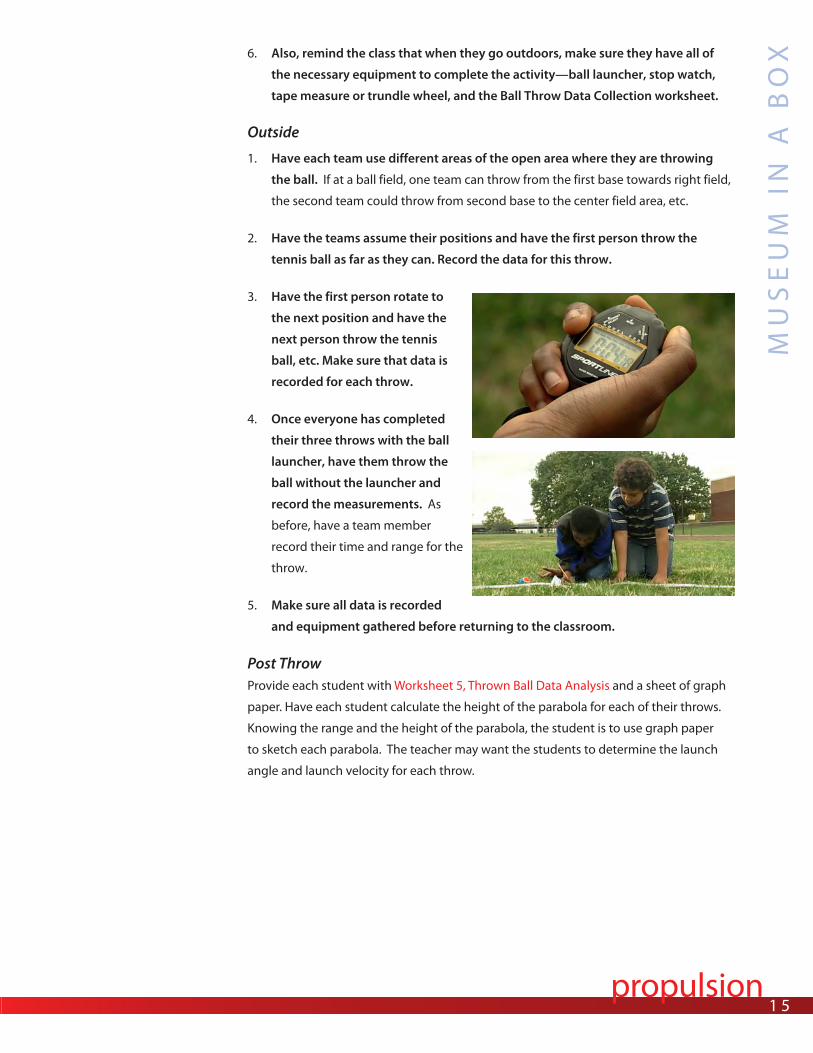
Post Throw Provide each student with Worksheet 5, Thrown Ball Data Analysis and a sheet of graph
paper. Have each student calculate the height of the parabola for each of their throws.
Knowing the range and the height of the parabola, the student is to use graph paper
to sketch each parabola. The teacher may want the students to determine the launch
angle and launch velocity for each throw.
6. Also, remind the class that when they go outdoors, make sure they have all of
the necessary equipment to complete the activity—ball launcher, stop watch,
tape measure or trundle wheel, and the Ball Throw Data Collection worksheet.
Outside
1. Have each team use different areas of the open area where they are throwing
the ball. If at a ball field, one team can throw from the first base towards right field,
the second team could throw from second base to the center field area, etc.
2. Have the teams assume their positions and have the first person throw the
tennis ball as far as they can. Record the data for this throw.
3. Have the first person rotate to
the next position and have the
next person throw the tennis
ball, etc. Make sure that data is
recorded for each throw.
4. Once everyone has completed
their three throws with the ball
launcher, have them throw the
ball without the launcher and
record the measurements. As
before, have a team member
record their time and range for the
throw.
5. Make sure all data is recorded
and equipment gathered before returning to the classroom.

propulsion1 6
MU
SE
UM
IN A
BO
X
Discussion Points:
1. How did your results compare to the other team members’ results?
Results depend on student data.
2. How was the trajectory the same for each of your throws? Look at the sketches to
answer this question. Please account for differences.
Launch angle, velocity of the launch and wind direction all have an impact.
3. Which of the above type of throws most often gave the optimum or best
trajectory for the longest throw for your team? What might be some reasons for
this?
There several reasons the students might propose, such as throwing with the wind
enabled the ball to travel farther than when thrown into the wind where the air
resistance was greater. In addition, under the same conditions launch angles near
45° will enable a ball to travel farther than a ball launched at any other angle. A ball
launched at a 55° launch angle will travel the same distance as a ball launched at a 35°
angle with the same launch velocity. Also, a ball launched at a 70° angle will travel the
same distance as a ball thrown at a 20° angle with the same launch velocity. Notice
how the two angles added together equals 90°.
4. Compare and contrast the trajectory of the tennis ball when thrown by hand and
with the Ball Launcher. Why are there differences in the two trajectories?
The Ball Launcher can provide a greater launch velocity than thrown by hand. In almost
every case, the Ball Launcher will have the greatest range because of that.
5. Explain why the use of math in looking at a parabola provides so much more
information than just observing the parabola?
Most scientists before Galileo never used math to explain their observations. Galileo
demonstrated how math can provide a much better explanation for events in nature
than can made from just observing an event, describing it and providing an idea to
explain the observation.

1 7propulsion
MU
SE
UM
IN
A B
OX
propulsion
NATIONAL SCIENCE STANDARDS 5-8
NATIONAL SCIENCE STANDARDS 9-12
SCIENCE AS INQUIRY• Abilities necessary to do scientific inquiry
• Understandings about scientific inquiry
PHYSICAL SCIENCE• Motion of an object can be described by its position, direction, speed
SCIENCE AND TECHNOLOGY• Abilities of technological design
• Understanding about science and technology
SCIENCE AS INQUIRY• Abilities necessary to do scientific inquiry
• Understandings about scientific inquiry
PHYSICAL SCIENCE• Motion of an object can be described by its position, direction, speed • Interactions of energy and matter
SCIENCE AND TECHNOLOGY• Abilities of technological design
• Understanding about science and technology


Reference Materials
Glossary
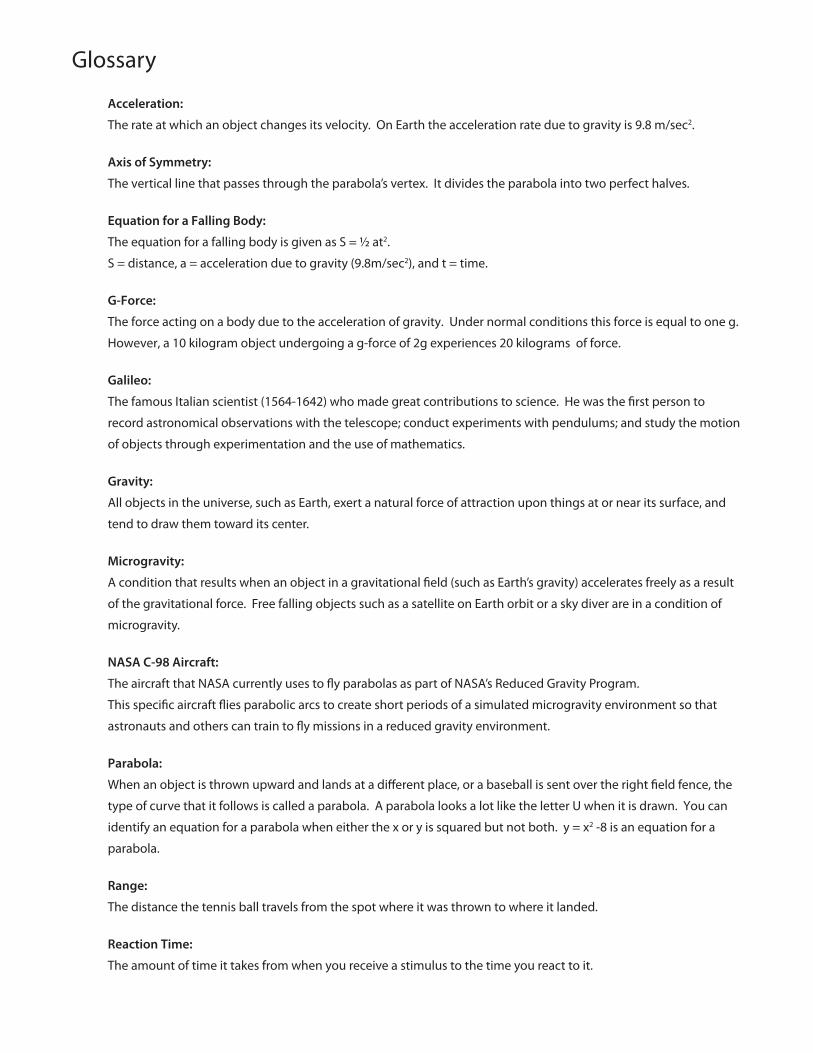
Acceleration:
The rate at which an object changes its velocity. On Earth the acceleration rate due to gravity is 9.8 m/sec2.
Axis of Symmetry:
The vertical line that passes through the parabola’s vertex. It divides the parabola into two perfect halves.
Equation for a Falling Body:
The equation for a falling body is given as S = ½ at2.
S = distance, a = acceleration due to gravity (9.8m/sec2), and t = time.
G-Force:
The force acting on a body due to the acceleration of gravity. Under normal conditions this force is equal to one g.
However, a 10 kilogram object undergoing a g-force of 2g experiences 20 kilograms of force.
Galileo:
The famous Italian scientist (1564-1642) who made great contributions to science. He was the first person to
record astronomical observations with the telescope; conduct experiments with pendulums; and study the motion
of objects through experimentation and the use of mathematics.
Gravity:
All objects in the universe, such as Earth, exert a natural force of attraction upon things at or near its surface, and
tend to draw them toward its center.
Microgravity:
A condition that results when an object in a gravitational field (such as Earth’s gravity) accelerates freely as a result
of the gravitational force. Free falling objects such as a satellite on Earth orbit or a sky diver are in a condition of
microgravity.
NASA C-98 Aircraft:
The aircraft that NASA currently uses to fly parabolas as part of NASA’s Reduced Gravity Program.
This specific aircraft flies parabolic arcs to create short periods of a simulated microgravity environment so that
astronauts and others can train to fly missions in a reduced gravity environment.
Parabola:
When an object is thrown upward and lands at a different place, or a baseball is sent over the right field fence, the
type of curve that it follows is called a parabola. A parabola looks a lot like the letter U when it is drawn. You can
identify an equation for a parabola when either the x or y is squared but not both. y = x2 -8 is an equation for a
parabola.
Range:
The distance the tennis ball travels from the spot where it was thrown to where it landed.
Reaction Time:
The amount of time it takes from when you receive a stimulus to the time you react to it.

Speed:
The measurement of how fast something is moving. The rate of speed is given as the distance traveled per unit of
time such as 5 kilometers/hour.
Trajectory:
The path that a moving body, such as a projectile, follows during its flight through space.

Fig. 1 Parabola
Axis of Symmetry
Vertex
Range
Man
euve
r Tim
e Se
cond
s
Altitude Feet
Zero
-g
45° N
ose
Low
45° N
ose
Hig
h
34,0
00
32,0
00
30,0
00
28,0
00
26,0
00
24,0
00
0
2
0
45
65350
KIA
S
1.8g
1.8g
A
B
C
KIA
S is
the
indi
cate
d ai
r spe
ed in
kno
ts. a
s re
ad d
irect
ly fr
om th
e ai
rspe
ed in
dica
tor o
n an
airc
raft
.
Fig.
2 F
lyin
g th
e pa
rabo
la


Student Worksheets

MU
SE
UM
IN A
BO
X
2 6
Worksheet 1 Acceleration Table
Time in Seconds
Distance in Inches
Distance in Centimeters
.10 sec
.15 sec
.20 sec
.25 sec
.30 sec
.35 sec
.40 sec
.45 sec
.50 sec
.55 sec
.60 sec
.65 sec
.70 sec
.75 sec
.80 sec
.85 sec
.90 sec
.95 sec
1 sec
1.05 sec
1.10 sec
1.15 sec
1.20 sec
.49 cm
1.1 cm
2 cm
3.1 cm
4.4 cm
6 cm
7.8 cm
9.9 cm
12.3 cm
14.8 cm
17.6 cm
20.7 cm
24 cm
27.6 cm
31.4 cm
35.4 cm
39.7 cm
44.2 cm
49 cm
54 cm
59.3 cm
64.8 cm
70.6 cm
.2 in
.4 in
.8 in
1.2 in
1.7 in
2.4 in
3.1 in
3.9 in
4.8 in
5.8 in
6.9 in
8.1 in
9.4 in
10.9 in
12.4 in
13.9 in
15.6 in
17.4 in
19.3 in
21.3 in
23.3 in
25.5 in
27.8 in
0cm
12
34
56
78
910
1112
1314
1516
1718
1920
2122
2324
2526
2728
2930
0in
1
2
3
4
5
6
7
8
9
10
11
12

MU
SE
UM
IN
A B
OX
2 7
Worksheet 2 Reaction Time Data Collection
Reac
tion
Tim
e D
ate
Colle
ctio
n W
orks
heet
Nam
e of
Stu
dent
Reac
tion
Tim
e in
Sec
onds
Ri
ght H
and
Eyes
Ope
nRe
actio
n Ti
me
in S
econ
ds
Righ
t Han
d Ey
es C
lose
dRe
actio
n Ti
me
in S
econ
ds
Left
Han
d Ey
es O
pen
Reac
tion
Tim
e in
Sec
onds
Le
ft H
and
Eyes
Clo
sed
Stud
ent 1
Stud
ent 2
Stud
ent 3
Stud
ent 4
Stud
ent 5
Stud
ent 6
Aver
age
Tim
e =
(T1
+ T2
+ T
3) ÷
3
T1
T2
T3
T1
T2
T3
T1
T2
T3
T1
T2
T3
Aver
age
Tim
e =
(T1
+ T2
+ T
3) ÷
3
Aver
age
Tim
e =
(T1
+ T2
+ T
3) ÷
3
Aver
age
Tim
e =
(T1
+ T2
+ T
3) ÷
3
Aver
age
Tim
e =
(T1
+ T2
+ T
3) ÷
3
Aver
age
Tim
e =
(T1
+ T2
+ T
3) ÷
3

MU
SE
UM
IN A
BO
X
2 8
Worksheet 3 Reaction Time Bar Graph20 15 10 5
Number of Students
0-.0
5 se
c
.051
-.10
sec
.
11-.1
5 se
c
.
16-.2
0 se
c
.21-
.25
sec
.26
-.30
sec
.31
-.35
sec
.
36-.4
0 se
c
Boy
G
irlBo
y
Girl
Boy
G
irlBo
y
Girl
Boy
G
irlBo
y
Girl
Boy
G
irlBo
y
Girl
Reaction Time Bar Graph Worksheet
Eyes Open Right Hand

MU
SE
UM
IN
A B
OX
2 9
Worksheet 3 (cont.) Reaction Time Bar Graph20 15 10 5
Number of Students
0-.0
5 se
c
.051
-.10
sec
.
11-.1
5 se
c
.
16-.2
0 se
c
.21-
.25
sec
.26
-.30
sec
.31
-.35
sec
.
36-.4
0 se
c
Boy
G
irlBo
y
Girl
Boy
G
irlBo
y
Girl
Boy
G
irlBo
y
Girl
Boy
G
irlBo
y
Girl
Reaction Time Bar Graph Worksheet
Eyes Open Left Hand
MU
SE
UM
IN A
BO
X
3 0
Worksheet 3 (cont.) Reaction Time Bar Graph20 15 10 5
Number of Students
0-.0
5 se
c
.051
-.10
sec
.
11-.1
5 se
c
.
16-.2
0 se
c
.21-
.25
sec
.26
-.30
sec
.31
-.35
sec
.
36-.4
0 se
c
Reaction Time Bar Graph Worksheet
Eyes Closed Right Hand
Boy
G
irlBo
y
Girl
Boy
G
irlBo
y
Girl
Boy
G
irlBo
y
Girl
Boy
G
irlBo
y
Girl

MU
SE
UM
IN
A B
OX
3 1
Worksheet 3 (cont.) Reaction Time Bar Graph
Reaction Time Bar Graph Worksheet
Eyes Closed Left Hand
20 15 10 5
Number of Students
0-.0
5 se
c
.051
-.10
sec
.
11-.1
5 se
c
.
16-.2
0 se
c
.21-
.25
sec
.26
-.30
sec
.31
-.35
sec
.
36-.4
0 se
c
Boy
G
irlBo
y
Girl
Boy
G
irlBo
y
Girl
Boy
G
irlBo
y
Girl
Boy
G
irlBo
y
Girl
MU
SE
UM
IN A
BO
X
3 2
Thrown Ball D
ata Recording Worksheet
Nam
e of StudentThrow
1Throw
2Throw
3
Student 1
Student 2
Student 3
Student 4
Student 5
Student 6
Time
Time
Time
Range Range
Range
Indicate for each throw the direction of the throw
in reference to the w
ind. If it is windy, do all three
tosses.
With the w
indInto the w
indN
o wind
If wind, throw
perpindicular to the wind.
If it is a north wind, throw
the ball either to the east or w
est.
With the w
indInto the w
indN
o wind
If wind, throw
perpindicular to the wind.
If it is a north wind, throw
the ball either to the east or w
est.
With the w
indInto the w
indN
o wind
If wind, throw
perpindicular to the wind.
If it is a north wind, throw
the ball either to the east or w
est.
Worksheet 4 Thrown Ball Data Recording
MU
SE
UM
IN
A B
OX
3 3
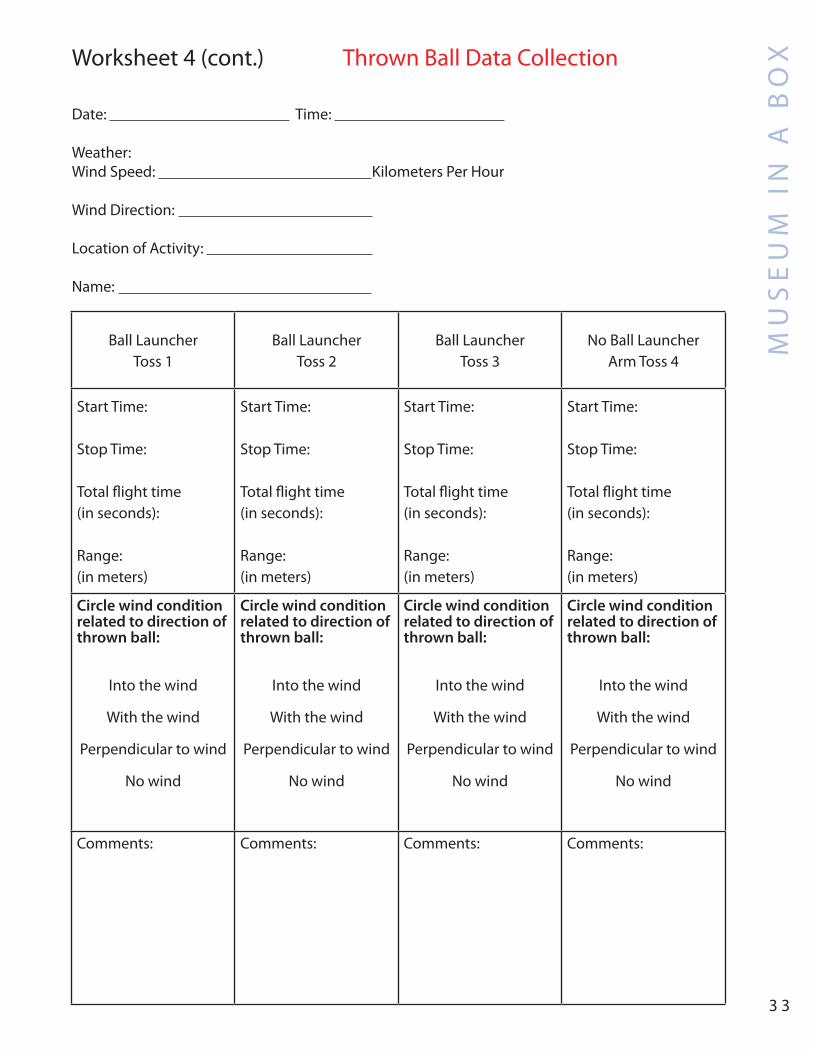
Worksheet 4 (cont.) Thrown Ball Data Collection
Date: Time: Weather: Wind Speed: Kilometers Per Hour Wind Direction: Location of Activity: Name:
Ball Launcher Toss 1
Ball Launcher Toss 2
Ball Launcher Toss 3
No Ball Launcher Arm Toss 4
Start Time:
Stop Time:
Total flight time (in seconds):
Range:(in meters)
Start Time:
Stop Time:
Total flight time (in seconds):
Range:(in meters)
Start Time:
Stop Time:
Total flight time (in seconds):
Range:(in meters)
Start Time:
Stop Time:
Total flight time (in seconds):
Range:(in meters)
Circle wind condition related to direction of thrown ball:
Into the wind
With the wind
Perpendicular to wind
No wind
Circle wind condition related to direction of thrown ball:
Into the wind
With the wind
Perpendicular to wind
No wind
Circle wind condition related to direction of thrown ball:
Into the wind
With the wind
Perpendicular to wind
No wind
Circle wind condition related to direction of thrown ball:
Into the wind
With the wind
Perpendicular to wind
No wind
Comments: Comments: Comments: Comments:

MU
SE
UM
IN A
BO
X
3 4
Worksheet 5 Thrown Ball Data Analysis
Name:
Use the Falling Bodies Equation to determine the height of the parabola for each of the throws. The formula is:
Height Toss 1: Height Toss 2: Height Toss 3: Height Toss 4: On graph paper, sketch the parabola for each throw. An example is given: Height 30 meters, range 25 meters.
25 m
30 m

MU
SE
UM
IN
A B
OX
3 5
Worksheet 5 (cont.) Thrown Ball Data Analysis
Solve for other aspects of the ball throw. (As required by the teacher.)
Ball Toss Launch Angle Launch Velocity
1
2
3
4
Use launch angle to find velocty. If the launch angle is 60°, then you would look up the sin and cos for the 60° in the Launch Velocity Equation.


Images
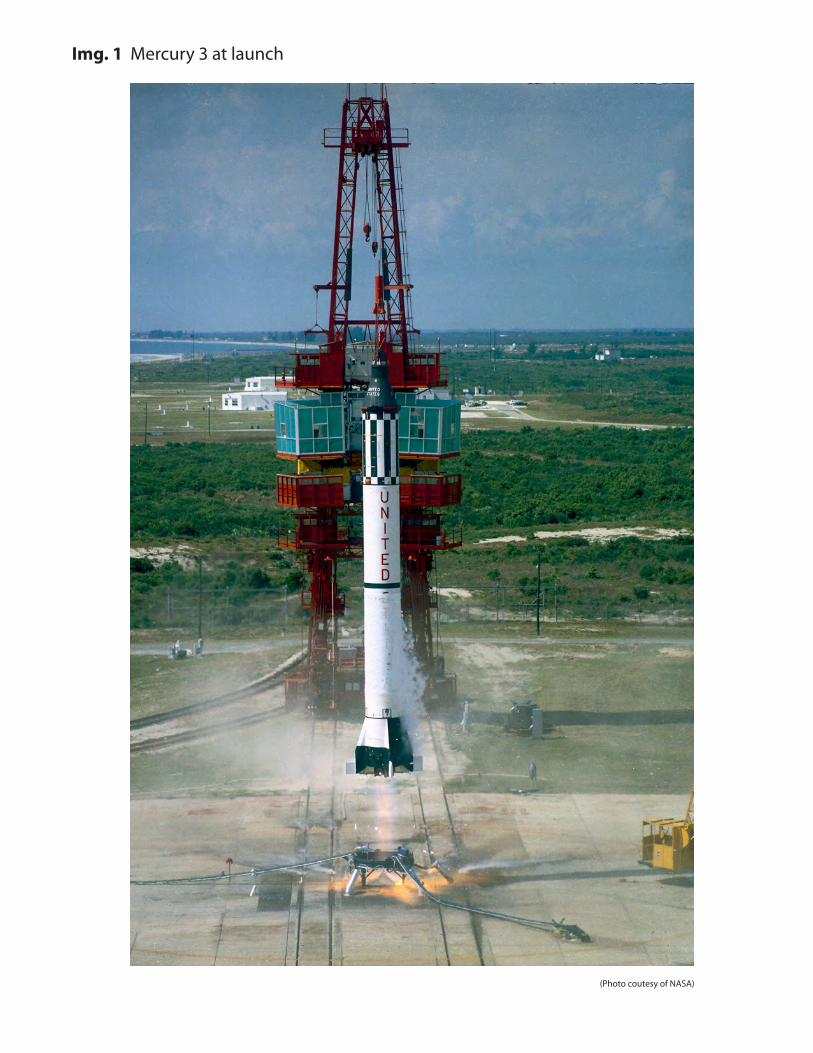
Img. 1 Mercury 3 at launch
(Photo coutesy of NASA)

MU
SE
UM
IN
A B
OX
3 9
Img. 2 Galileo Galilei by Justus Sustermans (1564-1642)
(Public Domain)

MU
SE
UM
IN A
BO
X
4 0
Img. 3 A
stronaut Satoshi Furukawa in Space A
board the ISS
(Image courtesy of N
ASA
)

MU
SE
UM
IN
A B
OX
4 1
Img.
4 “
NA
SA 9
32”
Wei
ghtle
ss W
onde
r VI,
Vom
it Co
met
(Pho
to c
ourt
esy
of N
ASA
)

MU
SE
UM
IN A
BO
X
4 2
Img. 5 U
niversity Students Conducting an Experiment on the ‘Vom
it Comet’
(Photo courtesy of NA
SA )


www.nasa.gov EP-2010-12-485-HQ
propulsion
Museumin a
BOXMuseum
in a
BOXSeries
Aeronautics ResearchMission Directorate