balancing opportunity and risk in the consumer products
TRANSCRIPT

SustainabilityBalancing Opportunity and Risk in the Consumer Products IndustryA 2007 GMA and Deloitte Consulting LLP Research Project


�
Table of Contents:Introduction 3
The Sustainability Imperative 9
Industry Findings 17
Ensuring Business Model Readiness 31
The Path Forward: Integrating Sustainability into the Business Model 35
Appendix A: Sustainability Definition 45
Appendix B: Sustainability Metrics 49
Appendix C: Regulatory Assessment 53
Appendix D: Leading Practices 67


�
IntroductionSustainability MovementSustainability is not a fad – it is unlike any issue the Consumer Product industry has encountered to date. Sustainability issues around environmental and social responsibility are not new. Over the past 12-18 months, momentum has been building due to increasing pressures from all major stakeholders, culminating in a ‘perfect storm’:
• Heightened media attention. Leading publications such as The Wall Street Journal, the Economist, and Newsweek are publishing cover stories on sustainability issues, often focusing on ‘gloom and doom’ scenarios that heighten the sense of urgency around environmental issues.
• Increasing consumer and shareholder awareness. Information transparency facilitated by the internet provides immediate access to corporate behavior and misbehavior as well as the ability to test corporate commitments. A company’s brand image is increasingly influenced by its perceived level of social and environmental responsibility. Seventeen percent of consumers today are ‘green motivated,’ and over fifty percent of shareholder proposals in 2006 were sustainability related.
• Business concern over operational and financial risk. Companies are increasingly being forced to address the operational risks associated with sustainability. Access to emerging markets, operating permits, and capital loans are being driven by real and perceived environmental and social performance. Companies face significant commodity risks related to potential shortages of raw material inputs such as corn, oil, and water.
Sustainability performance also exposes companies to financial risk, as consumers and shareholders are increasingly correlating environmental and management performance. Socially responsible and sustainable investment portfolios in the U.S. now total more than $2 trillion. The Dow Jones Sustainability Index tracks and rewards those corporations who practice sustainability; financial funds using this index total more than $4 billion.
For consumer Businesses, sustainability performance is especially visible, given branded consumer packaging (e.g. ‘branded litter’) and tangible retail locations.
• Increased regulatory scrutiny. The potential introduction of government regulations around water usage, carbon emissions, product composition (nanotechnology, hazardous materials), labeling, and performance reporting are serving as powerful motivators for self-monitoring. There has been a 300 percent increase in the number of climate change bills proposed from 5 years ago, and water usage and product and packaging labeling are emerging as the next wave of regulatory focus. In addition, environmental disclosures are receiving more scrutiny and investigation from the Securities & Exchange Commission, The Financial Accounting Standards Board and the Environmental Protection Agency.
• Growing consensus within scientific community. There has never been greater scientific consensus on the direct linkage between business activity and environmental impact. Various government bodies like the US Environmental Protection Agency, Department of Energy, and NASA are all assessing the linkage between industrial activities and environmental changes and exploring potential mitigation steps.
“ Sustainability is not a fad – it is unlike any issue the Consumer Product industry has encountered to date. Sustainability issues around environmental and social responsibility are not new. However, over the past 12-18 months, momentum has been building due to increasing pressures from all major stakeholders, culminating in a ‘perfect storm’.”
Section �: Introduction

�
Section �: Introduction
Scientific Community
• Acceptance that human activities influence global warming
• High-profile academic research published
• Increasing venture capital investments in environment benefitting opportunities
Government/NGO
• Kyoto agreement and other measures introduced
• 2008 Presidential elections as platform for change
• NGO activity increasing (Green Peace, Sierra Club, Environmental Defense)
• Evolving regulatory markets (China, EU) Businesses
• Natural resource shortage• Rising oil prices and cost of raw materials• Consumer demands• Supplier and retailer pursuit of cost saving
sustainability measures (e.g. decreased packaging)
Consumer/Society
• Rise of the ‘green buyer’• Concern over rising oil prices and
energy shortage• Public health concerns on food safety,
GMO• Organic food movement• Increasing awareness of environmental,
social and economic implications
Media
• Sustainability cover stories• Hype building and trendsetting
on’going green’• Gloom and doom stories
Climate change
• Extreme weather conditions• Diminishing natural resources• Energy, water, biodiversity, forestry• Increasing waste and decreased available
landfill area
SUSTAINABILITY
The combination of all the above mentioned factors has made sustainability a priority issue for executives of Consumer Product (CP) and Retail companies. Wal-Mart’s recent announcements on supplier packaging requirements have accelerated the level of sustainability activity. Given their significant environmental and ’social footprint,’ Consumer Businesses1 recognize the imperative for addressing sustainability. Consumer Business companies are initiating a wide range of sustainability programs across their business operations, including energy and water conservation, emissions control, and packaging and waste reduction efforts.
This report represents an inaugural effort to understand the impact of the sustainability issue in the Consumer Business industry. The Grocery Manufacturers Association/Food Products Association has partnered with Deloitte Consulting to research the key drivers and trends on sustainability, including:
• An industry assessment to develop a common framework for defining sustainability
• An evaluation of sustainability practices and emerging requirements of key retailers
• Identification of leading practices in managing environmental sustainability
• An understanding of the government regulatory environment’s impact on sustainability
Through interviews, surveys, and research with leading Consumer Product companies, retailers, suppliers, and environmental experts, this study provides an evaluation of business impacts associated with key sustainability initiatives. This study also provides a “Path Forward” for companies to consider as part of their sustainability journey.
Sustainability CompendiumA Compendium of Retailer Practices in Sustainability has been compiled to highlight the key sustainability activities that US and global retailers are currently engaged in. The Compendium includes companies from a range of retail channels: grocery, mass, club, specialty, drug, and convenience stores. The GMA Sales Committee provided significant input in prioritizing and selecting appropriate retail customers in each channel. The Compendium will be made available to GMA/FPA member companies (see attached example on the following page).
1“Consumer Businesses” (CB) include both Consumer Product (CP) companies and Retailers.
Drivers of Sustainability

�
Section �: Introduction
The Compendium has been compiled from publicly available sources, and includes specific information on retailer strategies, programs, goals and metrics, governance policies and compliance infrastructure. The depth and breadth of information may vary across retailers, in part because many U.S. retailers are in the early stages of developing their sustainability strategies while many European retailers may have more developed programs due to regulatory requirements.
Report StructureWe have structured this report into five key sections and focus areas as highlighted below:
• Section I: Introduction: Defines the scope of sustainability and highlights the major drivers of the sustainability movement.
• Section II: The Sustainability Imperative: Highlights recent events that illustrate the importance of sustainability, why it is relevant to the Consumer Business industry.
• Section III: Industry Findings: Outlines the key findings from direct interviews and surveys, as well as secondary research on leading practices and regulatory trends. Industry Findings includes: Survey and Interview Results, Retailer Sustainability Practices, Sustainability Metrics, and Regulatory Trends.
• Section IV: Ensuring Business Model Readiness: Evaluates the readiness of current business models in light of likely future trends.
• Section V: The Path Forward: Describes how leaders in sustainability should be structuring and executing their sustainability programs. It also includes a mini-case study on how a sustainable packaging program may be integrated into firm operations.
In addition to the main report sections, detailed definitions, metrics, case studies and regulatory assessments are also included in the appendices, as highlighted below:
• Appendix A: Sustainability Definition: A detailed definition of sustainability as well as definitions and sample practices for each type of environmental sustainability program (e.g. energy, water)
• Appendix B: Sustainability Metrics: A list of metrics commonly used by consumer product companies when reporting on sustainability performance.
• Appendix C: Regulatory Assessment: An assessment of the current regulatory environment, including predictions on potential regulatory changes and likely impact on Consumer Businesses.
• Appendix D: Sample Leading Practices: Examples of leading practices for environmental sustainability programs.

�
Section �: Introduction
Sustainability Definition and ScopeConsumer Businesses in the US do not share a common definition of ‘sustainability.’ Throughout our interviews and surveys with leading CP and Retailing companies, the term ‘sustainability’ was used to describe programs ranging from environmental programs (e.g. energy, water conservation) to social and economically oriented programs (e.g. human rights, fair trade.)
To address this disparity and to establish a common ground for discussion, the GMA Industry Affairs Council and Deloitte worked to develop a working definition of sustainability as: “The continual improvement of business operations to ensure long-term resource availability through environmental, socially sensitive, and transparent performance as it relates to consumers, business partners, and the community.” This definition is consistent with the United Nations and Brundtland Commission definitions of sustainability, as well as with definitions used by many Consumer Business companies issuing formal sustainability reports. Our definition of sustainability includes Environmental, Social, and Economic initiatives, for which we highlight the key programs below:
Environmental Programs Social Programs Economic Programs
EnergyWaterEmissionsWaste ReductionRecyclingRe-UseForestryAgriculture/Organic FoodsLivestockPackagingProduct ContentResource Conservation
Fair TradeLocal Economic DevelopmentWorking ConditionsHealth/NutritionDiversityHuman RightsFair CompetitionAnti-corruption and BriberySafetySocial PhilanthropySecurity and Privacy
Accountability/TransparencyCorporate GovernanceShareholder ValueEconomic PerformanceFinancial Objectives
Report Scope: Environmental ProgramsThe scope of this report will be on Environmental programs. Deloitte and the GMA Industry Affairs Council spent significant time validating the scope and priority of sustainability for the industry; the industry overwhelmingly supported Environmental sustainability programs as the first priority focus area.
To date, companies have emphasized Environmental sustainability programs because they are more tangible, and are characterized by identifiable ROI. Environmental programs also have long been subject to regulatory requirements, resulting in greater consistency in reporting and definitions.
Based on our surveys and interviews, we have compiled common practices and definitions of Environmental sustainability, which we highlight below:
Environmental Sustainability Programs: Definitions and Illustrative Practices
Program Definition Illustrative Practices
Energy Refers to programs that conserve the use of energy or utilize more environmentally-friendly energy sources
• Energy conservation programs and systems• Alternative energy use (e.g. wind, solar)• Purchasing alternative energy credits (e.g. wind credits)
to offset energy use
Emissions Refers to programs that reduce the amount of harmful emissions into the atmosphere, either direct or indirect. Emissions may include: greenhouse gas emissions, ozone depleting substances, air acidification substances.
• Use of energy-efficient equipment• Use of HFC-free refrigeration systems• Use of emission-reducing forms of transportation (e.g.
hybrid trucks)• Optimizing truck-load factors and distribution networks
to reduce number of trips taken• Use of alternative energy (bio-fuels) for fleets
Water Refers to programs that either conserve water usage or reduce the amount of water contamination
• Water conservation programs• Rainwater collection• Wastewater treatment programs and plants• Water re-use programs• Innovative product development to reduce the amount
of water used in product

�
Section �: Introduction
Program Definition Illustrative Practices
Waste Reduction Refers to programs that reduce the amount of waste generated or amount of waste going into landfills. Waste may be: hazardous, non-hazardous, solid, composts.
• Waste reduction programs• Waste-re-use programs (e.g. convert waste into energy)• Waste treatment and management programs
Recycling Refers to programs that recycle products and packaging, including paper/corrugate, plastic, glass, metal, electronics, other non-biodegradable materials.
• Store or community recycling programs for paper, plastic, glass, metal, etc.
• Use of recycled content in products or packaging• Initiatives to reduce use of products that need to be
recycled (e.g. paperless office)
Biodiversity/ Resource Conservation
Refers to programs that preserve the eco-system and biodiversity of land or ocean, as well as natural resource conservation
• Forestry programs • Re-forestation programs• Timber sourcing and processing guidelines• Participation in industry eco-preservation councils such
as Forest Stewardship Council, Marine Stewardship Council, etc.
Sustainable Agriculture
Refers to programs that support sustainable agriculture, including sustainable farming practices, organic farming standards, and proper care of livestock Note: This does not include “good for you” or healthy food products
• Standards on sustainable agriculture and organic products, including non-pesticide use and non-GMO products
• Standards on proper care of animals, including humane animal treatment, non-use of hormones, antibiotics, etc.
• Providing training or funds to support sustainable/organic farmers
Packaging Refers to programs that either reduce the amount of packaging used or utilize recyclable or biodegradable packaging
• Packaging reduction initiatives• Bulk packaging• Use of recyclable or biodegradable packaging or
distribution containers (e.g. pallets, boxes)• Investments in innovative technology that reduce
amount of packaging required or development of biodegradable packaging
Product Content Refers to programs that reduce the amount of harmful materials or ingredients in products
• Reformulation of products to remove trans fats, sodium, or other potentially hazardous chemicals
• New product development processes that consider Sustainability as a key criterion
[For a more information on how Consumer Businesses are defining sustainability, please refer to Appendix A: Sustainability Definition.]
Environmental Programs (continued)


�
For years, there have been warnings about the dangers of climate change, excessive natural resource consumption, and ever-increasing waste generation. Media headlines consistently focus on stories predicting dire consequences associated with the environment. Ascertaining fact from fiction and prioritizing true risks can be a daunting task.
The U.S. Environmental Protection Agency (“EPA”), Department of Energy (“DOE”), National Aeronautical Space Administration (“NASA”) and other government agencies are assessing the impact of emissions on the environment and are teaming with business leaders to understand the severity of the impacts and the best alternatives to mitigate environmental risk. Regardless of assessment findings, business leaders cannot ignore the implications associated with environmental risk.
Consumer Businesses will need to consider how their core business models, priorities, and focus areas will change, despite uncertainties about how sustainability will evolve. For the industry, sustainability is a critical business issue because:
• Consumer Businesses have a large environmental footprint, both from an input and output perspective. Consumer Businesses rely on a wide range of natural resource inputs, such as agricultural products, water, forestry, and marine fish stocks. Consumer products and packaging are also one of the largest contributors to solid waste, compared to other industries. The prominence of company brand names on product packaging also contributes to the public perception of CP companies as producers of ‘branded litter’.
• Sustainability poses troubling challenges unique to the industry. Reliance on scarce resources such as water, oil, and corn expose the industry to commodity risks and margin compression as input prices rise. Corn prices have already doubled in the past year alone, rising from $2 to $4 per bushel largely in response to increased demand for ethanol. Future regulations may force manufacturers to become responsible for product and packaging disposal costs. Finally, materials deemed harmful to humans or the environment are receiving increased scrutiny from stakeholders and governments. Retailers are requesting complete formula information for products containing chemicals, pesticides and aerosols or other hazardous materials. In response to recent health concerns over Chinese imports, legislation is being drafted that would require grocery retailers to list ‘country of origin’ on products sold.
• Tensions exist between pursuing sustainability and achieving growth. Growth trends in convenience and health have resulted in packaging proliferation (e.g. single/smaller servings, limited calorie packs, meal kits and other ‘ready-to-eat’ products), that may be counter to waste reduction goals. Increasingly complex global supply chains, driven by low-cost sourcing, have increased the amount of transport necessary, resulting in higher energy use and emissions output.
The Sustainability Imperative
Section 2: The Sustainability Imperative
Input
Value Chain
Output
• Agriculture
• Livestock
• Raw materials inputs
(water, oil, corn)
• Water
• Energy
• Agriculture inputs
• Paper/cardboard
• Plastic
• Glass
• Metal
• Chemicals
• Fuel, oil
• Alternative energy
• Packaging
• Marketing collateral
• Displays
• Fuel, oil, energy
• Product
• Packaging
Sourcing Manufacturing DistributionMarketing & Sales
Usage & Disposal
• Soil erosion
• Ecosystems loss
• Waste water
• Organic waste
• Solid waste
• Emissions
• Emissions • Paper waste
• Plastic waste
• Metal waste
• Wood waste
• Emissions
• Paper waste
• Plastic waste
• Metal waste
• Organic waste
• Glass waste
• Emissions
Consumer business environmental footprint (Illustrative example)

�0
Section 2: The Sustainability Imperative
Given the developing regulatory environment, global dynamics, pending political change, and emerging patterns of consumer behavior, it is difficult to predict or control how our understanding of sustainability will evolve. However, with sustainability quickly becoming a mandate, companies need to evaluate their readiness to respond and fully consider the implications of sustainability on operations, brand image, and compliance structures.
Impact on Business OperationsConsumer Businesses are significant users of natural resources - water, energy, fuel, agricultural resources, forest and marine resources. Outputs from Consumer Business operations, including packaging waste, solid waste, emissions, and waste-water, also have significant environmental impact, both directly and indirectly through consumer usage and disposal behaviors.
The following scenarios highlight some of the current research and predictions in key environmental areas. The purpose of these scenarios is not to validate the scientific estimates, but rather to put forward some of the key operational implications and considerations for Consumer Business leaders to consider as part of the overall sustainability imperative.
Emissions and Climate ChangeIn a study on the economics of climate change commissioned by the UK government, greenhouse gas emissions contributing to climate change have almost doubled since the Industrial Revolution. If the current growth rate continues, scientists predict a 3-5°F rise in temperature by 2050, with dire consequences to water supplies, food production, and ecosystems. The study predicts that such changes could result in a 3 percent loss to global GDP annually.2
There is mounting scientific consensus that emissions produced by the burning of fossil fuels have contributed to climate change and extreme weather conditions. Tropical cyclones intensities have increased substantially, directly impacted by an increase in surface sea temperatures of 0.9oF over the last 15 years3. Category 4 and 5 storms such as Wilma caused the loss of 60-75 percent of grapefruit crops and 10-15 percent of orange crops in Florida, two years in a row. Florida has now seen the smallest grapefruit crop in 2004-05 since 1935. Currently, Florida supplies 75 percent of U.S. grapefruit and 50 percent of oranges. Climate change has the potential to impact other states such as Texas, which grows crops used in popular consumer food products. Texas, the second largest producer of pecans in the U.S. and the third largest producer of oranges, increasingly faces widespread disruptions from hurricanes and inclement weather4.
2UK Government: Stern Review on the Economics of Climate Change 3British Government Chief Scientist, David King; MIT, Department of Earth, Atmospheric and Planetary Sciences, Kerry Emanuel - Professor of Meteorology, 4Texas A&M University, Aggie Horticulture Network; FEMA.gov
Hurricane intensity has doubled in �0 years
1.6
1.4
1.2
1.0
0.8
0.6
0.4
0.2
0���0
YEAR���0 ���0 ���0 ���0 ��80 ���0 2000
Oce
an T
empe
ratu
re
Stor
m In
tens
ity
Storm intensity
Ocean temperature
Storm Intensity vs. Ocean Temperature
Consumer Businesses may also be directly impacted by legislative efforts to curb emissions and climate change. The Lieberman-Warner bill (re-introduced in 2007) has the potential to impact downstream carbon emitters nationally by advocating a cap and trade system that would have financial reporting and operational implications.
��
The operational implications for Consumer Business companies are significant and require leaders to consider the following key strategic questions:
• How will the availability of key raw material and commodity inputs such as oil, water, and corn need to be managed in the future? What contingency plans and risk mitigation steps should be put in place now?
• What are the economic implications associated with the above commodity risks? Are there viable agricultural alternatives that should be investigated now?
• How can emissions output be managed while distribution and supply networks continue to grow in complexity across the globe?
• Do companies need to re-evaluate their collaboration processes across a broader set of value chain partners to include farmers, transportation companies, and energy companies?
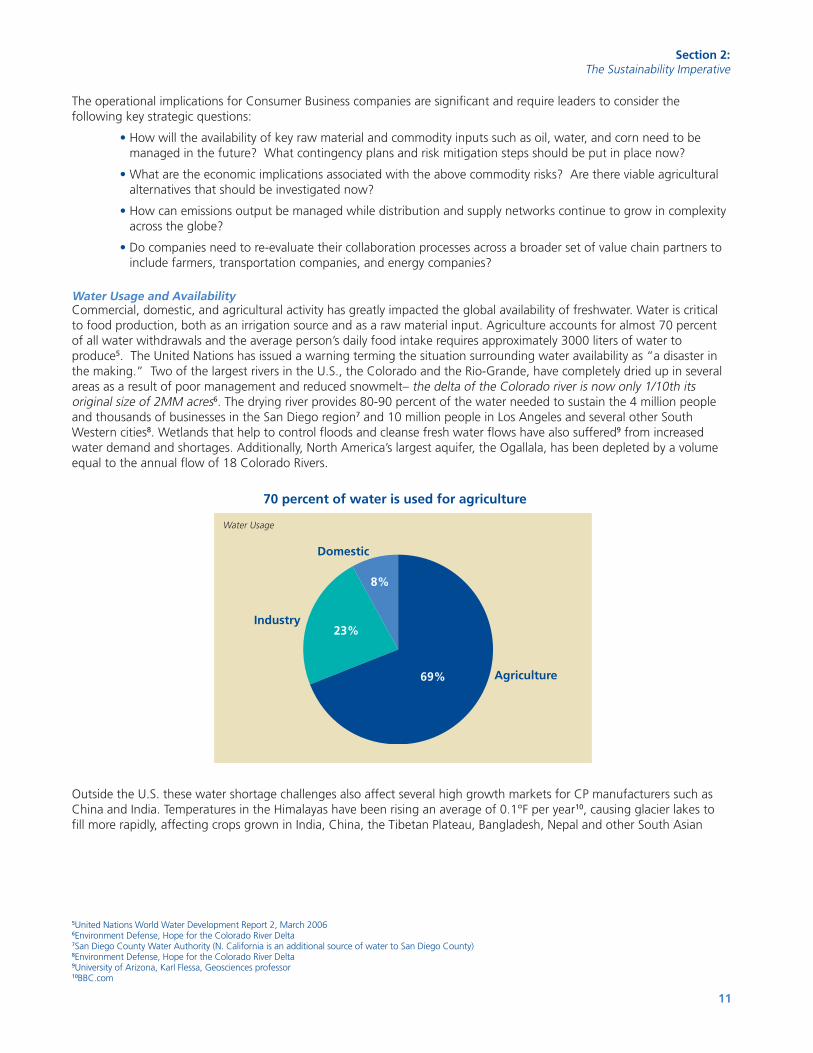
Water Usage and Availability Commercial, domestic, and agricultural activity has greatly impacted the global availability of freshwater. Water is critical to food production, both as an irrigation source and as a raw material input. Agriculture accounts for almost 70 percent of all water withdrawals and the average person’s daily food intake requires approximately 3000 liters of water to produce5. The United Nations has issued a warning terming the situation surrounding water availability as “a disaster in the making.” Two of the largest rivers in the U.S., the Colorado and the Rio-Grande, have completely dried up in several areas as a result of poor management and reduced snowmelt– the delta of the Colorado river is now only 1/10th its original size of 2MM acres6. The drying river provides 80-90 percent of the water needed to sustain the 4 million people and thousands of businesses in the San Diego region7 and 10 million people in Los Angeles and several other South Western cities8. Wetlands that help to control floods and cleanse fresh water flows have also suffered9 from increased water demand and shortages. Additionally, North America’s largest aquifer, the Ogallala, has been depleted by a volume equal to the annual flow of 18 Colorado Rivers.
5United Nations World Water Development Report 2, March 20066Environment Defense, Hope for the Colorado River Delta7San Diego County Water Authority (N. California is an additional source of water to San Diego County)8Environment Defense, Hope for the Colorado River Delta9University of Arizona, Karl Flessa, Geosciences professor10BBC.com
�0 percent of water is used for agriculture
8%
��%
2�%Industry
Domestic
Agriculture
Water Usage
Section 2: The Sustainability Imperative
Outside the U.S. these water shortage challenges also affect several high growth markets for CP manufacturers such as China and India. Temperatures in the Himalayas have been rising an average of 0.1°F per year10, causing glacier lakes to fill more rapidly, affecting crops grown in India, China, the Tibetan Plateau, Bangladesh, Nepal and other South Asian

�2
countries. If we consider the case of India, a major growth market for many CP manufacturers for consumption and raw material sourcing, a loss of glacial melt water in the Ganges River would reduce flows by two-thirds, causing water shortages for 500 million people and 37 percent of India’s irrigated land. Rice, corn, and potato crops would be hardest hit, significantly impacting manufacturers of cereals, snacks, bottled water, and other beverages - a market worth up to $3.5 billion in India alone. However, CP manufacturers should also be aware of the potential economic gain arising from predicted climate change in some regions of the world. The UN projects that crop yields could increase up to 20 percent in East and Southeast Asia while they could decrease up to 30 percent in Central and South Asia by the mid-21st century.11
Legislative actions are being considered to address this situation. Some states facing more immediate concerns have taken water scarcity issues to the courts. Companies using water as a major input may have their water usage regulated by state or local mandates and/or will have to engage in trading of water rights both in the U.S. and globally. States in the Southwest including New Mexico, Arizona, and Gulf states such as Texas, Georgia, and Florida are already facing this situation and are investigating trading markets and local use bans. Federal, state and local mandates on the use of water or requirements for retailers to carry “low water use products” are likely.
Leaders of Consumer Business companies with a heavy reliance on water as a major input for their operations or products need to consider the following strategic questions:
• How will regulatory changes impact water availability and usage?
• What are the economic and financial implications of changes in water availability?
• How will limited water availability and changing usage requirements impact growth plans, especially as it relates to emerging markets?
• What opportunities and/or risks exist around product offerings in response to customer and consumer demands?
Energy and Alternative Energy SourcesBetween 2005 and 2006, the median price for domestic gasoline increased 17 percent while diesel price increased 48 percent in the U.S.12 As oil prices rise dramatically, companies are seeking alternative energy sources to fuel their operations. However, alternative energy sources also face their own challenges such as capacity constraints. For instance, ethanol comprises only one percent of the total U.S. petroleum fuel usage but takes 18 percent of the U.S. corn crop to produce.13 There is simply not enough arable land to produce the corn needed to make ethanol widely available. The price of corn has already doubled in the past year. If more corn crop is diverted to ethanol production, it could have an adverse impact on manufacturers of corn syrup, corn snacks, and other corn products, an industry worth $8.5 billion in the U.S.14 Indirectly, since 25 percent of corn is used to feed cattle, increasing corn prices could also impact the livestock industry.
Corn prices nearly doubled in one year
Corn Prices
YEAR
450
400
350
300
250
200
150A S O N D J F M A M J J A S O N D J
200� 200� 200�
Cor
n pr
ices
(in
cent
s)
Section 2: The Sustainability Imperative
11Intergovernmental Panel on Climate Change12 New York Mercantile Exchange; University of Nebraska, Institute of Agriculture and Natural Resources13USA Today article, “Contentious Ethanol Debate,” 7/31/200614Census.gov, Industry statistics

��
Section 2: The Sustainability Imperative
15U.S. EPA16Container Recycling Institute17Natural Marketing Institute
Leaders of Consumer Business companies need to consider the following strategic questions:
• How will rising energy costs impact manufacturing and distribution costs?
• How will growing use of biofuels such as ethanol affect the availability and price volatility of raw input materials such as corn?
• Are alternative energy sources a viable option for operations? To what degree?
Packaging and Waste Management In the U.S., packaging waste makes up 30 percent of the solid waste stream.15 Only 20 percent of plastic beverage bottles are actually recycled, and many of those are exported to far off places like China for recycling. Those that end up in landfills can take up to 1,000 years to naturally decompose.16 The amount of packaging waste is continuing to increase as trends in health and convenience lead to a proliferation of single-serving packages, smaller bottles, and on-the-go disposable containers. The high visibility of brand names on CP products and packaging exposes CP manufacturers to additional regulatory and reputational risk. In Europe and parts of Asia, CP manufacturers are being held responsible for the packaging waste of the products they manufacture, and U.S. firms operating in those markets are held to the same standards. There is rising concern that these standards may eventually be adopted in the U.S. as well.
Consumer products generate significant waste
Solid Waste
Tons
(in
mill
ions
)
70
60
50
40
30
20
10
0Electronic products
Automotives Consumer Products & Packaging
Leaders of Consumer Business companies need to consider the following strategic questions:
• How can sustainable packaging requirements be balanced with sometimes conflicting consumer demands for convenience (e.g. “ready to eat,” smaller/individual sizes) and the need for product integrity/safety?
• Are new collaboration processes required across a broader set of value chain partners to include packaging suppliers, waste management companies, and consumers?
Impact on Brand Image and Consumer PerceptionSustainability is increasingly influencing brand image and consumer perception of Consumer Business companies. A leading UK retailer was able to achieve a six percent increase in sales in its stores by implementing a sustainability program. Careful analysis attributed this increase to an improved brand image, centered largely on sustainability, in the eyes of the consumer.
On the other hand, heightened media attention on negative publicity stemming from unsustainable practices (e.g. unethical sourcing, human rights, oil spills, and other environmental damages) have adversely impacted consumer perception of some companies and dampened sales for others.
A rising 17 percent of consumers – coined ‘green buyers’ or LOHAS (Lifestyle of Health and Sustainability) – are willing to shift their brand loyalties to ‘green’ companies.17 Another 21 percent of U.S. consumers called ‘Naturalites’ are focused on natural/organic products. Specialty retailers such as Whole Foods have capitalized on this trend by catering to organic/

��
natural food lovers and the health-conscious. As ‘green’ product availability and environmental awareness increase, sustainability may become a key consideration factor, in addition to price and performance. Consumer Businesses will need to balance growing consumer demand for sustainable products with demands for convenience and price sensitivity.
Consumer segments
• LOHAS: ‘Green buyers,’ dedicated to environment
• Naturalites: Natural/organic consumers with strong preference for healthy food/beverage products
• Drifters: Have good intentions, but other factors (price, trends) influence purchase decisions
• Conventionals: Do not have green attitudes but practice environmental behaviors such as recycling
• Unconcerned: Environment is not a priority
Source: Natural Marketing Institute 2006
At the same time, there are concerns that the consumer will remain price-sensitive and, while wanting green products, may not be ready to pay a premium for them. The LOHAS segment is largely driven by the baby boomer generation with higher disposable income, and some believe that it may not translate into long-term growth, and will eventually be superseded by other segments that value price over ‘green.’
Key Strategic Questions. Consumer Business companies need to consider the following strategic questions:
• Is the green segment sufficiently attractive and will it permit long-term growth?
• Will ‘green’ products need to be introduced? If so, which ones?
• How can companies balance consumer demand for sustainability with the demand for convenience?
• How will consumer willingness to pay be impacted when true costs of natural resources across the supply chain are reflected in products and services?
• How can sustainability goals and financial goals be aligned?
Governance and Compliance ImplicationsThere is an increasing perception that undisclosed environmental risks would impair the public’s ability to make sound investment decisions. Accordingly, shareholders and stakeholders are demanding more transparency around environmental and social performance. While not currently required by law in the U.S., many companies are enhancing their required regulatory and public financial reports with voluntary statements to address issues such as the environment, health and safety, labor, and corporate social responsibility. However, organizations face risks in the form of lawsuits or Sarbanes-Oxley implications, for example, if voluntary reports do not reconcile to information contained in public financial or regulatory reports.
An increasing number of companies are obtaining third-party verification to manage their voluntary reporting risks. However, questions regarding auditable standards or criteria are surfacing as inconsistencies in voluntary reports and third-party verification procedures are becoming apparent. Shareholders and stakeholders, frustrated by potentially unreliable voluntary reporting, are increasingly issuing resolutions that require Consumer Business companies to report on environmental performance if they are not already issuing public reports and are dictating reports on certain areas of performance for companies who are issuing public reports if they believe the reports appear to contain ‘greenwashing’, the disclosure of only the positive attributes of sustainability performance.
Disclosures of environmental matters have been inconsistent and challenging to interpret. Increasing shareholder demands for stronger governance resulted in a recent investigation initiated by U.S. Congress on public company disclosure of environmental matters. The conclusion was that the Financial Accounting Standards Board (“FASB”), the Securities and Exchange Commission (“SEC”), and the Environmental Protection Agency (“EPA”) should align to ensure more transparent disclosure. More activity is expected from each of these agencies. Already, the FASB has issued subsequent accounting
LOHAS ��%
Naturalites 2�%
Drifters ��%
Conventionals 20%
Unconcerned 2�%
Section 2: The Sustainability Imperative

��
Section 2: The Sustainability Imperative
pronouncements and is drafting additional guidance to provide more clarity with respect to environmental matters in public accounting. With likely governmental regulation in the areas of carbon management and reporting, the voluntary and financial reporting requirements will be inextricably linked, meaning reports on performance will need to be consistent across communications channels, be they public financial reports, voluntary reports, press releases, or websites.
Increased Demand for Sustainability Reporting
The increased number of reports and the topics discussed is in direct response to demands by shareholders, investment companies, business partners, consumers, and regulators in the U.S. and abroad. A review of 306 shareholder proposals made in 2006 and 2007 shows that 154 proposals, or nearly half of all shareholder proposals, were related to sustainability topics.�8 Of these, 36 shareholder proposals were made to companies in the Consumer Products and Retail industries.
Retailers and Consumer Products companies should work closely with legal counsel and financial reporting personnel across functions to respond to such resolutions and to ensure that the data communicated externally across channels is consistent, whether within a voluntary report, disclosure to ratings agencies, contained in a response to a shareholder resolution, or issued in a financial report or a regulatory report. While the Global Reporting Initiative (GRI) has emerged as a widely accepted reporting framework to guide companies in producing quality, standardized reports, many companies struggle with ensuring the reports are compliant with U.S. required and suggested frameworks. For example, the American Institute of Certified Public Accountants (“AICPA”) has been active in issuing Statements of Position that provide recommended frameworks for reporting particularly in the area of carbon emissions. The AICPA’s recommendations will likely transition from a recommended approach to a required position if carbon should become regulated in the U.S. by state and federal governments. Companies should balance current voluntary reporting frameworks against financial and regulatory reporting frameworks, standards, and positions which are evolving and vary accordingly to country.
Key Strategic Questions. In light of these developments, leaders of Consumer Business companies need to consider the following key questions:
• What are the benefits and risks associated with voluntary reporting? How and when should a voluntary report be issued?
• Does the data distributed in a voluntary report reconcile to data reported in other channels (e.g. company website, press releases, financial statements, federal, state, and local regulatory reporting)?
• What are the risks associated with regulatory uncertainty? How can the company best prepare for and influence outcomes in this area?
• Will the metrics and calculations reported in the past be consistent with government mandates for calculating and reporting?
• What proactive steps can be taken to address increasing shareholder and other stakeholder concerns related to sustainability?
[For a detailed discussion on specific regulatory trends and their implications for Consumer Business companies, please refer to Appendix D: Regulatory Assessment.]
Shareholder Proposal Topic No. of Proposals
Sustainability reportingClimate change/GHGHuman rightsEnergyVendor standardsProduct labelingEnvironmental impactGlobal labor standardsRecyclingRenewable energyBiodiversityOther sustainability topics
38311210853333236
TOTAL ���
18Shareholder proposals were found in a database compiled by Interfaith Center for Corporate Responsibility. http://www.iccr.org/ethvest.php


��
Section �: Industry Findings
Industry FindingsIntroductionTo evaluate the state of sustainability in the Consumer Business industry, we conducted a series of interviews and in-depth surveys with leading Retailers and Consumer Product manufacturers. We supplemented our primary research with extensive secondary research, using publicly available sources including sustainability reports, annual company reports, news articles, analyst reports, and company websites.
• Survey and Interview Results: Contains results from our in-depth survey and interviews with 25+ leading companies in the Retail and Consumer Product industries.
• Retailer Sustainability Practices: Highlights leading practices in sustainability and emerging priorities for Retailers.
• Sustainability Metrics: Outlines the types of metrics Consumer Businesses are currently using to measure their sustainability performance.
• Regulatory Trends: Evaluates the current and projected regulatory trends impacting environmental sustainability.
Our research findings indicate that sustainability – both from a corporate and regulatory perspective – is not a fad and will become increasingly important over the next 5 years.
Survey and Interview ResultsOver a three month period, we conducted a detailed survey and a series of in-depth interviews with leading Retailers and Consumer Product companies. Retailers interviewed and surveyed included companies from a range of retail channels, including grocery, mass, club, specialty, and drug stores. Retailers interviewed and surveyed represent well over 50 percent of the grocery, mass and convenience store channels by revenues. Consumer Product companies interviewed and surveyed included leading companies in food and beverage, personal care, and household products sectors. In total, 26 Consumer Businesses were interviewed and surveyed. Finally, primary research was supplemented by detailed external research using publicly available sources. We highlight our key findings below.
Company interviews, survey results, and external research indicate that a large number of Consumer Business companies are taking an increasingly active interest on the sustainability issue, with companies in varying stages of involvement.
• There is significant focus and activity on sustainable initiatives within the industry. However, overall maturity levels across the industry are low.
• EU-based Consumer Businesses are ahead of their U.S.-based counterparts in environmental sustainability efforts.
• There is no dominant framework or definition used, with companies defining their own framework or drawing relevant practices from several leading ones.
• Retailer requirements are a key influencer but not the primary driver for Consumer Product companies undertaking sustainability initiatives. Internal priorities drove the majority of sustainability efforts.
• The majority of the companies are pursuing similar programs, but doing so independently.

�8
• Overall collaboration on programs was very limited. However, Retailers and Consumer Product companies both acknowledge the importance of collaboration.
• Most companies indicate they are measuring and reporting sustainability progress, but there is little consistency in how sustainability is being defined, measured, and reported.
• Both Retailers and CP companies cited several barriers to comprehensive sustainability efforts such as regulatory uncertainty, unjustifiable ROI, and immature technology.
• Governance structures are fairly rudimentary.
Industry Activity and Maturity Levels:
There is significant focus and activity on sustainability initiatives within the industry. However, overall maturity levels across the industry are low.
Currently, over 60 percent of U.S. Consumer Business companies are focused on initiatives that are directly related to ensuring compliance or reducing operational costs.
• Almost one third of Retailers have minimal, if any, sustainability related efforts.
• Only eight percent of these companies have leveraged the sustainability opportunity to create a unique competitive advantage.
EU-based Consumer Businesses are ahead of their U.S.-based counterparts, driven by regulatory requirements, government incentives, and consumer behavior.
Only 15 percent of companies in the U.S. vs. 63 percent in the EU have identified their long-term strategies and position on sustainability, including management driven vision and goals, and extensive collaboration with traditional stakeholders.
Reporting Framework/Definitions:
There is no dominant framework or definition used, with companies defining their own framework or drawing relevant practices from several leading ones.
Overall, CP companies are ahead of Retailers in adopting frameworks or definitions. 40 percent of Retailers, more than twice the number of CP companies, have not adopted a sustainability framework.
Established Strategy and Stakeholder
Collaboration
USCB* ��% �2% ��% 8%
-USCP 0% ��% ��% 8%
-USRetail 2�% �0% ��% �%
EU** 0% 2�% ��% �0%
Note: *N = 26 Consumer Businesses;** Deloitte UK Study on Sustainability Practices in the EU, N = 11
Managing Direct Risks and Costs
Integrated Strategy for Competitive Advantage
Reactive or Little
Response
Section �: Industry Findings
80%
60%
40%
20%
0%DJSI
Frameworks
% of Responses
FTSE�Good GRI ISO ��000 None
Note: N = 11 CP and 15 Retailers; Percent figures indicate portion of respondents who selected a particular metric. Sums to more than 100 percent since respondents could select more than one response
CP Retail

��
Key Drivers:
Retailer requirements were a key influencer but not the primary driver. Over 60 percent of companies identified internal strategic priorities as the primary driver of their sustainability efforts. These priorities included reducing operational costs, managing commodity risks, and upholding corporate values.
Consumer needs, specifically consumer demand for ‘green’ products and increasing awareness and scrutiny of Retailers’ social and environment related initiatives, also drove Retailers’ sustainability efforts.
CP companies acknowledged that Retailer requirements were another important driver– however, specific interviews highlighted that this was primarily in response to Wal-Mart’s packaging program.
Leading Programs:
Majority of the companies were pursuing similar programs, but doing so independently.
Recycling and energy conservation were the most commonly pursued programs given the ease of quantifying benefits and ability to internally control these programs. Mass retailers and grocers were more focused on these programs compared to other retail formats.
Overall collaboration on programs was very limited. Packaging, driven by Wal-Mart, was the primary program demanding collaboration between Consumer Product companies and Retailers.
Retailer – CP Collaboration:
In many cases where collaboration exists, it is limited in scope and lacks depth.
Less than 40 percent of companies were focused on ensuring that products they source or sell meet defined sustainable criteria.
We also researched publicly available data on U.S. Consumer Business companies. Greater than 50 percent of companies researched did not currently collaborate with Non-Governmental Organizations (NGOs), an important stakeholder. Many that do are often reacting to a particular issue or NGOs/ Advocacy Groups concerns. There are other companies that engage NGOs proactively, leveraging them to fill gaps in technical knowledge, help determine best practices and launch programs where they may not have the dedicated in-house staff to do so.
80%
60%
40%
20%
0%Recycling
Note: N = 11 CP and 15 Retailers; Percent figures indicate portion of respondents who selected a particular metric. Sums to more than 100 percent since respondents could select more than one response
CP
ProgramsEnergy Waste Water Emissions Packaging
Mass Grocery Drug Other% of Responses
Retailer – CP collaboration
Section �: Industry Findings
80%
60%
40%
20%
0%Internal
Drivers
% of Responses
Regulatory Retailer Needs
Consumer Needs
Supplier Needs
Note: N = 11 CP and 15 Retailers; Percent figures indicate portion of respondents who selected a particular metric. Sums to more than 100 percent since respondents could select more than one response
CP Retail
CP Retail% of Responses
Standards/Scorecards
Conferences/ Trainings
Technical guidance and
funding
Selection based on sustainable
criteria
None
80%
60%
40%
20%
0%
Types of Collaboration
Note: N = 11 CP and 13 Retailers; Percent figures indicate portion of respondents who selected a particular metric. Sums to more than 100 percent since respondents could select more than one response

20
Performance Measurement
There is little consistency and depth in how sustainability is being measured and reported. Up to 55 percent of Retailers had no formal metrics for their top priority programs, such as Packaging Reduction.
For companies that do measure sustainability performance, actionable program performance metrics are largely absent. Nearly 60 percent of Retailers had only basic metrics for Recycling (e.g. total waste recycled per year).
Top Barriers
Both Retailers and CP cited several barriers to comprehensive sustainability efforts. Unjustifiable ROI and lack of incentives for their sustainability programs impaired efforts for both, but impacted CP companies more than Retailers. Interview discussions identified that this was due to the more complex value chains and business models of CP companies compared to Retailers.
Retailers found immature technology and regulatory uncertainty to be key barriers.
Section �: Industry Findings
CP Retail% of Responses
Total waste recycled per
year
Recycling rate % of waste sold for re-use
% of recycled content
No formal metrics
80%
60%
40%
20%
0%
Recycling Program Metrics
Note: N = 11 CP and 13 Retailers; Percent figures indicate portion of respondents who selected a particular metric. Sums to more than 100 percent since respondents could select more than one response
CP Retail% of Responses
80%
60%
40%
20%
0%Waste Reduction Recycling Packaging Reduction
Companies with No Formal Metrics
CP Retail% of Responses
80%
60%
40%
20%
0%ROI/Incentive
challengesImmature
technologyRegulatory uncertainty
Top Barriers
Note: N = 11 CP and 15 Retailers; Percent figures indicate portion of respondents who selected a particular metric. Sums to more than 100 percent since respondents could select more than one response

2�
Governance Structures
Governance structures at most companies are fairly basic. When asked to rate the maturity of their governance structures, only a few companies have formal sustainability offices or Chief Sustainability Officer (CSO) level positions with supporting resources. Over 66 percent did not have supporting policies or procedures.
Most companies indicated their sustainability initiatives are being driven by part-time cross-functional groups focused mainly on compliance, cost reduction, or addressing needs tactically as they arise.
Our primary research clearly indicate that the Consumer Business industry is undertaking significant activity related to sustainability today. However, these initiatives, especially in U.S.-based companies, are primarily inward looking and driven by priorities such as cost reduction and risk management. Several critical elements to ensure a comprehensive effort are missing and thereby hindering progress.
There is minimal collaboration with important stakeholders to drive sustainability across the value chain and to overcome barriers. Few companies provide technical guidance to their partners and even fewer offer incentives or enforce performance. Some companies have created formal investment programs to drive collaboration with their partners. These programs, however, were frequently described as ‘one-way’ streets, with partners dictating technical standards, rather than truly collaborating to determine what is best for their partnership or industry.
Finally, governance structures and business models are largely undeveloped or inherently constrained from a sustainability standpoint, with only a few pockets of excellence. Metrics being used today are inconsistent or not actionable.
Retailer Sustainability Practices and PrioritiesDespite their nascent stage of sustainability program development, Consumer Businesses are increasingly ramping up their efforts with programs across a broad range of environmental areas, such as energy conservation, emissions reduction, and packaging. Our interviews indicate significant momentum is building on sustainability, with firms making sizeable investments in sustainability programs and services. Our research indicates that Retailers have been focused on the following priority areas of environmental sustainability:
• Energy Conservation
• Recycling/Waste Reduction
• Packaging
• Water Conservation
• Emissions
In the following sections, we highlight some leading practices and common programs Retailers are currently undertaking in the above-mentioned areas. These leading practices and programs have been compiled from our surveys, interviews, and the Compendium of Retailer Practices in Sustainability, a database of current sustainability initiatives from a broad range of retail channels: grocery, mass, club, specialty, drug, and convenience stores. The Compendium is available to GMA/FPA members.
Note: N = 11 CP and 15 Retailers; Percent figures indicate portion of respondents who selected a particular metric. Sums to more than 100 percent since respondents could select more than one response
CSO
Companies with Mature Governance Structures
Full Time Staff
Local Teams
Cross - Func.
Adhoc Comm
Policies
% of Responses
80%
60%
40%
20%
0%Reporting
MetricsTools
Section �: Industry Findings

22
Energy Conservation ProgramsEnergy conservation programs have been a high priority for Retailers because they offer cost savings and measurable ROI. Over 65 percent of the Retailers we surveyed indicated energy conservation programs as a high priority. Some sample retailer energy conservation programs include:
• Energy efficient equipment and lighting in stores. Retailers are both designing new stores and retrofitting existing stores with new lighting systems and energy-efficient equipment. A leading mass retailer invested $17 million to develop an LED lighting system and designed new stores to use 30 percent less energy. By rolling out energy efficient components, a leading grocery retailer achieved a 17 percent reduction in energy consumption compared to the previous store design. Other common energy conservation practices include installing energy-efficient refrigerators and ovens, installing motion-sensor lighting systems, using infrared diagnostic equipment to test and repair air leaks in coolers, windows, and freezers, and installing compact fluorescent lamps and solar panels.
• Centralized energy management systems. Some retailers have installed centralized energy management systems to monitor energy usage at store levels. A leading grocery retailer automatically controls store lighting through the Internet, and turns off 60 percent of lighting after-hours to prevent excess usage. A leading mass retailer has implemented an integrated energy management system, which is centralized and enables corporate headquarters to control lighting, refrigeration equipment, heating and cooling equipment, and exhaust fans in all stores.
• Alternative energy use and investments. Many retailers are using alternative energy sources (e.g. bio-fuel, geothermal, wind, or solar energy) to power their stores. They are also purchasing alternative energy credits, such as wind energy credits, to offset their energy usage. A leading specialty retailer was able to offset 100 percent of its energy use with wind energy credits. A leading club retailer donated its roof space for the installation of solar panels to provide a green power option for residential and commercial residents in the store’s area. Finally, a leading European retailer has invested in a £100 million fund for investments in sustainable environmental technology (e.g. wind turbines, solar panels, gasification technology).
“ We invested £20 million in an extensive range of energy-saving programs, which will cut energy consumption by 135 million kWh per year, saving £8.1 million in energy costs annually.”
-Leading European Retailer
Recycling/Waste Reduction ProgramsCompanies are setting dramatic ‘zero waste’ and ‘zero landfill’ goals and implementing storewide recycling and waste reduction programs to achieve these goals. Approximately 60 percent of the retailers we surveyed indicated recycling as a top priority program while approximately 55 percent indicated waste reduction as a top priority program. Some retailers have even turned their recycling programs into positive revenue streams by baling recyclable waste and selling them to other entities for reuse in alternative products and energy sources. Some sample Retailer recycling initiatives include:
• Store recycling programs. Leading retailers recycle all different types of materials – distribution packaging (corrugated cardboard, shrink wrap), product packaging (paper, boxes), product displays, hangers, metal fixtures, food, and organic waste. One leading mass retailer reuses 92 percent of its garment hangers. Recycled products are baled and sold for reuse to create recycled content products or incinerated to generate energy. A leading grocery retailer developed an organic waste recycling program, whereby organic waste is fermented and composted to develop environmentally friendly methane gas. Another leading retailer sells recycled shrink wrap to a manufacturer to create lumber products.
• Consumer/Community recycling programs. Retailers are also engaging consumers and the broader community in the recycling effort. Recycling bins are often found in stores to encourage consumer recycling. Retailers are also devising creative ways to encourage consumers to recycle plastic shopper bags, such as selling strong, reusable bags or charging a small fee for paper or plastic bags. A leading drug retailer encourages neighborhood residents to recycle newspaper, soda bottles or soup cans by allowing them to earn up to $25 in credits per month that can be used towards product purchases in its stores. A leading grocery retailer has sold 3.5 million reusable carrier bags, reducing the number of checkout bags distributed by 20 percent. In addition to traditional recycling programs, Retailers are also donating unsold food to the community. A leading grocery retailer recently donated 29 million pounds of food valued at $43 million.
Section �: Industry Findings

2�
• Recycled content products. Retailers are both using and selling recycled content products. Leading European retailers are working towards 80-100 percent recycled paper in all offices. A leading U.S. specialty retailer ensures that all brochures, signage and other marketing materials produced are printed on at least 40 percent post-consumer recycled paper and that only soy-based inks are used in the printing. Some Retailers are even requesting that advertisers should use PCR paper and sustainable printing materials. Finally, many Retailers sell PCR products in their stores, from paper products to bottles and other packaging containers.
“ We have reduced waste by 70 percent through extensive recycling and re-use programs, including reusing garment hangers, recycling store fixtures, recycling shrink wrap at distribution centers and re-processing them into lumber products. Corrugated cardboard are baled and sold for profit; cardboard revenues have outpaced trash expenses for the past five years.”
-Leading Mass Retailer
Packaging ProgramsPackaging programs have come to the forefront of sustainability initiatives because of their wide-ranging impact on retailers, suppliers, and consumers; almost 35 percent of Retailers we surveyed indicated packaging as a top priority program. The amount of packaging waste generated is staggering - comprising 30 percent of the total solid waste in the U.S. - and much attention is being focused on packaging programs as responsibility for reducing this waste is beginning to shift to retailers and manufacturers. Amongst Retailers, some key packaging initiatives include:
• Product and distribution packaging reduction. Many retailers are reducing the use of primary and secondary packaging. Practices include selling products in bulk (e.g. produce), removing polystyrene trays, cling wraps and other unnecessary packaging. A leading European retailer pioneered the use of re-usable ‘green trays’ to replace cardboard boxes that are used to transport products. It also created an internal Packaging Strategy Group to reduce product packaging for key categories such as pizza and potato packaging, drink bottles, and spirit bottles, successfully eliminating 11,000 tons of product packaging a year.
• Using biodegradable or recycled packaging materials. Some retailers have begun using biodegradable packaging materials in product packaging (e.g. biodegradable shrink wrap, sandwich wrappers, fruit cartons), often made from a biodegradable polymer called PLA (polylactic acid). Retailers are also working towards eliminating PVC in packaging and using more recycled content in their packaging. For instance, a leading grocery retailer is using 50 percent recycled plastic for salad packaging and 30 percent recycled packaging for snack drinks. Some retailers are getting involved in packaging recycling. A leading grocery retailer launched a closed loop recycling program that will ensure that 35,000 tons of packaging, that might otherwise have been exported for recycling or sent to a landfill, will be converted into new packaging material.
• Supplier packaging requirements and audits. Retailers are beginning to require their CP suppliers to reduce product and distribution packaging. A leading mass retailer has unveiled a packaging scorecard that rates suppliers on packaging reduction efforts in nine key dimensions, including: greenhouse gas emissions during production, material value, product to packaging ratio, cube utilization, recycled content usage, innovation, amount of renewable energy used in production, recovery value of the raw materials, and emissions related to transportation of packaging. Finally, audits of suppliers are also being conducted.
“ By improving packaging on our toy line, we saved 3,425 tons of corrugated materials, 1,358 barrels of oil, 5,190 trees, 727 shipping containers, and $3.5 million in transportation costs.”
-Leading Mass Retailer
Section �: Industry Findings

2�
Water Conservation ProgramsOver 25 percent of the Retailers we surveyed indicated water conservation programs as a key priority. Some water conservation programs Retailers are engaged in include:
• Water saving systems and leak detection programs. Leading retailers are installing water saving systems such as low-volume aerators, dual-flush systems, and ice removal ramps to conserve water use. A leading specialty retailer installed flush-less urinals which helped save 40,000 gallons of water per year. A leading grocery retailer replaced water-cooled cooling towers with air-cooled cooling towers.
• Water recovery processes. Retailers are also making structural changes to store designs and processes in order to recover and reuse water from rainfalls, condensation, or truck washing. A mass retailer installed a storm water management program in its store design to capture and reuse water for irrigation and sewer systems. Another retailer built rain gardens to trap water for reuse in store facilities. A club retailer has installed processes to recover 75 percent of water used in its car washing systems.
• Supplier mandates. Some retailers are requiring their suppliers to reduce water usage in the growing, production, and manufacture of their products.
“ Implementing leak-detection programs in stores has led to a 50 percent reduction in water consumption.”
-Leading Mass Retailer
Emissions ProgramsEmissions programs have become high priority for many retailers due to climate change media stories as well as pending state/federal regulations governing emissions output by companies, and about 20 percent of retailers indicated emissions as a top priority program for them. In addition to store operations, emissions programs impact distribution processes, such as transportation modes and networks. Some sample Retailer emissions programs include:
• Improvements to fleets. Retailers are switching to new energy-efficient vehicles and making mechanical adjustments to their fleets to save on fuel usage. A leading mass retailer is adding a new fleet of hybrid trucks, while a European grocery retailer invested £2.8 million in double-deck trailers that can carry 67 percent more products per load. Other adjustments include mechanical adjustments such as: aerodynamic aprons to cut down wind resistance, adjusting engine idling times, and reducing weight of tractors and trailers to use less gas. Retailers are also switching to alternative energy sources for its truck, such as bio-fuels and liquefied natural gases, to reduce harmful emissions.
• Refrigeration equipment upgrades. Retailers are also switching refrigeration equipment to reduce or entirely eliminate ozone-damaging refrigerants. A mass retailer replaced environmentally harmful HCFC gases in 90 percent of its store refrigeration systems. Efforts have led to reduced CO
2 emissions by 30 percent per square
foot in some of its stores.
• Network optimization. Retailers are optimizing their transportation networks to streamline distribution and reduce fuel use. Retailers are analyzing their truckload factors, doubling their loads, and transporting goods on return loads. A leading retailer is working with 150 of its suppliers to create a highly efficient transportation network that minimizes empty truck loads. It also installed a continuous replenishment system to align stores, distribution centers, and suppliers to minimize unnecessary trips while maximizing product availability. Retailers are also exploring alternative transportation modes (rail, truck, sea) that produce fewer emissions. A leading European retailer is investing £3.2 million in a dedicated daily return train service which will save over 6,000 tons of CO
2 emissions a year.
Section �: Industry Findings

“ We estimate our transportation changes could save $277 million per year. These changes, which include adding 100+ new hybrid vehicles to the corporate fleet each year and adding Auxiliary Power Units(to our existing fleet), will eliminate 100,000 metric tons of CO
2 emissions and
10 million gallons of gasoline fuel.”-Leading Mass Retailer
Sustainable Agriculture/Organic FoodsAlthough not currently indicated as a top priority in our survey results, agricultural and food quality issues are at the heart of a food retailer’s business, and as public concern about the use of pesticides, GMO, and other potentially hazardous agricultural practices continues to grow, we believe sustainable agriculture and organic foods will become key priorities for both Retailers and CP companies. Our research indicates that Retailers are increasingly undertaking initiatives to meet growing consumer demand for sustainable and organic food products, including:
• Supplier standards, requirements, and audits. Retailers are becoming more discriminating in the quality of produce and other food products they receive from suppliers, requiring suppliers to meet certain standards in order for their products to be sold in stores. A leading specialty retailer has detailed lists of acceptable ingredients for every category of products, including produce, meat products, body care products, as well as packaged goods. Another leading grocery retailer has introduced a set of environmental standards that specifies shape, size, taste, variety, and shelf life requirements that applies to all fruit, vegetable, and salad suppliers. Over 7,600 farms in 41 countries are registered in the retailer’s program.
• Certification systems. As the demand for organic produce increases, some retailers are developing certification systems to ensure consistency and to guarantee that agricultural products are indeed grown according to organic standards. A leading specialty retailer helped formulate the National Organic Standards in the U.S., while a leading European retailer seeks independent third party certification for all of its organic products. Some retailers are also developing their own logos as stamps of approval to indicate that products have been responsibly sourced, taking into account fair trade issues, local sourcing, and other sustainable agricultural practices. There has also been a rise in ‘traceable’ products, whereby the end consumer is able to trace the origin of a product, such as coffee, to ensure that it has been responsibly sourced and produced.
• Farmer collaboration and support. To improve the supply of organic agricultural products, some retailers are collaborating closely with farmers, providing both technical training and financial assistance. A leading specialty retailer has pledged $10 million in direct loans to nurture and support local farmers. The retailer also offers vendor training programs to help farmers become certified suppliers.
• Organic food promotions. Nearly every retailer is increasing its offering of organic food products. However, since organic foods are often priced at a premium to non-organic foods, some retailers are trying to extend these offerings to non-traditional consumers by holding price reduction promotions or by subsidizing the prices. A leading European retailer held a promotion whereby organic product prices were reduced by 25 percent, and later permanently reduced those prices. Another leading European retailer invested £11 million in reducing organic prices.
• Private labels. Many retailers are beginning to introduce their own private-labeled organic products. Private label products are attractive to retailers because they enable retailers to earn a higher margin, while ensuring more control over a sustainable supply chain and production process. In addition, private label organic products reflect positively on a retailer’s brand image and aid in developing a closer and more direct relationship with the consumer. A leading specialty retailer owns 14 private-labeled organic/all natural brands. Another leading grocery retailer’s private label organic line has become so successful it is expanding into organic private-labeled baby products.
2�
Section �: Industry Findings

2�
Growing Retailer sustainability programs should drive sustainability efforts further in the Consumer Business industry. As CP manufacturers respond to Retailer requirements, as well as their own internal mandates, we anticipate that the level of sustainability activity in the industry will only continue to increase.
[For more information on Retailer programs, leading practices, and implementation considerations, please refer to Appendix E: Leading Practices. Additional detail on Retailer programs can also be found in the Compendium of Retailer Practices in Sustainability, available to GMA/FPA members.]
Sustainability MetricsWhile there has been significant activity in sustainability amongst Retailers, many of the programs are localized, decentralized initiatives that occur at the store level. As a result, measurements of program performance are often fragmented and not centrally coordinated. CP manufacturers are slightly ahead of Retailers in this aspect, due to the centralized nature of manufacturing standards and historical systems (such as the ISO 14000 standards) which have been supplemented to include environmental metrics. By and large, however, our research indicates that a commonly accepted set of metrics to measure sustainability performance does not exist.
Consumer Businesses are using a variety of metrics to measure sustainability performance. We surveyed how Retailers and CP manufacturers are currently measuring their performance on environmental sustainability programs. We discovered that companies are using a broad range of metrics to measure sustainable performance, despite similarity in the types of programs (e.g. energy conservation, recycling) they are measuring.
• Commonality in ‘what’ is being measured, but not ‘how.’ Most companies are measuring the same types of environmental information, such as levels of energy usage, carbon emissions, or water usage. However, there is very little commonality in how these levels are being measured with respect to both the actual calculation and the scope of activities included. Some companies focus measurement within their four walls whereas others include external impact along the value chain. With respect to carbon emissions reporting, one company we surveyed measured emissions reductions by the tons of carbon dioxide generated per unit, another offset measurement by including the number of cars taken off the road, while yet another captured offsets for the number of trees saved or planted.
• Not all metrics are relevant to all companies. The type of metrics each company collected depended on the type of programs it was engaged in (e.g. water, energy, biodiversity), which in turn, depended on the core business of the company. For instance, Retailers often had metrics on recycling, waste, and energy usage. Manufacturers had detailed metrics on water usage and emissions.
• Calculation methods vary. Even if the same metric is used, much variance came from the type of unit used to measure output. For instance, energy could be measured by kilowatt hours, mega joules, or giga joules. This tended to vary by geographic locations which have different metrics systems. How a particular metric is calculated and which factors are included are included in a particular formula also tended to vary.
Section �: Industry Findings
Representative Program Metrics
Energy Conservation/Use of Environmentally Friendly Energy Sources
Total energy consumed per year
Percent reduction in energy consumed per year
Energy consumed per unit
Energy consumed per truck of delivered products
Percent energy use from alternative sources
Percent energy use offset by alternative energy credits
Reduction of Harmful Air Emissions Total emissions generated per year, including direct or indirect GHG emissions, ozone depleting substances
Emissions generated per unit
Percent reduction in use of harmful refrigerants
Continued

2�
Representative Program Metrics
Water Conservation or Processing Total water consumed per year
Water consumption per unit
Wastewater generated per unit
Percent savings in water usage
Waste Reduction Total waste generated per year (e.g. hazardous, non-hazardous, solid)
Total waste generated per unit
Percent reduction in waste volume going to landfills per year
Percent reduction in waste produced during operational processes
Total waste composted per year
Product and Packaging Recycling Total waste recycled per year
Recycling Rate (percent of waste recycled per year)
Percent of waste sold for reuse per year
Percent of recycled content in products
Eco-system and Land or Ocean Biodiversity Preservation/ Natural Resource Conservation
Number of new locations that are ‘brownfield’ developments
Area of land disturbed
Area of land protected
Area of land restored
Percent of products sourced responsibly from non-endangered ecosystems (e.g. Forest Stewardship Council, Marine Stewardship Council)
Sustainable Agriculture/ Livestock Care Number of suppliers providing organic or sustainable products
Percent or number of products offered that are organic/sustainable (including private label)
Percent market share in organic products
Amount of store space dedicated to sale of organic products (in sq. ft)
$ spent on promoting organic products from sustainable agriculture
Number of farmers helped or supported
Reduced Packaging/ Increased use of Biodegradable Packaging
Amount of packaging materials used by weight or volume
Percent of suppliers meeting scorecard or other formal sustainable packaging requirement
Percent reduction in packaging as a result of retailer or retailer-supplier efforts
Product/package ratio
Percent recycled content of distribution or product packaging (e.g. pallets, crates)
Number of products with sustainable packaging (e.g. biodegradable packaging)
Section �: Industry Findings
At this stage, there are no commonly accepted metrics for measuring sustainability performance in the Consumer Business industry. To the extent that the industry can agree on representative and meaningful metrics, measurement methodologies, and standardized calculations, the Consumer Business industry would be better positioned to advance its performance benchmarking efforts.
[For a more information on how Consumer Businesses are measuring sustainability, please refer to Appendix B: Sustainability Metrics.]
Regulatory TrendsAnother key driver of sustainability activity in the Consumer Business industry is pending regulations in the area of environmental sustainability. At the request of the GMA, Deloitte Consulting teamed with regulatory experts and law firms to assess regulatory activity. Perhaps the most challenging finding was that the regulatory activity evolving most quickly at the municipal and state level which results in burdensome and costly efforts to remain current with respect to identifying, monitoring, tracking, and ensuring compliance to regulatory requirements. Based on the regulatory and legal analyses, as

28
well as Deloitte’s professional experience, near-term local, state, and federal regulatory activity with respect to environmental sustainability may be categorized in the following priority areas:
• Transparency and Governance of Environmental Performance
• Natural Resource Conservation
• Product Stewardship (e.g. Managing harmful materials, Nanotechnology, Genetically Modified Organisms)
Transparency and Governance of Environmental PerformanceGlobalization, increasing environmental regulation, energy and water scarcity, and shareholder demands for stronger governance resulted in a 2004 Congressional-initiated investigation of public company disclosure of environmental matters. The investigation concluded with recommendations that the Financial Accounting Standards Board (“FASB”), the Securities and Exchange Commission (“SEC”), and the Environmental Protection Agency (“EPA”) align to ensure more transparent disclosure.
Following this investigation, the FASB has issued subsequent accounting pronouncements and is drafting additional guidance to provide more clarity on environmental matters in public accounting, the SEC is undertaking investigations specific to environmental representations in public financial statements, and the EPA is actively developing performance metrics, issuing certifications for leading programmatic efforts, and undergoing an expansion of its regulatory administration.
In response, many Consumer Business companies have begun issuing sustainability reports on a voluntary basis. The increased number of reports and topics discussed is in direct response to demands by shareholders, investment companies, business partners, consumers, and regulators in the U.S. and abroad. Response to these resolutions can be challenging as shareholder and stakeholder tolerance for ‘greenwashing,’ or disclosing only the positive attributes of sustainability performance, are not acceptable.
Natural Resource ConservationGrowing public awareness and concerns over resource scarcity caused by climate change and U.S. energy security and interdependency have prompted a number of policy reactions with respect to managing, reducing, and reporting greenhouse gas emissions at the municipal, state, federal, and international levels. Most indicators forecast a federal cap and trade system to reduce emissions of carbon dioxide.
Climate ChangeCurrently in the U.S., the most significant activity has been at the state level, where states are proposing, implementing, and enforcing their own versions of climate change legislation or are banding together to form regional efforts. The actions across states are relatively similar and generally include:
• Identifying sources of greenhouse emissions
• Preparing greenhouse gas inventories
• Establishing advisory groups and legislative commissions
• Setting emissions targets
• Creating climate change action plans
States are also requiring that utilities provide a designated amount or percentage of power from renewable sources as a portion of their overall provision of electricity.
Section �: Industry Findings
Alaska
Completed Climate ActionsStates with Greenhouse Gas Inventories
States with Greenhouse Gas Inventories (left) and States with Completed Climate Action Plans (right) (source: Pew Center for Climate Change)

2�
However, several states have moved more rapidly and are launching carbon regulation within the next year. While focused on the utilities, these carbon regulations could impact Consumer Products manufacturers particularly in the areas of energy prices and reliability.
New England and Mid-Atlantic states forged The Regional Greenhouse Gas Initiative (“RGGI”), the nation’s first mandatory cap-and-trade program for carbon dioxide. The program, led by New York State, has a launch date of January 1, 2009. Additional states participating include Maine, New Hampshire, Vermont, Massachusetts, Connecticut, New Jersey, Delaware, and Rhode Island. Additionally, Pennsylvania and Maryland may also join the initiative. These states collectively are the 11th largest emitter of all emissions in the world and account for nine percent of U.S. emissions. The reduction goals are to stabilize emissions at current levels through 2014 and then reduce emissions by 10 percent by 2019.
While these programs target mostly greenhouse gas emissions, a number of programs has been approved or is being considered across the U.S. that have potential impacts on the Consumer Business supply chain. RGGI is spurring other state and regional efforts including the West Coast Governors Global Warming Initiative (Oregon, California, Washington, New Mexico, and Arizona) and the subsequent Western Regional Climate Action and Southwest Climate Change Initiatives which are modeled off the RGGI platform. Governor Schwarzenegger has set aggressive targets of reducing green house gas emissions to 80 percent below 1990 levels by 2050. California’s commitment is evidenced through application of the RGGI concept to the second wave of emitters by passing bills and regulations pertaining to automobiles, green building, and energy efficiency. While the regulatory efforts are being challenged by industry, Consumer Products manufacturers will have to understand the regulatory activities that may impact distribution fleets or operation. CP manufacturers should take advantage of tax and regulatory incentives to minimize the cost impact of complying as other states are demonstrating a willingness to follow California’s example.
Within the broader trend of state-led initiatives and programs, local communities and cities have also enacted policies and programs of their own to address specific concerns including health, quality of life and economics. In the U.S. Mayor’s Climate Protection Agreement, over 330 U.S. mayors committed to exceed Kyoto Protocol targets for the U.S. – a seven percent reduction from 1990 levels by 2012.19
While limited federal legislation has been passed to-date, the recent U.S. Supreme Court ruling requiring the U.S. EPA to administer regulation of carbon emissions and indications by the U.S. Congress and the White House suggest that in the near future, these issues will be legislated. Both the Congress and Senate are considering several proposals for near-term legislation.
Water Quality and ConservationThe Environmental Protection Agency cites water as the natural resource where the most severe environmental problems will most quickly develop. Both water scarcity and quality are of considerable concern as only ten percent of wastewater is treated before it re-enters water bodies globally. While some believe water to be the ultimate renewable resource, others are concerned with the infrastructure for and impacts of water renewal. Investments in technologies such as desalination and water purification can renew private and commercial depletion of fresh water sources but result in a sludge by-product that requires landfill disposal deemed hazardous in certain locales. The question of who will make the investments in infrastructure and technology necessary to renew water at scale and when and whether the renewed water source will be available when needed has yet to be answered.
While developing nations are most noticeably subjected to water scarcity, the U.S. is also experiencing shortages of this valuable natural resource. The Great Lakes are now at their lowest levels in history. The Colorado and Rio-Grande, two of the largest rivers in the U.S., are irreversibly drying. In fact, the 1450 mile-Colorado River is one of North America’s most endangered water system. The Colorado, which feeds seven states and is critical to primary needs such as hydro-electric generation, farmland irrigation, and the provision of municipal water supply to numerous cities and populations within the seven states is now only 1/10th of its original size.
Additionally, North America’s largest aquifer, the Ogallala, has been depleted by a volume equal to the annual flow of 18 Colorado Rivers. The Ogallala Aquifer supports three-quarters of the world’s wheat market and feeds farming, industrial, commercial and residential uses to seven states, from South Dakota into Texas and New Mexico (source bbcnews.com).
19http://www.seattle.gov/mayor/climate/
Section �: Industry Findings

�0
While states and municipalities are managing water use, the court system has served as the first mechanism for addressing access to and use of water resources in the U.S. Montana, Wyoming, South Dakota, Kansas, and Nebraska are all involved in court actions regarding water use and appropriations, and Georgia, Florida and Alabama have been trying to negotiate interstate water compacts regarding use since the 1990’s. States supplying California, Arizona, and Nevada are starting to reconsider interstate water trade as their own states face critical scarcity issues going forward.
Legislative actions are being considered by international, state, and local governments to regulate water usage in products and operations and may come in the forms of water use bans. Retailers may eventually be mandated (by federal, state, and local law) to carry low water use products or to utilize water conserving technology. Additionally, tradable water markets are being considered by some states in the U.S. and abroad to more accurately reflect the cost of water use.
Product StewardshipRecent issues related to the safety of pet food, spinach, and toys have demonstrated the challenge of ensuring products are safe for people and the environment despite commercial and regulatory programs designed to reduce these risks. These incidents are increasing government focus in the areas of materials management. This expansion of product-safety laws in the last few years mirrors a similar growth in OSHA and EPA laws passed in the late 80’s and early 90’s but that now serve to address all stakeholders in the supply chain—from suppliers to consumers. Consumer Products manufacturers may want to examine the electronics, automotive, and building industries which have already been subject to the consequences of heavy regulatory activity in both the U.S. and abroad.
Materials deemed or perceived to be harmful to humans or the environment are receiving increased scrutiny from not only stakeholders but also from the U.S. and foreign governments. Many governments are now actively mandating the tracking and reporting of certain materials in their countries and subsequently banning certain materials from products, packaging, or processes. Retailers and Consumer Product companies alike will have to increase their focus on tracking materials, percentage content, locations, and/or applications used in distribution to ensure they are not in violation of U.S. or foreign laws. Banned materials will have an impact on procurement and distribution, requiring a flexible product lifecycle and heightened attention to trending regulatory proposals and interest. Further, regulatory efforts are being pre-empted by Retailers who are requesting complete formula information for products containing chemicals, pesticides, and aerosols or other hazardous materials in anticipation of the regulatory activity and/or to achieve higher standards of employee and consumer health and safety.
Regulations are emerging to limit the use of nanotechnology and chemicals deemed harmful to humans may foreshadow subsequent efforts. The Environmental Protection Agency expects producers and users of nanotechnology and harmful chemicals to apply “Pollution Prevention Principles” to protect both humans and the environment and is relying on existing U.S. federal statutes to provide some legal basis for their regulation including:
• Toxic Substances Control Act (“TSCA”)
• Food and Drug Cosmetic Act (“FDCA”)
• Occupational Safety and Health Act (“OSHA”)
• Clean Water Act (“CWA”)
• Clean Air Act (“CAA”)
• Resource Conservation and Recovery Act (“RCRA”)
Consumer Products companies will have to protect proprietary business information, anticipate supply chain and product life cycle impacts, and ensure technology to support these demands. They will also need to address labeling and disclosure requirements for the use of products containing nanotechnology, GMOs, and processes or facilities using certain chemicals.
CP manufacturers are particularly vulnerable to the potential changes in regulations and requirements due to their reliance on a broad range of activities and participants in their supply chain. Changes in the cost of commodities and the competitive nature of their industries allow little flexibility for the modifications new regulations may require.
Despite the level of activity in the industry today, unless the operational and regulatory issues are acknowledged and addressed, Consumer Businesses will be unable to take sustainability efforts to the next level. Based on the research findings, a significant effort is required today to ensure business model readiness for tomorrow.
[For additional detail on pending regulations and potential impacts on CP companies, please see Appendix D: Regulatory Assessment.]
Section �: Industry Findings

��
The decision to pursue a sustainability program is relatively simple, given the influences in the marketplace. Balancing the opportunities and risks of a sustainability program poses a significant challenge requiring fundamental business model innovation.
The research findings indicate that the current business model has evolved in response to existing tensions:
• While 17 percent of consumers are ‘green motivated,’ the majority are still price sensitive and focused on convenience. Trends in convenience and health have resulted in a proliferation of single serving packages, meals-to-go kits, and limited calorie snack packs, all of which drive industry growth but increase packaging waste.
• Supply chains have become global and complex due to cost-led sourcing. Today, the common food item travels over 1500 miles on average. While global supply chains may reduce input costs, the extra transport required to move products and materials results in higher energy use and emissions output.
• Growth opportunities are primarily in emerging markets, increasing supply chain complexity. Additionally, the social and environmental impacts of a business presence can be magnified in emerging markets due to poor environmental infrastructures.
Evaluating business model readiness would require gearing up to address various business and environmental scenarios. While we are not validating or predicting that these scenarios will happen, there is growing consensus amongst experts that at least some of the following could come to realization in the near future:
• Green consumers may increase from an existing 17 percent to 40 percent of the overall market. In addition to the 17 percent of ‘green motivated’ consumers, another 21 percent are ‘Naturalites’ who are interested in natural food and beverage products. A portion of this Naturalites segment may become ‘green motivated’ as consumer awareness continues to rise driven by increasing media, shareholder, government, and NGO attention.
• Access to critical raw materials may be regulated or restricted. Restrictions around water usage could be mandated by state governments in the near future. In addition, as more corn crops are diverted toward ethanol production, corn prices may continue to rise, impacting manufacturers that use corn, corn syrups, or corn feed as key input ingredients.
• Retailers may adopt broader and stricter sustainability standards. Following Wal-Mart’s lead, other retailers may also implement more aggressive sustainability standards and requirements. A few US retailers have already unveiled packaging requirements. Leading European retailers have adopted detailed requirements on ethical sourcing, agricultural standards, and packaging, driven by consumer demand and as well as by regulatory requirements.
• Government mandates on performance standards could become significantly more stringent. California has legislated a 25 percent mandatory reduction in carbon emissions by 2020, while Hawaii, Washington, and the nine Northeast states that make up the Regional Greenhouse Gas Initiative have also passed similar laws. Other state legislations, as well as federal laws, may follow.
• Consumers may not be willing to pay for higher-priced sustainable products after the higher cost of natural resources is factored into the supply chain. While demanding green products, many consumers may not be ready to pay for them.
Ensuring Business Model Readiness
Section �: Ensuring Business Model Readiness

�2
In our view, current sustainability efforts do not appear to be sufficient to respond to any of these potential scenarios.
Fundamental business model changes and innovation will be required to prepare for these scenarios and leverage opportunities arising from sustainability. Preparing for the business model of tomorrow requires companies to balance economic benefits with environmental benefits while thinking beyond existing value chains, incremental product and service changes, and limited collaborations with external parties. These business model changes and innovation would demand:
• Optimizing operations and value chain to achieve cost, service level, and sustainability objectives. Breakthrough thinking will be needed to adapt existing operational strategies and to develop new supply chains that achieve sustainability goals while optimizing cost and service levels. It will involve making additional collaborations upstream and downstream in the value chain with both existing and indirect partners.
• Innovating products and services with a broader lifecycle view to balance market and environmental impact. Pursuing broader product stewardship policies will be increasingly important. Product innovation and design will need to consider a much broader lifecycle, from the use of alternative inputs to designing for post-consumption (e.g. recycling). Use of materials that are biodegradable, reusable, and recyclable will be demanded by a broader set of stakeholders. In addition, the post-consumption impact of products containing harmful materials needs to be carefully assessed. Finally, consumer awareness and education will take on a much more significant role in the overall product stewardship strategy.
For example, a leading Consumer Products company has developed products and services that balance market and environmental needs by:
• Incorporating lightweight, biodegradable, and alternative materials into product and packaging designs
• Designing for disposal with an understanding of consumer usage and disposal patterns in mind. For instance, if consumers fail to recycle bottles, companies could consider eliminating bottles entirely and switching to beverage flavoring packets
• Engaging scientific and academic institutions to conduct environmental product lifecycle assessments to measure the full post-disposal impact of a product on the environment over time
• Setting specific environmental impact standards for product launches (e.g. a product should be launched only if it passes a ‘zero impact’ test)
For example, a leading U.S. Consumer Products company has integrated sustainability into its operational model by:
• Conducting focus groups with consumers and interest groups to identify sustainable product opportunities
• Developing a tool to help marketers assess the social, environmental, and economic impact of new products
• Making environmental performance improvements to the supply chain based on external audit results by NGOs
• Engaging scientific institutions and competitors to help develop standards and influence regulatory agendas
• Leveraging non-traditional collaborations to accelerate knowledge building, innovation, and risk management. Alliances with the scientific community and non-traditional business partners to identify technological advances related to sustainable products and practices will be critical to keeping ahead of disruptive/non-traditional competitors. Engaging the government to ensure adequate infrastructure to support various environmental programs and to offer incentives to businesses and consumers will be crucial. Working with NGOs to audit programs and identify areas for improvement will help accelerate success.
Section �: Ensuring Business Model Readiness

��
Value proposition
Market Segment
Revenues
Costs
Supply Side Value Chain
Demand Side Value Chain
Employees
Value proposition
Market Segment
Revenues
Costs
Supply Side Value Chain
Demand Side Value Chain
Employees
Product Disposal
Non-Traditional Competition
Government
NGOs
Scientific Community
Shareholders
Business Model Considerations
Today
Business Model Considerations
Tomorrow
For example, a leading Consumer Products company has engaged in key collaborations to improve sustainability practices by:
• Engaging suppliers and research centers to identify innovations in lightweight, biodegradable, and alternative materials
• Working with Retailers, NGOs, and marketing firms to educate consumers on recycling and reuse practices
• Collaborating with state governments and waste management organizations to increase the number of curbside recycling programs and state bottle deposit programs
• Collaborating with energy and waste management companies on alternative ways to use waste and recycled matter as energy sources
Section �: Ensuring Business Model Readiness

��

��
The Path Forward: Integrating Sustainability into the Business Model
Section �: The Path Forward: Integrating Sustainability
into the Business Model
Critical Success FactorsSustainability is a strategic business issue and, to be successful, leading companies need to integrate it into their core business models. There is clear evidence that companies approaching sustainability through ad hoc programs or isolated initiatives do not achieve the desired outcomes and goals as an integrated approach.
Sustainability issues are complicated and ever-evolving due to competing priorities of shifting consumer demand, emerging scientific findings, and regulatory changes. Sustainability, however, should not be treated as an academic exercise. Sustainability issues cannot be resolved with just the latest scientific research, deliberations over environmental predictions, or by supporting the latest technologies. Our findings indicate that companies need to focus on certain critical success factors. Importantly, the sequence of the specific actions in the pursuit of sustainability is crucial to the success of a long-term sustainability initiative. Based on our research, we found that leading companies succeed by:
• Aligning sustainability and business strategies
• Integrating sustainability into operations and processes across the value chain
• Structuring non-traditional collaborations and extending existing collaborations
• Setting up a governance structure that is supported by the right infrastructure
• Leadership Commitment• Vision• Drivers• Goals and Priorities
• Baseline and Benchmarks• Value Chain Implications• Program Selection and Business Case• Metrics, Policies, and Procedures
• Upstream Collaboration• Downstream Collaboration• Measurements and Incentives• Non-traditional Collaborations
• Dedicated Resources• Governance Structure• Central Tracking and Reporting• Best Practice Sharing
Sequence of Efforts
Strategic Alignment
Operational Integration
Collaboration
Governance and Infrastructure
A Structured Approach to Implementing Sustainability
Key InputsCritical Success Factors

��
Strategic AlignmentSuccessful companies consistently defined sustainability as a top five strategic priority. In the majority of these cases, the CEO is directly involved in setting the sustainability agenda and vision. Additionally, these companies have implemented sustainability into their brands, company strategy, and operations. They view sustainability as an integral part of the overall company mission, and in the words of one survey respondent: “…we have worked to assure that sustainability is woven into the very fabric of the company.” These leading companies:
• Have proactive and committed leadership
• Strive to develop a culture of sustainability
• Identify motivations and drivers for success
• Set achievable goals
Vision
Drivers
Goals
PrioritiesLeadership
Commitment
Gain leadership commitment. The most successful sustainability programs have support and leadership from the highest levels of management. In these cases, the CEO and Board have direct and proactive involvement in setting the sustainability agenda and vision. Rather than charging the task of sustainability to a mid-level manager to implement in an isolated fashion, senior executives are held accountable for implementing sustainability programs and sustainability is a key factor in their performance measurement. In our research, we have observed that leadership commitment is critical to establishing a strong sustainability vision, understanding competing drivers and priorities, and establishing realistic, achievable goals.
Develop a ‘sustainability culture’ and vision. Leading companies have a clear sustainability vision for the company and drive this vision by instilling ‘sustainable values’ within their culture. These companies set firm-wide goals that involve commitment and action from all levels of employees. They hold regular meetings and updates on sustainability issues. They invest in training and education of employees, suppliers, and consumers. They also offer incentives for sustainable behavior and actions. All these elements work together to create a sustainable culture.
Align drivers and motivations with organizational values and beliefs. Leading companies understand the drivers and motivations of sustainability, and incorporate these into the firm’s overall business priorities. While motivations for companies included retailer and consumer needs, competitive positioning, cost reduction, regulation, CEO/Board goals, or responsible citizenship, no single factor was consistently mentioned as most important by our survey and interview respondents. Leading companies were consistent in stating that short term ROI was not a particularly important driver of sustainability, but rather, taking a longer term perspective on sustainability was a key driver of success. However, many CP companies stated that heightened Retailer (especially Wal-Mart) priorities and requirements in the area of sustainability have been a call to action and a key driver of greater structure and discipline around sustainability efforts.
Section �: The Path Forward: Integrating Sustainability into the Business Model

��
Set goals and priorities. Once drivers and motivations are understood, and stakeholder demands, organizational values, and strategic visions are assessed, leading companies set go-forward goals that will enable them to achieve the sustainability vision. Goals may be very specific, such as “We will reduce packaging across our global supply chain by 5 percent by 2013,” or more general, such as “We will be a zero waste company.” In our research and experience, we found that specific goals with set timelines, associated metrics, and leadership accountability were the most effective. To drive the company towards achieving these goals, company leadership allocated economic resources, hired key skill sets, created new collaborations, and helped sustainability teams navigate internal organizational boundaries to achieve their goals.
Section �: The Path Forward: Integrating Sustainability
into the Business Model
Case Study: Strategic Alignment
In 2005 alone, Americans were estimated to have consumed more than 50 billion single-serving plastic bottled beverages, of which only about 20 percent were recycled.
Embarking on a sustainable packaging program, however, involves a wide range of considerations across the value chain. For instance, a manufacturer considering incorporating more recycled content into its bottles must consider several key questions, including:
• How does using more recycled content in plastic bottles fit with the firm’s overall strategy and goals?
• Have all competing drivers and priorities been considered? Will the firm invest in sustainable bottling production facilities and materials at the expense of potentially higher costs and changes to manufacturing processes?
• What type of leadership support is needed for program success?
Operational IntegrationInvestments in programs can be significant - a leading European retailer is investing £200 million over the next five years in an ‘eco plan,’ while a U.S. retailer plans to invest $500 million each year in technologies to reduce greenhouse gas emissions alone.20 Given the sizeable investments, leading companies are thorough in considering the operational implications of sustainability across the supply chain and product lifecycle. They are methodical in:
• Understanding the ‘as is’ environmental footprint and identifying key measurement metrics
• Evaluating impacts of sustainability programs on the entire value chain
• Prioritizing programs to focus on and building the business case for them
• Track programs aggressively through key performance indicators
20http://www.sustainablebuildingcentre.com/forum-topic/wal_mart_s_green_impact
Operational Model
Supply Chain Demand Chain
Science and Technology Regulations
Supply Chain• Procurement• Manufacturing• Distribution• Sales/Retailer relations
Demand Chain• Consumer demand• Product innovation cycle• Brand• Price
Science & Technology• Evolving technologies• Materials innovation• Alternative energy (e.g. ethanol, wind)
Regulations• State and federal regulations• Reporting requirements and risk• SEC/Congress investigations• NGO activity

�8
Section �: The Path Forward: Integrating Sustainability into the Business Model
Develop a baseline and identify metrics. As an initial step, firms develop an understanding of the ‘as is’ situation by measuring their current performance on energy usage, water usage, emissions generation, waste production, recycling, etc. Developing this baseline will require looking upstream and downstream along the value chain to understand resource usage and emissions footprint. Leading companies also define the future state vision and assess gaps.
Understand the operational impacts across the value chain. Leading companies methodically assess the impact of these programs on their full value chain, from product design to sourcing, manufacturing, distribution and sales. Leading companies also consider an additional piece of the value chain, consumer usage and disposal patterns, taking a lifecycle view of products. Products are designed for disposal or for recycling, based on known consumer behavior. Leading companies are cognizant that actions squeezing one part of the value chain may have repercussions on other parts, both to upstream suppliers and downstream customers/consumers.
Select a program and build a business case. A business case and operational model is built that thoroughly evaluates the potential costs and benefits associated with the supply chain, the demand chain, emerging technology and new regulatory requirements.
We highlight some examples of the key considerations associated with a sustainability program below:
• Supply chain: Sourcing new biodegradable/recycled or non-hazardous materials; resource maps to understand supply and demand of limited raw material inputs (corn, water, oil); redesigning supply chain and distribution networks; investments in energy-efficient equipment, hybrid trucks, waste management tools (e.g. recycling balers)
• Demand chain: Integrating evolving consumer demand and behaviors into new product innovation; evaluating brand impact of green products; understanding impact of new/limited material inputs on product prices
• Technology: Investments in alternative energy sources or energy credits; supply of new packaging materials; weighing costs/benefits of emerging and evolving technologies
• Regulatory: Ensuring operations are compliant with emerging state and federal regulations on water access, carbon emissions, hazardous materials, and product labeling; implementing risk and compliance procedures and audits; collaborating with NGOs
Develop key performance indicators to track and measure progress. Leading companies make sustainability programs real and accountable by implementing metrics and measurement systems to track performance. Company-wide Environmental Performance Indicators (EPIs) are often implemented to centrally collect information on a variety of metrics including energy usage, water usage, waste generation, recycling rates, and emissions output, amongst others. Target goals may be set for each of these metrics for up to five years, and performance should be measured against the goals year over year. Report cards or scorecards may be developed to ensure accountability. Third party audits can also be used to authenticate performance reporting.
Case Study: Operational Integration
Operationally, using recycled content in bottles could impact nearly all areas in the supply chain:
Design: • Will new bottles need to be designed to accommodate recycled content? • How might recycled content bottles interact with product content?
Procurement:• How and where can recycled bottles/resins be sourced?• How will emerging market demand (e.g. China) for recycled bottles impact supply and pricing?
Manufacturing: • Will new production processes be needed?• What types of investments are required for new or retrofitted equipment?
Distribution: • How will truck weight and load factors change?• Will new cases/pallets be needed to protect bottle integrity?
Are new bottles strong enough to withstand warehouse processes?

��
CollaborationLeading companies take a full lifecycle view of sustainability, one that incorporates enhanced collaboration processes with a much broader group of stakeholders. Leading companies create innovative business models by:
• Collaborating upstream with suppliers
• Collaborating downstream with retail customers, consumers, and waste management
• Collaborating with the broader society: the academic community, scientific community, NGOs, and regulatory bodies
• Aggressively measuring and tracking collaborative efforts to ensure success
Section �: The Path Forward: Integrating Sustainability
into the Business Model
Case Study: Operational Integration (continued)
Sales & Marketing: • How do new bottles stack and look on display? What is impact on brand image?• Are consumers willing to pay for it?
Consumer Usage & Disposal:• What is consumer reaction to look-and-feel of new bottle?• Will additional consumer education on proper usage and disposal be needed?
Product Design
Procurement (�st, 2nd tier)
Manufacturing
Distribution
Marketing & Sales
Consumer Usage & Disposal
Shareholders
Government Infrastructure
Scientific Community
NGOs
Sustainability: A Collaborative Effort
Upstream collaboration with suppliers. Leading sustainability programs support intimate collaboration between suppliers, manufacturers, and retailers. Leading retailers actively engage CP manufacturers for answers to sustainability issues, and in turn, leading CP manufacturers look to their suppliers (e.g. packaging manufacturers) to generate innovative solutions. Companies institute formal collaborative practices, such as formal supplier requirements and audits. Companies also employ informal practices, such as sponsoring conventions and working groups to share best practices. Collaborations are instituted with first-tier, second-tier, or third-tier suppliers.
Downstream collaboration with retail customers, consumers, and waste management. Leading companies invest to understand the customer and consumer side of the equation. The entire product lifecycle is considered, from the consumer’s demand for the product to the retailer’s and consumer’s roles in disposing and recycling of the product. Leading companies engage retail customers and consumers in the product design process, taking into account consumer behavior patterns. They also educate the consumer on proper usage. Finally, collaborations with waste management companies or the government to bolster the recycling and waste management infrastructure are beneficial.

�0
Collaborations with key stakeholders such as consumers and waste management companies may also help companies design for disposal. Manufacturers who are able to design for ‘recyclability’ by using particular resin types help increase the amount of recycled content available for future reuse.
Collaboration with universities, the scientific community, and NGOs. Leading companies partner with the academic, scientific, and regulatory community/NGOs to develop innovative sustainable solutions that are advantageous to both the company and for the broader society. Universities and scientific communities are the thought leaders and innovators in sustainability. Collaborative efforts with these innovative leaders allow companies to take advantage of the latest ideas from think tanks and locate improvement opportunities. Collaborations with NGOs help companies keep abreast of regulatory changes and also provide technical guidance and resource knowledge. Many companies have environmentalists on their sustainability committees or advisory boards to ensure that they are informed of the latest issues and that leading-edge expertise is available to readily develop solutions. Such collaborations also enable companies to build allies in the community.
Measurement and tracking. To track the success of collaborative efforts, leading companies develop measurement systems and tools. Scorecards are used to communicate requirements and assess performance against goals. For instance, Wal-Mart’s packaging scorecard evaluates a supplier’s performance against nine key metrics. Specific goals and calculation methodology can also be included as part of the scorecard. Other measurement and tracking tools include IT systems to collect and centralize data. Measurement and tracking systems can be used both within the organization to manage cross-functional collaboration or externally to manage communications with customers and suppliers.
Case Study: Collaboration
In the US in 2005, there were only 8,550 curbside collection programs, slightly down from 8,875 in 2002. Only 20 percent of plastic beverage bottles are currently recycled. A Manufacturer should key consider questions such as:
• What types of collaborations with suppliers and the scientific/academic community are needed? How to boost innovation for new resin materials and recycling processes?
• Could collaborations with government bodies bolster the current recycling infrastructure and help increase bottle collection?
• What types of collaborations with other manufacturers could be structured?
• How best to collaborate with consumers and the broader community to drive recycling rates?
Section �: The Path Forward: Integrating Sustainability into the Business Model
Governance and InfrastructureSustainability is a firm-wide effort. A robust governance infrastructure both supplements and drives a ‘sustainability culture.’ Leading companies build a sustainable organization by:
• Investing in dedicated full-time resources and employee training
• Creating a centralized governance infrastructure to manage program execution
• Developing incentive systems and metrics to encourage sustainable behavior
• Sharing best practices in sustainability to ensure continual improvement
Company organization and infrastructure will depend on the maturity of the company’s sustainability program and the nature of its business model (e.g. regional vs. global business, diversified product line vs. specialized, channel strategy).

��
Allocate dedicated resources. In leading companies, dedicated full-time resources are allocated to sustainability programs. These dedicated resources, knowledgeable in both sustainability and functional roles, sit within corporate and operational functions, and play a significant role in drafting and implementing programs. Leading companies also invest in regular employee training on sustainable issues. However, sustainability programs for these firms are not just education-focused (e.g. reading articles about environmental issues, attending conferences). Rather, education is balanced against actionable programs with goals, metrics, and performance measurement.
Select the right governance infrastructure. Leading companies have a robust governance infrastructure to coordinate and monitor the execution of sustainability programs. Many companies have a centralized sustainability organization headed by a Chief Sustainability Officer, who has accountability for implementing all programs and reports to the CEO or the Board. In addition, a core sustainability team is comprised of leaders from all relevant functions (e.g. heads of product development, procurement, distribution, marketing and sales), who are accountable for executing sustainability programs within the function. To ensure that the firm is compliant from an enterprise-wide perspective and to control external communications, other groups such as compliance, legal resources, public relations, ethics, and quality assurance professionals may also be involved. However, leading companies do not merely comply with regulation - they understand the go-forward regulatory environment and can drive policy in this area. Some leading companies have an internal sustainability group that coordinates activities and controls communications, both internally and externally.
Centrally coordinate activities. In large or global companies, a centrally managed infrastructure is especially important to avoid repeated efforts, to coordinate resources, and to control communications, both internally and externally. In some companies, we have observed as many as seven or eight different groups working on multiple energy initiatives simultaneously. Centrally monitoring energy usage and coordinating activities internally could achieve cost savings by reducing overlapping/duplicate energy bills and leveraging scale when making purchases.
Share and track leading practices. Sustainable companies develop a knowledge base of leading practices and lessons learned. They share best practices with each other and with their customers and partners. Lessons and best practices are formally documented into repositories accessible by employees, and that are used to inform future decisions and accelerate future sustainable development efforts.
Training & Education
Facilities Management
Ethics
Compliance & Reporting
Legal
Public Relations
CEO, Board Chief Sustainability
Officer
Procurement
Design & Mfg
Marketing & Sales
Distribution
Governance Structure
Section �: The Path Forward: Integrating Sustainability
into the Business Model

�2
In conclusion, the previous page mentioned four critical success factors are important for creating a successful program. Following the four steps in sequence will enable companies to establish a strong foundation for a sustainable business going forward.
Case Study: Governance & Infrastructure
A sustainable packaging program involves multiple departments and groups, including procurement, operations, distributions, marketing, and sales. To help ensure implementation success within the organization, a Manufacturer should consider some key questions such as the following:
• Does the firm have dedicated personnel knowledgeable about sustainable packaging and recycling processes?
• How to involve multiple department heads while centrally coordinating activities?
• What types of metrics should be used to measure how much material, energy, and emissions have been used or saved as a result of the program?
• What types of processes and procedures are need to continually track and check progress over time?
• How are metrics, successes, and lessons being mined for future sustainability efforts?
Section �: The Path Forward: Integrating Sustainability into the Business Model
21http://www.sustainablebuildingcentre.com/forum-topic/wal_mart_s_green_impact
Concluding ThoughtsSustainability is not a fad and is unlike any business issue Consumer Businesses have encountered in the past. There has been a 300 percent increase in climate change regulations over the past five years. The segment of ‘green buyers’ has grown to 17 percent. A leading European retailer is investing $400 million over the next five years on sustainability initiatives, while Wal-Mart plans to invest $500 million each year in technologies to reduce greenhouse gas emissions alone.21 These types of investments indicate that the Consumer Business industry recognizes the importance of sustainability as a core business issue. Unlike other business issues in the past, however, sustainability is all-encompassing – involving shareholders, consumers, retailers, suppliers, employees, NGOs, state and federal governments, and scientific and academic institutions.
Consumer Businesses need to consider how their core business models, priorities, and focus areas will change, despite uncertainties about how sustainability will evolve. As sustainable technologies emerge and regulations evolve, it is becoming increasingly difficult for companies to navigate the uncertainties and constraints. Investments in ethanol today could have adverse consequences for agriculture and ecosystems tomorrow. Similarly, recycling infrastructures and programs of today could later be rendered impractical by advancements in the fields of environmental design or biotechnology. In addition, leading companies should take a full lifecycle view of sustainability, and understand that changes in one part of the value chain could negatively impact another. Taking a full lifecycle view helps them define sustainability priorities and focus areas that consider the various uncertainties and constraints.
Retailer requirements (specifically Wal-Mart) are a key influencer, but not the primary driver. Although the initial premise of this study was that Retailers were the driving forces of the sustainability movement in the Consumer Business industry, our findings indicate that the majority of retailers have not been as proactive as Wal-Mart. However, both CP companies and Retailers are beginning to actively integrate sustainability into their organizations.
The decision to undertake sustainability is a relatively easy one. However, implementing sustainability in a way that balances the opportunity and risk is a significant challenge requiring fundamental business model innovation. Breakthrough thinking is necessary to incorporate sustainability into every aspect of the business model. Leading companies factor in changing technologies, emerging consumer demands, and evolving regulatory requirements into their sustainable strategies and operations.

��
Companies are focusing on sustainability in very different ways. However, successful sustainability programs methodically address strategic, operational, collaboration, and governance requirements. Leading companies take a top-down, sequential approach when implementing sustainability into their organizations. Leadership commitment is the most important first step. Then, through non-traditional collaborations, systematic assessments of value chain impacts, and robust governance structures, leading companies ensure that sustainability is woven into the very fabric of the company.
Companies will not be able to dictate the timeframes or expectations for managing sustainability. Shareholders, federal and state agencies, and consumers are driving the evolution of sustainability. The time is now to undertake initiatives and integrate sustainability into the organization.
However, sustainability need not be a reactive response to environmental or regulatory threats. As sustainability develops in the business world, companies can move from short-term risk avoidance and regulation compliance to long-term development of brand, competitive, and operational advantage. Proactive sustainability initiatives are an opportunity for companies to differentiate themselves as leaders in the industry, the environment, and society, ensuring long-term business success.
Section �: The Path Forward: Integrating Sustainability
into the Business Model

��

��
Sustainability Definition
Appendix A: Sustainability Definition
What is Sustainability? The generally accepted definition of the sustainability concept is the one defined by the United Nations and Brundlandt Commission on Environment and Development, which characterizes sustainable development as that which “meets the needs of the present without compromising the ability of future generations to meet their own needs.” This definition recognizes that sustainable development is a balance of three dimensions: environmental protection, social development, and economic growth.
Independent groups have also emerged with frameworks for scoping and measuring sustainability that are increasingly used by corporations to report on sustainable performance. For example, the Global Reporting Initiative (GRI) has developed a Sustainability Reporting Framework and aims to make sustainability reporting on economic, environmental, and social performance as routine and comparable as financial reporting. The ISO14000 framework is a historical management system that has been used by many companies for EHS (Environmental Health and Safety) reporting. Subsequent ISO standards are evolving to include sustainability.
The lack of a common definition has made engaging in meaningful discussions on sustainability challenging. In practice, the term ‘sustainability’ is used by companies to describe a range of activities: energy and water conservation programs, human rights and worker safety initiatives, and even food donations and charitable events that benefit the general community. In our research, we found that a variety of metrics were also used to measure sustainable efforts. For environmental programs, metrics vary on how energy usage, emissions output, and water usage are measured. In addition, metrics also vary by company and geographic locations.
Sustainability Definition/Framework Description
UN Commission on Environment and Development
Sustainable development meets the needs of the present without compromising the ability of future generations to meet their own needs.
Global Reporting Initiative (GRI)
A reporting framework that aims to make sustainability reporting on economic, environmental, and social performance by all organizations as routine and comparable as financial reporting.
CERES Formerly known as the Valdez principles, CERES is a ten-point code of corporate environmental conduct. A part of that code of conduct is the mandate to report periodically on environmental management structures and results.
ISO 14000 Environmental management standards that help organizations minimize how their operations negatively affect the environment (cause adverse changes to air, water, or land), comply with applicable laws, regulations, and other environmentally oriented requirements, and continually improve on the above.
Sustainability Definition & ScopeConsumer Businesses in the U.S. do not share a common definition of sustainability. Consistent with the United Nations and Brundtland Commission definitions, we developed a working definition of sustainability as: “The continual improvement of business operations to ensure long-term resource availability through environmental, socially sensitive, and transparent performance as it relates to consumers, business partners, and the community.”
The above definition is consistent with the definition used by most Consumer Business companies issuing a formal sustainability report. To date, many companies have emphasized environmental sustainability programs. Deloitte and the GMA Industry Affairs Council spent significant time validating the scope and priority of sustainability for the industry. The GMA Industry Affairs Council overwhelmingly supported environmental sustainability programs as the first priority focus area for the industry. The scope of this report is environmental programs.

��
We highlight major environmental, social, and economic programs within the scope of sustainability below. (These are consistent with the GRI Reporting Framework.)
Environmental Programs Social Programs Economic Programs
Energy
Water
Emissions
Waste Reduction
Recycling
Reuse
Forestry
Agriculture/Organic Foods
Livestock
Packaging
Product Content
Resource Conservation
Fair Trade
Local Economic Development
Working Conditions
Health/Nutrition
Diversity
Human Rights
Fair Competition
Anti-corruption and Bribery
Safety
Social Philanthropy
Security and Privacy
Accountability/Transparency
Corporate Governance
Shareholder Value
Economic Performance
Financial Objectives
Report Scope: Environmental Sustainability ProgramsThe scope of this particular study will focus on environmental programs. We have chosen environmental programs as our initial focus area due to several reasons:
• Many CPG companies have chosen environmental sustainability as their initial focus area
• Environmental sustainability issues are highly relevant to Retail and CPG companies, given their large environmental footprint
• Environmental programs are more tangible and measurable, allowing for a more consistent definition, measurement and comparison
As other areas of sustainability become more mature and well-defined, we may look to explore those areas as well. However, our initial focus in this report will be on environmental sustainability programs.
Environmental Sustainability ProgramsEnvironmental sustainability programs are initiatives that reduce negative impact on the global environment or conserve limited natural resources. Programs that lessen negative impact on the global environment include but are not limited to: emissions reduction, waste reduction, recycling, and sustainable agriculture. Programs that conserve limited natural resources may include energy conservation, water conservation, and biodiversity. While packaging and product content are not traditionally environmental programs, we have included them in the environmental category due to their widespread impact on the global environment. For instance, the creation and disposal of product packaging may have significant impact on waste generation, recycling, energy consumption, and emissions output.
To date, environmental programs have been the most defined of the three categories. Historical regulatory efforts in the U.S. have also driven the definitions and focus of environmental programs. Additionally, the tangible nature of these programs and quantifiable ROI enables some form of measurement and tracking, and many companies have begun measuring energy consumption, water consumption, and emissions output. Most Retailers and CP manufacturers have also been tracking waste generation and recycling rates.
We have listed definitions and sample practices of environmental programs on the following page.
Appendix A: Sustainability Definition
Representative Sustainability Programs

��
Social Sustainability Programs
Program Definition Illustrative Practices
Energy Refers to programs that conserve the use of energy or the use of more environmentally-friendly energy sources
• Energy conservation programs and systems• Alternative energy use (e.g. wind, solar)• Purchasing alternative energy credits (e.g. wind credits) to
offset energy use
Emissions Refers to programs that reduce the amount of harmful emissions into the atmosphere, either direct or indirect. Emissions may include: greenhouse gas emissions, ozone depleting substances, air acidification substances, etc.
• Use of energy-efficient equipment• Use of HFC-free refrigeration systems• Use of emission-reducing forms of transportation (e.g. hybrid
trucks)• Optimizing truck-load factors and distribution networks to
reduce number of trips taken• Use of alternative energy (bio-fuels) for fleets
Water Refers to programs that either conserve water usage or reduce the amount of water contamination
• Water conservation programs• Rainwater collection• Wastewater treatment programs and plants• Water reuse programs• Innovative product development to reduce the amount of
water used in product
Waste Reduction
Refers to programs that reduce the amount of waste generated or amount of waste going into landfills. Waste may be: hazardous, non-hazardous, solid, composts, etc.
• Waste reduction programs• Waste reuse programs (e.g. convert waste into energy)• Waste treatment and management programs
Recycling Refers to programs that recycle products and packaging, including paper/corrugate, plastic, glass, metal, electronics, other non-biodegradable materials, etc.
• Store or community recycling programs for paper, plastic, glass, metal, etc.
• Use of recycled content in products or packaging• Initiatives to reduce use of products that need to be recycled
(e.g. paperless office)
Biodiversity/ Resource Conservation
Refers to programs that preserve the ecosystem and biodiversity of land or ocean, as well as natural resource conservation
• Forestry programs• Re-forestation programs• Timber sourcing and processing guidelines• Participation in industry eco-preservation councils such as
Forest Stewardship Council, Marine Stewardship Council, etc.
Sustainable Agriculture/LivestockCare
Refers to programs that support sustainable agriculture, including sustainable farming practices, organic farming standards, and proper care of livestock (Note: This does not include “good for you” or healthy food products).
• Standards on sustainable agriculture and organic products, including non-pesticide use and non-GMO products
• Standards on proper care of animals, including humane animal treatment, non-use of hormones, antibiotics, etc.
• Providing training or funds to support sustainable/organic farmers
Packaging Refers to programs that either reduce the amount of packaging used or uses recyclable or biodegradable packaging
• Packaging reduction initiatives• Bulk packaging• Use of recyclable or biodegradable packaging or distribution
containers (e.g. pallets, boxes)• Investments in innovative technology that reduce amount
of packaging required or development of biodegradable packaging
Product Content
Refers to programs that reduce the amount of harmful materials or ingredients in products
• Reformulation of products to remove trans fats, sodium, or other potentially hazardous chemicals
• New product development processes that consider Sustainability as a key criterion
Appendix A: Sustainability Definition
Representative Environmental Sustainability Programs

�8
Social sustainability programs benefit the overall quality of life and the well-being of the local and global communities in which the company influences in its operations. These programs may include fair trade and ethical sourcing initiatives as well as agricultural development programs that support local economic development. They may also include human rights issues such as child labor and working conditions.
In our research, we found that social programs tend to span a broader range of definitions that vary amongst cultures, races, nationalities, and geographies. There are varied opinions on what should be included under the social category. For instance, does philanthropic/charitable giving count as a social sustainability program? Can issues such as consumer privacy and responsible advertising be considered part of a sustainability program? In addition, there was variation in how each group defined a social program category. For instance, should ‘working conditions’ be included under ‘human rights’? Is ‘fair trade’ a social issue or an economic issue? Finally, meanings tend to vary globally – for instance, each country, nationality, or religion may have their own definition of ‘human rights.’ In addition, some social programs can also overlap with some environmental programs. For instance, agricultural programs in developing countries that benefit local economies can be classified as either a sustainable agriculture program (environmental) or a local development program (social).
Of all the social programs we researched, the most consistently measured social programs were ‘working conditions’ and ‘local development.’ ‘Working conditions’ was usually measured by existing metrics such as accident rates or missed work days. ‘Local development’ was frequently measured by the amount of funds injected into a local economy. By and large, however, we found it difficult to compare social programs because of the range of programs implemented and the variety of metrics used by companies.
Economic Sustainability ProgramsEconomic sustainability programs enable a company to operate in such a way that ensures financial viability and ethical performance. Economic sustainability programs may include corporate governance programs to provide accountability to stakeholders, corporate citizenship and ethics programs, and the like.
In our research, we found that CPG and Retail companies had the fewest reports on this area of sustainability. Programs on economic sustainability tend to focus on corporate governance and providing accountability to stakeholders. Companies also incorporated stakeholder value as part of their core mission statement. Some organizations have instituted corporate citizenship programs, focused on ethics training, ethics hotlines, and the like. Aside from metrics such as percent increases in shareholder value or number of calls on ethics hotlines, performance in these areas is not consistently measured. This area of sustainability is often managed by other functions and areas. For instance, ethics may be monitored by compliance, while shareholder accountability may be monitored by a corporate governance function.
Appendix A: Sustainability Definition

��
Sustainability Metrics
Appendix B: Sustainability Metrics
Measuring Sustainability Measuring sustainability performance is not standardized, resulting in the inability to effectively analyze trends or perform peer comparisons. Currently, corporate sustainability performance is compared within indices, such as the Dow Jones Sustainability Index or the FTSE4Good Index. The financial indices provide a way to compare overall corporate performance and assess the relative financial attractiveness of companies. However, these indices do not use a common set of metrics to measure sustainability; rather, the criteria for sustainable performance vary from index to index, and are not always transparent. Additionally, these indices rely on self reporting of performance metrics which are inconsistently measured and are not validated by the indices.
Common Sustainability Indices
Sustainability Index Description
Dow Jones Sustainability Index
An index that tracks the financial performance of the leading sustainability-driven companies worldwide, providing asset managers with reliable and objective benchmarks to manage sustainability portfolios. DJSI provides a financial quantification of company sustainability strategy and their management of sustainability opportunities, risks, and costs.
FTSE�Good An index designed to measure the performance of companies that meet globally recognized corporate responsibility standards, and to facilitate investment in those companies. For inclusion, eligible companies must meet criteria requirements in five areas: 1) working towards environmental sustainability; 2) developing positive relationships with stakeholders; 3) up-holding and supporting universal human rights; 4) ensuring good supply chain labor standards; 5) countering bribery.
LOHAS Index Developed by the Natural Marketing Institute (NMI), the LOHAS Index is a ranking of the fifty most environmentally and socially responsible companies based on both a consumer perspective and investment analyst ratings of corporate sustainability and responsibility. The LOHAS Index is selected from companies in the Russell 3000 Index.
Sustainability MetricsAs part of the survey process, we evaluated metrics that are currently being used by both Retailers and CP manufacturers to measure environmental sustainability programs. We discovered, not surprisingly, that few companies used the same metrics.
Commonality in ‘what’ is being measured, but not ‘how.’ Most companies are measuring the same types of environmental information, such as levels of energy usage, carbon emissions, or water usage. However, there is very little commonality in how these levels are being measured. One company we surveyed measured emissions by the tons of carbon dioxide generated per unit, another measured it by the number of cars taken off the road, while yet another measured it by the number of trees saved or planted.
Not all metrics are relevant to all companies. We found that the type of metrics collected depended on the type of programs companies engaged in (e.g. water, energy, biodiversity), which in turn, depended on the core business of a company. For instance, Retailers often had metrics on recycling, waste, and energy usage. Manufacturers, especially beverage companies, had detailed metrics on water usage. Some CP manufacturers focused on biodiversity, while most Retailers did not.

�0
Calculation methods vary. Even if the same metric was used, there was a significant variation in the type of unit used to measure output. For instance, energy could be measured by kilowatt hours, mega joules, or giga joules. This tended to vary by geographic locations which have different metrics systems. How a particular metric is calculated, and which factors are included in the formula, also tended to vary.
At this stage, there are no commonly accepted or ideal metrics framework for measuring sustainability performance in the Consumer Business industry. In our survey, we collected commonly used metrics, which we have listed below. To the extent that the industry can collectively agree on select metrics, it would help the industry advance its performance measurement and benchmarking efforts. Once the metrics are selected, however, measurement systems and calculation methodologies must also be aligned. Additionally, where collaboration is required, the metrics should be shared amongst firms via scorecards or other tools.
Sustainability Metrics
Appendix B: Sustainability Metrics
Program Representative Metrics
Energy Conservation/ Use of Environmentally Friendly Energy Sources
Total energy consumed per year
Percent reduction in energy consumed per year
Energy consumed per unit
Energy consumed per truck of delivered products
Percent energy use from alternative sources
Percent energy use offset by alternative energy credits
Reduction of Harmful Air Emissions
Total emissions generated per year, including direct or indirect GHG emissions, and ozone depleting substances
Emissions generated per unit
Percent reduction in use of harmful refrigerants
Water Conservation or Processing
Total water consumed per year
Water consumption per unit
Wastewater generated per unit
Percent savings in water usage
Waste Reduction Total waste generated per year (e.g. hazardous, non-hazardous, solid)
Total waste generated per unit (in per square foot or other measure)
Percent reduction in waste volume going to landfills per year
Percent reduction in waste produced during operational processes
Total waste composted per year
Product and Packaging Recycling
Total waste recycled per year
Recycling Rate
Percent of waste sold for reuse per year
Percent of recycled content in products
Ecosystem and Land or Ocean Biodiversity Preservation/ Natural Resource Conservation
Number of new locations that are ‘brownfield’ developments
Area of land disturbed
Area of land protected
Area of land restored
Percent of products sourced responsibly from non-endangered ecosystems (e.g. Forest Stewardship Council, Marine Stewardship Council)

��
Program Representative Metrics
Sustainable Agriculture/Livestock Care
Number of suppliers providing organic or sustainable products
Percent or Number of products offered that are organic/sustainable (including private label)
Percent market share in organic products
Amount of store space dedicated to sale of organic products
Dollars spent on promoting organic products from sustainable agriculture
Number of farmers helped or supported
Reduced Packaging/ Increased Use of Biodegradable Packaging
Amount of packaging materials used by weight or volume
Percent of suppliers meeting scorecard or other formal sustainable packaging requirement
Percent reduction in packaging as a result of retailer or retailer-supplier efforts
Product/package ratio
Percent recycled content of distribution or product packaging (e.g. pallets, crates)
Number of products with sustainable packaging (e.g. biodegradable packaging)
Appendix B: Sustainability Metrics
Sustainability Metrics cont.

�2

��
Regulatory Assessment
Appendix CRegulatory Assessment
IntroductionNear-term local, state, and federal regulatory activity with respect to environmental sustainability may be categorized as addressing three priority areas:
• Overall Governance and Transparency of Environmental Performance
• Conservation of Natural Resources
• Product Stewardship
The drivers and anticipated future regulatory activity for each are described in further detail below.
Governance and Transparency of Environmental PerformanceGlobalization, increasing environmental regulation, energy and water scarcity, and shareholder demands for stronger governance resulted in a 2004 Congressional-initiated investigation of public company disclosure of environmental matters. The investigation concluded with recommendations that the Financial Accounting Standards Board (“FASB”), the Securities and Exchange Commission (“SEC”), and the Environmental Protection Agency (“EPA”) align to ensure more transparent disclosure. The result – more activity from each of the agencies and increased collaboration to ensure consistent disclosure of data across the communication channels they manage. The FASB issued subsequent accounting pronouncements and is drafting additional guidance to provide more clarity on environmental matters in public accounting, the SEC is undertaking investigations on specific environmental representations in public financial statements, and the EPA is actively developing performance metrics, issuing certifications for leading programmatic efforts and is experiencing an expansion of its regulatory administration.
While not required by law in the United States, many companies enhance their required public reports on management, regulatory, and financial performance with voluntary statements to address the management of issues such as protection of the environment, health and safety, labor, and overall values and objectives with respect to corporate social responsibility. These reports attempt to provide stakeholders with information on a broad range of issues related to how an organization performs financially, environmentally, and socially. This information is currently provided through a number of channels:
• Customized reports on sustainability, CSR, the environment, and other related topics
• Addendums to annual reports or discussion in the Management Discussion and Analysis section
• Company websites and press releases and
• Other ad-hoc reports
While useful and often detailed, many reports fail to discuss the bottom line effect of sustainability for a company. Furthermore, only a small percentage of reports are audited by independent third parties to ensure accuracy, consistency, and reliability of the information provided to the public. Even more challenging is that third-party verifiers are not relying upon consistent reporting frameworks, standards, or auditable criteria, resulting in an inability to compare performance within and across industries.

��
Voluntary reporting has had an erratic history in terms of frequency of report issuance, scope and content and verification by third-parties. In the absence of guidance or consensus, many companies are applying the Sarbanes-Oxley principles with respect to documented processes, procedures and controls for data collection and timely and relevant communication in the Environmental and Social Sustainability reporting areas. Accordingly, some companies are slowing their external reporting efforts while they develop management programs for enhancing the credibility of their data and reporting. Some are awaiting the implementation of future regulation and clarification on recommended metrics before issuing external reports formally.
Shareholders have been frustrated by inconsistency in both mandatory and voluntary reporting and are increasingly issuing resolutions that are requiring companies across industries to report on performance.
Increased Demand for Sustainability ReportingThe increased number of reports and topics discussed is in direct response to demands by shareholders, investment companies, business partners, consumers, and regulators in the U.S. and abroad. A review of 306 shareholder proposals made in 2006 and 2007 shows that 154 proposals, or almost half of all shareholder proposals, were related to sustainability topics.22 The table below lists the most common shareholder proposals:
Shareholder Proposal Topic
No. of Proposals
Sustainability reporting 38
Climate change/GHG 31
Human rights 12
Energy 10
Vendor standards 8
Product labeling 5
Environmental impact 3
Global labor standards 3
Recycling 3
Renewable energy 3
Biodiversity 2
Other sustainability topics 36
TOTAL 154
There were 36 shareholder proposals made to companies in the Consumer Products manufacturing and Retailing industries. Eight of these 36 proposals related to sustainability reporting, five related to product labeling of genetically modified foods, three related to energy, and three related to vendor standards.
Response to these resolutions can be challenging as shareholder and stakeholder tolerance for “greenwashing” or disclosing only the positive attributes of sustainability performance are not acceptable. Retailers and Consumer Products companies should work closely with legal counsel and financial reporting personnel across functions to respond to such resolutions and to ensure that the data communicated externally across channels is consistent, whether within a voluntary report, disclosure to ratings agencies, contained in a response to a shareholder resolution, or issued in a financial report or a regulatory report.
22Shareholder proposals were found in a database compiled by Interfaith Center for Corporate Responsibility. http://www.iccr.org/ethvest.php
Appendix CRegulatory Assessment

��
While the Global Reporting Initiative (“GRI”) has emerged as a widely accepted reporting framework to guide companies in producing quality, standardized reports, many companies struggle with ensuring the reports are compliant with U.S. required and suggested frameworks. For example, the American Institute of Certified Public Accountants (“AICPA”) has been active in issuing a Statement of Position that provides recommended frameworks for reporting, particularly in the area of carbon emissions. The AICPA’s recommendations will likely transition from a recommended approach to a required position if carbon is regulated in the U.S.
Companies will have to monitor the reporting environment as it trends from voluntary to mandatory requirements and United States agencies become active in setting and enforcing standards. Many are wondering whether U.S. standards will ultimately outdate global reporting frameworks.
Required Disclosures and ReportsThe UK adopted the Business Review in 2005, which requires large publicly traded companies to include a “Business Review” in the annual report with a comprehensive analysis of the development and performance of the company and its year-end position. In November 2006, the legislation was modified to require companies to include a discussion of issues related to the supply chain, society, and the community, and to report the effectiveness of the company’s policies on the covered sustainability topics. The 2006 modification also requires performance indicators relating to employees, suppliers, the environment, and social and community matters. However, no guidance was provided to ensure consistency with respect to reporting in these areas.
Interestingly, recent pronouncements from the Financial Accounting Standards Board (“FASB”) reflect a convergence to the International Accounting Standards Board guidance. With likely government regulation in the areas of carbon management and reporting, the voluntary and financial reporting requirements will be inextricably linked and Consumer Products Manufacturers should expect more stringent reporting requirements and guidance with respect to metrics required in reporting to drive consistency.
The Impact on CPG ManufacturersThe recent and growing attention of the public on businesses in the area of sustainability provides a number of challenges and issues related to such reports that CP manufacturers should consider:
Impact Issues
Data Consistency in Reports
• How are data normalized against reasonable metrics such as hours of activity, tons of products, number of employees?
• Is the same type of information reported year to year?
Reporting Process • Does the company have a formal process to gather sustainability information?• How is qualitative data addressed?• Is data assessed and validated internally and by a third party?• Are specific individuals assigned the role of reporting sustainability data?• Are individuals responsible for reporting information involved in managing sustainability
initiatives?• What guidance is provided by Management in supporting the reporting process?
Report Content • Does the company have a process to identify additional information that stakeholders demand?
• Does the report describe challenges in additions to successes?• Are the reports prepared in accordance with specific, acceptable standards, such as
GRI?• Are the reports evaluated to verify that they provide valuable information to
stakeholders?• Is the content audited internally and externally to ensure quality and accuracy?
Senior Management Involvement
• To what extent is senior management involved in reviewing and validating sustainability information that is published?
• Does Management use the sustainability reports to identify future initiatives?
Appendix CRegulatory Assessment

��
Conservation of Natural ResourcesAs the environmental impacts of the twenty-first century are becoming more visible and resource availability for current and future generations is becoming compromised, we can expect to see that regulatory efforts will be in the areas of minimizing degradation to the environment and conserving the use of natural and non-renewable resources. Based on recent history at the local, state, and federal areas, climate change and water conservation are trending towards having the most activity in the near term.
Climate ChangeGrowing public awareness and concern of climate change and concerns over U.S. energy security and interdependency has prompted a number of policy reactions with respect to managing, reducing, and reporting green house gas emissions at the municipal, state, federal and international levels.
In 1992, the United States was one of 184 countries ratifying the United Nations Framework Convention on Climate Change (“UNFCCC”). The Kyoto Protocol, signed in 1997 and effective in 2006, was a deliverable of the UNFCCC and schedules a reduction in green house gas emissions of an average of 5 percent against a 1990 baseline during a period of 2008 to 2012. While the United States was not a signatory to Kyoto, U.S. states and municipalities have recently undertaken corresponding initiatives aligned with Kyoto that may be even more difficult to manage and present greater challenges given the resources. Consumer Products manufacturers will need to track and enforce numerous localized regulations and timeframes.
State InitiativesIn the United States, the most significant climate change related activity has been at the state level, where states are proposing, implementing, and enforcing their own versions of climate change legislation or are banding together to form regional efforts. The actions across states are relatively similar and generally include a) identifying sources of greenhouse emissions, b) preparing green house inventories, c) establishing advisory groups and legislative commissions, d) setting emissions targets, and e) creating climate change action plans. States are also requiring that utilities provide a designated amount or percentage of power from renewable sources as a portion of their overall provision of electricity.
The maps below show the number of states that have identified sources of greenhouse gas emissions and are collecting inventories, as compared to the number of states that have completed climate action plans, to demonstrate the growth in activity at the state level.
States with Greenhouse Gas Inventories (left) and States with Completed Climate Action Plans (right) (source: Pew Center for Climate Change)
However, several states have moved more rapidly and are launching carbon regulation within the next year, and while focused on utilities, could impact Consumer Products Manufacturers particularly in the areas of energy prices and reliability.
Concerned about climate change and its impacts on the environment and the economy, New England and Mid-Atlantic states forged the Regional Greenhouse Gas Initiative (‘RGGI’), the nation’s first mandatory cap-and-trade program for carbon dioxide. The program, led by New York State, has a launch date of January 1, 2009. Additional states
Appendix CRegulatory Assessment
Alaska
Completed Climate Action PlansHave Greenhouse Gas Inventories

��
participating include Maine, New Hampshire, Vermont, Massachusetts, Connecticut, New Jersey, Delaware and Rhode Island. Additionally, Pennsylvania and Maryland may also join the initiative. These states collectively are the 11th largest emitter of all emissions in the world and account for 9 percent of U.S emissions. The reduction goals are to stabilize emissions at current levels through 2014 and then reduce emissions by ten percent by 2019.
While mandatory emissions reductions will be targeted towards regulating the utilities and electricity generating units, regulations may be expanded in the future to mimic the European Union including iron, steel, mining, and ultimately wood, paper and pulp processing sectors.
A regional cap was set and each state was allocated a set emissions allowance based on previous emissions, population, and electricity consumption. Power plants with low emissions will be able to sell surplus emissions in an active trading market where proceeds will be used to foster renewable generation and fund the administration of the program. To incent compliance, early programs will include offset opportunities by investing in projects that remove carbon dioxide from the environment.
Additional concerns include reliability of the power grid and energy generation. Efforts may be slowed by threatened legal action from states or industries questioning the constitutionality of an interstate program not approved by Congress.
Most importantly, RGGI is spurring other state and regional efforts including the West Coast Governors Global Warming Initiative (Oregon, California, Washington, New Mexico and Arizona) and the subsequent Western Regional Climate Action and Southwest Climate Change Initiatives which are modeled off the RGGI platform.
While these programs target mostly greenhouse gas emissions, a number of programs have been approved or are being considered across the United States that have potential impacts on the consumer business supply chain. Governor Schwarzenegger has set aggressive targets of reducing green house gas emissions to 80 percent below 1990 levels by 2050. California’s commitment is evidenced through application of the RGGI concept to the second wave of emitters by passing bills and regulations pertaining to automobiles, green building, and energy efficiency. While the regulatory efforts are being challenged by industry, Consumer Products manufacturers will have to trend the regulatory activities that may impact distribution fleets or operations and should take advantage of tax and regulatory incentives to minimize the cost impact of complying as other states are demonstrating a willingness to follow California’s example.
The table below23 presents a number of representative programs, legislation, and initiatives across the United States.
Program Title and Description Type States
Alaska climate impact assessment commission Climate change Alaska
Governor’s Commission on Global Warming Climate change Multiple states
North Carolina legislative commission on global climate change
Climate change North Carolina
Connecticut climate action plan Climate action plans Connecticut
Maine climate action plan Climate action plans Maine
California climate action registry GHG reporting California
Wisconsin mandatory GHG reporting GHG reporting Wisconsin
Wisconsin voluntary GHG reporting GHG reporting Wisconsin
West Virginia inventory and reporting GHG reporting West Virginia
Global Warming Solutions Act of 2006 Economy-wide GHG reductions California
California SB 1368 GHG performance standards for electric power California
Out-of-State Carbon Sequestration GHG performance standards for electric power Minnesota
California AB 1493 GHG performance for vehicles California
New Jersey Vehicle Emission Standards GHG performance for vehicles New Jersey
Washington Vehicle Emissions Standards GHG performance for vehicles Washington
23Source: www.pewclimate.org
Appendix CRegulatory Assessment

�8
Local InitiativesWithin the broader trend of state-led initiatives and programs, local communities and cities have enacted policies and programs of their own to address specific concerns including health, quality of life, and economics.
In the U.S. Mayor’s Climate Protection Agreement, over 330 U.S. mayors committed to exceed Kyoto Protocol targets – a seven percent reduction from 1990 levels by 2012.24 Additionally, the U.S. Conference of Mayors endorsed the Architecture 2030 Challenge to reduce fossil fuel used in new buildings (which account very substantial green house gas emissions) by 50 percent today and by 2030 buildings are to be carbon neutral.25
Currently, the majority of the world’s population lives in cities or large urban centers and by 2030, 2 billion additional people will be added to the world’s population. Seventy-five percent of the world’s energy is consumed in urban areas and in the United States, the ten largest cities account for ten percent of total emissions in the country.26
The pursuit of sustainability initiatives in cities and urban areas is a response to the realization that changes in these settings have more impact and are easier to implement than in suburban areas given the public transportation possibilities. Cities are also more flexible with respect to tax structures and incentives. Such decisions have a direct impact on businesses since zoning regulations, tax incentives, and the acceptance of certain industries in the areas may be affected by a city’s overall goals against issues such as pollution control, water availability, and climate change. And more local issues, such as logistics and traffic, are increasingly determining the ability of certain business to locate production facilities.
The table below lists cities that are enacting initiatives representative of the many currently going into practice across the United States:
Program Focus Communities involved
Energy Supply Montgomery County (Maryland); San Diego (California); St. Paul (Minnesota)
Energy Efficiency Atlanta (Georgia), Portland (Oregon); Fort Collins (Colorado)
Transportation Honolulu (Hawaii); Miami-Dade County (Florida); Keene (New Hampshire)
Trees and Vegetation Chicago (Illinois); Houston (Texas)
Cross-Cutting Seattle (Washington); Burlington (Vermont)
While not exclusively targeting businesses, such initiatives may indeed have effects on a number of corporate strategies especially in relation to a number of key areas:
• Location and construction of facilities or refurbishing of existing ones may be subjected to specific performance standards with regards to green buildings, energy sources used and energy efficiency and savings requirements
• Operating permits and access to capital may be more difficult to obtain
• Operations requiring large amounts of energy or certain materials (such as potable water) may find opposition as these commodities become more expensive or scarce
• Logistics may be affected by plans to limit traffic or to regulate its flow
According to the Pew Center, in 1995 only 15 local governments in the United States were engaged in climate protection activities and by 2006 that number had grown to 20027, representing almost 66 million people. Businesses are learning that local issues can quickly become state or national ones given the attention that is often placed on some of the more innovative approaches and the public sensitivity towards such initiatives, seen as part of a broader effort to manage issues such as climate change.
24http://www.seattle.gov/mayor/climate/25http://www.architecture2030.org/home.html26Source: United Nations Department of Economic and Social Affairs World Population Prospects: the 2004 Revision. 200427Source: the Pew Center – Climate Change 101. Local Action. 2006
Appendix CRegulatory Assessment

��
Federal InitiativesAt this time, federal initiatives may be characterized as voluntary, including but not limited to the following:
• Asia- Pacific Partnership on Clean Development and Climate is a voluntary agreement to share technology advances. Signatories include Australia, China, India, Japan, Korea, and the United States who together account for 50 percent of greenhouse gas emissions.
• In February 2002, the President called for voluntary action to cut greenhouse gas intensity (measured in terms of the amount emitted per unit of economic activity) by 18 percent in 2012. Several programs have been set up to support this initiative, including:
• Climate Vision - a Presidential/public-private partnership initiative launched by the Department of Energy in February 2003. The focus of the initiative is to provide incentives to encourage energy-intensive industries to reduce emissions intensity.
• Climate Leaders - a voluntary EPA industry-government partnership that works with companies to develop long-term comprehensive climate change strategies. Climate Leader partners set a corporate-wide greenhouse gas (GHG) reduction goal and inventory their emissions to measure progress.
While limited federal legislation has been passed to-date, the recent U.S. Supreme Court ruling and indications by the U.S. Congress and the White House suggest that in the near future these issues will be legislated. The table below indicates the growth of bills, resolutions, and amendments in the most recent four legislatures.
Congressional Proposals related to Climate ChangeThe growing number of proposed bills in Congress is perceived by many to be the leading indicator pointing towards a federal cap and trade system. Cap and trade systems entails setting an emissions target toward allocating allowances to the sources of emissions. The allowances, if appropriately distributed, would have a value in the market and would be eligible for trading.
28PEW Climate Center of Global Climate Change. Accessed April 18, 2007 from http://www.pewclimate.org/what_s_being_done/in_the_congress/leg_proposals.cfm
Appendix CRegulatory Assessment
Congress Relevant YearsBills, Resolutions, and Amendments
109th 2005 – 2006 106
108th 2003 – 2004 100
107th 2001 – 2002 70
106th 1999 – 2000 30
Source: PEW Climate Center on Global Climate Change 28
Leading Senate climate change legislation in the last year addressing green house gas emissions is summarized below and includes:
• The Jeffords Bill – The Global Warming Pollution Reduction Act calls for carbon dioxide (CO2) and other heat-
trapping emissions to be reduced to 80 percent below 1990 levels by 2050. The Bill includes standards for vehicles and power plants and includes a Renewable Portfolio Standard.
• Lieberman-Warner Climate Stewardship Act – While the floor vote failed on both the first proposal and the second revised initiative, a subsequent version has the potential to impact downstream (transportation, industry and commercial sectors) carbon emitters nationally and advocates a cap and trade system.
• Bingaman Proposal and Resolution – Sets absolute reduction targets based on emissions per million dollars of GDP. The Bingaman proposal is unique given its “safety value,” or price cap of $7/TCO
2 on the cost of
greenhouse gas permits which ensures that large emitters with targets will not have to pay more than some specified price for permits.
• Energy Policy Act of 200� – Seeks to authorize loan guarantees and funding for technology innovation, explore renewable energy sources, and support clean energy initiatives. The bill also increased the amount of biofuel (i.e. ethanol) mixed with gasoline sold in the United States.

�0
A more thorough comparison of each of these proposals is summarized in the table below:
Climate Policy Proposal Comparison
Program Element/Result Bingaman Proposal
Climate Stewardship and Innovation Act
S.����Kyoto
ProtocolClimate Initiative Bush
Administration
Mandatory / Voluntary
Mandatory Mandatory Mandatory Voluntary
Target Absolute based on 2.4 percent intensity
improvement 2010-2018, after 2019 target increases stringency to 2.8 percent
Absolute emissions 2000 emissions level
after 2010
Absolute 7 percent below 1990 levels
by 2012
Intensity target goal 18 percent reduction by
2012
Offsetting Emissions
Allowed for Compliance
Yes
Not to exceed 3 percent
Yes
Not to exceed 15 percent of allowance
allocation
no limits specified through
Kyoto, though implementing countries have
discretion
N/A
Cost Cap Yes - $7 No No No
Stabilizes Emissions
No
(12 percent above 2010 levels in 2020)
Yes Yes No
(12 percent above 2000 levels by 2012)
EIA Estimated Emissions
Reductions 2025
(MTCO2)
621 2180 3,800 400 (goal)
EIA Estimated Permit Price 2025
($/TCO2)
$8.73 $36 $354 N/A
EIA Estimated Impact on real GDP
2025
-0.13 percent
($29 billion)
-0.4 percent
($89 billion)
-0.7 percent
($135 billion in 2020)
N/A
In May 2005, the U.S. Senate Foreign Relations Committee passed a resolution authored by Senators Richard G. Lugar (R-IN) and Joseph R. Biden (D-DE) calling for U.S. re-engagement in international climate negotiations. Senator Lugar has been active in developing an Energy Policy agenda for this purpose.
International InitiativesIn addition to the Kyoto Protocol discussed earlier in this section, individual countries and the European Union are considering a broad range of measures that may be imposed on the business community. These measures may affect Consumer Products Manufacturers through requirements that:
• Reduce the allowable amount of energy that can be used to manufacture certain products
• Impose limits on the use of water for industrial purposes
• Monitor and regulate the ingredients used in products
• Impose increasingly stringent rules related to waste generation and disposal
• Conserve energy use
Appendix CRegulatory Assessment
Source: Pewclimate.org

��
WaterWater is the ultimate renewable resource. Investments in technologies such as desalination and water purification can renew private and commercial depletion of fresh water sources. The question is who will be making the investments in infrastructure and technology to renew water at scale and when and whether the renewed water source will be available when needed.
Threats to freshwater include not only agricultural and industrial consumption, but also domestic, as well as activities which destroy natural water purification processes such as new construction, deforestation, damming and reservoiring and wetlands drainage. Evaporation alone from dammed reservoirs in the U.S. is equivalent to a volume sufficient to meet the municipal needs of all major U.S. cities combined.
A survey conducted by the Marsh Center for Risk insights found that 47% of the survey respondents said water was critical to day-to-day operations, while 41% said that a severe water shortage would cause a complete or partial shutdown of their business. The recent drought in Atlanta is already verifying the need for companies to identify risks associated with local demands and challenges to water availability.
While states and municipalities are preparing managing water use, the court system has served as the first of the judicial mechanisms for addressing access and use to water resources. Montana, Wyoming, South Dakota, Kansas and Nebraska are all involved in court actions regarding water use and appropriations. States supplying California, Arizona, and Nevada are starting to reconsider interstate water trade as their own states face critical scarcity issues going forward.
Legislative actions are being considered by international, state, and local governments to regulate water usage in products and operations and may come in the forms of water-use bans. Retailers in the sector may eventually be mandated by federal, state, local or law to carry low water use products or other incentive to utilize water conserving technology. Additionally, tradable water markets are being considered by some states in the U.S. and abroad to more accurately reflect the cost of water use.
Implications for CPGCPG companies are particularly vulnerable to the potential changes in regulations and requirements due to their reliance on a broad range of activities and participants in their supply chain, the competitive nature of their business, and the significant effects on their activities that changes in the availability or cost of commodities can have.
The table below identifies a number of issues specific to CP manufacturers across a number of impact categories in relation to climate change and energy issues:
Appendix CRegulatory Assessment
Continued
Current Climate Change Legislation Summary of Market-Based Climate Change Bills Introduced in the ��0th Congress
Who’s Regulated
Allowance Allocation
Price Stability Offsets Technology
Competitive-ness
Lieberman- Warner (S.2191)
Economy-wide cap: large sources downstream at emitter; transport emissions at refin-ery; F-gas produc-ers and importers. (75% of U.S. GHG emissions covered).
40% free to indus-try (including electric generators; with phase out); 10% to electricity consumers; 24% auc-tioned to fund technology deployment, transition assistance, an adaptation; 12% set aside for CCS and sequestration; 9% to states; 5% for early action.
“Climate Fed” with discretion to increase use of borrowing an offsets and tem-porarily expand cap. Borrowing: up to 15% of allowances, for no more than 5 years.
Up to 15% of obligation can be met with domes-tic sequestration, and another 15 % through international allowances and credits.
Technology deployment incen-tives for zero-and low-carbon gen-eration, advanced coal, cellulosic biomass, and advanced vehicles (55% of auction revenues).
Bulk, energy-in-tensive imports from countries w/o comparable policy require permits after 2020.
Bingaman-Specter (S1766)
Economy-wide cap: coal and process emissions at emit-ters; oil refiners, NG processors, and oil/NG importers; and F-gas produc-ers and importers.
53% free to industry (with phase out); 24% auctioned to sup-port R&D, transition assistance, adaptation; 14% set aside for CCS and sequestration; 9% to states.
$12/metric ton CO
2 safety valve,
rising at 5% per year above inflation.
Unlimited domes-tic offsets includ-ing methane and SF
6. Limits
on international offsets (10% of cap) and domestic agricultural offsets (5% of cap).
Detailed technol-ogy development programs funded from allowance auction revenues (12-26% of auc-tion revenues).
Bulk, energy- in-tensive imports from countries w/o comparable policy require permits after 8 years.

�2
Appendix CRegulatory Assessment
Who’s Regulated
Allowance Allocation
Price Stability Offsets Technology Competitiveness
Udall-Petri (May draft and staff talks)
Economy-wide cap: primarily upstream sources (e.g. producers and importers of fuels).
20% free to industry. 80% auctioned to sup-port RD&D; developing country engagement; adaption, dislocation aid; sequestration; debt reduction.
$12/metric to CO
2 safety
valve, rising at 2-8% per year above inflation.
Unlimited geologi-cal sequestration offsets. 5% of al-lowances set aside to fund biological sequestration and 1% for CCS projects.
Establishes ARPA-E to fund technology advancement projects (24% of auction revenues).
Inaction by develop-ing countries can justify delay in safety valve escalation.
Lieberman-McCain (S.280)
Economy-wide cap: large down-stream at emitter; transport emis-sions regulated at refinery.
Discretion of EPA, with guidance for some free allocation and an auction to fund R&D, transition assistance, adaptation measures.
Borrowing: up to 25% of allowances, for no more than 5 years.
Up to 30% of obligation can be met with domestic sequestration projects and inter-national offsets.
Revenues from some auctioned allowances used for RD&D.
No provisions.
Kerry-Snowe (S.485)
Economy-wide cap: point of regulation at dis-cretion of EPA.
Discretion of the President with guidance from the EPA.
No provisions.
USDA sets rules for domestic bio-logical sequestra-tion.
Vehicle emission rules; efficiency & renewable standards for electric genera-tion; additional billspecific mandates.
Waxman (H.R.1590)
No provisions.
Sanders- Boxer (S.309)
Economy-wide cap: EPA has discretion to implement a market-based allowance program to achieve cap.
Feinstein-Carper (S.317) Electricity-sec-
tor cap: power plants. (S.1168 also covers util-ity SO
2, NO
x, and
mercury emis-sions).
85% free to industry, based on generation (updated annually), and phased out by 2036.
Borrowing up to 10%, for no more than 5 years.
International offsets up to 25% of cap; extensive domestic biologi-cal offsets.
Economy-wide cap: point of regulation at discretion of EPA.
Alexander- Lieberman (S.1168)
75% free to industry, based on heat input. No provisions.
Domestic offsets in five categories, including methane, SF
6, efficiency, and
forest sequestra-tion.
NSPS for CO2
emissions from new electric generation units.
Stark (H.R.2069) Economy-wide
tax: fossil fuels taxed by CO
2con-
tent at the point of production and import.
100% revenues to US Treasury.
$3/metric ton CO
2, rising $3
annually.
Tax refunds for fuel CO
2
sequestered downstream: CCS, plastics.
No provisions.
Tax applied to fossil fuel imports; fossil fuel exports are exempt.
Larson (H.R. 3415)
1/6 of revenues to R&D, 1/12 to industry transi-tion assistance (with phase out), remainder to payroll tax rebates.
$16.5/metric ton CO
2, rising
10% plus infla-tion annually.
Tax refunds for domestic sequestration and HFC destruction projects.
1/6 of tax rev-enues up to $10 billion annually goes to clean energy technol-ogy R&D.
Dingell (Summary of draft)
Economy-wide tax: fossil fuels taxed by CO
2
content at point of production and import. Also, tax on gasoline (but diesel exempt).
Revenues used to expand ETTC and help fund entitlement pro-grams. Gas tax revenues go to highway trust fund (40% mass transit, 60% roads).
$15/metric ton CO
2, rising
at inflation. $0.5gallon gasoline tax (in addition).
No provisions. No provisions.
Current Climate Change Legislation cont.Summary of Market-Based Climate Change Bills Introduced in the ��0th Congress
Source: Resources for the Future, [email protected], [email protected], [email protected]

��
29Martin Spitzer “Sustainability and CSR: Assessing Regulatory Risk” March 18, 2007.
Appendix CRegulatory Assessment
Product StewardshipRecent issues related to the safety of pet food, spinach, and toys have demonstrated the ongoing challenge to ensuring that products are safe for people and the environment. These incidents are increasing government attention and scrutiny in the areas of materials management. This growth of product-related laws in the last few years parallels a similar growth in OSHA and EPA laws that came into being in the late 80’s and early 90’s but now serves to address all stakeholders in the supply chain—from suppliers to consumers. Consumer Products manufacturers may observe the activity in the electronics, automotive, and building industries that have experienced heavy regulatory activity in this space both in the U.S. and abroad.
Requirement for Traceability Materials deemed or perceived to be harmful to humans or the environment are receiving increased scrutiny from not only stakeholders but also from global governments who are mandating the tracking and reporting of certain materials and are issuing materials bans in products, packaging, or processes. Retailers and Consumer Product companies alike will have to increase their focus on tracking materials, percentage content, and locations and/or applications use or distribution to ensure they are not in violation of global or U.S. requirements. Banned materials will have an impact on procurement and distribution, requiring a flexible product lifecycle and heightened attention to trending regulatory proposals and interest.
Senators Charles Schumer and Dick Durban have introduced a bill called the Safe Food Act, which provides for a single entity that regulates consumer products and establishes a national system for tracing food-producing animals from point of origin to retail point of sale. New York, frustrated by federal work with toy manufacturers to initiate voluntary recalls of toys with lead, is mandating that certain toys be removed from the shelves of NY retailers. Further, regulatory efforts are being pre-empted by retailers who are requesting complete formula information for products containing chemicals, pesticides and aerosols, or other hazardous materials in anticipation of the regulatory activity and/or to promote higher standards of employee health and safety. Consumer Products companies will have to address the protection of proprietary business information, anticipate supply chain and product lifecycle impacts, and ensure technology to support these demands. They will also have to be prepared to address disclosing or labeling the use of the above materials and products or packaging containing nanotechnology, GMOs, and/or processes or facilities using certain chemicals for example. Below we highlight certain materials of regulatory interest to illustrate the complexity of potential regulations at international and local levels.
NanotechnologyNanotechnology is research and technology development at the level of molecular matter (control of matter on a scale smaller than 1 micrometer, normally between 1-100 nanometers). Nanotechnology is commonly applied in many consumer products and/or processes such as packaging, cosmetics and skincare products, apparel, plastics, and food, and future uses include “smart” packaging, healthier foods, efficiencies in farming, and the detection of pathogens.29 Nanotechnology even has the potential to minimize environmental impacts through the detection, prevention, and removal of pollutants as well as drive cleaner manufacturing processes.
Concerns regarding NanotechnologyHowever, the unique properties of nanotechnology also result in new and unknown interaction with human health and the environment. These microscopic nanomaterials may pass through human defenses, personal protective and control equipment, and natural defenses against contamination. In its First Annual Report of the Global Environment, the United Nations called for “tighter regulation of nanotechnology and ‘swift action’ by policymakers.”

��
Potential impacts of nanotechnology have been raised with regards to a number of specific areas such as:
• Potential effects on the environment as materials using nanotechnology are introduced in the ecosystem through farming or disposal
• Consequences on human health including product handling and consumption
• Effects on the ecosystem and new and potentially modified products come into contact with native/organic species
• Economic impact on emerging economies or those that may not be able to compete with those using nanotechnology in light of a technological advantage that it can provide
• Capability of testing methods to fully evaluate the potential effect of nanotechnology products prior to their introduction in the marketplace.
As the number of products containing nanomaterials increase globally, U.S. and International policymakers are relying on scientific assessments to determine the toxicity of nanomaterials. In the meanwhile, use restrictions, controls of occupational exposure, or releases into the environment may be mandated until the fact data are developed.
U.S. Federal Regulation of NanotechnologyThe Environmental Protection Agency (“EPA”) expects producers and users of nanotechnology to apply “Pollution Prevention Principles” to protect both the environment and humans and is relying on existing U.S. federal statutes which provide some legal basis for the regulation of nanomaterials including:
• Toxic Substances Control Act (“TSCA”)
• Food and Drug Cosmetic Act (“FDCA”)
• Occupational Safety and Health Act (“OSHA”)
• Clean Water Act (“CWA”)
• Clean Air Act (“CAA”)
• Resource Conservation and Recovery Act (“RCRA”).
In particular, the EPA-administered statues will apply to nanomaterials depending on the media, application, or release of their uses. The EPA’s authority to prohibit, limit the manufacture, import, processing, distribution, or disposal of chemical products that present an unreasonable risk and ongoing assessments to determine whether nanotechnology presents unreasonable risk is prompting organizations to collect information associated with use, production by volume or by products or number of individuals occupationally exposed in the event the EPA or local governments mandate the collection of such data or issue restriction or controls on the use of nanotechnology. In December 2006, Berkeley, California passed the first local regulation requiring companies to disclose information on the safety of the particles, monitoring plans and handling and disposal procedures.30
The House and Senate Committees with regulatory jurisdictions have expressed interest in holding hearings this year, resulting potentially in regulations in the areas of product labeling, testing, manufacturing controls or bans. The EU may be observed as setting the regulatory trend.
International Regulation of NanotechnologyCountries around the globe and their regulatory authorities are also racing to set the standard for the application of nanotechnology:
• The European Framework Program on Research and Technological Development has developed a formal outline of preexisting legislation that could cover nanoscience
• The Department of Environment, Food, and Rural Affairs (“DEFRA”) in the UK announced a voluntary reporting scheme for nanomaterials
• China released standards in June 2006 with the intention to develop an entire set of standards that could “shape world nanotech competition”31
30Martin Spitzer “Sustainability and CSR: Assessing Regulatory Risk” March 18, 200731Reference
Appendix CRegulatory Assessment
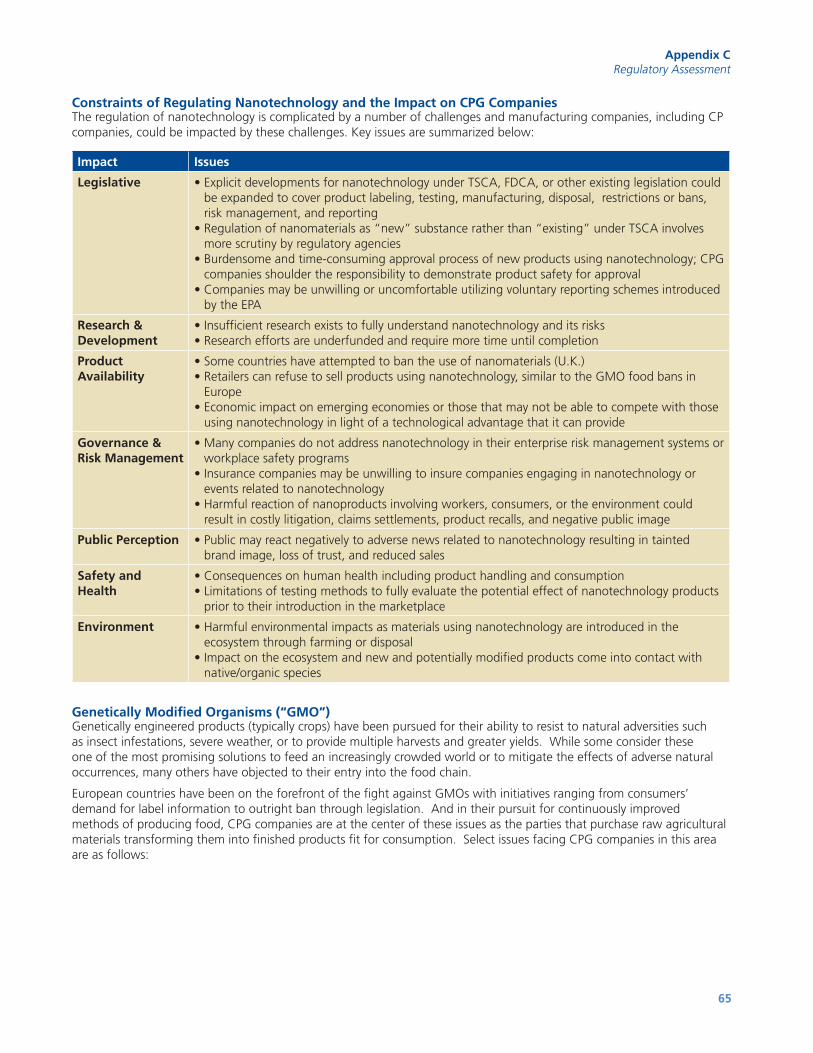
��
Constraints of Regulating Nanotechnology and the Impact on CPG CompaniesThe regulation of nanotechnology is complicated by a number of challenges and manufacturing companies, including CP companies, could be impacted by these challenges. Key issues are summarized below:
Impact Issues
Legislative • Explicit developments for nanotechnology under TSCA, FDCA, or other existing legislation could be expanded to cover product labeling, testing, manufacturing, disposal, restrictions or bans, risk management, and reporting
• Regulation of nanomaterials as “new” substance rather than “existing” under TSCA involves more scrutiny by regulatory agencies
• Burdensome and time-consuming approval process of new products using nanotechnology; CPG companies shoulder the responsibility to demonstrate product safety for approval
• Companies may be unwilling or uncomfortable utilizing voluntary reporting schemes introduced by the EPA
Research & Development
• Insufficient research exists to fully understand nanotechnology and its risks• Research efforts are underfunded and require more time until completion
Product Availability
• Some countries have attempted to ban the use of nanomaterials (U.K.)• Retailers can refuse to sell products using nanotechnology, similar to the GMO food bans in
Europe• Economic impact on emerging economies or those that may not be able to compete with those
using nanotechnology in light of a technological advantage that it can provide
Governance & Risk Management
• Many companies do not address nanotechnology in their enterprise risk management systems or workplace safety programs
• Insurance companies may be unwilling to insure companies engaging in nanotechnology or events related to nanotechnology
• Harmful reaction of nanoproducts involving workers, consumers, or the environment could result in costly litigation, claims settlements, product recalls, and negative public image
Public Perception • Public may react negatively to adverse news related to nanotechnology resulting in tainted brand image, loss of trust, and reduced sales
Safety and Health
• Consequences on human health including product handling and consumption• Limitations of testing methods to fully evaluate the potential effect of nanotechnology products
prior to their introduction in the marketplace
Environment • Harmful environmental impacts as materials using nanotechnology are introduced in the ecosystem through farming or disposal
• Impact on the ecosystem and new and potentially modified products come into contact with native/organic species
Genetically Modified Organisms (“GMO”)Genetically engineered products (typically crops) have been pursued for their ability to resist to natural adversities such as insect infestations, severe weather, or to provide multiple harvests and greater yields. While some consider these one of the most promising solutions to feed an increasingly crowded world or to mitigate the effects of adverse natural occurrences, many others have objected to their entry into the food chain.
European countries have been on the forefront of the fight against GMOs with initiatives ranging from consumers’ demand for label information to outright ban through legislation. And in their pursuit for continuously improved methods of producing food, CPG companies are at the center of these issues as the parties that purchase raw agricultural materials transforming them into finished products fit for consumption. Select issues facing CPG companies in this area are as follows:
Appendix CRegulatory Assessment

��
Impact Issues
Legal • Potentially significant liabilities that are or may be imposed on companies that use GMOs in their products
• Risk of being banned from certain markets for fear of GMO products• Health effects that may not be currently known but may be attributed to GMO
consumption• Legislation may punish an entire company rather than ban a single product
Supply Chain • Costs of relying on non-GMO products and their availability to respond to consumer demand
• Control over entire supply chain to ensure product compliance and safety• In the absence of definitive data, participants of the supply chain may make decisions based
on own perceptions or public pressure
Marketing / Brand Image
• Issues related to GMO and product safety may linger with consumer causing long-term brand image issues
• Concerns may have repercussions and retailers may refuse to carry products by CPG companies using GMOs even in the absence of specific legislation
Chemicals ManagementConsumer Products Manufacturers have long been subject to identifying, inventorying, reporting and in some cases phasing out certain chemicals or materials deemed harmful to people or the environment as the result of the introduction of acts such as those described below:
• Toxic Substances Control Act (“TSCA”)
• Food and Drug Cosmetic Act (“FDCA”)
• Occupational Safety and Health Act (“OSHA”)
• Clean Water Act (“CWA”)
• Clean Air Act (“CAA”)
• Resource Conservation and Recovery Act (“RCRA”)
However, they will now have an additional agency to contend within the Department of Homeland Security (“DHS”), and should expect increased regulations or regulatory tracking and management requirements for materials that could present terrorism risk.
Department of Homeland SecurityNew chemical regulations issued by the Department of Homeland Security (“DHS”) impact Consumer Products manufacturers and potentially retailers. The rules will require facilities storing or using “chemicals of interest” that exceed specified amounts to inventory them and complete an online form. DHS will then determine whether the institutions are subject to further security requirements. Facilities housing certain quantities of specified chemicals will be required to complete a preliminary screening assessment that determines the level of risk associated with the facility. If a facility preliminarily qualifies as high risk, its owners will be required to prepare and submit a security vulnerability assessment and site security plan. Submissions will be validated through audits and site inspections. The department will provide technical assistance to facility owners and operators as needed. Security standards will be required to achieve specific outcomes, such as securing the perimeter and critical targets, controlling access, deterring theft of potentially dangerous chemicals, and preventing internal sabotage. The department authority will seek compliance through the imposition of civil penalties, of up to $25,000 per day, and the ability to shut non-compliant facilities down. The industry can expect to be subject to additional regulations with regard to transportation, packaging, and distribution in the interest of national security.
LabelingThe above trends in governance, resource conservation, and materials management and product stewardship are drawing scrutiny with respect to product labeling. Regulatory trends suggest the need for consistent metrics and key performance indicators as the disparity in voluntary reporting performance extends to the variability in product labels. Consumer Businesses should expect to be held to more stringent labeling standards for containment of controversial materials, as well as for the labeling of environmental performance metrics, such as percent recycled content, ‘percent alternative energy’, and the like.
Appendix CRegulatory Assessment

��
Leading PracticesLeading Practices Retailer Examples
• Centralized energy management systems to control store/display level energy usage from headquarters.
• Retrofitting stores with energy efficient equipment, such as motion sensor lighting systems, refrigeration systems, ovens, cold air recycling systems, etc. (New stores are designed with these features).
• Infrared diagnostic equipment is used to test and repair air leaks in the seals on coolers, windows, freezers.
• Powering stores with alternative energy, such as wind, solar, small hydro, biomass, or geothermal energy.
• Grocery Retailer: U.S. retail companies have been rolling out energy efficient components, which have led to a reduction in energy consumption of 17 percent compared to the previous store design.
• Mass Retailer: Solar panel installation is expected to generate more than 100,000 kilowatt-hours of electricity annually. In total, BJ’s efforts saved approximately 10.5 million kilowatt-hours.
• Grocery Retailer: Saved 300 million kilowatt hours and reduced light output by nine percent through installation of energy-efficient lighting.
• Grocery Retailer: In 2005/06, Retailer invested £20 million in an extensive range of energy-saving initiatives which will cut energy consumption by 135 million kWh per year, saving £8.1 million in energy costs.
Implementation Considerations
• Measure and baseline current energy uses and sourceso Electricalo Natural gaso Petroleum-based fuelso Other (nuclear, solar, wind, etc.)
• Identify energy needso Required energy o Discretionary energy (i.e., energy uses that may be displaced by adding windows)
• Categorize energy requirements by operations, processes, facilities and equipment• Identify seasonality in operations and energy requirements• Baseline energy uses against production quantities or man-hours• Perform cost benefit analysis against
o Availability of sourceso Costso Risks of shortages due to cycles, community needs, competing facilitieso Sustainability objectiveso Requirements and commitments by management (such as contracts)
• Identify available alternatives againsto Availability of viable alternatives in sufficient quantitieso Costso Risks of shortageo Community requirements and demandso Future plans (expansion, sales of facility, etc.)
• Identify opportunities for supplier to enable organizational energy goalso Set goals for supplierso Integrate into supplier qualification and contractso Measure and audit performanceo Create Supplier Preferred Alliances
Energy Conservation
Appendix DLeading Practices

�8
Leading Practices Retailer Examples
• Recycling programs in stores, including paper, plastic, cardboard, metal, and organic compost
• Purchasing only recycled content paper
• Providing reusable cloth bags for customers
• Recycling hazardous items such as electronic and computer equipment and batteries
• Utilizing washable, reusable distribution containers for the logistics/store packaging
• Backhauling of compost materials and unsold goods to distribution centers for recycling.
• Comprehensive waste management policy that integrates upstream and downstream partners to reduce wastage and increase recycling
• Audits of stores and distribution centers verify that recyclable waste is not included in the waste stream when recycling facilities are available
• Utilizing recycled store construction materials
• Setting ‘zero-waste’ and ‘zero-landfill’ goals
• Setting environmental metrics that are normalized to sales
• Tying management compensation to reduction in controllable expenses (e.g. energy usage, $ saved/ generated through recycling)
• Grocery Retailer: Developed two new systems for composting, which provide a minimum of 15-20 percent savings over traditional disposal costs
• Mass Retailer: Reused 92 percent of garment hangers (376 million hangers). Once hangers have exceeded their useful life, they are reground and used in post-consumer goods
• Grocery Retailer: Cardboard and plastic recycling efforts save 400 million kilowatt hours (kWh) of energy per year
• Grocery Retailer: Increased the proportion of the store waste recycled from 55 percent to 71 percent, reducing total waste sent to landfill from 125,359 tons to 116,317 tons
• Grocery Retailer: Supermarkets have sold 3.5 million reusable carrier bags and cut the number of checkout bags distributed by 20.3 percent
• Mass Retailer: Partnered with computer manufacturer to develop the first RoHS (Restriction on Hazardous Substance) laptop available on the US market
• Mass Retailer: Selling low-mercury compact fluorescent light bulbs (CFLs) that will effectively remove on average 360 pounds of mercury per 100 million CFLs, a reduction of 33 percent
• Grocery Retailer: Donated 29 million pounds of food valued at $43.7 million
Implementation Considerations
• Identify and inventory quantity and quality of recyclable materials used in packaging (primary and secondary), processes, support activities, and equipment
• Evaluate potential for recycling of each against a number of parameters such as:o Available technologies for processing recycled materialso Applicable regulatory requirements and incentives (such as tax incentives)o Transportation and logistics to deliver recyclable products to facilitieso Level of pre-processing and processing efforts (such as sorting) required for recycling of productso Cost benefit analysis considering labor, transportation costs, and energy requirementso Evaluation of alternatives (such as reuse of materials in other processes)o Internal effort required to collect materialso Ease by which materials can be expected to be recycled by users and employeeso Control of a company over materials (employees vs third party subcontractors)
• Identification of those materials that should be the focus of recycling programs on the basis of the parameters listed below
• Implementation of a recycling programo Collection points and systemo Logistics and transportation or shipmento Policies and procedures, expectations and requirementso Incentives programso Roles and responsibilitieso Measurement and metrics; feedback and periodic evaluation for continuous improvement
• Re-evaluation of program against categories above and changes in requirements, costs, etc.• Communicate results to management, employees, and stakeholders• Ripple effect – consider involvement of partners along supply chain, vendors, and customers• Identify best practices and consider applicability
Recycling/Waste Reduction Programs
Continued
Appendix DLeading Practices

��
Implementation Considerations
• Affect changes in origination such aso Change in raw material used to include more recycled material as inputo Modification in quantity used (such as less cardboard in packaging)o Potential for reuse or alternative uses of materials subject to recyclingo Alternative procurement strategies to ensure easier recycling or reuse
• Identify opportunities for suppliers to enable organizational recycling goalso Set goals for supplierso Integrate into supplier qualification and contractso Measure and audit performanceo Create Supplier Preferred Alliances
Leading Practices Retailer Examples
• Packaging Scorecard introduced for suppliers. Defining packaging reduction goals, standards and guidelines
• Internal Packaging Strategy Groups developing low-impact packaging solutions, including spirit bottles, drink bottles, pizza and potato packaging. Moving towards bulk packaging where possible
• Innovative distribution packaging such as re-usable distribution trays and crates that are adopted throughout supply chain
• Using biodegradable or recycled content packaging in foods containers, bags, etc.
• Closed loop recycling programs that send recyclable packaging directly from stores to the plant for recycling
• Mass Retailer: Introduced a detailed scorecard that grades suppliers on 9 key dimensions, including: greenhouse gas emissions, material value, product to packaging ratio, cube utilization, recycled content usage, innovation, the amount of renewable energy used, recovery value of the raw materials, and emissions related to transportation packaging
• Mass Retailer: Improved packaging on toy line saved 3,425 tons of corrugated materials, 1,358 barrels of oil, 5,190 trees, 727 shipping containers, $3.5 million in transportation costs
• Grocery Retailer: Using 50 percent recycled plastic in the packaging for salad snacks and 30 percent on snack drinks
• Grocery Retailer: Launched a closed loop recycling program that will ensure that 35,000 tons of packaging, which might otherwise be exported for recycling or sent to landfill, will be converted into packaging material
Implementation Considerations
• Define packaging lifecycle o Raw materialso Growth & extractiono Transformationo Transportationo Consumer useo Disposal
• Identify packaging risks across packaging lifecycleo Materials harmful to health or the environmento Dependencies on scarce raw materialso Commodities risko Regulatory risk
• Prioritize impacts, risks and opportunities to reduce packaging against organizational capabilities• Develop sustainable packaging management program
o Strategyo Objectives & targets o Policies, procedures & metricso Communication plan o Implementation
Packaging
Continued
Appendix DLeading Practices

�0
Implementation Considerations
• Identify packaging reduction projectso Using inventory and historical data, identify packaging reduction that may be attained through more efficient
uses and reduction of waste (bundling)o Evaluate feasibility of sustainability initiatives against product/packaging requirementso Coordinate initiatives against regulatory requirements and trends
• Identify reductions/efficiencies through materials reformulationo With suppliers, identify opportunities to modify formulation of packaging material to identify opportunities for
reduction/efficiencieso Assess feasibility of such modifications against processes, packaging functionality requirements, capital
investments, and energy and water impacts• Identify reductions/efficiencies through materials substitution/replacement
o With supply chain partners and internal resources, identify packaging substitution that may provide desired results (e.g. replacing plastic with cardboard)
o Assess opportunity for such replacements against performance and regulatory requirementso Assess the effect of such replacements on costs, energy requirements, availability and operational commitments
(contracts, distribution) and long-term viabilityo Create specific implementation plans with supply chain partners and implement
• Integrate and coordinate packaging sustainability into functional and divisional processes• Identify opportunities for suppliers to enable organizational packaging goals
o Set goals for supplierso Integrate into supplier qualification and contractso Measure and audit performanceo Create Supplier Preferred Alliances
• Measure and optimize packaging programo On an ongoing basis, identify the effects of package “changes” against additional defined metrics such as
availability, effects of supply chain costs, and energy and water impactso Integrate into supplier qualification and contractso As necessary, re-evaluate programs against new and changing requirements, materials availability, regulatory
requirements, and other key metrics to ensure optimization• Continually improve performance
Packaging cont.
Leading Practices Retailer Examples
• Continuous replenishment systems with vendors being established to reduce transport of unwanted goods
• Optimizing distribution network with suppliers and increasing truck loads
• Selecting alternate transport methods, such as rail transport, that generate lower emissions
• Fleet investments, including switching to bio-fuels and investing in doubled-deck trailers, hybrid trucks and other mechanical adjustments to reduce fuel usage
• Grocery Retailer: Engaging 150+ suppliers to participate in a project to create a highly efficient network for transporting goods
• Grocery Retailer: Increased the tonnage of its delivery trucks from 5 to 10 tons. Combined rail and road shipping, leading to a reduction of 60g per t/km of CO
2 emissions
• Mass Retailer: Replaced environmentally harmful HCFC gases in 90 percent of store refrigeration systems. Reduced CO
2 emissions by 30
percent per square foot in UK and Irish stores (over 4 years)
• Grocery Retailer: Investing £3.2 million in a dedicated daily return train service which will divert 4.5 million road miles onto rail, saving over 6,000 tones of CO
2 emissions a year
Emissions Reduction
Continued
Appendix DLeading Practices

��
Leading Practices Retailer Examples
• Investment in store equipment, such as CFC-free refrigeration equipment and energy efficient lighting
• Purchasing energy credits to offset emissions, such as wind energy credits or Greenhouse Gas Emission Reduction Credits (ERCs)
• Mass Retailer: Retailer estimates transportation changes will save $277M per year. Changes include: Adding 100+ new hybrid vehicles to the corporate fleet each year, and adding Auxiliary Power Units, which will eliminate 100,000 metric tons of CO
2 emissions and 10
million gallons of gasoline fuel
• Grocery Retailer: Launched program to quantify, claim, and trade Greenhouse Gas Emission Reduction Credits
Implementation Considerations
• Develop an Energy and/or greenhouse inventoryo Assign resourceso Identify sources across all operations including administrative, production, manufacturing, distribution, etc.o Collect data against all emission sources identifying quantities of assets and generationo Calculate baseline
• Select a greenhouse gas reporting protocolo Map operational/facilities locationso Evaluate against calendar cyclicalityo Participate in Voluntary vs. Regulatory Initiativeso Identify financial reporting implications
• Define organizational boundarieso Equity Share vs. Control Approacho Access to or control of informationo Data credibilityo Participation in Voluntary vs. Regulatory Initiatives
• Set reduction targets• Develop reduction strategy and plan• Identify emission reduction projects
o Operational efficiencieso Replacement/substitution of energy sourceso Logistics and transportation o Production methods and processeso Machinery and equipment
• Identify changes that may be implemented premised ono Short and long terms effects on production capabilityo Costs to organization and customerso Percent reduction of emissionso Regulatory requirements and future trendso Effects on supply chain
• Measure and evaluate solutionso Develop metrics and measure performanceo Evaluate changes against results and future objectiveso Identify modifications or improvementso Track regulatory requirements and future trendso Incorporate effects on supply chain
• Track regulatory evolvement and ensure compliance• Continually improve performance
Emissions Reduction cont.
Appendix DLeading Practices

�2
Leading Practices Retailer Examples
• Leak-detection program in stores
• Implementation of water saving systems such as low-volume aerators, dual-flush systems, ice removal ramps, etc.
• Collaborations with Advocacy groups and communities to improve sustainable access to water in developing countries
• Installation of equipment and processes to recover and reuse water from condensation, truck washing, rainfall
• Mandates to suppliers to reduce in the growing, production, and manufacture of their products
• Building rain gardens to trap water
• Mass Retailer: Implemented leak-detection program in stores which led to 50 percent reduction in water consumption
• Mass Retailer: Signed a partnership agreement on water with WWF to fund two programs in Niger to guarantee sustainable access to water for 64,000 people
• Grocery Retailer: Set up water-saving systems (dual-flush systems, urinal controls) in its stores which have helped reduce water use from 3,426,100m3 to 3,161,811m3, a saving of 7.7 percent or 264,289m3
• Specialty: Installing flush-less urinals which help save 40,000 gallons of water per year
• Club: Recovers 75 percent of water used in car wash systems
• Mass Retailer: Storm water management program used as a component in new store designs to capture and reuse water for irrigation and sewer systems
• Grocery Retailer: Replacing water cooled cooling towers with air cooled cooling towers to reduce water usage
Implementation Considerations
• Measure and baseline current water uses, sources, and water discharges across all business processeso Inputso Operationso Outputso Consumer use and post-useo Asset & Machinery specific
• Conduct water needs assessment• Conduct water impact assessment• Categorize findings across
o Operations, processes, facilities, and equipmento Volumeso Criticality of useo Available substitutes
• Identify seasonality in operations and water requirements• Baseline water uses against production quantities • Understand current and future constraints on water availability against
o Future regulationso Community issueso Future costso Other industry present in area
• Perform risk assessment and cost-benefit analyses againsto Availability of sourceso Regulatory evolvemento Risk of non-compliance to discharge requirementso Costo Risks of shortages due to weather cycles, community needs, competing facilitieso Sustainability objectiveso Requirements and commitments by management (such as contracts)o Technological limitations
Water Conservation Programs
Continued
Appendix DLeading Practices

��
Implementation Considerations
• Identify opportunities to reduce water useo Closed-loop systemso Equipment retro-fitso Recyclingo Operational processes and product innovation
• Identify available alternatives againsto Short and long-term effects on production capacityo Availability of viable alternatives in sufficient quantitieso Costs to organization and customerso Estimated effective reductionso Risks of shortageo Community requirements and demandso Future plans (expansion, sales of facility, etc.)o Regulatory requirementso Effects on supply chain
• Identify opportunities for supplier to enable organizational water goalso Set goals for supplierso Integrate into supplier qualification and contractso Measure and audit performanceo Create Supplier Preferred Alliances
• Measure and evaluateo Using defined metrics, manage performanceo Evaluate changes against results and future objectiveso Identify modifications and improvements
Water Conservation Programs cont.
Leading Practices Retailer Examples
• Supplier Standards and Audits being developed, with retailer sourcing only from compliant vendors
• Farmer collaboration to develop sustainable products, with retailer providing training and financial support
• Private label lines being introduced to offer organic and all-natural foods
• ‘Traceable’ products being offered that provide transparency in product sourcing
• Grocery Retailer: Introduced set of environmental standards that specifies shape, size, taste, variety, and shelf life requirements that applies to all fruit, vegetable and salad suppliers. Over 7,600 farms in 41 countries are registered
• Mass Retailer: Announced plans to purchase all of its wild-caught fresh and frozen fish for the North American market from Marine Stewardship Council certified fisheries over next three to five years
• Specialty Retailer: Works closely with farmers to develop organic, pesticide, and non-GMO products, including training seminars and financial support
• Grocery Retailer: Launched private label line with 150+ USDA-certified organic products
Implementation Considerations
• Inventory organization’s needs for raw agricultural products and their quality includingo Quantitieso Quality (organic, non-OGM, etc.)o Availability on open markets or through special arrangements with specific growers
• Understand needs and requirements byo Consumers, distributors, and retailerso Trends and regulatory requirements (particularly in relation to country-specific issues)
Sustainable Agriculture
Continued
Appendix DLeading Practices

��
Implementation Considerations
• Identify own strategy for addressing needs against those that are real and those that are perceived by marketing issues
o Understand and prioritize issues to be addressed through food and agriculture optimization (what must be done against what could be done)
o Measure risks associated with such programso Evaluate each option against costs, availability, effects on supply chain, marketing, etc.o Identify food and agriculture program(s) to be pursued
• Measure effects of changes/program ono Product availability (shortages)o Customer acceptance and responseo Costso Supply chain strain
• Ongoing evaluation of programo Cost benefit analysiso Risk evaluationso Long-term effects on supply chain partieso Effective sustainability benefits against those perceived or believed to be attainable in previous estimates
Sustainable Agriculture cont.
Appendix DLeading Practices

For more information, please contact:
Peter Capozucca Principal Deloitte Consulting LLP 212-618-4440 [email protected]
Nick Handrinos Principal Deloitte Consulting LLP 203-905-2723 [email protected]
Kathryn Pavlovsky PrincipalDeloitte Financial Advisory Services LLP 713-982-4358 [email protected]
Stephen Sibert Senior Vice President of Industry AffairsGrocery Manufacturers [email protected]

©2007 by the Grocery Manufacturers Association (GMA) and Deloitte Consulting LLP. All rights reserved. No part of this publication may be reprinted or reproduced in any way without written consent from GMA or Deloitte Consulting.


Member of Deloitte Touche Tohmatsu
Grocery Manufacturers AssociationThe Grocery Manufacturers Association (GMA) represents the world’s leading food, beverage and consumer products companies. The Association promotes sound public policy, champions initiatives that increase productivity and growth and helps to protect the safety and security of the food supply through scientific excellence. The GMA board of directors is comprised of chief executive officers from the Association’s member companies. The $2.1 trillion food, beverage and consumer packaged goods industry employs 14 million workers, and contributes over $1 trillion in added value to the nation’s economy.
About DeloitteDeloitte refers to one or more of Deloitte Touche Tohmatsu, a Swiss Verein, its member firms, and their respectivesubsidiaries and affiliates. Deloitte Touche Tohmatsu is an organization of member firms around the world devotedto excellence in providing professional services and advice, focused on client service through a global strategy exe-cuted locally in nearly 140 countries. With access to the deep intellectual capital of approximately 150,000 peopleworldwide, Deloitte delivers services in four professional areas — audit, tax, consulting, and financial advisory serv-ices — and serves more than 80 percent of the world’s largest companies, as well as large national enterprises,public institutions, locally important clients, and successful, fast-growing global companies. Services are not provid-ed by the Deloitte Touche Tohmatsu Verein, and, for regulatory and other reasons, certain member firms do notprovide services in all four professional areas.
As a Swiss Verein (association), neither Deloitte Touche Tohmatsu nor any of its member firms has any liability foreach other’s acts or omissions. Each of the member firms is a separate and independent legal entity operatingunder the names “Deloitte,” “Deloitte & Touche,” “Deloitte Touche Tohmatsu,” or other related names.In the United States, Deloitte & Touche USA LLP is the U.S. member firm of Deloitte Touche Tohmatsu and servicesare provided by the subsidiaries of Deloitte & Touche USA LLP (Deloitte & Touche LLP, Deloitte Consulting LLP,Deloitte Financial Advisory Services LLP, Deloitte Tax LLP, and their subsidiaries), and not by Deloitte & Touche USALLP. The subsidiaries of the U.S. member firm are among the nation’s leading professional services firms, providing audit, tax, consulting, and financial advisory services through nearly 40,000 people in more than 90 cities. Known as employers of choice for innovative human resources programs, they are dedicated to helping their clients and their people excel. For more information, please visit the U.S. member firm’s Web site at www.deloitte.com
Copyright © 2008 Deloitte Development LLC. All rights reserved.