balanced scorecard usps
DESCRIPTION
Balanced Scorecard in postal industryTRANSCRIPT
Nicholas J. MathysProfessor of ManagementDepartment of ManagementKellstadt Graduate School of BusinessDePaul University
Kenneth R. ThompsonProfessor of ManagementDepartment of ManagementKellstadt Graduate School of BusinessDePaul University
Using the Balanced Scorecard: Lessons Learned from the U.S. Postal Service and the Defense Finance and Accounting Service
Man
agin
g fo
r Pe
rfo
rman
ce a
nd
Res
ult
s Se
ries
2 0 0 6


Using the Balanced Scorecard: Lessons Learned from the U.S. Postal Service and the Defense Finance and Accounting Service
Nicholas J. Mathys Professor of Management Department of Management Kellstadt Graduate School of Business DePaul University
Kenneth R. Thompson Professor of Management Department of Management Kellstadt Graduate School of Business DePaul University
MAnAGinG For PerForMAnce AnD reSULtS SerieS

�
t A B L e o F c o n t e n t S
Foreword .............................................................................................4
Executive Summary ..............................................................................5
Introduction .........................................................................................6 What is a Balanced Scorecard and Why Use it? ............................6 Why is Balance important? ............................................................7 Why is Linking or Aligning Performance Measures important? ......7 the Balanced Scorecard as a Management tool to
improve Performance ..............................................................8 Differences in the BSc Between Private and Public Sectors ...........9
Defense Finance and Accounting Service ..........................................11 Legislative environment of the 1990s ..........................................11 Beginning of Major changes .......................................................1� introduction of the BSc into the Planning Process .......................13 continued BSc Development ......................................................�0 ongoing changes ........................................................................�5 BSc Benefits ................................................................................�7 Best Practice ................................................................................�7
The United States Postal Service .......................................................�9 overview of the Postal Service ....................................................�9 Structural changes and the evolution of the
Postal environment ................................................................�9 the emergence of a Balanced Scorecard Approach .....................30 the need for Balance ..................................................................3� the Application of the Balanced Scorecard to USPS....................3� the national Performance Assessment Program ..........................34 Performance results ....................................................................37 Summary .....................................................................................39
Building a Balanced Scorecard Using Lessons Learned from DFAS and USPS .........................................................................43 Action Step 1: Develop a clear Mission Statement ......................43 Action Step �: Define Key customer and
Stakeholder requirements .....................................................44 Action Step 3: Develop a Quantified Strategic and
Budgetary Plan ......................................................................46 Action Step 4: Set Direction and Key outcome Measures
for the organization ..............................................................47 Action Step 5: Define Key internal Processes and
Measures of Performance ......................................................49

3
Action Step 6: translate needed Process changes into Learning and Development Plans ..........................................50
Action Step 7: Put the Balanced Scorecard together ....................51 Action Step 8: Develop Action Plans ...........................................53 Action Step 9: Actively Work to Manage and continually Develop the Scorecard ..........................................................54 conclusion ..................................................................................56
Endnotes ............................................................................................58
About the Authors ..............................................................................60
Key Contact Information ....................................................................6�

iBM center for the Business of Government4
USinG the BALAnceD ScorecArD
F o r e W o r D
on behalf of the iBM center for the Business of Government, we are pleased to present this report, “Using the Balanced Scorecard: Lessons Learned from the U.S. Postal Service and the Defense Finance and Accounting Service,” by nicholas J. Mathys and Kenneth r. thompson.
the balanced scorecard approach to managing organizations was first broached in a 199� Harvard Business Review article by David norton and robert Kaplan. it swept the business world and became an accepted management approach in over half of the Fortune 500 companies.
the public sector was less quick at adopting this approach. oftentimes, it was piloted in small units or in support functions. But when an agency leader made a sustained commitment, this approach contributed to enormous differences in performance. this report showcases two large federal agencies that adapted the balanced scorecard approach to their operations and have used it for more than five years to drive improved performance.
the challenge, Professors Mathys and thompson note, isn’t creating a scorecard; it’s getting its elements to align and link to each other and to the operations of the agency. they tell the compelling stories of how the U.S. Postal Service and the Defense Finance and Accounting Service did just that. they conclude with nine action steps that other agency leaders might adopt if they too want to achieve similar improvements in performance.
Albert Morales Debra cammer Managing Partner Partner and Vice President iBM center for the Business of Government Public Sector Financial Management [email protected] iBM Business consulting Services [email protected]
www.businessofgovernment.org 5
USinG the BALAnceD ScorecArD
e x e c U t i V e S U M M A r ye x e c U t i V e S U M M A r y
the call for greater responsiveness and performance measures in the government sector has never been greater and will continue to be a clarion call, particu-larly with the shortfall of the government’s response in the aftermath of hurricane Katrina. Government organizations must be responsive, use their resources well, and provide good value to the user and account-ability to the taxpayer. one method that has had significant demonstrated success to improve process efficiency, timeliness, and customer satisfaction in business is the balanced scorecard. this approach also has been applied in government sector organizations with success. We examined two federal organizations, the Defense Finance and Accounting Service (DFAS) and the United States Postal Service (USPS)—two organizations with different missions and different types of operations. We wanted to learn how they developed the balanced scorecard, how they modi-fied the approach to meet their needs, what lessons were learned in its application, and what organizations might do to increase their success with the balanced scorecard approach.
the results show that both organizations had successful applications of the balanced scorecard. Performance improved on all the key areas that each organization measured. in addition, employee sat-isfaction improved in both organizations. this was especially significant for DFAS, as they had undergone some very dramatic reductions in force. Finally, cus-tomer satisfaction improved dramatically in both orga-nizations and value added improved in the multiple measures that were used.
however, at the time of our interviews, both organiza-tions still were having some difficulty deploying the scorecard throughout the organization. Union or civil service work rule restrictions, reliance on tradition, and difficulty with translating personal development
goals into unit goals seem to be part of the problem. however, we also saw problems in the application of the scorecard itself. First, there is the traditional focus in most organizations on financial performance. While the scorecard expands traditional financial perfor-mance assessment to include customer satisfaction, process management, and organizational develop-ment and learning, often there are not strong linkages between these elements in many applications of the scorecard. these linkages are essential in building a high-performance organization as demonstrated in the Baldrige Award criteria. the national institute for Science and technology (niSt) reviews the top- performing organizations to determine if they meet these criteria. the Baldrige criteria reflect the effective business practices of high-performing organizations. in november �005, congress authorized niSt to expand the Baldrige program to include government and not-for-profit organizations. A significant aspect of the criteria is the importance of goal alignment throughout the organization.
to meet the complexity of aligning elements, we advo-cate a much more stringent approach to the scorecard that carefully links elements and expands definitions to match the differences found in the nature of gov-ernment organizations. Missions and a customer/stakeholder focus drive the organization, followed by financial performance measures that meet the needs of key stakeholders (government authorizing and funding bodies). internal performance measures are based on the key processes that drive customer and stakeholder satisfaction and influence financial per-formance. organizational learning and development aspects focus on improvements that directly affect the key value-added performance measures that sup-port customer/stakeholder satisfaction measures. We address this alignment issue after our review of each organization’s approach to the scorecard.

iBM center for the Business of Government6
USinG the BALAnceD ScorecArD
the balanced scorecard (BSc) approach has been used extensively in for-profit organizations since its popular inception with the work of norton and Kaplan in 199�.1 only recently has the approach been advocated in public sector organizations by such groups as the Balanced Scorecard interest Group sponsored by the American Society for Public Administration.� While there have not been many controlled experiments that provide convincing proof of the efficacy of scorecard use, the scorecard is built on solid principles that have demonstrated their effectiveness through various rigorous research designs. the efficacy of goal setting, the alignment of quantified targets across departments, the use of contingent reinforcements based on performance, and the development of commitment through effec-tive two-way communications are all principles that have been demonstrated as effective business tools and are part of the balanced scorecard philosophy.
Government organizations are like businesses; businesses that may not be run for profit but rather are organized to meet a social goal in an effective and efficient manner. in this report, we focus on two federal organizations and report on their use of the balanced scorecard. our goal is to show what each organization did to make the program success-ful and what they are doing to sustain and improve their efforts using the balanced scorecard approach. We also consider the “lessons learned” in their adaptation of the balanced scorecard. in the final section, we take the lessons learned coupled with our analysis of their success and provide our own road map of action steps to guide the leaders of other public sector organizations who may be think-ing of applying a BSc approach or are grappling with some of the issues in using the scorecard.
What Is a Balanced Scorecard and Why Use It?reliance exclusively on financial performance measures is similar to “trying to drive an automobile by looking in the rearview mirror rather than the road ahead.” the balanced scorecard, or BSc, is an attempt to achieve a more proactive, forward view to managing an organization while still taking into account traditional measures. it does this through a “balanced” perspective of measures that assess the effectiveness in meeting the organization’s vision and strategy. Four areas are considered in norton and Kaplan’s model: Financial, customer, internal Business Processes, and Learning and Growth.3 Visions and strategies are translated into objectives, measures, targets, and initiatives that answer the questions in each of the four categories:
• For the financial category, the main question is: “to succeed financially, how should we appear to our shareholders?”
• For the customer category, the focus is: “to achieve our vision, how should we appear to our customers?”
• the internal business process category focuses on the question: “to satisfy our shareholders and customers, what business processes must we excel at?”
• the learning and growth category focuses on answering the question: “to achieve our vision, how will we sustain our ability to change and improve?”
Introduction

www.businessofgovernment.org 7
USinG the BALAnceD ScorecArD
Why Is Balance Important? each of these four areas needs to be addressed to have a “balanced” methodology in reaching the organization’s vision and strategy. that is why each of the four areas is linked in the norton and Kaplan model; it demonstrates that each of them is impor-tant in linking actions to meet the overall vision and strategies of the organization. the scorecard then becomes a driving force to guide organizational actions and create a culture of “clarifying and trans-lating the vision and strategy to actions, communi-cating and linking these actions to all levels of the organization through planning and setting quantified targets and aligning these targets to meet the goals in each of the four balanced scorecard areas.”4
traditionally, performance measures used to assess success were financial in nature. this allowed only one view of what happened. the measure is com-plete only at the moment, and there are limited indications where current operations are effective or ineffective as the measures are historical in nature. Financial measures are outcome measures that show what has happened in the past. A more forward-looking set of performance measures, like those used in the BSc, tells managers and employees where they are headed, what aspects of the organization are succeeding, and what aspects need improvement to effect future successful outcomes. For example, customer satisfaction levels tell us something about the future predisposition of customers to use our service in the future, which relates to future finan-cial measures. in the same manner, if we know there is a connection between meeting customer requirements and internal process measures that are tracked, then we have a clear sense of what we need to do in managing our processes in order to meet customer needs.
Why Is Linking or Aligning Performance Measures Important?Performance measures provide the link between strategies and actions. Many businesses have stra-tegic plans and business strategies. the real issue is how to implement these strategies in a meaningful way, in a way that is shown to affect the success of the business. however, that success has to be
measured. to do this, the BSc links these strategies to organizational operations. essentially, BSc serves to link the long-term goals of an organization with short-term operational control by means of a cause-and-effect model. it attempts to determine on a daily, monthly, and annual basis what is working to achieve organizational success (cause) and what, in fact, is limiting that success and should be changed. it not only does this at a high management strategy level, but also communicates this down to an opera-tional level.
to do this, the balanced scorecard needs to be considered more in terms of a hierarchical relation-ship that aligns elements of the organization into a cohesive set of actions to meet the desired strategy. For a for-profit organization, this would place elements more in a hierarchical relationship, much as Kaplan and norton provide in a later article.5 they viewed that through strategic mapping, the scorecard items were hierarchically related.
• Vision and strategies are met through meeting financial outcome goals.
• Financial outcome goals are related to meeting customer satisfaction measures.
• Both improving customer satisfaction and finan-cial outcomes are directly related to effective and efficient internal business process management.
• Learning and growth aspects are focused on improving internal business processes in order to improve output goals.
the key in aligning these elements relates to mea-sures, and linking the measures to that one level relates to another level. “inappropriate measures lead to actions incongruent with strategies, however well formulated and communicated. Appropriate measures should provide and strengthen this link, and both lead to attainment of strategic goals and impact the goals and strategies needed to achieve them.”6 in order to use the BSc measures correctly (or any other performance measurement system), using the proper measures for the present business environment is crucial for the alignment that is needed so that effort is focused in the organization.
iBM center for the Business of Government8
USinG the BALAnceD ScorecArD
The Balanced Scorecard as a Management Tool to Improve PerformanceWhile many organizations use the balanced scorecard as an evaluative tool, we strongly support the notion of a BSc as a management tool. What is the difference? As an evaluative tool, the focus is more on using the scorecard for the assessment of (individual) perfor-mance, which leads to many different sorts of behav-ioral consequences that may not support organizational performance improvement. For example, increased pressure to reach targets often will lead to increased
pressure to reduce those same targets in order to increase the likelihood that targets will be reached. As a management tool, BSc focuses on improving organi-zational performance and clarifying where the organi-zation should focus its efforts toward mutual problem solving. As a by-product, BSc acts as a guidepost that also helps to improve individual performance.
According to a conference Board study,7 “poor and insufficient feedback” was the number one cause of poor performance in the workplace and resulted in 60 percent of performance problems.” this factor was �0 percent higher than the next cause. the study fur-ther states that proper performance feedback requires performance expectations to be communicated and understood, and to lead to mutual agreement on problem solving. With BSc, there is a clear set of goals aligned to the vision and strategy of the organization. this allows management to communi-cate objective expectations for performance, while also allowing a greater understanding of those objec-tives. this empowers both management and staff to make agreed upon improvements.
BSc allows managers to get and give feedback from all units and all levels of the organization; this results in focusing resources where they are needed most and where they will be most effective in changing overall performance. BSc allows an orga-nization to avoid such costly misallocations while reaping the benefits of proper allocation. Because of the focus of this approach, questions will be asked such as “how does this allocation or program expenditure relate to improving our key internal processes?”—which are then related to improve financial and customer satisfaction measures.
in addition, because of the quantified measures and target of performance created in a BSc system, fact-based management can replace intuition or the educated guess. Management develops a greater ability to trace its actions, and the actions of a par-ticular unit, to business outcomes. conjecture and the causes of poor projections are reduced signifi-cantly. in fact, it has been found that when more non-financial measures are used, earnings projec-tions become more accurate.8 this forward perspec-tive shift contributes to a new management style, one in which future outcomes can be anticipated.
the BSc also allows best practices to be identified. As inefficiencies are uncovered, high-performance areas
Abbreviations and Acronyms
BEA Business environmental Assessment
BSC Balanced Scorecard
BSI Balanced Scorecard institute
CE client executive
CFO chief Financial officer
DA Developmental Assignment
DBE DFAS Business evolution
DFAS Defense Finance and Accounting Service
DoD Department of Defense
EAS executive and Administrative Schedule
ELFM entry Level Financial Managers
ELPA entry Level Professional Accountants
FFMIA Federal Financial Management improvement Act
FTE Full-time equivalent
GMRA Government Management reform Act
GPRA Government Performance and results Act
NIST national institute of Standards and technology
NPA national Performance Assessment
OMB office of Management and Budget
PCES Postal career executive Service
PES Performance evaluation System
REDRESS resolve employment Disputes reach equitable Solutions Swiftly
SPSG Strategic Planning Steering Group
SWOT Strengths, Weaknesses, opportunities, and threats
USPS United States Postal Service

www.businessofgovernment.org 9
USinG the BALAnceD ScorecArD
can be defined and the successful activities of these high performers adopted in areas where appropriate.
Differences in the BSC Between Private and Public Sectors Using the same performance metrics in the public sector as the private sector is likely to be ineffective since public sector goals differ drastically from those of the private sector. Private sector focus is primarily on shareholder value: the bottom line. Funding comes from various sources, and as long as shareholder financial needs are being met, the company can function as it pleases (see table 1).
the public sector faces a quite different environ-ment. Public sector funding comes, in most cases, from the taxpayers it is servicing. the measure of success is not shareholder value or profit but rather how well the agency is meeting the mission given to them by congressional statute or executive order. Although the agency can oftentimes perform this mission in whatever way it sees fit, it is still bound by the directive of the mission. thus, strategic value comes in the form of fulfilling the mission, and ful-filling the mission comes down to customer satisfac-tion with the agency’s service. however, defining customer needs is a bit more complex.
A second difference evolves through the number of customers or stakeholders that a public sector organization must serve. Financial measures in the BSc relate to financial performance, which is a means to satisfy investors (shareholders, investment
firms, bondholders). in the public sector organiza-tion, the financial measures are just part of what is needed to please the “investors,” which in this case would be the funding agencies. While private sec-tor clients are not concerned with an organization’s internal efficiency so long as their product, price, and service needs are met, internal efficiency is of great concern to the public sector’s stakeholders, who also are its source of funding. taxpayers also require accountability that their tax dollars are being used effectively and efficiently. therefore, program performance, efficient use of resources, and satisfac-tion with the service by the public are additional key issues.
these differences lead to a different sort of hierar-chical model for the balanced scorecard, as seen in Figure 1 on page 10.
First, as increasing shareholder wealth does not have primacy in a governmental operation, finan-cial performance becomes less critical. however, reaching the mission of the organization is of key interest to those who fund the organization. hence, the government model needs some changes in the hierarchical ordering compared to how Kaplan and norton arranged the hierarchical ordering in their mapping article.
Some public sector balanced scorecard advocates have put financial measures at the bottom of the model to indicate the importance of having ade-quate funding as a precursor to developing the organization, as done in Figure 1. however, to be
Features Private Sector Public Sector
Focus Shareholder value Mission effectiveness
Financial goals Profit; market share growth; innovation; creativity
cost reduction; efficiency; accountability to public
Efficiency concerns of clients no yes
Desired outcome customer satisfaction Stakeholder satisfaction
Stakeholders Stockholders; bondholders taxpayers; legislators; inspectors
Who defines budget priorities customer demand Leadership; legislators; funding agencies
Key success factors Uniqueness; advanced technology
Sameness; economies of scale; standardized technology
Table 1: Comparing Balanced Scorecards in the Private and Public Sectors

iBM center for the Business of Government10
USinG the BALAnceD ScorecArD
consistent with usage in the private sector, we look at financial measures as output measures that are precursors to meeting the mission, which will in the end lead to adequate future funding.
internal process management would be similar for government and for-profit organizations as both relate to the key value-added processes that the organization provides. For a car manufacturer, the key process would be producing automobiles and trucks. For the government agency, it is providing the service promised through its mission. For the United States Postal Service, the mission is deliver-ing mail. For the Defense Department’s Defense Finance and Accounting Service, the key process is taking invoices it receives from its customers and translating those into payments.
internal processes are important to improving financial and customer satisfaction measures of performance. this is why there is a direct line from internal processes to both customer/user satisfac-tion and to financial performance. in the for-profit world, the financial ties directly to the overall goal; in government organizations it is only one part of fulfilling the mission, with customer/user satisfaction the other part. in both cases, learning and growth support the development of internal processes.
in summary, the balanced scorecard is an effective management tool that can support improvements in government sector organizations. there needs to be some modification in the basic strategic mapping model provided by Kaplan and norton to align
elements in the BSc to correspond to the environ-ment faced by government organizations. this allows a focus on the mission of the organization as the focal point rather than return to shareholders.
We now focus on two government organizations that have adopted the balanced scorecard as a major part of the management effort. First, we look at the Defense Finance and Accounting Service and what they did to develop the organization culture as they introduced the scorecard. in the second case, the United States Postal Service, the focus is on the difficult time they had in enacting the scorecard and how reinforcement systems became an important part of their process. Both cases provide two differ-ent sorts of initial organizational cultures and envi-ronments that needed different approaches to effect a quality scorecard introduction and deployment.
Government
Mission
Financial
Learning & Growth
Internal Processes
Customer/Service Users
For-Profit Business
Goals/Strategies
Financial Financial
Customer
Internal Processes
Learning & Growth
Figure 1: Comparing the Scorecards for Government Versus For-Profit Organizations

www.businessofgovernment.org 11
USinG the BALAnceD ScorecArD
Defense Finance and Accounting Service
Legislative Environment of the 1990sin 1990, the chief Financial officers (cFo) Act was enacted by the United States congress to improve the financial management practices of the federal government, and to ensure the production of reli-able and timely financial information for use in the management and evaluation of federal programs. one of its major provisions was to establish a chief financial officer position for all federal agencies.9
Within this legislative environment, the Defense Finance and Accounting Service (DFAS) was created by the secretary of defense in 1991 to reduce the cost of Department of Defense (DoD) finance and account-ing activities and to strengthen financial management through consolidation of finance and accounting activities across DoD. DFAS inherited 330 finance and accounting locations and over 3�0 different finance and accounting systems. More than �7,000 people were members of finance and accounting operations in DoD that were capitalized into DFAS.10 When DFAS was created, it became a fee-for-service organization and operates as a working capital fund. it receives no appropriations directly from the government and is financed by its customers, primarily the military departments and defense agencies.
the continued concern in government circles to improve performance, reduce costs of all government agencies, and make them more like private sector organizations resulted in new legislation focused on improved performance and results as well as amend-ments to the cFo Act of 1990. the Government Performance and results Act of 1993 (GPrA) required all agencies to set strategic goals, measure performance, and report on the degree to which goals were met. in addition, much like private sec-tor practice, it required an annual performance plan
that could provide a direct link between the strategic goals of an agency and employees’ daily activities. the Government Management reform Act (GMrA) of 1994 furthered the objectives of the cFo Act and GPrA by requiring that all federal agencies build or strengthen the management capacities that form the foundations of high-performing organizations. these capacities included:
• A clear mission and vision for the organization and a sense of direction that is clearly and consistently communicated by top leadership
• A strategic planning process that yields results-oriented program goals and performance mea-sures that flow from and reinforce the organization’s mission
• organizational alignment to achieve goals
• Sound financial and information management systems
• the strategic use of technology to achieve mission-related goals
• the effective management of human capital—the organization’s employees—including ensuring that the right employees are on board and provided with the training, tools, incentives, structures, and accountability needed to achieve results11
two years later, the Federal Financial Management improvement Act of 1996 (FFMiA) was passed. it continued to advance federal financial management practices by ensuring that federal financial manage-ment systems provide accurate, reliable, and timely financial management information to the govern-ment’s managers. the intent and the requirements of this act required that agencies publish audited financial reports.1�

iBM center for the Business of Government1�
USinG the BALAnceD ScorecArD
By the mid-1990s, DFAS made significant progress in consolidating and reconciling the different sys-tems used by the four military services and defense agencies. Finance and accounting operations were consolidated and realigned to fewer locations, caus-ing many independent installation offices to close and personnel to be reduced. Unfortunately, politi-cal considerations prevented achieving some econo-mies envisioned by DFAS. For example, DFAS desired to consolidate all its operations at fewer sites called “megacenters,” but pressure from some members of congress required DFAS to continue operations at �1 operating locations. By its 10th anniversary in �001, DFAS operated from �6 locations with 18,400 personnel and had reduced the number of account-ing and finance systems in use to 76.13 By �011, DFAS is projected to reduce to three locations from its present �6.
While consolidation was progressing, it was based on an assumption that finance and accounting func-tions within the Defense Department were inher-ently governmental. however, in compliance with the Federal Activities inventory reform Act, DFAS completed a position-by-position review in �000. the review determined that 8� percent of its full-time equivalent (Fte) employees were commercial in nature, and no specific military requirement dictated that these business functions be performed by government employees. in fact, a majority of the activities performed by DFAS were commercially available in the competitive private sector. At the same time, the services provided by DFAS were considered to be too expensive, of poor quality, and untimely by its customers. Since many large and well-run corporations outsourced many finance and accounting tasks, it was suggested by the Business executives for national Security, a nationwide, non-partisan organization, and some senior executives in the office of the Secretary of Defense, that DFAS be outsourced.14 Because of the service-provider relationship with its customers, DFAS had an oppor-tunity to seek continuous innovation and improve-ment quality of services, but the agency was more involved with conducting operations instead of improving performance.
Beginning of Major Changesin May 1999, thomas r. Bloom was appointed by DoD as the new director of DFAS. he immediately recognized that the organization was providing poor
services and determined that significant changes were needed. one of the first steps he took was to visit many high-performing private corporations to understand their business models and establish a Leadership council of the top 18 executives at DFAS that would provide a collaborative decision process to lead DFAS into the �1st century.
Using the Leadership council to dissect these models and separate the good from the bad, Bloom proposed implementing a new business model called the DFAS Business evolution (DBe). it outlined steps to strengthen customer relationships and improve busi-ness processes to deliver “best value” services to its customers: soldiers, sailors, airmen, marines, civil-ians, military departments, and defense agencies. As a result, three business lines—Military and civilian Pay Services, commercial Pay Services, and Accounting Services—were established. Within each business line, different product lines such as civilian pay, military pay garnishments, contract pay, and vendor pay became business units. With the establishment of these units, DFAS became more aligned to com-mercial business practices. Additionally, it redefined internal DFAS executive responsibilities and relation-ships and led to the development of distinct initia-tives that concentrated solely on specific products for specific customers. this improved the focus on cus-tomer needs and more clearly identified access to and accountability for each DFAS service. Figure � shows the DFAS organizational relationships under the DBe. the DBe also set the stage for the creation of an envi-ronment for innovation and professional growth for every DFAS employee.15
Client Executive RoleWith implementation of the DBe, a new client executive (ce) role was established to serve DFAS customers. the ce serves as a steward for custom-ers, helping them find solutions to their needs. to assist the ces in accomplishing this, each business line conducted a needs analysis and customer sur-vey to better understand the critical areas needing improvement. Additionally, DFAS used an Activity-Based costing analysis to conduct an end-to-end analysis on all major processes to identify ways to improve quality and lower costs. While implement-ing these improvements, DFAS remained focused on achieving 100 percent of its Agency Performance contract commitments as well as the goals outlined in the Financial Management improvement Plan.

www.businessofgovernment.org 13
USinG the BALAnceD ScorecArD
Strategic Planning ImprovementsAlthough DFAS had a good strategic plan, when Bloom became the director he quickly learned that it was a plan that was not really used. in october �000 after the DBe was implemented, he held a three-day planning session with �0 top executives to develop a revised, usable strategic plan. At the beginning of the session, and after completing a detailed SWot (strengths, weaknesses, opportuni-ties, and threats) analysis, his leadership team finally realized that “our platform is on fire” and all functions within the agency were prime candidates for outsourcing.
What could be done and how should DFAS react? From the planning session came new strategies that would allow DFAS to become competitive with private sector companies. this meant world-class performance was needed. As a result, a new DFAS strategic plan was published in november �001 that outlined clear goals and objectives focused on improv-ing quality and performance and reducing cost.
the leadership team quickly determined that it did not have a mechanism in place to monitor and manage progress or evaluate performance toward achieving strategic goals and objectives. hence, Lee Krushinski, director of Accounting Services, with the assistance of ed Kufeldt, director of Plans and requirements, was put in charge of finding a solution and communicating the new strategy to the organization. As part of this charge, they visited private sector firms and evaluated some public sector organizations involved with changing focus to
become more strategy and performance centric. this led to the recommendation to develop and imple-ment the Kaplan and norton balanced scorecard, or BSc, methodology. As a result, they created the stra-tegic bridge (see Figure 3 on page 14) from the site-focused organization to the new business enterprise. including the balanced scorecard into the strategy development model supported the case for change and provided a sound foundation for linking goals, objectives, measures, and targets to outcomes.
Introduction of the BSC into the Planning ProcessDFAS actually started defining its balanced score-card process by first updating its strategic plan and vision with assistance from a consulting firm. (the box below provides the revised mission and vision
Army Navy Air Force
Customers
Marine Corps Defense Agencies
Army Navy Air Force
Client Executives
Marine Corps Defense Agencies
Military & Civilian Pay Services Commercial Pay Services Accounting Services
DFAS Business Line Executives
Support Services
Figure 2: DFAS Reorganization Using Client Executives
The DFAS Mission and Vision
Mission: Provide responsive, professional finance and accounting services for the people who defend America.
Vision: Best value to our customers • World-class provider of finance and accounting
services
• trusted, innovative financial partner
• one organization, one identity
• employer of choice, providing a progressive and professional work environment

iBM center for the Business of Government14
USinG the BALAnceD ScorecArD
statements). Additionally, a review of public and commercial scorecards, like Mobil oil’s, assisted in identifying useful measures. DFAS was already using a system that identified performance management indicators. however, it was strictly a report card approach that measured about 350 items and was viewed by many as a non-value-added activity that required significant time for data gathering and did not receive much attention.
the director understood that most strategic plans die a very slow, dusty death in someone’s bookcase, and he didn’t want that to happen. he wanted to ensure that the strategic plan remained vibrant and that DFAS could measure how successful it was in achieving its strategic targets.
At first there were some false starts as the execu-tive team struggled with the revision of the strategic plan and identification of possible tools for track-
ing execution. When Accounting Services Director Krushinski tasked his staff to research tracking tools, they identified an organization called the Balanced Scorecard institute (BSi) that had some potentially useful tools. their further research and persis-tence resulted in Krushinski reading The Balanced Scorecard by Kaplan and norton.16
At a subsequent monthly meeting of the Leadership council, Krushinski introduced the balanced score-card as a framework for strategic planning that could provide the necessary linkage to the already developed strategic initiatives.
After this briefing, it was clear that the director sup-ported the value of the BSc approach and that all the members of the Leadership council realized that even though the budget drove most of what the organization tried to accomplish, it wasn’t the only important target. Many other factors were also impor-
1. Current State • Where we are now • SWOT assessment • What do our
customers/people/ others say about us?
2. Vision & Goals • Where do we want to be in 3–5 years? • How will we be known?
3. Case for Change • What is the burning
platform? • How much change
is required?
4. Strategy • What steps are we going to take to achieve our vision given where we are?
5. Balanced Scorecard • What are our objectives
in the shorter term? • How will we measure
our strategic success? • What initiatives will we
pursue to make sure we achieve our targets?
6. Learn & Adjust • What refinements
do we need to make?
4. Strategy
Barriers
Environmental Analysis
2.Vision &
Goals
3.Case for Change
1.Current
State
Figure 3: Strategy Development Model

www.businessofgovernment.org 15
USinG the BALAnceD ScorecArD
tant: customer satisfaction, process improvements, and the role of the employees. the council members real-ized that all this “other stuff” also needed attention in order to achieve the new DFAS vision.
Before the BSc approach was implemented, DFAS concentrated primarily on the financial perspec-tive without considering its interrelationship with other areas. For example, a cost reduction target of 5 percent for the year would be established with-out understanding what was needed to achieve it. Using the BSc approach made leadership realize that incremental improvements in quality brought about by new processes or “employee growth or learning” meant less rework and higher customer satisfaction. these improvements, in turn, meant fewer workers were needed and translated into a cost reduction. Leadership realized that while cost reduction may be the ultimate goal, concentrating on the enablers—people, internal processes, and customers—was more important and would achieve the desired cost reduction as a by-product. At the same time, the new processes improved quality, and the cost reduction could be passed on to the cus-
tomer with a resulting overall increase in customer satisfaction. consequently, all four perspectives of the scorecard were met.
in arriving at this understanding, however, the Leadership council for a long time wrestled over the relationship among the four BSc perspectives. they finally agreed that because DFAS is a service, public sector organization, the key driver was the customer and that the foundation was its people. improving the skill level of its workforce would allow the talent of the employees to identify the “best” way to improve processes and would solve the problems or needs of the customer. the use of this intellectual talent would improve internal processes, reduce costs, and ultimately achieve better customer service. the DFAS pyramidal BSc model (see Figure 4) was developed to explain the interrelationships among the perspec-tives to employees rather than to represent any hierar-chy among each of the perspectives.
While the BSc pyramid explained the relationship among the four perspectives, balancing the impor-tance of the four perspectives remained a significant
Best Value
Improve client/ customer satisfaction
Implement transformation strategy
Reduce cost to the client/customer
Improve and leverage quality
Encourage innovation
Deliver system solutions
Enhance ability to recruit and retain DFAS talent
Enhance employee competence
Develop a climate for action
Increase employee satisfaction
Customer
Financial
Internal
Growth & Learning
Figure 4: Balanced Scorecard Hierarchy

iBM center for the Business of Government16
USinG the BALAnceD ScorecArD
challenge. DFAS was still under severe pressure to reduce costs by 5 percent in absolute terms per year, and the director was keenly aware that if costs were not significantly reduced, the future of DFAS was not guaranteed.
Integrating BSC into Strategic Planningthe DFAS mission and vision reflect a conscious decision by DFAS to be more customer focused. the DFAS strategic plan focuses on goals and objec-tives to advance the DFAS mission and to attain the vision. through the balanced scorecard process, the directors of all product lines and support services participated in developing goals and objectives and linking together all DFAS organizational initia-tives. Additionally, to help achieve its vision to be world-class in the finance and accounting industry, DFAS used the “best practices” of other world-class organizations as gauges to measure its performance. thus, the strategic plan became a product of DFAS internal expertise, external benchmarking, legal and regulatory guidance, and industry consultation.
in developing strategy, DFAS analyzed its current state, articulated its desired future state, and identi-fied the case for change. Starting in �001, DFAS began to build on its strengths and create new synergies to advance its desire to be more customer focused. the Leadership council met monthly to monitor the key strategic initiatives being pursued to transform the organization. these initiatives concen-trated on opportunities to deliver outstanding customer service and to firmly imbed the strategic planning process into the agency’s organizational culture.
Establishing a Governance StructureLee Krushinski played an important part in this effort by working with individual employees and groups to identify initiatives that supported the strategy and then acting as their champion. Additionally, he convinced the director to establish a Strategic Planning Steering Group (SPSG), composed of seven Leadership council members, as a means to further improve the gover-nance process. this group included representatives from key business lines, the chief information officer, the human resource director, and the chief finance officer. they were tasked to develop a new strategy and implement a new strategic plan that embodied the DFAS vision to become a world-class financial and
accounting organization. Additionally, Bloom believed that a strategic plan only works when embraced by all the employees in the organization and integrated into their day-to-day events; the key to ensuring this was to communicate the agency strategy using all the means of communication available, including face-to-face communication as well as electronic and print media. Figure 5 describes the governance structure relation-ships. A Balanced Scorecard Working Group also was established to involve representation from across all business lines and support organizations. the working group worked closely with the SPSG and developed proposed scorecard measures and targets, formulated definitions, monitored the scorecard process, and reviewed data for integrity.
to support monitoring the implementation of the strategic plan and measuring progress toward achieving the DFAS vision, the balanced scorecard process was designed and implemented in Fiscal year �001. the first step in designing and rolling out the BSc was to understand and identify the four broad areas, or perspectives, to be measured: customer, Financial, internal Business Processes, and Growth and Learning. At the same time, feedback mechanisms were established to ensure progress in these areas and proper alignment to DFAS strategy.
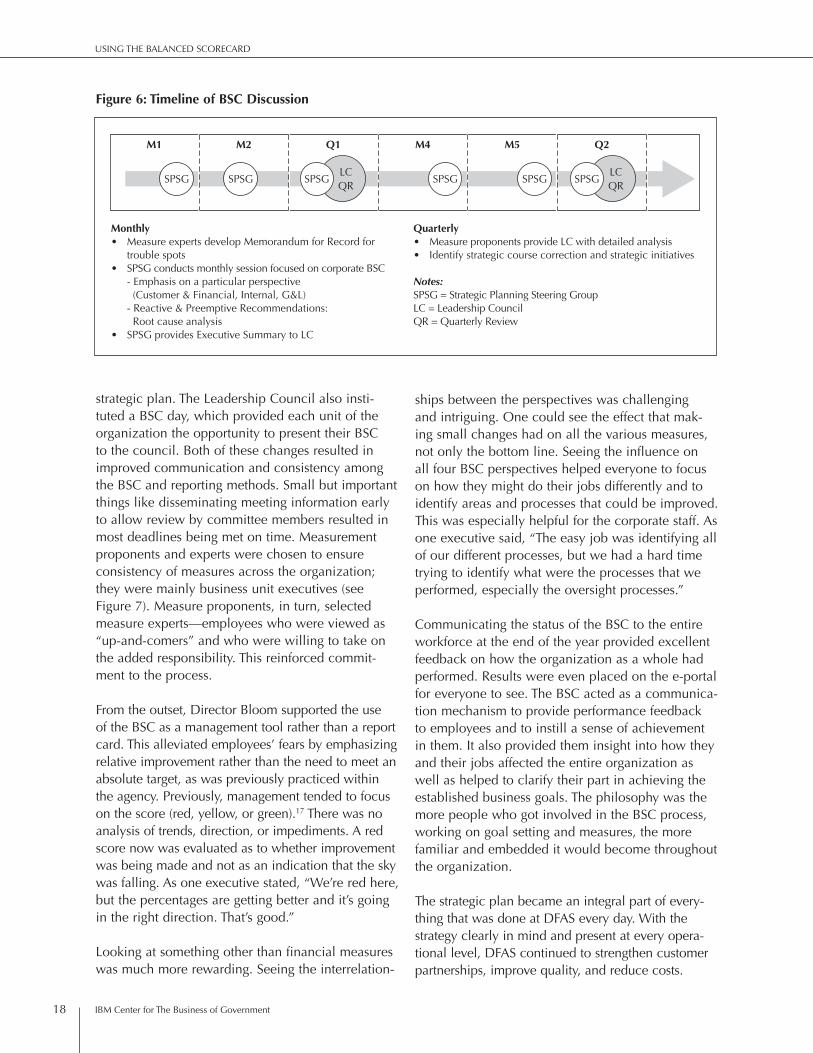
Gaining Acceptance and Aligning the BSCAlthough the Leadership council was primarily responsible for developing the BSc at their monthly meetings, leadership was committed to ensuring employee participation at all levels through open communication. establishing the governance struc-ture, described in Figure 5, provided a means for all managers and employees to provide input into the process. timelines, seen in Figure 6 on page 18, were established to ensure an effective coordination and feedback process among the various commit-tees. Scorecard results were reported to business unit directors on a monthly basis, and every quarter the Leadership council conducted a two-day review of these scorecards with the business unit directors. this interchange between business unit directors and their managers provided an opportunity to resolve any misunderstandings or other issues. it didn’t take long for everyone to understand that the BSc wasn’t just about “keeping score”; it was about moving the organization forward to achieve the goals of the

www.businessofgovernment.org 17
USinG the BALAnceD ScorecArD
DFASDirector
3
2
1
Leadership Council
SPSG
QC Lean Strategy Team
Human Capital Strategy Working
Group
Training Advisory Board
•ABL•CPBL•MCPS•Corp Res•Corp Elem•TSO
•ABL•CPBL•MCPS
•ABL•CPBL•MCPS•Corp Res•Corp Elem•TSO
System Managers Working Group
Portfolio Management
Business Information Technology Experts
Budget Advisory Group
Balanced Scorecard
Working Group
Corporate Transformation
Team (CTT)
BRAC Team
MEO/A-76 Teams BCA &
Initiative Teams
CIO/BIE
HCSGTESG
•Corp Res•Corp Elem•TSO
•ABL•CPBL•MCPS
•Corp Res•Corp Elem•TSO
•ABL•CPBL•MCPS•Corp Res•Corp Elem•TSO
•ABL•CPBL•MCPS•Corp Res•Corp Elem•TSO
•ABL•CPBL•MCPS•Corp Res•Corp Elem•TSO
•ABL•CPBL•MCPS•Corp Res•Corp Elem•TSO
•ABL•CPBL•MCPS•Corp Res•Corp Elem•TSO
Executive Level
Establish Strategic Planning Steering Group• Consists of senior executives from business lines and support
organizations• Reviews and evaluates agency progress in achieving strategic objectives through BSC• Oversees alignment of budget to strategy actions
Integrated Operations Level
Establish BSC Working Group• Cross-organizational representation• Develop definitions, monitor implementation, review data
integrity
Project/Tactical Level
Cascade the BSC to Sub-Orgs• Business line and support service
scorecards drive initiatives to lower levels
• Aggressive BSC reviews by business lines and support service leaders
• Provides an integrated view of strategic performance
21 3
Stra
tegy
Dev
elop
men
t and
Per
form
ance
Man
agem
ent
Technology Strategy Implementation
Process Strategy Implem
entation
People Strategy Implem
entat
ion
Strategy Execution and Change Management
Figure 5: Establish a Strategic Governance Structure for DFAS
iBM center for the Business of Government18
USinG the BALAnceD ScorecArD
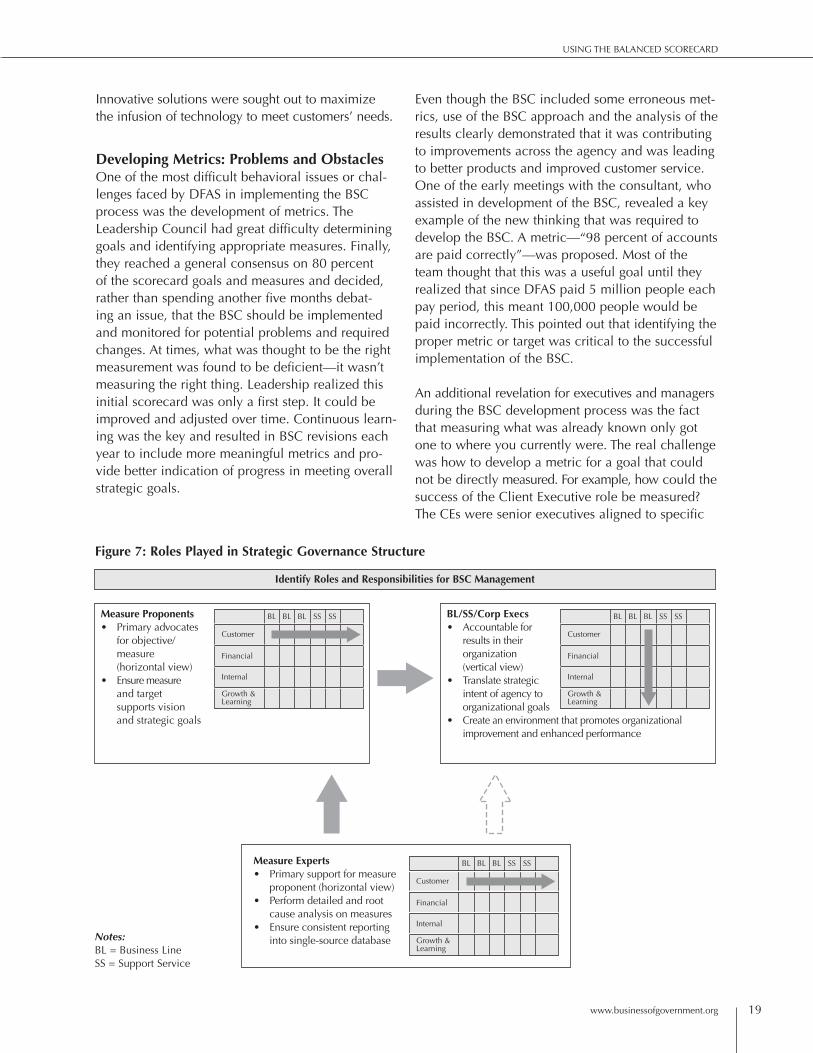
strategic plan. the Leadership council also insti-tuted a BSc day, which provided each unit of the organization the opportunity to present their BSc to the council. Both of these changes resulted in improved communication and consistency among the BSc and reporting methods. Small but important things like disseminating meeting information early to allow review by committee members resulted in most deadlines being met on time. Measurement proponents and experts were chosen to ensure consistency of measures across the organization; they were mainly business unit executives (see Figure 7). Measure proponents, in turn, selected measure experts—employees who were viewed as “up-and-comers” and who were willing to take on the added responsibility. this reinforced commit-ment to the process.
From the outset, Director Bloom supported the use of the BSc as a management tool rather than a report card. this alleviated employees’ fears by emphasizing relative improvement rather than the need to meet an absolute target, as was previously practiced within the agency. Previously, management tended to focus on the score (red, yellow, or green).17 there was no analysis of trends, direction, or impediments. A red score now was evaluated as to whether improvement was being made and not as an indication that the sky was falling. As one executive stated, “We’re red here, but the percentages are getting better and it’s going in the right direction. that’s good.”
Looking at something other than financial measures was much more rewarding. Seeing the interrelation-
ships between the perspectives was challenging and intriguing. one could see the effect that mak-ing small changes had on all the various measures, not only the bottom line. Seeing the influence on all four BSc perspectives helped everyone to focus on how they might do their jobs differently and to identify areas and processes that could be improved. this was especially helpful for the corporate staff. As one executive said, “the easy job was identifying all of our different processes, but we had a hard time trying to identify what were the processes that we performed, especially the oversight processes.”
communicating the status of the BSc to the entire workforce at the end of the year provided excellent feedback on how the organization as a whole had performed. results were even placed on the e-portal for everyone to see. the BSc acted as a communica-tion mechanism to provide performance feedback to employees and to instill a sense of achievement in them. it also provided them insight into how they and their jobs affected the entire organization as well as helped to clarify their part in achieving the established business goals. the philosophy was the more people who got involved in the BSc process, working on goal setting and measures, the more familiar and embedded it would become throughout the organization.
the strategic plan became an integral part of every-thing that was done at DFAS every day. With the strategy clearly in mind and present at every opera-tional level, DFAS continued to strengthen customer partnerships, improve quality, and reduce costs.
SPSGLCQR
LCQR
SPSG SPSG SPSGSPSG SPSG
Q2M1 M2 Q1 M4 M5
Monthly• Measure experts develop Memorandum for Record for
trouble spots • SPSG conducts monthly session focused on corporate BSC - Emphasis on a particular perspective (Customer & Financial, Internal, G&L) - Reactive & Preemptive Recommendations: Root cause analysis• SPSG provides Executive Summary to LC
Quarterly• Measure proponents provide LC with detailed analysis • Identify strategic course correction and strategic initiatives
Notes:SPSG = Strategic Planning Steering GroupLC = Leadership CouncilQR = Quarterly Review
Figure 6: Timeline of BSC Discussion
www.businessofgovernment.org 19
USinG the BALAnceD ScorecArD
innovative solutions were sought out to maximize the infusion of technology to meet customers’ needs.
Developing Metrics: Problems and Obstaclesone of the most difficult behavioral issues or chal-lenges faced by DFAS in implementing the BSc process was the development of metrics. the Leadership council had great difficulty determining goals and identifying appropriate measures. Finally, they reached a general consensus on 80 percent of the scorecard goals and measures and decided, rather than spending another five months debat-ing an issue, that the BSc should be implemented and monitored for potential problems and required changes. At times, what was thought to be the right measurement was found to be deficient—it wasn’t measuring the right thing. Leadership realized this initial scorecard was only a first step. it could be improved and adjusted over time. continuous learn-ing was the key and resulted in BSc revisions each year to include more meaningful metrics and pro-vide better indication of progress in meeting overall strategic goals.
even though the BSc included some erroneous met-rics, use of the BSc approach and the analysis of the results clearly demonstrated that it was contributing to improvements across the agency and was leading to better products and improved customer service. one of the early meetings with the consultant, who assisted in development of the BSc, revealed a key example of the new thinking that was required to develop the BSc. A metric—“98 percent of accounts are paid correctly”—was proposed. Most of the team thought that this was a useful goal until they realized that since DFAS paid 5 million people each pay period, this meant 100,000 people would be paid incorrectly. this pointed out that identifying the proper metric or target was critical to the successful implementation of the BSc.
An additional revelation for executives and managers during the BSc development process was the fact that measuring what was already known only got one to where you currently were. the real challenge was how to develop a metric for a goal that could not be directly measured. For example, how could the success of the client executive role be measured? the ces were senior executives aligned to specific
Figure 7: Roles Played in Strategic Governance Structure
Customer
BL BL BL SS SS
Financial
Internal
Growth & Learning
Measure Experts• Primary support for measure
proponent (horizontal view) • Perform detailed and root
cause analysis on measures• Ensure consistent reporting
into single-source database
BL/SS/Corp Execs• Accountable for
results in their organization
(vertical view) • Translate strategic
intent of agency to organizational goals
• Create an environment that promotes organizational improvement and enhanced performance
Customer
BL BL BL SS SS
Financial
Internal
Growth & Learning
Measure Proponents• Primary advocates
for objective/ measure (horizontal view) • Ensure measure and target supports vision and strategic goals
Identify Roles and Responsibilities for BSC Management
Customer
BL BL BL SS SS
Financial
Internal
Growth & Learning
Notes: BL = Business Line SS = Support Service

iBM center for the Business of Government�0
USinG the BALAnceD ScorecArD
customers and tasked with handling their issues. A measure was needed to track how effective the ces were in resolving customer issues. the metric decided upon was “number of interactions with the customer per month”—an activity measure. While at first, this might seem too basic, when related to the other scorecard measures like “customer satisfac-tion” and some of the process changes that involved the customers, it was obvious that the greater the number of interactions, the greater the direct divi-dends in other areas of the scorecard. however, because the ce role became so institutionalized after two years, this measure became meaningless.
Another example of an extremely difficult metric to develop was related to the great number of finance and accounting systems being used by DFAS. the first measure selected, “Percentage increase in elec-tronic commerce used to service the customer,” didn’t work. For one business line, the measure stayed almost static. Additionally, the metric lacked consistency and compatibility across business lines; every location was measuring it differently because each business line had a different system or way of gathering the information. As a result, DFAS developed the Wide Area Workflow System, which allowed electronic exchange of invoices and reports and ensured greater consistency of data reporting and a meaningful metric.
A third example of a poorly developed metric dealt with the issue of employee empowerment. employees expressed that they were not able to influence how operations were conducted at DFAS; they were not really being empowered. the director wanted a metric that indicated whether supervisors were empowering the workforce. Since DFAS had a suggestion program called “Bright ideas” to which any employee could contribute, the metric decided on was the “number of ‘bright idea’ suggestions per quarter submitted by a manager” (another activity measure). this resulted in the submission of many meaningless recommenda-tions, like restriping the parking lots, just to increase the number of “bright ideas” submitted. obviously, this was not the effect desired, as it was being used as a report card rather than a management tool. the metric was quickly dropped.
the final example dealt with the need to identify and track rework, since an important goal was to
reduce rework as a cost-savings measure. A BSc metric was identified and a system built to mea-sure and track rework. the BSc measure kept going down and down. however, since BSc measures are linked, there should have been changes in other measures like increased quality and reduc-tion in cost. this was not happening. Managers soon discovered that the amount of rework had not decreased; employees were merely not charging for rework. this measure was replaced by another measure that could be “managed.” A measure that appeared on the surface to be a useful measure was unrealistic because employees were quickly able to figure out how to beat the system.
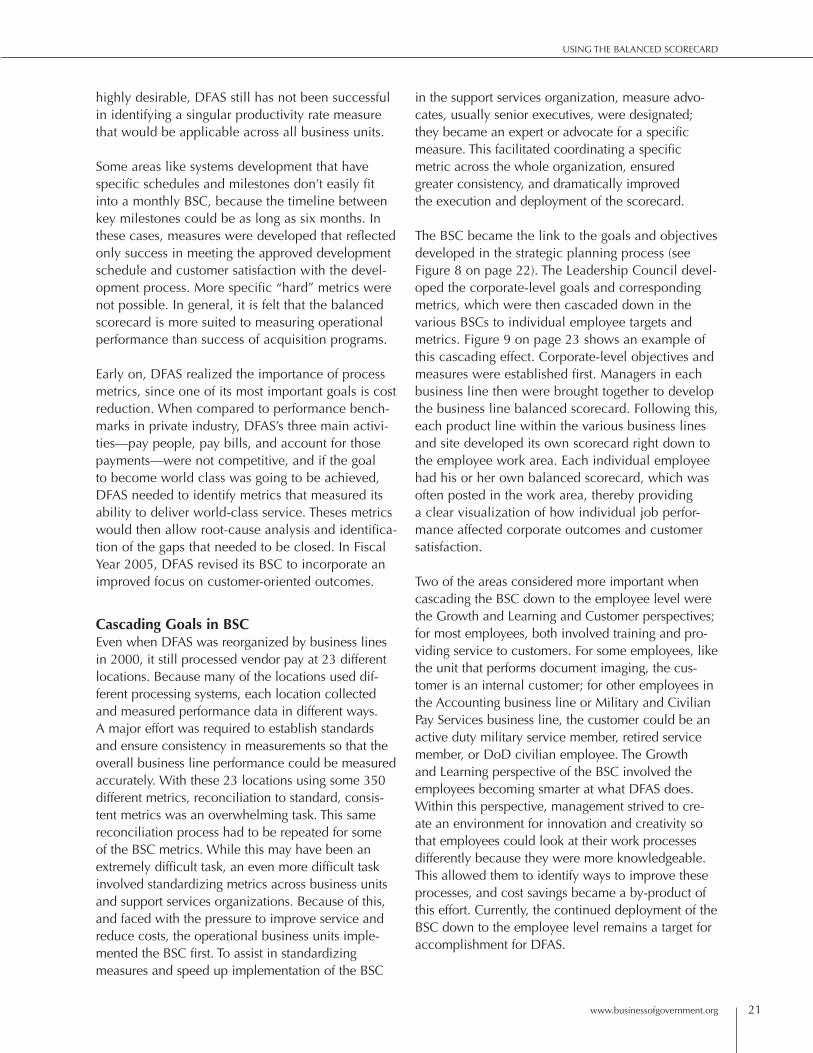
While it was fairly easy to develop metrics for busi-ness lines that were revenue producing, it was (and continues to be) much more difficult to develop measures and objectives for supporting staff units that were not revenue producing.
Continued BSC Development the scorecard wasn’t initially deployed throughout the entire organization. however, by its second year of usage, management—especially in the busi-ness units—recognized that additional deployment farther down, through lower levels of the organiza-tion, would be extremely valuable. Business unit executives placed more emphasis on full deploy-ment by communicating to their department heads and employees the importance of the scorecard to the success of DFAS. Although each business unit implemented unique incentives and approaches to gain acceptance of the BSc process, the communi-cation process started to have an effect. now it is unusual to visit any employee workplace and not find some linkage back to the BSc.
Differences Among UnitsAs balanced scorecards were developed, it became clear that certain measures were not appropriate for all business units and that individual score-cards needed to take into account the differences between business units. For example, DFAS uses different pay systems to support the various business areas—Army, Air Force, navy, Marines, and other defense agencies. Under these circumstances, it became readily apparent that a single business line productivity rate measure was not possible. While
www.businessofgovernment.org �1
USinG the BALAnceD ScorecArD
highly desirable, DFAS still has not been successful in identifying a singular productivity rate measure that would be applicable across all business units.
Some areas like systems development that have specific schedules and milestones don’t easily fit into a monthly BSc, because the timeline between key milestones could be as long as six months. in these cases, measures were developed that reflected only success in meeting the approved development schedule and customer satisfaction with the devel-opment process. More specific “hard” metrics were not possible. in general, it is felt that the balanced scorecard is more suited to measuring operational performance than success of acquisition programs.
early on, DFAS realized the importance of process metrics, since one of its most important goals is cost reduction. When compared to performance bench-marks in private industry, DFAS’s three main activi-ties—pay people, pay bills, and account for those payments—were not competitive, and if the goal to become world class was going to be achieved, DFAS needed to identify metrics that measured its ability to deliver world-class service. theses metrics would then allow root-cause analysis and identifica-tion of the gaps that needed to be closed. in Fiscal year �005, DFAS revised its BSc to incorporate an improved focus on customer-oriented outcomes.
Cascading Goals in BSCeven when DFAS was reorganized by business lines in �000, it still processed vendor pay at �3 different locations. Because many of the locations used dif-ferent processing systems, each location collected and measured performance data in different ways. A major effort was required to establish standards and ensure consistency in measurements so that the overall business line performance could be measured accurately. With these �3 locations using some 350 different metrics, reconciliation to standard, consis-tent metrics was an overwhelming task. this same reconciliation process had to be repeated for some of the BSc metrics. While this may have been an extremely difficult task, an even more difficult task involved standardizing metrics across business units and support services organizations. Because of this, and faced with the pressure to improve service and reduce costs, the operational business units imple-mented the BSc first. to assist in standardizing measures and speed up implementation of the BSc
in the support services organization, measure advo-cates, usually senior executives, were designated; they became an expert or advocate for a specific measure. this facilitated coordinating a specific metric across the whole organization, ensured greater consistency, and dramatically improved the execution and deployment of the scorecard.
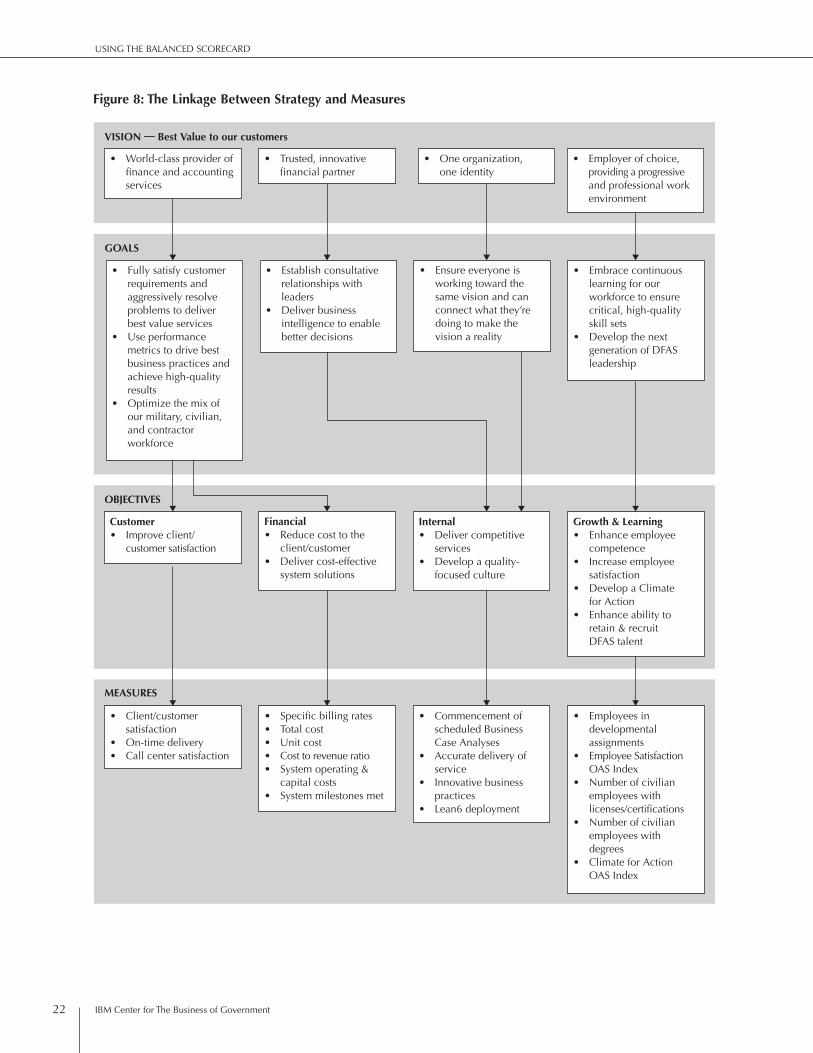
the BSc became the link to the goals and objectives developed in the strategic planning process (see Figure 8 on page ��). the Leadership council devel-oped the corporate-level goals and corresponding metrics, which were then cascaded down in the various BScs to individual employee targets and metrics. Figure 9 on page �3 shows an example of this cascading effect. corporate-level objectives and measures were established first. Managers in each business line then were brought together to develop the business line balanced scorecard. Following this, each product line within the various business lines and site developed its own scorecard right down to the employee work area. each individual employee had his or her own balanced scorecard, which was often posted in the work area, thereby providing a clear visualization of how individual job perfor-mance affected corporate outcomes and customer satisfaction.
two of the areas considered more important when cascading the BSc down to the employee level were the Growth and Learning and customer perspectives; for most employees, both involved training and pro-viding service to customers. For some employees, like the unit that performs document imaging, the cus-tomer is an internal customer; for other employees in the Accounting business line or Military and civilian Pay Services business line, the customer could be an active duty military service member, retired service member, or DoD civilian employee. the Growth and Learning perspective of the BSc involved the employees becoming smarter at what DFAS does. Within this perspective, management strived to cre-ate an environment for innovation and creativity so that employees could look at their work processes differently because they were more knowledgeable. this allowed them to identify ways to improve these processes, and cost savings became a by-product of this effort. currently, the continued deployment of the BSc down to the employee level remains a target for accomplishment for DFAS.
iBM center for the Business of Government��
USinG the BALAnceD ScorecArD
• World-class provider of finance and accounting services
• Trusted, innovative financial partner
• One organization, one identity
• Employer of choice, providing a progressive and professional work environment
• Fully satisfy customer requirements and aggressively resolve problems to deliver
best value services• Use performance
metrics to drive best business practices and achieve high-quality results
• Optimize the mix of our military, civilian, and contractor workforce
Customer• Improve client/ customer satisfaction
• Client/customer satisfaction
• On-time delivery• Call center satisfaction
• Employees in developmental assignments
• Employee Satisfaction OAS Index
• Number of civilian employees with
licenses/certifications• Number of civilian employees with
degrees• Climate for Action
OAS Index
• Commencement of scheduled Business Case Analyses
• Accurate delivery of service
• Innovative business practices
• Lean6 deployment
Financial• Reduce cost to the
client/customer• Deliver cost-effective
system solutions
• Specific billing rates• Total cost• Unit cost• Cost to revenue ratio• System operating &
capital costs• System milestones met
• Establish consultative relationships with leaders
• Deliver business intelligence to enable better decisions
Internal• Deliver competitive
services• Develop a quality-
focused culture
Growth & Learning• Enhance employee
competence• Increase employee
satisfaction• Develop a Climate for Action• Enhance ability to retain & recruit DFAS talent
• Ensure everyone is working toward the same vision and can connect what they’re doing to make the vision a reality
• Embrace continuous learning for our workforce to ensure critical, high-quality skill sets
• Develop the next generation of DFAS leadership
VISION — Best Value to our customers
GOALS
MEASURES
OBJECTIVES
Figure 8: The Linkage Between Strategy and Measures

www.businessofgovernment.org �3
USinG the BALAnceD ScorecArD
The Importance of Growth and Learning and Individual Developmental Assignmentsto achieve their strategic planning goals, DFAS management was keenly aware that each employee needed to acquire and develop additional skills. Management identified and defined the core compe-tencies needed by the workforce for successful mission accomplishment and committed to spending 5 percent of its labor budget on training to enable all employees to acquire the competencies needed to provide world-class service. in Fy �003, DFAS spent $1,811 per employee on training—or nearly 3.8 per-cent of its total payroll. this was more than double the average U.S. industry training expenditure of $8�6 per employee in calendar year �00�.
coupled with this increased emphasis on training, all individual performance plans included a metric related to performance in a developmental assign-ment (DA). in DAs, employees had an opportunity to work for at least one week in an area completely different form their normal business duties. While employees initially viewed this as a benefit that provided a nice opportunity to get away from the daily grind, managers soon realized that this time could be valuable in helping to fix problems faced by their organizations. Developmental assignments allowed managers to identify good people, free up their time, and use them to help solve departmental
problems. this had an extremely positive effect on employees, who felt good about being able to learn new skills and also able to contribute to solving problems within their work organization.
Some managers, especially ones in the more production-oriented units, initially resisted the use of developmental assignments because of concerns that their people did not have enough “free” time for additional projects. however, the Leadership council stressed the importance of DAs and emphasized that if DFAS was really serious about the value of its people, developmental assignments needed to be established and used. the use of developmental assignments became so successful that when removal of the metric from the �005 BSc was proposed, lower-level manag-ers and employees strongly demanded its retention.
employees generally had great freedom to inte-grate their individual performance plans within the framework of their business unit scorecard measures. each employee was asked to identify “what is important to them” as a means to help them define goals for their individual performance plans. employees were provided much assistance in developing their individual performance plans to ensure that their individual goals meshed with busi-ness line and corporate goals. this process included individual one-on-one visits with employee teams at
CUSTOMER PERSPECTIVE—Corporate Measure: Commitments Met Performance Plan
Corporate
Business Line
Product Line
Site
Employee
DFAS
Commercial Pay
Vendor Pay
Rome
Rome
MeasureExecution of agency Performance Plan deliverables
TargetSuccessfully meet all 11 agency Performance Plan deliverables
MeasureInterest penalty payments
BaselineFY 2001-$35.0MFY 2002-$32.6M
TargetReduce FY 2001baseline by 40%
BaselineFY 2001-$24.8MFY 2002-$22.3M
TargetReduce FY 2001baseline by 40%
BaselineFY 2001-$209KFY 2002-$368K
TargetReduce FY 2001baseline by 40%
TargetContribute to interest penalty reduction goals by averaging 32–34 contract type payments or 64–66 miscellaneous type payments per day with a 99% accuracy rate
Figure 9: Cascading DFAS Corporate Goals to Business Line Goals

iBM center for the Business of Government�4
USinG the BALAnceD ScorecArD
different locations and at which all employee ques-tions were openly answered. this created trust with managers and emphasized individual ownership of the plan. Figure 10 shows an example of cascading the BSc to an individual employee’s performance goals and developmental assignments.
Employee and union involvement. initially, some of the goals established in various BScs created prob-lems because they were “stretch” goals. For exam-ple, the target of one metric was “zero defects.” this goal extremely frustrated employees because the BSc system measured success only in terms of a red, yellow, or green rating. As a result, even though employees had improved their performance, they still remained red or yellow on the scorecard. one or two $13 transactions out of a 70-billion-dollar-a-month business may have been in error and didn’t make sense because there were always some transactions that were outside an employee’s control. When processing 13 million transactions a month, one or two errors made the unrealistic target unachievable.
correctly identifying performance goals was a sig-nificant problem. if performance goals were set such that every individual was successful but the organization failed, then the standard was obviously
set too low. if the standard was set so high that it was not achievable (like the zero defect target), both the individual and organization failed. As a result, a review process was quickly developed to revise unrealistic targets when they were uncovered, which exemplified the openness, flexibility, and refine-ment of the BSc process to all employees. the best choice turned out to be defining a range for a spe-cific goal based on historical performance data. Any goal could then be adjusted upward based on future technological improvements affecting productivity or lower if it was unrealistic.
Although “stretch” goals remained important, emphasis was placed on continuous improve-ment in BSc measures, where trends were more important than the final score. Understanding why a target was not reached was considered more important than reaching a target that was set too low. if an individual performance plan had all greens and no reds or yellows, the goals were probably not set high enough. on the other hand, if an individual finished the year with eight greens and a couple of yellows and reds out of 14 mea-sures, this was not viewed negatively if improve-ment had been demonstrated in the majority of the areas measured. this was a powerful motivator to the workforce.
Vision TenetEmployer of choice, providing a progressive and professional work environment
GoalEmbrace continuous learning for our workforce to ensure critical, high-quality skill sets
ObjectiveEnhance employee competence
MeasureDevelopmental Assignments (DAs)
BalancedScorecard
Target3.0%
InitiativesMarket advantages of DAs to employeesHighlight employee’s impact on business through DA
Individual ObjectiveIdentify DA in Individual Development Plan that meets organizational and individual goals
Figure 10: Cascading DFAS Corporate Goals to Individual Developmental Assignment and Objectives

www.businessofgovernment.org �5
USinG the BALAnceD ScorecArD
From the very first, the union was fully involved in any goal setting or performance rating changes for its members. it was critical to the success of the BSc process to make the union part of the team and get them fully on board. Key management briefed the union leadership early in the process and explained the benefits of using the BSc as a management tool. the union resonated with the Growth and Learning perspective, which they felt was really directed toward providing additional benefits to the employees. Additionally, as the scorecards were being developed, one business unit invited a union representative to participate, who helped to establish range-based standards that had the necessary flex-ibility to ensure employees as well as the business unit could be successful. the scorecards allowed performance measures to be compared against per-formance plans each quarter and individuals to be rewarded (monetarily or in some other manner) who met or exceeded the performance measures.
Recruiting activity. Despite the staff reductions resulting from process improvements, DFAS still needed to acquire new talent to replace its aging workforce. this was especially true in those busi-ness lines that required professional accountants and other college graduates to accomplish the work. to meet this need, DFAS established a college recruiting program for entry-level accountants. this formal three-year program, called eLPA (entry Level Professional Accountants), hired college students as interns for positions in various developmental assignments; they were hired upon graduation into permanent positions if they demonstrated satisfac-tory performance during their internship.
the success of this program soon led DFAS to real-ize that many of its existing employees also were very interested in continuing their formal educa-tion by obtaining a college degree or additional technical qualifications they needed to advance. responding to the employees’ desires, a new pro-gram called eLFM (entry Level Financial Managers) was developed to meet the career needs of a num-ber of employee groups. it was specifically set up to meet the needs of mostly lower-grade technicians who also were attending college part-time and working toward a degree. this program also greatly benefited DFAS.
Reward system link. in developing an individual’s performance plan, all four perspectives of the BSc were not necessarily represented. For example, one business line required that every individual identify at least one additional metric besides a Growth and Learning metric that linked their individual performance plan to the BSc. the rationale for this requirement was based on the feeling that if an employee’s performance was not linked to the BSc, then either the BSc wasn’t measuring the right thing or an employee was doing the wrong thing.
Because of implementing the BSc, DFAS also attempted to de-link employees’ performance rewards from the annual performance appraisal review system (which was used to determine when employees were eligible for rewards). rewards (or counseling) are now given to employees based on results achieved in meeting BSc and an individual’s performance plan goals.
Ongoing Changesin �00�, DFAS implemented a customer satisfaction survey process. the customer satisfaction survey measured nine separate components, including key measures directly related to the BSc such as problem resolution, access, recovery, knowledge, quality, and courtesy. the results of these surveys indicated that customers were recognizing the pro-cess improvements being implemented by DFAS as improved satisfaction; it validated the efforts being undertaken by DFAS and made everyone in the agency aware that there was a real linkage between scorecard results and customer satisfaction.
the customer satisfaction surveys not only allowed tracking the overall number for customer satisfaction to previous years, but also allowed tracking each specific component. this allowed the identification of specific customer-related problems. For example, when business lines examined how well they were doing in a specific customer satisfaction area—recovery—they were able to form customer focus groups and identify potential ways to improve per-formance. By monitoring implementation of these improvements through the BSc, DFAS was able to improve customer satisfaction.
the fact that all business lines and support services groups had BScs that were aligned to the corporate

iBM center for the Business of Government�6
USinG the BALAnceD ScorecArD
scorecard provided a synergistic effect in improv-ing performance. For example, when the human resources group met its goal to turn around person-nel actions within seven days, it helped a business unit’s Growth and Learning perspective by bringing new employees on board in a more timely manner and ensured applicants would be more likely to accept the position. it also enabled the business unit to improve customer satisfaction through improved responsiveness and increased quality.
A New Leader AppointedWith the appointment of the new director, Zack Gaddy, in May �004, executives were encouraged to include some external stakeholder measures at
the DoD controller level in their BScs. Up to this time, the BSc was used mainly as an internal man-agement tool. now DFAS needed to find ways to cap-ture two areas of concern: measures to track internal improvement and measures needed to track external concerns. this change primarily stemmed from office of Management and Budget (oMB) guidance for meeting the President’s Management Agenda goals, which implemented a government-wide scorecard to track agency management capacity.
Since becoming the director, Gaddy demonstrated that he fully supports the balanced scorecard, but made some notable changes reflected in the score-card process. First, he changed the governance model (see Figure 11) by replacing the SPSG and
ClientExecutive Input
OtherInputs
PortfolioManagement
ProjectsKilled
Customer Advisory Forum (Client Executive
& Customer)
Exec
utio
n/M
anag
emen
tD
ecis
ion
Con
cept
Dev
elop
men
t/D
ue D
ilige
nce/
Init
iati
on
•
Sing
le p
oint
of e
ntry
Issues outside of Portfolio Financial Management
Business LinesCR/CE
Lean6 AMOBusiness Lines
CR/CE
ExecutiveSteering Group
Customer Value
ExecutiveCouncil/Director
Customers
Workgroups WorkgroupsThreshold for Business Line Decision
StrategicDirection
Office of Strategic Direction
Figure 11: Improved Business Value Model—DFAS Governance Process
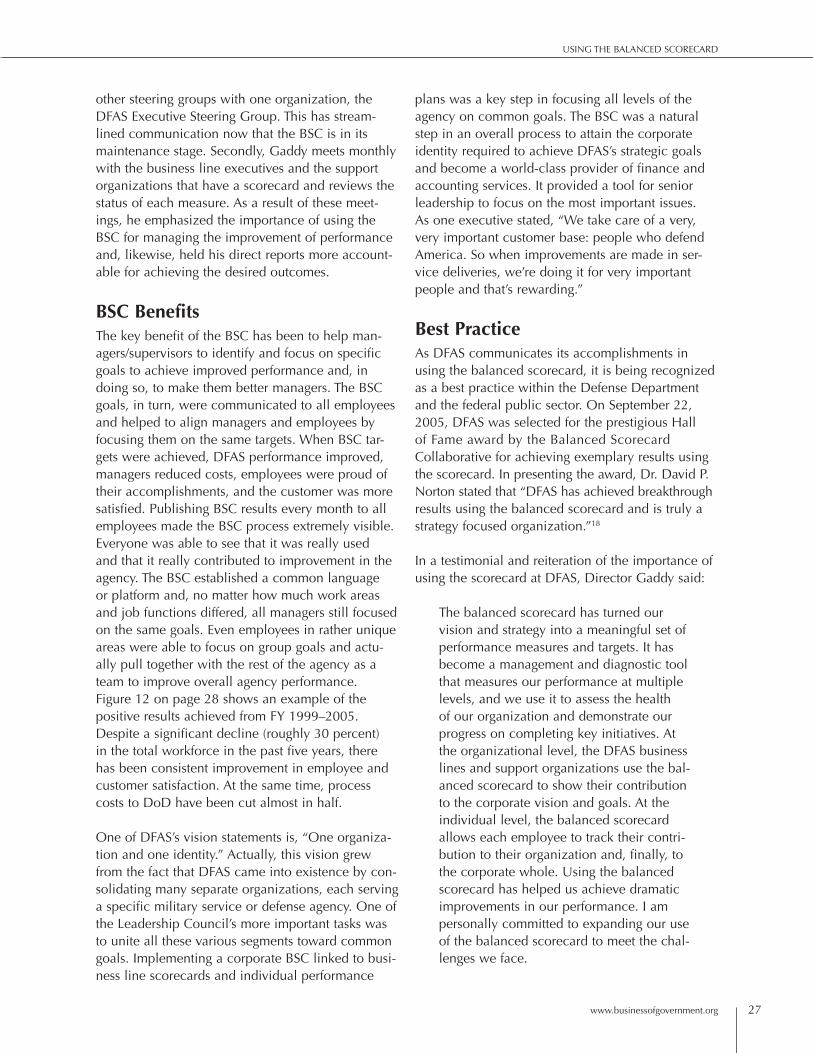
www.businessofgovernment.org �7
USinG the BALAnceD ScorecArD
other steering groups with one organization, the DFAS executive Steering Group. this has stream-lined communication now that the BSc is in its maintenance stage. Secondly, Gaddy meets monthly with the business line executives and the support organizations that have a scorecard and reviews the status of each measure. As a result of these meet-ings, he emphasized the importance of using the BSc for managing the improvement of performance and, likewise, held his direct reports more account-able for achieving the desired outcomes.
BSC Benefitsthe key benefit of the BSc has been to help man-agers/supervisors to identify and focus on specific goals to achieve improved performance and, in doing so, to make them better managers. the BSc goals, in turn, were communicated to all employees and helped to align managers and employees by focusing them on the same targets. When BSc tar-gets were achieved, DFAS performance improved, managers reduced costs, employees were proud of their accomplishments, and the customer was more satisfied. Publishing BSc results every month to all employees made the BSc process extremely visible. everyone was able to see that it was really used and that it really contributed to improvement in the agency. the BSc established a common language or platform and, no matter how much work areas and job functions differed, all managers still focused on the same goals. even employees in rather unique areas were able to focus on group goals and actu-ally pull together with the rest of the agency as a team to improve overall agency performance. Figure 1� on page �8 shows an example of the positive results achieved from Fy 1999–�005. Despite a significant decline (roughly 30 percent) in the total workforce in the past five years, there has been consistent improvement in employee and customer satisfaction. At the same time, process costs to DoD have been cut almost in half.
one of DFAS’s vision statements is, “one organiza-tion and one identity.” Actually, this vision grew from the fact that DFAS came into existence by con-solidating many separate organizations, each serving a specific military service or defense agency. one of the Leadership council’s more important tasks was to unite all these various segments toward common goals. implementing a corporate BSc linked to busi-ness line scorecards and individual performance
plans was a key step in focusing all levels of the agency on common goals. the BSc was a natural step in an overall process to attain the corporate identity required to achieve DFAS’s strategic goals and become a world-class provider of finance and accounting services. it provided a tool for senior leadership to focus on the most important issues. As one executive stated, “We take care of a very, very important customer base: people who defend America. So when improvements are made in ser-vice deliveries, we’re doing it for very important people and that’s rewarding.”
Best PracticeAs DFAS communicates its accomplishments in using the balanced scorecard, it is being recognized as a best practice within the Defense Department and the federal public sector. on September ��, �005, DFAS was selected for the prestigious hall of Fame award by the Balanced Scorecard collaborative for achieving exemplary results using the scorecard. in presenting the award, Dr. David P. norton stated that “DFAS has achieved breakthrough results using the balanced scorecard and is truly a strategy focused organization.”18
in a testimonial and reiteration of the importance of using the scorecard at DFAS, Director Gaddy said:
the balanced scorecard has turned our vision and strategy into a meaningful set of performance measures and targets. it has become a management and diagnostic tool that measures our performance at multiple levels, and we use it to assess the health of our organization and demonstrate our progress on completing key initiatives. At the organizational level, the DFAS business lines and support organizations use the bal-anced scorecard to show their contribution to the corporate vision and goals. At the individual level, the balanced scorecard allows each employee to track their contri-bution to their organization and, finally, to the corporate whole. Using the balanced scorecard has helped us achieve dramatic improvements in our performance. i am personally committed to expanding our use of the balanced scorecard to meet the chal-lenges we face.

iBM center for the Business of Government�8
USinG the BALAnceD ScorecArD
13,500
15,500
17,500
19,500
21,500
0.25
0.30
0.35
0.40
0.45
0.50
0.55
0.60
20,269
18,773
17,663
0.56%
0.53%
0.47%
0.45%
0.34%
0.30%
16,323
15,362
14,741
14,307
20
25
30
35
40
45
50
55
60
65
70
75
80
40
45
50
55
60
65
70
75
80
85
90
47%
51% 53%
56%
59%61%
44%
47%
50%
53%
57% 58%
Prob
lem
resolu
tion
Choice
Acces
s
Knowled
ge
Timeli
ness
Tang
ibles
Reliab
ility
Quality
Courte
sy
FY99
2000
2001
2002
2003
2004
2005
2000
2001
2002
2003
2004
2005
FY00
FY01
FY02
FY03
FY04
FY05
FY99
FY00
FY01
FY02
FY03
FY04
FY2005
EmployeeSatisfaction Index
Climate forAction Index
FY2002
Total Workforce
Overall Employee Satisfaction 2000–2005
DFAS Percentage of DoD Budget
Overall Customer Satisfaction 2000–2005
Percent
Percent Percent
Figure 12: DFAS Organizational Results

www.businessofgovernment.org �9
USinG the BALAnceD ScorecArD
The United States Postal Service
the United States Postal Service (USPS) has evolved a planning process over the past several decades that has used principles of the balanced scorecard approach. this section traces the evolution (from 1970 to the current state) of strategy development and goal setting, the innovative reinforcement struc-ture that supports performance management, and the results obtained through continuous improve-ment in the use of this approach.
Overview of the Postal Servicethe Postal Service employs roughly 700,000 workers, with a fleet of over �00,000 vehicles driving about a billion miles a year to deliver more than �06 billion pieces of mail to over 14� million delivery points. it operates one of the largest facilities networks in the nation, with about 38,000 retail offices. About 1.8 million new deliveries are added every year. the annual revenue was about $69 billion in �004.
the Postal Service is charged by congress with the mission of “binding the nation together through the personal, educational, literary, and business correspon-dence of the people.… it shall provide prompt, reliable, and efficient service to patrons in all areas and shall render postal services to all communities at ‘fair and equitable’ prices.”19 the Postal Service is at the center of a larger mailing industry that generates an estimated $871 billion in commerce annually and employs nearly 9 million.�0 Despite the emergence of direct alternatives and technological substitutes, a healthy postal service remains essential to the economy.�1
Structural Changes and the Evolution of the Postal Environmentthe Postal reorganization Act of 1970 redefined the Post office Department into the United States Postal
Service to accomplish a variety of policy objectives. the new law created an “independent establishment of the executive branch.”�� instead of fragmented congressional control, with management and super-vision largely provided by political appointees, the legislation established that the new postal organiza-tion would be managed by career professionals, led by a private-sector style Board of Governors.
the Board of Governors consists of nine presiden-tial appointees who are confirmed by the Senate. in an attempt to reduce political interference, no more than five board members could be of the same party, and board members serve staggered seven-year terms. the board appoints the postmaster general and the deputy postmaster general, both of whom also serve as members of the board. Another major objective of the legislation was to reduce the burden on taxpayers by requiring the new Postal Service to reach a financial “break-even” point.�3 At the time, about a quarter of the postal budget was subsidized. the Postal reorganization Act was part of an effort to bring “businesslike” practices to government agencies. An assessment of perfor-mance was conducted in 1977,�4 and by 1983, an assessment by the national Academy of Public Administration concluded that the Postal Service had accomplished an outstanding implementation of the act.�5 one of the benchmark accomplishments was the achievement of “break-even” status and the elimination of the public subsidy.
While the structure of the Postal Service was chang-ing, so was the business environment. Private package delivery corporations provided increasing competition. United Parcel Service became a nation-wide delivery organization, and in 1971 Federal express entered the market. By the mid-1980s, com-petition from facsimile services and the emergence

iBM center for the Business of Government30
USinG the BALAnceD ScorecArD
of e-mail further threatened the traditional protected status of the Postal Service. Since then, the develop-ment of electronic bill presentment and payment services and other internet-based applications have reduced the Postal Service’s historic growth rates.
The Emergence of a Balanced Scorecard Approachthe Postal Service had traditionally been able to depend on the growth of the economy to drive mail volume and revenue increases in a protected envi-ronment. it was becoming clear that this planning assumption could no longer be taken for granted. the Postal Service had fairly sophisticated opera-tional planning, and in fact successfully deployed a massive automation program (corporate Automation Plan) to reduce the number of manual processes in mail processing. the Postal Service also developed a rigorous financial planning process, including rate case and capital investment planning, but something more was needed since service performance and customer satisfaction were declining.
Anticipating the need for substantial change, the Board of Governors appointed Marvin runyon as the nation’s 70th postmaster general in July 199�. Formerly a senior executive with Ford Motor company, and the first president and ceo of nissan America, runyon came to USPS fresh from a stint at the tennessee Valley Authority, one of the earliest experiments in government-sponsored enterprises.�6 in these positions, runyon had successfully applied quality management principles to focus the organization toward improving performance and better meeting the needs of custom-ers. he established a quality group at the senior man-agement level of the Postal Service.
changes often come to an organization experienc-ing a crisis or from new leadership with a vision. USPS had both. in november 1993, problems in the chicago post office pointed to critical problems in the Postal Service. Postal inspectors found mountains of unsorted mail at several chicago offices. one pile was 800 feet long, nearly the length of three football fields. inspectors found one carrier with 40,000 pieces of undelivered mail stashed in his truck, and another had �0,000 pieces in his basement. inspectors found nearly �00 pounds of commercial mail burning beneath a railroad viaduct and other mail dumped in sewers and vacant lots. information and complaint phones rang scores of times before being answered,
if they were answered at all.�7 the problem was not isolated in chicago, and poor postal performance in new york city and Washington, D.c., raised even more complaints in congress.
runyon had a town hall meeting in May 1994 at the chicago Armory and faced hundreds of angry customers for two and a half hours.�8 runyon had begun an assessment of the Postal Service in 1993, using the national Baldrige Quality Award crite-ria.�9 in 1995, the results of that process led to the creation of what was called CustomerPerfect!, now known simply as the management cycle. this inter-nal initiative was reinforced by the enactment of the Government Performance and results Act of 1993. the act required federal agencies, including the Postal Service, to prepare five-year strategic plans, annual performance plans, and performance reports. Agencies were expected to describe their mission, establish specific performance goals and annual improvement targets, and measure performance using valid indicators and reliable measurement systems.30
one of the critical features that emerged was the development of strategic goal areas of emphasis called “voices”: Voice of the customer, Voice of the employee, and Voice of the Business. this was the beginning of the balanced scorecard approach in the Postal Service and served, according to Suzanne Medvidovich, senior vice president, human resources, as a major focal point toward developing a quality approach. A senior management commit-tee was established to set goals and improvement targets, and to develop specific performance indi-cators and measurement systems. this committee came to be known as the Establish committee, part of a four-part management cycle.
the Postal Service went through a full-fledged Baldrige examination in 1998, conducted by an independent outside organization of qualified examiners. the Postal Service used the criteria for business excellence, since congress did not autho-rize the development of criteria for public organi-zations until �005. the examiners conducted site reviews including postal headquarters, all 10 field operation areas, and over 1�0 facilities, and inter-viewed more than 1,500 people. According to Linda Kingsley, vice president of strategic planning, “the Postal Service worked to design itself to better focus on meeting the needs of its customers by improv-ing communications with its employees and unions,

www.businessofgovernment.org 31
USinG the BALAnceD ScorecArD
The Malcolm Baldrige National Quality Award
What is the Malcolm Baldrige National Quality Award?the Baldrige Award is given by the President of the United States to businesses—manufacturing and service, small and large—and to education and healthcare organizations that apply and are judged to be outstanding in the following seven criteria: leadership; strategic planning; customer and market focus; measurement, analysis, and knowledge management; human resource focus; process management; and results.
congress established the award program in 1987 to recognize U.S. organizations for their achievements in quality and performance and to raise awareness about the importance of quality and performance excellence as a competitive edge. the award is not given for specific products or services. three awards may be given annually in each of these categories: manufacturing, service, small business, education, and healthcare. in october �004, President Bush signed into law legislation that authorizes the Malcolm Baldrige national Quality Award Program to include nonprofit and government organizations. the program may begin to solicit applications from nonprofit organizations in �006 for a pilot program, with awards commencing in �007. the U.S. commerce Department’s national institute of Standards and technology (niSt) manages the Baldrige national Quality Program in close cooperation with the private sector.
What are the Baldrige criteria?the Baldrige performance excellence criteria are a framework that any organization can use to improve overall performance. Seven categories make up the award criteria:
• Leadership—examines how senior executives guide the organization and how the organization addresses its responsibilities to the public and practices good citizenship.
• Strategic planning—examines how the organization sets strategic directions and how it determines key action plans.
• Customer and market focus—examines how the organization determines requirements and expectations of customers and markets; builds relationships with customers; and acquires, satisfies, and retains customers.
• Measurement, analysis, and knowledge management—examines the management, effective use, analysis, and improvement of data and information to support key organization processes and the organization’s performance management system.
• Human resource focus—examines how the organization enables its workforce to develop its full potential and how the workforce is aligned with the organization’s objectives.
• Process management—examines aspects of how key production/delivery and support processes are designed, managed, and improved.
• Business results—examines the organization’s performance and improvement in its key business areas: customer satisfaction, financial and marketplace performance, human resources, supplier and partner performance, opera-tional performance, and governance and social responsibility. the category also examines how the organization performs relative to competitors.
For many organizations, using the criteria results in better employee relations, higher productivity, greater customer satisfaction, increased market share, and improved profitability. According to a report by the conference Board, a business membership organization, “A majority of large U.S. firms have used the criteria of the Malcolm Baldrige national Quality Award for self-improvement, and the evidence suggests a long-term link between use of the Baldrige criteria and improved business performance.”
Source: The Baldrige National Quality Program website at www.quality.nist.gov.
iBM center for the Business of Government3�
USinG the BALAnceD ScorecArD
developing a strategic human resource plan aligned with organizational business strategies, and stan-dardizing core processes across the entire organiza-tion to improve operations.”
one of the first areas of emphasis was the “Voice of the employee,” which focused on providing a safe and secure workplace in response to instances of violence and poor employee relations.31 A second major initiative, the “Voice of the Business,” focused on the “Breakthrough Productivity initiative,” while the third area, the “Voice of the customer,” focused on providing timely, reliable delivery.
The Need for BalanceLike most organizations, the Postal Service has mul-tiple stakeholders. however, the scope and scale of postal operations makes balancing the interests of its stakeholders somewhat more complex, especially since there are no direct “shareholders” that com-mand precedence in determining organizational pri-orities. As a public institution, the Postal Service has numerous responsibilities and accountabilities not shared by typical private sector organizations.
According to Kent Smith, manager of strategic busi-ness planning, the Postal Service has a comprehen-sive outreach program to its various stakeholders. the Postal Service sponsors customer satisfaction and market research, maintains Postal customer councils in many communities to connect with small businesses, operates a Mailer’s technical Advisory committee to work out operational issues with major mailers and their associations, and has a significant consumer affairs and customer service operation.
Like many businesses, the Postal Service conducts a Business environmental Assessment (BeA) to review economic, demographic, and social trends; customer needs; competitor initiatives; market requirements; technological changes and business process improvements; and workforce and workplace changes in order to adjust its strategies. the busi-ness situation, which includes the BeA; the findings from the various outreach programs; and reviews of current capabilities, performance, and financial posi-tion are used to support the Establish phase of the management cycle.3� As mentioned previously, the Establish phase sets the goals and annual performance improvement targets, and reviews the performance indicators and measurement systems.
the Establish phase of the management cycle is followed by the Deploy phase, also called “catch Ball.” According to richard Strasser, chief financial officer, “catch Ball” is an iterative process of nego-tiation between headquarters, functional depart-ments, and field operating units, led by Finance and tied to the budget function, that determines how resources will be deployed to achieve the per-formance improvement targets. this is followed by the Implementation phase, where programs are put into action to achieve the goals. A Review process, which evaluates performance, is ongoing throughout the year.
this process is similar to the strategic mapping advocated by Kaplan and norton.33 in their �000 article, they advocated a well-connected map-ping that leads from the main strategy to Financial, customer, internal Process, and Learning and Growth perspectives. each element works to support the strategic objectives in a linked process. Learning and growth (“Voice of the employee” in postal terms) supports improved internal processes (“Voice of the Business”), which support customer satisfac-tion (“Voice of the customer”). customer satisfac-tion leads to the desired financial outcome, which in the case of the Postal Service is sufficient revenue to support the universal delivery service mission. this is the basis of the balanced scorecard.
The Application of the Balanced Scorecard to USPSMost organizations adapt the scorecard to their own conditions, which is why it is difficult to assess the effectiveness of the approach across organizations. At USPS, they were responding to performance gaps in three specific and critical areas. As indicated by Suzanne Medvidovich, then-senior vice president of human resources, one of the critical areas that needed improvement in the labor-intensive Postal Service is the workplace environment. this is what USPS calls the “Voice of the employee.” the process evolved from the specific situation described ear-lier that resulted in a call to action. A strategic goal was established and indicators were developed to measure annual improvements. As the senior vice president for human resources, Medvidovich had “ownership” of this process as part of the establish committee, along with the chief operating officer. this process is shown in Figure 13.

www.businessofgovernment.org 33
USinG the BALAnceD ScorecArD
the primary indicators of performance in this category of the scorecard were safety, based on the requirements of the occupational Safety and health Administration, and employee satisfaction. employee satisfaction is measured by a survey of all employees that is conducted annually but can be tracked monthly by each unit.
richard Strasser, the chief financial officer, also part of the establish committee, had ownership of the “Voice of the Business” issue, along with the chief operating officer. this issue went through a similar process of situation analysis, call to action, and establishment of strategic goals, with the development of annual performance objectives, performance indicators, and measurement systems, as shown in Figure 14.
the Voice of the Business is now separated into two areas—one represented by a productivity measure and the other by a revenue generation measure.
the last major area of strategic emphasis, “Voice of the customer,” is owned by the chief marketing offi-cer in partnership with the chief operating officer, as shown in Figure 15. the primary indicator was a set of delivery service measurement systems.
Guided by the establish committee, these three improvement processes were implemented simulta-neously, and the organization’s efforts were focused on achieving specific, measurable results in each area.34 From the above approaches, a balanced scorecard consistent with the norton and Kaplan recommendations was constructed, as shown in Figure 16 on page 34. As demonstrated by the arrows, there is an implied alignment from the per-formance-driven culture reflected in human capital improvements, to operational efficiency, to improve-ments in customer satisfaction, all of which will improve financial stability.
Poor productivity
Blueprint forprogress/
BreakthroughProductivity
Initiative
Managecosts
TotalFactor
Productivityimprovement
Incrementalimprovements
Consecutiveimprovementsin productivity
Situation Call to Action Strategic Goal Objective Results
AnnualPerformance
Targets
Figure 14: Voice of the Business
Poorperformance
Low customersatisfaction
Operationalexcellence
Improveservice
Timely,reliabledelivery
Incrementalimprovements
Recordservice
performanceand customersatisfaction
Situation Call to Action Strategic Goal Objective Results
AnnualPerformance
Targets
Figure 15: Voice of the Customer
“Going Postal”Poor laborrelations
CalifanoCommission
Safe andsecure
workplace
Develop employees/
enhance results-oriented
culture
Workplace improvements
(VOE)
Safety (OSHA)
Incrementalimprovements
Record VOEindex
Record safetyperformance
Situation Call to Action Strategic Goal Objective Results
AnnualPerformance
Targets
Figure 13: Voice of the Employee

iBM center for the Business of Government34
USinG the BALAnceD ScorecArD
the Postal Service adapted this approach, and has been using the “PMG Star” (see Figure 17) as a communication device to drive the concept of multiple, balanced goals throughout this large and complex organization. each point of the star repre-sents an area of the scorecard. Financial measures are focused on growing revenue. operational efficiency is focused on managing costs. the reason for the fifth point of the star, also reflected in Figure 16 as “struc-tural modifications,” was the Postal Service’s efforts to obtain policy changes in the Postal reorganization Act of 1970 to gain greater levels of operational and market flexibility.
As Strasser noted, the goals and measures were deployed by specific goals relevant to the functional and operational units involved. According to Pat Donahoe, previously the chief operating officer and now deputy postmaster general, “there are 10 cor-porate-level measures, which relate directly to the five corporate goals.35 Since the goals are long term and strategic, they do not change significantly. each of the indicators is weighted to reflect its relative importance, and the weights are adjusted annually. Senior officers, through the planning process, may adjust corporate objectives, measures, and targets each year.” table � on page 36 provides details of the link between specific goals, performance objec-tives, and measures, and their Fy�005 target.
Planning in an organization is one thing. execution is often another. the Postal Service addressed this gap by developing a rigorous performance review process tied to achieving the targets set by the establish process. Ann Wright, then-manager of performance assessment, stated, “the USPS has developed a national Performance Assessment (nPA) system, which provides detailed measures for each of the corporate-level indicators, that provides a line-of-sight link to unit and individual perfor-mance down to the frontline supervisor. these are consistent across operating areas and job categories within the operating units.36 each of the indicators is objective and measurable, and focuses on results or outcomes rather than activities or processes.”
The National Performance Assessment Programindividual and unit performance within organiza-tions is driven, in large part, by the focus given to specific activities (in postal terms, “manage what they measure”) and by the incentives associated with achievement of the specific goals. the nPA system provides a systematic approach more akin to the private sector, and, in fact, the Postal Service has been a forerunner of “pay-for-performance” approaches now being implemented elsewhere in the federal government.
Goals Strategies Measures
Building a Balanced Scorecard: The Postal Experience
Financial Stability
Customer Focus
Operational Efficiency
Human Capital
President’s Management Agenda
Generate Revenue
Improve Service
Manage Costs
Performance-Driven Culture
Structural Modifications
Total Revenue
% Mail Delivered to Standard
Total Factor Productivity
Employee Attitudes and Safety
Increased Flexibility
Figure 16: The USPS Balanced Scorecard

www.businessofgovernment.org 35
USinG the BALAnceD ScorecArD
Figure 17: The Postmaster General’s ‘Star’
Delivering Results
Pursuing Reform• Consensus on need for change• President’s Commission on
Postal Service• Civil Service Retirement System
funding reform legislation• Pending legislation• Reforming our own processes
Growing Revenue• Stable rates• Customer-driven product
innovations• Click-N-Ship• Online insurance• Business Connect• Customer Connect• Carrier pickup• Parcel return services• Additional innovations• Negotiated pricing
Improving Service• Record end-to-end service
performance• Record customer satisfaction• Unrivaled access to services
and information• My Post Office expansion• Quick, easy, convenient• Reply mail website• Care package kits• Consistent mailing standards
Managing Costs• $8.7B in cumulative cost reductions• Fifth straight year of positive
productivity• Reduced debt by $9.5B• Transformed administrative, network, purchasing processes
Developing People• Workplace environment improvement• Record safety performance• Training and development innovations• Corporate succession planning• Performance-based pay systems
Since the Postal Service is a complex, linked oper-ating system, it carefully constructed a family of measures that helped to ensure performance maxi-mization. the performance on many key measures depends on establishing teamwork on a common goal; this common goal is a central part of the nPA. Furthermore, postal management wanted to create an incentive for sustained improvement, whether the unit was far below or far above the performance target.
the matrix or range of performance approach was developed to encourage reaching performance targets for each measure. A sample of this matrix appears in Figure 18 on page 37, which is indica-tive of the range of performance indicators that was developed for each of the key organizational goals.
the national target of 6.1� (in cell 6) is highlighted in the lower part of Figure 18. the cell selection is based on historical performance and the desired performance target. the array establishes a normal-
ized curve in which the majority of units are clus-tered around a midpoint, with a few units at the ends to the right and left of the midpoint. the sys-tem is designed so that every unit can strive toward a higher cell or performance level. For example, if a unit were currently at a performance level of 54.9 for this particular measure, it would be placed in cell 3. the gap between their current position and the national target of 61.� in cell 6 might seem insurmountable. however, moving from cell 3 to cell 4 (57.1) is probably achievable. this improve-ment would place the unit in the “contributor” cat-egory for this indicator.37
the same is true for a high-performing unit (with a score of 66.6, for example). normally they would have little incentive to improve if the national goal were 61.�. however, using the matrix approach, the high-performing unit still has room to improve by moving from cell 10 to cell 11.

iBM center for the Business of Government36
USinG the BALAnceD ScorecArD
each unit can track its performance on many opera-tional and financial issues on a daily basis. each unit receives a monthly scorecard comparing the current level of performance to the desired goal and the national norm. in addition, each unit receives a detailed nPA score based on the cell achievement and the importance of that indicator (its weighted value for that unit).
this report includes the performance on the 10 key corporate indicators and on a variety of sub-goals that support goal achievement. Different units, depending on size or function of the unit, focus attention on critical sub-processes that are under the control of local managers. individual performance objectives are set in a similar fashion, down to the supervisor level for many functions. the relative weighting of individual to unit performance indica-tors is dependent on the sphere of influence. that is, an area vice president (representing control of postal operations in a multi-state area) may have a
performance rating weighted 80 percent on corpo-rate goals and �0 percent on unit goals, while local postmasters may have a performance rating based 30 percent on corporate goals and 70 percent on the performance of goals relative to their office. A sample of the composite report card can be seen in Figure 19 on page 38. in this sample, corporate measures accounted for 75 percent of the weight of the individual’s evaluation and unit performance was worth �5 percent.
the Postal Service makes performance data widely available internally. All people working in a unit can go to the scorecard page on the USPS internal website and find the performance score for their unit. they also can see the performance of their unit relative to all others in the country. to improve organizational learning and performance, the web-site provides contact information to find out how other units have improved their performance on any given indicator.
Table 2: Strategic Goals, Performance Objectives, Measures, and Targets
Strategic Goal Strategic Objective Performance Measure FY 2005 Target
Develop people enhance performance- based culture
Safety—oShA illness and injury rate
Better than same period last year
Workplace improvement—
employee survey results
Better than end of year �004
Manage costs increase productivity total Factor Productivity Achieve plan
Improve service timely, reliable delivery
Priority Surface
ProprietaryPriority Air
express Mail
First-class mail overnight 95.0
First-class mail �-day 91.0
First-class mail 3-day 90.0
Grow revenue Sufficient to cover costs national total revenue Achieve plan

www.businessofgovernment.org 37
USinG the BALAnceD ScorecArD
the nPA score for that unit is entered into the Performance evaluation System (PeS) along with individual goals and performance. the PeS system then develops additional compensation amounts added to the base salary for each participant, based on corporate, unit, and individual performance. the pay-for-performance premium can be 10 to 15 percent of base salary.38 in Fiscal year �003, all Postal career executive Service (PceS) employees were part of the balanced scorecard and national Performance Assessment program.39 in Fy �004, all executive and Administrative Schedule (eAS) employees were included in the program.40 Some jobs are very difficult to measure, such as those at headquarters in planning, long-term marketing, law, it, and engineering. Because of the more difficult-to-measure tasks or tasks that may be multi-year in their outcomes, these jobs are measured through setting individual performance goals that are as objective, measurable, and outcome focused as possible, but by their nature some goals may be more process based.
Performance Resultsthe results of the management planning cycle, the postal adaptation of the balanced scorecard, and the reinforcing pay-for-performance system have delivered impressive results in each of the areas of strategic concern.
the Postal Service has improved its performance on those measures assessing a safe and secure environ-ment. USPS has been recognized as one of the best places for minorities to work.41 the Postal Service’s implementation of the reDreSS (resolve employment Disputes reach equitable Solutions Swiftly) program has received national recognition.4� the USPS oShA illness and injury rate, shown in Figure �0 on page 39, improved to 6.3 in �004 from 8.7 in �000.43
the results of the annual employee satisfaction survey, expressed as an index for six key questions (where a larger index indicates improvement), have advanced from 57.5 in �000 to 6�.1 in �004, as shown in Figure �1.44
Index Performance—Cluster Frequency
1
52.1 53.5 54.9 57.1 59.3 61.2 62.3
2
Non-Contributor Contributor High Contributor Exceptional Contributor
3 4 5 6 7
63.7
8
65.2
9
66.6
10
68.0
11
69.5
12
70.9
13
72.3
14
73.7
15
Indicator for the Voice of the Customer Survey Results
53.0
54.0
55.0
56.0
57.0
58.0
59.0
60.0
61.0
62.0
63.0
64.0
65.0
66.0
67.0
68.0
69.0
70.0
71.0
0
2
4
6
8
10
12
Figure 18: Example of a National Performance Assessment 15-Cell Matrix

iBM center for the Business of Government38
USinG the BALAnceD ScorecArD
Uni
t Typ
e: C
lust
er L
eade
rs T
eam
Non
-Con
trib
utor
Con
trib
utor
Hig
h C
ontr
ibut
orEx
cept
iona
l C
ontr
ibut
or
Dep
th
Targ
etW
eigh
tC
ell
Scor
eIn
dica
tor
12
34
56
78
910
1112
1314
15
Corporate 75%
clu
ster
95.0
7.5%
3.�
�50
Prio
rity
Sur
face
clu
ster
90.0
7.5%
3.�
�50
Prio
rity
Air
clu
ster
95.0
5.0%
10.5
000
expr
ess
Mai
l
clu
ster
95.0
10.0
%5
.500
0Fi
rst c
lass
on
94.5
95.0
95.�
95.4
95.7
95.9
96.1
96.3
96.6
96.8
97.0
clu
ster
91.0
5.0%
5.�
500
Firs
t cla
ss �
-Day
90.0
91.0
91.6
9�.1
9�.7
93.�
93.8
94.3
94.9
95.4
96.0
clu
ster
90.0
5.0%
5.�
500
Firs
t cla
ss 3
-Day
89.8
90.0
90.4
90.9
91.3
91.8
9�.�
9�.7
93.1
93.6
94.0
clu
ster
6.0
10.0
%7
8.8
000
oSh
A i&
i Avg
.8.
05.
6-1
1.1%
4.7
4.�
3.7
3.3
�.9
�.5
�.3
0.0
9-9
.0%
-1�.
0%-1
5.0%
-18.
0%-�
1.0%
-�4.
0%-�
7.0%
clu
ster
6.0
10.0
%7
9.9
000
Vo
e Su
rvey
Avg
.9.
064
.�4.
1%67
.969
.470
.87�
.�73
.675
.0
0.�
113.
1%3.
9%4.
7%5.
4%6.
�%7.
0%
nat
iona
l0.
6�0
.0%
10�.
000
tot n
atio
nal r
ev�.
1�.
3�.
63.
03.
54.
5
nat
iona
l0.
0�0
.0%
91.
800
tFP
.50
.60
.80
1.0
1.3
1.5
�.0
Unit 25%
clu
ster
6.0
5.0%
69
.450
0B
MeU
Pro
f (be
st o
f)9.
069
6.0
13.0
%7�
3.0
73�.
074
1.0
750.
075
9.0
768.
0
5.0
913
.9%
16.1
%18
.3%
�0.6
%��
.8%
�5.0
%
clu
ster
6.0
10.0
%1�
111.
100
ret
ail c
SM A
vg.
11.0
650.
716
.7%
640.
065
7.0
673.
067
5.0
0.0
9�6
.5%
31.0
%33
.5%
35.0
%
clu
ster
96.0
5.0%
7.3
500
Parc
el S
elec
t DD
U96
.496
.696
.997
.�97
.597
.898
.198
.498
.7
clu
ster
6.0
5.0%
98
.400
0W
ait t
ime
Avg
.8.
09�
.�0.
1%91
.793
.194
.495
.897
.�98
.610
0.0
0.0
6�4
.0%
3�.0
%40
.0%
48.0
%51
.0%
76.0
%10
0.0%
clu
ster
6.0
5.0%
56
.300
0M
VA
Avg
.6.
010
.5-1
.9%
9.3
8.6
7.9
7.1
6.4
5.7
5.0
4.0
3.0
0.0
6-4
.0%
-8.0
%-1
�.0%
-16.
0%-�
0.0%
-�4.
0%-�
8.0%
-3�.
0%-3
6.0%
clu
ster
3.0
5.0%
6.3
000
Sfty
Pgm
eva
l Gui
de3.
13.
33.
53.
84.
04.
�4.
34.
54.
64.
8
clu
ster
4�.5
0.0%
6.0
000
eeo
con
vers
ion
rat
e41
.141
.039
.538
.036
.535
.033
.53�
.030
.5�9
.0
clu
ster
6.0
10.0
%6
111.
100
cas
es P
endi
ng A
vg.
11.0
-10.
34.
40%
-16.
7-1
7.8
-18.
9-�
0.0
6.0
155.
60%
5.53
%5.
47%
5.40
%
clu
ster
0.0
35.0
%6
�.10
0to
e %
Pla
n-0
.1-0
.5-1
.0-1
.5-�
.0-3
.0-4
.0-6
.0-8
.0-1
0.0
clu
ster
�.4
10.0
%5
.500
0r
etai
l rev
% P
lan
�.3
�.4
3.0
3.6
4.3
4.9
5.5
6.1
6.8
7.4
8.0
clu
ster
�.5
10.0
%9
.900
0r
et. A
lt. A
cces
s r
ate
3.4
3.6
3.9
4.�
4.4
4.7
5.0
Cor
pora
te S
umm
ary
Scor
e 7.
45U
nit
Sum
mar
y Sc
ore
7.50
Com
posi
te S
umm
ary
Scor
e 7.
47
* D
ue to
dat
a is
sues
, exp
ress
Mai
l Jun
e sc
ores
are
the
sam
e as
May
sco
res.
non
-con
trib
utor
con
trib
utor
hig
h c
ontr
ibut
orex
cept
iona
l con
trib
utor
Clu
ster
Lea
ders
Tea
m C
ompo
site
Sum
mar
yc
orpo
rate
Sum
mar
y 7.
45 x
75.
0%=
5.5
9U
nit S
umm
ary
7.50
x �
5.0%
= 1
.88
Com
posi
te S
umm
ary
7.47
Figu
re 1
9: C
ompo
site
Rep
ort
Car
d—C
lust
er L
eade
rs T
eam
(N
atio
nal P
erfo
rman
ce A
sses
smen
t)—
June
(FY
200
5 Ye
ar-t
o-da
te)

www.businessofgovernment.org 39
USinG the BALAnceD ScorecArD
the improvements in the workplace, along with aggressive implementation of automation and other management investments, have led to a remark-able growth in postal productivity that has outpaced the growth of productivity in the U.S. economy, as shown in table 3 on page 40. the result is that the Postal Service is delivering more mail to more places, with fewer employees. Figure �� on page 41 graphically shows this productivity improvement.
total operating revenue also has improved from $64,540 million in �000 to $68,960 million in �00445 (Figure �3 on page 41), with postage rates increasing below the rate of inflation. this is an average annual increase of � percent, even though the volume of first-class mail declined by 5.4 percent (Fy �004 compared to Fy �000) and lower margin standard mail increased by 6.1 percent.46
Postal delivery service also has improved signifi-cantly. First-class mail performance has improved from the crisis days of chicago to over 95 percent of overnight mail being delivered on time, with improvements in other categories of first-class mail, as shown in Figure �4 on page 41.47
Summaryone way to summarize the effectiveness of the postal implementation of the balanced score-card approach is to refer to the assessment of the American Society for Quality in their annual American customer Service index, where they described the Postal Service in their �004 survey as “the most improved organization” since the comparative measurement program began in 1994 (see table 4 on page 4�). in an overall compari-son to industry ratings of customer satisfaction, the Postal Service ranked above the transportation, telecommunications, and Utilities averages, and about equaled the Services industry.48 Although there may be many other factors involved in the recent success of the Postal Service, the balanced scorecard approach certainly has played an important role as part of a sustained and focused performance improvement effort.
5.0
5.5
6.0
6.5
7.0
7.5
8.0
8.5
9.0
FY20
00
FY20
01
FY20
02
FY20
03
FY20
04
Illness and Injury Rate per 1,000 Workhours
Percent
Fiscal Year
Figure 20: OSHA Safety Performance
45.0
50.0
55.0
60.0
65.0
FY20
00
FY20
01
FY20
02
FY20
03
FY20
04
Percent Favorable
Fiscal Year
Figure 21: Voice of the Employee Survey Performance

iBM center for the Business of Government40
USinG the BALAnceD ScorecArD
Productivity Since 1990
Total Factor Productivity (TFP) Output per Workhour1
Multifactor Productivity2 (MFP)
Annual3Cumulative from 1972 Annual
Cumulative from 1972 Annual
Cumulative from 1972
1990 �.9 8.6 3.4 13.9 (0.0) 11.3
1991 (1.8) 6.8 (0.1) 13.7 (1.0) 10.�
199� 0.4 7.� 1.0 14.8 �.0 1�.�
1993 3.8 11.0 4.6 19.3 0.5 1�.7
1994 (0.�) 10.9 0.8 �0.� 1.0 13.7
1995 (1.9) 8.9 (1.3) 18.9 0.4 14.1
1996 (1.3) 7.6 (0.1) 18.8 1.4 15.5
1997 1.3 8.9 1.7 �0.5 1.0 16.5
1998 (1.0) 7.9 1.� �1.7 1.� 17.7
1999 (0.1) 7.7 0.9 ��.6 0.7 18.4
�000 �.� 9.9 �.0 �4.6 1.4 19.9
�001 1.7 11.6 1.7 �6.3 (1.1) 18.8
�00� 1.0 1�.6 �.� �8.5 �.0 �0.8
�003 1.8 14.4 �.3 30.8 �.7 �3.5
�004 �.4 16.8 �.4 33.3 �.8 �6.3
Table 3: Productivity Comparisons 1990–2004
1. output per Workhour measures the changes in the relationship between workload (mail volume and deliveries) and the labor resources used to do the work. the main output is delivering mail and services to an expanding network.
�. �00�–�004 MFP data are estimates of Global insights, inc. Bureau of Labor Statistics (BLS) data for these years have not yet been released.
3. historical data is subject to revision as certain data used in calculating productivity are periodically revised. Price indexes released by the BLS and the Bureau of economic Analysis that are used to calculate resource usage are subject to historical revisions by these agencies. When historical revisions are released, they are incorporated into the tFP calculation, which can result in historical tFP revisions. tFP for the reporting year is also subject to revision when final Postal Service cost data for the reporting year are available. Generally, this revision occurs in April of the following year.

www.businessofgovernment.org 41
USinG the BALAnceD ScorecArD
$62,000
$63,000
$64,000
$65,000
$66,000
$67,000
$68,000
$69,000
$70,000
FY20
00
FY20
01
FY20
02
FY20
03
FY20
04
Revenue Dollars (millions)
Fiscal Year
Figure 23: USPS Operating Revenue Improvements
78
80
82
84
86
88
90
92
94
96
FY20
00
FY20
01
FY20
02
FY20
03
FY20
04
Percent on Time
Fiscal Year
Overnight 2-Day 3-Day
Figure 24: First-Class Mail Delivered within Standard
0.5
1.5
4.5
3.5
2.5
5.5
7.5
9.5
8.5
6.5
FY20
00
FY20
01
FY20
02
FY20
03
FY20
04
Total Factor Productivity Performance
Percent Change from Previous Year
Previous Year
Percent
Fiscal Year
Figure 22: Postal Productivity Improvements

iBM center for the Business of Government4�
USinG the BALAnceD ScorecArD
Firm/IndustryBaseline
(Summer 1994) 2004Change from Baseline (%)
U.S. Postal Service 61 74 �1.3
U.S. Postal Service (Parcel/express Services) 69 77 11.6
Parcel/express Delivery Service industry 81 81 0.0
Scheduled Airlines 7� 66 -8.3
telecommunication Services 81 71 -1�.3
energy Utilities 75 7� -4.0
hotels 75 7� -4.0
transportation, communication and Utilities industry 75.5 69.7 -7.7
Service industry 74.4 74.7 0.4
Table 4: Comparative Customer Satisfaction Index Ratings
Source: 2004 Transportation/Communication/Utilities and Services Industry Report, American Society for Quality.

www.businessofgovernment.org 43
USinG the BALAnceD ScorecArD
Building a Balanced Scorecard Using Lessons Learned from DFAS and USPS
the balanced scorecard, or BSc, is primarily a tool for translating an organization’s strategy into action through the development of performance objectives and measures in order to fulfill its mission. For many organizations, strategy may be a new destination, somewhere that has not been traveled before. the BSc is a method to document and test the assump-tions inherent in that strategy.
A well-designed BSc describes strategy through specific objectives and measures. these measures should link together in a chain of cause-and-effect relationships from the performance drivers in the employee Learning and Growth perspective all the way through to improved customer (stakeholder) outcomes as reflected in the customer perspective. Strategy is documented through measurement, mak-ing the relationships between the measures explicit so they can be monitored, managed, and validated.
We considered different ways to present the find-ings from our study of the Defense Finance and Accounting Service and the United States Postal Service, and decided to link what we have learned to an action-oriented process map (or road map) that leaders of an organization can follow step by step as they develop their own balanced score-card. Within our discussion, we give examples of how each of the organizations approached the action steps on their journey in developing their own variation of the scorecard. We have adopted the more aligned version of the scorecard and one that more closely matches effective Baldrige prin-ciples. We hope that by presenting how others have approached scorecard development and clarifying the sequential action steps needed, future organiza-tion leaders will be helped in their journey toward performance improvement.
in table 5 on page 44, we have included nine action steps along with other supporting activities, the key groups of employees to involve, and the training focus needed to facilitate the development and deployment of the balanced scorecard. What follows is a more detailed explanation of each of the nine steps and how DFAS and the USPS applied them. this will serve as a useful guide to be applied in other government organizations.
Action Step 1: Develop a Clear Mission Statement At the onset, both organizations had clear mission statements. the DFAS mission statement is provided in the box on page 13. the United States Postal Service mission statement appears in the box on page 45.
A mission statement provides direction to the orga-nization by outlining in the broadest terms what the purpose of the organization is, what the organiza-tion values, and how it views its relationship with its customers and key stakeholders. the mission statement provides a start by clearly stating publicly what it values and plans to do that will guide the behavior of its employees.
Key groups involved: if not present already, senior leadership should develop a mission statement. early drafts of the mission statement should be shared with internal and external stakeholders of the organization in order to get their input, concur-rence, and acceptance. of particular importance is the acceptance of the mission statement by employee groups. the mission statement can help start building a culture that works toward accom-plishing the mission. While the mission statement cannot make that culture happen, it is a beginning, a means to bring together disparate groups to gather under the values and goals of the organization.
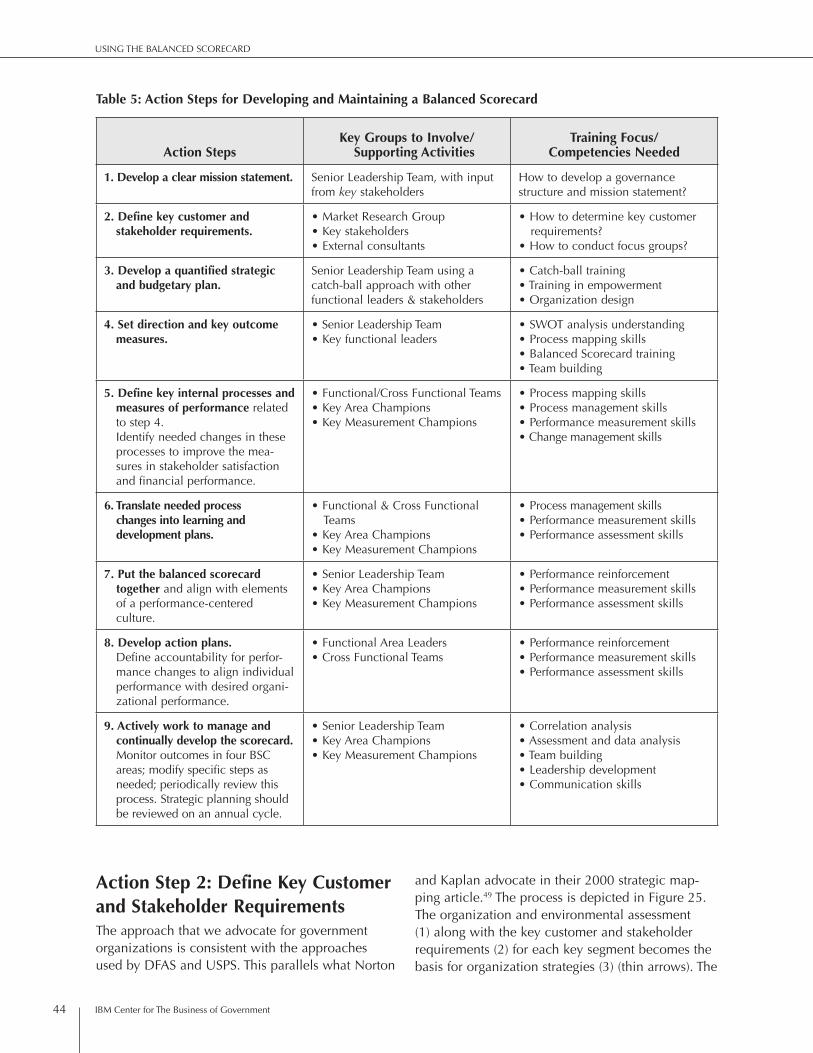
iBM center for the Business of Government44
USinG the BALAnceD ScorecArD
Action Step 2: Define Key Customer and Stakeholder Requirementsthe approach that we advocate for government organizations is consistent with the approaches used by DFAS and USPS. this parallels what norton
and Kaplan advocate in their �000 strategic map-ping article.49 the process is depicted in Figure �5. the organization and environmental assessment (1) along with the key customer and stakeholder requirements (�) for each key segment becomes the basis for organization strategies (3) (thin arrows). the
Action StepsKey Groups to Involve/
Supporting ActivitiesTraining Focus/
Competencies Needed
1. Develop a clear mission statement. Senior Leadership team, with input from key stakeholders
how to develop a governance structure and mission statement?
2. Define key customer and stakeholder requirements.
• Market research Group• Key stakeholders• external consultants
• how to determine key customer requirements?
• how to conduct focus groups?
3. Develop a quantified strategic and budgetary plan.
Senior Leadership team using a catch-ball approach with otherfunctional leaders & stakeholders
• catch-ball training• training in empowerment• organization design
4. Set direction and key outcome measures.
• Senior Leadership team• Key functional leaders
• SWot analysis understanding• Process mapping skills• Balanced Scorecard training• team building
5. Define key internal processes and measures of performance related to step 4. identify needed changes in these processes to improve the mea-sures in stakeholder satisfaction and financial performance.
• Functional/cross Functional teams• Key Area champions• Key Measurement champions
• Process mapping skills• Process management skills• Performance measurement skills• change management skills
6. Translate needed process changes into learning and development plans.
• Functional & cross Functional teams
• Key Area champions• Key Measurement champions
• Process management skills• Performance measurement skills• Performance assessment skills
7. Put the balanced scorecard together and align with elements of a performance-centered culture.
• Senior Leadership team• Key Area champions• Key Measurement champions
• Performance reinforcement • Performance measurement skills• Performance assessment skills
8. Develop action plans. Define accountability for perfor-mance changes to align individual performance with desired organi-zational performance.
• Functional Area Leaders• cross Functional teams
• Performance reinforcement • Performance measurement skills• Performance assessment skills
9. Actively work to manage and continually develop the scorecard. Monitor outcomes in four BSc areas; modify specific steps as needed; periodically review this process. Strategic planning should be reviewed on an annual cycle.
• Senior Leadership team• Key Area champions• Key Measurement champions
• correlation analysis• Assessment and data analysis• team building• Leadership development• communication skills
Table 5: Action Steps for Developing and Maintaining a Balanced Scorecard

www.businessofgovernment.org 45
USinG the BALAnceD ScorecArD
key requirements then are translated and aligned to key customer satisfaction measures (4) and key process performance requirements (5) (bold arrows). As the dashed feedback arrows suggest, meeting the process requirements will directly relate to improv-ing satisfaction measures, which will directly relate to meeting key strategies of the organization.
Knowing key customer and stakeholder require-ments for the organization is critical in developing strategies, budgets, and process requirements. these requirements are the drivers of what the organiza-tion will do. if you do not meet the needs of these key groups, you will not get the degree of customer and stakeholder satisfaction that may be necessary to ensure a sustainable and effective organization.
Key groups involved: Focus groups or surveys with open-ended questions can be used to determine what is important to each customer and stakeholder segment. Focus groups often offer a good start by narrowing down issues before an organization sends out more broad-based survey questionnaires. Focus groups can help to identify relevant customer and stakeholder segments as well as the issues impor-tant to these segments. this is done in focus groups by using open-ended questions that will allow the respondent to articulate key requirements. then sur-veys can be used to validate the information gained from focus groups. important in this step is to have a process, a systematic set of actions that can be used
to determine the segments and their needs. Making guesses may miss critical information.
once focus groups provide a sense of key customer and stakeholder requirements, then the organiza-tion can use customer and stakeholder satisfaction surveys to track how well the public perceives the organization is doing on these key dimensions. Both DFAS and USPS used surveys to assess their perfor-mance, and the questions range over many of the
Discussion of the Postal Service Mission, Vision, and Objectives
in 1970, congress enacted the Postal reorganization Act, transforming the former Post office Department into the United States Postal Service. the intent was to ensure that the former department became a self-sustaining federal entity, operating more like a business. the Postal reorganization Act states that the Postal Service will have the “basic and fundamental” responsibility to provide postal services to bind the nation together through the personal, educational, literary, and business correspondence of the people. Prompt, reliable, and efficient postal services must be extended to patrons in all areas and to all communities.
the objective of transformation was stated in the April �00� transformation Plan and the Strategic Plan �004–�008. the plans acknowledge the assistance of the full range of stakeholders in the postal industry and a firm commitment to all stakeholders, especially our customers. in order to maintain our financial viability and fulfill our universal service mission, we commit that we will:
• Foster growth by increasing the value of postal products and services to our customers;
• improve operational efficiency; and
• enhance the performance-based culture.
2. Key Customer and Stakeholder Requirements
1. Organization and External Environment Assessment
3. Strategies
4. Key Customer and Stakeholder Satisfaction Measures
5. Key Internal Processes and Process Effectiveness Measures
Figure 25: Relationships Between Key Customer Requirements, Process Requirements, and Customer Satisfaction

iBM center for the Business of Government46
USinG the BALAnceD ScorecArD
items important to customers. other stakeholders, like funding agencies, are critical in this process as well. the government organization needs to know the pulse of these funding organizations to deter-mine what the expectations are for the organiza-tion and how well they are meeting expectations. this may be done less formally, but it still is critical so that the organization is “in sync” with funding group expectations. For example, having data and data analysis in a form that supports the need of the funding group would be a key area.
Just knowing the key requirements is helpful, but translating these elements into some quantified mea-sure is critical so the level of expectation becomes clear. For example, stating that quick resolution of a complaint or concern is important is helpful for the organization to know. however, this does not tell the organization what is meant by “quick” or “resolution.” if the customer is expecting all issues will be solved in a maximum of four business days while the organization considers quick resolution in terms of one month, there is a significant disconnect between expectations and performance. the result is customer dissatisfaction. hence, it is imperative to translate customer and stakeholder needs into some quantified measures of performance. this becomes the means to translate customer requirements to organization strategies, to develop the means to assess customer satisfaction measures, and to create performance requirements for the key processes that deliver the services important to the customer. these relationships are indicated in Figure �5 by the bold lines flowing from the key customer and stakeholder requirements.
the Postal Service translated customer expectations into specific performance targets related to their process of delivering mail. they have specific time expectations for delivering priority airmail, prior-ity surface mail, and first-class mail divided into overnight, two-day, and three-day delivery goals. Processes and reinforcements are then designed to meet these customer expectations. the Postal Service then samples deliveries to track how well its key processes (delivering the mail) meet the key customer requirements or expectations. By meeting these needs, USPS expects that customers will be satisfied and will be more inclined to use the Postal Service, helping USPS meet its revenue target. in the same manner, DFAS has tracked its costs as a
percentage of the Department of Defense budget, an important stakeholder concern, while making dra-matic increases in overall customer satisfaction.
Both organizations we studied had made progress in determining key customer and stakeholder require-ments and translated them into quantified measures. they then applied the measures to their strategies, customer satisfaction measures, and established performance measures for the important processes that would meet customer needs. each step is essen-tial; organizations need to understand what their customers expect. Determining those expectations and quantifying them comes from initially interact-ing with customers to determine what is important to them. Assuming what those needs are could leave the organization in peril. the quantification of requirements needs to be based on what the customer expects, not the organization’s current capabilities. With quantified customer requirements in hand, the organization can build a set of strate-gies and process requirements that will enhance the organization’s ability to meet the needs of customers and key stakeholders.
Action Step 3: Develop a Quantified Strategic and Budgetary PlanAccording to the Baldrige criteria, an effective organization is built upon a fact-based leadership approach and a well-quantified strategic plan.50 Building a fact-based culture and a solid strategic plan dictates use of a systematic process to analyze the organization and the environment in which it operates. An effective balanced scorecard depends on defining appropriate strategies. Appropriate strategies evolve by scanning the external environ-ment so that appropriate actions can be taken by the organization based on the current strengths, weaknesses, and competencies of the organization. SWot (strengths, weaknesses, opportunities, and threats) analysis is an effective approach to do a systematic analysis. however, it is quite important that the organization focus on defining its customers and other stakeholders, find meaningful segments of each group, and determine the key requirements of each segment.
Key groups involved: Strategic planning requires the time and attention of senior leaders as well as the willingness to provide sufficient resources to carry

www.businessofgovernment.org 47
USinG the BALAnceD ScorecArD
out the planning activities. Key functional manag-ers need to provide an accurate internal scanning of strengths and weaknesses. opportunities and threats as well as key stakeholder requirements and con-cerns need to be discerned by task forces composed of organizational members most knowledgeable about the external environment.
Both DFAS and USPS conducted assessments of their external environments and the strengths and weaknesses of their organizations as part of broader transformation plans. For example, in their trans-formation document, USPS defined their major customer and stakeholder groups along with expec-tations of each group. in addition, the Postal Service focused on changes in the external environment that would affect the competitive environment and expected resulting demand for their particular ser-vices in the future. DFAS did similar data analysis. these analyses are essential for both organizations as they plan infrastructure and the changes each organization must make to remain competitive. DFAS, as a younger organization, had the additional problem of trying to merge many different operating systems that were inherited into a more cost- effective and responsive process.
Sometimes lost in the SWot assessment is the need to stress, as these organizations did, the importance of identifying customer and other stakeholder seg-ments and the key requirements of each group. Also essential is the need to align organization focus toward meeting those needs. this is as true for nonprofits or government organizations as it is for profit-based organizations. if key stakeholder requirements are not understood by the organization, it will be difficult, if not impossible, to develop strategies that are respon-sive to customers and to other stakeholder needs.
Assessing an organization’s internal strengths and weaknesses, as well as the opportunities, threats, and trends that they face in the external environ-ment, can be done by involving key leaders in the organization along with representatives from each of the key customer and stakeholder segments. this provides input from many different perspectives. however, that is not enough; the organization needs to develop a process to gather and analyze data in the external environment that is germane to under-standing trends affecting demand for its services or changing requirements in those services. in addi-
tion, for government-funded operations, knowledge of the changing funding patterns and philosophies regarding the role and size of government are criti-cal factors that can shape the mandates affecting how the government organization operates in the future. For example, like many government agen-cies, DFAS faces the possibility that their function could be outsourced to the private sector. this can affect their planning horizon, their ability to gather resources to improve operations, and their ability to recruit new employees.
Connect Strategy to Budget ProcessA major problem that often occurs when develop-ing a sense of strategic direction is not tying the budgetary process into the strategic process. Since the budgetary process allocates the resources of the organization, the strategic planning process is virtually meaningless if not tied to a consideration of how resources will be allocated over the many competing needs of the organization. Both DFAS and USPS connected the scorecard very early on to resource allocations; this enables the organization to make the changes needed to meet scorecard targets.
Key groups involved: to deal with this issue, some organizational redesign may be required to ensure a smoothly running organization. At the very least, task forces or committees made up of members from appropriate areas need to be established and led by a senior leadership team. We advocate this broader systematic view in any adoption of the balanced scorecard.
Action Step 4: Set Direction and Key Outcome Measures for the Organizationonce the organization assessment is completed and the key requirements are identified for the key customer segments and stakeholders, the organiza-tion needs to identify key organizational goals and strategies that support meeting those requirements. Kaplan and norton advocate that elements in the balanced scorecard flow from the strategy of the organization.
Key groups involved: Key players in establishing direction are the strategic planning group along with the senior leadership team. of course, a well-developed strategy requires input from various levels
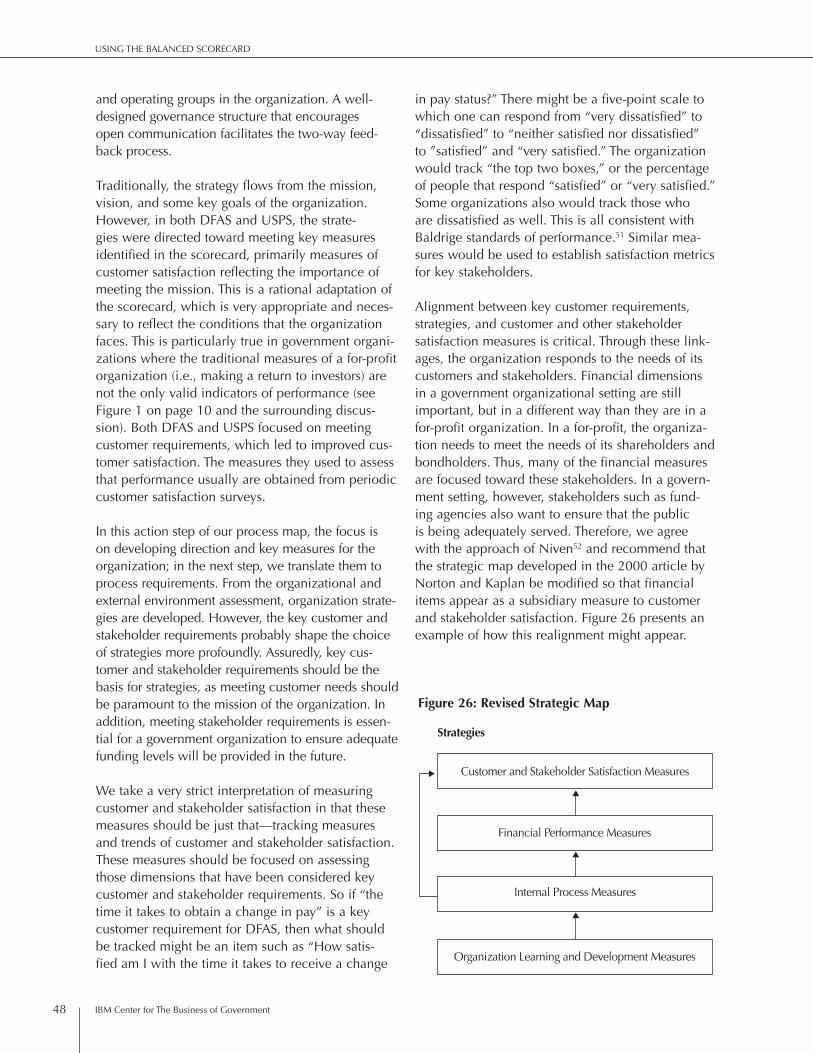
iBM center for the Business of Government48
USinG the BALAnceD ScorecArD
and operating groups in the organization. A well-designed governance structure that encourages open communication facilitates the two-way feed-back process.
traditionally, the strategy flows from the mission, vision, and some key goals of the organization. however, in both DFAS and USPS, the strate-gies were directed toward meeting key measures identified in the scorecard, primarily measures of customer satisfaction reflecting the importance of meeting the mission. this is a rational adaptation of the scorecard, which is very appropriate and neces-sary to reflect the conditions that the organization faces. this is particularly true in government organi-zations where the traditional measures of a for-profit organization (i.e., making a return to investors) are not the only valid indicators of performance (see Figure 1 on page 10 and the surrounding discus-sion). Both DFAS and USPS focused on meeting customer requirements, which led to improved cus-tomer satisfaction. the measures they used to assess that performance usually are obtained from periodic customer satisfaction surveys.
in this action step of our process map, the focus is on developing direction and key measures for the organization; in the next step, we translate them to process requirements. From the organizational and external environment assessment, organization strate-gies are developed. however, the key customer and stakeholder requirements probably shape the choice of strategies more profoundly. Assuredly, key cus-tomer and stakeholder requirements should be the basis for strategies, as meeting customer needs should be paramount to the mission of the organization. in addition, meeting stakeholder requirements is essen-tial for a government organization to ensure adequate funding levels will be provided in the future.
We take a very strict interpretation of measuring customer and stakeholder satisfaction in that these measures should be just that—tracking measures and trends of customer and stakeholder satisfaction. these measures should be focused on assessing those dimensions that have been considered key customer and stakeholder requirements. So if “the time it takes to obtain a change in pay” is a key customer requirement for DFAS, then what should be tracked might be an item such as “how satis-fied am i with the time it takes to receive a change
in pay status?” there might be a five-point scale to which one can respond from “very dissatisfied” to “dissatisfied” to “neither satisfied nor dissatisfied” to ”satisfied” and “very satisfied.” the organization would track “the top two boxes,” or the percentage of people that respond “satisfied” or “very satisfied.” Some organizations also would track those who are dissatisfied as well. this is all consistent with Baldrige standards of performance.51 Similar mea-sures would be used to establish satisfaction metrics for key stakeholders.
Alignment between key customer requirements, strategies, and customer and other stakeholder satisfaction measures is critical. through these link-ages, the organization responds to the needs of its customers and stakeholders. Financial dimensions in a government organizational setting are still important, but in a different way than they are in a for-profit organization. in a for-profit, the organiza-tion needs to meet the needs of its shareholders and bondholders. thus, many of the financial measures are focused toward these stakeholders. in a govern-ment setting, however, stakeholders such as fund-ing agencies also want to ensure that the public is being adequately served. therefore, we agree with the approach of niven5� and recommend that the strategic map developed in the �000 article by norton and Kaplan be modified so that financial items appear as a subsidiary measure to customer and stakeholder satisfaction. Figure �6 presents an example of how this realignment might appear.
Financial Performance Measures
Customer and Stakeholder Satisfaction Measures
Strategies
Internal Process Measures
Organization Learning and Development Measures
Figure 26: Revised Strategic Map
www.businessofgovernment.org 49
USinG the BALAnceD ScorecArD
Financial measures might include examples of the following: the cost of processing an employee pay change at DFAS or the several different cost measures that relate the amount of annual surplus or deficit at USPS. items such as contributions from each product line, contributions from each postal unit, average cost of processing a first-class letter, and so on would be measures that would be of interest to some key stakeholders of each organization either through a funding organization or through the board that would approve a rate hike for USPS.
Action Step 5: Define Key Internal Processes and Measures of Performancethe financial and customer/stakeholder satisfac-tion measures are outcome measures to ensure that organizational objectives are met. internal processes are needed to ensure these outcome measures are met. (A process is a set of repeatable steps to complete an activity). For example, at USPS there is a process for gathering mail and shipping it to regional units for sorting. there is a sorting process, a transportation process, and a process for final sort and delivery. these processes are designed to meet the outcome measures of timely delivery. recently, organizations began to realize that the key to perfor-mance management is to define the key processes of the organization and work to design and manage these processes effectively. For example, the United Parcel Service (UPS) chicago Area consolidated hub, where many parcels are sorted, improved the volume of accurate sorts through process design and management. their initial expectations were that half a million packages would go through the facility per day. through process design and man-agement, they have had 1.84 million packages go through the facility at one time, with a current day-to-day average of 1.3 million to 1.6 million packages per day.53 organizations need to define processes so they can understand what is related to getting something done in the organization. By physically charting the key processes, the organiza-tion gains a better understanding of the important activities required to meet organization goals. once the entire process is understood, the organization can work to improve it—to make it better, faster, more reliable, and cost-effective. however, this cannot be done until there is an understanding of all of the steps that are involved in the activity.
Which processes are critical? there should be a direct relationship between the processes identified and meeting the measures identified in customer/stakeholder satisfaction and financial measures. the alignment becomes critical between processes, sat-isfaction measures, financial measures, and meeting key customer and stakeholder requirements.
For example, customer requirements for first-class mail delivery are that the letter arrives in a reasonable number of days. Let us say it should take three days to deliver a letter from harrisburg, Pennsylvania, to tulsa, oklahoma. that expectation is then translated into a customer satisfaction measure that is tracked: “how satisfied are you with the timeliness of deliver-ies?” with a response from “very dissatisfied” to “very satisfied.” Doing this helps the organization to track how well customers think the organization is doing. We advocate that customer satisfaction measures be used to assess customer satisfaction directly, rather than relying on the use of performance dimensions themselves as an indicator of consumer satisfaction. the process that relates to the delivery of mail can be oversimplified, as done in Figure �7 on page 50. this process is really the combination of many different processes, but these processes in combination is what is essential to reach the needed process requirement of “delivering a first-class letter within three days.”
the complexity of this process and the need for all elements to work together to meet these process requirements led USPS to set their performance system to encourage units to work together to meet these process requirements. in a similar manner, each key customer requirement is linked to a satisfaction measure, which, in turn, is aligned with a process. that process also has measures that relate to the customer satisfaction measure and, most likely, some measure of financial performance as well.
Key groups involved: Measurement champions play a key role in this process by ensuring consistency across the organization. Area champions, on the other hand, ensure consistency within organiza-tional units as the measures are deployed down through the unit. these individuals act as “the eyes and ears” of the senior leadership team by report-ing periodically regarding problem areas that may arise. Appropriate modifications or adjustments in measures can be taken to ensure the active commit-ment of employees and managers throughout the organization.

iBM center for the Business of Government50
USinG the BALAnceD ScorecArD
Action Step 6: Translate Needed Process Changes into Learning and Development Plans the last of the four components in the balanced scorecard framework is called the Learning and Growth perspective.54 the role of learning and development supports the current and future devel-opment of knowledge and skills (competencies) needed to perform identified key processes ade-
quately. improving both the technical, operational, and human aspects of the processes is done in this part of the balanced scorecard. Without provid-ing people with needed competencies, the other perspectives (parts) of the BSc cannot be realized fully. this is why alignment of different parts of the scorecard is so important. it is like trying to build a skyscraper without a strong foundation. these development needs can be of three types: (1) look-ing at new ways to address needs, (�) making modi-fications to an existing process, and (3) developing employees and leadership to improve the operations and management of processes.
coming up with long-range and innovative approaches to improve key processes is one aspect of learning and development. Both of the profiled organizations had extensive development work in that area. For example, DFAS worked to reduce the many different systems that it inherited in order to speed processes, reduce errors, and reduce costs. in addition, it worked with military branch custom-ers to improve each other’s processes. For example, in submitting a change in personnel status and therefore a change in pay, the personnel action is done by the specific branch of service while the change in pay is processed by DFAS. if the service branch process is lengthy or inaccurate, then the whole process suffers. DFAS worked with each military branch (or what it calls one of its custom-ers) to improve processes on both sides. Likewise, USPS dramatically improved some of its key pro-cesses by working with partners. For example, it collaborated with Federal express in hauling mail to improve USPS’s ability to meet its process goal of delivering various classes of mail in the standard allotted time.
Key groups involved: A second type of change focuses more on the continuous improvement aspect of processes. here the focus is on how the organization can make it better, faster, more reliable, and less costly. these changes include improvements such as adjusting schedules, modify-ing work procedures, and improving quality control. in our interviews with both steering groups (DFAS and USPS), we learned that continuous improve-ment was a day-to-day part of each leader’s job as well as on the minds of those who worked with the balanced scorecard. the makeup of the focus groups involved representatives from various functional
Customer Requirement: First-class mail should be delivered within 3 days of posting.
Customer Satisfaction Measures: Percentage of survey respondents that respond “satisfied or very satisfied” with the time it takes to deliver first-class mail.
Learning and Development: Supporting the future and current development of the process and providing employees learning and develop-ment opportunities
Simplified Process Map of Mail Delivery: 1. Pick up mail from local mailbox 2. Gather at local post office 3. Transport to regional sort facility 4. Sort to destination regional sort facility 5. Transport to destination regional sort facility 6. Sort and bundle for local post office 7. Transport to local post office 8. Sort mail to specific route 9. Sort route mail to specific address 10. Deliver to location
Process Requirements or Performance Measures for the Process:• 3-day length of the process• Percentage of mail sorted correctly at each sort stage• Percentage of transported mail arriving at destination on time• Cost of processing and transporting at each step in process
Figure 27: Relationship of Key Customer Requirements to Customer Satisfaction Measures and to Process Definition and Requirements
www.businessofgovernment.org 51
USinG the BALAnceD ScorecArD
departments. this was done to break down the tra-ditional management culture of being concerned with only what happens in one’s unit. A functional culture is frequently at odds with what is needed for a strategy-focused organization, especially when processes that transcend departments need to be streamlined.
Focus groups met on a regular basis to determine how to improve performance and better meet the needs of the customers. in fact, Ann Wright, one of the team members interviewed at USPS, was between meetings when we met. She had just returned from chicago, having worked with employees there to improve their handoffs. After our interview, she was off to Pittsburgh to work on problems that both her unit and Pittsburgh had in common.
the third dimension of learning and development is the learning component. Learning relates to the improvement of (1) skills to perform the technical aspects of the process, (�) leadership skills to manage the process or build the culture, or (3) communica-tion skills of employees or leaders to interact better with their customers and stakeholders. however, in a fact-based organization this training also should be focused on those activities and behaviors that have a direct effect on process improvement. training in areas of process improvement tech-niques, as well as performance measurement and assessment skills, becomes important. this requires training assessment that goes beyond assessing the degree of satisfaction that the participant has had in the training program. there also needs to be an assessment of the actual skills or behavior gained, whether the skills are practiced on the job and, of most significance, whether the training made a differ-ence in process performance. While both organiza-tions had extensive training programs and most were tied to resolving specific performance issues, it was not clear if they had (as most organizations do not) the means to assess the link between training activity and job performance or process improvement.
For most organizations, training in how to improve treatment of customers should receive higher pri-ority. Satisfaction with service often relates to the quality of the behavioral interactions. in fact, that is why some organizations are backing away from the use of automated answering systems; custom-
ers who need help want to talk to people, not machines. customers also want to be treated fairly, with respect, and have their concerns adequately addressed. Sometimes just explaining the process to the customer—that is what can or cannot be done and when—is all that is needed. For example, Amtrak, the national railroad passenger corpora-tion, under then-ceo George Warrington, realized that just explaining the reasons for delays, showing concern, and keeping passengers informed reduced many of the complaints that Amtrak received about service.55
Action Step 7: Put the Balanced Scorecard TogetherAll four traditional components of the balanced scorecard are now assembled (action steps 4–6). if the organization follows the norton and Kaplan strategic mapping article, which is consistent with the Baldrige criteria, there would be a strong align-ment between items from learning and develop-ment to internal process measures to financial and customer and stakeholder measures. this alignment strongly supports a high-performance organiza-tion. in both organizations studied, some alignment efforts occurred. Both used this hierarchical order-ing of items (or perspectives). As both organiza-tions continue to use and gain experience with the scorecard, we expect that the alignment between the four perspectives of the BSc will improve. they certainly seem to be moving toward greater align-ment. there are many examples of a mature align-ment development; one investment company has statistical relationships between what an incremen-tal improvement in a process measure would do to customer satisfaction levels.56 in a similar way, School District 15, in Palatine, illinois,57 a Baldrige winner, calculated the relationship between some of their processes and improvements on standardized test scores.
Focus on the Vital Few Goalsthe improvements that both DFAS and USPS have made using the balanced scorecard and their focus on performance measures have transformed them into fact-based, performance-focused organizations. it was clear in interviews with top leaders and busi-ness unit leaders that there is a focus on the elements of performance critical to the success of the organiza-
iBM center for the Business of Government5�
USinG the BALAnceD ScorecArD
tion. in our view, this focus is a direct result of using the BSc as a management tool. the focus is on actual measures and performance, rather than mere plati-tudes and guesses on what will happen and what one should do. the focus for government organiza-tions on customer and stakeholder satisfaction is an important means to redirect the organization to do those things that will matter for the longer-term success and survival of the organization.
it is critical, however, that organizations focus on the vital few goals. What we have seen in our experience is that many organizations create a huge number of metrics and goals to follow. this leads to confusion and, often, conflicting goals. the organization needs to decide what are the vital few items that they need to focus on and build the scorecard to meet those vital few. While the num-ber of goals that should be articulated depends on many things, both organizations in this study seem to have a manageable number. of the two organi-zations, DFAS has fewer metrics that seem to be related to the type of operations. USPS has more metrics, reflecting their varied product line and the expectations of its different customer base. For a new adopter of the scorecard or a seasoned user, there often is a push to add more metrics and mea-sures to reflect everyone’s specific areas of expertise. however, many of these special issues might be accommodated better at the unit scorecard level as part of a unit or personal development plan. this should occur as the scorecard is deployed to differ-ent groups in the organization.
What is the ‘right’ number of goals? We agree with other experts who recommend that the organization should strive for no more than 15 total scorecard measures, and 10 would be better. According to the hackett Group survey, companies report that an average of 1�3 measures are reported to senior management on a monthly basis—nearly nine times the number of measures in most effective score-cards.58 the goal is to focus behaviors on key and critical performance goals; too many measures lead people to focus on their preferred goals and not the key needs of the organization.
Outcome goals are desired over activity goals. When goals are selected, they should focus on those items that lead to performance results. For example, the number of hours in training is an activity goal.
Just being in training does not lead to performance improvements. on the other hand, measuring the skills acquired in the training program and if they are used on the job are outcome goals. outcome goals focus on assisting people directly to reach the goals of the organization as reflected in the bal-anced scorecard. if measures do not directly support an organizational goal, the question becomes why they are being used.
Develop a Team to Champion the Scorecardteams have become a popular concept in organiza-tions. What should be their makeup? the team should not consist of executives only, but should draw from a broad base of support. it should represent all areas of the organization that will use the scorecard. Both DFAS and USPS drew on a broad base of people and got them involved in the process. they used the catch Ball process to obtain input into processes and goals, and area and measurement champions to involve more people. these area and measure-ment champions were drawn from lower levels in the organization and paved the way for the successful deployment of the scorecard. DFAS also had a host of different teams to support their approach. these approaches resulted in more ideas and input into the process, increased ownership, and greater accep-tance of the BSc program as it was deployed. the teams helped the organization to accept and adapt the approach more quickly than it would have with-out the degree of input and ownership.
Put in Place a Management Governance Structure at the Topthis is needed to guard against a change in lead-ership style at the top. A leader who emphasizes vision, communication, involvement, and employee innovation and initiative fosters a performance-focused culture in the organization. if someone who manages in a command-and-control style replaces such a leader, the positive effects of scorecard development could disappear. Some of the key management positions and the roles they play in the scorecard development include:59
• Director of strategic planning—clarifying and translating vision and strategy
• chief financial officer—planning and target setting

www.businessofgovernment.org 53
USinG the BALAnceD ScorecArD
• Director of human resources—communicating and learning
• chief information officer—strategic feedback and learning
Many organizations find it difficult to make one of these executives solely responsible for the operation of the total system. of course, the chief executive officer or director is the ultimate owner. however, what is needed is an executive team that is filled with members who encourage innovation and are willing to experiment so that learning and growth are enhanced during the journey of continuous per-formance improvement. in addition, there needs to be a link established between improved performance and individual or group rewards, whether intrinsic or extrinsic. in interviews with the key leadership at DFAS and USPS, it was clear that both leadership teams shared these qualities and concerns.
Use Reinforcement Systems to Support the BSC ApproachBoth organizations provided significant reinforce-ment so managers would focus on performance and had significant performance improvements as a result. the well-documented and quantified USPS system might seem a bit cumbersome, yet it was needed in order to cover the diversity of operations and tasks within the organization. Measurement standardization was needed to build employee trust in the system. Weighting of results addressed the issue of fairness and the need to reflect the different contributions made by different operations to over-all organization success. the system seems to be accepted and trusted by those we interviewed and is a model of a reward system that is linked to con-tinuous performance improvement.
however, both organizations indicated some frustra-tion with not being able to include all employees. DFAS referred to this situation as a thermal layer below which there was difficulty in getting people motivated, especially at lower organization levels. USPS also referred to their problem with going beyond the management units to the bargaining units. these present real deployment issues and ones that each organization is continuing to resolve. Some of that will evolve as the BSc approach is deployed through individual performance plans in which a significant part of an individual’s perfor-
mance is tied to reaching his or her individual per-formance objectives that relate directly to attaining unit and organization goals. While reinforcement approaches may not be fully applied because of the current limits of collectively bargained agree-ments, objective measures of performance still can be used to guide individual performance and support improved unit performance. Linking the organization’s balanced scorecard to unit and personal performance plans is a key factor in the deployment process.
Action Step 8: Develop Action Plansthe balanced scorecard is not a freestanding management tool. if all the organization has is the strategy followed by the balanced scorecard, then it is not doing an effective job in deploying the scorecard throughout the organization. Proper deployment is essential to get the best use of the scorecard and is essential in any performance man-agement system. in the Baldrige criteria, deployment is a central part of the whole Baldrige process and, more specifically, is related to the strategic planning process in category �.�, strategy deployment.60
Deployment takes two major forms. in one respect, it relates to how well goals are translated from higher organizational levels down to the unit level and ultimately to individual personal performance plans. Secondly, it relates more to the extent of the translation of these goals. the basic deploy-ment issue is how well all the applicable goals are translated to the relevant parts of the organization. For example, USPS did not translate all goals to all employees in the organization. Some of the goals simply did not relate to the employee’s performance effort. however, there was good linkage between individual performance goals and the goals of the unit, which then were aligned to the goals of the organization.
the difference between alignment and deployment relates to scope. Deployment relates to connect-ing individuals to the organization plan. Alignment relates to how well the goals of the individual or unit are aligned to meeting the organizational goals. in both cases, DFAS and USPS took great pains to ensure that there was good deployment and align-ment of goals to all levels of the organization. however, both organizations had difficulty getting performance improvement at all levels of the orga-

iBM center for the Business of Government54
USinG the BALAnceD ScorecArD
nization. in our analysis, this was due to the rein-forcement system rather than a lack of articulation or deployment of goals. in both organizations, there were artificial barriers that created some difficul-ties with providing pay for performance. in USPS, it related to the bargained agreement between USPS and the unions. With DFAS, it related to work rules. research has repeatedly demonstrated that goal setting with pay that is linked to performance can enhance performance outcomes.61
the nature of these deployment goals should be dif-ferent from simply using the same outcome goals of the organization. the unit or individual performance goals should be more closely related to upstream or in-process measures that provide a meaningful early indicator of those performances and lead to reaching the organizational goals. the term upstream relates to outcome measures that are leading indicators of the desired outcome measures. In-process measures relate to those measures that are one part of the defined process. they are early indicators of the qual-ity or timeliness of the total process performance. For example, assessing that a hamburger is cooked properly immediately at the end of the cooking stage helps to ensure a quality end product that will not make someone ill. taking this measure at the end of the cooking stage saves resources (by less wasted condiments and buns) than if the measurement is not taken until the end of the entire process.
For example, tracking sort times, the quantity of mail that missed the day’s delivery cutoff times, or the number of trucks delayed all support the larger goal of having the mail delivered in the desired time. By focusing and even making statistical com-parisons on what factor is related to better outcome performance, organizations can better align their actions through focusing on in-process or upstream measures.
Key groups involved: Deployment is a central part of making the scorecard effective. Without deployment, it is like a ship without a rudder. the captain may have plans on where the ship should go, but does not have the tools to make it happen. Deployment using upstream or in-process measures ensures more consistent actions aligned with the desired goals of the organization. Some organiza-tions fall short of complete deployment by failing to involve the teams and/or individuals who actually
make the needed changes or improvements. this requires the involvement of key functional work-group leaders and cross-functional teams at every level of the organization. in both organizations, we saw signs of the development of this effective deployment approach.
Action Step 9: Actively Work to Manage and Continually Develop the Scorecardonce the scorecard is in place, the mission still is not accomplished. there needs to be concerted action to ensure that the scorecard continues to be an effective leadership development tool. this is done through several different actions that consis-tently support the scorecard and help to improve its role in creating a performance-centered culture. the following action steps provide some specific direction upon which organizational leaders need to focus their efforts.
the management governance structure put in place should ensure that timely communication and feedback occur throughout the organization. this requires that committees and task forces be formed and their roles defined. DFAS did this by establishing a Strategic Planning Steering Group, or SPSG, made up of senior executives from busi-ness lines and support functions that reported to the Leadership council. then, a Balanced Scorecard Working, or BSW, group was established to develop definitions, monitor implementation, and review data integrity. the BSW group was cross-function-ally represented and reported to the SPSG. Measure experts were appointed to ensure consistent applica-tion across the organization. there were monthly meetings held to track and compare short-term performance against the annual targets established in the budgeting and strategy process. Quarterly reviews examined linkages to the longer-term score-card measures.
Because organizations face different challenges, for the BSc to be effective it should reflect the strategic vision of the senior leadership group, not merely be copied or borrowed by emulating the best measures of the best organizations. At the other extreme, it also is detrimental to attempt perfection in score-cards. the balanced scorecard should be dynamic; it should be continually reviewed, assessed, and
www.businessofgovernment.org 55
USinG the BALAnceD ScorecArD
updated to meet the new conditions and challenges that arise. For these reasons, the scorecard (and the leadership behind it) should be flexible, adaptive, and innovative.
traditional measures are often lagging, i.e., they report how well an organization’s strategy worked in the past. this is good for keeping score but not for communicating to employees what they need to do well to affect future performance. it is important, therefore, to develop a balanced set of measures, both outcome and performance drivers, lagging and leading indicators, which are linked to achieving long-run performance. this is done in the scorecard through the deployment and alignment process, which always needs to be tested. Units may want to have their own “pet” measures to be included. Some units may relate to reaching organizational goals while others may be fairly distant or may empha-size an activity goal that is not effective. overall, the scorecard team needs to manage the number of measures used at the organization, unit, and individ-ual level. Focus on the vital few goals that direct key areas of performance rather than many insignificant ones that confuse and reduce organizational focus. this may not be easy, but is essential to support an effective scorecard approach.
Develop a Strategic Feedback System That Is Designed to Test, Validate, and Modify the Hypotheses Embedded in Strategies the cause-effect relationships embodied in BSc allow executives to establish their best estimate concerning the impact that changes in performance drivers might have on changes in one or more outcome measures. there are always some areas in an organization where linkages between the performance drivers and outcome measures are more difficult to determine. Support service areas like human resources and engineering are examples. often activity measures are used initially. For example, DFAS used employee developmental activity (hours of training) as a start-ing measure for Growth and Learning. however, now they are attempting to link the length of time it will take for a specific employee to reach competency level in the trained attribute.
there are a number of documented approaches that can be used to determine cause-effect relation-ships within the scorecard. they include correlation analysis, scenario analysis, anecdotal reporting, ini-
tiative review, and external peer review. All of these mechanisms enable an organization to review and think about its strategic direction on a regular basis. By this step, some of these mechanisms should be embedded into the review process. For example, DFAS uses initiative review to establish account-ability, to ensure against conflict targets or measures, and to help in developing a stronger action plan.
Use the Scorecard as a Management Tool, Not as a Performance Evaluation Approach if used properly, the BSc becomes a valuable tool that organizations can use to improve organizational performance. But like many effective manage-ment tools (Management By objectives programs, total Quality Management, and even the Baldrige process), it can easily be misapplied by a well-intentioned management group. Using the BSc as a performance evaluation approach will dilute its value as a management tool. As a tool, the focus is on how management and employees can work together to improve the numbers. if the scorecard is used only as a performance evaluation device, the ground rules change. Subordinates begin to look for ways to dilute the scorecard, performance targets, and scope of outcomes so that the unit has “better numbers.” these latter activities take away from the essential mutual problem solving that should occur. We strongly advocate that the scorecard be used as a management tool and that performance rein-forcements be based on performance improvements rather than “reaching or not reaching” goals or the number of “reds, yellows, and greens.”6�
Actively Work to Sustain the Culturethe scorecard is only part of the process of building a performance-focused culture in the organization, albeit an important part. At the heart of any major program to improve performance in organizations is the fact that it is likely to require a change in culture to drive the needed organizational improve-ments. Quality management expert Joseph Juran observed that all organizations, like individuals, possess immune systems. on the positive side, this “immune system” resists foreign ideas that might be harmful, but it also has the undesired effect of resist-ing and rejecting beneficial changes.63 the requisites detailed below help to overcome this resistance to change. they are certainly applicable in facilitat-ing the integration of a balanced scorecard into an organization’s management practices.

iBM center for the Business of Government56
USinG the BALAnceD ScorecArD
Maintain Top Management Commitment employees are inundated with a variety of new man-agement tools and concepts. thus, they quickly learn that the best strategy is to give lip service, because it is usually just a matter of time until management declares victory and moves on to the next fad. W. edward Deming recognized this in the very first of his 14 points: “create constancy of purpose.”64 Senior management demonstrates its commitment to the desired change not only by its words but also by its deeds. it takes every opportunity to promote the desired change by stressing its relevance to future success, the possibilities that the change creates, how the change will be accomplished, and each per-son’s role in creating that change. Management deals with failures in a constructive and nurturing way, without reverting to blame, and celebrates individual and team successes. At both DFAS and USPS, senior management was involved intimately in the creation and implementation of their balanced scorecards. For example, at DFAS, senior managers, through the Leadership council and the Strategic Planning Steering Group, played significant leadership roles in the design and development of its BSc. From the time DFAS Director Bloom initiated the process and tasked senior management to develop the BSc quickly (it was completed within six months), he was kept informed of progress on a continuous basis.
Establish Organizational Support Systems to be adequately prepared for change, organiza-tions require certain support systems to be in place. training is one aspect, but training is not the only support needed to foster the balanced scorecard. other elements include the provision of required support staffs that can facilitate and provide expert advice. Selection of these people should not be based on who is available, but on a carefully designed set of requirements that are right for the organization and its prevailing culture. these staff can be employees or outside consultants who are willing to commit sufficient time and energy.
For a change initiative like the balanced scorecard to work, it must be seamlessly integrated into an organization’s ongoing management systems. this occurs in several ways. For instance, over time many organizations integrate their scorecard into all of their other planning and management systems. if the BSc represents strategically important issues to the organization, then it should provide the justification
for most resource allocation and capital investment decisions, including each business unit’s annual budget. At the individual level, it should be linked to each employee’s performance assessment and plan. the balanced scorecard should never say to do one thing while a different management system pro-duces an opposing signal.
Foster Communication and Ownership the process of communicating with others in the development of the BSc, rather than the “story” of its adaptation, often is of most value to the organization. employees have the opportunity to participate with senior managers in a structured process that helps both sides gain a better understanding of the link between the organization’s strategy and what has to happen for that strategy to be executed successfully.
one potential complication in the deployment of scorecards is the conflict between organizing by function or by process. Most strategic BSc mea-sures relate to overall organization processes that are cross-functional in nature. changes that might adversely affect one function involved in the process may be resisted even though they are in the best interest of the overall organization. Both organiza-tions we studied wrestled with this difficulty. At first, DFAS gave senior executives dual roles (functional business line responsibilities and specific client responsibilities). this proved to be a mistake, and sepa-rate client executive roles were finally developed. At USPS, regional units were traditionally held account-able only for their territorial performance. now they are being held accountable for how they affect the entire process of mail delivery across the country.
Conclusionin the end, the balanced scorecard is a management tool that helps executives solve their most central issue: how to implement strategy, particularly when it requires radical change. it does this by giving organizations, often for the first time, a clear picture of the future and a path for getting there. in the two cases that have been reviewed in this report, DFAS and USPS, we have seen some dramatic improve-ments in their performance resulting from the use of the balanced scorecard and the organizational culture of performance and fact-based improvement that are part of the process. We saw a dedicated staff championing the approach and committed
www.businessofgovernment.org 57
USinG the BALAnceD ScorecArD
to the performance excellence that occurs when performance goals are articulated, deployed, and reinforced in a manner that leads to sustainable improvements in the organization. it takes a focused leadership approach to make this happen, and this focus must continue to maintain and improve on the quality results achieved so far. the balanced score-card is not a magic pill, but an approach that can lead to a sustained culture of quality.

iBM center for the Business of Government58
USinG the BALAnceD ScorecArD
Endnotes
1. David norton and robert Kaplan (199�). “the Balanced Scorecard: Measures that Drive Performance.” Harvard Business Review, January-February, pp. 71–79. �. other groups have provided support as well, for example: the Balanced Scorecard institute, the Balanced Scorecard collaborative, and the Advanced Learning institute, which had scorecard training sessions. 3. robert Kaplan and David norton (1996). “Using the Balanced Scorecard as a Strategic Management System,” Harvard Business Review, January-February, p. 76. 4. ibid., p. 77. 5. robert S. Kaplan and David P. norton (�000). “having trouble with your Strategy? then Map it,” Harvard Business Review, September-october, pp. 167–176. 6. Dilanthi Amaratunga and David Baldry (�001). Work Study 50, no. 4/5, pp. 179–180. 7. catherine Kay Brancato (1995). new Corporate Performance Measures, conference Board report #r-1118, July. 8. Dilanthi Amaratunga, David Baldry, and Marjan Sarshar (�001). “Process improvement through Performance Measurement: the Balanced Scorecard Methodology.” Work Study 50, no. 4/5, pp. 179–188. 9. the chief Financial officers Act. http:// irm.cit.nih.gov/itmra/cfoact.html. 10. DFAS press release (1991). http://www.dod.mil/dfas/news/releases/�001/01_10.pdf. 11. the Government Management reform Act. www.casu.gov/library/reference/gmra/gmra.html. 1�. Federal Financial Management reform Act. www.whitehouse.gov/omb/financial/ffs_ffmia,html. 13. DFAS press release (1991). http://www.dod.mil/dfas/news/releases/�001/01_10.pdf. 14. Business executives for national Security. Archived report—September 11, 1997. www.bens.org/upd03.html. President’s Management Agenda report. Fy�00�. Particularly pp. 7, 13, 17. www.whitehouse.gov/omb/budget/fy�00�/mgmt.pdf.
15. DFAS Annual report �004, p. 16. www.dod.mil/dfas/about/ar_index.htm. 16. robert S. Kaplan and David norton (1996). The Balanced Scorecard, Boston: harvard Business School Press. 17. the color reference refers to the use of green dots for goals that have been achieved, yellow for goals that are nearly met, and red when performance is not at desired levels. 18. Press release from Balanced Scorecard collaborative. September ��, �005. http://www.prnewswire.com/cgi-bin/stories.pl?Acct=104&Story=/www/story/ 09-��-�005/0004113435&eDAte=. 19. Postal reorganization Act of 1970 (title 39, U.S. code, August 1�, 1970, U.S.c. 101 (a, d). �0. Seizing opportunity—the report of the �001 Mailing industry task Force, october 15, �001. �1. embracing the Future: Making the tough choices to Preserve Universal Mail Service, the report of the President’s commission on the United States Postal Service, July �1, �003. ��. title 39, U.S. code, Sec. �01. �3. Outline for Discussion: Concepts for Postal Transformation, USPS �001, Section �, p. 4. �4. commission on Postal Service, 1977. �5. national Academy of Public Administration, 1983. �6. eric yoder (1998). time for a change, Govexec.com, May 1, 1998. �7. charles nicodemus (1994). “the chicago Post office Scandal,” Washington Monthly, July-August. �8. Michael Lilly (�005). “Simply Marvelous,” www.usps.com/history/plfe/p103331698/marv.htm. �9. current criteria can be found at www.quality.nist.gov. 30. Government Performance and results Act, 1993. 31. report of the United States Postal Service commission on a Safe and Secure Workplace, August �000 (califano commission). 3�. A detailed review of this process is included in the USPS Five-year Strategic Plan, available at usps.com.
www.businessofgovernment.org 59
USinG the BALAnceD ScorecArD
33. robert S. Kaplan and David P. norton (�000). “having trouble with your Strategy? then Map it,” Harvard Business Review, September-october, pp. 167–176. 34. Detailed information on the measurement systems used is available in the Five-year Strategic Plan on the USPS website, usps.com. 35. Performance measure for “improve service” in table � actually represents six different categories of mail, each of which has separate improvement targets. 36. this assessment does not apply to bargaining-unit or craft employees. Associations representing postmasters and supervisors are involved in the crafting of the goals. 37. overall performance ratings for the unit are based on the weighted total of all relevant indicators, making it possible to achieve higher ratings through a wide variety of approaches appropriate to local conditions. 38. this process replaced traditional civil service time-in-grade or annual step increases. 39. the PceS category of employees includes the senior executives and senior managers of the Postal Service. PceS executives are equivalent to Senior executive Service (SeS) employees in the federal government. 40. these include everyone except the bargaining unit. eAS categories of employees are comparable to GS classification in the federal government. 41. Jonathan hickman, christine chen, et al. (�004). “the List,” Fortune 149(13) p. 140. 4�. Lisa B. Bingham (�003). “Mediation at Work: transforming Workplace conflict at the United States Postal Service,” Washington, D.c.: iBM center for the Business of Government. 43. this is calculated as total number of illnesses and injuries, divided by the number of hours worked by all employees, multiplied by �00,000. Source: �004 comprehensive Statement on Postal operations, p. 80. 44. �004 comprehensive Statement on Postal operations, p. 80. 45. United States Postal Service �004 Annual report, p. �3. 46. �004 comprehensive Statement on Postal operations, p. 63. 47. �004 comprehensive Statement of Postal operations, p. 39. 48. American Society for Quality (�005). �004 transportation/communications/Utilities and Service industry report; and AcSi, the American customer Satisfaction index at ten years. Milwaukee: American Society for Quality. 49. robert S. Kaplan and David P. norton (�000). “having trouble with your Strategy? then Map it,” Harvard Business Review, September-october, pp. 167–176.
50. Mark Blazey (�004). Insight to Performance Excellence: An Inside Look at the 2004 Baldrige Award Critera. Milwaukee: ASQ Quality Press, pp. �4–36. 51. �005 Baldrige criteria, particularly category 3. category 3.1 focuses on determining customer segments and key customer requirements, and category 3.� focuses on measuring customer satisfaction and dissatisfaction. We refer to the Baldrige criteria often in anticipation that niSt will obtain funding for a government sector award for quality operations and because the Baldrige criteria are considered comprehensive criteria for performance quality. 5�. Paul niven (�003). Balanced Scorecard Step-by-Step for Government and Nonprofit Agencies, John Wiley & Sons. 53. Kenneth r. thompson (�001). “A conversation with Mark Susors: Leadership in the Largest UPS Distribution Facility in the World,” Journal of Leadership Studies, 8(�0), 145–159. 54. robert S. Kaplan and David P. norton (�000). “having trouble with your Strategy? then Map it,” Harvard Business Review, September-october, pp. 167–176. 55. Kenneth r. thompson (�00�). “A conversation with George Warrington: Leadership at Amtrak,” Organizational Dynamics, 31(1): 85–98. 56. one of the clients of one of the authors of this report. 57. John G. conyers and robert ewy (�004). Charting Your Course: Lessons Learned During the Journey Toward Performance Excellence. Milwaukee: ASQ Quality Press. 58. www.thehackettGroup.com (�004). “Most executives are Unable to take Balanced Scorecards from concept to reality,” 5, october ��. 59. robert Kaplan and David norton (1996). The Balanced Scorecard: Translating Strategy into Action. harvard Business School Publishing, chapter 1�. 60. �005 Baldrige criteria for Performance excellence, see category �.� along with scoring, and core values. this relates to the business, education, and health care criteria. 61. B. Gerhart, h. B. Minkoff, and r. n. olson, (1995). “employee compensation: theory, Practice, and evidence,” in G. r. Ferris, S. D. rosen, and D. t. Barnum (eds.) Handbook of Human Resource Management, cambridge, MA: Blackwell. 6�. the color reference relates to the use of green dots on goals that have been reached, yellow where the goal is nearly met, and red where performance is off the desired levels. 63. Joseph Juran (1964). Managerial Breakthrough, Southbury, ct: Juran institute. 64. W. edward Deming (1986). Out of the Crisis, Boston: Mit Press.

iBM center for the Business of Government60
USinG the BALAnceD ScorecArD
A B o U t t h e A U t h o r
Nicholas J. Mathys is Professor and the former chair of the Department of Management at DePaul University, where he has been on staff since 1978. his current research interests include applying the balanced scorecard in strategic management, developing performance-based management systems, especially in high-performance organizations, and management development approaches.
Professor Mathys has published in several journals—including the Academy of Management Executive, Organizational Dynamics, the Journal of Leadership and Organizational Studies, and Human Resource Planning—in the areas of total Quality Management, human resources, and goal setting. he also has co-authored four textbooks and several chapters dealing with management and human resource topics. he has served on the editorial board of Computers in Personnel and currently is a reviewer for the Journal of Leadership and Organizational Studies.
Mathys’ dissertation focused on the career paths of ceos of Fortune 500 companies. he continues to be interested in many issues related to career management as evidenced by two books he co-authored: Human Resource Planning and Career Management in Organizations.
Before becoming an academic, Mathys was a plant engineer for eaton Manufacturing and also worked in sales positions at several organizations. in addition, he has consulted with or given management development work-shops to a variety of organizations. A partial list includes Bethlehem Steel company, the electromotive Division of General Motors, commonwealth edison (now exelon corp.), the international Bank of Asia (hong Kong), integrated Project Management, inc. (a project management consulting organization), and Silver cross hospital.
Mathys has always been interested in improving the productivity of both for-profit and nonprofit organizations. For the past four years, he has served as an examiner evaluating organizations for the Lincoln Quality Award. the Lincoln Award is the State of illinois’ highest quality award and uses Baldrige methodology, which provides a performance-based, fact-based management approach to for-profit, nonprofit, and government organizations.
his active interest in the international arena has led him to visit many countries in europe and Asia since 1990, and he is a major contributor to DePaul University’s international M.B.A. programs in hong Kong, Prague, and Bahrain. While overseas, he has taught courses on strategic management of human resources and performance management, and has presented workshops to executives on topics such as high-performing organizations and employee motivation strategies.
Professor Mathys received his Ph.D. from Western colorado University in 1975.
A B o U t t h e A U t h o r S

www.businessofgovernment.org 61
USinG the BALAnceD ScorecArD
Kenneth R. Thompson is Professor and the former chair of the Department of Management for seven years at DePaul University, where he has been on staff since 1986. his current research interests include application of total Quality Management approaches to service and academic institutions, self-efficacy, and goal setting.
Professor thompson has published in several journals, including the Academy of Management Executive, Organizational Dynamics, and the Journal of Social Psychology, in the areas of organizational behavior, total Quality Management, self-efficacy, and goal setting. he has co-authored four textbooks and four invited chapters.
thompson has been elected to the offices of president and chairman of the Board of Directors of the Midwest Division of the national Academy of Management. he was also on the governance board of the organizational Behavior Division of the national Academy of Management. he is on the editorial review board of four professional journals and is the associate editor for the Journal of Leadership and Organizational Studies.
For the past nine years, thompson has been a senior lead examiner evaluating organizations for the Lincoln Quality Award. the Lincoln Award is the State of illinois’ highest quality award. in addition, he has been a Baldrige examiner for the past two years. the Baldrige Award is the top award in the United States for quality given to businesses and education and healthcare organizations. he has lobbied to obtain passage of the bill that would expand the Baldrige Award process to public sector organizations and non-profits. in �004, that bill was passed and funding was approved in �005.
From 1984 to 1986, thompson was the director of the center for Management and executive Development for the University of Arkansas and was a major developer of the Walton institute of Leadership. in that role, he worked directly with Sam Walton and other Wal-Mart executives in developing training programs for store managers and assistant managers at Wal-Mart. in 1994, he completed a six-month internship in curricular design at the Galvin center at Motorola. Before that time, he was at notre Dame as an assistant professor of management. At that time, he consulted for General Motors in setting performance objectives in the Parts Division.
Professor thompson received his Ph.D. from the University of nebraska in 1977.
iBM center for the Business of Government6�
USinG the BALAnceD ScorecArD
K e y c o n t A c t i n F o r M A t i o n
To contact the authors:
Dr. Nicholas J. Mathys Kellstadt Graduate School of Business DePaul University one east Jackson Blvd. chicago, iL 60604 (31�) 36�-8364
e-mail: [email protected]
Dr. Kenneth R. Thompson Kellstadt Graduate School of Business DePaul University one east Jackson Blvd. chicago, iL 60604 (31�) 36�-5�11
e-mail: [email protected]
to download or order a copy of a report, visit the iBM center for the Business of Government website at: www.businessofgovernment.org 63
CENTER REPORTS AVAILABLE
COMPETITION AND CHOICE
Determining a Level Playing Field for Public-Private Competition (1999)Lawrence L. Martin
Implementing State Contracts for Social Services: An Assessment of the Kansas experience (�000)Jocelyn M. Johnston and Barbara S. romzek
A Vision of the Government as a World-Class Buyer: Major Procurement issues for the coming Decade (�00�)Jacques S. Gansler
Contracting for the 21st Century: A Partnership Model (�00�)Wendell c. Lawther
Franchise Funds in the Federal Government: ending the Monopoly in Service Provision (�00�)John J. callahan
Making Performance-Based Contracting Perform: What the Federal Government can Learn from State and Local Governments (�00�, �nd ed.)Lawrence L. Martin
Moving to Public-Private Partnerships: Learning from experience around the World (�003)trefor P. Williams
IT Outsourcing: A Primer for Public Managers (�003)yu-che chen and James Perry
The Procurement Partnership Model: Moving to a team-Based Approach (�003) Kathryn G. Denhardt
Moving Toward Market-Based Government: the changing role of Government as the Provider (�004, �nd ed.)Jacques S. Gansler
Transborder Service Systems: Pathways for innovation or threats to Accountability? (�004)Alasdair roberts
Competitive Sourcing: What happens to Federal employees? (�004)Jacques S. Gansler and William Lucyshyn
Implementing Alternative Sourcing Strategies: Four case Studies (�004)edited by Jacques S. Gansler and William Lucyshyn
Designing Competitive Bidding for Medicare (�004)John cawley and Andrew B. Whitford
International Experience Using Outsourcing, Public-Private Partnerships, and Vouchers (�005) Jón r. Blöndal
E-GOVERNMENT
Supercharging the Employment Agency: An investigation of the Use of information and communication technology to improve the Service of State employment Agencies (�000)Anthony M. townsend
Assessing a State’s Readiness for Global Electronic Commerce: Lessons from the ohio experience (�001) J. Pari Sabety and Steven i. Gordon
Privacy Strategies for Electronic Government (�001) Janine S. hiller and France Bélanger
Commerce Comes to Government on the Desktop: e-commerce Applications in the Public Sector (�001)Genie n. L. Stowers
The Use of the Internet in Government Service Delivery (�001)Steven cohen and William eimicke
State Web Portals: Delivering and Financing e-Service (�00�)Diana Burley Gant, Jon P. Gant, and craig L. Johnson
Internet Voting: Bringing elections to the Desktop (�00�)robert S. Done
Leveraging Technology in the Service of Diplomacy: innovation in the Department of State (�00�)Barry Fulton
Federal Intranet Work Sites: An interim Assessment (�00�)Julianne G. Mahler and Priscilla M. regan
The State of Federal Websites: the Pursuit of excellence (�00�)Genie n. L. Stowers
State Government E-Procurement in the Information Age: issues, Practices, and trends (�00�)M. Jae Moon
Preparing for Wireless and Mobile Technologies in Government (�00�) Ai-Mei chang and P. K. Kannan
Public-Sector Information Security: A call to Action for Public-Sector cios (�00�, �nd ed.)Don heiman
The Auction Model: how the Public Sector can Leverage the Power of e-commerce through Dynamic Pricing (�00�, �nd ed.)David c. Wyld
The Promise of E-Learning in Africa: the Potential for Public-Private Partnerships (�003)norman Larocque and Michael Latham
Digitally Integrating the Government Supply Chain: e-Procurement, e-Finance, and e-Logistics (�003)Jacques S. Gansler, William Lucyshyn, and Kimberly M. ross
Using Technology to Increase Citizen Participation in Government: the Use of Models and Simulation (�003)John o’Looney
Seaport: charting a new course for Professional Services Acquisition for America’s navy (�003)David c. Wyld
E-Reporting: Strengthening Democratic Accountability (�004)Mordecai Lee

CENTER REPORTS AVAILABLE
to download or order a copy of a report, visit the iBM center for the Business of Government website at: www.businessofgovernment.org64
Understanding Electronic Signatures: the Key to e-Government (�004)Stephen h. holden
Measuring the Performance of E-Government (�004)Genie n. L. Stowers
Restoring Trust in Government: the Potential of Digital citizen Participation (�004)Marc holzer, James Melitski, Seung-yong rho, and richard Schwester
From E-Government to M-Government? emerging Practices in the Use of Mobile technology by State Governments (�004)M. Jae Moon
Government Garage Sales: online Auctions as tools for Asset Management (�004)David c. Wyld
Innovation in E-Procurement: the italian experience (�004)Mita Marra
Computerisation and E-Government in Social Security: A comparative international Study (�005)Michael Adler and Paul henman
The Next Big Election Challenge: Developing electronic Data transaction Standards for election Administration (�005)r. Michael Alvarez and thad e. hall
RFID: the right Frequency for Government (�005)David c. Wyld
FINANCIAL MANAGEMENT
Credit Scoring and Loan Scoring: tools for improved Management of Federal credit Programs (1999)thomas h. Stanton
Using Activity-Based Costing to Manage More Effectively (�000)Michael h. Granof, David e. Platt, and igor Vaysman
Audited Financial Statements: Getting and Sustaining “clean” opinions (�001)Douglas A. Brook
An Introduction to Financial Risk Management in Government (�001)richard J. Buttimer, Jr.
Understanding Federal Asset Management: An Agenda for reform (�003)thomas h. Stanton
Efficiency Counts: Developing the capacity to Manage costs at Air Force Materiel command (�003)Michael Barzelay and Fred thompson
Federal Credit Programs: Managing risk in the information Age (�005)thomas h. Stanton
Grants Management in the 21st Century: three innovative Policyresponses (�005) timothy J. conlan
Performance Budgeting: how nASA and SBA Link costs and Performance (�006) Lloyd A. Blanchard
HUMAN CAPITAL MANAGEMENT
Profiles in Excellence: conversations with the Best of America’s career executive Service (1999)Mark W. huddleston Reflections on Mobility: case Studies of Six Federal executives (�000) Michael D. Serlin
Managing Telecommuting in the Federal Government: An interim report (�000)Gina Vega and Louis Brennan
Using Virtual Teams to Manage Complex Projects: A case Study of the radioactive Waste Management Project (�000)Samuel M. DeMarie
A Learning-Based Approach to Leading Change (�000)Barry Sugarman
Labor-Management Partnerships: A new Approach to collaborative Management (�001) Barry rubin and richard rubin
Winning the Best and Brightest: increasing the Attraction of Public Service (�001)carol chetkovich
A Weapon in the War for Talent: Using Special Authorities to recruit crucial Personnel (�001)hal G. rainey
A Changing Workforce: Understanding Diversity Programs in the Federal Government (�001) Katherine c. naff and J. edward Kellough
Life after Civil Service Reform: the texas, Georgia, and Florida experiences (�00�)Jonathan Walters
The Defense Leadership and Management Program: taking career Development Seriously (�00�)Joseph A. Ferrara and Mark c. rom
The Influence of Organizational Commitment on Officer Retention: A 1�-year Study of U.S. Army officers (�00�) Stephanie c. Payne, Ann h. huffman, and trueman r. tremble, Jr.
Human Capital Reform: �1st century requirements for the United States Agency for international Development (�003)Anthony c. e. Quainton and Amanda M. Fulmer
Modernizing Human Resource Management in the Federal Government: the irS Model (�003) James r. thompson and hal G. rainey
Mediation at Work: transforming Workplace conflict at the United States Postal Service (�003)Lisa B. Bingham
Growing Leaders for Public Service (�004, �nd ed.)ray Blunt
Pay for Performance: A Guide for Federal Managers (�004)howard risher
The Blended Workforce: Maximizing Agility through nonstandard Work Arrangements (�005) James r. thompson and Sharon h. Mastracci
to download or order a copy of a report, visit the iBM center for the Business of Government website at: www.businessofgovernment.org 65
The Transformation of the Government Accountability Office: Using human capital to Drive change (�005)Jonathan Walters and charles thompson
INNOVATION
Managing Workfare: the case of the Work experience Program in the new york city Parks Department (1999)Steven cohen
New Tools for Improving Government Regulation: An Assessment of emissions trading and other Market-Based regulatory tools (1999)Gary c. Bryner
Religious Organizations, Anti-Poverty Relief, and Charitable Choice: A Feasibility Study of Faith-Based Welfare reform in Mississippi (1999)John P. Bartkowski and helen A. regis
Business Improvement Districts and Innovative Service Delivery (1999)Jerry Mitchell
An Assessment of Brownfield Redevelopment Policies: the Michigan experience (1999)richard c. hula
San Diego County’s Innovation Program: Using competition and a Whole Lot More to improve Public Services (�000) William B. eimicke
Innovation in the Administration of Public Airports (�000)Scott e. tarry
Entrepreneurial Government: Bureaucrats as Businesspeople (�000)Anne Laurent
Rethinking U.S. Environmental Protection Policy: Management challenges for a new Administration (�000)Dennis A. rondinelli
The Challenge of Innovating in Government (�001) Sandford Borins
Understanding Innovation: What inspires it? What Makes it Successful? (�001)Jonathan Walters
Government Management of Information Mega-Technology: Lessons from the internal revenue Service’s tax Systems Modernization (�00�)Barry Bozeman
Advancing High End Computing: Linking to national Goals (�003)Juan D. rogers and Barry Bozeman
MANAGING FOR PERFORMANCE AND RESULTS
Corporate Strategic Planning in Government: Lessons from the United States Air Force (�000)colin campbell
Using Evaluation to Support Performance Management: A Guide for Federal executives (�001) Kathryn newcomer and Mary Ann Scheirer
Managing for Outcomes: Milestone contracting in oklahoma (�001) Peter Frumkin
The Challenge of Developing Cross-Agency Measures: A case Study of the office of national Drug control Policy (�001)Patrick J. Murphy and John carnevale
The Potential of the Government Performance and Results Act as a Tool to Manage Third-Party Government (�001)David G. Frederickson
Using Performance Data for Accountability: the new york city Police Department’s compStat Model of Police Management (�001)Paul e. o’connell
Moving Toward More Capable Government: A Guide to organizational Design (�00�)thomas h. Stanton
The Baltimore CitiStat Program: Performance and Accountability (�003)Lenneal J. henderson
Strategies for Using State Information: Measuring and improving Program Performance (�003)Shelley h. Metzenbaum
Linking Performance and Budgeting: opportunities in the Federal Budget Process (�004, �nd ed.)Philip G. Joyce
How Federal Programs Use Outcome Information: opportunities for Federal Managers (�004, �nd ed.)harry P. hatry, elaine Morley, Shelli B. rossman, and Joseph S. Wholey
Performance Leadership: 11 Better Practices that can ratchet Up Performance (�004)robert D. Behn
Performance Management for Career Executives: A “Start Where you Are, Use What you have” Guide (�004, �nd ed.)chris Wye
Staying the Course: the Use of Performance Measurement in State Governments (�004)Julia Melkers and Katherine Willoughby
Moving from Outputs to Outcomes: Practical Advice from Governments Around the World (�006)Burt Perrin
Using the Balanced Scorecard: Lessons Learned from the U.S. Postal Service and the Defense Finance and Accounting Service (�006)nicholas J. Mathys and Kenneth r. thompson
NETWORKS AND PARTNERSHIPS
Leveraging Networks to Meet National Goals: FeMA and the Safe construction networks (�00�)William L. Waugh, Jr.
21st-Century Government and the Challenge of Homeland Defense (�00�)elaine c. Kamarck
Assessing Partnerships: new Forms of collaboration (�003)robert Klitgaard and Gregory F. treverton

CENTER REPORTS AVAILABLE
to download or order a copy of a report, visit the iBM center for the Business of Government website at: www.businessofgovernment.org66
Leveraging Networks: A Guide for Public Managers Working across organizations (�003)robert Agranoff
Extraordinary Results on National Goals: networks and Partnerships in the Bureau of Primary health care’s 100%/0 campaign (�003)John Scanlon
Public-Private Strategic Partnerships: the U.S. Postal Service-Federal express Alliance (�003)oded Shenkar
The Challenge of Coordinating “Big Science” (�003)W. henry Lambright
Communities of Practice: A new tool for Government Managers (�003)William M. Snyder and xavier de Souza Briggs
Collaboration and Performance Management in Network Settings: Lessons from three Watershed Governance efforts (�004)Mark t. imperial
The Quest to Become “One”: An Approach to internal collaboration (�005) russ Linden
Cooperation Between Social Security and Tax Agencies in Europe (�005) Bernhard Zaglmayer, Paul Schoukens, and Danny Pieters
Leveraging Collaborative Networks in Infrequent Emergency Situations (�005) Donald P. Moynihan
Public Deliberation: A Manager’s Guide to citizen engagement (�006)carolyn J. Lukensmeyer and Lars hasselblad torres
TRANSFORMATION
The Importance of Leadership: the role of School Principals (1999)Paul teske and Mark Schneider
Leadership for Change: case Studies in American Local Government (1999)robert B. Denhardt and Janet Vinzant Denhardt
Managing Decentralized Departments: the case of the U.S. Department of health and human Services (1999)Beryl A. radin
Transforming Government: the renewal and revitalization of the Federal emergency Management Agency (�000) r. Steven Daniels and carolyn L. clark-Daniels
Transforming Government: creating the new Defense Procurement System (�000)Kimberly A. harokopus
Trans-Atlantic Experiences in Health Reform: the United Kingdom’s national health Service and the United States Veterans health Administration (�000)Marilyn A. DeLuca
Transforming Government: the revitalization of the Veterans health Administration (�000)Gary J. young
The Challenge of Managing Across Boundaries: the case of the office of the Secretary in the U.S. Department of health and human Services (�000) Beryl A. radin
Creating a Culture of Innovation: 10 Lessons from America’s Best run city (�001) Janet Vinzant Denhardt and robert B. Denhardt
Transforming Government: Dan Goldin and the remaking of nASA (�001) W. henry Lambright
Managing Across Boundaries: A case Study of Dr. helene Gayle and the AiDS epidemic (�00�)norma M. riccucci
Managing “Big Science”: A case Study of the human Genome Project (�00�)W. henry Lambright
The Power of Frontline Workers in Transforming Government: the Upstate new york Veterans healthcare network (�003)timothy J. hoff
Making Public Sector Mergers Work: Lessons Learned (�003)Peter Frumkin
Efficiency Counts: Developing the capacity to Manage costs at Air Force Materiel command (�003)Michael Barzelay and Fred thompson
Managing the New Multipurpose, Multidiscipline University Research Centers: institutional innovation in the Academic community (�003)Barry Bozeman and P. craig Boardman
The Transformation of the Government Accountability Office: Using human capital to Drive change (�005)Jonathan Walters and charles thompson
Transforming the Intelligence Community: improving the collection and Management of information (�005) elaine c. Kamarck
Executive Response to Changing Fortune: Sean o’Keefe as nASA Administrator (�005) W. henry Lambright
Ramping Up Large, Non-Routine Projects: Lessons for Federal Managers from the Successful �000 census (�005) nancy A. Potok and William G. Barron, Jr.
The Next Government of the United States: challenges for Performance in the �1st century (�005) Donald F. Kettl
PRESIDENTIAL TRANSITION
Government Reorganization: Strategies and tools to Get it Done (�004)hannah Sistare
Performance Management for Political Executives: A “Start Where you Are, Use What you have” Guide (�004)chris Wye
to download or order a copy of a report, visit the iBM center for the Business of Government website at: www.businessofgovernment.org 67
Becoming an Effective Political Executive: 7 Lessons from experienced Appointees (�005, �nd ed.)Judith e. Michaels
Getting to Know You: rules of engagement for Political Appointees and career executives (�005)Joseph A. Ferrara and Lynn c. ross
SPECIAL REPORT
Enhancing Security Throughout the Supply Chain (�004)David J. closs and edmund F. McGarrell
Assessing the Impact of IT-Driven Education in K–12 Schools (�005)Ganesh D. Bhatt
Investing in Supply Chain Security: collateral Benefits (�005, �nd ed.)James B. rice, Jr., and Philip W. Spayd

* Available at bookstores, online booksellers, and from the publisher (www.rowmanlittlefield.com or 800-46�-64�0).68
BOOKS*
Collaboration: Using Networks and Partnerships (rowman & Littlefield Publishers, inc., �004)John M. Kamensky and thomas J. Burlin, editors
Competition, Choice, and Incentives in Government Programs (rowman & Littlefield Publishers, inc., �006)John M. Kamensky and Albert Morales, editors
E-Government 2001 (rowman & Littlefield Publishers, inc., �001)Mark A. Abramson and Grady e. Means, editors
E-Government 2003 (rowman & Littlefield Publishers, inc., �00�)Mark A. Abramson and therese L. Morin, editors
Human Capital 2002 (rowman & Littlefield Publishers, inc., �00�)Mark A. Abramson and nicole Willenz Gardner, editors
Human Capital 2004 (rowman & Littlefield Publishers, inc., �004)Jonathan D. Breul and nicole Willenz Gardner, editors
Innovation (rowman & Littlefield Publishers, inc., �00�)Mark A. Abramson and ian Littman, editors
Leaders (rowman & Littlefield Publishers, inc., �00�)Mark A. Abramson and Kevin M. Bacon, editors
Learning the Ropes: Insights for Political Appointees (rowman & Littlefield Publishers, inc., �005)Mark A. Abramson and Paul r. Lawrence, editors
Managing for Results 2002 (rowman & Littlefield Publishers, inc., �001)Mark A. Abramson and John M. Kamensky, editors
Managing for Results 2005 (rowman & Littlefield Publishers, inc., �004)John M. Kamensky and Albert Morales, editors
Memos to the President: Management Advice from the Nation’s Top Public Administrators (rowman & Littlefield Publishers, inc., �001)Mark A. Abramson, editor
New Ways of Doing Business (rowman & Littlefield Publishers, inc., �003)Mark A. Abramson and Ann M. Kieffaber, editors
The Procurement Revolution (rowman & Littlefield Publishers, inc., �003)Mark A. Abramson and roland S. harris iii, editors
Transforming Government Supply Chain Management (rowman & Littlefield Publishers, inc., �003)Jacques S. Gansler and robert e. Luby, Jr., editors
Transforming Organizations (rowman & Littlefield Publishers, inc., �001)Mark A. Abramson and Paul r. Lawrence, editors


About the IBM Center for The Business of GovernmentThrough research stipends and events, the IBM Center for The Business of Government stimulates research and facilitates discussion on new approaches to improving the effectiveness of government at the federal, state, local, and international levels.
The Center is one of the ways that IBM seeks to advance knowledge on how to improve public sector effectiveness. The IBM Center focuses on the future of the operation and management of the public sector.
About IBM Business Consulting ServicesWith consultants and professional staff in more than 160 countries globally, IBM Business Consulting Services is the world’s largest consulting services organization. IBM Business Consulting Services provides clients with business process and industry expertise, a deep understanding of technology solutions that address specific industry issues, and the ability to design, build and run those solutions in a way that delivers bottom-line business value. For more information visit www.ibm.com/bcs.
For additional information, contact:Mark A. AbramsonExecutive DirectorIBM Center for The Business of Government1301 K Street, NWFourth Floor, West TowerWashington, DC 20005(202) 515-4504, fax: (202) 515-4375
e-mail: [email protected]: www.businessofgovernment.org