balanced hmac designs - dot.state.tx.us
TRANSCRIPT
Balanced HMAC Designs
Dale Rand, P.E.
TxDOT Construction Division
Flexible Pavements Branch
IHEEP
Conference
San Antonio, Tx.
September 29, 2009

BackgroundStability and durability are arguably the two most important factors related to HMA performanceThe goal is to have a mix that is both resistant to rutting (stability) and resistant to cracking (durability)Over the past 10 years, rutting has diminished significantly due to the use of polymers and the Hamburg Wheel Test (HWT) Reflective cracking is arguably the most common distress associated with flexible pavements in Texas No state’s currently evaluate HMA mixtures for cracking resistance at the mixture design stageGenerally speaking “we test for rutting resistance with the HWT and hope for cracking resistance”

Background (continued)
The Overlay Tester appears to be a good predictor of reflective crackingThe overlay tester has revealed that most TxDOT mixes are relatively susceptible to crackingThere is a lot of potential for using the Overlay Tester to improve the way we design our mixesTxDOT is currently working with TTI on project 0-5123 to develop HMA mixes that are both stable (rut resistant) and durable (crack resistant)

Project 0-5123:Advanced overlay design system incorporating both rutting and
reflection cracking requirements
Feb. 27, 2006, Austin, TexasFujie Zhou, Tom Scullion, and Sheng Hu
Texas Transportation Institute

Lab testing:performance evaluation
Hamburg Wheel Tracking Device Overlay Tester

Loading Configuration
Sample - 6’’ length, 3’’ width, 1.5’’ height
Loading - Continuously triangular displacement, 5 sec loading & 5 sec unloading
Standard Test ConditionsOpening displacement - 0.025 in.Room temperature - 77 ± 3 F
Definition of failure93% Load Reduction Visible crack on surface
Fixed plate
0.08 in
Aluminum plates
150 mm (6 in)
Test Sample
Movable Plate
Ram direction
1.5 in
Displacement (in)
Time (sec)10 20
0.025


Statewide Evaluation of Good/Bad reflection cracking projects
Crack Stops
Latex Modified Asphalt Binder
US 84 Abilene (6 mo old)
Inplace RecyclingUS 175 Dallas
10 year old section

Field Validation Studies
1) Does the test rank materials correctly ?
2) What are acceptable criteria ?
Overlay Tester Results
0
200
400
600
800
HIPR C76-22 DAC5 + L D64-22 L CM64-22CR
reps
- fa
ilure
300
700
252
520

IH-10 Type C (PG76-22L), 4.4%AC
Hamburg Test@50C
00.5
11.5
22.5
33.5
0 5000 10000 15000 20000 25000
No. of Passes
Rut
Dep
th (m
m)
I-10
Properties Result Target
Cracking(overlay tester cycles to failure)
2 >200
Rutting(APA rutting after 8000 cycles)
2.6 mm <6mm
RuttingHamburg(Hamburg cycles to 0.5 inch rut)
>20K >20K
Rut resistance mix (4 in thick) placed on IH 10 in 2002 heavy traffic
Reflection cracking in 2004

Current Completion Dates
• Rutting testing Jan. 2004• Fatigue testing (100-mm) Mar. 2006• Fatigue testing (150-mm) Dec. 2007
Two FHWA ALFs with 12 Pavement Lanes Constructed in
the Summer and Fall of 2002

As-Built Pavement Lanes
CR-AZ----70-22
1
PG70-22Control
2
AirBlown
3
SBSLG
4
CR-TB
5
TP
6
PG70-22
+Fibers
7
PG70-22
8
SBS64-40
9
AirBlown
10
SBSLG
11
TP
12

Lane 1
CR-AZ
300,000
Lane 2
Control
100,000
Lane 3
Air Blown
100,000
Lane 4
SBS LG
300,000
Lane 5
CR-TB
100,000
Lane 6
TP
200,000

Percentage of Area Cracked vs. ALF Wheel Load Passes
0.0
20.0
40.0
60.0
80.0
100.0
120.0
0 50000 100000 150000 200000 250000 300000 350000
Number of ALF Passes
Perc
enta
ge o
f Are
a C
rack
ed, %
L2S3 (Control)L3S3 (Air Blown)L5S3 (CR-TB)L6S3 (Terpolymer)L4S3 (SBS LG)L1S2 (CR-AZ)
L4S3L6S3
L5S3
L2S3
L1S2
L3S3

OT vs. FHWA-ALF Fatigue Test Results
0.0
20.0
40.0
60.0
80.0
100.0
120.0
0 50000 100000 150000 200000 250000 300000 350000
Number of ALF Passes
Perc
enta
ge o
f Are
a C
rack
ed, %
L2S3 (Control)L3S3 (Air Blown)L5S3 (CR-TB)L6S3 (Terpolymer)L4S3 (SBS LG)L1S2 (CR-AZ)
18901120
890
60
Did not crack
80

Influence of Mix Type
0
200
400
600
800
1000
1200
1400
Num
ber o
f Cyc
les
Median 47 317 374 1200Count 417 76 39 58Minimum 1 3 24 83Maximum 1200 1200 1200 1200Average 172 507 548 978
Dense Graded Performance Designed
Stone-Matrix Asphalt RBL/CAM

Frequency DistributionDense-Graded Hot Mix Asphalt
0
30
60
90
120
150
180
210
0 40 80 120
160
200
240
280
320
360
400
440
480
520
560
600
640
680
720
760
800
840
880
920
960
1000
1040
1080
1120
1160
1200
Number of Cycles
Freq
uenc
y

Influence of Mix TypeDense-Graded Hot Mix Asphalt
0
100
200
300
400
500
600
700
Num
ber o
f Cyc
les
Median 13 10 61 78 438Count 15 108 119 162 13Minimum 2 1 2 2 43Maximum 98 1200 752 1200 1200Average 28 97 127 232 621
Type A Type B Type C Type D Type F

Frequency DistributionDense-Graded Type C
0
5
10
15
20
25
30
35
40
45
50
0 40 80 120
160
200
240
280
320
360
400
440
480
520
560
600
640
680
720
760
800
840
880
920
960
1000
1040
1080
1120
1160
1200
Number of Cycles
Freq
uenc
y
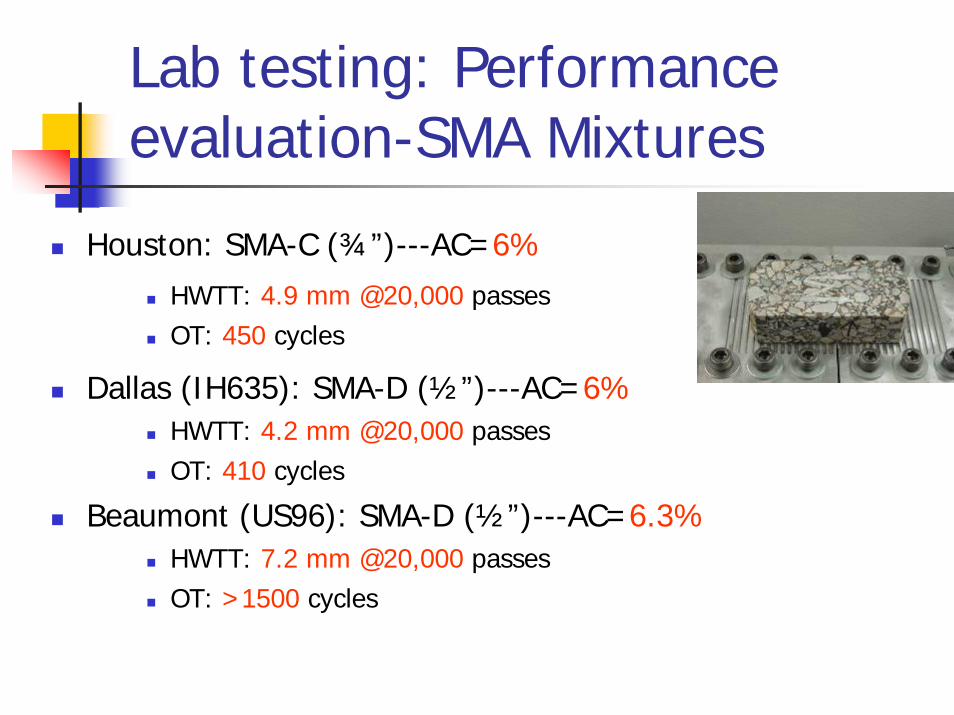
Lab testing: Performance evaluation-SMA Mixtures
Houston: SMA-C (¾”)---AC=6%HWTT: 4.9 mm @20,000 passesOT: 450 cycles
Dallas (IH635): SMA-D (½”)---AC=6%HWTT: 4.2 mm @20,000 passesOT: 410 cycles
Beaumont (US96): SMA-D (½”)---AC=6.3%HWTT: 7.2 mm @20,000 passesOT: >1500 cycles

Influence of Aggregate TypeAll mixtures
0
200
400
600
800
1000
1200
1400
Num
ber o
f Cyc
les
Median 53 90 262 271 344 1200Count 147 62 80 15 25 14Minimum 2 2 2 80 10 457Maximum 1200 1200 1200 1200 1200 1200Average 204 232 512 378 555 1030
Limestone Gravel Granite Rhyolite Sandstone Quartzite

Influence of Asphalt
0
100
200
300
400
500
600
Num
ber o
f Cyc
les
Median 84 96 55 80 344Count 119 156 69 172 21Minimum 2 1 2 2 14Maximum 1200 1200 1200 1200 1200Average 199 297 306 336 555
64-22 70-22 70-28 76-22 CRM
All mixtures
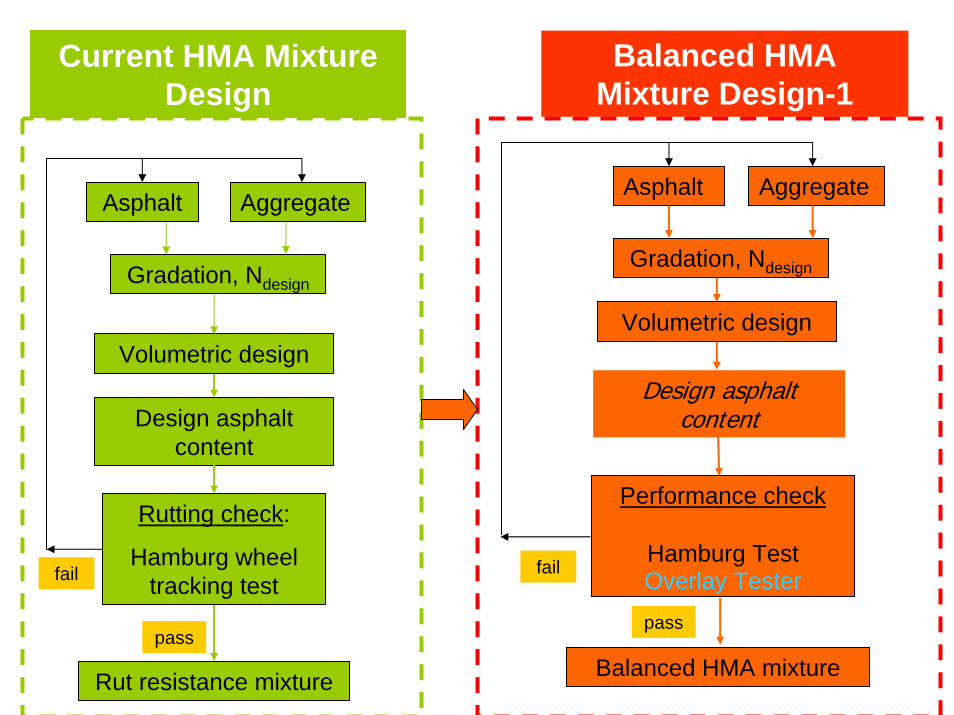
Asphalt Aggregate
Gradation, Ndesign
Volumetric design
Rutting check:
Hamburg wheel tracking test
Balanced HMA Mixture Design-1
Asphalt Aggregate
Gradation, Ndesign
Volumetric design
Performance check
Hamburg TestOverlay Tester
Design asphalt content
Current HMA Mixture Design
Design asphalt content
Rut resistance mixture
pass
fail
Balanced HMA mixture
pass
fail

Asphalt Aggregate
Gradation, Ndesign
Volumetric design
Rutting check:
Hamburg wheel tracking test
Balanced HMA Mixture Design-2
Asphalt Aggregate
Gradation, Ndesign
Volumetric design
Hamburg Test Overlay Test
“Design asphalt content (DAC)”
Current HMA Mixture Design
Design asphalt content Vary asphalt contents:
DAC, DAC+0.5%, DAC+1%
Rut resistance mixture
pass
fail
Performance Evaluation
Balanced HMA mixture
pass
fail

Methodology for Balancing Rutting and Cracking Requirements
Balancing Rutting and Cracking
0
2
4
6
8
10
12
14
16
4 4.5 5 5.5 6 6.5 Asphalt Content (%)
Rut
Dep
th (m
m)
0
100
200
300
400
500
600
700
800
Cra
ckin
g Li
fe (c
ycle
s)
RutCrack
Acceptable Rutting &Cracking
Acceptable Rutting Acceptable Cracking
Criteria
•Rutting: 12.5 mm
•Cracking: 300* cyclesCurrently used in Houston, originally based on field experience.

Lab testing: performance evaluation
Hamburg wheel tracking test: 12.5 mmPG64-22: Rut depth @10000 passesPG70-22: Rut depth @15000 passesPG76-22: Rut depth @20000 passes
Overlay tester: 300 cyclesCracking life: 93% load reduction of max. load at first cycle

Asphalt Aggregate
Gradation, Ndesign
Volumetric design
Rutting check:
Hamburg wheel tracking test
Balanced HMA Mixture Design-1
Asphalt Aggregate
Gradation, Ndesign
Volumetric design
Performance check
Hamburg TestOverlay Tester
Design asphalt content
Current HMA Mixture Design
Design asphalt content
Rut resistance mixture
pass
fail
Balanced HMA mixture
pass
fail

Lab testing: balanced HMA mixture design-1
Mixture type Aggregate Asphaltbinder
DesignAC (%)
VMA(%)
HWTT(mm)
OT(cycles)
AsphaltAbsorption(%)
TXI-limestone PG64-22 4.8 15.2 3.0 189 0.07
TXI-limestone PG76-22 4.7 15.2 5.0 200 0.14
TCS-limestone PG64-22 5.5 16.3 13.4 25 0.93
Type D
Sandstone PG76-22 5.4 16.0 4.6 580 0.16
Sandstone PG64-22 5.0 15.1 5.9 112 1.07
Sandstone PG70-22 5.1 15.3 2.4 35 1.37
Gravel PG76-22 5.5 16.4 3.0 105 0.30
Superpave-CNdesign=100
Quartzite PG76-22 5.4 16.3 3.0 230 0.63

Asphalt Aggregate
Gradation, Ndesign
Volumetric design
Rutting check:
Hamburg wheel tracking test
Balanced HMA Mixture Design-2
Asphalt Aggregate
Gradation, Ndesign
Volumetric design
Hamburg Test Overlay Test
“Design asphalt content (DAC)”
Current HMA Mixture Design
Design asphalt content Vary asphalt contents:
DAC, DAC+0.5%, DAC+1%
Rut resistance mixture
pass
fail
Performance Evaluation
Balanced HMA mixture
pass
fail

TXI-PG76-22
0
1
2
3
4
5
6
7
8
9
10
4.5 4.7 4.9 5.1 5.3 5.5 5.7 5.9
Asphalt Content (%)
Rut
Dep
th (m
m)
0
100
200
300
400
500
600
700
800
900
1000
Cra
ckin
g Li
fe (N
o. o
f Cyc
les)
HWTT
OT
Lab testing: Performance evaluation-Type D Mixtures
Balanced AC=5.3%

Lab testing: Performance evaluation-Type D Mixtures
TXI-PG64-22
0
5
10
15
20
25
4.5 4.7 4.9 5.1 5.3 5.5 5.7 5.9
Asphalt Content (%)
Rut D
epth
(mm
)
0
300
600
900
1200
1500
Crac
king
Life
(No.
of C
ycle
s)
HWTTOT
Balanced AC=5.1%

Sandstone PG76-22
0
2
4
6
8
10
5 5.5 6 6.5
Asphalt Content (%)
Rut D
epth
(mm
)
0
300
600
900
1200
1500
1800
2100
Crac
king
Life
(No.
of C
ycle
s)
HWTTOT
Lab testing: Performance evaluation-Type D Mixtures
Balanced AC=5.9%

Sandstone_L- PG64-22
0
2
4
6
8
10
12
14
4.8 5 5.2 5.4 5.6 5.8 6 6.2
Asphalt Content (%)
Rut D
epth
(mm
)
0
50
100
150
200
250
300
350
400
450
Crac
king
Life
(No.
of C
ycle
s)
HWTTOT
Lab testing: Performance evaluation-Superpave C Mixtures
Balanced AC=5.8%

Lab testing: Performance evaluation-Superpave C Mixtures
Sandstone_NL- PG70-22
0
0.5
1
1.5
2
2.5
3
3.5
4
5 5.2 5.4 5.6 5.8 6 6.2
Asphalt Content (%)
Rut
Dep
th (m
m)
0
50
100
150
200
250
300
350
400
450
Crac
king
Life
(No.
of C
ycle
s)
HWTTOT
No balance: either redesign or increase asphalt content again.

Quartzite MD L-PG64-22
0
1
2
3
4
5
6
5.2 5.4 5.6 5.8 6 6.2 6.4 6.6
Asphalt Content (%)
Rut D
epth
(mm
)
0
150
300
450
600
750
Crac
king
Life
(No.
of C
ycle
s)
HWTTOT
Lab testing: Performance evaluation-Superpave C Mixtures
Balanced AC=6.0%

Balanced HMA Mixture Design
Asphalt Aggregate
Gradation, Ndesign
Volumetric design
Hamburg Test Overlay Test
“Design asphalt content (DAC)”
Vary asphalt contents:DAC, DAC+0.5%, DAC+1%
Performance Evaluation
Balanced HMA mixture
pass
fail

Summary & ConclusionsMixes such as SMA and CAM balance stability & durability very wellFor dense graded mixes, the current design procedure results in mixes that are stable but not very durableA “balanced” mix design procedure can be used to improve dense graded mixes This approach shows promise but is not ready for full implementation yet