balaji amines ltd - nirmal bang amines initiating coverage.pdf · balaji amines ltd 4 ... bal is...
TRANSCRIPT

ACATALYSTOF CHANGE
ACATALYSTOF CHANGE
Balaji Amines LtdBalaji Amines Ltd

1 | P a g e
Init
iati
ng
Co
ve
rag
e
Balaji Amines Ltd 4
Recommendation BUY A CATALYST OF CHANGE Balaji Amines, set up in 1988, is a leading manufacturer of Aliphatic Amines. It specialized in manufacturing Methylamines, Ethylamines and derivatives of them. It also operates a 5 start hotel in Solapur – Balaji Sarovar, the only 5 star property in the city. Investment Rationale
Core Business: (A) High Volume growth: BAL is targeting volume growth of 25-30% in near future. However, as the key raw material prices were coming down, realizations had also remained muted impacting the overall sales growth. (B) Growing user industries: Pharma and Agro chemical segments contribute ~75-80% of company’s total revenues, wherein Pharmaceutical industry is expected to grow at 11-13% in next five years and Agro chemical is expected to grow by 12-13%. (C) DMF: BAL has set up an ambitious 30,000 tones p.a Dimethyl formamide (DMF) and added 7,500, Dimethyl amine hydrochloride (DMA HCL) facility taking the total capacity to 24000 MT with an investment of Rs 30 cr in FY14. However, due to excess supply at lower prices from China, BAL’s growth got impacted. Currently the company is utilizing 15-20% of its capacity due to stiff competition from China. Still, the management is hopeful of revival in the product as it doesn’t see Chinese companies will continue bleeding and expect up-tick in prices in future. Also, it expects some regulatory intervention in form of Anti dumping duty.
Hotel Business – doing well: Balaji Amines started a 5 star hotel in Solapur (only 5 star hotel till date) in Oct’13 with an investment of Rs 110 cr. It is a 129 room facility. Solapur is located on major road and rail routes between Mumbai and Hyderabad and is an important hub for pilgrims for Pandharpur, Tuljapur Siddheshwar temple, Gangapur, Bijapur and Akkalkot. All these destinations attract millions of pilgrims and tourist every year to Solapur. In addition, various corporates are coming up which drives corporate tourist traffic. For FY17E/FY18E, we expect Hotel to report sales of Rs 18.8/23.2 cr with EBITDA of Rs 7/9.5 cr
Divestment of loss making subsidiary: BAL is looking to divest stake in its loss making subsidiary – Balaji Greentech Products Ltd, in which it holds 66% stake. Due to accumulated losses, the subsidiary has ~Rs 18 cr debt which is putting interest cost pressure on the financials of the company. BAL has decided to sale the company but to reduce the interest cost burden it has recently re-paid long term debt of the company which will eventually help reducing the drain on consolidated numbers as well.
Valuation & Recommendation
For FY16-18E we expect the company’s sales to grow by 20.3% and PAT by 33.3% (as interest cost if likely to come down and with no more capex lined up depreciation is likely to be stable at current levels). We have forecasted stable EBITDA margins. BAL is leading amine player and enjoys handsome market share in its basket of products. It is consistent dividend paying company and is poised for good
growth and is available at attractive valuations. We believe there is scope of re-rating of the stock given the improvement in ROCE and ROE with positive free cash flow. We have assigned multiple of 13x for FY17E earnings, giving a price target of Rs 310. We are initiating coverage on Balaji Amines Limited with a BUY rating for price target of Rs 310, an upside of 42%.
CMP Rs 218
Target Price Rs 310
Sector Chemicals
Stock Details
BSE Code 530999
NSE Code BALAMINES
Bloomberg Code BLA IN
Market Cap (Rs cr) 706
Free Float (%) 45.58
52- wk HI/Lo (Rs) 239/106
Avg. volume NSE (Quarterly) 110,010
Face Value (Rs) 2.0
Dividend (FY 16) 100%
Shares o/s (Cr) 3.2
Relative Performance 1Mth 3Mth 1Yr
BAL 6.8% 72.2% 92.7%
Sensex 6.4% 16.3% -4.1%
Shareholding Pattern 31st
Mar 16
Promoters Holding 54.42
Institutional (Incl. FII) 0.35
Corporate Bodies 3.91
Public & others 41.32
Runjhun Jain –Sr. Research Analyst 022 3926 8177 [email protected] Sunil Jain – Head of Retail Research 022 39268196 [email protected]
Year Consol
Sales (Rs cr)
Growth (%)
EBITDA (Rs cr)
Margin (%)
PAT (Rs cr)
Margin (%)
Adj EPS (Rs) P/E (x) RoE
FY15A 618.8 1.4% 101.8 16.4% 34.3 5.5% 10.6 20.6 15.0%
FY16A 643.1 3.9% 126.7 19.7% 57.6 9.0% 17.8 12.3 20.6%
FY17E 773.0 20.2% 155.5 20.1% 77.1 10.0% 23.8 9.2 22.1%
FY18E 931.2 20.5% 188.6 20.3% 102.4 11.0% 31.6 6.9 23.1%
100
140
180
220
1-Jun 1-Sep 1-Dec 1-Mar 1-Jun

2 | P a g e
Init
iati
ng
Co
ve
rag
e
Balaji Amines Ltd INVESTMENT RATIONALE
Core Business o High Volume growth – BAL is targeting volume growth of 25-30% in near future on back
of increase sales of Methyamine, specialty chemcials like NMP, DMA, Morpholine, NEP etc. However, as the key raw material prices were coming down, realizations had also remained muted impacting the overall sales growth. However, we believe the prices could near bottom and any up-tick in prices from here on can give a big boost to the company’s revenues. The company recorded volume growth of 22% in FY16 however due to decline in the prices of raw materials and subsequently in finished products prices, value growth was restricted to mere 4%. Going forward we expect finishes products prices to remain stable. We are forecasting 20% growth for standalone business for FY17E and FY18E at Rs 763 cr and Rs 916 cr respectively.
o Growing user industries – BAL caters to many industries like Pharmaceuticals, Agro
chemicals, Paints, Oil and Gas, Rubber cleaning, Dyes and Textiles etc. However, Pharmaceuticals and Agro chemicals contributes ~75-80% of company’s total revenues. The Indian pharmaceuticals market is estimated to be worth US$36.8 billion in revenues for the fiscal year 2015 and is estimated to grow at a CAGR of 11-13% in next five years. Moreover, government’s thrust on more affordable medicines and increasing the reach should work in favor of the pharmaceuticals companies and indirectly for companies like Balaji Amines. Pharmaceutical segment is key segment for BAL and contributes around 50% of company’s revenues and has wide client base like Aurobindo, Dr Reddy, Cipla etc.
Other key user industry for BAL is Agro chemical which contributed 26% to total revenues in FY15. Indian agro-chemical industry is growing at a CAGR of 12-13% p.a. and is expected to reach over $6.8bn in 2017. India is world’s fourth largest pesticide producing country. Factors like low consumption of crop protection products in India at 0.6 kilograms per hectare compared to the global average of 3 kilograms per hectare, the availability of cheap labor and low processing costs, a growing opportunity for contract manufacturing and research among Indian players offers strong growth potential. Some of its clients are Bayer Crop, BASF, Jubilatn Organics etc
-5%
0%
5%
10%
15%
20%
25%
0
10000
20000
30000
40000
50000
60000
70000
FY13 FY14 FY15 FY16
Volume
Vol Gr
Value Gr

3 | P a g e
Init
iati
ng
Co
ve
rag
e
Balaji Amines Ltd o DMF – BAL has set up an ambitious 30,000 tones Dimethyl formamide (DMF) and added
7,500 Dimethyl amine hydrochloride (DMA HCL) facility taking the total capacity to 24000 MT
with an investment of Rs 30 cr in FY14. DMF is used in Pharma space as raw materials for manufacturing anti-diabetic and antibiotic like Metformin and Ranitidine. BAL’s capacity of DMF was set up to replace the import in the country. India’s total consumption of DMF stands at 44,000 tons per annum of which Rashtriya Chemical and Fertilizer produces meagre between 3,000 – 4,000 tons per annum. This doesn’t create any meaningful competition however it does face stiff competition from Chinese/Saudi players and due to excess supply at lower prices from China/Saudi, BAL’s growth got impacted. Currently the company is utilizing 20-25% of its capacity due to stiff competition from China. Still, the management is hopeful of revival in the product as it doesn’t see Chinese companies will continue bleeding and expect up-tick in prices in future. Also, it expects some regulatory intervention in form of Anti dumping duty.
o No major Capex in near future – With hotel and DMF capex behind it, the company is not planning any big capex in near future. With improving cash flows and no capex lined up the company is looking to repay its high interest cost bearing debt which would eventually improve the ROCE of the company The company is launching a new product – Acetonenitrile with an investment of less than Rs 20 cr for 10,000 ton capacity. It has not taken any loan for it. It is widely used in battery applications and in Human Insulin, hence pharma sector would be a major customer for it. Alkyl Amine is one of the leading player in Acetonenitrile space. Capex in last four years
Rs cr FY12 FY13 FY14 FY15
Capex 115.9 89.0 52.3 34.1
The company has done total capex of Rs 290 cr in last 4 years out of which it has spent Rs 110 cr for Hotel. BAL enjoys Asset turnover of 1.8x hence on Rs 180 cr of last 4 years, ideal revenue addition should be Rs 325 cr however the company has done incremental revenue of just Rs 169 cr, which we believe gives enough scope to the company to grow in coming years without any more investments.
16.6%
18.3% 18.6%
16.1%
14.8% 15.4%
21.5%
23.9%
27.0%
21.6%
23.2%
24.6%
18.2%
16.7%
15.0%
20.6%
22.1% 23.1%
10%
12%
14%
16%
18%
20%
22%
24%
26%
28%
FY10 FY11 FY12 FY13 FY14 FY15 FY16 FY17E FY18E
ROCE ROE

4 | P a g e
Init
iati
ng
Co
ve
rag
e
Balaji Amines Ltd
Hotel Business - doing well: Balaji Amines started a 5 star hotel in Solapur (only 5 star hotel till date) in Oct’13 with an investment of Rs 110 cr. It is a 129 room facility. It has tied up with Sarovar group for the management of the Hotel on management fee plus nominal revenue sharing basis. Solapur is located on major road and rail routes between Mumbai and Hyderabad and is an important hub for Pandharpur, Tuljapur Siddheshwar temple, Gangapur, Bijapur and
Akkalkot. All these destinations attract millions of pilgrims and tourist every year to Solapur.
In addition, various corporates are coming up like NTPC is setting up 1320 MW thermal power plant with an investment of Rs 9500 cr, HPCL (HP Gas) is putting up a new LPG bottling plant in Solapur will drive corporate tourist traffic. There are other corporates also present like Precision Camshafts, Smruthi Organics, Thermax etc. Solapur is a city with multi-linguistic and multi-cultural features and getting popular as a destination wedding place, due to which BAL’s hotel’s Banquets are doing very well Hotel division did sales of Rs 15 cr in FY16 with EBIT loss of Rs 1.7 cr. However, the financials are improving on quarterly basis as evident from below table For FY17E/FY18E, we expect Hotel to report sales of Rs 19/23 cr with EBITDA of Rs 7.0/9.5 cr
Divestment of loss making subsidiary – Balaji amines’ subsidiary Balaji Greentech Products manufactures energy efficient lamps and components and supplies a comprehensive range of Compact Fluorescent Lamps (CFL). BAL is looking to divest stake in its loss making subsidiary in which it holds 66% stake now. BAL started CFL business in FY09 with a capital advance of Rs 6.94 cr. It undertakes the job work for third party companies. However, the division has not been able to perform as per company’s expectations and has been making losses. Due to accumulated losses, the subsidiary has ~Rs 18 cr debt which is putting interest cost pressure on the financials of the company. BAL has decided to sale the company but to reduce the interest cost burden it has recently re-paid long term debt of the company which will eventually help reducing the drain on consolidated numbers as well.
Limited players – Worldwide Amines technology is a closely guarded process with only few handful companies having access to such technology. For the first time in India, Balaji testes on a indegenoously developed products and over the years has become a leading player in the segment and commands healthy market share of 60-70% in domestic region for various products. BAL has mastered the complex process which we believe, would act as a major entry barrier for domestic competitors and would provide revenue visibility and stable profitability.
FY14 FY15 FY16
Rs cr Q2 Q3 Q4 FY14 Q1 Q2 Q3 Q4 FY15 Q1 Q2 Q3 Q4 FY16
Sales 5.0 1.6 2.4 4.0 2.5 2.4 2.9 3.7 11.5 3.4 3.0 4.7 3.8 15.0
EBIT 0.1 0.1 0.1 0.2 0.0 0.2 -0.4 1.2 2.0 0.7 -0.8 0.2 -0.3 -1.7

5 | P a g e
Init
iati
ng
Co
ve
rag
e
Balaji Amines Ltd
COMPANY OVERVIEW
Balaji Amines, set up in 1988, is a leading manufacturer of Aliphatic Amines. It specialized in manufacturing Methylamines, Ethylamines and derivatives of them. The company enjoys leadership position in many of its products like Monomethylamine (MMA), Dimethyl amine (DMA), Trimethylamine (TMA), Dimethyl Amino Ethanol (DMAE), Mono Methyl Amino Ethanol etc. It caters to host of industries like Pharma (51% of revenues), , Agro Chemicals (26%), Paint Stripping & Resins, Rubber cleaning etc. The company has three state of the art units – two near Solapur and one near Hyderabad. In addition BAL possess a fully furnished Laboratory which helps the company in development of newer products. It also operates a 5 start hotel in Solapur – Balaji Sarovar, the only 5 star property in the city.
Pharma 51%
Paint stripping 4%
Agro 26%
Animal Inds 2%
Oil & Gas 3%
Rubber Cleaning 4%
Water Treatment
2%
Dyes & textiles 4%
Others 3%

6 | P a g e
Init
iati
ng
Co
ve
rag
e
Balaji Amines Ltd
Industry Overview Amines are a large class of nitrogen-containing organic compounds derived from Ammonia (NH3) by displacement of H2 in the ammonia molecule by other radicals such as Methyl, Ethylene and Propanol Structurally, three types of amines are formed – Primary/Secondary/Tertiary based on the number of hydrogen atoms displaces For example, following are the three tpes of Methylamines (MA) Primary or Mono Amine – MMA Secondary or Di amine – DMA Tertiary amine - TMA

7 | P a g e
Init
iati
ng
Co
ve
rag
e
Balaji Amines Ltd
QUARTERLY RESULT
The company recorded volume growth of 22% in FY16 however due to decline in the prices of raw materials and subsequently in finished products prices, value growth was restricted to mere 4%. The company has been reported improving profitability over the years and likely to maintain the trend going forward. However, Q4 margins of 24.6% are not sustainable . Q4 margins were abnormally high as one of the key Chinese player was not so aggressive and hence prices moved up. SEGMENTAL BREAKUP Hotel division’s performance is improving and likely to continue the momentum going forward.
Standalone(Rs cr) FY14 Q1FY15 Q2FY15 Q3FY15 Q4FY15 FY15 Q1FY16 Q2FY16 Q3FY16 Q4FY16 FY16
Net sales 610.1 164.5 150.5 141.7 148.3 604.9 159.6 158.8 150.0 166.5 634.9
Cost of Materials 381.0 101.2 85.3 84.5 79.7 350.7 94.8 91.9 79.0 83.1 348.9
Staff cost 20.8 5.7 5.5 6.2 7.1 24.5 6.6 6.9 7.7 10.4 31.5
Other Exps 117.4 32.6 31.4 29.4 32.6 127.3 29.3 32.1 32.2 32.1 125.7
Total Expenses 519.1 139.5 122.3 120.1 119.4 502.5 130.7 130.9 118.9 125.6 506.0
EBITDA 91.0 25.0 28.2 21.6 28.9 102.4 29.0 27.9 31.1 40.9 128.9
margins 14.9% 15.2% 18.7% 15.2% 19.5% 16.9% 18.2% 17.6% 20.7% 24.6% 20.3%
Depreciation 16.5 4.9 4.9 5.0 3.8 18.6 4.4 4.4 4.4 4.7 17.9
EBIT 74.6 20.1 23.2 16.6 25.1 83.8 24.6 23.6 26.7 36.1 111.0
Interest 31.5 8.4 7.9 7.7 7.5 31.4 5.7 5.2 5.2 4.0 20.1
Other income 2.6 0.8 0.9 0.5 1.2 3.4 0.7 0.8 0.1 0.7 2.2
PBT 45.7 12.5 16.2 9.5 18.9 55.7 19.6 19.1 21.7 32.8 93.2
Tax 12.1 3.2 5.8 3.3 7.1 19.4 6.7 7.3 8.4 9.5 31.9
Tax rate 26.5% 25.4% 36.0% 34.6% 37.7% 34.8% 34.4% 38.2% 38.6% 28.9% 34.2%
MI & EO 0.0 0.0 1.3 0.0 0.0 0.0 0.0 0.0 0.0 0.0 0.0
PAT 33.5 9.3 9.1 6.2 11.8 36.4 12.8 11.8 13.3 23.3 61.3
Equity Capital 6.5 6.5 6.5 6.5 6.5 6.5 6.5 6.5 6.5 6.5 6.5
FV 2.0 2.0 2.0 2.0 2.0 2.0 2.0 2.0 2.0 2.0 2.0
EPS 10.3 2.9 2.8 1.9 3.6 11.2 4.0 3.6 4.1 7.2 18.9
FY14 Q1FY15 Q2FY15 Q3FY15 Q4FY15 FY15 Q1FY16 Q2FY16 Q3FY16 Q4FY16 FY16
Amines
- Sales 606.2 162.0 148.0 138.9 144.7 593.6 156.3 155.8 145.3 162.6 620.1
- EBIT 93.4 25.8 28.9 17.5 29.0 103.8 28.9 25.1 26.6 37.1 114.9
margins % 15.4% 15.9% 19.5% 12.6% 20.0% 17.5% 18.5% 16.1% 18.3% 22.8% 18.5%
Hotel
- Sales 4.0 2.5 2.4 2.9 3.7 11.5 3.4 3.0 4.7 3.8 15.0
- EBIT 0.2 0.0 0.2 -0.4 1.2 2.0 0.7 -0.8 0.2 -0.3 -1.7
margins % 4.5% -1.6% 6.1% -13.8% 32.3% 17.0% 21.3% -27.5% 4.8% -7.4% -
11.4%

8 | P a g e
Init
iati
ng
Co
ve
rag
e
Balaji Amines Ltd
PEER COMPARISON
RISKS
DMF prices remains stagnant: BAL undertook an ambitious capex and expanded its capacity for DMF to replace the imports and to get the benefit of strong prices however, due to increased dumping by China at lower prices; it couldn’t reach its targeted growth and has been facing reduction in prices. Currently, the company is hoping of turnaround in prices and looking for some government intervention in future (in form of dumping duty). In case it doesn’t materialize then the company had to take the brunt of subdued prices.
Higher competition from China/Saudi for other products as well: China is the biggest competitor for the domestic chemical segment. Due to large scale production in China and incentives provided by its government, domestic industry is unable to compete with them on pricing. BAL is also facing stiff competition on few products from China/Saudi. Any further competition from China for its other products can impact the growth forecasts of the company.
Net
Sales EBITDA Margin PAT Margin EPS Price Mcap EV PE EV/S EV/
EBITDA P/BV
(Rs Cr) (Rs Cr) (%) (Rs Cr) (%) (Rs) (Rs)
(Rs Cr)
(Rs Cr) (x) (x) (x) (x)
Alkyl Amines 473 92 20% 50 11% 24.5 308 629 721 12.6 1.53 7.8 5.7
Amines & Plasticizers 262 23 9% 9 3% 1.6 20 108 162 11.9 0.62 6.9 4.9
Indo Amines 253 31 12% 9 4% 2.8 39 128 169 14.1 0.67 5.5 2.3
Balaji Amines 643 127 20% 58 9% 17.8 218 706 866 12.3 1.35 6.8 4.1
Source: FY16 numbers, Company, NB Research
9 | P a g e
Init
iati
ng
Co
ve
rag
e
Balaji Amines Ltd
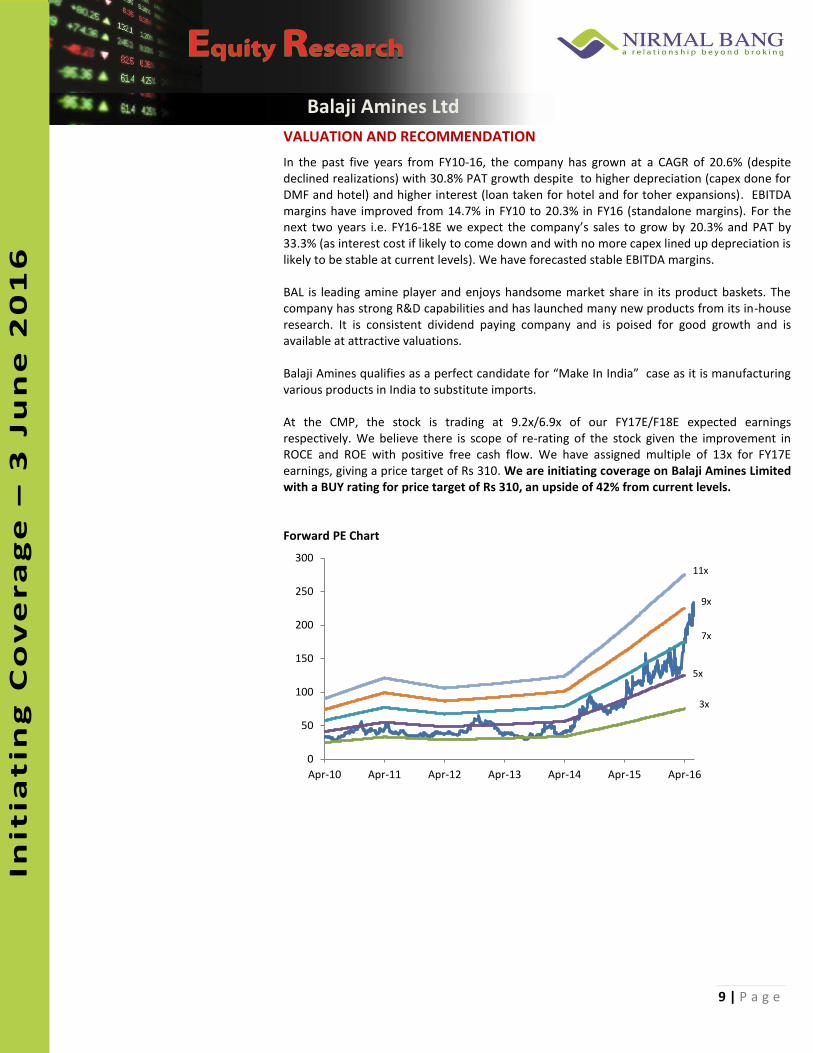
VALUATION AND RECOMMENDATION
In the past five years from FY10-16, the company has grown at a CAGR of 20.6% (despite declined realizations) with 30.8% PAT growth despite to higher depreciation (capex done for DMF and hotel) and higher interest (loan taken for hotel and for toher expansions). EBITDA margins have improved from 14.7% in FY10 to 20.3% in FY16 (standalone margins). For the next two years i.e. FY16-18E we expect the company’s sales to grow by 20.3% and PAT by 33.3% (as interest cost if likely to come down and with no more capex lined up depreciation is likely to be stable at current levels). We have forecasted stable EBITDA margins. BAL is leading amine player and enjoys handsome market share in its product baskets. The company has strong R&D capabilities and has launched many new products from its in-house research. It is consistent dividend paying company and is poised for good growth and is available at attractive valuations. Balaji Amines qualifies as a perfect candidate for “Make In India” case as it is manufacturing various products in India to substitute imports. At the CMP, the stock is trading at 9.2x/6.9x of our FY17E/F18E expected earnings respectively. We believe there is scope of re-rating of the stock given the improvement in ROCE and ROE with positive free cash flow. We have assigned multiple of 13x for FY17E earnings, giving a price target of Rs 310. We are initiating coverage on Balaji Amines Limited with a BUY rating for price target of Rs 310, an upside of 42% from current levels. Forward PE Chart
0
50
100
150
200
250
300
Apr-10 Apr-11 Apr-12 Apr-13 Apr-14 Apr-15 Apr-16
9x
7x
5x
3x
11x

10 | P a g e
Init
iati
ng
Co
ve
rag
e
Balaji Amines Ltd
Financials – Consolidated – Rs cr Profit & Loss FY15A FY16A FY17E FY18E Balance Sheet FY15A FY16A FY17E FY18E
Net Sales 618.8 643.1 773.0 931.2 Share Capital 6.5 6.5 6.5 6.5
% change 1.4% 3.9% 20.2% 20.5% Reserves & Surplus 221.4 273.7 342.9 437.0
EBITDA 101.8 126.7 155.5 188.6 Net Worth 227.9 280.2 349.4 443.5
EBITDA margin 16.4% 19.7% 20.1% 20.3% Net Deferred Tax Liab 45.1 50.5 50.5 50.5
Depn & Amort 20.1 19.4 22.5 23.9 Total Loans 255.9 168.0 156.0 116.0
Operating income 81.7 107.3 132.9 164.7 Trade Payables 47.6 49.3 59.0 70.8
Interest 34.9 22.2 18.2 13.4 Provis ions 18.0 34.4 34.4 34.4
Other Income 4.3 2.8 5.0 7.0 Other CL 9.8 10.2 10.3 12.2
PBT 51.1 88.0 119.7 158.3 Total Liabilities 622.5 604.7 671.7 739.4
Tax 17.9 30.3 42.5 55.9 Net Fixed Assets 341.1 340.8 355.4 362.3
MI & EO -1.1 0.0 0.0 0.0 Capital WIP 3.3 16.3 4.1 3.4
PAT 34.3 57.6 77.1 102.4 Investments 0.0 0.0 0.0 0.0
PAT margin (%) 5.5% 9.0% 10.0% 11.0% Cash & Bank 7.0 8.6 15.9 20.1
Sh o/s - Diluted 3.2 3.2 3.2 3.2 Inventories 112.4 78.0 101.4 119.3
Adj EPS 10.6 17.8 23.8 31.6 Debtors 119.4 124.3 147.3 177.2
Cash EPS 16.8 23.8 30.8 39.0 Loans & Advances 39.4 36.7 47.5 57.1
Qtrly-Stdalone Jun.15 Sept.15 Dec.15 Mar.16 Misc Exp 0.0 0.0 0.0 0.0
Revenue 159.6 158.8 150.0 166.5 Total Assets 622.5 604.7 671.7 739.4
EBITDA 29.0 27.9 31.1 40.9 Cash Flow FY15A FY16A FY17E FY18E
Dep & Amorz 4.4 4.4 4.4 4.7 Op CF before tax 101.8 126.7 155.5 188.6
Op Income 24.6 23.6 26.7 36.1 Change in WC -37.5 46.4 -47.4 -43.7
Interest 5.7 5.2 5.2 4.0 Tax -17.9 -30.3 -42.5 -55.9
Other Inc. 0.7 0.8 0.1 0.7 CF from Operation 46.4 142.7 65.5 89.1
PBT 19.6 19.1 21.7 32.8 Capex -34.1 -32.0 -25.0 -30.0
Tax 6.7 7.3 8.4 9.5 Oth Inc & Investments 24.2 2.8 5.0 7.0
EO 0.0 0.0 0.0 0.0 CF from Investing -9.9 -29.3 -20.0 -23.0
PAT 12.8 11.8 13.3 23.3 Financing
EPS (Rs.) 4.0 3.6 4.1 7.2 Diviend Paid -4.7 -7.6 -8.0 -8.3
Performance Ratio FY15A FY16A FY17E FY18E Share Capital 0.0 0.0 0.0 0.0
EBITDA margin(%) 16.4% 19.7% 20.1% 20.3% Loans -5.8 -87.8 -12.0 -40.0
EBIT margin (%) 13.2% 16.7% 17.2% 17.7% Interest -34.9 -22.2 -18.2 -13.4
PAT margin (%) 5.5% 9.0% 10.0% 11.0% Others 6.0 5.6 0.0 0.0
ROE (%) 15.0% 20.6% 22.1% 23.1% CF from Financing -39.3 -111.9 -38.2 -61.8
ROCE (%) 15.4% 21.5% 23.9% 27.0% Net Chg. in Cash -2.7 1.6 7.3 4.3
PAT growth (%) 2.3% 68.1% 33.9% 32.8% Cash at beginning 9.7 7.0 8.6 15.9
Debt/Equity (x) 1.1 0.6 0.4 0.3 Cash at end 7.0 8.6 15.9 20.1
Valuation Ratio FY15A FY16A FY17E FY18E Per Share Data FY15A FY16A FY17E FY18E
PE (x) 20.6 12.3 9.2 6.9 Adj EPS 10.6 17.8 23.8 31.6
Price/BV (x) 1.0 0.8 0.6 0.5 BV per share 70.3 86.5 107.8 136.9
EV / Sales 1.5 1.3 1.1 0.9 Cash per share 2.2 2.6 4.9 6.2
EV / EBITDA 9.4 6.8 5.4 4.3 Dividend per share 1.2 2.0 2.1 2.2

11 | P a g e
Init
iati
ng
Co
ve
rag
e
Balaji Amines Ltd
Disclaimer:
Nirmal Bang Securities Private Limited (hereinafter referred to as “NBSPL ”) is a registered Member of National Stock Exchange of India Limited,
Bombay Stock Exchange Limited and MCX stock Exchange Limited. We have been granted certificate of Registration as a Research Analyst with
SEBI. Registration no. is INH000001766 for the period 23.09.2015 to 22.09.2020 .NBSPL or its associates hold more than 1% financial
interest/beneficial ownership in the company covered by Analyst. NBSPL or its associates/analyst has not received any compensation from the
company covered by Analyst during the past twelve months. NBSPL /analyst has not served as an officer, director or employee of company
covered by Analyst and has not been engaged in market making activity of the company covered by Analyst. The views expressed are based
solely on information available publicly and believed to be true. Investors are advised to independently evaluate the market conditions/risks
involved before making any investment decision.
Nirmal Bang Research (Division of Nirmal Bang Securities Pvt. Ltd.) B-2, 301/302, Marathon Innova, Opp. Peninsula Corporate Park
Off. Ganpatrao Kadam Marg Lower Parel (W), Mumbai-400013 Board No. : 91 22 3926 8000/8001
Fax. : 022 3926 8010