bakken - has the bubble burst?
TRANSCRIPT

Bakken -the bubble has
burst!
Ciaran NolanMay 2015

The opinions and views expressed in this presentation are solely those of the author and
not necessarily those of any organisation
2
Disclaimer
C.Nolan May. 2015

1. Updated NDIC production data (Mar. 2014)2. Production model corrected* and updated 3. Incorporated comments and corrections4. Imported well production data into IHS Kingdom5. Company production data interrogated
3
Updates from previous (Mar. 2014) version
C.Nolan May. 2015* With feedback from Rune Likvern and Enno Peters

Introduction• Current US oil production stands at 9.3M bopd
with 4.5M of this coming from LTO plays. Bakken oil production (North Dakota only) is currently 1.11M bopd
• The Bakken (orange in the chart on the left) has recently been supplanted by the Eagle Ford as the worlds most prolific light tight oil (LTO) play
• Some analysts* suggest the US LTO industry could enter a downward spiral by Q4 2015. Sustained low oil prices will result in significantly reduced cash flow and for some, debt to EBITA ratios that violate credit covenants. This will in turn accentuate the decline in investment, production and hence revenues.
• Bakken economics are one of the most challenging of the LTO plays at sustained low oil prices due to the $7-10 discount between ND light sweet and WTI
• A number of companies have started to divert capital away from the Bakken to other LTO plays with higher margins
4
* See Slide 8C.Nolan May. 2015

This study• The author has no direct interest in any
Bakken Producers – the study is of personal/academic interest only
• ‘Outsiders’ independent view of the Bakken• Only public domain data has been used,
including production data from the regulatory authority; North Dakota Industrial Commission’s Department of Mineral Resources (NDIC-DMC)
• Data used to build a Bakken monthly production model since 2005
• Average initial production (IP) rates are determined for each months new wells by varying the IP rate to fit actual data
• Monthly decline curves are derived and summed to create a total production model
• Bakken production modelled from 2015 to 2020 based on a variety of inputs and scenarios
C.Nolan May. 2015 5

C.Nolan May. 2015 6
• Four ‘engines’ have propelled the growth of US LTO over the last 10 years including the Bakken;
1. Advances in completion technologyWell bore reservoir contact area increased 100 times in 15 years
2. Better definition of sweet spotsDownspacing, increased well densities allow better definition of sweet spots
3. High oil pricesContinuous rise in oil prices since late 2008 coincident with 1 and 2
4. Access to capitalGross US LTO debt of $133bn.
The Four Engines of LTO Growth
Artist rendering of the RS-25 engines power the core stage of NASA's Space Launch System (SLS) -- NASA's new heavy-lift launch vehicle
C.Nolan May. 2015 7
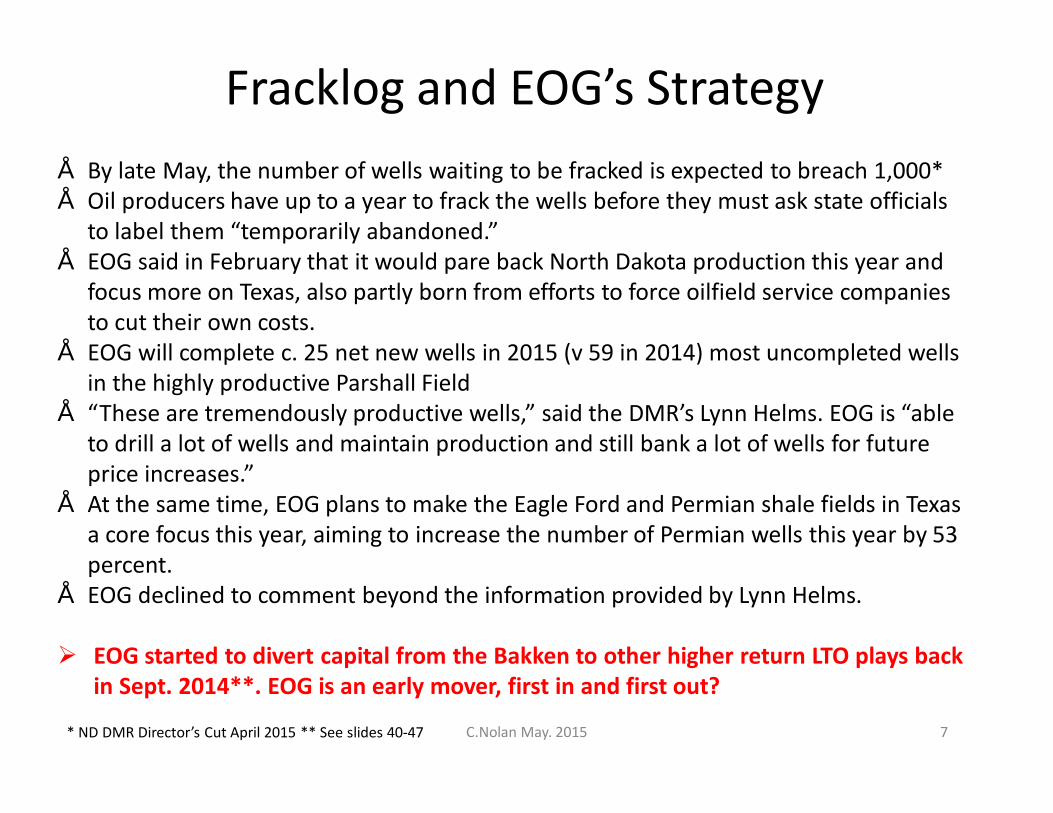
Fracklog and EOG’s Strategy• By late May, the number of wells waiting to be fracked is expected to breach 1,000*• Oil producers have up to a year to frack the wells before they must ask state officials
to label them “temporarily abandoned.”• EOG said in February that it would pare back North Dakota production this year and
focus more on Texas, also partly born from efforts to force oilfield service companies to cut their own costs.
• EOG will complete c. 25 net new wells in 2015 (v 59 in 2014) most uncompleted wells in the highly productive Parshall Field
• “These are tremendously productive wells,” said the DMR’s Lynn Helms. EOG is “able to drill a lot of wells and maintain production and still bank a lot of wells for future price increases.”
• At the same time, EOG plans to make the Eagle Ford and Permian shale fields in Texas a core focus this year, aiming to increase the number of Permian wells this year by 53 percent.
• EOG declined to comment beyond the information provided by Lynn Helms.
Ø EOG started to divert capital from the Bakken to other higher return LTO plays back in Sept. 2014**. EOG is an early mover, first in and first out?
* ND DMR Director’s Cut April 2015 ** See slides 40-47
C.Nolan May. 2015 8
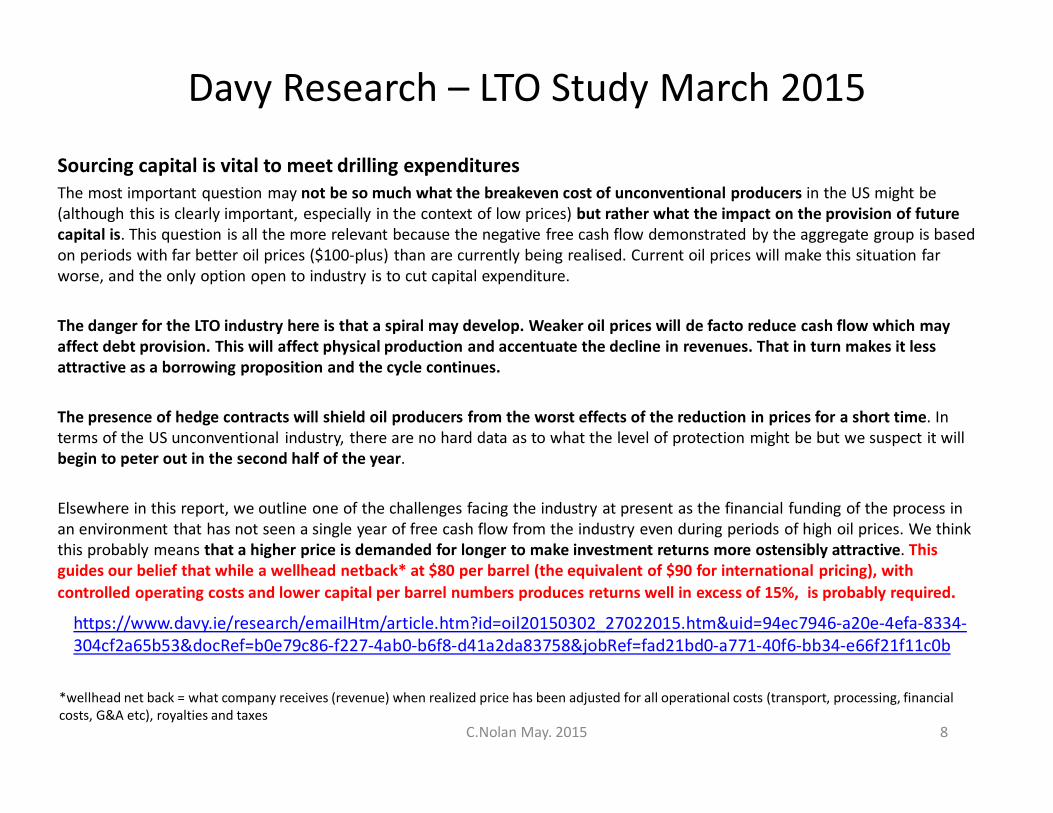
Davy Research – LTO Study March 2015
Sourcing capital is vital to meet drilling expendituresThe most important question may not be so much what the breakeven cost of unconventional producers in the US might be (although this is clearly important, especially in the context of low prices) but rather what the impact on the provision of future capital is. This question is all the more relevant because the negative free cash flow demonstrated by the aggregate group is based on periods with far better oil prices ($100-plus) than are currently being realised. Current oil prices will make this situation far worse, and the only option open to industry is to cut capital expenditure.
The danger for the LTO industry here is that a spiral may develop. Weaker oil prices will de facto reduce cash flow which may affect debt provision. This will affect physical production and accentuate the decline in revenues. That in turn makes it less attractive as a borrowing proposition and the cycle continues.
The presence of hedge contracts will shield oil producers from the worst effects of the reduction in prices for a short time. In terms of the US unconventional industry, there are no hard data as to what the level of protection might be but we suspect it will begin to peter out in the second half of the year.
Elsewhere in this report, we outline one of the challenges facing the industry at present as the financial funding of the process in an environment that has not seen a single year of free cash flow from the industry even during periods of high oil prices. We think this probably means that a higher price is demanded for longer to make investment returns more ostensibly attractive. This guides our belief that while a wellhead netback* at $80 per barrel (the equivalent of $90 for international pricing), with controlled operating costs and lower capital per barrel numbers produces returns well in excess of 15%, is probably required.
https://www.davy.ie/research/emailHtm/article.htm?id=oil20150302_27022015.htm&uid=94ec7946-a20e-4efa-8334-304cf2a65b53&docRef=b0e79c86-f227-4ab0-b6f8-d41a2da83758&jobRef=fad21bd0-a771-40f6-bb34-e66f21f11c0b
*wellhead net back = what company receives (revenue) when realized price has been adjusted for all operational costs (transport, processing, financial costs, G&A etc), royalties and taxes

North Dakota Production, Rig Count and Oil Prices*
ND production peaked in Dec. 2014 at 1.27M bopd and has since fallen back to 1.11M bopd in Feb. 2015.
*NDIC reported monthly oil price

Introduction

Bakken Geology
The Upper Devonian to Lower Mississippian Bakken Formation in the Williston Basin is a world-class petroleum system. Bakken and Three Forks pressures indicate an inverted continuous system with pressure leaking off at top, apart from the Parshall pressure cell. Three Forks shows higher overpressure than Middle Bakken. Good correlation between hydrocarbon generation, pore-overpressure, inferred oil saturations and productivity. Sweet spots influenced by migration and trapping mechanisms (e.g. Sanish/Parshall, Elm Coulee). Low-productivity areas probably result of migration (e.g. flanks of Nesson Anticline). Natural fractures play a significant role for production, but do not define sweet spot areas. Production increases with more sophisticated completion technology but geological factors have a larger impact on productivity than technological improvements*
* Theloy and Sonnenberg 2013 – Search and Discovery article #80332 11C.Nolan May. 2015

Current Bakken production is concentrated in a discrete part of the Williston Basin (within the purple polygon) mostly in the sparsely populated state of North Dakota. The ‘City’ of Dickinson has a population of 20,826 in 2013, and is currently one of the fastest growing cities in the U.S.
C.Nolan May. 2015 12

This is a satellite photo of North Dakota in 2003 prior to the growth in Bakken production. Note the lights of the main ‘Cities’ and towns in red.
C.Nolan May. 2015 13

This is a satellite photo of the same part of North Dakota in 2013 and illustrates the vast number of producing wells flaring gas. Gas flaring restrictions are now being implemented by the NDIC.
C.Nolan May. 2015 14

30 day initial production (IP) rates, hotter colours = higher rates
Bakken – Initial production rates – Drilling Info.*
*From Drillinginfo (Aug. 2014) C.Nolan May. 2015 15

ND Bakken IP rates gridded to create a ‘Heat Map’* which illustrates four sweet spots in terms of counties;1. Williams2. Mountrail3. McKenzie4. Dunn
Bakken Production Heat Map - RBC
* From RBC capital markets presentation July 2014C.Nolan May. 201516

17
Bakken Production Heat Map – this study
Gridded average ND well production for first 12 months of full production (post 2007 / pre 2014)
C.Nolan May. 2015
* Average 12 months full production (bbls) between Jan. 2007 and Jan. 2014. Contours are for Top Three Forks (feet) Well production data from Enno Peters.
18
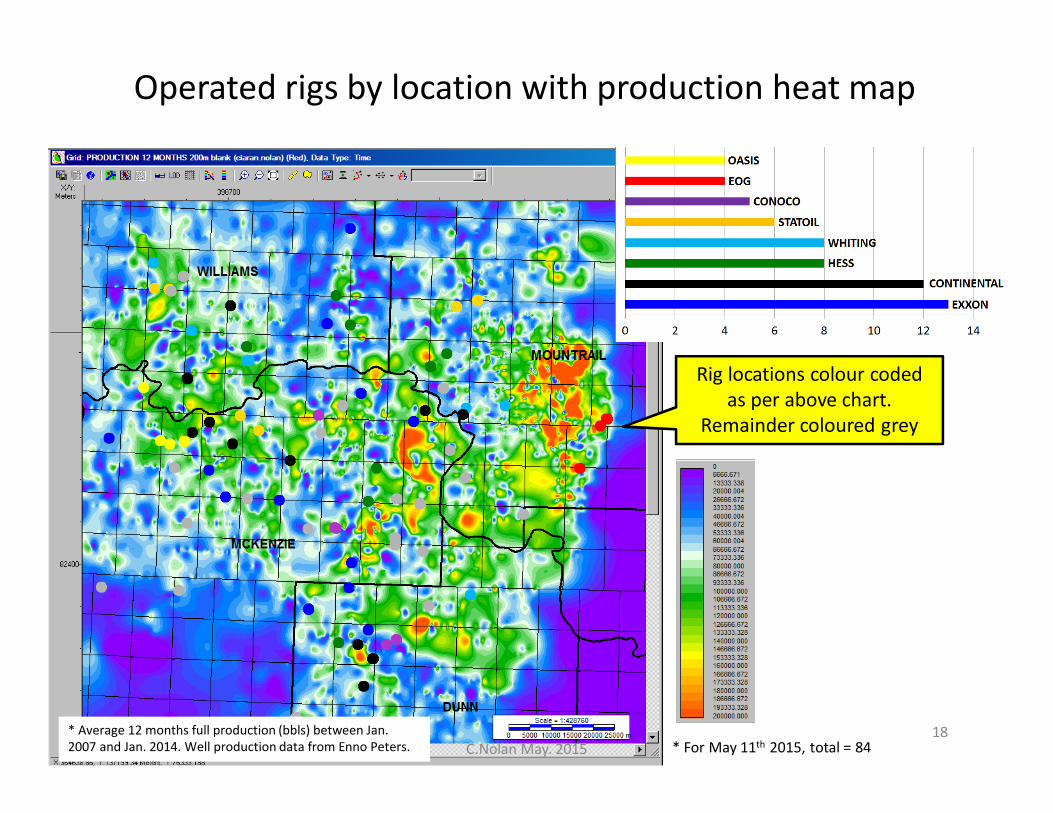
Operated rigs by location with production heat map
* For May 11th 2015, total = 84
Rig locations colour coded as per above chart.
Remainder coloured grey
C.Nolan May. 2015* Average 12 months full production (bbls) between Jan. 2007 and Jan. 2014. Well production data from Enno Peters.

North Dakota / BakkenProduction

• Monthly North Dakota production statistics published by the State Regulatory Body’s web site; The North Dakota Industrial Commission’s Department of Mineral Resources: https://www.dmr.nd.gov
• Data exists from 1953, but this study focuses on unconventional production since 2005 in North Dakota (95% of current production is from the Bakken)
• Currently 12,198 producing wells with more than 900 wells awaiting completion (c. 7 months of new producers at 2014 rates)
North Dakota Industrial Commission (NDIC)Department of Mineral Resources (DMR)

North Dakota Production*ND production peaked in Dec. 2014 at 1.27M bopd has fallen back to 1.11M bopd in Feb. 2015. The blue line shows the monthly number of net of new producers (12 month average)
*95% is from the Bakken and Three Forks. 5% (presently 63K bopd) from legacy conventional pools.12 month moving average of new producers
C.Nolan May. 2015 21

North Dakota Productionand key completion milestones*
*from 2014 presentation by Torstein Hole SVP US Onshore, Statoil, United States C.Nolan May. 2015 22
45
6

C.Nolan May. 2015
23*from 2014 presentation by Torstein Hole SVP US Onshore, Statoil, United States

C.Nolan May. 2015 24
ND - average yearly decline curves* (2007 – 2014)
Advances in completion technology have led to a significant improvement in IP rates. Major
step between 2007 and 2008 when application of lateral isolation using swell packers started to be applied. Increase in EUR over first year
but minor recent changes thereafter.
*Calculated by the author and based on NDIC production data supplied by Enno Peters, based on 11,474 wells

C.Nolan May. 2015 25
North Dakota – Average 12 month EUR/Well by year*
*Calculated by the author and based on NDIC production data supplied by Enno Peters, based on 11,474 wells
Advances in completion technology have led to a significant improvement
in EUR over 12 month period (50% increase between 2008 and 2014)
C.Nolan May. 2015 26*Calculated by the author and based on NDIC production data supplied by Enno Peters, based on 11,474 wells
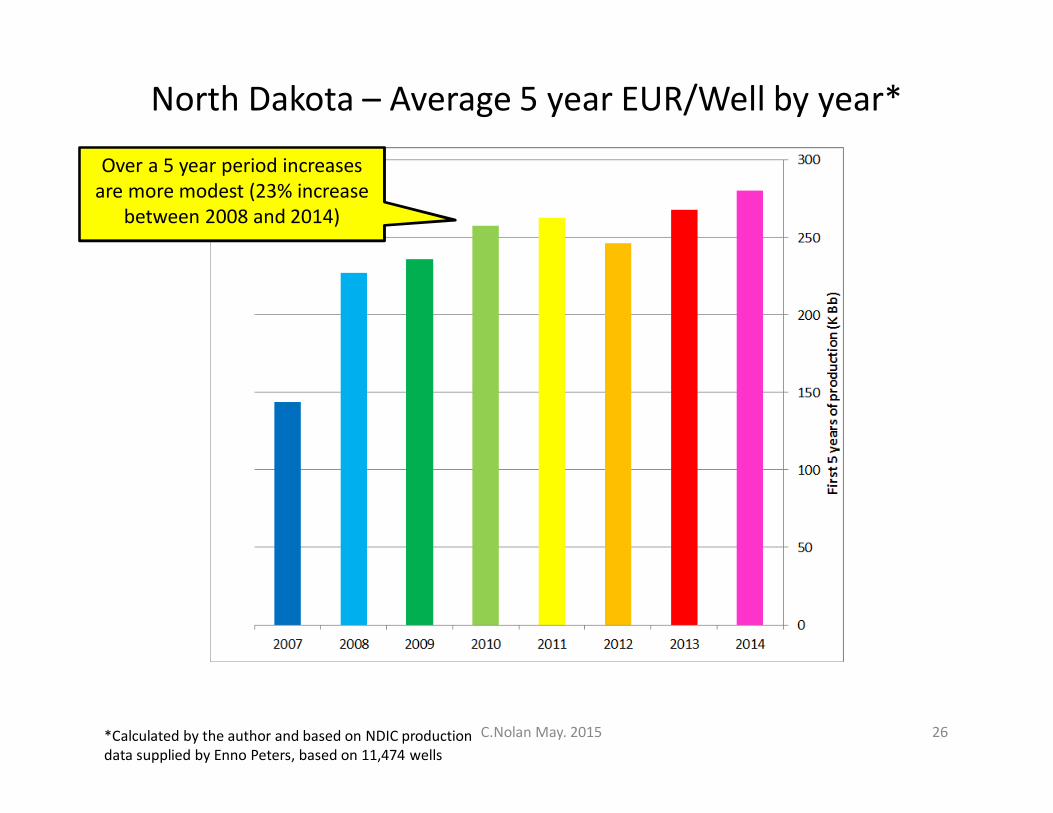
North Dakota – Average 5 year EUR/Well by year*
Over a 5 year period increases are more modest (23% increase
between 2008 and 2014)
C.Nolan May. 2015 27*Calculated by the author and based on NDIC production data supplied by Enno Peters, based on 11,474 wells
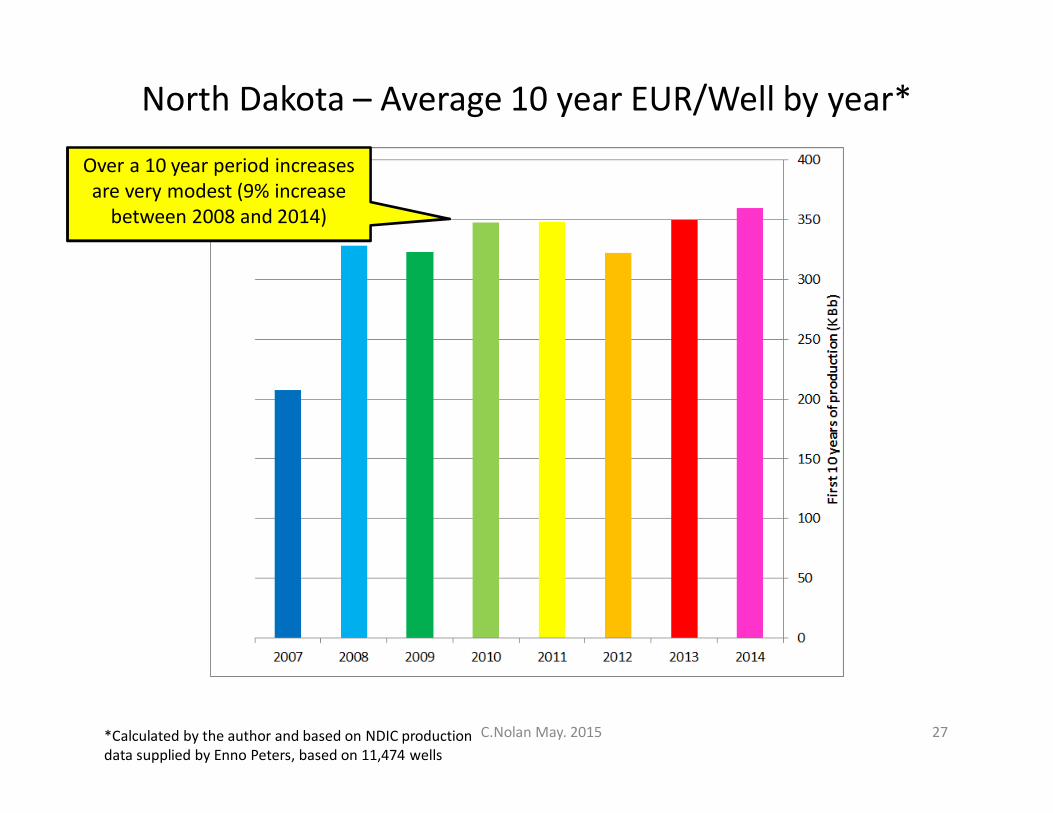
North Dakota – Average 10 year EUR/Well by year*
Over a 10 year period increases are very modest (9% increase
between 2008 and 2014)

Modelled ND Well Decline Curves
• Estimate made for missing/incomplete production data* for some of the months (0-3). Estimate is based on decline curve (iterative process)
• Decline curves based on power equation fitted to actual production data for each year (2007-2014) for 11,474 wells – see above
• Equations then used for modelled monthly production data (see slides 65-70)
*Calculated by the author and based on NDIC production data supplied by Enno Peters, based on 11,474 wells

North Dakota / BakkenProduction by Company
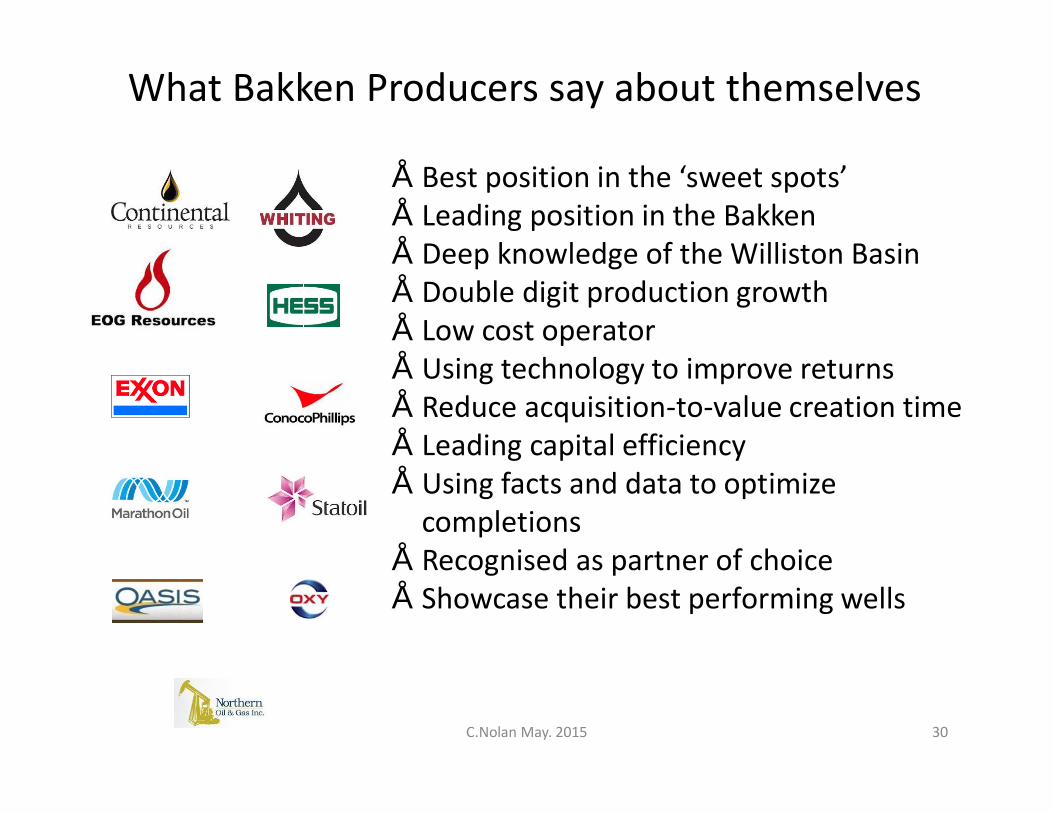
What Bakken Producers say about themselves
• Best position in the ‘sweet spots’• Leading position in the Bakken• Deep knowledge of the Williston Basin• Double digit production growth• Low cost operator• Using technology to improve returns• Reduce acquisition-to-value creation time• Leading capital efficiency• Using facts and data to optimize
completions• Recognised as partner of choice• Showcase their best performing wells
C.Nolan May. 2015 30

Top 10 Bakken Producers*
*Based on Q4 2014 production were available in the public domain. EOG, Exxon, Marathon and Conoco do not break out Bakken Production and are estimates. Smaller company production <50K BOPD not listed. Total displayed = 793K BOPD, 389K BOPD not shown.
Hard to get an accurate picture. EOG, Exxon, Marathon and Conoco do not break
out Bakken Production and these are estimates. Some include gas production as
well and quote a boe number.
C.Nolan May. 2015 31

C.Nolan May. 2015 32
Bakken as a % of total production*Oasis, Whiting, Continental and QEP have
the highest proportion of their total production in the Bakken. Hess has the
largest proportion of the mid-sized independents.
*Based on Q4 2014 production were available in the public domain. Includes Montana Bakken.

C.Nolan May. 2015 33
Dec. 2014 Operated Bakken Production*
*Total production from operated wells on a 100% basis. Estimate are based on well production data supplied by Enno Peters. Top 20 displayed. Most of the top producers have higher 100% operated production than actual working interest production.
A lot of smaller companies (producing <3000 bopd) that are often overlooked. Individually
they are small, but collectively producing 113,000 bopd. Harder to predict what the ‘others’ will do as a group going forward.

C.Nolan May. 2015 34
2013/2014 production growth for operated wells
*For operated wells on a 100% basis. Well production data supplied by Enno Peters. Top 10 displayed. Bakken all = average = 34%

C.Nolan May. 2015 35
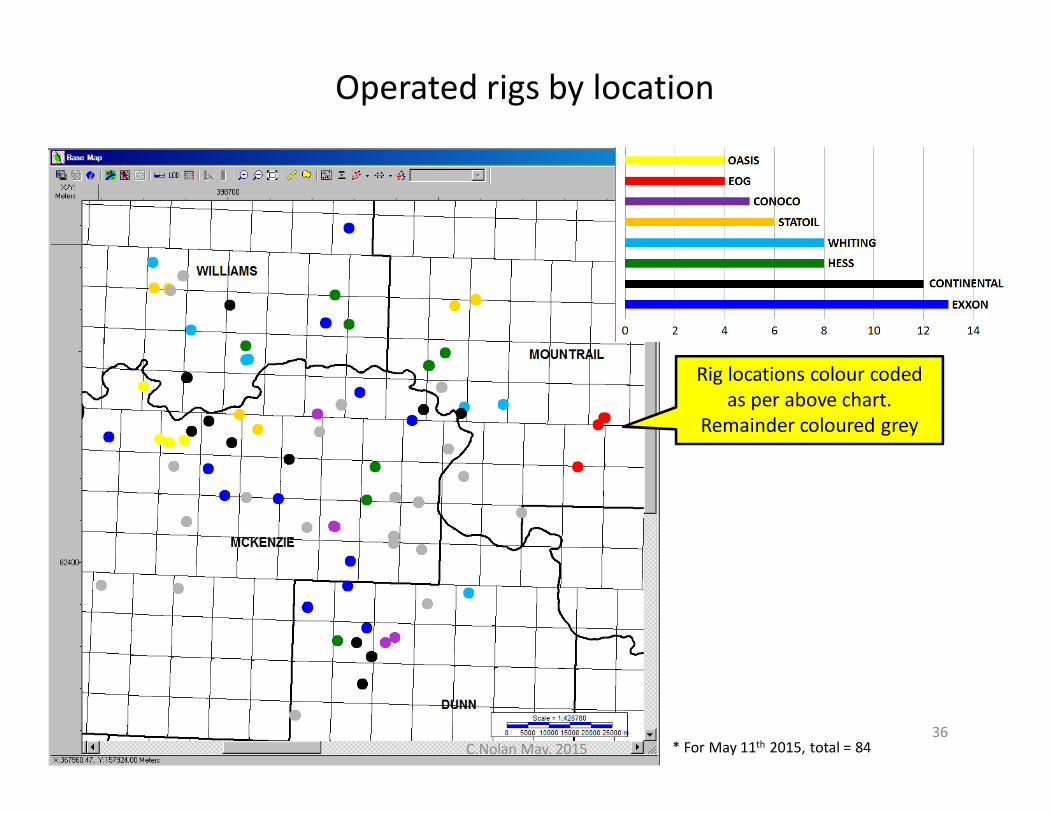
North Dakota Rig Count by Operator*
* For May 11th 2015, total = 84
Exxon and Continental currently have the most rigs operating. Are
Exxon maintaining/expanding their rig count?
C.Nolan May. 201536
Operated rigs by location
* For May 11th 2015, total = 84
Rig locations colour coded as per above chart.
Remainder coloured grey

37
Operated rigs by location with production heat map
* For May 11th 2015, total = 84
Rig locations colour coded as per above chart.
Remainder coloured grey
C.Nolan May. 2015* Average 12 months full production (bbls) between Jan. 2007 and Jan. 2014. Well production data from Enno Peters.

C.Nolan May. 2015 38
Operated Bakken Production* 2007 - 2015
*Total production from operated wells on a 100% basis. Well production data supplied by Enno Peters. Top 20 displayed. Most of the top producers have higher 100% operated production than actual working interest production.
EOG was an earlier mover in the Bakken and had early significant growth in 2007 and 2008 and again in 2013. Since then it has begun to focus on other LTO plays with further running
room and better margins.

C.Nolan May. 2015 39
Average Well Decline Curves by Company*
*For wells producing between 2007 and 2014 with 12 months of full production – hence staring in month 2. Production is for operated wells on a 100% basis. Well production data supplied by Enno Peters. Top 10 displayed. Some production data e.g. Conoco missing for months 2 and 3.
QEP, EOG and Conoco* appear to be in a ‘league of their own’ when it comes to
average production/well. Is this replicated in IRR per well? Probably a combination of
geology and completion strategy.

Company Case Study EOG

C.Nolan May. 2015 41
EOG and the Bakken
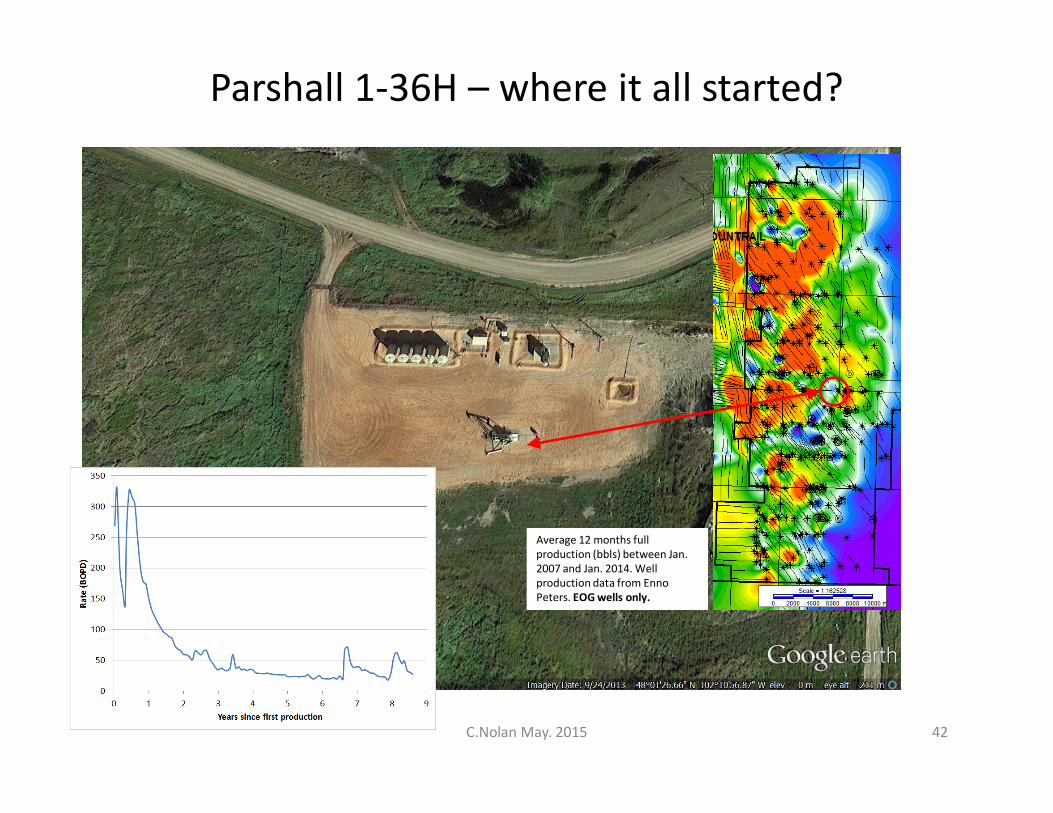
• EOG discovered the Parshallfield / part of the Bakken in 2006
• Discovery well Parshall 1-36H was one of the first horizontal wells in the middle Bakken
• Pressures were so high that it blew out once the lateral leg reached 1,200 feet into the middle member of the Bakken.
• Flowed at 463 bopd (42OAPI after simple ‘hail mary’ frac
• Subsequent appraisal wells at IP rates of up to 2000 bopd
C.Nolan May. 2015 42
Parshall 1-36H – where it all started?
Average 12 months full production (bbls) between Jan. 2007 and Jan. 2014. Well production data from Enno Peters. EOG wells only.

Parshall 1-36H
Parshall Field area
Average 12 months full production (bbls) between Jan. 2007 and Jan. 2014. Well production data from Enno Peters. EOG wells only.
Parshall 1-36H

Parshall v Sanish
Average 12 months full production (bbls) between Jan. 2007 and Jan. 2014. Well production data from Enno Peters. EOG wells only.
High 12 month rates within EOG’s Parshall. Horizontals mostly orientated NW-SE,
moderate (2000-3000’) well spacing
Average 12 months full production (bbls) between Jan. 2007 and Jan. 2014. Well production data from Enno Peters. Whiting wells only.
Moderate 12 month rates within Sanish area to the west of
Parshall field. Whiting operated horizontals mostly orientated
ENE, close (1000’ well spacing)
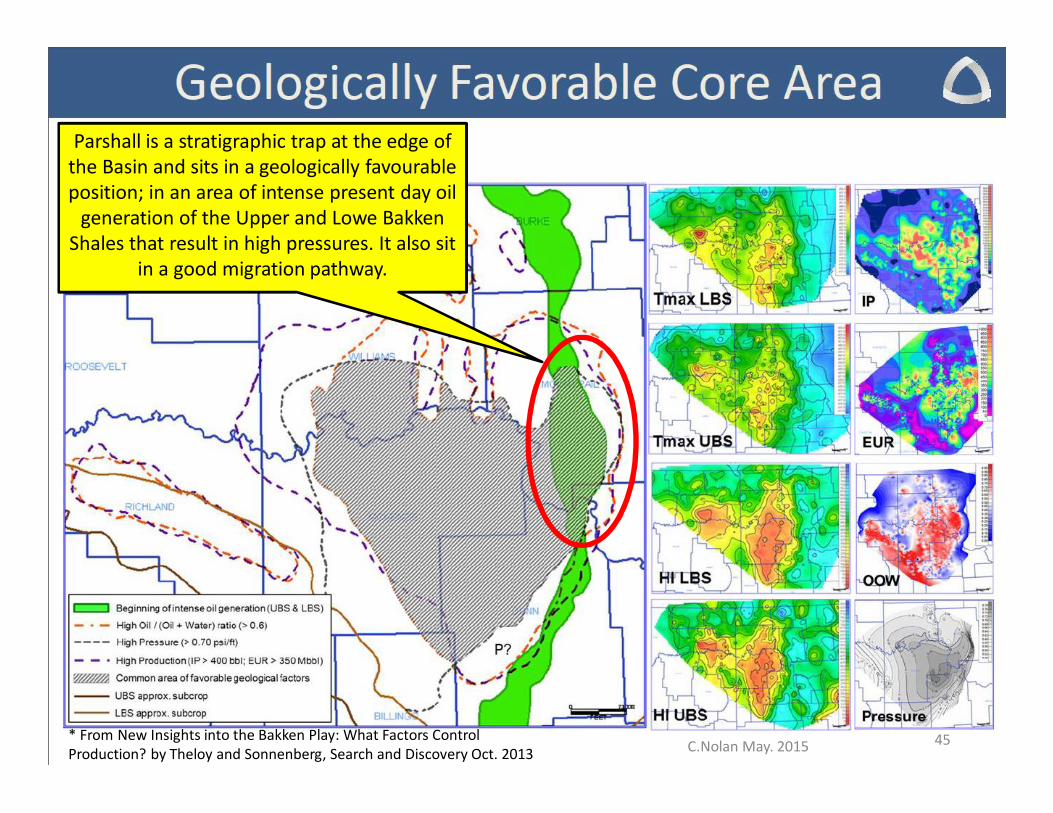
C.Nolan May. 2015 45
Parshall is a stratigraphic trap at the edge of the Basin and sits in a geologically favourable position; in an area of intense present day oil
generation of the Upper and Lowe Bakken Shales that result in high pressures. It also sit
in a good migration pathway.
* From New Insights into the Bakken Play: What Factors Control Production? by Theloy and Sonnenberg, Search and Discovery Oct. 2013

C.Nolan May. 2015 46
Parshall Field Production
Produced 104 mmbls of oil since 2006, Significant drop in production since September 2014 (75-40K bopd) with BOPD/producers also dropping. Fewer
new wells + some producers shut-in > EOG reducing investment since drop in oil price.

C.Nolan May. 2015 47
EOG’s Strategy• EOG said in February that it would pare back North Dakota production this year
and focus more on Texas, also partly born from efforts to force oilfield service companies to cut their own costs.
• EOG will complete c. 25 net new wells in 2015 (v 59 in 2014) most uncompleted wells in the highly productive Parshall Field
• “These are tremendously productive wells,” said the DMR’s Lynn Helms. EOG is “able to drill a lot of wells and maintain production and still bank a lot of wells for future price increases.”
• At the same time, EOG plans to make the Eagle Ford and Permian shale fields in Texas a core focus this year, aiming to increase the number of Permian wells this year by 53 percent.
• EOG declined to comment beyond the information provided by Lynn Helms.
Ø EOG started to divert capital from the Bakken to other higher return LTO plays back in Sept. 2014. EOG is an early mover, first in and first out?
* ND DMR Director’s Cut April 2015

North Dakota / BakkenProduction by County

North Dakota – Production by County*
Recent production growth focused in McKenzie, Mountrail,
Dunn and Williams
*Data copied from NDIC monthly reports which DOES include most recent tight wells
C.Nolan May. 2015 49

Mountrail, Dunn, Williams – Average Well Rates*
Average rates now declining/flat inMountrail, Dunn and Williams
*Data copied from NDIC monthly reports which DOES include most recent tight wells
C.Nolan May. 2015 50
Aggressive appraisal drilling of Parshall‘sweet spot’ in Mountrail in 2007-2009 results in high average producer rates

North Dakota – Average Well Rates*
Increases in McKenzieare offsetting declines in other states resulting in plateauing of overall ND
rates (black line) at 100bopd
*Data copied from NDIC monthly reports which DOES include most recent tight wells
51C.Nolan Mar. 2015C.Nolan May. 2015

North Dakota Production v New Producers
The number of net new producers (blue line) swings from month to month (for
reporting and statistical reasons) but the general trend is increasing
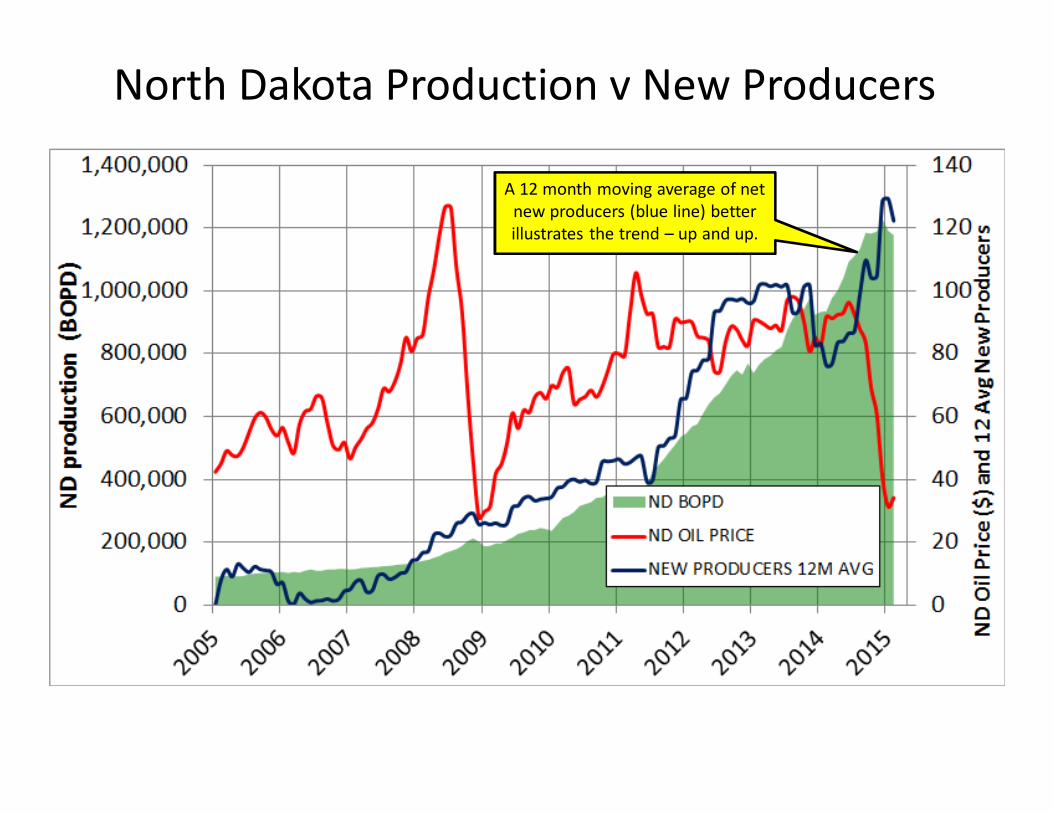
North Dakota Production v New Producers
A 12 month moving average of net new producers (blue line) better illustrates the trend – up and up.
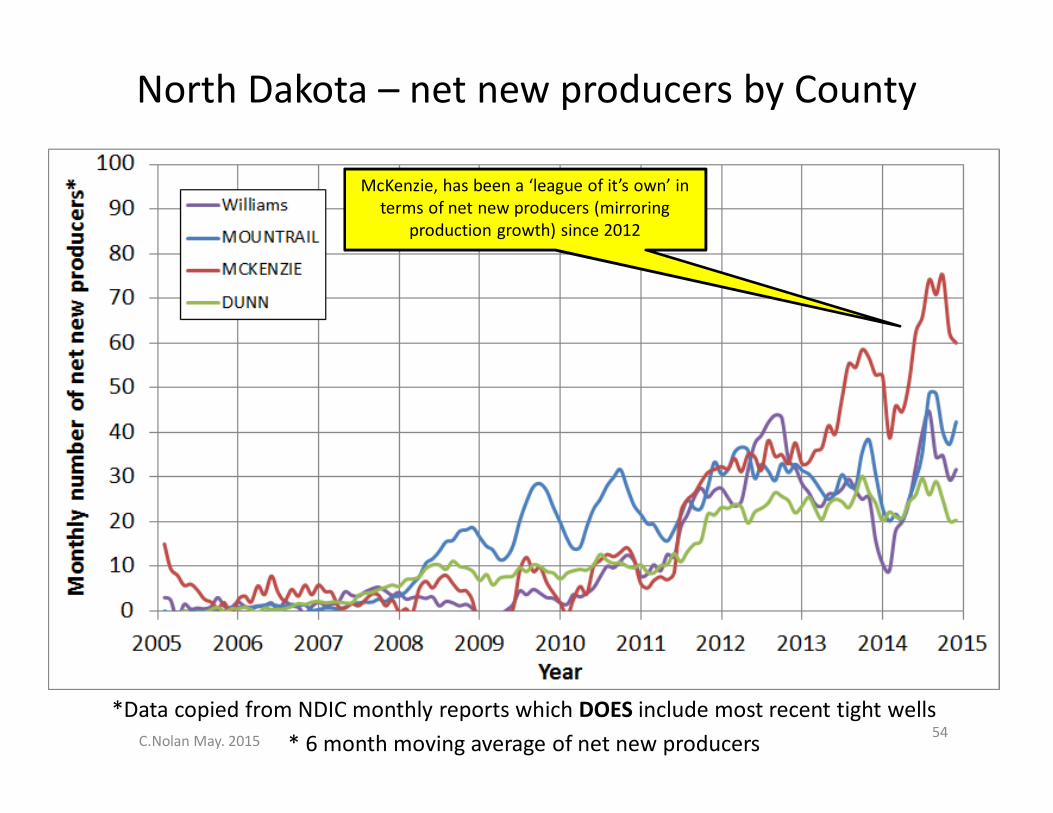
North Dakota – net new producers by County
McKenzie, has been a ‘league of it’s own’ in terms of net new producers (mirroring
production growth) since 2012
* 6 month moving average of net new producers*Data copied from NDIC monthly reports which DOES include most recent tight wells
C.Nolan May. 2015 54
North Dakota Productionand Oil Prices

2008 Collapse in Oil PricesThe 2008 financial crisis and resulting drop in oil price from $125 to $30 resulted in a
15% drop in production.
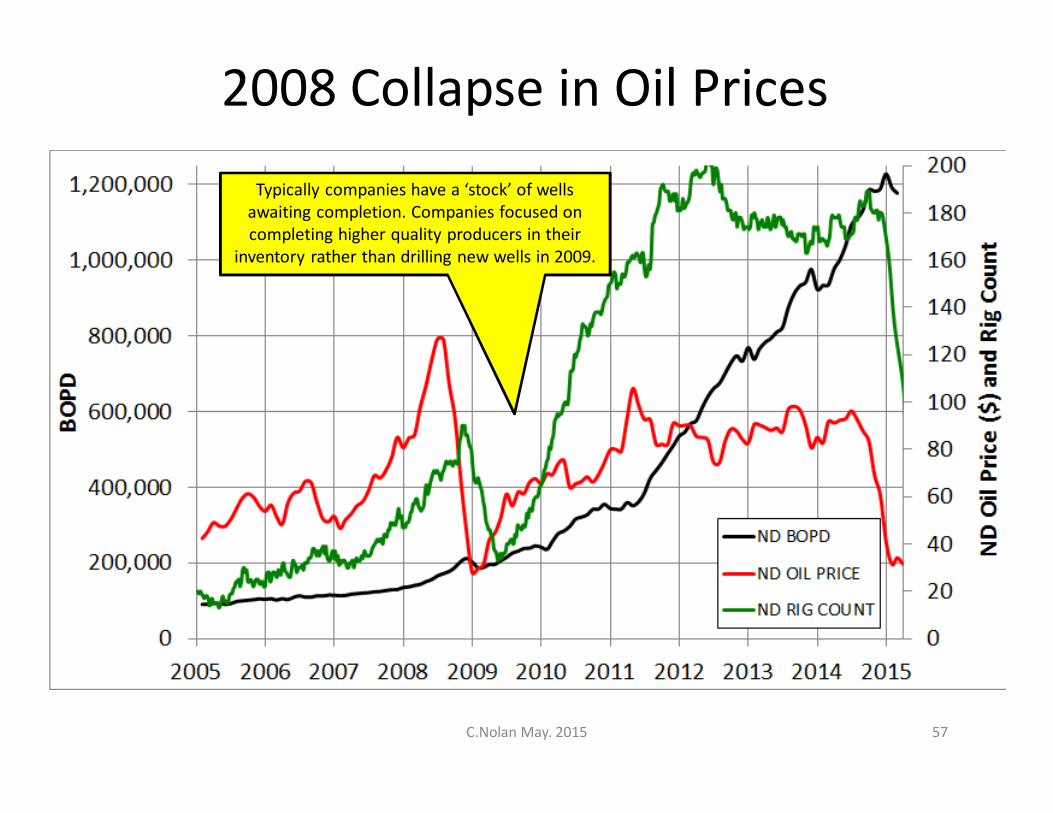
2008 Collapse in Oil PricesTypically companies have a ‘stock’ of wells
awaiting completion. Companies focused on completing higher quality producers in their
inventory rather than drilling new wells in 2009.
C.Nolan May. 2015 57

2014 ND v WTI Oil Prices
North Dakota Sweet Crude currently trading at $17 discount to WTI
C.Nolan May. 201558

Cost & Capital - Bakken Study
http://www.costandcapital.com/news/107-new-report-bakken-stress-test.htmlC.Nolan May. 2015
59
C.Nolan May. 2015
60
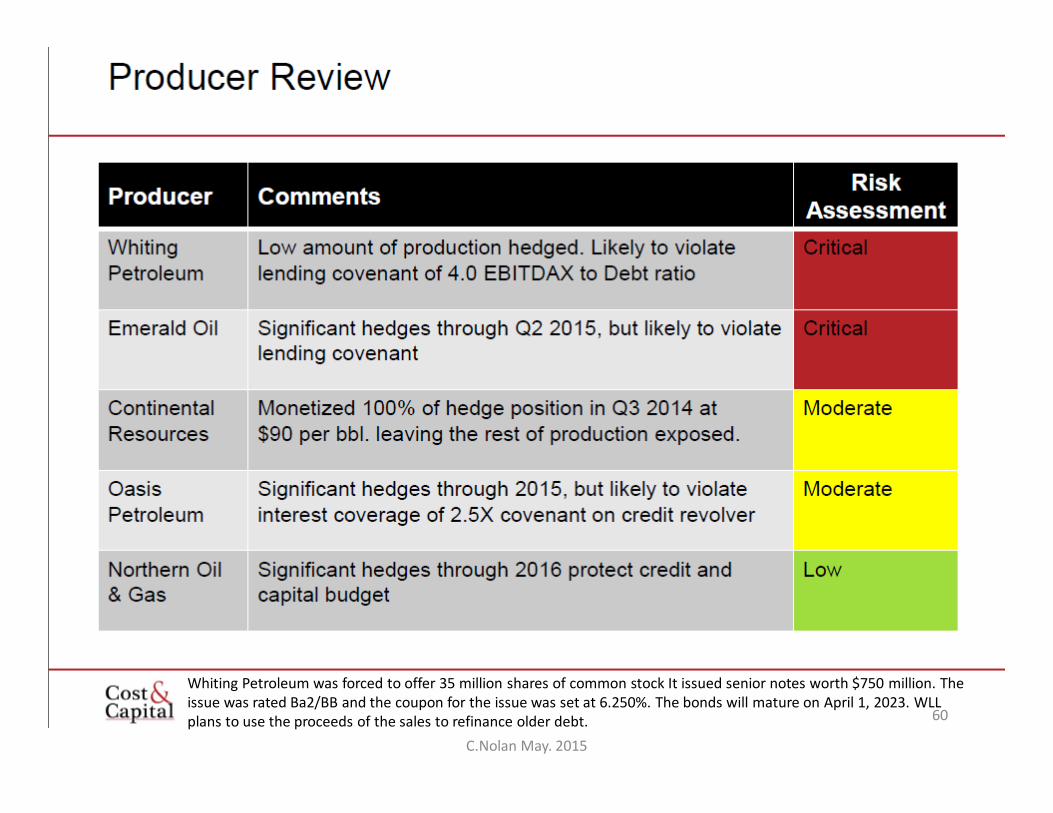
Whiting Petroleum was forced to offer 35 million shares of common stock It issued senior notes worth $750 million. The issue was rated Ba2/BB and the coupon for the issue was set at 6.250%. The bonds will mature on April 1, 2023. WLL plans to use the proceeds of the sales to refinance older debt.
C.Nolan May. 2015 61

Analysis by Cost & Capital Partners LLChttp://www.thebakken.com/articles/978/assessment-reveals-potential-risk-for-some-in-bakken
• Cost & Capital Partners LLC, a management consulting firm, analysed 5 Bakken “pure play producers” that have more than 90% of their total production coming out of the Bakken’ Continental Resources, Whiting Petroleum, Emerald Oil, Oasis Petroleum and Northern Oil & Gas.
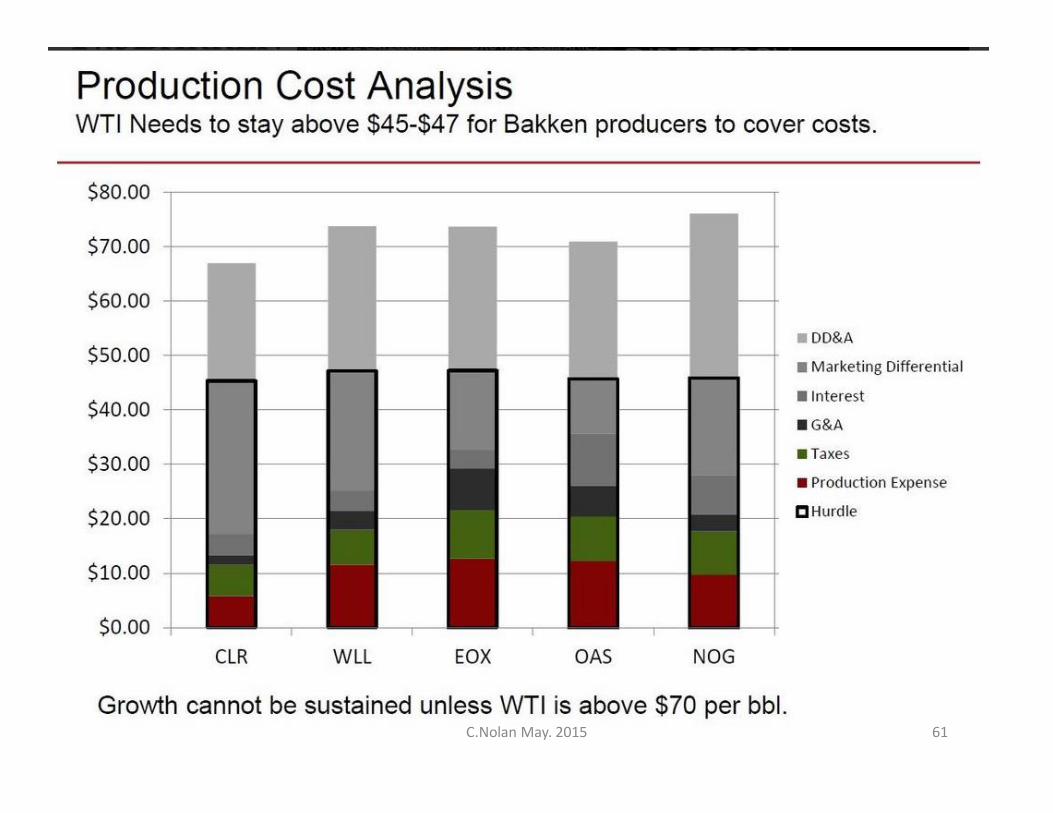
• WTI crude price must stay above $45 to $47 for Bakken producers to cover costs, and growth can’t be sustained unless WTI is above $70 per barrel.
C.Nolan May. 2015 62

• On April 29th ND Governor Jack Dalrymple approved a sweeping reorganization of its oil tax code, cutting the overall rate and ending a tax break of more than $5 billion poised to hit in June
• Reduces the oil extraction tax to 5 percent from 6.5 percent starting Jan. 1.
• The bill does not alter North Dakota's 5 percent gross production tax, a type of property tax on the value of an extracted mineral. The oil extraction tax is a levy on the industry itself.
• Effectively, the North Dakota oil tax rate will fall to 10 percent, with the potential for it to hit 11 percent only if oil prices average above that $90 per barrel for three consecutive months.
• Many had expected the "large trigger" tax break to hit in June, but given the recent rise in oil prices, it is no longer a foregone conclusion. Even if it were to take effect, it would offer mere months of tax savings to oil producers, several of whom state the "large trigger" factors little into their budgets.
Recent Bakken Tax Incentives for Oil Producers
C.Nolan May. 2015 63

C.Nolan May. 2015 64
Davy Research – LTO Study March 2015
Sourcing capital is vital to meet drilling expendituresThe most important question may not be so much what the breakeven cost of unconventional producers in the US might be (although this is clearly important, especially in the context of low prices) but rather what the impact on the provision of future capital is. This question is all the more relevant because the negative free cash flow demonstrated by the aggregate group is based on periods with far better oil prices ($100-plus) than are currently being realised. Current oil prices will make this situation far worse, and the only option open to industry is to cut capital expenditure.
The danger for the LTO industry here is that a spiral may develop. Weaker oil prices will de facto reduce cash flow which may affect debt provision. This will affect physical production and accentuate the decline in revenues. That in turn makes it less attractive as a borrowing proposition and the cycle continues.
The presence of hedge contracts will shield oil producers from the worst effects of the reduction in prices for a short time. In terms of the US unconventional industry, there are no hard data as to what the level of protection might be but we suspect it will begin to peter out in the second half of the year.
Elsewhere in this report, we outline one of the challenges facing the industry at present as the financial funding of the process in an environment that has not seen a single year of free cash flow from the industry even during periods of high oil prices. We think this probably means that a higher price is demanded for longer to make investment returns more ostensibly attractive. This guides our belief that while a wellhead netback at $80 per barrel (the equivalent of $90 for international pricing), with controlled operating costs and lower capital per barrel numbers produces returns well in excess of 15%, this is probably required.
https://www.davy.ie/research/emailHtm/article.htm?id=oil20150302_27022015.htm&uid=94ec7946-a20e-4efa-8334-304cf2a65b53&docRef=b0e79c86-f227-4ab0-b6f8-d41a2da83758&jobRef=fad21bd0-a771-40f6-bb34-e66f21f11c0b

Future Production Scenarios

North Dakota Production Model – this study
• ND production data since 2005• Each months new production is modelled with a
decline curve based on a monthly average IP value and a power law function (see slide 25)
• Future production modelled on the following; inputs (shown in red on the table on the left);
1. Number of new producers per months2. The change of the number of new producers3. Average well IP rate4. The change in the IP rate5. Fraction of future production not shut-in
66C.Nolan May. 2015

North Dakota Production – possible outcomes in 2015
• The number of new completions in North Dakota dropped to 63 in January and 43 in February 2015
• The updated model* in this study suggests 119 new producers/month are required for 2015 to maintain North Dakota YE 2015 production at 2014 levels i.e. 1.23M bopd – this is comparable to NDIC estimate (see slide 71)
• Assuming no new completions / producers for the remainder of 2015 then North Dakota production would decline by 43% by 2015 YE to 0.92M BOPD
• Assuming the number of new completions stays at 52/month (i.e. Jan/Feb levels) for the remainder of 2015 then, North Dakota 2015 YE production would decline by 27% to 0.90M BOPD
67C.Nolan May. 2015
* With feedback from Rube Likvern and Enno Peters. By comparison Rune Likvern predicts a 16% decline in 2015 YE Bakken/Three Forks production if 52/producers month are added and 28% if no producers are added.

68
March 2015 onwards - 52 new producers/month
This study suggests an average of 52 new producers/month from now on (current levels) would result in a 27% drop in North Dakota YE production.

69
2015 – Average of 119 new producers/month
This study suggests an average of 119 new producers/month required to
maintain 2015 YE production at same level as 2014 i.e. 33% less producers.

70
March 2015 onwards - 0 new producers/month
This study suggests zero producers from now on would result in a 43%
reduction in 2015 YE production.

The NDIC Director’s Cut – April 2015
From the Director’s Cut (Director of NDIC – Lynn Helms) on 14/04/15
Today’s rig count is 91 (lowest since January 2010)(all-time high was 218 on 5/29/2012)The statewide rig count is down 58% from the high and in the five most active counties
The drilling rig count dropped 27 from January to February, 25 more from February toMarch, and has since fallen 17 more from March to today. The number of wellcompletions dropped from 63(final) in January to 42(preliminary) in February. Oil priceis by far the biggest driver behind the slow-down, with operators reporting postponedcompletion work to avoid high initial oil production at very low prices and to achieveNDIC gas capture goals.
The total net number of net new producers increased by 1 in February. That means 62 wells have been shut-in.
At the end of February there were an estimated 900 wells waiting on completionServices1, an increase of 75. Comparing December, January, and February completionsand production increases results in a requirement of 110-120 completions per month tomaintain production near 1.2 million barrels per day.
C.Nolan May. 2015 71
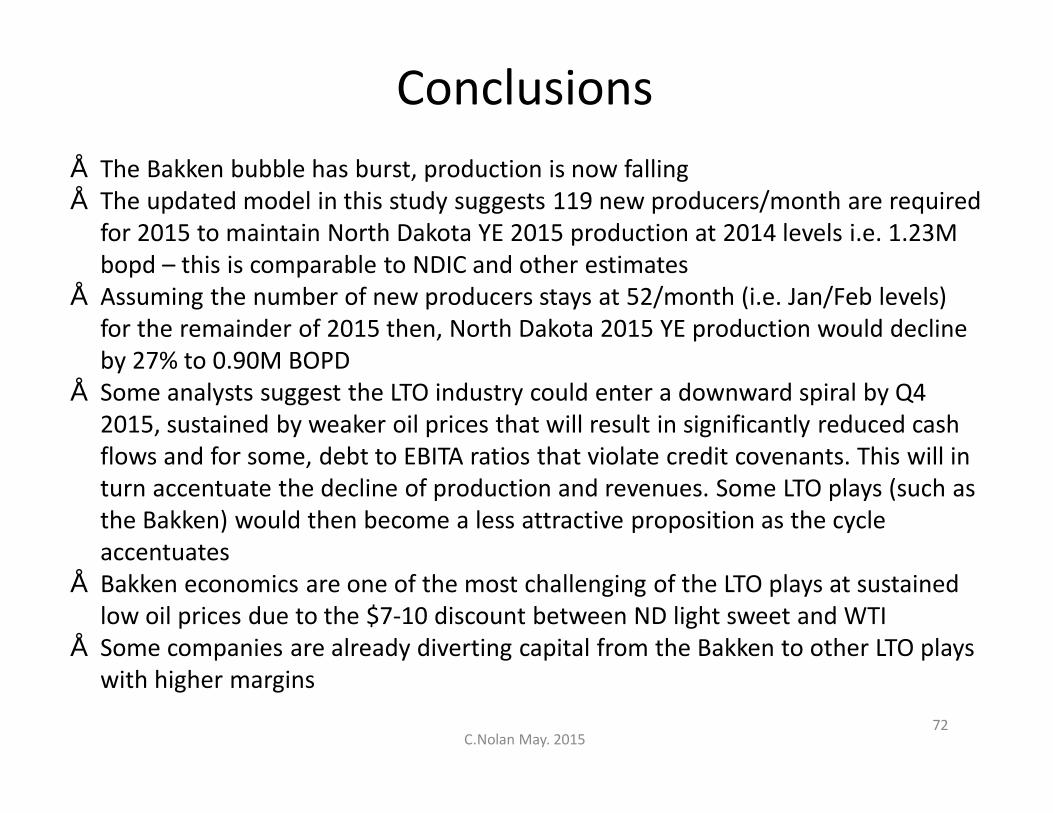
Conclusions• The Bakken bubble has burst, production is now falling• The updated model in this study suggests 119 new producers/month are required
for 2015 to maintain North Dakota YE 2015 production at 2014 levels i.e. 1.23M bopd – this is comparable to NDIC and other estimates
• Assuming the number of new producers stays at 52/month (i.e. Jan/Feb levels) for the remainder of 2015 then, North Dakota 2015 YE production would decline by 27% to 0.90M BOPD
• Some analysts suggest the LTO industry could enter a downward spiral by Q4 2015, sustained by weaker oil prices that will result in significantly reduced cash flows and for some, debt to EBITA ratios that violate credit covenants. This will in turn accentuate the decline of production and revenues. Some LTO plays (such as the Bakken) would then become a less attractive proposition as the cycle accentuates
• Bakken economics are one of the most challenging of the LTO plays at sustained low oil prices due to the $7-10 discount between ND light sweet and WTI
• Some companies are already diverting capital from the Bakken to other LTO plays with higher margins
72C.Nolan May. 2015
