baker river relicensing project elk habitat mapping … river relicensing project elk habitat...
TRANSCRIPT

Baker River Relicensing Project
Elk Habitat Mapping Study
Final Report
Relicense Study T21
FERC PROJECT NO. 2150
Prepared By: Ronald Tressler
EDAW, Inc. 815 Western Ave., Suite 300
Seattle, WA 98104 Phone: (206) 267-7741
Ron Davis University of Illinois
Prepared For: Puget Sound Energy
Baker River Project Relicense Wildlife and Terrestrial Resources Working Group
31 December 2003
Unpublished Work © 2003 Puget Sound Energy, Inc.

TABLE OF CONTENTS
Page
INTRODUCTION........................................................................................................... 1
STUDY AREA ............................................................................................................... 1
METHODS .................................................................................................................... 4
RESULTS...................................................................................................................... 9
DISCUSSION.............................................................................................................. 24
REFERENCES............................................................................................................ 25
APPENDICES
Appendix A – Baker Lake Re-Licensing: Elk Forage Mapping Study (NCASI)
T21 Final Study Report; 31 December 2003 Page i
Unpublished Work © 2003; Puget Sound Energy, Inc.

LIST OF TABLES
Page
Table 1. Buffer distances used for assessing human disturbance impacts on elk in the Baker River Hydroelectric T21 study area. ................... 8 Table 2. Number of sampled sites (N), estimated forage (kg/ha), estimated
digestibility (%), forage value ranking, and scaled index (0 to 1) of forage value ranking for habitat classes based on forest zone and canopy cover (%) class ......................................................................... 10
Table 3. Acreage of elk forage habitat by ownership category in the T21 study area.12 Table 4. Acreage of elk forage habitat by seasonal range in the T21 study area....... 12 Table 5. Acreage of elk habitat within early-season (winter-spring) roads
and trails buffers by seasonal range and ownership. ................................... 15 Table 6. Acreage of elk habitat within late-season (summer-fall) road and
trail buffers by seasonal range and ownership............................................. 17 Table 7. Acreage of elk habitat in developed recreation buffers by seasonal
range and ownership.................................................................................... 20 Table 8. Acreage of elk habitat in dispersed recreation site buffers by
seasonal range and ownership .................................................................... 22 Table 9. Acreage of elk habitat in buffers around proposed new trails by
seasonal range and ownership .................................................................... 23
T21 Final Study Report; 31 December 2003 Page ii
Unpublished Work © 2003; Puget Sound Energy, Inc.

LIST OF FIGURES
Page
Figure 1. T21 Elk habitat study area ............................................................................. 2
Figure 2. Land ownership status in the Baker River T21 Study Area ............................ 3
Figure 3. Elk forage habitat ranking in the Baker River T21 study area ...................... 11
Figure 4. Elk ranges in the Baker River T21 study area.............................................. 14
Figure 5. Buffer areas affected by early season (winter-spring) roads and trails in the Baker River T21 study area ................................................ 16
Figure 6. Buffer areas affected by late season (summer-fall) roads and trails in the Baker River T21 study area ................................................ 19
Figure 7. Buffer areas affected by existing campgrounds, dispersed recreation sites, and proposed trails in the Baker River T21 study area .................................................................................................... 21
T21 Final Study Report; 31 December 2003 Page iii
Unpublished Work © 2003; Puget Sound Energy, Inc.

ACRONYMS & ABBREVIATIONS
ABAM Pacific silver fir
BLM Bureau of Land Management
BSA bovine serum albumin
CI Confidence Interval
FERC Federal Energy Regulatory Commission
GIS geographic information system
IVMP Interagency Vegetation Mapping Project
NCASI National Council for Air and Stream Improvement
NWIFC Northwest Indian Fisheries Commission
NWI National Wetlands Inventory
PSE Puget Sound Energy
TRWG Terrestrial Resources Working Group
TSHE western hemlock
TSME mountain hemlock
UIUC University of Illinois at Urbana-Champaign
USFS U.S. Forest Service
USGS U.S. Geological Survey
WDNR Washington Department of Natural Resources
T21 Final Study Report; 31 December 2003 Page iv
Unpublished Work © 2003; Puget Sound Energy, Inc.

INTRODUCTION
Puget Sound Energy (PSE) and other interested parties are currently participating in the collaborative development of an application for the relicense of the Baker River Project (Federal Energy Regulatory Commission [FERC] Project No. 2150). The collaborating parties have formed several working groups to address the environmental effects of the new license. One of these groups, the Terrestrial Resources Working Group (TRWG), commissioned a study examining the relationship between elk forage habitat and recreational sites, roads, and trails in the vicinity of the Project (i.e., Lake Shannon and Baker Lake). This report presents the results of that study.
The goal of this study was to provide site-specific information on elk habitat quality in the vicinity of the Project under both current and future conditions. The TRWG can use the results of this study to develop protection, mitigation, and enhancement measures that are consistent with the elk management activities being implemented in the Baker River/Nooksack River area by governmental and tribal biologists.
This study relies heavily on research conducted by Ron Davis of the University of Illinois and biologists with the National Council for Air and Stream Improvement (NCASI) and U.S. Geological Survey (USGS) (Davis et al. 2003).
STUDY AREA
The Baker River elk study area was selected by the TRWG to encompass the area that is typically used by the elk herd near the Baker River Project. Based on previous telemetry studies, this was defined as the Baker River watershed from Highway 20 north to the Swift Creek watershed on the west side of the Baker River, as well as the Grandy Lake/Creek watershed to Highway 20 (Figure 1). The habitat modeling used in this study was developed in the adjacent South Fork Nooksack River drainage by NCASI (see Appendix A) (Figure 1). More than 70 percent of the 91,441 ac (37,005 ha) T21 study area is federally owned; the remainder is a combination of state, county, and private ownership (Figure 2).
T21 Final Study Report; 31 December 2003 Page 1
Unpublished Work © 2003; Puget Sound Energy, Inc.

Placeholder for
Figure 1. T21 Study Area
T21 Final Study Report; 31 December 2003 Page 2
Unpublished Work © 2003; Puget Sound Energy, Inc.

Placeholder for
Figure 2. T21 Ownership
T21 Final Study Report; 31 December 2003 Page 3
Unpublished Work © 2003; Puget Sound Energy, Inc.

METHODS
This study involved using Geographic Information System (GIS) habitat modeling developed by NCASI along with GIS data of vegetation, roads, trails, and recreation sites in the Baker River T21 study area to characterize existing elk forage habitat resources and the potential effects of human activities on elk use of these habitats. The TRWG agreed that this study should rely on the NCASI elk forage model because the new elk habitat information being developed will likely be utilized in the future for elk management decisions in the entire Baker/Nooksack elk herd area. The following sections describe: (1) field data collection and elk forage habitat modeling completed by NCASI, and (2) the interpretation and analysis of the elk forage habitat model results and the implication of human activity areas in the T21 study area. Appendix A provides more detailed descriptions of methods used by NCASI.
Field Data Collection and Forage Habitat Modeling
To develop a GIS-based elk forage habitat model, NCASI researchers are currently working on studies aimed at linking habitat to performance of elk herds (Cook et al. 2001). This approach is based on the knowledge that nutrition is a primary factor capable of influencing reproduction and survival rates in an elk herd. This work provides for the first time a basis to reliably rank elk forage based on its nutrient content, particularly digestible energy content, in the context of supporting lactating cow elk and their calves during the summer-autumn period. In coastal and lower-elevation Cascade Mountain habitats of the Northwest, where winters typically are mild, nutrition in summer may be at least as important as nutrition in winter in affecting productivity of elk herds.
The goal of the habitat modeling being conducted by NCASI is to develop a ranking system of forage conditions related to digestible energy needs of lactating cow elk and their calves during summer and autumn, and to integrate this system into GIS to map areas of varying nutritional value across the landscape. The following sections summarize the field data collection and analysis methods utilized in the NCASI study.
Elk Forage Habitat Data Collection
During summer/fall of 2002, NCASI researchers collected forage quality and quantity data from 132 stands in the Nooksack watershed. Sites were sampled randomly in respect to seasonal period, from 1 June through 1 November, such that the analysis included a seasonal effect to help predict forage quality and quantity changes from late spring through mid-autumn. Sampling sites spanned the lowest elevations in the Nooksack basin (about 700 feet) to about 4,500 feet, and included stand ages from 1 year to about 400 years old. Sampling focused on upland conifer habitats and hardwood riparian/river terraces and were proportioned approximately equally among early, mid-, and moderately late successional stages. No data were collected in non-forested hydric and mesic meadow communities, primarily because these communities were very rare in the study area.
The basic sampling unit was a 30 m by 50 m rectangle. In each rectangle, five transects were spaced systematically perpendicular to the long axis of the rectangle. In two, 2-m2 circular plots along each transect (a total of 20 m2 per site) were clipped to estimate potential forage biomass, and used for measuring the following forest overstory characteristics.
T21 Final Study Report; 31 December 2003 Page 4
Unpublished Work © 2003; Puget Sound Energy, Inc.

(1) Forest canopy measures such as leaf-area index determined using ground-based digital photographs of the canopy and calculated using the Hemiview software system;
(2) Forest overstory canopy cover measured using the Moosehorn sighting instrument (Cook et al. 1996);
(3) Height, diameter at breast height (dbh), density, and species composition of trees comprising the forest overstory; and
(4) Slope, aspect, slope position, slope character (e.g., convex, concave, etc.), and elevation.
Forage data collected at the sites included dry biomass of each plant taxa and forage quality of the following plant taxa groups: grasses, forbs, deciduous shrubs, evergreen shrubs, forest ferns, and bracken fern. In all, approximately 20,000 vegetation biomass samples were collected in the South Fork Nooksack drainage. Lab assays were conducted to determine digestible energy content based on detergent fiber analysis with bovine serum albumin binding to account for tannin effects (Robbins et al. 1987a and b).
For each sampling site, existing GIS layers and forest management files obtained from Crown Pacific Corporation, the Washington Department of Natural Resources (WDNR), and U.S. Forest Service (USFS) were used to describe additional environmental characteristics including estimates of time since last overstory stand removal (e.g., logging, stand-replacement fire), extent and timing of thinning, planting history, and herbicide and fertilizer application history.
Elk Forage Values
The value of various habitats to foraging elk was based on captive elk monitored in late spring 2002. Within the Nooksack basin, pens were located across a variety of habitats representing a wide gradient of elevation and seral stages. A total of 33 sites were sampled across the elevation gradients from late June through late October. Four cow:calf pairs were monitored in each pen to determine forage selection patterns, dietary quality, and dry-matter and nutrient (digestible energy) intake rates using standard bite-count methodology (Wickstrom et al. 1984, Canon et al. 1987, Collins and Urness 1983, Parker et al. 1999). Composite simulated diet samples were collected and analyzed for digestible protein and digestible energy content, bovine serum albumin (BSA) tannin analysis to assess tannin astringency, and kjeldhal techniques for crude protein as described by Robbins et al. (1987a,b). Using the fiber analysis results, an approximate digestibility level (a measure of digestible energy content) of the samples was calculated.
To estimate forage preferences, Ivlev’s selectivity index (Manly et al. 1993) was calculated based on estimates of plant composition in elk diets and estimates of plant composition available to the elk. The index ranges from –1 (avoided) to +1 (selected), with 0 representing use of a plant taxa equal to its availability. This index was calculated for each plant taxa in each pen, whether consumed or not. NCASI researchers calculated the average index and 90% lower and upper confidence intervals (CIs) using each pen as a replicate (one data value for each pen, averaged across the four elk in the pen, to avoid pseudoreplication). Plant taxa with indices averaging >0 and with a lower CI >0 were ranked as “selected” species; taxa with indices averaging <0 and with an upper CI <0 were ranked as “avoided” species; and taxa with indices averaging either above or below 0 and with CIs including zero were ranked as “neutral”
T21 Final Study Report; 31 December 2003 Page 5
Unpublished Work © 2003; Puget Sound Energy, Inc.

species. This analysis was conducted across all pens, without stratification by elevation or seral stage. Appendix A, Table 1 lists the selected, avoided, and neutral plant species.
There was no appreciable relationship between dry matter intake rate and the amount of biomass of all plant taxa combined, biomass of either neutral or selected plant taxa, the combination of neutral and selected taxa, or abundance of various individual forage species. This lack of significant correlation probably should be expected in many natural plant communities that contain a complex mix of shrubs, forbs, and graminoid species (Spalinger and Hobbs 1992). Therefore, analysis focused on relationships between biomass of the three forage groups (avoided, neutral, and selected) and dietary quality (i.e., digestibility) of the elk forage in the pens. Non-linear regression techniques were used to model this relation and to predict dietary digestibility based on forage characteristics in the plant community. The predicted digestibility estimates were scaled into an index ranging between 0 and 1 (0 = no value, 1 = excellent forage) using the following equation:
index = 1 - ((maxpdig - pdig) / maxpdig - 50) where,
maxpdig = maximum predicted dietary digestibility of the prediction equation,
pdig = predicted digestibility for the habitat category, and
50 = digestibility at which forage is virtually worthless for lactating cows and calves.
Predicted digestibility levels of elk diets were apportioned into four possible categories that relate to performance of lactating cows, their calves, and yearlings during summer-autumn as defined by Cook et al. (in press):
• Excellent – dietary quality of at least 64% digestibility. • Good – diets ranging from 60 to 64% digestibility. • Marginal – diets ranging from 54 to 60% digestibility. • Poor – diets below 54% digestibility. • No habitat
Habitat Modeling
NCASI developed habitat categories from existing GIS coverages representing forest zones and percent overstory canopy cover. The forest zone coverage was developed in 1994 and updated in 1999 by the USFS Mt. Baker Ranger District and represents a model developed to predict major forest zones in the Mt. Baker-Snoqualmie National Forest using field sampling and various GIS layers (aspect, elevation, ecozones, topographic moisture, and cold air drainage). Coverages for broadleaf and conifer canopy cover were developed from 1996 satellite imagery by the U.S. Bureau of Land Management (BLM) and USFS for their Interagency Vegetation Mapping Project (IVMP). The IVMP coverages were derived from 1996 Landsat satellite imagery with an 82-ft (25-m) pixel size. The IVMP mapping defines areas based on percent canopy cover in 10% interval classes for both broadleaf and conifer species. The IVMP data were updated and refined by overlaying the T15 vegetation mapping study results (PSE Unpublished) that delineated all forested and non-forested cover types throughout most of the T21 study area (only the extreme southwest corner of the study area was not included in the T15 mapping). The T15 vegetation mapping also incorporated wetlands documented from National Wetland Inventory (NWI) and field verification.
T21 Final Study Report; 31 December 2003 Page 6
Unpublished Work © 2003; Puget Sound Energy, Inc.

NCASI assigned each of their vegetation sampling sites to one of 14 corresponding habitat categories that represent a combination of forest zone, forest type (broadleaf vs. conifer), and percent canopy cover to represent understory vegetative conditions in each type. NCASI data adequately represented five conifer canopy cover classes (20% intervals) and one broadleaf class (80-100% canopy cover) in the western hemlock (TSHE) and Pacific silver fir (ABAM) forest zones. The understory vegetation characteristics of each habitat category were then used as a basis to predict the nutritive value of the habitat category for foraging elk.
Analyze Elk Movement Data
To identify the areas most often used by the elk herd near the Project during different seasons of the year, existing radio telemetry data obtained from the USFS, NCASI (Lou Bender), the Northwest Indian Fisheries Commission (NWIFC), and the Baker Lake Administrative Elk Study (Farrow 1995) were summarized. The 2,400-ft (731-m) elevation was used to define the upper limit of summer and transitional habitat (Farrow 1995). GIS was then used to display the elk telemetry data and to define areas most consistently used in the winter, summer, and transitional periods.
Effects of Human Activity Areas on Elk Forage Habitat Quality
To identify areas where roads, recreational trails, developed recreational facilities, and dispersed recreation sites have the potential to discount elk foraging habitat quality due to human activity, GIS was used to overlay “disturbance buffers” on the elk forage habitat mapping. The buffer distances were based on a review of existing literature (Table 1). The first step in this analysis was to review, update (where necessary), and merge the various existing GIS coverages with trails, roads, and recreation site locations. Existing data from the USFS, Crown Pacific Corporation, WDNR, and Baker River recreation studies were used to identify when each facility, road, or trail is open to public use.
T21 Final Study Report; 31 December 2003 Page 7
Unpublished Work © 2003; Puget Sound Energy, Inc.
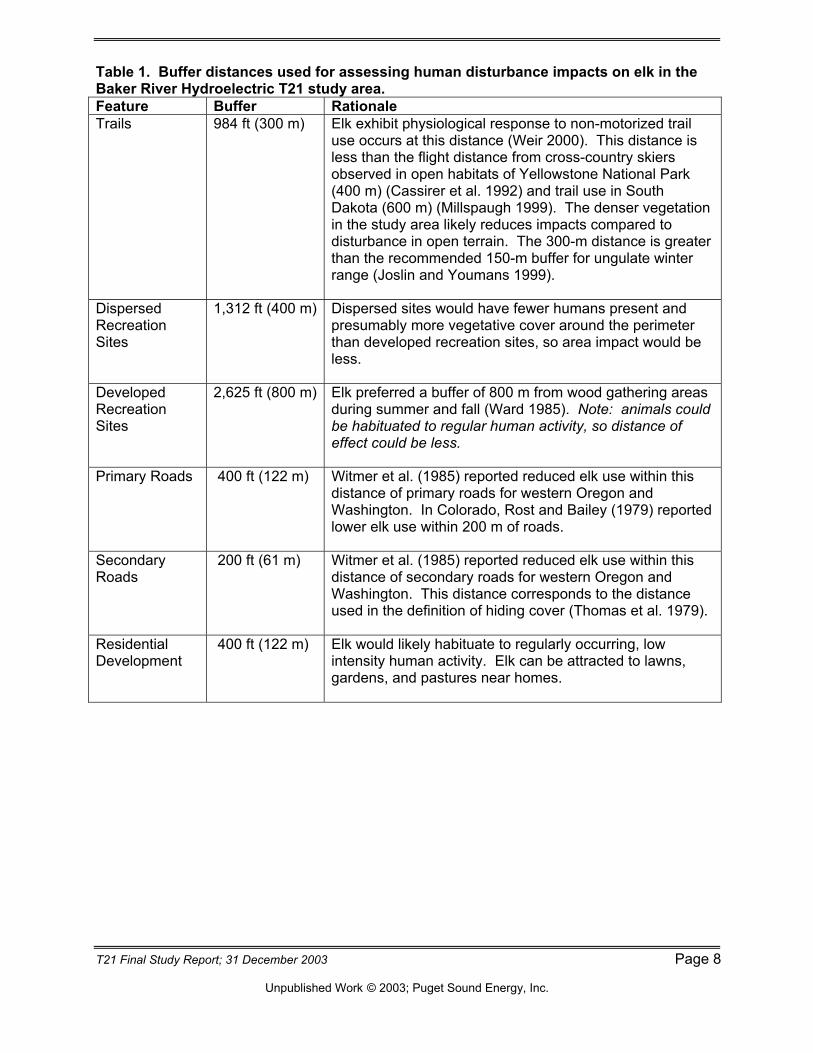
Table 1. Buffer distances used for assessing human disturbance impacts on elk in the Baker River Hydroelectric T21 study area. Feature Buffer Rationale Trails 984 ft (300 m) Elk exhibit physiological response to non-motorized trail
use occurs at this distance (Weir 2000). This distance is less than the flight distance from cross-country skiers observed in open habitats of Yellowstone National Park (400 m) (Cassirer et al. 1992) and trail use in South Dakota (600 m) (Millspaugh 1999). The denser vegetation in the study area likely reduces impacts compared to disturbance in open terrain. The 300-m distance is greater than the recommended 150-m buffer for ungulate winter range (Joslin and Youmans 1999).
Dispersed Recreation Sites
1,312 ft (400 m) Dispersed sites would have fewer humans present and presumably more vegetative cover around the perimeter than developed recreation sites, so area impact would be less.
Developed Recreation Sites
2,625 ft (800 m) Elk preferred a buffer of 800 m from wood gathering areas during summer and fall (Ward 1985). Note: animals could be habituated to regular human activity, so distance of effect could be less.
Primary Roads 400 ft (122 m) Witmer et al. (1985) reported reduced elk use within this distance of primary roads for western Oregon and Washington. In Colorado, Rost and Bailey (1979) reported lower elk use within 200 m of roads.
Secondary Roads
200 ft (61 m) Witmer et al. (1985) reported reduced elk use within this distance of secondary roads for western Oregon and Washington. This distance corresponds to the distance used in the definition of hiding cover (Thomas et al. 1979).
Residential Development
400 ft (122 m) Elk would likely habituate to regularly occurring, low intensity human activity. Elk can be attracted to lawns, gardens, and pastures near homes.
T21 Final Study Report; 31 December 2003 Page 8
Unpublished Work © 2003; Puget Sound Energy, Inc.

RESULTS
NCASI sampled between 2 and 37 vegetation sampling sites in each of 14 habitat categories (Table 2). No vegetation sampling sites fell within several of the canopy cover classes in the mountain hemlock (TSME) forest zone, requiring that only two classes (0-40% and 61-100%) be used in the analysis. A forage value ranking based on the average digestibility was calculated for each habitat category. Associated scaled index values for each forage quality category are:
(1) Excellent: >0.93 (2) Good: >0.67 – 0.929 (3) Marginal: >0.27 – 0.669 (4) Poor: -0.7 to 0.269
NCASI’s data indicate substantial differences in suitable forage biomass in each of the 14 habitat categories that were sampled. Suitable forage biomass ranged from 700-800 kg/ha in open habitats to 15-70 kg/ha in habitats with near complete canopy cover (Appendix A, Figure 5). Similarly, predicted dietary digestibility also varied markedly between habitat categories, primarily in relation to overstory canopy cover. Habitats with less than 20% canopy cover in all forest zones provided dietary digestibility in the good category; habitats with 21-40% canopy cover provided digestibility in the marginal category (except in the TSME forest zone which yielded good forage); and habitats with greater then 40% canopy cover provided poor forage conditions (Table 2; Appendix A). Deciduous forests in both the TSHE and ABAM zones provided forage conditions ranking in the marginal category and forage value rankings, at high overstory canopy (Table 2).
Because the NCASI field sampling did not target non-forested habitats, deciduous stands of lower canopy coverage, or most habitats in the TSME, alpine, and parkland forest zones, the TRWG agreed to extrapolate the overall habitat ranking derived from sampled stands to the unrepresented habitats based on basic assumptions. These included:
• Herbaceous and shrub habitats delineated in the T15 mapping were assigned a “Good” ranking based on the assumption that most of these areas have high cover of elk forage species.
• Deciduous dominated stands with canopy cover ≤ 40% were assigned a “Good” ranking because these relatively open areas likely have high herbaceous and shrub cover.
• Deciduous-dominated stands with canopy cover >40% were assigned a “Marginal” ranking because these sites typically have low herbaceous cover and are likely similar to the sites NCASI sampled in ABAM 80-100 percent canopy cover.
• Within the TSME forest zone, conifer stands with canopy cover >40% were assigned a “Poor” ranking as they are likely similar to the sampled stands in the TSHE and ABAM forest zones.
• High elevation areas within the snow/glacier zones and water bodies were assigned a value of “No Habitat” as they probably do not provide consistent forage habitat.
• Areas with no IVMP data (due to shadows in the remote sensing data) that were not in a shrub or herbaceous habitat in the T15 coverage were assigned a value of “No Data.”
By using these assumptions, gaps in the NCASI sampling were filled to produce a map of overall forage habitat suitability ranking for the entire T21 study area (Figure 3).
T21 Final Study Report; 31 December 2003 Page 9
Unpublished Work © 2003; Puget Sound Energy, Inc.

Table 2. Number of sampled sites (N), estimated forage (kg/ha), estimated digestibility (%), forage value ranking, and scaled index (0 to 1) of forage value ranking for habitat classes based on forest zone and canopy cover (%) class.
Forage Digestibility Forest Zone
Cover Class
Canopy Cover
(%) N
Mean (kg/ha) SE (kg/ha) Mean (%) SE (%) Rank Index
TSHE C1 0-20 20 787.17 94.62 60.69 0.73 Good 0.71
C2 21-40 4 372.31 147.36 56.40 2.41 Marginal 0.43
C3 41-60 7 133.37 38.72 52.31 0.81 Poor 0.15
C4 61-80 8 134.67 29.45 52.37 0.64 Poor 0.16
C5 81-100 37 71.80 16.71 50.91 0.36 Poor 0.06
D5 80-100 6 437.66 45.65 58.03 0.73 Marginal 0.54
ABAM C1 0-20 19 690.21 71.51 60.54 0.77 Good 0.70
C2 21-40 4 500.84 132.24 58.56 1.89 Marginal 0.57
C3 41-60 4 187.11 64.00 53.43 1.33 Poor 0.23
C4 61-80 4 115.84 44.66 51.96 1.00 Poor 0.13
C5 81-100 9 16.14 4.30 49.69 0.10 Poor 0.00
D5 80-100 2 391.53 165.65 57.11 2.77 Marginal 0.47
TSME C1-2 0-40 6 759.56 80.78 61.83 0.88 Good 0.79
C4-5 61—100 2 55.74 29.68 50.63 0.70 Poor 0.04
T21 Final Study Report; 31 December 2003 Page 10
Unpublished Work © 2003; Puget Sound Energy, Inc.

Figure 3. Habitat Ranking Map
T21 Final Study Report; 31 December 2003 Page 11
Unpublished Work © 2003; Puget Sound Energy, Inc.

Approximately 38,816 ac (15,708 ha), or 42 percent, of the T21 study area was modeled as having poor quality forage habitat, and an additional 12 percent was rating has having no forage habitat value (Table 3, Figure 3). Most of this poor habitat is located in conifer stands with high canopy coverage. There were 26,025 ac (10,531 ha) of habitat in the study area that was rated as good forage habitat, primarily in the mid elevations of the study area (Figure 3). A forage quality ranking could not be assigned to 335 ac (136 ha) due to shadows in the remote sensing images. As the federally owned land accounts for more than 70 percent of the entire study, it is not surprising that the largest proportion of each habitat value category occurs on federal land (Table 3).
Based on a combination of elevation and elk telemetry data, the study area was divided into three basic seasonal elk ranges: (1) a low elevation zone that is used as winter (December-March) range and during spring (April-June) and fall (October-November) transitional periods, (2) a mostly mid-elevation zone that is used only during the transitional periods, and (3) a higher elevation zone above 2,400 ft (731 m) that represents elk summer (July-September) range (Figure 4). The summer range extends along most of the north-south extent of the study area, except for the lower elevations near the Baker Lake Highway; the winter/transition zone goes from Swift Creek to Highway 20. The transition range is restricted to the area from the mid-section of Swift Creek to Rocky Creek. Nearly 57 percent of the study area is situated in the summer range zone; slightly more than 31 percent of the study area is winter range/transitional range and about 12 percent is strictly transitional habitat (Table 4). About 28 percent of the 28,615 ac (11,580 ha) winter/transition range is federally owned, while 62 percent of the winter/transition range is privately owned. Nine percent of the winter/transition range is state owned. Only 324 ac (131 ha) of the winter/transition range is owned by PSE. The entire 11,058-ac (4,475-ha) transitional zone is federally owned and more than 88 percent of the 51,768-ac (20,950-ha) summer range is managed by the USFS. The summer range includes nearly 6,000 ac (2,428 ha), or 9 percent, of private land.
About 64 percent of all good forage habitat in the study area is located at higher elevations and is typically only available during summer (Table 4). In fact, a fairly large proportion—32 percent—of the summer range is composed of good forage habitat (Table 4). In comparison, the modeling predicts that 28 and 12 percent of the winter/transitional and transitional ranges provide good quality forage habitat, respectively. The distribution of good habitat is patchier in the winter/transition and transition ranges, whereas in the summer range, there are several large contiguous areas of good forage (Figure 3, Figure 4).
Overlaying existing roads and trails on the elk forage habitat mapping indicated that roads that are open during the early season (winter and spring) potentially affect a total of 5,958 ac (2,411 ha) of elk habitat while early-season trail buffers include 4,648 acres (1,881 ha) (Figure 5, Table 5). By far the most acreage—3,026 ac (1,225 ha)—affected by roads that are open to travel during the early season (December-June) is within the winter/transition elk range (Table 5), but 1,309 and 1,623 ac (530 and 657 ha) of summer and transitional habitat are also affected by early-season roads, respectively. Approximately 11 percent of the entire winter range is affected by one or more of the early-season road or trail buffers. Early-season roads and trails on federally owned land affect 4,209 ac (1,703 ha) and 4,648 ac (1,881 ha), respectively. A total of 1,504 ac (609 ha) is affected on private land, which includes 106 ac (43 ha) of PSE land. Within the winter/transition range, approximately 41 percent of the area within the early-season road/trail buffers is ranked as good quality. Approximately 73 percent of the habitat affected by early-season road/trail buffers in the transition range is poor quality, while only 11 percent was ranked as good. In the summer range, about 32 percent of the habitat within early-season road/trail buffers was ranked as good, and 84 percent of the early-season affected habitat is federally owned.
T21 Final Study Report; 31 December 2003 Page 12
Unpublished Work © 2003; Puget Sound Energy, Inc.
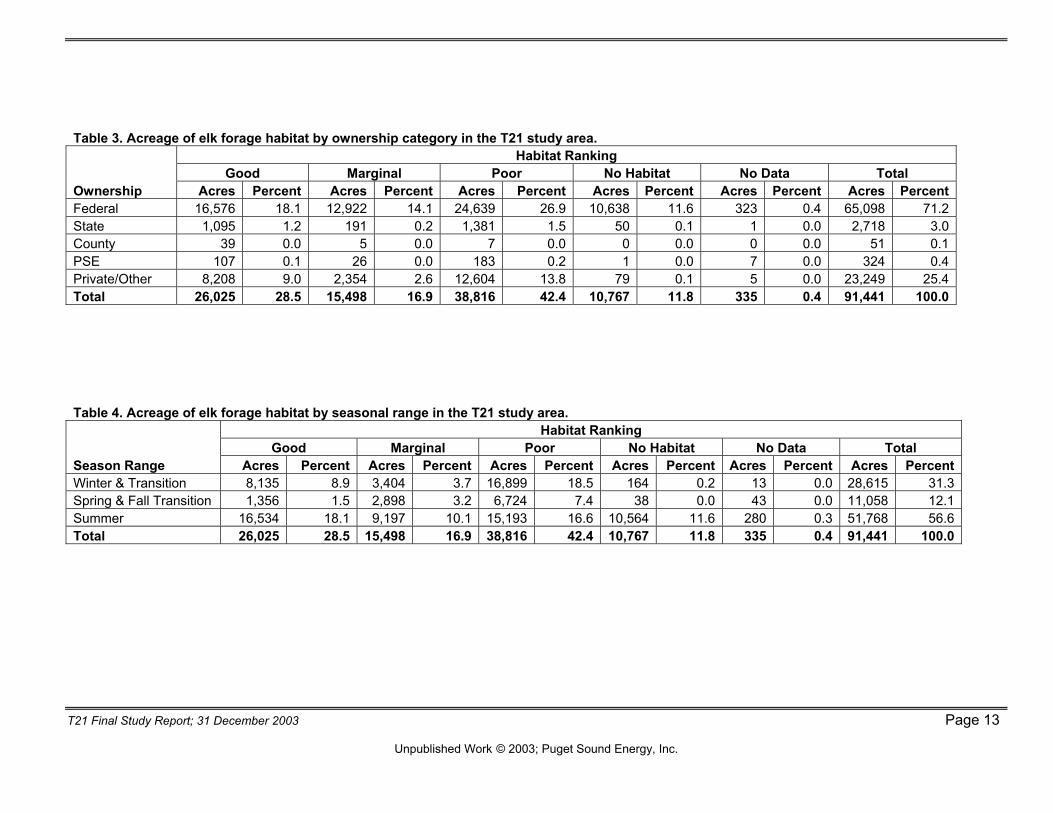
Table 3. Acreage of elk forage habitat by ownership category in the T21 study area. Habitat Ranking Good Marginal Poor No Habitat No Data Total Ownership Acres Percent Acres Percent Acres Percent Acres Percent Acres Percent Acres PercentFederal 16,576 18.1 12,922 14.1 24,639 26.9 10,638 11.6 323 0.4 65,098 71.2State 1,095 1.2 191 0.2 1,381 1.5 50 0.1 1 0.0 2,718 3.0County 39 0.0 5 0.0 7 0.0 0 0.0 0 0.0 51 0.1PSE 107 0.1 26 0.0 183 0.2 1 0.0 7 0.0 324 0.4Private/Other 8,208 9.0 2,354 2.6 12,604 13.8 79 0.1 5 0.0 23,249 25.4Total 26,025 28.5 15,498 16.9 38,816 42.4 10,767 11.8 335 0.4 91,441 100.0
Table 4. Acreage of elk forage habitat by seasonal range in the T21 study area. Habitat Ranking Good Marginal Poor No Habitat No Data Total Season Range Acres Percent Acres Percent Acres Percent Acres Percent Acres Percent Acres PercentWinter & Transition 8,135 8.9 3,404 3.7 16,899 18.5 164 0.2 13 0.0 28,615 31.3Spring & Fall Transition 1,356 1.5 2,898 3.2 6,724 7.4 38 0.0 43 0.0 11,058 12.1Summer 16,534 18.1 9,197 10.1 15,193 16.6 10,564 11.6 280 0.3 51,768 56.6Total 26,025 28.5 15,498 16.9 38,816 42.4 10,767 11.8 335 0.4 91,441 100.0
T21 Final Study Report; 31 December 2003 Page 13
Unpublished Work © 2003; Puget Sound Energy, Inc.

Figure 4
T21 Final Study Report; 31 December 2003 Page 14
Unpublished Work © 2003; Puget Sound Energy, Inc.
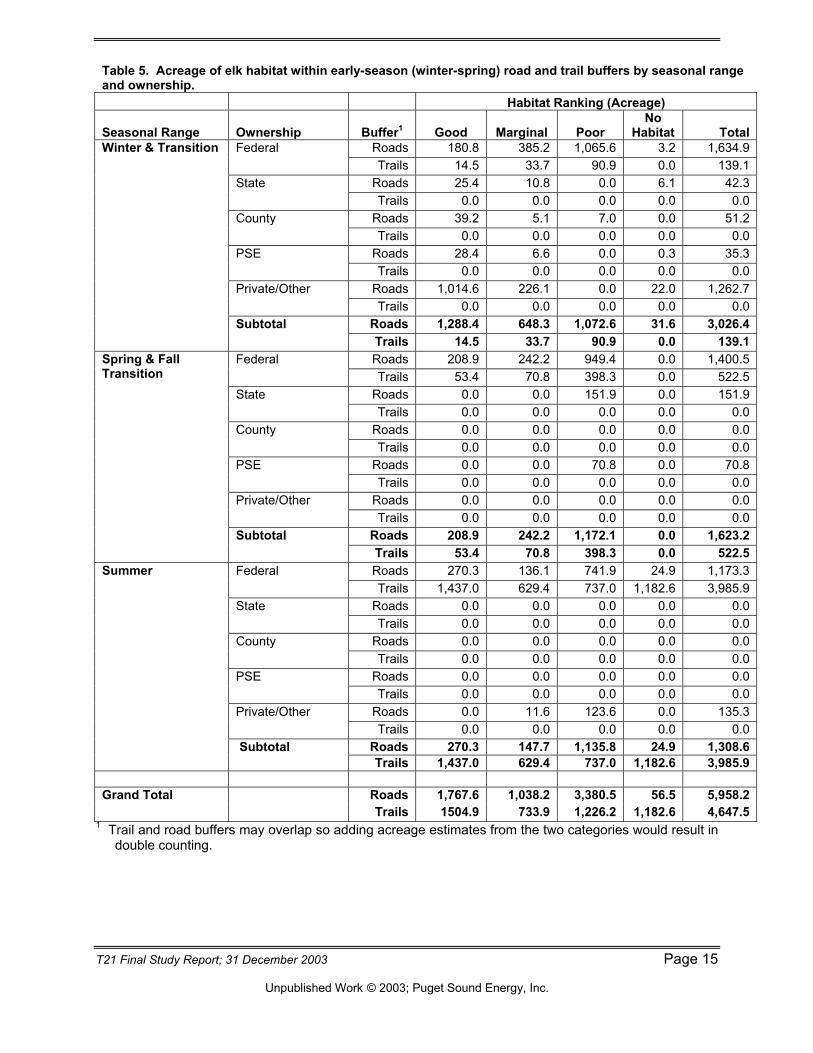
Table 5. Acreage of elk habitat within early-season (winter-spring) road and trail buffers by seasonal range and ownership. Habitat Ranking (Acreage)
Seasonal Range Ownership Buffer1 Good Marginal Poor No
Habitat TotalFederal Roads 180.8 385.2 1,065.6 3.2 1,634.9Winter & Transition Trails 14.5 33.7 90.9 0.0 139.1
State Roads 25.4 10.8 0.0 6.1 42.3 Trails 0.0 0.0 0.0 0.0 0.0 County Roads 39.2 5.1 7.0 0.0 51.2 Trails 0.0 0.0 0.0 0.0 0.0 PSE Roads 28.4 6.6 0.0 0.3 35.3 Trails 0.0 0.0 0.0 0.0 0.0 Private/Other Roads 1,014.6 226.1 0.0 22.0 1,262.7 Trails 0.0 0.0 0.0 0.0 0.0
Subtotal Roads 1,288.4 648.3 1,072.6 31.6 3,026.4 Trails 14.5 33.7 90.9 0.0 139.1Federal Roads 208.9 242.2 949.4 0.0 1,400.5Spring & Fall
Transition Trails 53.4 70.8 398.3 0.0 522.5 State Roads 0.0 0.0 151.9 0.0 151.9 Trails 0.0 0.0 0.0 0.0 0.0 County Roads 0.0 0.0 0.0 0.0 0.0 Trails 0.0 0.0 0.0 0.0 0.0 PSE Roads 0.0 0.0 70.8 0.0 70.8 Trails 0.0 0.0 0.0 0.0 0.0 Private/Other Roads 0.0 0.0 0.0 0.0 0.0 Trails 0.0 0.0 0.0 0.0 0.0
Subtotal Roads 208.9 242.2 1,172.1 0.0 1,623.2 Trails 53.4 70.8 398.3 0.0 522.5
Summer Federal Roads 270.3 136.1 741.9 24.9 1,173.3 Trails 1,437.0 629.4 737.0 1,182.6 3,985.9 State Roads 0.0 0.0 0.0 0.0 0.0 Trails 0.0 0.0 0.0 0.0 0.0 County Roads 0.0 0.0 0.0 0.0 0.0 Trails 0.0 0.0 0.0 0.0 0.0 PSE Roads 0.0 0.0 0.0 0.0 0.0 Trails 0.0 0.0 0.0 0.0 0.0 Private/Other Roads 0.0 11.6 123.6 0.0 135.3 Trails 0.0 0.0 0.0 0.0 0.0
Subtotal Roads 270.3 147.7 1,135.8 24.9 1,308.6 Trails 1,437.0 629.4 737.0 1,182.6 3,985.9
Grand Total Roads 1,767.6 1,038.2 3,380.5 56.5 5,958.2 Trails 1504.9 733.9 1,226.2 1,182.6 4,647.5
1 Trail and road buffers may overlap so adding acreage estimates from the two categories would result in double counting.
T21 Final Study Report; 31 December 2003 Page 15
Unpublished Work © 2003; Puget Sound Energy, Inc.

Figure 5
T21 Final Study Report; 31 December 2003 Page 16
Unpublished Work © 2003; Puget Sound Energy, Inc.

Table 6. Acreage of elk habitat within late-season (summer-fall) road and trail buffers by seasonal range and ownership. Habitat Ranking (Acreage) Seasonal Range Ownership Buffer Good Marginal Poor No Habitat Total
Federal Roads 206.2 363.4 1,060.1 3.2 1,632.9 Winter & Transition Trails 14.5 33.7 90.9 0.0 139.1 State Roads 297.5 16.9 286.6 6.1 607.1 Trails 0.0 0.0 0.0 0.0 0.0 County Roads 39.2 5.1 7.0 0.0 51.2 Trails 0.0 0.0 0.0 0.0 0.0 PSE Roads 34.1 8.9 73.1 0.3 116.4 Trails 0.0 0.0 0.0 0.0 0.0 Private/Other Roads 1,721.8 313.3 2,818.3 22.0 4,875.5 Trails 0.0 0.0 0.0 0.0 0.0
Subtotal Roads 2,298.8 707.6 4,245.1 31.6 7,283.1
Trails 14.5 33.7 90.9 0.0 139.1
Federal Roads 230.7 298.8 1,033.8 0.0 1,563.3 Spring & Fall Transition Trails 0.0 0.0 0.2 0.0 0.2 State Roads 0.0 0.0 0.0 0.0 0.0 Trails 0.0 0.0 0.0 0.0 0.0 County Roads 0.0 0.0 0.0 0.0 0.0 Trails 0.0 0.0 0.0 0.0 0.0 PSE Roads 0.0 0.0 0.0 0.0 0.0 Trails 0.0 0.0 0.0 0.0 0.0 Private/Other Roads 0.0 0.0 0.0 0.0 0.0 Trails 0.0 0.0 0.0 0.0 0.0
Subtotal Roads 230.7 298.8 1,033.7 0.0 1,563.4
Trails 0.0 0.0 0.2 0.0 0.2
Summer Federal Roads 286.6 209.4 853.2 24.9 1,374.1 Trails 2,046.0 1,171.1 1,212.9 1,673.0 6,103.1 State Roads 0.2 0.0 0.0 0.0 0.2 Trails 0.0 0.0 0.0 0.0 0.0 County Roads 0.0 0.0 0.0 0.0 0.0 Trails 0.0 0.0 0.0 0.0 0.0 PSE Roads 0.0 0.0 0.0 0.0 0.0 Trails 0.0 0.0 0.0 0.0 0.0 Private/Other Roads 406.5 237.4 571.8 0.1 1,215.7 Trails 0.0 0.0 0.0 0.0 0.0 Subtotal Roads 693.3 446.8 1,425.0 24.9 2,590.0
Trails 2,046.1 1,171.1 1,212.9 1,673.0 6,103.1
Grand Total Roads 3,222.8 1,453.2 6,703.8 56.5 11,436.5 Trails 2,060.6 1,204.8 1,304.0 1,673.0 6,242.4
1 Trail and road buffers may overlap so adding acreage estimates from the two categories would result in double counting.
T21 Final Study Report; 31 December 2003 Page 17
Unpublished Work © 2003; Puget Sound Energy, Inc.

The roads and trails that are open during the late-season (July-November) have potential disturbance buffers that affect about 67 percent more habitat than the early-season road/trail buffers (Figure 6). Of the habitat in the late-season road buffers, 28 percent was ranked as good quality, while 33 percent of the habitat in trail buffers was ranked as good quality (Table 6). About 42 percent of the late season road/trail buffer is within the winter/transition range. About 61 percent of the elk habitat affected by late-season road/trail buffers is federally owned (Table 6). About 26 percent of all winter range is included in the late-season road/trail buffers. However, very little elk use occurs in this zone during the summer and fall so the level of conflict is relatively low.
Buffers around the developed recreation areas in the study area encompass 1,731 ac (701 ha) of elk habitat (Table 7, Figure 7). Most—1,484 ac (601 ha), or 86 percent—is in the winter range portion of the study area (Figure 4). Federal ownership accounts for 84 percent of the habitat within the developed recreation site disturbance buffers. Good quality forage only covers 35 percent of the developed recreation buffer (Table 7).
The dispersed recreation site disturbance buffers cover 1,498 ac (606 ha) in the T21 study area (Table 8, Figure 7). Approximately 1,352 ac (548 ha) are in the winter/transition range and the remaining acreage in the buffer is in the spring and fall transitional zone. Approximately 48 percent of the dispersed recreation buffers encompass poor quality habitat. Ninety-two percent of the buffer is on federal land.
Proposed new trails in the study area would result in disturbance buffers affecting 4,751 ac (1,923 ha) of elk habitat (Table 9). Seventy-seven percent of the proposed trail buffers are located in the winter/transition zone. Over 93 percent of the habitat affected by the proposed trail buffers is federally owned.
T21 Final Study Report; 31 December 2003 Page 18
Unpublished Work © 2003; Puget Sound Energy, Inc.

Figure 6
T21 Final Study Report; 31 December 2003 Page 19
Unpublished Work © 2003; Puget Sound Energy, Inc.

Table 7. Acreage of elk habitat in developed recreation site buffers by seasonal range and ownership. Habitat Ranking (Acreage)
Seasonal Range Ownership Good Marginal Poor No
Habitat Total Winter & Transition Federal 292.8 553.4 338.8 20.7 1,205.7 State 0.0 0.0 0.0 0.0 0.0 County 0.0 0.0 0.0 0.0 0.0 PSE 38.1 11.9 118.3 0.7 169.0 Private/Other 13.0 14.7 68.1 14.0 109.8 Subtotal 343.9 580.0 525.2 35.4 1,484.5 Spring & Fall Transition Federal 55.9 190.7 0.0 0.0 246.6 State 0.0 0.0 0.0 0.0 0.0 County 0.0 0.0 0.0 0.0 0.0 PSE 0.0 0.0 0.0 0.0 0.0 Private/Other 0.0 0.0 0.0 0.0 0.0 Subtotal 55.9 0.0 0.0 0.0 246.6 Summer Federal 0.0 0.0 0.0 0.0 0.0 State 0.0 0.0 0.0 0.0 0.0 County 0.0 0.0 0.0 0.0 0.0 PSE 0.0 0.0 0.0 0.0 0.0 Private/Other 0.0 0.0 0.0 0.0 0.0 Subtotal 0.0 0.0 0.0 0.0 0.0TOTAL 399.9 580.0 525.2 35.4 1,731.1
T21 Final Study Report; 31 December 2003 Page 20
Unpublished Work © 2003; Puget Sound Energy, Inc.

Figure 7
T21 Final Study Report; 31 December 2003 Page 21
Unpublished Work © 2003; Puget Sound Energy, Inc.

Table 8. Acreage of elk habitat in dispersed recreation site buffers by seasonal range and ownership. Habitat Ranking (Acreage) Seasonal Range Ownership Good Marginal Poor No Habitat Total Winter & Transition Federal 208.1 304.9 702.7 21.4 1,237.1 State 34.7 5.3 7.8 6.3 54.1 County 0.0 0.0 0.0 0.0 0.0 PSE 8.1 2.3 3.0 0.0 13.3 Private/Other 39.6 0.0 8.1 0.1 47.8 Subtotal 290.5 312.4 721.6 27.8 1,352.3 Spring & Fall Transition Federal 26.2 119.4 0.0 0.0 145.5 State 0.0 0.0 0.0 0.0 0.0 County 0.0 0.0 0.0 0.0 0.0 PSE 0.0 0.0 0.0 0.0 0.0 Private/Other 0.0 0.0 0.0 0.0 0.0 Subtotal 26.2 119.4 0.0 0.0 145.5 Summer Federal 0.0 0.0 0.0 0.0 0.0 State 0.0 0.0 0.0 0.0 0.0 County 0.0 0.0 0.0 0.0 0.0 PSE 0.0 0.0 0.0 0.0 0.0 Private/Other 0.0 0.0 0.0 0.0 0.0 Subtotal 0.0 0.0 0.0 0.0 0.0TOTAL 316.7 431.8 721.6 27.8 1,497.9
T21 Final Study Report; 31 December 2003 Page 22
Unpublished Work © 2003; Puget Sound Energy, Inc.

Table 9. Acreage of elk habitat in buffers around proposed new trails by seasonal range and ownership. Habitat Ranking (Acreage) Seasonal Range Ownership Good Marginal Poor No Habitat Total Winter & Transition Federal 446.5 810.8 2,038.3 35.5 3,331.1 State 0.0 0.0 0.0 0.0 0.0 County 7.0 1.4 0.1 0.0 8.5 PSE 38.0 12.4 113.0 0.7 164.1 Private/Other 41.3 19.7 83.5 14.0 158.4 Subtotal 532.9 844.3 2,234.8 50.2 3,662.2 Spring & Fall Transition Federal 82.2 371.7 635.0 0.0 1,089.0 State 0.0 0.0 0.0 0.0 0.0 County 0.0 0.0 0.0 0.0 0.0 PSE 0.0 0.0 0.0 0.0 0.0 Private/Other 0.0 0.0 0.0 0.0 0.0 Subtotal 82.2 371.7 635.0 0.0 1,089.0 Summer Federal 0.0 0.0 0.0 0.0 0.0 State 0.0 0.0 0.0 0.0 0.0 County 0.0 0.0 0.0 0.0 0.0 PSE 0.0 0.0 0.0 0.0 0.0 Private/Other 0.0 0.0 0.0 0.0 0.0 Subtotal 0.0 0.0 0.0 0.0 0.0TOTAL 615.1 1,216.0 2,869.8 50.2 4,751.1
T21 Final Study Report; 31 December 2003 Page 23
Unpublished Work © 2003; Puget Sound Energy, Inc.

DISCUSSION
The following are some additional discussion points. See Appendix A for additional details.
• Large areas have forage in the poor habitat category, primarily due to a preponderance of dense coniferous forests. However, appreciable areas do provide forage conditions that should support elk at a reasonably high level of productivity, which explains the relatively good body condition of elk in the basin.
• There are large areas of poor quality forage in all three seasonal ranges—winter/transition (December-March), spring (April-June) & fall (October-November) transition, and summer (July-September)—that are outside of any of the disturbance buffers that potentially could be enhanced to substantially increase forage that are also not subjected to human disturbance from roads, trails, or campgrounds.
• Several roads in the study area go through good quality elk forage habitat. In some cases, closing seasonally or permanently select roads, can increase habitat for elk and reduce poaching.
• While factors such as roads, predation, and competition can affect elk use of landscapes, the basic determinant of any landscape to support elk (or any herbivore) is the quality of the foraging environment.
• Given the age and unknown accuracies of the GIS coverages, it is difficult to assess the accuracy of this habitat model. As stands have matured or were cut, overall habitat value, or at least the distribution of habitat classes, has undoubtedly shifted. Further, habitat capacity may be under- or overestimated somewhat by using only two major habitat variables (forest zone and canopy cover). For example, thinned forests, which had an average canopy cover of 77%, were grouped in poor habitats but had an average digestibility of 55% based on sampling with the captive elk and were at least marginal habitats. Conversely, some C1 stands (0-20% canopy cover) were ranked as good due to low canopy, but were actually poor forage producers. While habitat conditions have no doubt shifted somewhat, the dominance of even-aged forests on the landscape makes it unlikely that the overall prevalence of poor habitats has changed appreciably since 1996.
T21 Final Study Report; 31 December 2003 Page 24
Unpublished Work © 2003; Puget Sound Energy, Inc.
REFERENCES
Canon, S.K., P.J. Urness, and N.V. DeByle. 1987. Foraging behavior and dietary nutrition of elk in burned aspen forest. Journal of Range Management 40:433-438.
Cassirer, E.F., D.J. Freddy, and E.D. Ables. 1992. Elk responses to disturbance by cross-country skiers in Yellowstone National Park. Wildl. Soc. Bull. 20:375-381.
Collins, W.B., and P.J. Urness. 1983. Feeding behavior and habitat selection of mule deer and elk on northern Utah summer ranges. Journal of Wildlife Management 47:646-663.
Cook, J.G., B.K. Johnson, R.C. Cook, R.A. Riggs, T. Delcurto, L.D. Bryant, and L.L. Irwin. In press. Effects of summer-autumn nutrition and parturition date on reproduction and survival of elk. Wildlife Monographs.
Cook, J. G., L. L. Irwin, L. D. Bryant, R. A. Riggs, and J. W. Thomas. 1998. Relations of forest cover and condition of elk: a test of the thermal cover hypothesis in summer and winter. Wildlife Monographs No. 141.
Cook, J.G., L.C. Bender, and L.L. Irwin. 2001. Assessing Nutritional Influences on Elk Herd Productivity on Pacific Northwest Landscapes: First Annual Progress Report.
Davis, R.W., J.G. Cook, R.C. Cook, L.C. Bender, and L.L. Irwin. 2003. Baker Lake Relicensing: Elk Forage Mapping Study. Final Report Prepared for Puget Sound Energy.
Farrow, L. 1995. Baker Lake Administrative Elk Study 1995 Final Project Report. U.S. Forest Service, Mt. Baker Ranger District. Sedro Woolley, Washington.
Joslin, G., and H. Youmans, coordinators. 1999. Effects of recreation on Rocky Mountain wildlife: A Review for Montana. Committee on Effects of Recreation on Wildlife, Montana Chapter of The Wildlife Society. 307pp.
Manly, B., L. McDonald, and D. Thomas. 1993. Resource selection by animals: statistical design and analysis for field studies. Chapman and Hall, New York, New York, USA.
Millspaugh, J.J. 1999. Behavioral and physiological responses of elk to human disturbances in the southern Black Hills, South Dakota. Unpublished Ph.D. diss., University of Washington, Seattle, Washington.
Parker, K.L., M.P. Gillingham, T.A. Hanley, and C.T. Robbins. 1999. Energy and protein balance of free-ranging black-tailed deer in a natural forest environment. Wildlife Monographs 143:1-48.
PSE (Puget Sound Energy). Unpublished Reports. Studies conducted as part of the Baker River Relicensing Project, FERC Project No. 2150.
T21 Final Study Report; 31 December 2003 Page 25
Unpublished Work © 2003; Puget Sound Energy, Inc.

Robbins, C.T., T.A. Hanley, A.E. Hagerman, O. Hjelhord, D.L. Baker, C.C. Schwartz, and W.W.
Mautz. 1987a. Role of tannins in defending plants against ruminants: reduction in protein availability. Ecology 68:98-107.
Robbins, C.T., S. Mole, A.E. Hagerman, and T.A. Hanley. 1987b. Role of tannins in defending plants against ruminants: reduction in dry matter digestion? Ecology 68:1606-1615.
Rost, G.R. and J.A. Bailey. 1979. Distribution of mule deer and elk in relation to roads. Journal of Wildlife Management 43: 634-641.
Spalinger, D.E., and N.T. Hobbs. 1992. Mechanisms of foraging in mammalian herbivores: new models of functional response. American Naturalist 140:325-348.
Thomas, J.W., H. Black, Jr., R.J. Scherzinger, and R.J. Pedersen. 1979. Deer and Elk. Chapter 8 In: J.W. Thomas (tech. ed.). Wildlife habitats in managed forests: the Blue Mountains of Oregon and Washington. U.S. Dept. of Agriculture Forest Service. Agriculture Handbook No. 553.
Ward, A.L. 1985. The response of elk and mule deer to firewood gathering on the Medicine Bow Range in south-central Wyoming. Proceedings of the 1984 Western States and Provinces Elk Workshop. Nelson, R.W., ed. Edmonton, Alberta Fish and Wildlife Division, Wildlife Branch. Pp. 28-40.
Weir, D.V. 2000. A guide to the impacts of non-motorized trail use. Donald V. Weir & Associates. Edmonton, Alberta, Canada.
Wickstrom, M.L., C.T. Robbins, T.A. Hanley, D.E. Spalinger, and S.M. Parrish. 1984. Food intake and foraging energetics of elk and mule deer. Journal of Wildlife Management 48:1285-1301.
Witmer, G.W., M. Wisdom, E.P. Harshman, R.J. Anderson, C. Carey, M. P. Kuttel, I.D. Luman, J.A. Rochelle, R.W. Scharpf, and D. Smithey. 1985. Deer and elk. Chapter 11 In: Management of wildlife and fish habitats in forests of western Oregon and Washington, Part 1—chapter narratives. USDA Forest Service, Pacific Northwest Region. Portland, Oregon.
T21 Final Study Report; 31 December 2003 Page 26
Unpublished Work © 2003; Puget Sound Energy, Inc.

APPENDIX A
T21 Final Study Report; 31 December 2003
Unpublished Work © 2003; Puget Sound Energy, Inc.

Baker Lake Re-Licensing: Elk Forage Mapping Study
Final Report
By
Ronald W. Davis, University of Illinois, Urbana 61801
John G. Cook, NCASI, La Grande, OR 97850
Rachel C. Cook, NCASI, La Grande, OR 97850
Louis C. Bender, USGS, Las Cruces, NM 88003
Larry L. Irwin, NCASI, Stevensville, MT 59870
August 22, 2003
Acknowledgements
Funding to support the elk research in the Nooksack Basin includes Rocky Mountain Elk Foundation, Weyerhaeuser Company, Plum Creek Timber, Bureau of Land Management, Washington Department of Fish and Wildlife, Willamette Industries, Rayonier Corporation, Crown Pacific, Swinomish Tribal Community, Oregon Forest Industries Council, Portland Chapter of Safari Club International Washington Forest Protection Association, NCASI, U.S. Geological Survey, with additional logistical support from Washington Department of Natural Resources and the PNW Station of the U.S. Forest Service. Funding to support this mapping effort was provided by Puget Sound Energy. We wish to acknowledge the contributions of Tom Toman, Tony Melchiors, Lorin Hicks, Kevin Russell, Dan Varland, Mike Davison, Chris Madson, Lenny Thompson, Russ Paul, Todd Wilbur, and Scott Fisher. We would also like to thank Jim Unsell and Steve Bratz of Crown Pacific and Allison Hitchcock of WDNR for help compiling stand management data as well as Ron Tressler of EDAW for help attaining and managing GIS layers used in this analysis.
T21 Final Study Report; 31 December 2003 A-1
Unpublished Work © 2003; Puget Sound Energy, Inc.

INTRODUCTION
Tools for habitat evaluation and planning on behalf of elk have a long history of research and development. The effort has provided a considerable number of models for this purpose (Lyon 1980, Lyon et al. 1985, Leege 1984, Wisdom et al. 1986, Thomas et al. 1988, Roloff et al. 2001), several of which have received widespread acceptance and application by private, state, and federal agencies throughout the western U.S. (Edge et al. 1990). These models typically evaluate habitat based on road density, thermal and hiding cover, and other such attributes but, for whatever reason, have largely ignored or discounted the nutritional contribution of forage quality and quantity (Edge et al. 1990, Cook et al. 1998). Yet, the marked influences of nutrition to productivity of large ungulates have been established through a long history of research on livestock and a variety of wild ungulate species (National Research Council 1986, Verme and Ullrey 1984, Cook 2002). Indeed, the greatest contribution of habitat to the productivity of ungulate herds undoubtedly arises from the capability of habitat to satisfy their nutritional needs. As such, habitat evaluation and planning that ignores nutritional resources can only partially account for the overall value of a landscape for elk, and can only partially account for the influences of land management practices that have potential to alter vegetation across landscapes.
We began a research effort in 2000 to evaluate forage quality and quantity, and land management practices that can influence forage quality and quantity, and subsequently, nutritional status of elk in coastal and Cascade habitats of western Oregon and Washington. This research builds on an earlier effort by NCASI and Oregon Department of Fish and Wildlife to assess nutritional requirements of lactating cow elk and their growing calves during summer and autumn (Cook et al. in press). This work, conducted in the late 1990s, provides for the first time a basis to reliably rank forages based on their nutrient content, particularly digestible energy content, in the context of supporting lactating cow elk and their calves during the summer-autumn period.
Implicit to this research is the assumption that nutrition in summer-autumn has important influences on performance of elk, a perspective that contrasts substantially with older assumptions that only nutrition on winter range has practical relevance (e.g., see Wallmo et al. 1977, Marcum 1975, Lyon 1980, Nelson and Leege 1982, Christensen et al. 1993, Unsworth et al. 1998). Cook et al. (in press) demonstrated that nutrition in summer significantly influenced (1) growth and probability of over-winter survival of calves, (2) yearling growth and breeding probability, (3) fat accretion and probability of breeding of adult cows, and, (4) in areas of harsh winter conditions, probability of over-winter survival of cows. Moreover, this work demonstrated that seemingly minor deficiencies of digestible energy content of diets had very large effects on most of these measures of performance. Such findings are supported by Julander et al. (1961), Pederson and Harper (1978), Verme and Ullrey (1984), Hobbs (1989), Merrill and Boyce (1991), and Parker et al. (1999). In coastal and lower-elevation Cascade foothill habitats of the Northwest, where winter weather conditions typically are mild, we assume that nutrition in summer is at least as important as nutrition in winter in affecting productivity of elk herds. Thus we focus our forage evaluations on summer-autumn ranges for the mapping effort described herein.
This report summarizes methods used to (1) collect nutrition data collected during the summer of 2002 in the Nooksack drainage, (2) convert this data into a ranking system of forage conditions that reflects digestible energy needs of lactating cow elk and their calves during summer and autumn, and (3) integrate this system into GIS to develop a means to map areas of varying nutritional value across the Nooksack landscape. The GIS layer containing the forage rankings for various habitat units is the primary product of this effort.
T21 Final Study Report; 31 December 2003 A-2
Unpublished Work © 2003; Puget Sound Energy, Inc.

STUDY AREA
The study area, for this mapping effort, extends northwest from Baker Lake approximately 13 km to Mt. Baker, and west approximately 34 km along the S. Fork Nooksack river basin (Fig. 1). The southern boundary of the study area lies along highway 20 just north of the Skagit River. The study area is in the North Cascades province in western Washington (Franklin and Dyrness 1988) and ranges in elevation from 120 m to over 3000 m on the southeast slopes of Mt. Baker. Terrain varies from steep mountains in the north to rolling foothills in the south. Five major vegetation zones occur in the study area including three forest zones: Tsuga heterophylla (TSHE), Abies amabilis (ABAM), Tsuga mertensiana (TSME) and two other zones, parkland (PKLD) and Alpine (ALPN) (Henderson et al. 1992).
METHODS
We developed this habitat model for the Baker River re-licensing area using data collected from a separate elk nutrition study along the South Fork of the Nooksack River and other areas of the Pacific Northwest. The overall elk-nutrition study consisted of four components. In Substudies I and II, we placed captive elk into pens in a variety of habitats and examined elk foraging behavior (Substudy I) and body condition changes in relation to forage conditions (Substudy II). In Substudy III, we sampled understory vegetation at randomly located sites to assess forage conditions for elk over the landscape. In Substudy IV, radio-collared wild elk in the Nooksack and Baker River area were monitored to determine general distribution patterns throughout the season and assess body condition in spring and fall. A final report with results from Substudy IV for the Nooksack herd (Bender et al. in prep) has been prepared but is still under review.
Vegetation Sampling
We sampled a total of 132 sites in substudies I-III to characterize understory and overstory vegetation across the landscape. The 132 sites were selected at random, and proportioned approximately equally among early, mid-, and moderately late successional stages. At each site we sampled understory species composition, biomass, and forage quality along with a variety of forest overstory variables (i.e. canopy closure, tree density, dbh) to determine factors most important in predicting understory forage conditions for elk.
At each site we established a macroplot averaging 0.2 km2 and sampled vegetation in 10, 2m2 subplots placed systematically in each macroplot. Within each vegetation subplot, we determined the composition and biomass of understory species by clipping, drying and weighing current annual growth of all deciduous vascular species up to 2 m (approximate browse height for elk) including current and past-years growth of evergreen species. Elk occasionally consumed past-years evergreen growth, thus it was considered to comprise available forage. The macroplot constituted the experimental unit, thus biomass values from the subplots were averaged for the macroplot on a per-hectare basis for each understory species.
Elk Forage Values
T21 Final Study Report; 31 December 2003 A-3
Unpublished Work © 2003; Puget Sound Energy, Inc.

The value of various habitats to foraging elk was based on data collected in Substudy I
and II. In late spring 2002, we transported 16 cow:calf pairs of tractable captive elk to the Nooksack basin and placed them in pens located across a variety of habitats representing a wide gradient of elevation and seral stages. A total of 33 sites were sampled with the elk across the gradients from late June through late October. We placed four cow:calf in each pen and monitored them to determine forage selection patterns, dietary quality, and dry-matter and nutrient (digestible energy) intake rates using standard bite-count methodology (Wickstrom et al. 1984, Canon et al. 1987, Collins and Urness 1983, Parker et al. 1999).
Elk were held in Substudy I pens (n = 27) for seven days and held in the Substudy II pens for 14 days (n = 6). For Substudy I, this time period was chosen such that the elk would be forced to switch to less preferred forages and we could assess the extent to which foraging efficiency and dietary quality were affected by diet switches. However, for the analyses conducted for this mapping effort, we used only the data collected the first day the elk were in the pens. These first-day data should best represent foraging dynamics of wild elk in the sampled plant communities. The pens ranged in size from 1 to 3 acres for Substudy I, with pen size varying inversely with forage density, such that total amount of forage was approximately equal among pens despite marked differences in forage density. Pen size ranged from 5 to 15 acres for Substudy II, with size again inversely proportional to forage density, to satisfy the different objectives of this aspect of the study.
Bite count methods included close observation of foraging elk to determine number of bites taken on each plant taxa and the number of bites taken per unit time. For each plant taxa consumed, we clipped, oven-dried, and weighed simulated bite samples to estimate bite weights. Estimates of bite weights and bite counts per taxa were used to calculate total dry-matter intake and dietary composition. Simulated diets also were clipped, such that they mimicked the parts of plants the elk selected and the composition of plant taxa in their diets. These composite simulated diet samples were buried in ice immediately after clipping (to halt metabolism of soluble nutrients), transferred to a freezer within 48 hours, and submitted to the Habitat Analysis Lab at Washington State University. Fiber analysis was used to assess digestible protein and digestible energy content, BSA tannin analysis to assess tannin astringency, and kjeldhal techniques for crude protein as described by Robbins et al. (1987a,b). All results from the Nooksack samples have been returned from the lab, except the tannin analyses. Using the fiber analysis results, we can only calculate, at this time, an approximate digestibility level (a measure of digestible energy content) of our samples. The tannin analysis will change these results, but differences should be small based on results already received for another study area. The approximate digestibility levels of the samples are used herein for developing our forage value estimates.
To estimate forage preferences, we used Ivlev’s selectivity index (Manly et al. 1993), based on estimates of plant composition in elk diets and estimates of plant composition available to the elk. The index ranges from –1 (avoided) to +1 (selected), with 0 representing use of a plant taxa equal to its availability. This index was calculated for each plant taxa in each pen, whether consumed or not. We then calculated the average index and 90% lower and upper confidence intervals (CIs) using each pen as a replicate (one data value for each pen, averaged across the four elk in the pen, to avoid pseudoreplication). Plant taxa with indices averaging >0 and with a lower CI >0 were ranked as “selected” species; taxa with indices averaging <0 and with a upper CI <0 were ranked as “avoided” species; and taxa with indices averaging either above or below 0 and with CIs including zero were ranked as “neutral” species. This analysis was conducted across all pens, without stratification by elevation or seral stage
We evaluated two potential relationships between plant community characteristics and foraging dynamics of elk to identify a relevant approach for ranking habitats in respect to their
T21 Final Study Report; 31 December 2003 A-4
Unpublished Work © 2003; Puget Sound Energy, Inc.

nutritive value for elk: (1) relations between dry-matter intake rates and plant community characteristics and (2) relations between dietary quality and plant community characteristics (Figure 2). In simple grass-dominated plant communities, dry-matter intake rate is correlated to biomass of forage (Wickstrom et al. 1984, Hudson and Watkins 1986). Dry-matter intake is a key variable linking forage value to elk nutrition, because this variable provides a good indication of the potential for elk to acquire sufficient food to meet nutritional requirements (Minson and Wilson 1994). However, we were unable to find any appreciable relation between dry matter intake rate and the amount of biomass of all plant taxa combined, biomass of either neutral or selected plant taxa, the combination of neutral and selected taxa, or abundance of various individual forage species. This lack of significant correlation probably should be expected in many natural plant communities that contain a complex mix of shrubs, forbs, and graminoid species (Spalinger and Hobbs 1992).
We therefore focused our analysis to identify relations between biomass of the three forage groups (avoided, neutral, and selected) and dietary quality (i.e., digestibility) of the elk in the pens. Digestibility of diets, as a measure of digestible energy content, is well-correlated to amount of food elk can eat each day (Minson and Wilson 1994, Grey and Servello 1995, Cook et al. in press) and related to nutritional status, fat accretion of lactating cows, and calf and yearling growth rates during summer and autumn (Cook et al. in press). We used non-linear regression techniques to model this relation and to provide an equation to predict dietary digestibility based on forage characteristics in the plant community. To facilitate incorporation of the forage ranking approach into the overall Baker Lake modeling effort, we scaled the predicted digestibility estimates into an index ranging between 0 and 1 (0 = no value, 1 = excellent forage) using the following equation:
index = 1 - ((maxpdig - pdig) / maxpdig - 50) where,
maxpdig = maximum predicted dietary digestibility of the prediction equation,
pdig = predicted digestibility for the habitat category, and
50 = digestibility at which forage is virtually worthless for lactating cows and calves.
Predicted digestibility levels of elk diets were apportioned into 4 possible categories that relate to performance of lactating cows, their calves, and yearlings during summer-autumn as defined by Cook et al. (in press):
(1) Excellent includes dietary quality of at least 64% digestibility. Such levels of dietary quality allow high levels of fat accretion of cows (>17% body fat by mid-autumn), very rapid growth of calves and yearlings, high pregnancy rates of yearlings (90%), and high pregnancy rates and early breeding of lactating cows. Our experience is that such diets are rare in native plant communities after mid-summer.
(2) Good includes diets ranging from 60 to 64% digestibility. Such levels of dietary quality allow good levels of fat accretion of cows (13 to 17% body fat), rapid growth of calves and yearlings, moderate pregnancy rates of yearlings (50-90%), and high pregnancy rates and early breeding of lactating cows.
(3) Marginal includes diets ranging from 54 to 60% digestibility. Within this range, performance may vary appreciably. Digestibility of about 58% represents maintenance levels of lactating cows (i.e., zero gain or loss of body fat). Body fat should range between 8 and 12%, calf and yearling growth will be moderate, yearling pregnancy will range from low to moderate (<30%), adult pregnancy rate will decline at the lower levels
T21 Final Study Report; 31 December 2003 A-5
Unpublished Work © 2003; Puget Sound Energy, Inc.

of this range and timing of breeding may be delayed. Probability of over-winter mortality increases particularly at the lower levels of this range, depending on severity of winter conditions.
(4) Poor/no value includes diets below 54% digestibility. Elk subsisting on diets at this level will be nutritionally stressed. Cows will not be able to accrue appreciable fat in summer-autumn (<8% body fat in autumn), calf and yearling growth will be greatly retarded, yearlings generally will not breed, and pregnancy rates of adult cows will be appreciably reduced (<75% pregnancy). Such elk will be susceptible to harsh winter conditions. Digestibility levels below about 50% are markedly inadequate for lactating cows, their calves, and yearlings and provide virtually no value to elk in the summer-autumn period.
Habitat Modeling
We developed habitat categories from existing GIS coverages representing forest zones and percent overstory canopy cover. The forest zone coverage was developed in 1994 and updated in 1999 by the U.S. Forest Service Mt. Baker Ranger District and represents a model developed to predict major forest zones in the Mt. Baker-Snoqualmie National Forest using field sampling and various GIS layers (aspect, elevation, ecozones, topographic moisture, and cold air drainage). Coverages for broadleaf and conifer canopy cover were developed from 1996 satellite imagery by the BLM and USFS for their Interagency Vegetation Mapping Project (IVMP). The IVMP coverages represent percent canopy cover in 10% interval classes for both broadleaf and conifer species.
Our habitat categories were developed using forest zone and canopy cover categories for broadleaf and conifer combined in each zone. Five combined canopy classes (20% intervals) and one broadleaf class (80-100% canopy cover) were used in the TSHE and ABAM zones. Our sample sizes were lowest in the TSME zone and only 2 canopy classes (40% interval) were used with no deciduous class in this zone.
We assigned each of our vegetation sampling sites to one of these 14 habitat categories, to represent understory vegetative conditions in each type. The understory vegetation characteristics of each habitat category were then used as a basis to predict the nutritive value of the habitat category for foraging elk. Because this post-stratification did not coincide with the stratification we originally used to select sampling sites, sample sizes within each habitat category were not equal.
RESULTS
Elk Foraging Dynamics
Data to develop estimates of forage preferences are based on 85 hours of foraging observations resulting in approximately 86,000 observed bites by the captive elk. These elk showed marked differences in selection for different plant taxa occurring in the pens (Table 1). In many plant communities, avoided taxa comprised a high proportion of available biomass. Of the 157 plant taxa we identified, only about 25 were classified as selected, 64 were classified as neutral, and 29 were classified as avoided. The remainder occurred in only one pen, precluding calculation of confidence intervals, comprised only 0.5% of total understory biomass across all pens, and were deleted from all calculations (Table 2). Selected plant taxa comprised about 51% of diets yet only comprised 10% of available biomass; neutral taxa comprised about 41% of diets and comprised 20% of biomass, and avoided taxa comprised 6% of elk diets and comprised 70% of understory biomass.
T21 Final Study Report; 31 December 2003 A-6
Unpublished Work © 2003; Puget Sound Energy, Inc.

Season and elevation generally had only slight effects on dietary quality, dry-matter intake rate, and digestible energy intake rate of the tractable elk (elevation was divided into low and high, generally corresponding to western hemlock and Pacific silver fir zones on the study area) (Fig. 2). Dietary quality tended to be greater at higher elevations, but intake rates tended to be higher at low elevations. A lack of a strong seasonal effect on digestibility of diets greatly simplifies development of our forage quality ranking system.
In contrast, digestibility of elk diets was moderately, non-linearly correlated to biomass of selected and neutral species combined (hereafter referred to as “suitable” species) (r2 = 0.41,
P = 0.0007, MSE = 4.89) (Fig. 3). Two data points at the highest level of suitable species biomass were relatively aberrant, and these were deleted from development of the quadratic regression equation (Fig. 3). The resultant equation was used to predict dietary digestibility as a function of biomass of suitable forage for each habitat category. It predicted dietary digestibility of about 50% at very low levels of suitable forage, and predicted digestibility of about 64% at suitable forage biomass levels of over 1,000 kg/ha. Thus, this equation provided predicted values included on all of the four forage quality categories listed above, but just barely into the excellent category.
Forage Value Modeling
Using the quadratic equation of Fig. 3 and biomass estimates of suitable forage in each habitat category, we calculated the expected digestibility of elk diets for each habitat category. Standard errors of suitable biomass and expected digestibility for each habitat were based on the replicates of vegetation sampling sites that belong to the habitat category (Table 3). Based on the average digestibility for the habitat category, we assigned a forage value ranking to the habitat category. Associated scaled index values for each forage quality category are:
(5) Excellent: >0.93, (6) Good: >0.67 – 0.929, (7) Marginal: >0.27 – 0.669, (8) Poor/no value: -0.7 to 0.269.
This scaling approach provided negative values at extremely low suitable forage biomass levels. We converted these values to 0.0 for the modeling effort.
Habitat Model
Sample size of vegetation sampling sites within each of the habitat categories ranged from 2 to 37 (Table 3). Additionally, we had no vegetation sampling sites falling within several of the canopy cover classes in the mountain hemlock zone, requiring that we use only two classes (0-40% and 61-100%). Our data indicate substantial differences in suitable forage biomass in each of the habitat categories, ranging from 700-800 kg/ha in open habitats to 15-70 kg/ha in habitats with near complete canopy cover (Fig. 5). Similarly, predicted dietary digestibility also varied markedly between habitat categories, primarily in relation to overstory canopy cover. Habitats with less than 20% canopy cover provided dietary digestibility in the good category, habitats with 21-40% canopy cover provided digestibility in the marginal category, and habitats with greater then 40% canopy cover provided poor forage conditions (Table 3). Deciduous forests in both the western hemlock and Pacific silver fir zone provided forage conditions ranking in the marginal category and forage value rankings, at any given level of overstory canopy and thus suitable forage biomass, were equivalent across the forest zones (Table 3).
T21 Final Study Report; 31 December 2003 A-7
Unpublished Work © 2003; Puget Sound Energy, Inc.

This is consistent with our observation that dietary digestibility was similar across elevations (Fig. 2).
The habitat model classified over 60,000 ha of forested landscape excluding areas for which we had no data (Figure 4). Of this area just over 13% fell into the good or marginal forage classes. These habitats were found entirely in canopy classes at or below 40% canopy coverage (C1 and C2) or in deciduous stands (D5) with the majority of these habitats (8.8%) in the TSHE zone (Table 3).
DISCUSSION
The forage quality rankings when projected across the Nooksack landscape indicate vast areas with forage in the poor/no value category. This is primarily due to a preponderance of habitats that support dense coniferous forests. Nevertheless, appreciable areas on the landscape do provide forage conditions that should support elk at a reasonably high level of productivity. We would predict that the majority of elk on this landscape would exhibit affinity for these areas. Our data of body fat levels of lactating elk in the Nooksack indicate reasonably good fat levels of about 13% in November (Bender et al. in prep). This corresponds to dietary digestibility levels in the low extreme of the good forage quality category and the high extreme of the marginal category. Thus, the nutritional condition data from the wild elk generally agrees with the mapped data, assuming that the Nooksack elk do seek out the areas of relative superior forage for foraging. If they do not, and instead select areas for foraging at random, we would predict markedly lower body fat levels in Nooksack elk.
The predominance of areas with habitats with poor/no value forage quality suggests that overall modeling of habitat capability of the study area should focus heavily on forage characteristics. Habitat suitability/effectiveness modeling in the past has largely focused on cover and roads. While factors such as roads, predation, and competition can affect elk use of landscapes, the basic determinant of any landscape to support elk (or any herbivore) is the quality of the foraging environment. Virtually all life processes are linked to nutrition and its expression in individual body condition (Clutton-Brock et al 1982, Clements and Young 1996, Cook 2002). For example, the potential impact of predation is directly tied to the size and viability of newborn fawns (Clutton-Brock et al. 1982, Linnell et al. 1995, Mackie et al. 1998, Ballard et al. 2002, Gaillard et al. 2000), which in turn is dependent upon maternal condition and nutrition (Verme 1963, 1969, Langenau and Lerg 1976, Clutton-Brock et al. 1982,Verme and Ulrey 1984, Whitten et al 1992, Adams et al 1995, Sams et al. 1996, Clemments and Young 1997, Swihart et al. 1998, Cook et al. 2002). Thus it is necessary to identify the specific nutritional limitations present on elk range that drive local elk productivity in order to prescribe corrective management actions to benefit elk populations (sensu Clemments and Young 1996). Thus we submit that good forage conditions, because they are relatively limited across the landscape and because they are linked to herd productivity to a much greater extent than cover and roads, should dominate rankings of overall habitat quality. As a minimum, we recommend
T21 Final Study Report; 31 December 2003 A-8
Unpublished Work © 2003; Puget Sound Energy, Inc.

that overall habitat quality rankings should be no higher than the ranking for the forage component of any modeling effort.
Given the age and unknown accuracies of the GIS coverages, it is difficult to assess the accuracy of this habitat model. Specifically, predictions of habitat quality and distribution are limited by the age of the IVMP coverage. As stands have matured or were cut, overall habitat value, or at least the distribution of habitat classes, has undoubtedly shifted. Further, habitat capacity may be under or over estimated somewhat by using only two major habitat variables (forest zone and canopy cover). For example, thinned forests, which had an average canopy cover of 77 %, were grouped in “poor” habitats but had an average digestibility of 55% based on sampling with the captive elk and were at least marginal habitats. Conversely, some “C1” stands (0-20% canopy cover) were ranked as “good” due to low canopy, but were actually poor forage producers. Using current satellite imagery (i.e., IKONOS) in a supervised classification with data splitting for training and accuracy assessment and by linking with management practices and other data sources a habitat map more representative of current conditions could likely be produced . Still, the differences in forage production across the various habitat classes are pronounced even given potential inaccuracies. Also, while habitat conditions have no doubt shifted somewhat, the dominance of even-aged forests on the landscape makes it unlikely that the overall prevalence of poor habitats has changed appreciably since 1996.
T21 Final Study Report; 31 December 2003 A-9
Unpublished Work © 2003; Puget Sound Energy, Inc.

LITERATURE CITED
Adams, L. G., J. Singer, and B. W. Dale. 1995. Caribou calf mortality in Denali National Park, Alaska. Journal of Wildlife Management 59:584–594.
Ballard, W. D., D. Lutz, T. W. Keegan, L. H. Carpenter, and J. C. deVos, Jr. 2001. Deer-predator relationships: a review of recent North American studies with emphasis on mule and black-tailed deer. Wildlife Society Bulletin 29:99–115.
Bender, L. C., M. A. Davison, J. G. Cook, R. C. Cook, and P. B. Hall. In prep. Feasibility of population augmentation as a management strategy for the Nooksack elk herd, Washington.
Canon, S. K., P. J. Urness, and N. V. DeByle. 1987. Foraging behavior and dietary nutrition of elk in burned aspen forest. Journal of Range Management 40:433-438.
Christensen, A. G., L. J. Lyon, and J. W. Unsworth. 1993. Elk management in the Northern Region: considerations in forest plan updates or revisions. U.S. Forest Service, General Technical Report INT-303.10pp.
Clements, C. D., and J. A. Young. 1996. A viewpoint: Rangeland health and mule deer habitat. Journal of Range Management 50:129–138.
Clutton-Brock, T. H., F. E. Guinness, and S. D. Albon. 1982. Red deer: Behavior and ecology of two sexes. University of Chicago Press, Chicago, Illinois, USA. 378 p.
Collins, W. B., and P. J. Urness. 1983. Feeding behavior and habitat selection of mule deer and elk on northern Utah summer ranges. Journal of Wildlife Management 47:646-663.
Cook, J. G., B. K. Johnson, R. C. Cook, R. A. Riggs, T. Delcurto, L. D. Bryant, and L. L. Irwin. In press. Effects of summer-autumn nutrition and parturition date on reproduction and survival of elk. Wildlife Monographs.
Cook, J. G. 2002. Nutrition and food. Pages 259–349 in D. E. Toweill and J. W. Thomas, editors. North American elk: Ecology and management. Second edition. Smithsonian Institution Press, Washington D.C., USA.
Cook, J. G., B. K. Johnson, R. C. Cook, T. Delcurto, R. A. Riggs, T. Delcurto, L. D. Bryant, and L. L. Irwin. 2002. Effects of summer-autumn nutrition and parturition date on reproduction and survival of elk. Final report, National Council for Air and Stream Improvement, LaGrande, Oregon, USA. 132 pp + APP.
Cook, J. G., L. L. Irwin, L. D. Bryant, R. A. Riggs, and J. W. Thomas. 1998. Relations of forest cover and condition of elk: a test of the thermal cover hypothesis in summer and winter. Wildlife Monographs No. 141.
T21 Final Study Report; 31 December 2003 A-10
Unpublished Work © 2003; Puget Sound Energy, Inc.

Edge, W. D., S. L. Olson-Edge, and L. L. Irwin. 1990. Planning for wildlife in national forests: elk
and mule deer habitats as an example. Wildlife Society Bulletin 18:87-98.
Franklin, J. F. and C. T. Dyrness 1988. Natural Vegetation or Oregon and Washington. Oregon State University Press. Corvalis, Oregon., USA.
Gaillard, J.-M., M. Festa-Bianchet, N. G. Yoccoz, A. Loison, and C. Toigo. 2000. Temporal variation in fitness components and population dynamics of large herbivores. Annual Review of Ecology and Systematics 31:367–393.
Grey, P. B., and F. A. Servello. 1995. Energy intake relationships for white-tailed deer on winter browse diets. Journal of Wildlife Management 59:147-152.
Henderson J. A., R. D. Lesher, D. H. Peter, and D. C. Shaw. 1992. Field Guide to the Forested Plant Associations of Mt. Baker-Snoqualmie National Forest. USDA Forest Service Technical Paper R6 ECOL TP 028-91.
Hobbs, N. T. 1989. Linking energy balance to survival in mule deer: development and test of a simulation model. Wildlife Monographs No. 101.
Hudson, R. J., and W. G. Watkins. 1986. Foraging rates of wapiti on green and cured pastures. Canadian Journal of Zoology 64:1705-1708.
Julander, O., W. L. Robinette, and D. A. Jones. 1961. Relation of summer range condition to mule deer herd productivity. Journal of Wildlife Management 25:54-60.
Langenau, E. E., Jr., and J. M. Lerg. 1976. The effects of winter nutritional stress on maternal and neonatal behavior on penned white-tailed deer. Applied Animal Ethology 2:207–223.
Leege, T. A. 1984. Guidelines for evaluating and managing summer elk habitat in northern Idaho. Idaho Department of Fish and Game, Wildlife Bulletin Number 11, Boise, Idaho, USA.
Linnell, J. D. C., R. Aanes, and R. Andersen. 1995. Who killed Bambi? The role of predation in the neonatal mortality of temperate ungulates. Wildlife Biology 1:209–223.
Lyon, J. L., T. N. Lonner, J.P. Weigand, C. L. Marcum, W. D. Edge, J. D. Jojnes, D. W. McCleerey, and L. L. Hicks. 1985. Coordinating elk and timber management: final report of the Montana Cooperative Elk-Logging Study, 1970-1985. Montana Department of Fish, Wildlife, and Parks. Bozeman, MT. 53 p.
Lyon, J. L. 1980. Coordinating forestry and elk management. Transactions of the North American Wildlife and Natural Resources Conference 45:278-287.
Mackie, R. J., D. F. Pac, K. L. Hamlin, and G. L. Dusek. 1998. Ecology and management of mule deer and white-tailed deer in Montana. Montana Fish, Wildlife and Parks, Helena, Montana, USA.
Manly, B., L. McDonald, and D. Thomas. 1993. Resource selection by animals: statistical design and analysis for field studies. Chapman and Hall, New York, New York, USA.
Marcum, C. L. 1975. Summer-fall habitat selection and use by a western Montana elk herd. Ph.D. Dissertation, University of Montana, Missoula, Montana, USA.
T21 Final Study Report; 31 December 2003 A-11
Unpublished Work © 2003; Puget Sound Energy, Inc.

Merrill, E. H., and M. S. Boyce. 1991. Summer range and elk population dynamics in Yellowstone
National Park. Pages 263-273 in R. B. Keiter and M. S. Boyce, editors, The Greater Yellowstone Ecosystem: redefining America's wilderness heritage. Yale University Press, New Haven, Connecticut, USA.
Minson, D. J., and J. R. Wilson. 1994. Prediction of intake as an element of forage quality. Pages 533-563 in G. C. Fahey, editor, Forage quality, evaluation, and utilization. ASA: Madison, Wisconsin, USA.
National Research Council. 1984. Nutrient requirements of cattle. Sixth edition. National Academy Press, Washington D.C., USA.
Nelson, J. R., and T. A. Leege. 1982. Nutritional requirements and food habits. Pages 323-367 in J. W. Thomas and D. E. Toweill, editors, Elk of North America: ecology and management. Stackpole Books, Harrisburg, Pennsylvania, USA.
Parker, K. L., M. P. Gillingham, T. A. Hanley, and C. T. Robbins. 1999. Energy and protein balance of free-ranging black-tailed deer in a natural forest environment. Wildlife
Monographs 143:1-48.
Pederson, J. D., and K. T. Harper. 1978. Factors influencing productivity of two mule deer herds in Utah. Journal of Range Management 31:105-110.
Robbins, C. T., T. A. Hanley, A. E. Hagerman, O. Hjelhord, D. L. Baker, C. C. Schwartz, and W. W. Mautz. 1987a. Role of tannins in defending plants against ruminants: reduction in protein availability. Ecology 68:98-107.
Robbins, C. T., S. Mole, A. E. Hagerman, and T. A. Hanley. 1987b. Role of tannins in defending plants against ruminants: reduction in dry matter digestion? Ecology 68:1606-1615.
Roloff, G. J., J. J. Millspaugh, R. A. Gitzen, and G. C. Brundige. 2001. Validation tests ofa spatially explicit habitat effectiveness model for Rocky Mountain elk. Journal of Wildlife Management 65:899-914.
Sams, M. G., R. L. Lochmiller, C. W. Qualls, Jr., D. M. Leslie, Jr., and M. E. Payton. 1996. Physiological correlates of neonatal mortality in an overpopulated herd of white-tailed deer. Journal of Mammalogy 77:179–190.
Swihart, R. K., H. P. Weeks, Jr., A. L. Easter-Pilcher, and A. J. DeNicola. 1998. Nutritional condition and fertility of white-tailed deer (Odocoileus virginianus) from areas with contrasting histories of hunting. Canadian Journal of Zoology 76:1932–1941.
Spalinger, D. E., and N. T. Hobbs. 1992. Mechanisms of foraging in mammalian herbivores: new models of functional response. American Naturalist 140:325-348.
Thomas, J. W., D. A. Leckenby, M. Henjum, R. J. Pedersen, and L. D. Bryant. 1988. Habitat-effectiveness index for elk on Blue Mountain Winter ranges. U.S. Forest Service General Technical Report PNW-GTR-218.
Unsworth, J. W., L. Kuck, E. O. Garton, and B. R. Butterfield. 1998. Elk habitat selection on the Clearwater National Forest, Idaho. Journal of Wildlife Management 62:1255-1263.
T21 Final Study Report; 31 December 2003 A-12
Unpublished Work © 2003; Puget Sound Energy, Inc.

Verme, L. J. 1963. Effect of nutrition on growth of white-tailed deer fawns. Transactions of the
North American Wildlife and Natural Resources Conference 28:431–442.
Verme, L. J. 1969. Reproductive patterns of white-tailed deer related to nutritional plane. Journal of Wildlife Management 33:881–887.
Verme, L. J., and D. E. Ullrey. 1984. Physiology and nutrition. Pages 91-108 in L. K. Halls, editor, White-tailed deer: ecology and management. Stackpole Books, Harrisburg, Pennsylvania, USA.
Wallmo, O. C., L. H. Carpenter, W. L. Regelin, R. B. Gill, and D. L. Baker. 1977. Evaluation of deer habitat on a nutritional basis. Journal of Range Management 30:122-127.
Whitten, K. R., G. W. Garner, F. J. Mauer, and R. B. Harris. 1992. Productivity and early calf survival in the porcupine caribou herd. Journal of Wildlife Management 56:201–212.
Wickstrom, M. L., C. T. Robbins, T. A. Hanley, D. E. Spalinger, and S. M. Parrish. 1984. Food intake and foraging energetics of elk and mule deer. Journal of Wildlife Management 48:1285-1301.
Wisdom, M. J., L. R. Bright, C. G. Carey, W. W. Hines, R. J. Pedersen, D. A. Smithey, J. W. Thomas, and G. W. Witmer. 1986. A model to evaluate elk habitat in western Oregon. U.S. Department of Agriculture Forest Service Publication Number R6-F&WL-216-1986.
T21 Final Study Report; 31 December 2003 A-13
Unpublished Work © 2003; Puget Sound Energy, Inc.
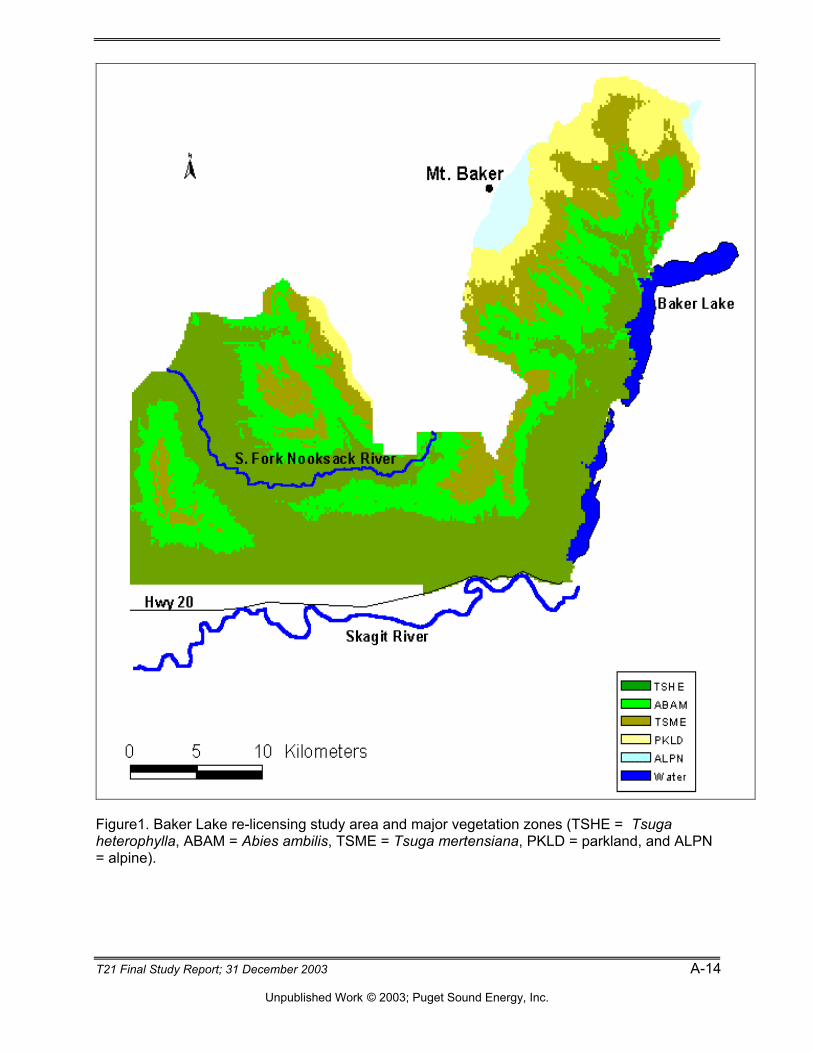
Figure1. Baker Lake re-licensing study area and major vegetation zones (TSHE = Tsuga heterophylla, ABAM = Abies ambilis, TSME = Tsuga mertensiana, PKLD = parkland, and ALPN = alpine).
T21 Final Study Report; 31 December 2003 A-14
Unpublished Work © 2003; Puget Sound Energy, Inc.
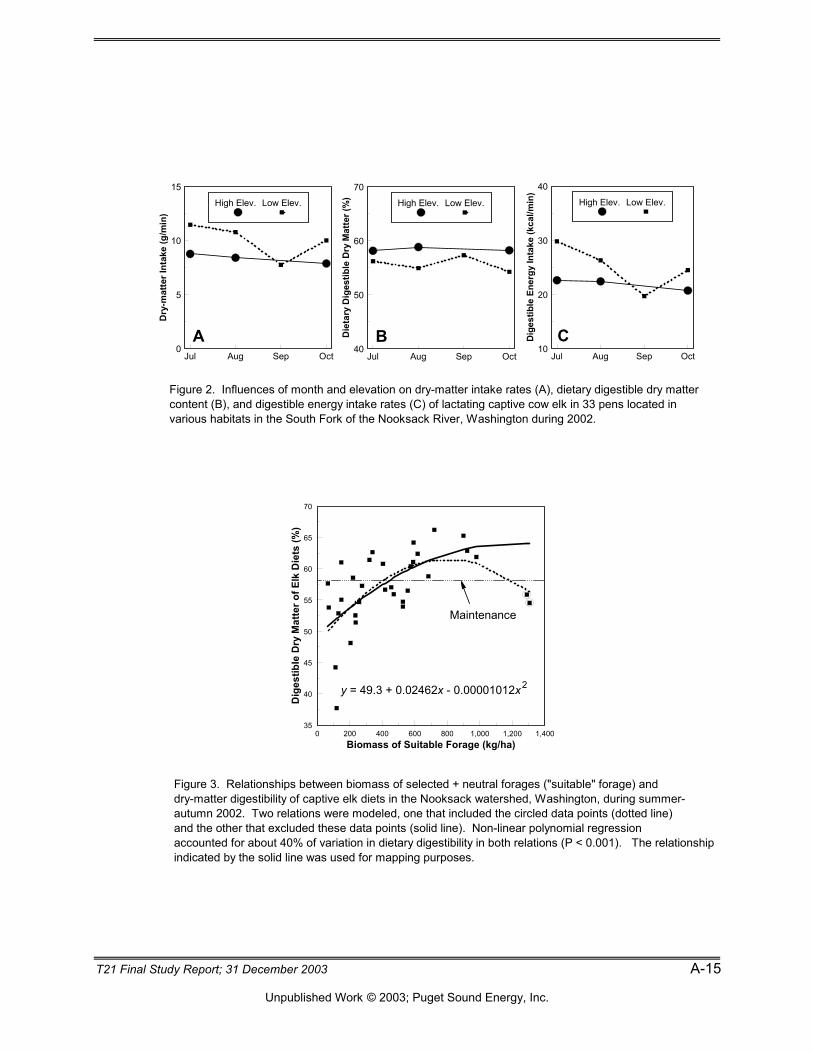
T21 Final Study Report; 31 December 2003 A-15
AJul Aug Sep Oct
0
5
10
15
Dry
-mat
ter I
ntak
e (g
/min
)
High Elev. Low Elev.
Jul Aug Sep Oct40
50
60
70
Die
tary
Dig
estib
le D
ry M
atte
r (%
) High Elev. Low Elev.
Jul Aug Sep Oct10
20
30
40
Dig
estib
le E
nerg
y In
take
(kca
l/min
)
High Elev. Low Elev.
0 200 400 600 800 1,000 1,200 1,40035
40
45
50
55
60
65
70
Biomass of Suitable Forage (kg/ha)
Dig
estib
le D
ry M
atte
r of E
lk D
iets
(%)
Maintenance
B C
Figure 2. Influences of month and elevation on dry-matter intake rates (A), dietary digestible dry matter content (B), and digestible energy intake rates (C) of lactating captive cow elk in 33 pens located in various habitats in the South Fork of the Nooksack River, Washington during 2002.
Figure 3. Relationships between biomass of selected + neutral forages ("suitable" forage) anddry-matter digestibility of captive elk diets in the Nooksack watershed, Washington, during summer-autumn 2002. Two relations were modeled, one that included the circled data points (dotted line) and the other that excluded these data points (solid line). Non-linear polynomial regression accounted for about 40% of variation in dietary digestibility in both relations (P < 0.001). The relationshipindicated by the solid line was used for mapping purposes.
y = 49.3 + 0.02462x - 0.00001012x2
Unpublished Work © 2003; Puget Sound Energy, Inc.

Figure 4. Elk forage value classes (excellent, good, marginal, poor) in the Baker Lake study area. No areas ranked in the excellent forage value class, 13% of the classified habitat (excluding “No Data”) was good or marginal, and over 80% was ranked as poor.
T21 Final Study Report; 31 December 2003 A-16
Unpublished Work © 2003; Puget Sound Energy, Inc.

0
100
200
300
400
500
600
700
800
900
C1 C2 C3 C4 C5 D5 C1 C2 C3 C4 C5 D5 C1-2 C4-5
TSHE ABAM TSMEForest Zone & Canopy Class
Kg/
ha
Figure 5. Estimated average biomass (+ 1 standard error) by forest zone and canopy class. With the exception of deciduous stands (D5), suitable forage biomass declined considerably above 40% canopy closure (C2). Descriptions of each habitat class are presented in Table 3.
T21 Final Study Report; 31 December 2003 A-17
Unpublished Work © 2003; Puget Sound Energy, Inc.

Table 1. Sample sizes (N. pens) of elk pens and Ivlev’s index for selected, neutral and avoided plant species.
Category Species N. Pens Ivlev Selected Acer circinatum 16 0.36 Acer macrophylum 14 0.49 Agrostis spp. 10 0.49 Anaphalis margaritacea 15 0.44 Carex spp. 28 0.25 Clintonia uniflora 12 0.79 Cornus cornuta 8 0.54 Dactylis glomerata 2 0.91 Galeopsis tetrahit 2 0.55 Lonicera ciliosa 2 0.36 Maianthemum dilatatum 14 0.57 Oplopanax horridus 4 0.76 Rhamnus purshiana 6 0.42 Rubus parviflorus 23 0.37 Salix spp. 11 0.61 Smilacena spp. 2 0.97 Sorbus sitchensis 11 0.87 Spiraea douglasii 8 0.67 Stellaria calycantha 3 0.69 Symphoricarpos spp. 9 0.41 Trifolium spp. 2 0.97 Trientalis latifolia 6 0.38 Valeriana sitchensis 4 0.53 Neutral Adiantum pedatum 6 -0.29 Agrostis exarata 3 0.50 Alnus rubra 18 -0.01 Alnus sinuata 5 0.26 Aruncus sylvester 2 -0.20 Asarum caudatum 2 -0.25 Athyrium filix-femina 23 -0.25 Bromus vulgaris 8 -0.16 Buddleja davidii 11 0.43
Chrysanthemum leucanthemum 3 0.27
Cirsium spp. 7 -0.22 Cornus canadensis 12 0.03 Crepis spp. 2 0.22 Deschampsia elongata 5 0.03 Dicentra formosa 7 0.15 Disporum smithii 5 0.09 Dryopteris austriaca 11 -0.22 Elymus spp. 13 0.13 Epilobium angustifolium 22 0.13 Epilobium watsonii 6 -0.17 Equisetum spp. 4 -0.16
T21 Final Study Report; 31 December 2003 A-18
Unpublished Work © 2003; Puget Sound Energy, Inc.
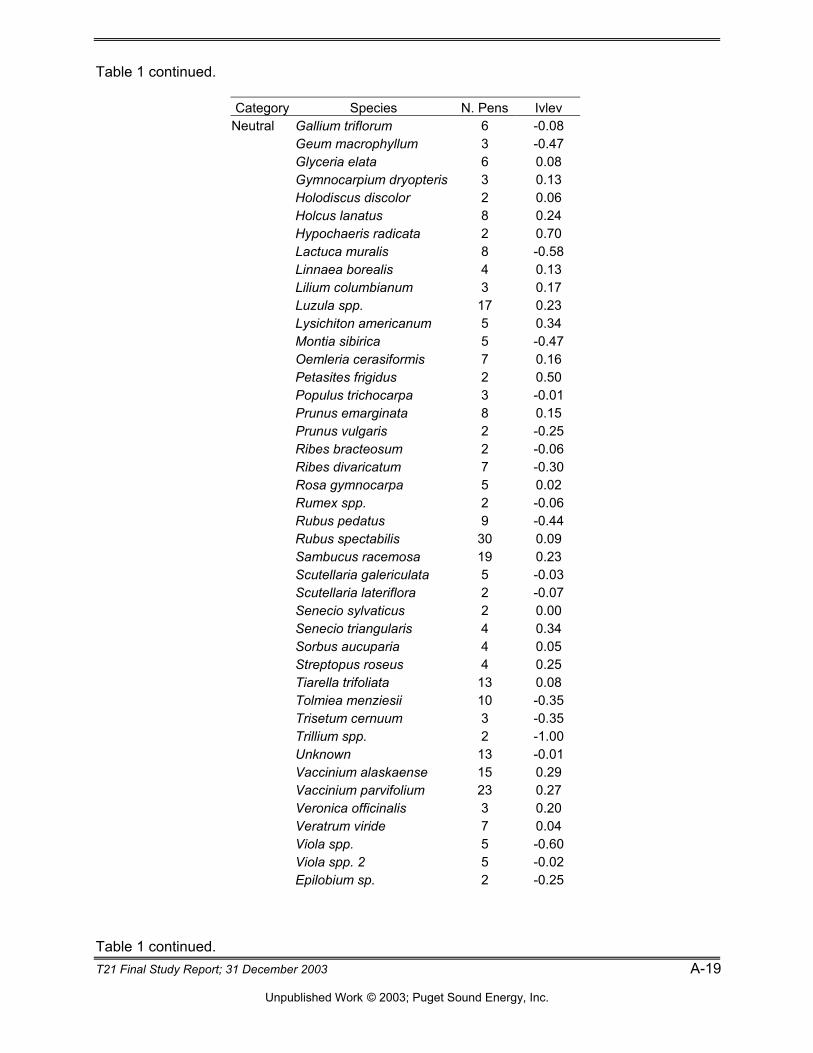
Table 1 continued.
Category Species N. Pens Ivlev Neutral Gallium triflorum 6 -0.08 Geum macrophyllum 3 -0.47 Glyceria elata 6 0.08 Gymnocarpium dryopteris 3 0.13 Holodiscus discolor 2 0.06 Holcus lanatus 8 0.24 Hypochaeris radicata 2 0.70 Lactuca muralis 8 -0.58 Linnaea borealis 4 0.13 Lilium columbianum 3 0.17 Luzula spp. 17 0.23 Lysichiton americanum 5 0.34 Montia sibirica 5 -0.47 Oemleria cerasiformis 7 0.16 Petasites frigidus 2 0.50 Populus trichocarpa 3 -0.01 Prunus emarginata 8 0.15 Prunus vulgaris 2 -0.25 Ribes bracteosum 2 -0.06 Ribes divaricatum 7 -0.30 Rosa gymnocarpa 5 0.02 Rumex spp. 2 -0.06 Rubus pedatus 9 -0.44 Rubus spectabilis 30 0.09 Sambucus racemosa 19 0.23 Scutellaria galericulata 5 -0.03 Scutellaria lateriflora 2 -0.07 Senecio sylvaticus 2 0.00 Senecio triangularis 4 0.34 Sorbus aucuparia 4 0.05 Streptopus roseus 4 0.25 Tiarella trifoliata 13 0.08 Tolmiea menziesii 10 -0.35 Trisetum cernuum 3 -0.35 Trillium spp. 2 -1.00 Unknown 13 -0.01 Vaccinium alaskaense 15 0.29 Vaccinium parvifolium 23 0.27 Veronica officinalis 3 0.20 Veratrum viride 7 0.04 Viola spp. 5 -0.60 Viola spp. 2 5 -0.02 Epilobium sp. 2 -0.25
Table 1 continued. T21 Final Study Report; 31 December 2003 A-19
Unpublished Work © 2003; Puget Sound Energy, Inc.

Category Species N. Pens Ivlev Avoided Abies amabalis 11 -1.00 Abies procera 2 -1.00 Berberis nervosa 11 -0.57 Blechnum spicant 12 -0.97 Circea alpina 5 -0.80 Gaultheria ovatifolia 7 -0.95 Gaultheria shallon 10 -0.56 Ilex spp. (Holly) 3 -0.67 Juncas spp. 4 -0.56 Menziesia ferruginea 12 -0.89 Phyllodoce empetriformis 2 -1.00 Polystichum munitum 25 -0.99 Pseudotsuga menziesii 11 -0.67 Pteridium aquilinium 21 -0.40 Rhododendron albiflorum 3 -0.87 Rubus discolor 11 -0.39 Rubus lacinatus 11 -0.66 Rubus leucodermis 9 -0.43 Rubus ursinus 24 -0.83 Solanum dulcamara 4 -1.00 Taxus brevifolia 4 -1.00 Thuja plicata 8 -1.00 Tsuga heterophylla 16 -1.00 Tsuga mertensiana 5 -1.00 Urtica dioicia 2 -1.00 Vaccinium membranaceum 6 -0.96 Veronica americana 2 -1.00
T21 Final Study Report; 31 December 2003 A-20
Unpublished Work © 2003; Puget Sound Energy, Inc.

Table 2. Plant species occurring in only 1 elk pen thus precluding calculation of confidence intervals for Ivlev’s index. These uncommon species were excluded from all analyses of forage value.
Species Alnus incana Angelica genuflexa Aruncus sylvester Bromus spp. Calamagrostis canadensisCinna latifolia Cornus stolonifera Digitalis purpurea Fragaria vesca Glyceria spp. Hieracium albiflorum Hypericum perforatum Phalaris arundinacea Phleum pratense Pinus monticola Plantago spp. Poa spp. Poa pratensis Pyrus communis Pyrus fusca Ranunculus spp. Ribes sanquineum Rosa spp. Rumex occidentalis Stellaria crispa Stellaria simcoei Tanacetum vulgare Tellima grandiflora Tofieldia glutinosa Trientalis latifolia
T21 Final Study Report; 31 December 2003 A-21
Unpublished Work © 2003; Puget Sound Energy, Inc.

T21 Final Study Report; 31 December 2003 A-22
Unpublished Work © 2003; Puget Sound Energy, Inc.
Table 3. Number of sampled sites (N), estimated forage (kg/ha), estimated digestibility (%), forage value ranking, scaled index (0 to 1) of forage value ranking, total area (ha) and percent of total area (Pct) for habitat classes based on forest zone (F. Zone) and canopy cover (%) class (Class).
F. Zone Class Range N Forage SE Digestibility SE Rank Index Area Pct
TSHE C1 0-20 20 787.17 94.62 60.69 0.73 Good 0.71 562.32 0.72
C2 21-40 4 372.31 147.36 56.40 2.41 Marginal 0.43 2375.26 3.06
C3 41-60 7 133.37 38.72 52.31 0.81 Poor 0.15 3447.18 4.43
C4 61-80 8 134.67 29.45 52.37 0.64 Poor 0.16 6839.25 8.80
C5 81-100 37 71.80 16.71 50.91 0.36 Poor 0.06 18484.28 23.78
D5 80-100 6 437.66 45.65 58.03 0.73 Marginal 0.54 3909.29 5.03
ABAM C1 0-20 19 690.21 71.51 60.54 0.77 Good 0.70 160.69 0.21
C2 21-40 4 500.84 132.24 58.56 1.89 Marginal 0.57 1139.89 1.47
C3 41-60 4 187.11 64.00 53.43 1.33 Poor 0.23 2327.54 2.99
C4 61-80 4 115.84 44.66 51.96 1.00 Poor 0.13 4459.13 5.74
C5 81-100 9 16.14 4.30 49.69 0.10 Poor 0.00 13294.23 17.10
D5 80-100 2 391.53 165.65 57.11 2.77 Marginal 0.47 110.46 0.14
TSME C1-2 0-40 6 759.56 80.78 61.83 0.88 Good 0.79 1965.86 2.53
C4-5 61--100 2 55.74 29.68 50.63 0.70 Poor 0.04 3921.9 5.04
No Data -- -- -- -- -- -- -- -- -- 14748.1 18.97