baffin island experimental oil spill and … · macoma macoma calcarea f rom the baff in island oil...
TRANSCRIPT
BAFFIN ISLAND EXPERIMENTAL OIL SPILL AND DISPERSANT STUDIES.
HYDROCARBON BIOACCUMULATION AND HISTOPATHOLOGICAL AND
BIOCHEMICAL RESPONSES IN MARINE BIVALVE MOLLUSCS
by
Jerry M. NeffRobert E. Hillman
Paul D. Boehm
BattelleNew England Marine Research Laboratory
Duxbury, Massachusetts
Final ReportOuter Continental Shelf Environmental Assessment Program
Research Unit 615
February 1984
1
TABLE OF CONTENTS
List of FiguresList of Tables
SUMMARY
1. INTRODUCTION
l . l Objectives of
1.2 Background
the Research Program
1.2.1 Hydrocarbon Accumulation1.2.2 Histopathology1.2.3 Biochemistry/Physiology
2. HYDROCARBON BIOACCUMULATION
2.1 Materials and Methods2.2 Results
2.2.4.12.2 .4 .22.2 .4 .32.2 .4 .42.2 .4 .5
2.3 Discussion
3. HISTOPATHOLOGY
3.1 Materials and
Heterocyclics
PANH Compounds in OilAs ta r te bo;ealis: Bay 9: 1 DayAstarte borealis: Bay 9: 2 WeeksSerripes q roenlandicus: Bay 10: 1 DaySerripes qroen Iandicus: Bay 10: 2 Weeks
Methods
3.1.1 Collections3.1 .2 Processing
3.2 Results
3.2.1 & truncata3.2 .2 Macoma calcarea
57
9
11
12
12
121314
15
1515
19343434
5656565656
57
65
65
6565
68
6875
3.3 Discussion 75
3
4. BIOCHEMICAL EFFECTS OF OIL
4.1 Materials and Methods4.2 Results4.3 Discussion
4.3.1 Weight-Length Relationships of Bivalves
5. LITERATURE CITED
6. APPENDICES
1: PANH Compounds in Oil
11: Astarte borealis: Bay 9: 1 Day
I l l : Astarte borealis: Bay 9: 2 Weeks
Iv: Serripes qroen Iandicus: Bay 10: 1 Day
v: Serripes g roenlandicus: Bay 10: 2 Weeks
79
798192
94
97
103
103
113
123
133
145
4

LIST OF FIGURES
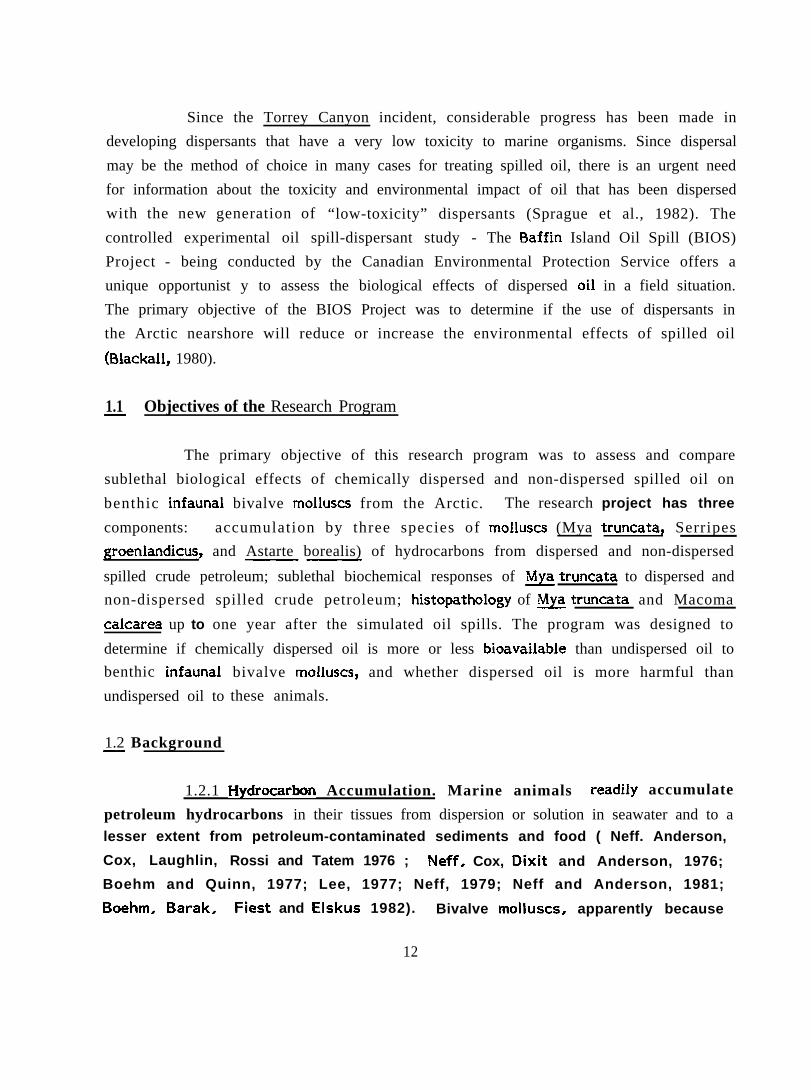
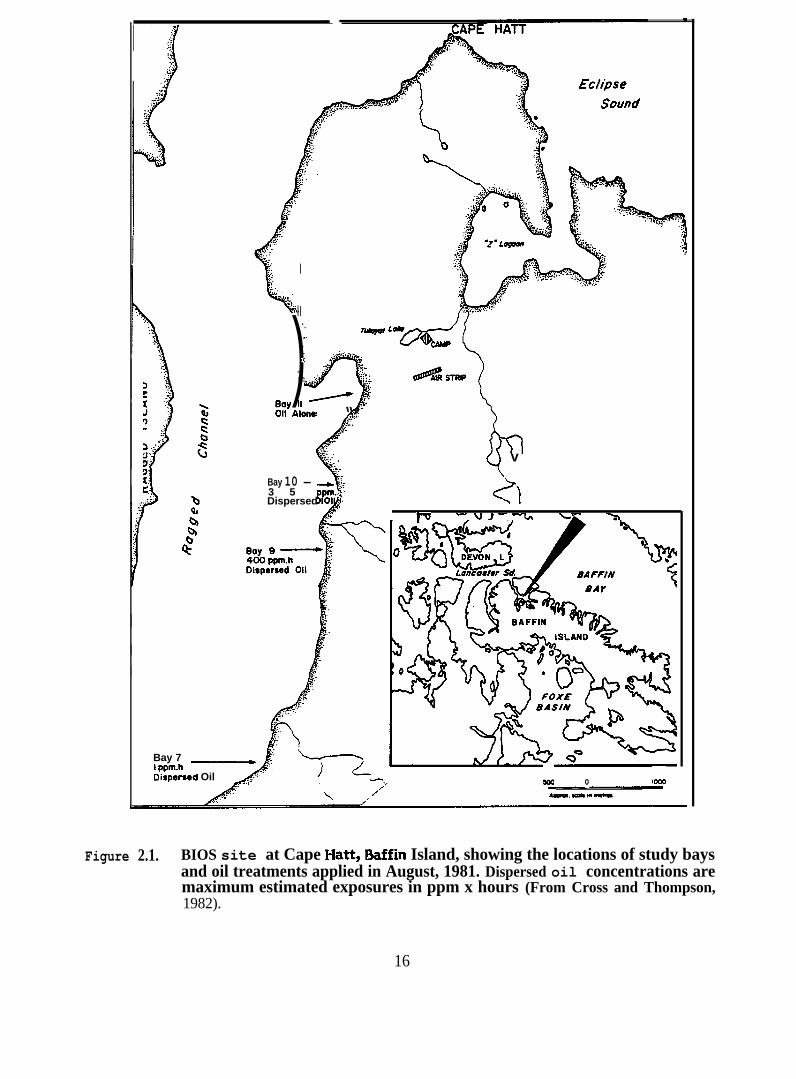
Figure 2.1. BIOS site at Cape Hatt, Baffin Island, showing thelocations of study bays and oil treatments appliedin August, 198 L Dispersed oil concentrations aremaximum estimated exposures in ppm x hours (FromCross and Thompson, 1982)
Figure 2.2. ~ aromatic profiles (by GC2/MS), (Bay 9)
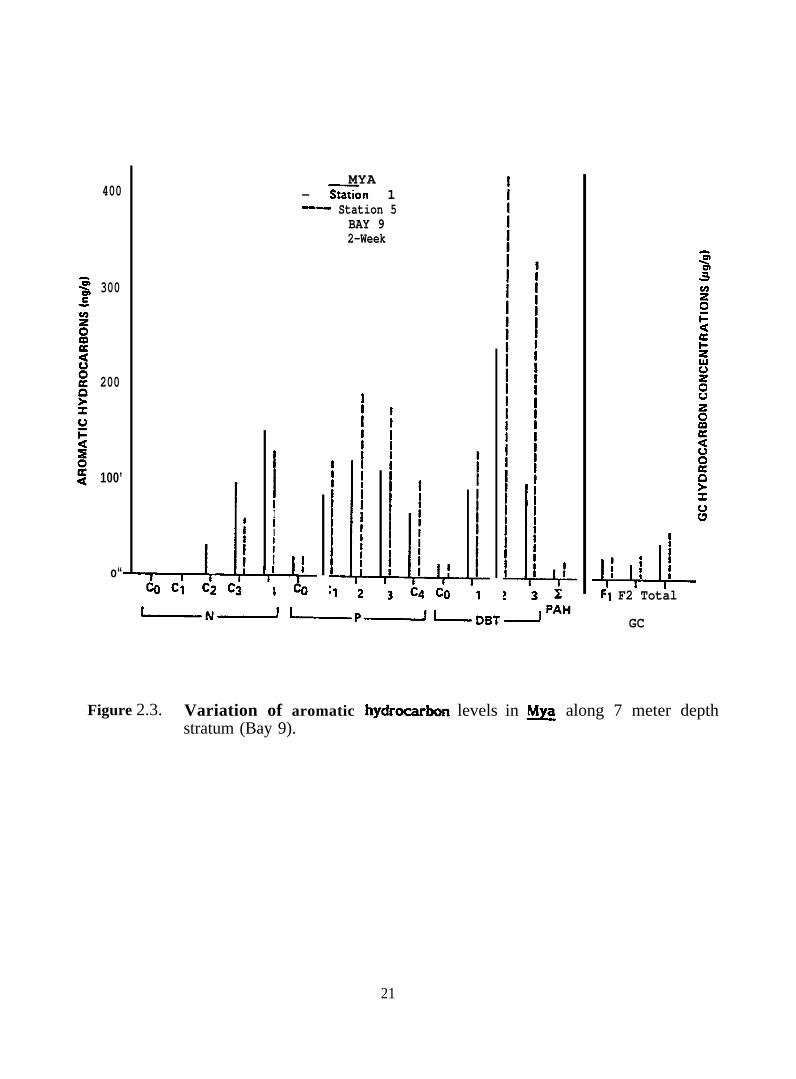
F@ure 2.3. Variation of aromatic hydrocarbon levels in N&along 7 meter depth stratum (BaY 9)
F@re 2.4. Concentrations of oil in ~ truncata, 13ay 9 by UV/F (@g)
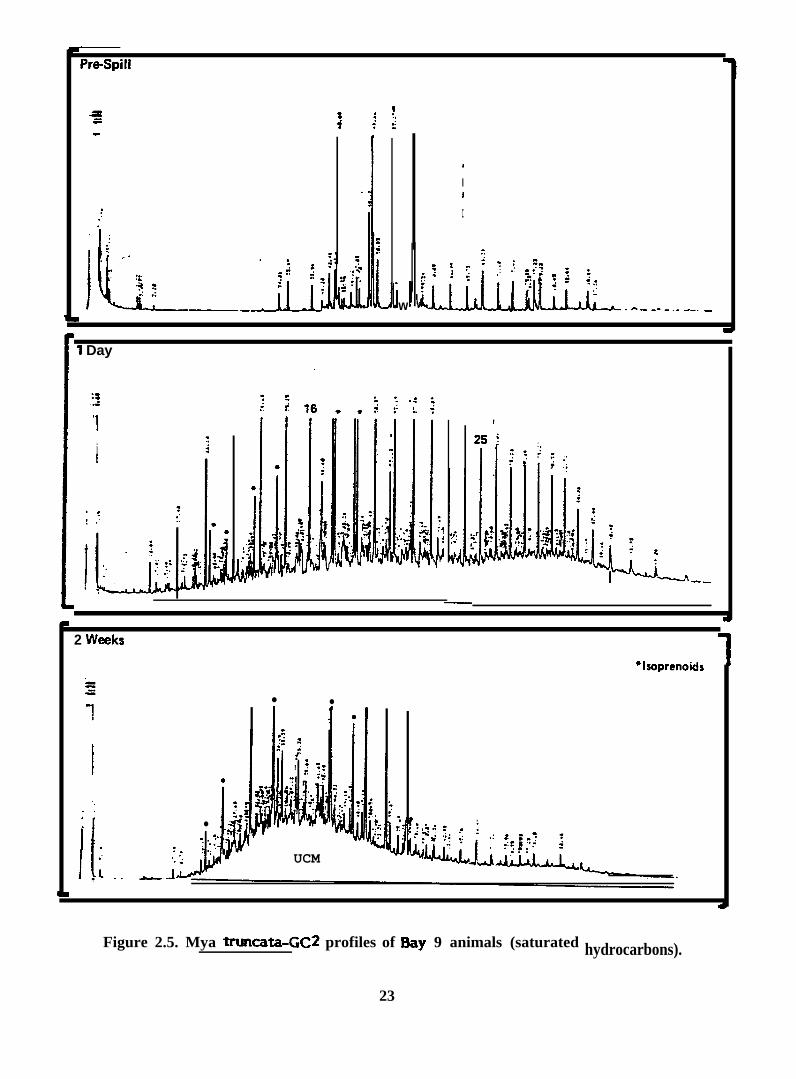
Figure 2.5. lk& truncata-GC2 profiles of Bay 9 animals (Satiatedhydti~]
F@re 2.6. ~ truncata-GC2profiles of Bay 9 animals (aromatics)
F@ure 2.7. Aromatic profiles from ~ exposed to oil, illustratingchanges in concentrations over 2 weeks, (Bay 10)
Figure 2.8. Concentrations of oil in N@ truncata, Bay 10 by UV/F (@g)
Figure 2.9. Mya truncatq aromatic profiles of Bays 7 & 11 by GC2/MS
Figure 2.10. Concentrations of oil in ~ truncata, Bay 7 UV/F (vgk)
F@ure 2.11. ~ truncata-GC2 profiles of Bay 7 animals (saturates)
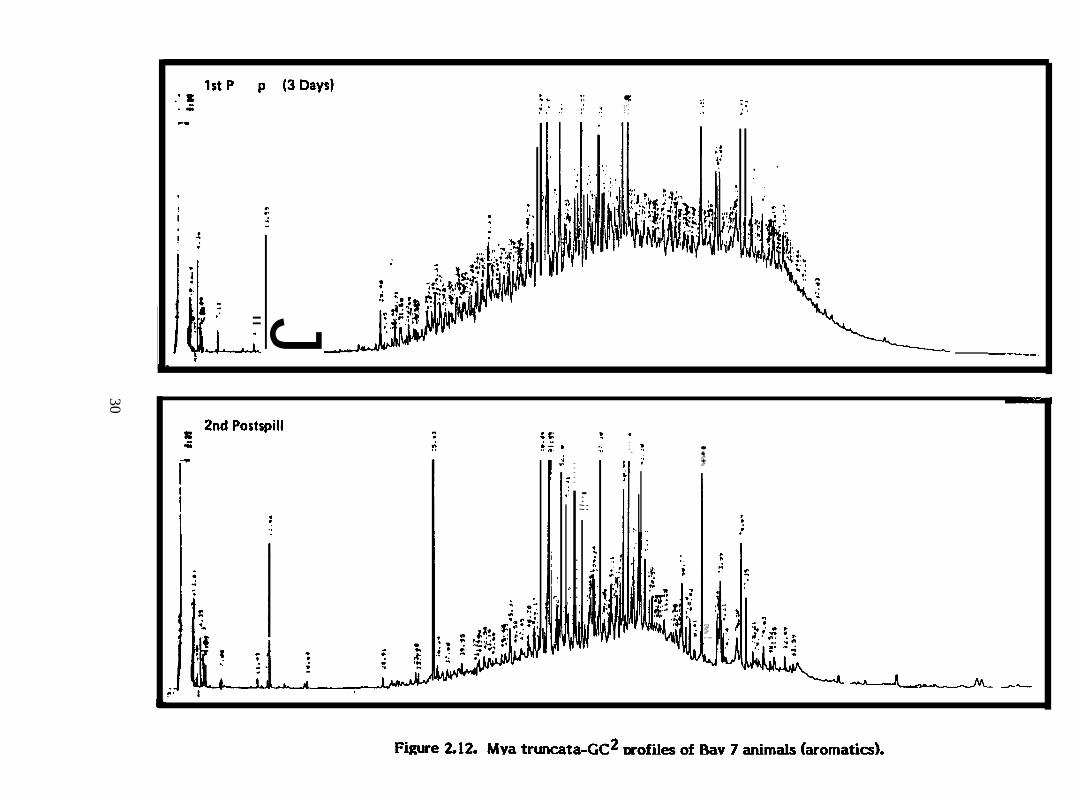
F@re 2.12. ~ truncata-GC2 profiles of Bay 7 animals (aromatics)
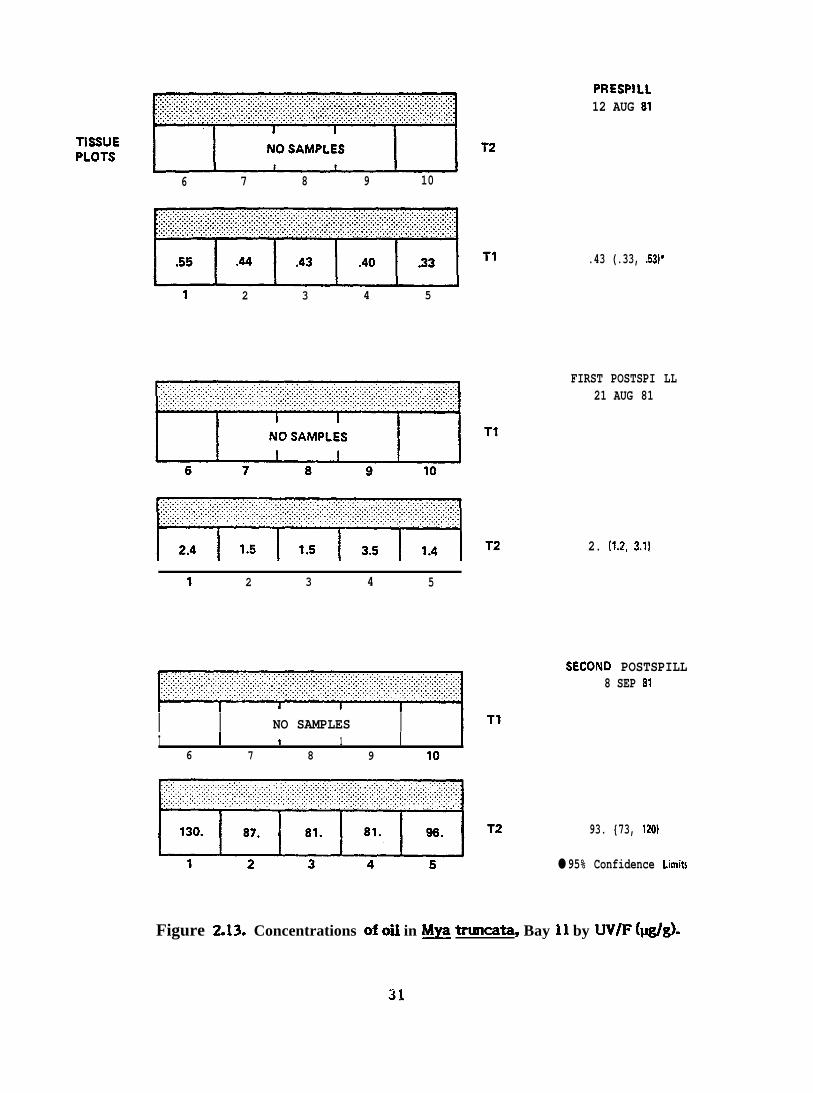
Figure 2.13. Concentrations of oil in A@ trmta, BaY 11 by UV/F (@g)
Figure 2.14. ~ truncata-Bay 11 (saturates)
Figure 2.15. ~ truncata-Bay 11 (aromatics)
Figure 2.16. Serripes aromatic profiles (by GC2/MS), (Bay 9)
Figure 2.17. Variation of aromatic hydrocarbon levels in Serripes along7 meter depth stratum (Bay 9)
Figure 2.18. Concentrations of oil in Serripes, Bay 9 by UV/F (@g)
Figure 2.19. Serri=e_-=2”0f””0f “y9tim”s
Figure 2.20. Serripes aromatic profiles, (Bay 10)
Figure 2.21. Concentrations of oil in Serripes, Bay 10 by UV/F (@g)
Figure 2.22. Aromatic hydrocarbons in Serripes-Bay 10, (3 meters)
Figure 2.23. Aromatic hydrocarbon profiles in Serripes by GC2/MS(Bay 7 and li)
5
F@ure 2.24.
Figure 2.25.
Figure 2.26.
Figure 2.27.
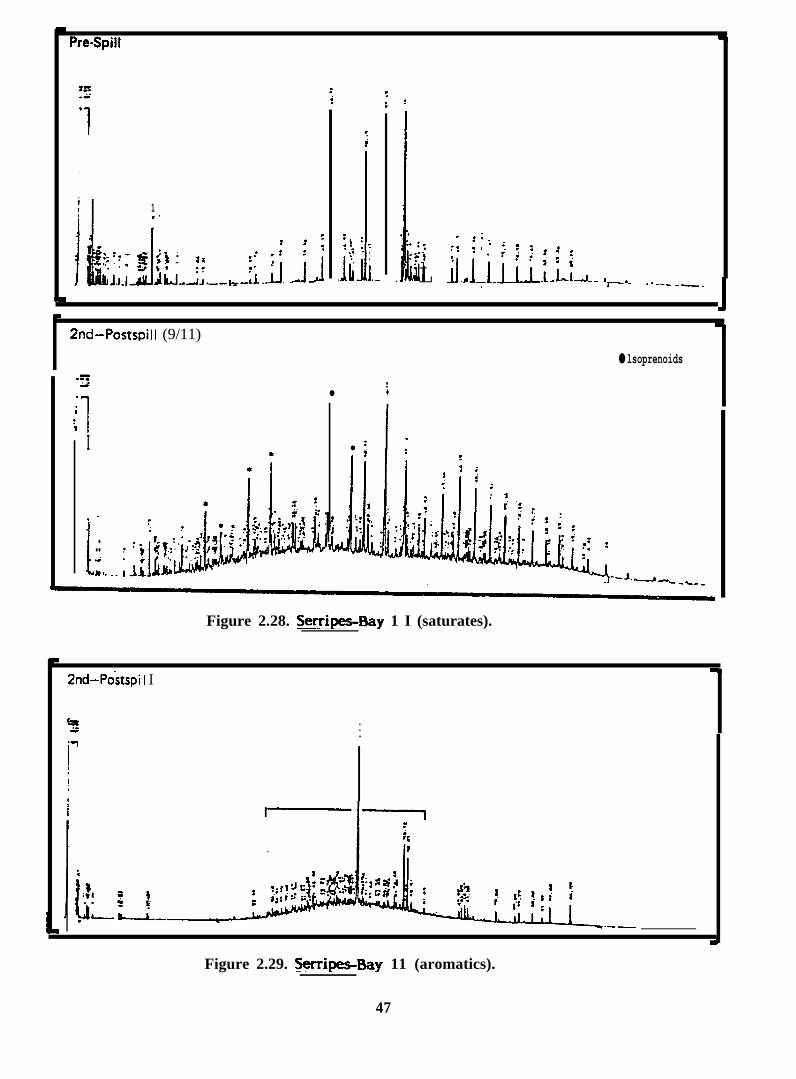
Figure 2.28.
Figure 2.29.
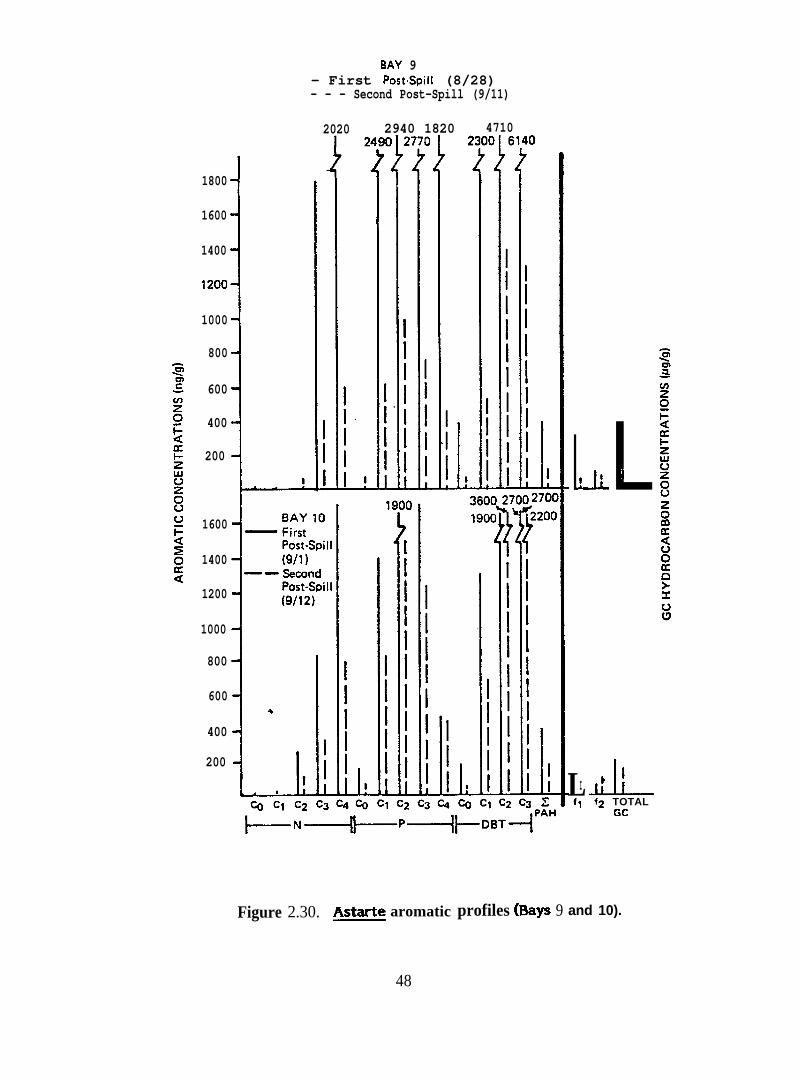
Figure 2.30.
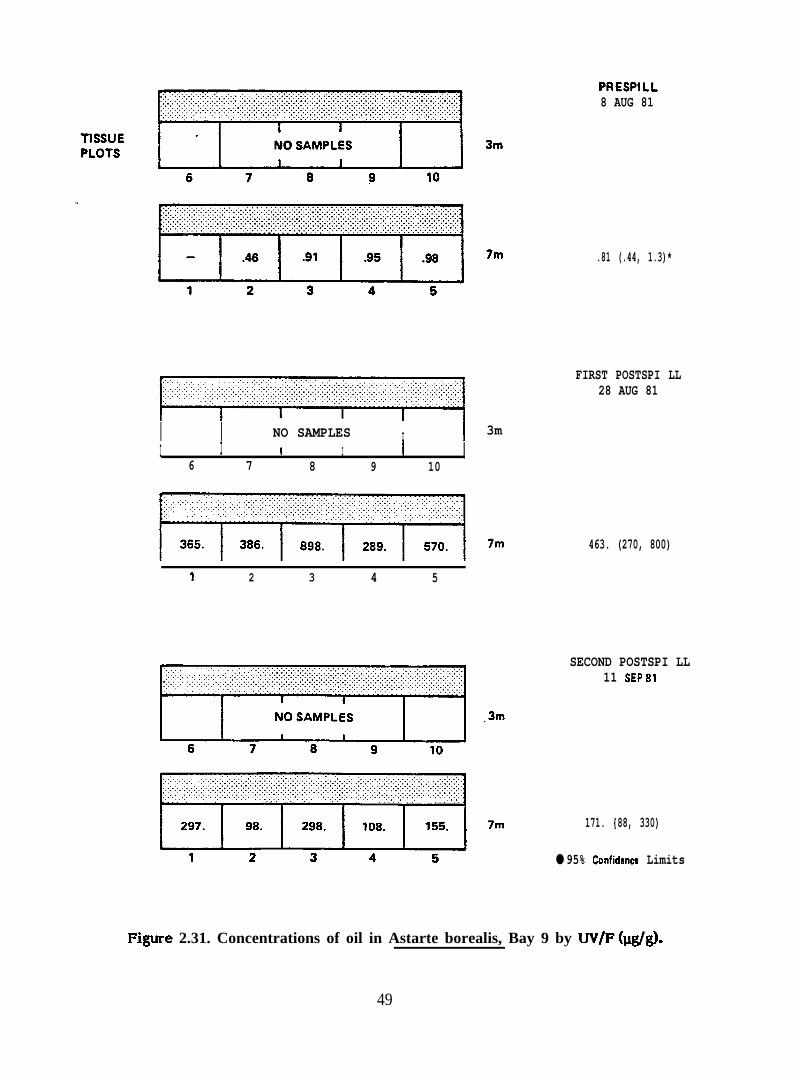
Figure 2.31.
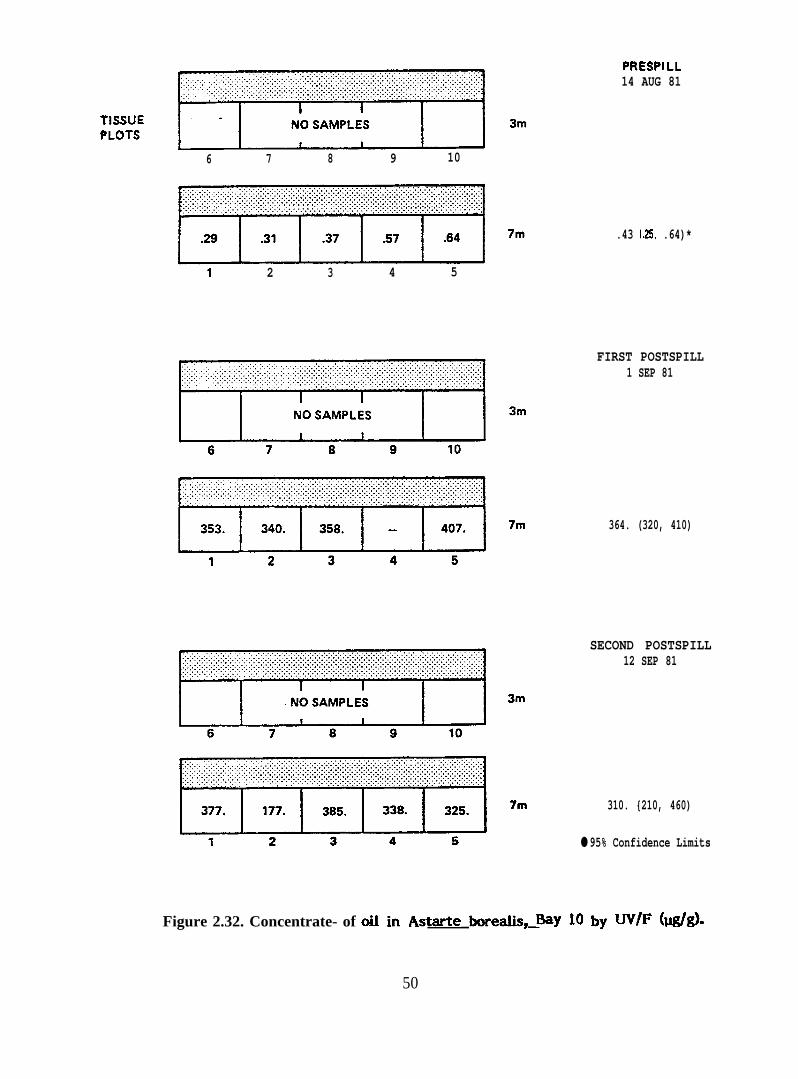
Figure 2.32.
Figure 2.34.
F&ure 2.35.
F@re 2.36.
Figure 2.37.
Figure 3.1.
Figure 3.2.
Figure 3.3.
Figure 3.4.
- Figure 3.5.
. . ---- -.Aromatic hyclrocartxm proxws 01
Concentrations of oil in Serripes,
Serripes-Bay 7 (aromatics)
Concentrations of oil in Serripes,
Serripes-Bay i 1 (saturates)
Serripes-Bay 11 (aromatics)
2S!UE p==
&ly 7 by UV/F (@g)
My 11 by UV/F (@g)
Astarte aromatic profiles (Bays 9 and 10)
Concentrations of oil in Astarte bore~ls, Bay 9 by UV/F (@g)
Concentrations of oil in Astarte borealis, Bay 10 by UV/F (@g)
Saturated hydrocarbon GC2 profiles of Astarte sample f rom Bay 9
Aromatic hydrocarbon GC2 profiles of Astarte sample compositefrom Bay 9
Astarte aromatic profiles (Bays 7 and 11)
Concentrations of oil in Astarte borealis, Bay 7 by UV/F (@g)
Concentrations of oil in Astarte borealis, Bay 11 by UV/F (@g)
Granuhxytoma in testis of truncate soft-shelled clam,* truncata, from Bay 9 one year following oil spill
Neoplastic hemocytes in tissues of the truncate soft-shelledclam, Mya truncata, collected from Bay 7 immediately followingthe oil spill
Hematopoietic neoplasm in digestive tubule area of truncatesoft-shelled clam, ~ truncata, collected from Bay 11 oneyear after oil spill. hJote invasion of digestive tubules byneoplastic cells (arrows)
Normal digestive tubules of the chalky macoma, Macoma calcarea,from Bay 11 one year following the oil spill
Excessively vacuolated digestive tubules of the chalky Macoma,Macoma cakarea, from Bay 11 one year following the oif spill
““
LIST OF TABLES
Table 2.1.
Table 3.1
Table 3.2.
Table 3.3.
Table 3.4.
Table 3.5
Table 3.6.
Table 3.7.
Table 4.1.
Table 4.2.
Table 4.3.
Table 4.4.
Summary of oil Concentrations a in mollusc
ky h @g dry weight)
Dates of collection and collection sites for
tissues by
soecimens of Mvatruncata collections for BIOS histopathology”investigatim—
Dates of collection and collection sites for specimens of Macomacalcarea collections for BIOS histopathology investigation
Summary of histopathological observations of tissues of the truncatesoft-shelled clam ~ truncata f rom the Baffin Island oil spillarea prior to the application of oil and dispersant
Summary of histopathological observations of tissues of the truncatesoft-shelled clam ~ truncata f rom the Baffin Island oil spillarea immediately following the application of oil and dispersant
Summary of histopathologi~ observations of tissues of the truncatesoft-shelled clam ~ truncata f rom the Baffin Island oil spill areaone year following the application of oil and dispersant
Summary of histopatholigical observations of tissues of the chalkymacoma Macoma calcarea from the Baffin Island oil spill area priorto and immediately f ollowing the application of oil and dispersant
Summary of histopathologbl observations of tissues of the chalkyMacoma Macoma calcarea f rom the Baff in Island oil spill area meyear following the application of oil and dispersant
Carbohydrates and lipids in tissues of the truncated soft-shell clam& truncata collected from the BIOS site before and after thesimulated oil spill
Concentrations of petroleum hydrocarbons, glucose and glycogen intissues of truncate soft-shell clams * tr-ta collected atStations 1-5 along the 7-meter isobath in four bays and stations6-10 along the 3-meter isobath in two bays. samples were takenduring the second postspill sampling period
Mean concentrations of free amino acids in adductor muscles oftruncate soft-shell clams ~ truncata collected from the fourBIOS experimental bays before the simulated oil spills
Mean concentrations of free amino acids in adductor muscles oftruncate soft-shell clams ~ truncata collected from the fourB1OS experimental bays one to three days after the simulatedoil spills

Table 4.5. Mean concentrations of free amino acids in adductor musclesof truncate soft-shell clams ~ truncata collected from thefour BIOS experimental bays 14 days after the simulated oilspills. Values are in @l/mg dry wt. and are the mean andstandard error from 10 to 20 replicate animals. The numberof clams analyzed is given in parentheses
Table 4.6. Molar ratio of taurhe to glycine and the sum of the concentrationsof threonine plus serine in the free amino acid pool of adductormuscles of truncate soft-shell clams * truncata from the fourBIOS experimental bays. Concentrations of threonine plus serineare in l,tM/mg dry weight and are the mean and standard error of7 to 20 replicate animals per treatment. The number of clamsanalyzed is given in parentheses
Table 4.7. A summary of associated pairs of biochemical parameters inll& truncata determined by the Spearman Rank Correlation Test.Data are tabulated by pairs shared among bays and by samplingtimes
Table 4.8. The number of associated pairs of biochemical parameters in thetruncata clam & truncata collected from the BIOS experimentalbays at three sampling times. Bay combinations denote pairedassociations which are shared
8
Infaunal bivalve tnolluscs from four bays at the B1OS experimental oil spill site
became contaminated with petroleum hydrocarbons. Bay 7 was considered a reference
bay (though it received some oil), Bays 9 and 10 received dispersed oil, and Bay 11
received oil alone. ALagomedio crude oil and the dispersant, Corexit 9527, were usedin
these field experiments. I& truncata a n d Serripes ~roenlandicus, which are filter-
feeders, rapidly accumulated dispersed oil in Bays 7, 9 and 10 immediately after thespilf,
but released much of the hydrocarbons by the second post-spill sampling about two weeks
after the spill. The deposit feeders, ?vlacoma calcarea, Astarte borealis, and Nuculana—— ——minuta, accumulated more oil than did the filter-feeders (presumably from the sediments)
and retained them longer in Bays 9 and 10. In Bay 11, all five species accumulated very
little oil immediately after the spill but became heavily contaminated within about two
weeks. Bay 7 received about 50-100 ppb dispersed oil in the first few days after the
dispersed oil spill. This was about 1,000-fold less than the amount in the water of Bay 9.
Nevertheless, the molluscs, especially Serripes, from Bay 7 became moderately heavily
contaminated with oil.
Based on chemical data, both %& and Serripes depurated oil during the two-
week post-spill period, in part through an in vivo biodegradation presumably by microbial.—activity in the guts of the animals. However, Serripes preferentially retained the high
molecular weight saturated hydrocarbon assemblage as well as the higher alkylated
naphthalene, phenanthrene and dibenzothiophene compounds, whereas & depurated all
hydrocarbon components although the water-soluble alkyl benzenes and naphthalenes were
depurated somewhat faster. The filter-feeders depurated oil even though the sediments in
which they resided still contained oil. However, the deposit feeders continued to
accumulate oil from the sediments, at least for the two weeks after the spills.
S p e c i m e n s o f A& truncata a n d Macoma calcarea f o r histopathologic
examination were collected immediately before, immediately after, and one year after
the experimental oil spills. Immediately after the spill, there was an increased incidence
of gill and digestive tract necrosis in I& from the bays receiving dispersed oil (Bays 7, 9
and 10). This was accompanied by an increase in the number of mucus cells in the
digestive tract epitheliums. After one year, a few clams had granulocytomas throughout
the tissues. Three clams from Bay 11 (receiving oil alone) coIlected one year after the
spill had invasive neoplasias (probably cancer). One clam from Bay 7 immediately after
the spill had a similar lesion.
There were few lesions in Macoma from Bays 7 and 9 immediately after or one
year after the spill. One year after the spill, animals from Bay 11 had a high incidence of
vacuolization of the digestive tubule epitheliums The incidence of parasitism and
hemocytic infiltration also was higher in Macoma from Bay 11 than from the other bays.
One specimen had a blood neoplasm.
Clams 5& truncata were collected immediately before, immediately after,
and about two weeks after the simulated oil spills for biochemical analysis.
Concentrations in the clam tissues of glucose, glycogen, trehalose, total lipid and free
amino acids were measured. Concentrations and ratios of free amino acids in adductor
muscle were the most useful indices of pollutant stress.
The results of the biochemical analyses indicate that h@ from the four bays
were not severely stressed by either dispersed oil or oil alone. Immediately after the
spill, clams from the two major dispersed oiI bays, and particularly Bay 10, appeared to be
more severely stressed than clams from Bay 11 (using clams from Bay 7 as reference).
After two weeks, clams from the dispersed oil bays were nearly normal, while those from
the bay receiving oil alone appeared stressed. These results seem to corroborate results
from analytical chemistry and histopathology, that the acute effects of dispersed oil are
greater than those of undispersed oil, but effects of undispersed oil on infaunal molluscs
develop ,more slowly and persist longer than those from dispersed oil.
10
FINAL REPORT
on
BAFFIN ISLAND EXPERIMENTAL OIL SPILLAND DISPERSANT STUDIES. HYDROCARBON
BIOACCUMULATION AND HISTOPATHOLOGICALAND BIOCHEMICAL RESPONSES IN
MARINE BIVALVE MOLLUSCS
NATIONAL OCEANIC AND ATMOSPHERIC ADMINISTRATIONOCSEAP PROGRAM OFFICE
Box 1808Juneau, AIaska 99802
from
BATTELLENew England Marine Research Laboratory
397 Washington StreetDuxbury, Massachusetts 02332
February 1, 1984
1. INTRODUCTION
More than 10,000 tons of chemical dispersant were used to clean the coast of
Cornwall, England of Kuwait crude oil following the Torrey Canyon oil spill in 1967. It is
now generally agreed that the dispersant caused more damage to the intertidal fauna and
flora than did the oil itself (Southward and Southward, 1978). The most frequently used
dispersant during the Torrey Canyon cleanup contained 12% nonionic surfactant and 3%
stabilizer in a high aromatic solvent (kerosene extract). This mixture was highly toxic to
nearly all forms of marine life. Because of the disastrous consequences of dispersant use
in this and a few other spills, use of chemical dispersants for oil spill cleanup fell into
disfavor. Relatively little dispersant was used after the Amoco Cadiz spilI and none was——used for shoreline cleaning.
11
Since the Torrey Canyon incident, considerable progress has been made in
developing dispersants that have a very low toxicity to marine organisms. Since dispersal
may be the method of choice in many cases for treating spilled oil, there is an urgent need
for information about the toxicity and environmental impact of oil that has been dispersed
with the new generation of “low-toxicity” dispersants (Sprague et al., 1982). The
controlled experimental oil spill-dispersant study - The Baffin Island Oil Spill (BIOS)
Project - being conducted by the Canadian Environmental Protection Service offers a
unique opportunist y to assess the biological effects of dispersed oii in a field situation.
The primary objective of the BIOS Project was to determine if the use of dispersants in
the Arctic nearshore will reduce or increase the environmental effects of spilled oil
(Blackall, 1980).
1.1 Objectives of the Research Program
The primary objective of this research program was to assess and compare
sublethal biological effects of chemically dispersed and non-dispersed spilled oil on
benthic infaunal bivalve molluscs from the Arctic. The research project has three
components: accumulation by three species of molluscs (Mya truncata, Serripes
groenlandicus, and Astarte borealis) of hydrocarbons from dispersed and non-dispersed——spilled crude petroleum; sublethal biochemical responses of ~ truncata to dispersed and
non-dispersed spilled crude petroleum; histopathology of & truncata and Macoma
calcarea up to one year after the simulated oil spills. The program was designed to
determine if chemically dispersed oil is more or less bioavailable than undispersed oil to
benthic infaunal
undispersed oil to
bivalve molluscs, and whether dispersed oil is more harmful than
these animals.
1.2 Background
1.2.1 Hydrocarixm Accumulation. Marine animals readiiy accumulate
petroleum hydrocarbons in their tissues from dispersion or solution in seawater and to alesser extent from petroleum-contaminated sediments and food ( Neff. Anderson,
Cox, Laughlin, Rossi and Tatem 1976 ; Neff, Cox, Dixit and Anderson, 1976;
Boehm and Quinn, 1977; Lee, 1977; Neff, 1979; Neff and Anderson, 1981;
Boehm, Barak, Fiest and Elskus 1982). Bivalve molluscs, apparently because
12
they have little or no ability to metabolize aromatic hydrocarbons to water-
soluble and easily excreted metabolizes ( Vandermeulen and Penrose. 1978; Lee,
1981 ). tend to accumulate petroleum hydrocarbons to higher concentrations and
retain them longer than do other phyla of marine organisms ( Neff. Cox, Dixit
and Anderson 1976; Boehm and Quinn, 1977; Neff and Anderson, 1981; Elmgren
et al. , 1983). Dispersants favor the formation of micro oil droplets in the
water column. The oil droplets are of a size that might be readily filtered
from the water and ingested during normal filter feeding activity of bivalve
molluscs. Thus, the use of dispersant could increase the bioavailabilit y of
petroleum hydrocarbons and, of particular importance, the poorly soluble
medium molecular weight polycyclic aromatic hydrocarbons and heterocyclics
( azaarenes. dibenzothiophenes, etc. ) to bivalve molluscs.
1.2.2 Histopathcdogy. Petroleum hydrocarbons, and particularly the more
toxic aromatics and heterocyclics, accumulated by marine animals interact with cells and
tissues to produce a variety of lesions. Aromatic hydrocarbons bind to the surface of cell
membranes and interfere with cell membrane-mediated biological processes (Roubal,
197% Roubal and Collier, 1975). Many hydrocarbons are irritants and cause localized
inflammatory responses. In oysters Crassostrea ~igas from the Amoco Cadiz oil spill site,——the most common histopathology was Ieucocytosis (an inflammatory response) in mantle
and gill tissues @Jeff and Haensly, 1982). Cockles, Cerastoderma edule, and mussels,
= -, transplanted to a bay that was heavily contaminated with oil from the
Amoco Cadiz spill, developed accumulations of lipid droplets and Iysosomal granuIes in— .the digestive diverticula (Wolfe et al., 1981). Stainken (1976) reported generalized ~
Ieucocytosis in the mantle of soft-shell clams ~ arenaria exposed in the laboratory to
oil. He also observed glycogen depletion and cellular vacuolization in several tissues of
exposed clams. A wide variety of other histopathological lesions have been reported in
invertebrates and fish exposed to petroleum in the laboratory or field (Malins, 1982).
Crude petroleum and heavy refined oils (e.g., bunker C residual oil) contain
known carcinogens including benzo(a)pyrene, dimethylbenz(a)anthracene, and methyl
chrysene (Neff, 1979). There are several reports in the literature of increased incidence
of apparently cancerous tumors in populations of bivalve molluscs from oil spill sites
(Barry and Yevich, 1975; Gardner et aI., 1975; Farley, 1977; Yevich and Barszcz, 197fi
Brown et al., 197!4 Mix, 1982). However, in no case has it been unequivocality
demonstrated that oil was the immediate cause of the cancerous lesions.
13

Immunosuppression and the resulting increased susceptibility to disease,
including parasitism, has been observed in molluscs and other marine animals exposed to
oil spills (Hodgins et al., 1977; Sindermann, 1982). Since some hyperpIastic or neoplastic
(cancer-like) lesions in molluscs are known or suspected of being caused by viruses,
bacteria, or fungi (Couch and Winstead, 1979), similar cancer-Iike lesions in bivalves from
oil spill sites may result from petroleum-mediated infection with pathogenic organisms.
1.2.3 Biochemistry/Physiology. Several physiological or biochemical measures
of metabolic energy partitioning and nutritional status may be sensitive indices of
sublethal pollutant stress in marine invertebrates. This conclusion is based on the
hypothesis, supported by substantial experimental data, that a majority of pollutants at
environmentally realistic concentrations, which are usually well below concentrations that
are acutely lethal, act as loading stressors. Chronic exposure of the animal to these
sublethal pollutant concentrations leads to an increase in the metabolic cost of basic
biological maintenance and homeostatic functions. Less energy is available for growth
and reproductive processes, and nutrient reserves are depleted. Recent reviews
supporting this hypothesis include those of Rosenthal and Alderdice (1976) and Bayne et
al. (1979; 1982).
Typical responses of bivalve molluscs to chronic exposure to sublethal
concentrations of petroleum include alterations in respiration rate or ratio of ox ygen
consumed to nitrogen excreted (Capuzzo, 1981; Wlddows et al., 1982), reduction in
nutrient assimilation and scope for growth (Dow, 1975; Gilf illan et al., 1976; Gilf illan and
Vandermeulen, 1978; Keck et al., 1978; Stekoll et al., 1980; Bayne et al., 1982; Mahoney
and Noyes, 1982), reduced growth rate (Anderson et al., 1983), depletion of gl ycogen
reserves (Stainken, 1976), changes in tissue free amino acid concentrations and ratios
(Jeff ries, 1972; Roesijadi and Anderson, 1979; Augenfeld et al., 1980), and decrease in
condition index (Roesijadi and Anderson, 1979; Augenfeld et al., 1980). All these
responses are indicative of a pollutant-mediated increase in metabolic load (loading
stress) on the animals.
In oysters from the Amoco Cadiz oil spilf site, we have observed statistically——significant long-term (more than two years) changes in tissue free amino acid ratios, blood
glucose concentration, and reserves of glycogen and ascorbic acid (Nef f and Haensley,
1982).
14
2.1 Materials and Methods
Specimens of ~truncata, Serripes groenlandicus, and Astarte borealis were
collected, when available in sufficient numbers, from the 3-meter and 7-meter transects
in all four bays (Figure 2.1) at three sampling times, immediately pre-spill, immediately
post-spill, and approximately two weeks after the experimental spills. Animals were
wrapped in aluminum foil and frozen for air shipment to the laboratory.
Aromatic hydrocarbons and sulfur heterocyclics in tissues were analyzed by
gas chromatography/mass spectrometry/data systems (GC/MS/DS). In order to
investigate the polycyclic aromatic nitrogen heterocyclic (PANH) composition and
content of the tissue, sample extracts from molluscs taken along the two depth strata
were pooled and analyzed by GC/MS for PANH.
Very briefly, the analytical methods used were identical to those of
Boehm, Barak, Fiest and Elskus ( 1982], a modification of the Warner (1976)
alkaline digestion-extraction procedure. After fractionating the extract on
an alumina-silica acid column, the saturated and aromatic hydrocarbons were
ana lyzed by cap i l l a ry CC and computer-assisted GC/MS (GD/MS/DS) .
GS/MS/DS analyses focused on the two- to five-ringed aromatic compounds.
PANH analyses involved the GC/MS analysis of an aqueous acid extract of the
total extractable (solvent ) lipids, which had been neutralized and back
extracted with solvent to recover the basic PANH compounds.
2.2 Results
Results from Boehm (1982) of analyses of total saturate and aromatic
hydrocarbons in five species of bivalves, including the three species treated in detail in
this report, are sum marized in Table 2.1. The three filter-feeders, X@ truncata, Serripes
groenlandicus, and Astarte borealis from the bays receiving dispersed oil (Bays 7, 9 and
10) rapidly accumulated petroleum hydrocarbons to high levels within a few days of the
spills. In Bay 11 which received undispersed oii, these species accumulated petroleum
hydrocarbons more slowly. Animals from the three bays receiving dispersed oil, released
15
,$ — 4
.) A “%”d
....:.:,.,,,.,..,’
.-‘.,
,;,. .... ..
).:
‘.T-
,....- :
.< A-&i.. ., . ... ... . .
/
Bay ,, >,,:
011 Alone “’# :,.”.,, .. .
-,..,
.2 ..
,,.,... )-nu:
); ) ,. -.,-’--h - \
.-..,,,. ,,.~. Y v9 ..:,.
“.,::cE., Bay 10 — <i;
b3 5 pprn.hDispersed 011 ~: +
Q,.
,; A .
Bay 7
Disper80d Oil m o 1--.~mm
Figure 2.1. BIOS site at Cape Hatt, Baffin Island, showing the locations of study baysand oil treatments applied in August, 1981. Dispersed oil concentrations aremaximum estimated exposures in ppm x hours (From Cross and Thompson,1982).
16
Table 2.1. Summary of oil concentrations in mollusc tissues by bay (in ~g dry weight). (f rom Boehm 1982 ~
BAY 9 (DISPERSED O I L) BAY 10 (DISPERSED OIL)
FIRST SECOND FIRSTSPECIES STRATUM
SECONDPRE-SPILL POST-SPILL POST-SPILL PRE-SPILL POST-SPILL POST-SPILL
& truncata 7m 0.35(.22, .49)
121(51, 290)
114(90, 140)
0.57(.42, .74)
277(180, 420)
157(1 10, 230)
131(96, 178)
141(110, 180)
177
149(130, 170)
440(250, 760)
336.7
336.7
3 m 0.40(.25, .56)
215(130, 350)
135(120, 150)
0.78(.55, 1.0)
368(290, 460)
&I!E?!2 W@nlandicus 7m 186(1 10, 330)
329(240, 460)
3mw-1 airlift
7m
160(120, 210)
698(500, 970)
0.68(.02, 1.9)
482(340, 680)
116(69, 190) [::09 3.0)
278(220, 350)
Macoma calcarea 7m 0.73(.33, 1.2)
836(61O, 1140) ?i!O, 3.6)
406(241, 680)
3m
7mAstarte borealis 0.81(0.41, 1.3)
463(270, 800)
171(88, 330)
1.4 441.5
3m
7m
3m
441.5Nuculana minuta 1.3 33.0 615.6 1.4
Table 2.1. (Continued)
BAY 7 (REFERENCE) BAY 11 (OIL ALONE)
FIRST SECOND FIRST SECONDSPECIES STRATUM PRE-SPILL POST-SPILL POST-SPILL PRE-SPILL POST-SPILL POST-SPILL
~ truncata 7m 0.34(.2 1, 4.8)
114(64, 21O)
0.43(*33, .53) ?i?2, 3.0
(.19::1)
?:4, 42)
2.7(2.2, 394)
11.3
?;3, 120)
394(200, 780)
246(76, 790)
140(50, 390)
428.9
“ .
3m
7m
3mairlift
7m
Serripes groenlandicus
(1.2,1 i!’3)
[:;8, 1.2)
517(360, 750) (31, ?70)
::9, 190)
1.6
::0, 112) ?:;5, 10)Macoma calcarea 7m
3m
7mAstarte borealis:112, 210) & 1 4 0 )
0.47(.31, .92)
3m
7m
3m
Nuculana minuta 1.2 87.341.2 1.1
aGeometric mean (lower 95% confidence limit, upper 95% confidence limit).
some of the oil during the period between the first and second post-spill sampling (about 2
weeks). A different pattern of hydrocarbon bioaccumulation was evident in the two
deposit-feeding bivalves, Macoma calcarea and Nuculana minuta. In these species, uptake
of petroleum hydrocarbons in all four bays was more gradual and maximum body burdens
were reached in the second post-spill samples.
Although Bay 7 was considered a reference bay, 50-100 ppb dispersed and
soluble petroleum hydrocarbons were measured in the water column of the bay qf ter the
dispersed oil spill. The benthic bivalves from this bay, in particular Serripes groenlandicus
and F& truncata, became contaminated with petroleum hydrocarbons immediately after
the spill.
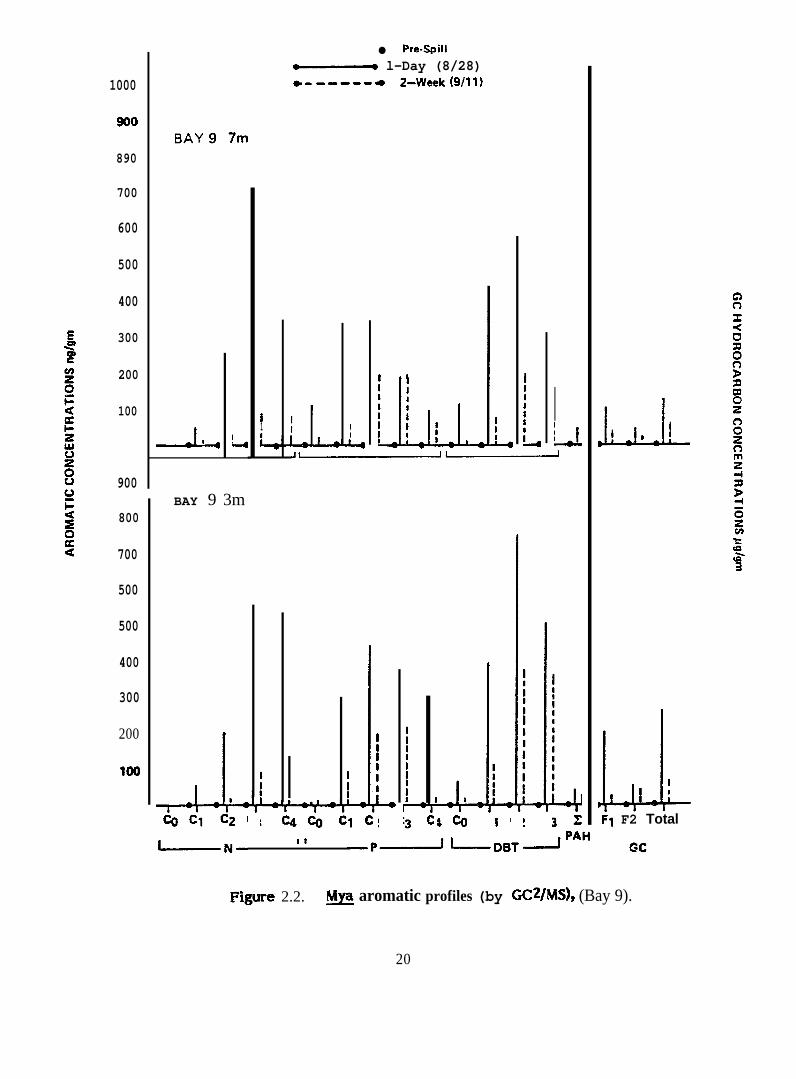
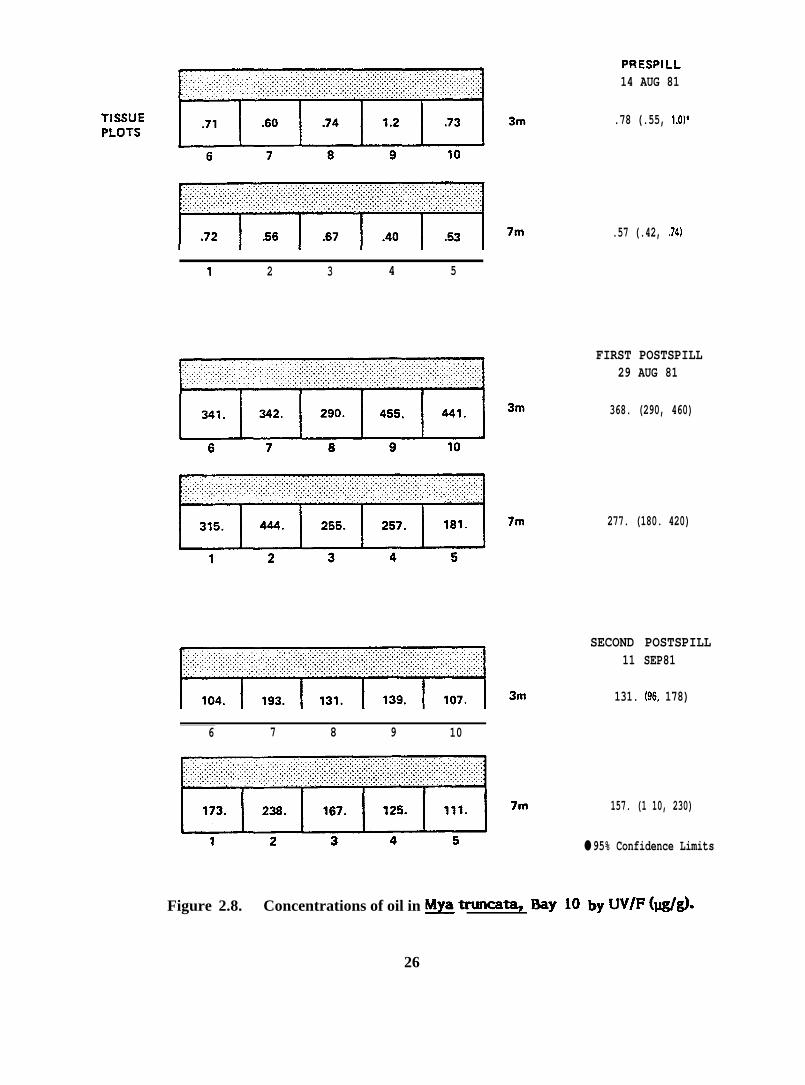
2.2.1. Mya truncata. The analytical results from 20 samples of N&L truncata
are summarized in Figures 2.2-2.15. Results correspond to one GC/MS/DS analysis of a
pooled extract of five stations along a depth stratum. For exampie, the l-day post-spill
sample from Bay 9 (7m) represents a result of a pooling of five samples (1 sample . 10
animals) along the 7-meter depth stratum in this bay. Pre-spill, l-day post-spill, and 2-
week post-spill analyses are presented for each bay. A set of samples from the inshore (3-
meter) transect was analyzed from Bays 9 and 10. In addition to the pooled 5-station
sample, analyses were conducted on animals from two individual stations in Bay 9. Total
petroleum (by UV) values for samples from each station and selected capillary GC traces
are presented as well.
There were differences in the patterns of accumulation of different aromatic
and sulfur heterocyclic hydrocarbons in ~. truncata from different water depths in the
same bay (e.g., Figure 2.2) and from different stations along the same depth transect
(Figure 2.3), perhaps indicating an uneven distribution of hydrocarbons in the bays. In ~.
truncata from Bays 9 and 10 which received dispersed oil, the compound accumulated to
the greatest extent from each of the three homologous series examined in detail was
C3-naphthalenes, C2-phenanthrenes and C2-dibenzothiophenes (Figures 2.2 and 2.7). Only
very small amounts of higher molecular weight polycyclic aromatic hydrocarbons were
accumulated ( ~ PAH in figures). On the other hand, ~. truncata from Bay 11 which
received undispersed oil, preferentially accumulated C4-naphthalenes, C3-phenanthrenes
and C 3-dibenzothiophenes. These clams also accumulated proportionately much smaller
amounts of naphthalene and alkyl naphthalenes than did clams from Bays 9 and 10. M.—truncata from Bay 11 undoubtedly were exposed to more highly weathered oil than clams
in 13ays 9 and 10.
19
● Pre-Spill
~ l-Day (8/28)~------- 2-~eek(9/11)1000
Wo
890
700
600
500
400
300
200
100 J&LII I IL-Li
1
LI
4 iJ
900BAY 9 3m
800
700
500
500
400
300
200
100 L-’l-119
F1 F2 TotalA-1tCQC1C21 4%’
II
F@ure 2.2. ~ aromatic profiles (by GC2/MS), (Bay 9).
20
400
300
200
100’
o“
MYA— GXon 1—-- Station 5
BAY 92-Week
IIIIIIIIIt
~1
4$
~ co Jui;II
F1 F2 Total
GC
Figure 2.3. Variation of aromatic hydr-bon levels in ~ along 7 meter depthstratum (Bay 9).
21
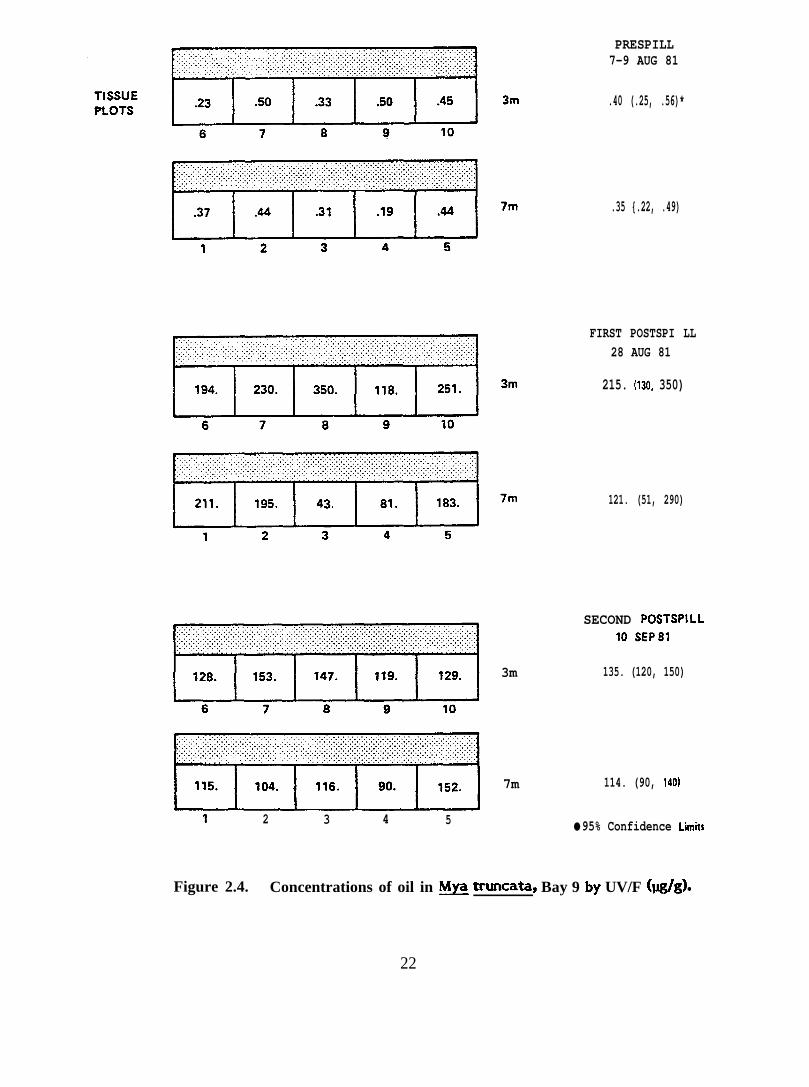
1 2 3 4 5
3m
PRESPILL7-9 AUG 81
.40 (.25, .56)*
.35 {.22, .49)
FIRST POSTSPI LL28 AUG 81
215. (130, 350)
121. (51, 290)
SECOND POSTSPILLIO SEP8’I
135. (120, 150)
7m 114. (90, 140)
● 95% Confidence Limits
Figure 2.4. Concentrations of oil in ~ truncata, Bay 9 by UV/F (@g).
22
PrMpill
.a t: :.i“i:
w
1
II
I
? ; :.
-------- --. —
1 Day
. .1
i
.::.
ti_&___
2 Waeks
*
. .. .●
● ●
. .,.-:i
UCM
-.
“Isoprenoids
.
Figure 2.5. Mya truncata-GC2 profiles of %y 9 animals (saturated
23
hydrocarbons).
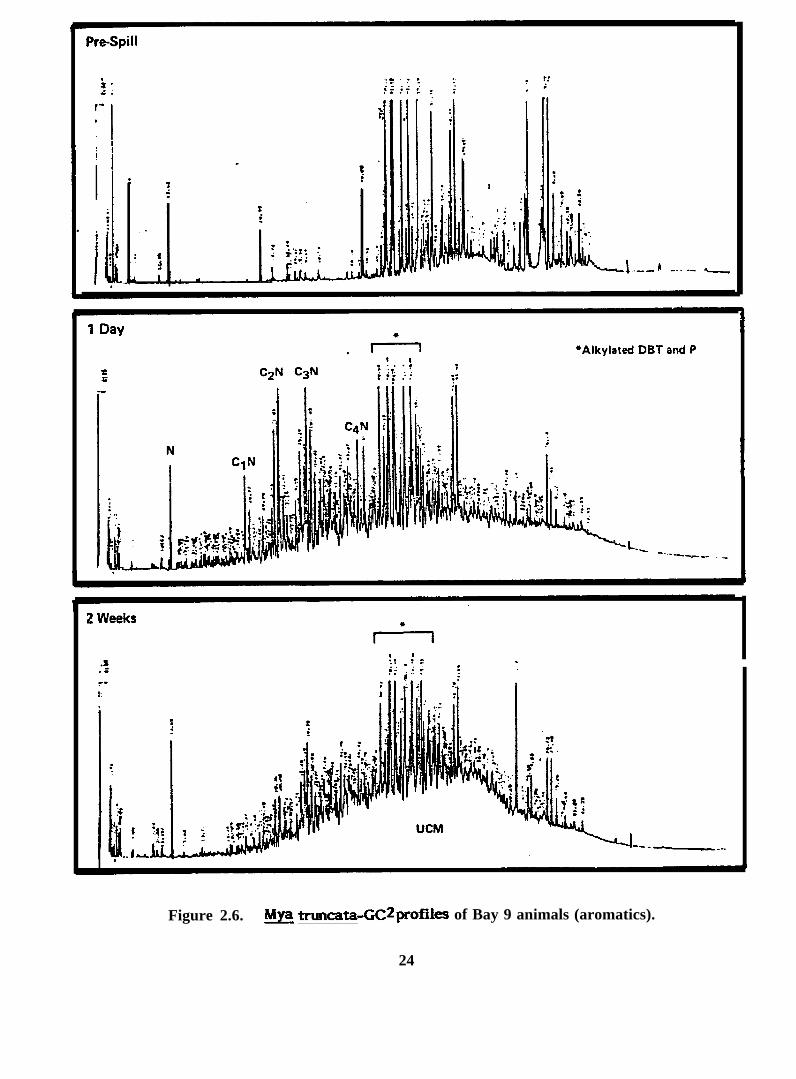
Figure 2.6. h& truncata-GC2profileS of Bay 9 animals (aromatics).
24

~ I-Day (8/28)-------~ 2-Week (9/11)100a
m
700
6oa
Boa
400
300
BAY 10 7m
II1tI
i1III
IIIIIIIII
200
LLLtI I
I t t
IIIIILI
L
100I
1. , 44
16201051800
BAY 10 3m800
700
600
500
400
I1:I:IIII
200
la
IIII
L
IIJ-4 #
Ltal
-+C2 ( s4QJC1C2
Figure 2.7. Aromatic profiles from M7
expocmf to oil, illustrating changes inconcentrations over 2 weeks, Bay 10).
25.
1 2 3 4 5
6 7 8 9 10
PRESPILL14 AUG 81
.78 (.55, 1.O)+
.57 (.42, .74)
FIRST POSTSPILL29 AUG 81
368. (290, 460)
277. (180. 420)
SECOND POSTSPILL11 SEP81
131. (96, 178)
157. (1 10, 230)
● 95% Confidence Limits
Figure 2.8. Concentrations of oil in ~ trun-ti, Bay 10 by W/F (IQ@.
26
30C
20[
10C
40C
200
100
. Pre-Spill~ I-Day (8/31)----- _ 4 2-Week (9/11)
BAY 11 3m b ●
* - - . - - Ml-Day (8/212-Week (9/8)
I:J1
dI9
t! I :
11I!
:1 ;
J-J&F1 F2 Total
~~——J ~P~LD8T,_fPAH
GC
Figure 2.9. Mya truncataj aromatic profiles of Bays 7 & 11 by GC2/MS.
27
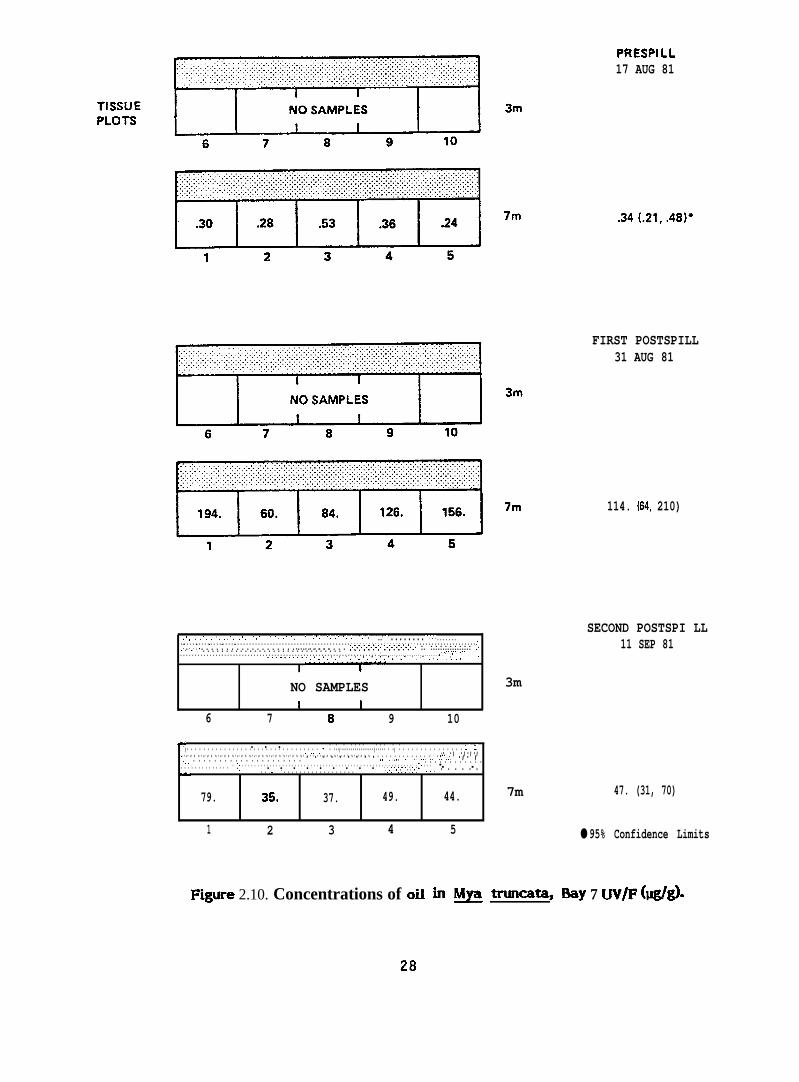
PRESPILL17 AUG 81
FIRST POSTSPILL31 AUG 81
114. {64, 210)
. . . . . . . . . . . . . . . . . . . . . . . . . . . . . . . . . . . . . . . . . . . . . . . . . . . . . . . . . . . . . . . . . . . . . . . . ...’ ‘.. . . . . . . . . ..’...’. . . . . . . .. . . . . . . . . . . . . . . . . . . . . . . . . . . . . . . . . . . . . . . . . . . . . . . . . . . . . . . . . . . . . . . . . . . . . . . . . . . . . . . . . . . . . . . . . . . . . . . . . . . ,.. . . . .
. . . . . . . . . . . . . . . . . . . . . . . . . . . . . . . . . :.:.:.:.:.:-:. :.;.:.:.:.:.:. :. :.:.:.:.:.:.:.:.: :.. . . . . . . .... ,., ., . . . . . . . . . . . . . . . . . . . . . . . . . . . . . .. . . . . . . . . . . . . . . . . . . . . . . . . . . . . . . . . . . . . . . . . . . . . . . . . . . . . . . . . . . . . . . . . . . ..’...... . . . . . . . . . . . . . . . . . . . . . . . . ...’ . . . . . . . . . . . . . . . . . . . . . .. . . . . . . . . . . . . . . . . . . . . . . . . . . . . . . . . . . . . . .,, .,,, .. . .
I —’-NO SAMPLES
I 16 7 8 9 10
v’ . . ..:. ,. . . . . . . . . . . . . . . . . . . . . . . . . . . . . . . . .,,,.,.:., : .:.,.:...:.:.:.:.....,:.:.: . :, : . . . . . . . . . . . . . . :., :.: .. :.:.:..,., . . . . . . . . . . . . . . . . . . . . . . . . . . . . . . . . . . . . . . . . . . . . . . . . . . . . . . . ,, .,.,.,.,.,., ., .,.,.,. . . . . . . . . . . . . . . . . . . . . . . . . . . . . ...... ...... . . . . . . . . . . . . . . . . . . . . . . . . . . . . . ,, .,... . . . . . . . . .,, .,.,,, ,,, ...,,, ,,, ,. .,.,., .,. ,, .,.,..,,, . . . . . . . . . . . . . . . . . . . . .. . . . . . . . . . . . . . : . . . . . . . . . . . .. : :.:...... . . . . . . . . . . . . . . . . . . . . . . . . . . . . . . . . . . . . . . . . . . . . . . . . . . . . . . . , . ..’...... . . .. . . . . . . . . :.:,:,.,:.:.:.:,:,:, .. .., ..,,., . . . . . .. . ...’ .. ’.,... . . . . . . . . . . . . . . . . . .w
79. 35. 37. 49. 44.
1 2 3 4 5
SECOND POSTSPI LL11 SEP 81
3m
7m 47. (31, 70)
● 95% Confidence Limits
F@re 2.10. Concentrations of oil in ~ ~az 13ay 7 UV/F (w@
● hoprenoids
● ❉
2 Weeks
“.=. . .
●
I
●
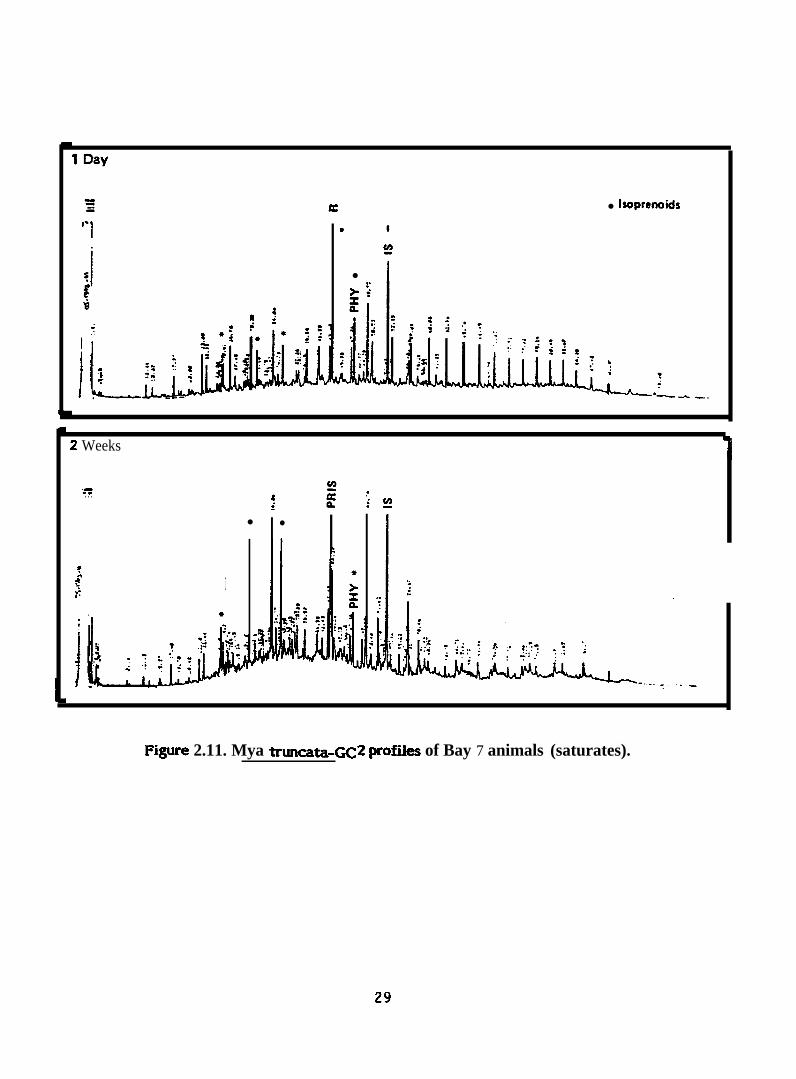
Figure 2.11. Mya truncata-Gc2 profiies of Bay 7 animals (saturates).
29
{
!..,.-.
p=’
-..—
● ☛
✎✚
✎✞✎
✎ !
1,. ,
~: ,,,-
:.--. ——
,,.
...’
,’ . . .
●
;...-
-,.-
-,“’”~~
● ..;;. . . . .
. . . . . -.. . . .
,. .... . .
. . .., .,,
-—-
.ti:lc“..:
.*,. ””
.,.-—
.-.— .
. ..=
- . :.,. . . . . -
J.. -,,1M
:}-..
30
6 7 8 9 10
1 2 3 4 5
1 2 3 4 5
I I NO SAMPLES I I 11
I I 1 1 I I6 7 8 9 10
PRESPILL12 AUG 81
.43 (.33, .53)*
FIRST POSTSPI LL21 AUG 81
2. (1.2, 3.11
SECOND POSTSPILL8 SEP 81
93. {73, 120)
● 95% Confidence Limits
Figure 2.13. Concentrations of oil in N& truncata, Bay 11 by UV/F (I&)-
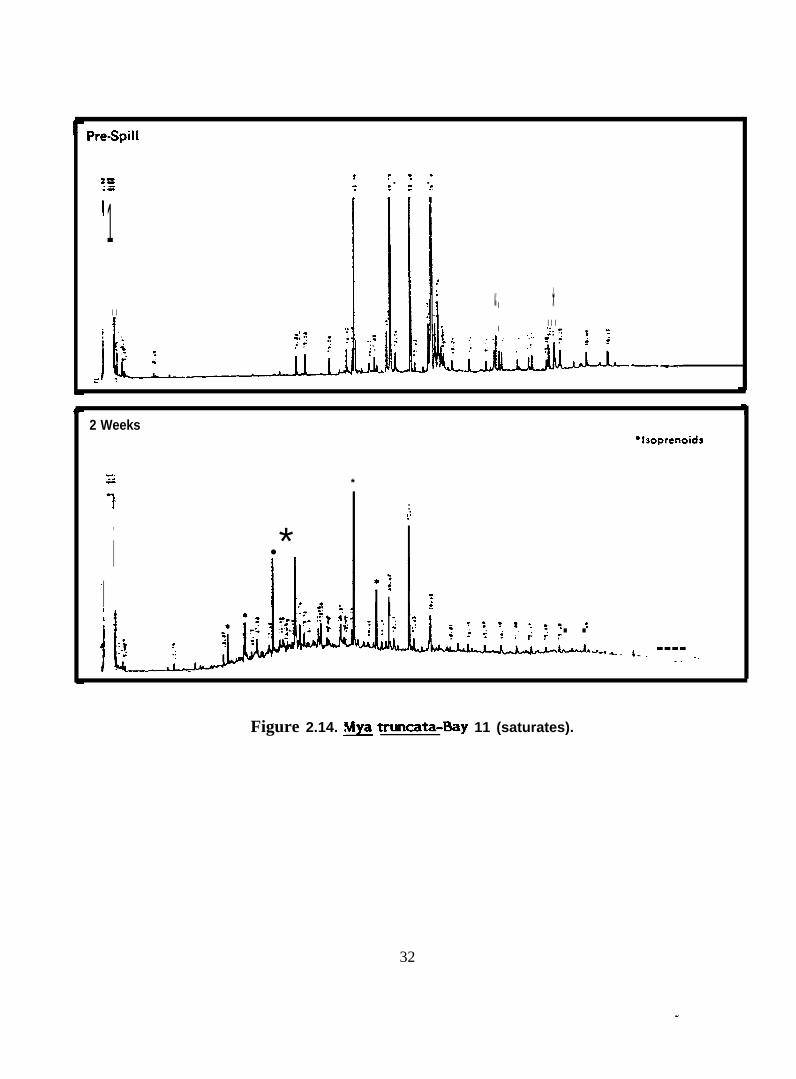
Pre-Spill
:= t ::.. .~= : ::.”
I 1. . . .*.i ., “: :IL? :4 —.::
2 Weeks‘Isoprenoids
Y: *
? :::
,
I ● *I :8 -. :-, :: Z: Z::. .?:; f +.-LAAA...a. ,-- ---- -.-.
Figure 2.14. ~ truncata-Bay 11 (saturates).
32
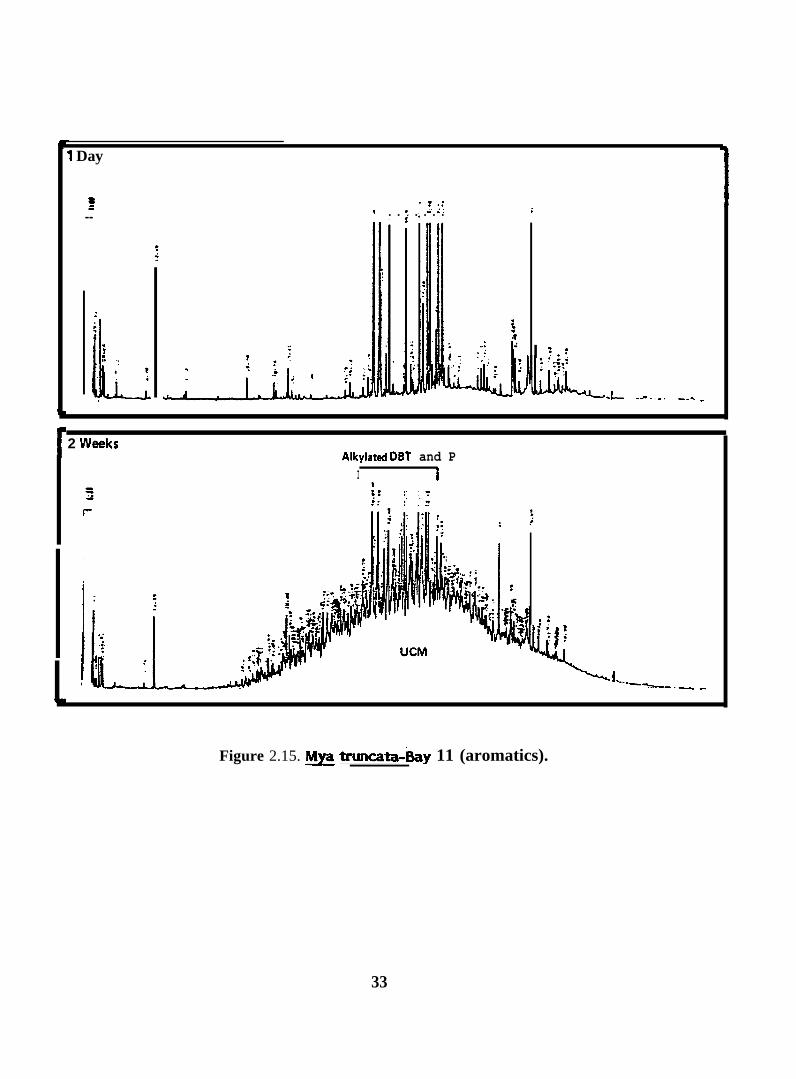
1 Day
s=--
:
L: ;: . ..;
,.:.“ ;“:. . . . . . .:. ;
..,..:..”.
;
::!“:.“.-. :-
● : ;L./- -,-* . . . . -... -
2 WaaksM@atad DET and P
I I
:
—-
Figure 2.15. ~ truncata-~y 11 (aromatics).
33
In all cases but one (Bay 10, second post-spill sample) where comparisons could
be made, clams from the 3-meter water depth contained higher concentrations of total
hydrocarbons than clams collected at the same time from the 7-meter water depth.
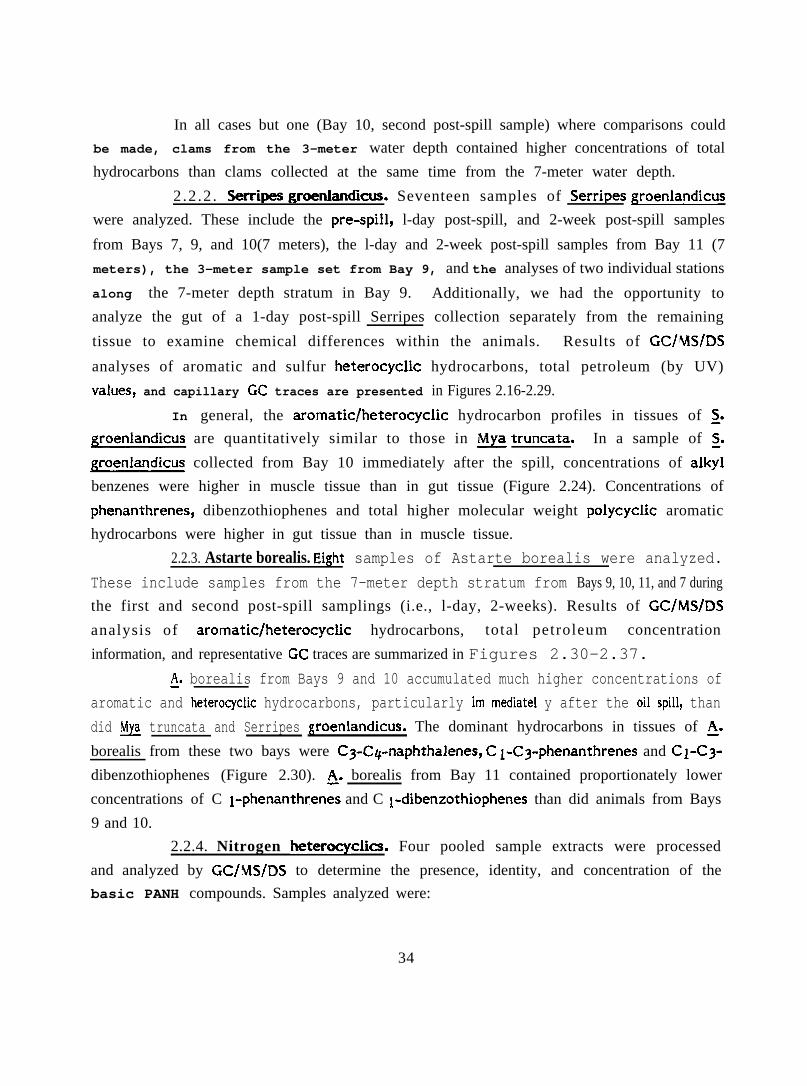
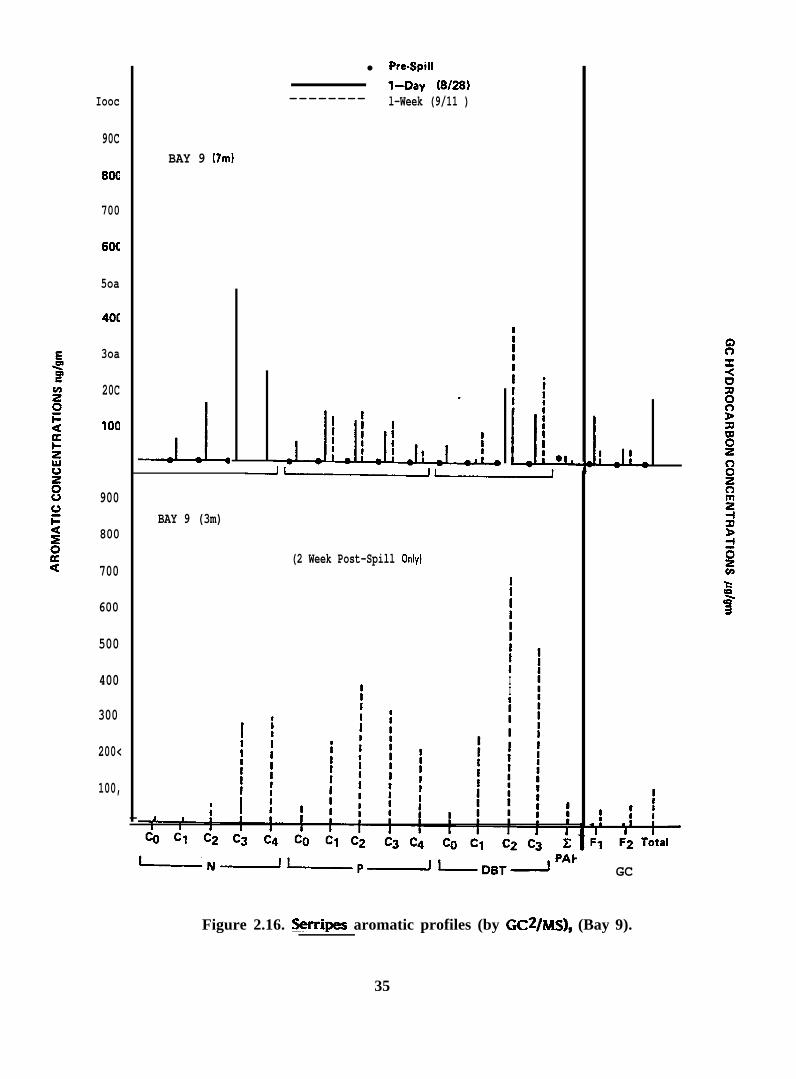
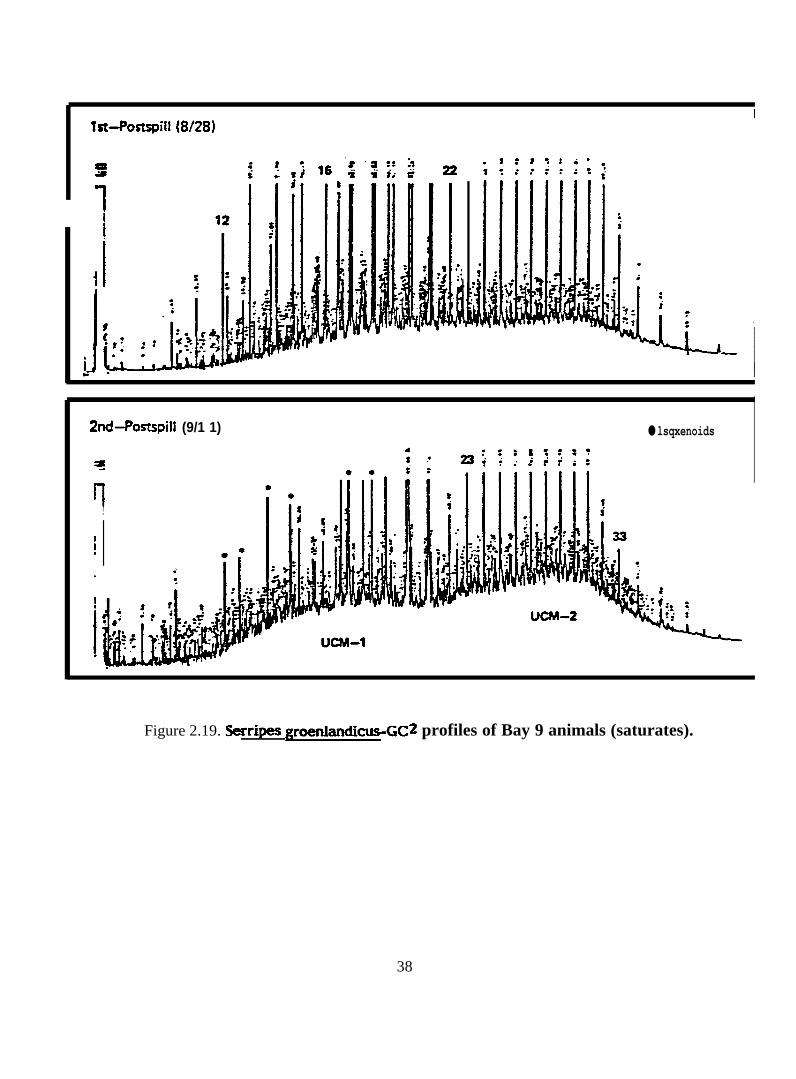
2 .2 .2 . Serripes groenlandicus. Seventeen samples of Serripes groenlandicus
were analyzed. These include the pre-spill, l-day post-spill, and 2-week post-spill samples
from Bays 7, 9, and 10(7 meters), the l-day and 2-week post-spill samples from Bay 11 (7
meters), the 3-meter sample set from Bay 9, and the analyses of two individual stations
along the 7-meter depth stratum in Bay 9. Additionally, we had the opportunity to
analyze the gut of a 1-day post-spill Serripes collection separately from the remaining
tissue to examine chemical differences within the animals. Results of GC/MS/DS
analyses of aromatic and sulfur heterocyclic hydrocarbons, total petroleum (by UV)
vahes, and capillary GC traces are presented in Figures 2.16-2.29.
In general, the aromatic/heterocyclic hydrocarbon profiles in tissues of >.
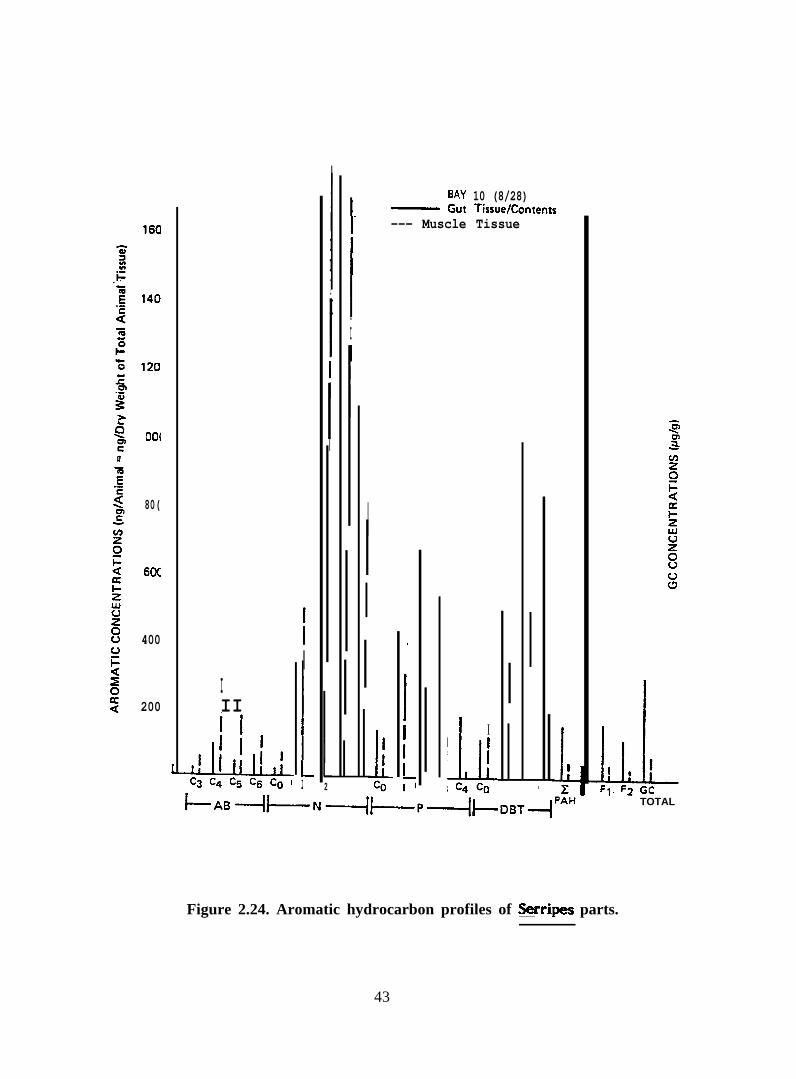
groenlandicus are quantitatively similar to those in h& truncata. In a sample of ~.
groenlandicus collected from Bay 10 immediately after the spill, concentrations of alkyl
benzenes were higher in muscle tissue than in gut tissue (Figure 2.24). Concentrations of
phenantlwenes, dibenzothiophenes and total higher molecular weight polycyclic aromatic
hydrocarbons were higher in gut tissue than in muscle tissue.
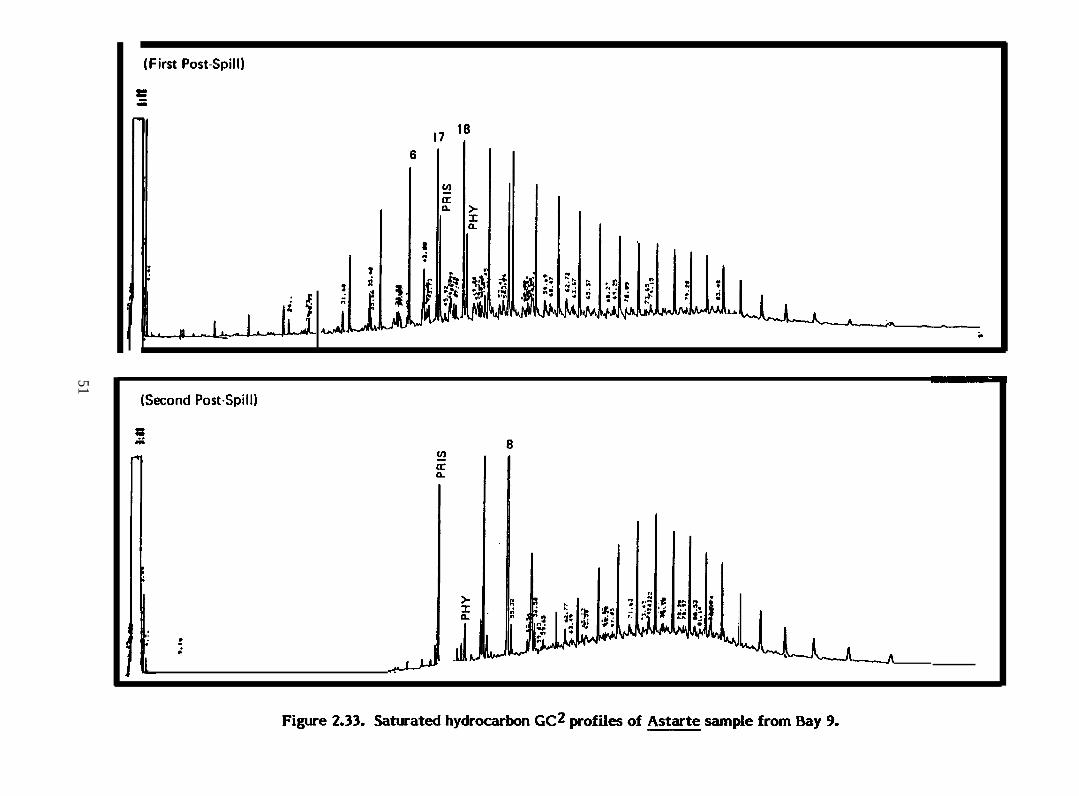
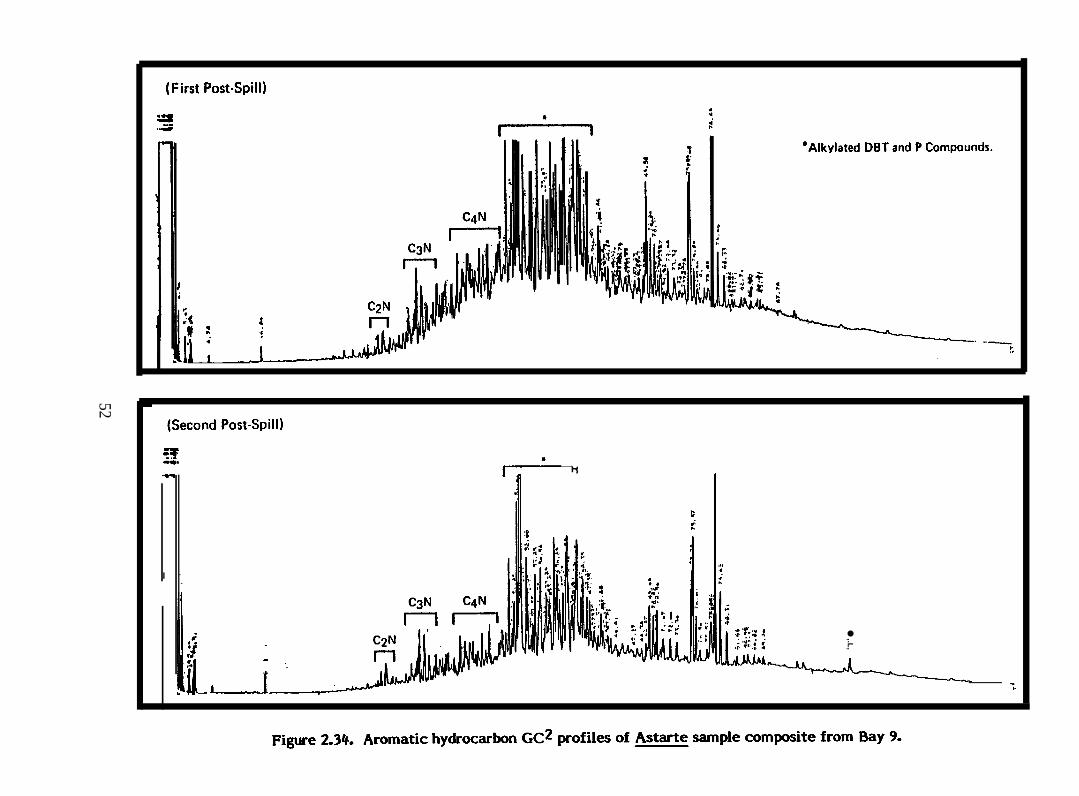
2.2.3. Astarte borealis. Eight samples of Astarte borealis were analyzed.These include samples from the 7-meter depth stratum from Bays 9, 10, 11, and 7 during
the first and second post-spill samplings (i.e., l-day, 2-weeks). Results of GC/MS/DS
analysis of aromatic/heterocyclic hydrocarbons, total petroleum concentration
information, and representative GC traces are summarized in Figures 2.30-2.37.
& borealis from Bays 9 and 10 accumulated much higher concentrations of
aromatic and heterocyclic hydrocarbons, particularly im mediatel y after the oil spill, than
did & truncata and Serripes groenlandicus. The dominant hydrocarbons in tissues of &
borealis from these two bays were C3-C4-naphthalenes, C l-C3-phenanthrenes and Cl-C3-
dibenzothiophenes (Figure 2.30). &. borealis from Bay 11 contained proportionately lower
concentrations of C l-phenanthrenes and C l-dibenzothiophenes than did animals from Bays
9 and 10.
2.2.4. Nitrogen heterocyclics. Four pooled sample extracts were processed
and analyzed by GC/MS/DS to determine the presence, identity, and concentration of the
basic PANH compounds. Samples analyzed were:
34
Iooc
90C
80C
700
60C
5oa
40[
3oa
20C
loa
900
800
700
600
500
400
300
200<
100,
—
● Pre-SpillI-Day (S/28)
-------- l-Week (9/11 )
BAY 9 (7m)
J-L.
BAY 9 (3m)
(2 Week Post-Spill Only)
II9
GC
Figure 2.16. Serripes aromatic profiles (by GC2/MS), (Bay 9).
35
SERRIPES
800-
700 ‘
~~ 600xcw; 500.aa~a 400<n>z: 300azo~ 200
100
0
950!
‘:IIII1IIIIIIIIII~IIIIIIIIII
— Station 1----- Station 5
IIII1IIIIIII1IIIII;
I1II—:1
IIIIIIIIIII
III
II~
II—
2
BAY 91-Day
II1I
A-L
1II:I1I\IIIIII1IIIIIIIIIF
:3 C4 co c1 C2
I
;IIIIIIIIII1:IIIIIIIIIIIIIIIIIII$III—
IIIIt!IIIIIIIIIIIII
4-3Z
-J PA H
I iI II 1
&l&F1 F2 Total
GC
Figure 2.17. Variation of aromatic hydrocarbon levels in Serripes along 7 meter depthstratum (Bay 9).
36
FIRST POSTSPI LL28-31 AUG 81
482. (340, 680)
186. (1 10, 330)
.and=3m ‘Ec:zr6 7 8 9 10
116. (69, 190)
97. [59. 160)
● 95% Confidence Limits
Figure 2.18. Concentrations of oil in Serripes, Bay 9 by W/F (pg/g).
37
I
:;
l- l - i:: —
2nd-Postspiii
4=
!!
I! I
(9/1 1) ● lsqxenoids
Figure 2.19. Serripes groenlandicus-GC2 profiles of Bay 9 animals (saturates).
38

● Pre-SpillI-Day (9/1 )
------- . 2-WAC (9/12)1000
900
800
700
600
SoO
400
BAY 10 7m
::1
I1
: III 1 :I t t
II II
I II 1 1
200
100’ L1
—
c
1100 01100900 ‘
800 ●
700 ‘
..BAY 10 3m(1 Day Post-Spill Oniy]
600 “
500 “
400 “
300 “
200 ●
100- hlLJ-,Co[
d-Cocl( 4(
—c
—
C3 C4 co ( F1 F2 TotalPAH
GC
lo).F@ure 2.20. Se@es aromatic profiles, (Bay
39
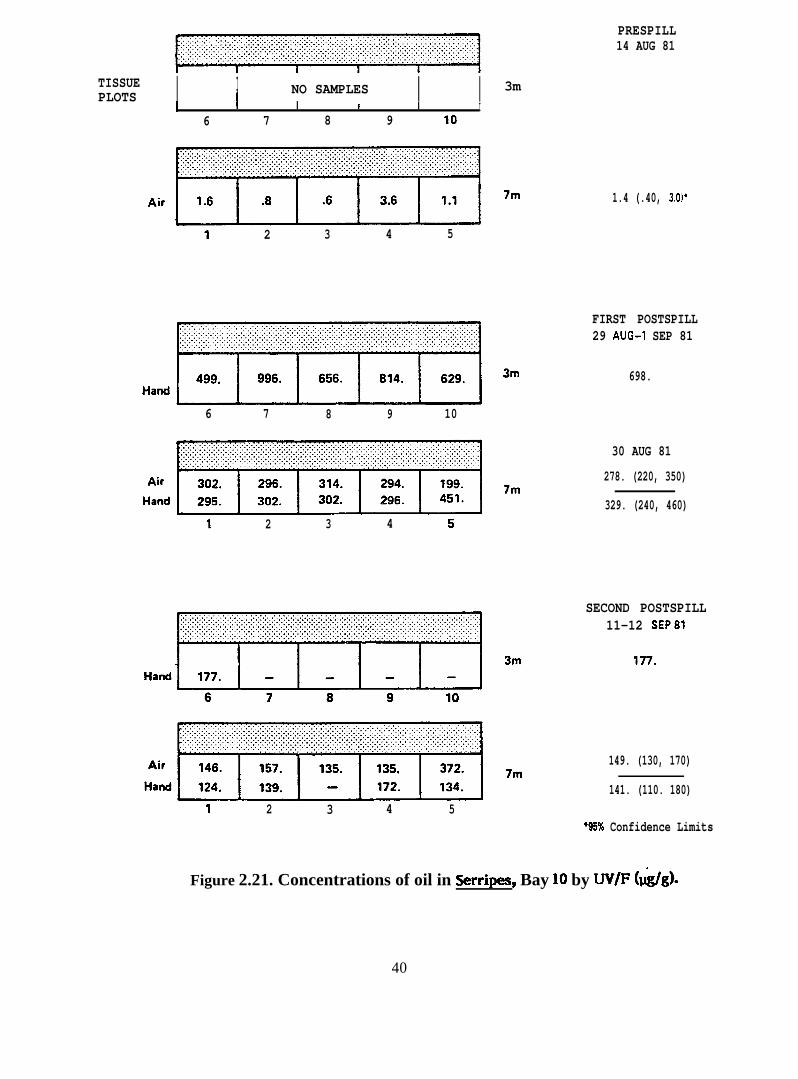
TISSUEPLOTS I I
I NO SAMPLES I I 3mI I I I I I
6 7 8 9 10
1 2 3 4 5
6 7 8 9 10
1 2 3 4 5
PRESPILL14 AUG 81
1.4 (.40, 3.0)*
FIRST POSTSPILL29 AUG-1 SEP 81
698.
30 AUG 81
278. (220, 350)
329. (240, 460)
SECOND POSTSPILL11-12 SEP81
177.
149. (130, 170)
141. (110. 180)1 2 3 4 5
’95% Confidence Limits
Figure 2.21. Concentrations of oil in Serripes, Bay 10 by UV/F (&/g).
40
. ..-
Itn
,[
:W:%:=*-,-
,-:0i=, + 9=.,.
,0INIz:Ul
m ●
..,.‘a‘ga
-, . .. . . .. . .
- *..~-4
-—%
-L. —-.
M=w J
*. <,-J
.-. .b,
,
:-1L
-. _
__
3
., .r -
. ..0.
:
41
● Pre-Soill
400
300
200
100
800
700
600
500
400
3CQ
200
100
I-Day (9/1)------ 2-Week (9/1 1 )
BAY 7 (7m)
Ad1: :I1 :I I
t: I,, 1~: 1
II 11
:’ 1, dIn980
BAY 11 (7m) I
88I,
:
:
:8@
1,,I,II
:I:iII1I1III
— First Post-Spill---- Second Post-Spill {
II1 I
1I ;8 II II I
1: III II111 1:
0 I 1: II II 1:* Ill IIt Ill t:It I 11: I I1;11 :1;1,, a 11:::1Itt 1 , r I n
coclczcscd~~lczcscd cOclc2c3~
+’++’+I-””-l ‘AH
d
11I
II91
It I:1,:1 fz T O T A L
GC
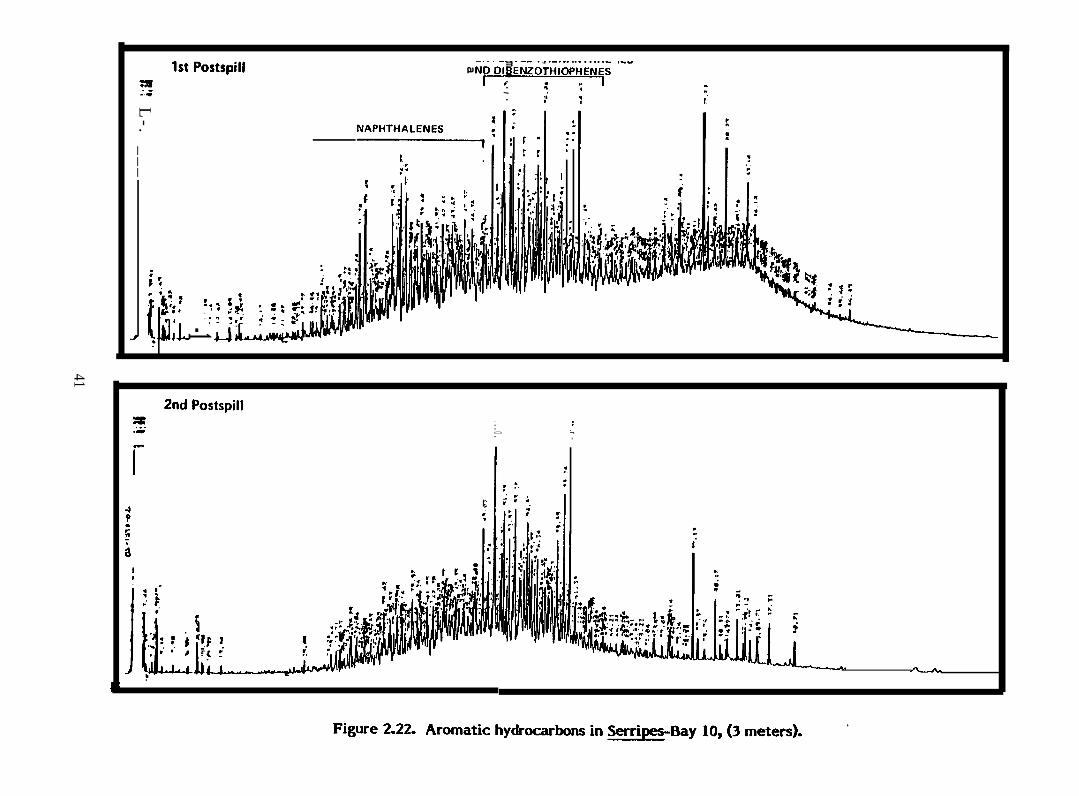
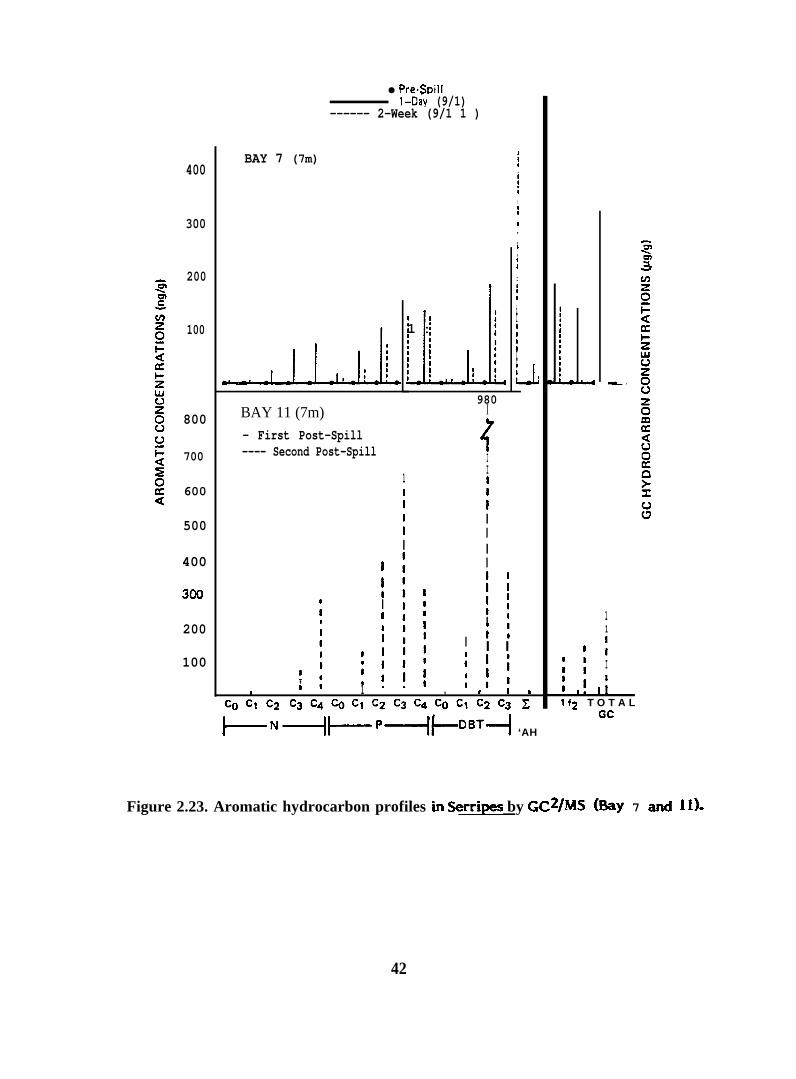
Figure 2.23. Aromatic hydrocarbon profiles in Serripes by GC2/MS (Bay 7 and 11).
42
001
80(
60(
400
200IIIJI
ldLLILLC3 C4 C5 Cfj CO {
IIIIII
ILI
IIIIIIIIIII
1L2
IIII
I
I[
II
BAY 10 (8/28)_ Gut Tissue/ContenK-—— Muscle Tissue
I L1, IFt. Fz Gc
TOTAL
Figure 2.24. Aromatic hydrocarbon profiles of Serripes parts.
43
6 7 8 9 10
PRESPILL17 AUG 81
1.2 (1.2, 1.3)*
FIRST POSTSP!LL1 SEP81
517. (360, 750)
SECOND POSTSPILL11 SEP 81
73. (31. 170}
● 95% Confidence Limits
Figure 2.25. Concentrations of oil in Serripes, Bay 7 by UV/F (@g).
44
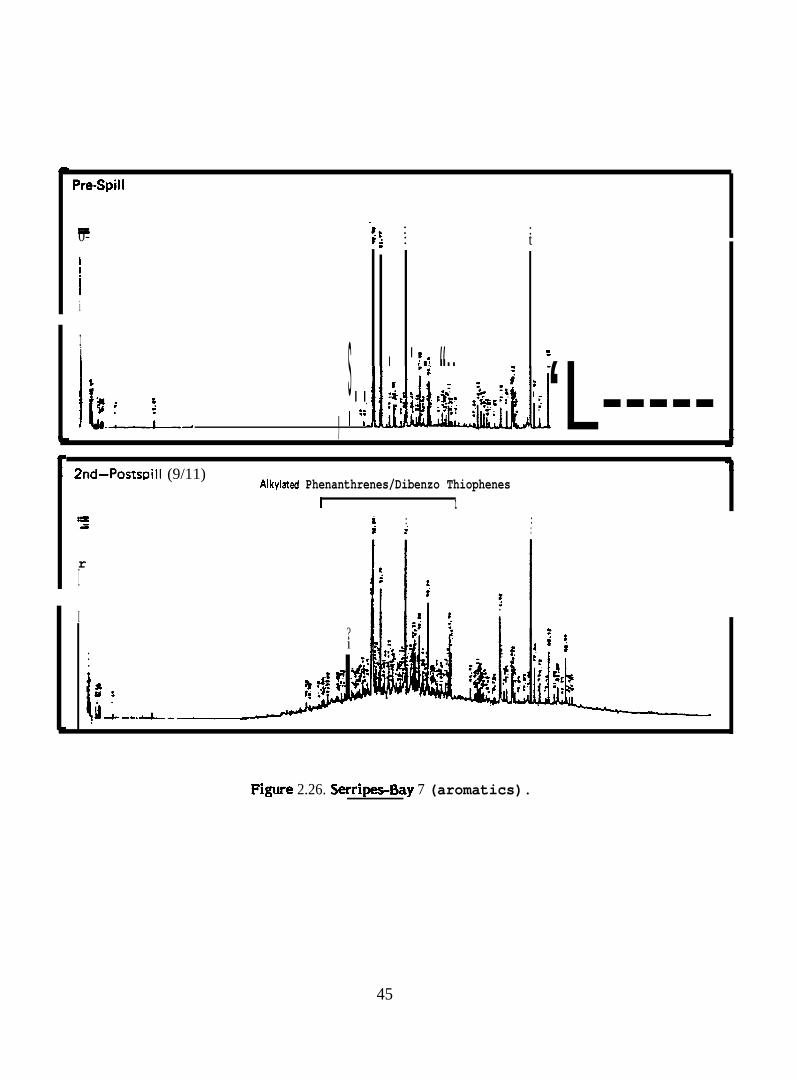
Pre-Spill
= -?t :0- :?: : t
I
ii
Ii
IL8, 2J ,,● ..L s Ft; : :- . . :6 ~ :: ~ ~.t.:$>I ,1:: ● “;:
● .~- hkLidAL‘; ‘L-----,2nd–Postspill (9/11)
Alkylated Phenanthrenes/Dibenzo ThiophenesI 1
u a :.= :i ~ :
rI
~I
.
?i
:. .
1
s.
.iL_..L..
F@ure 2.26. Serr@s-Bay 7 (aromatics).
45
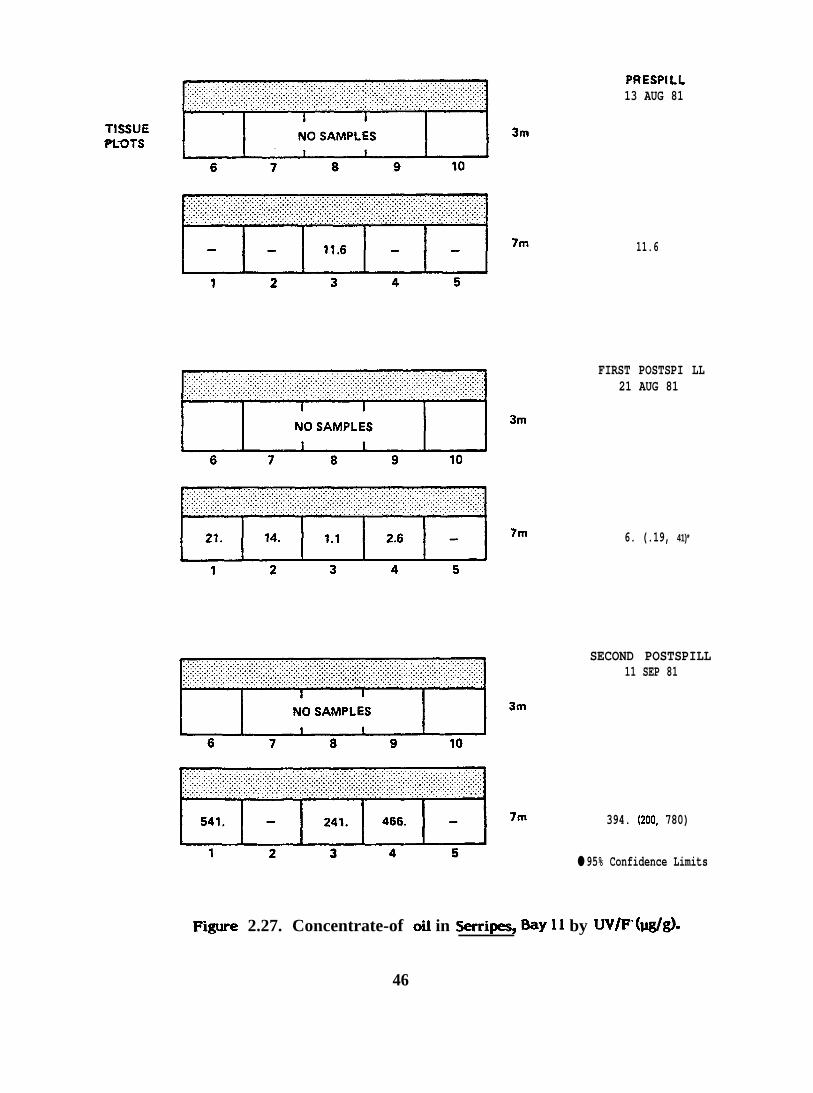
PRESPILL13 AUG 81
11.6
FIRST POSTSPI LL21 AUG 81
6. (.19, 41)*
SECOND POSTSPILL11 SEP 81
394. (200, 780)
● 95% Confidence Limits
F@ure 2.27. Concentrate-of oil in S=ii=s, *Y 11 by W/F”(I&/g).
46
Pre-Spill
i
!11.- J::1:- ..:. .
h I:
. .- 1,.:.:.:s:
. : L -, ----— .
2nd-Postspill (9/11)
I
.-
1.:.i
● lsoprenoids
:● ✚
Figure 2.28. Serripes-Bay 1 I (saturates).
:
2nd–Postspi I I
9= :.
i.Ll____,CItL
Figure 2.29. Serri~Bay 11 (aromatics).
47
BAY 9— First POst.Spiil (8/28)— — — Second Post-Spill (9/11)
2020 2940 1820 4710
1800
1600
1400
1200
1000
800
600
400
200
1600
1400
1200
1000
800
600
400
200
LIfl
LI
lJ-1
TOTALGC
Figure 2.30. aromatic profiles 9 and 10).
48
I I NO SAMPLES I I 3mI I 1 I I I
6 7 8 9 10
1 2 3 4 5
PRESPILL8 AUG 81
.81 (.44, 1.3)*
FIRST POSTSPI LL28 AUG 81
463. (270, 800)
SECOND POSTSPI LL11 SEP81
171. {88, 330)
● 95% Confiden= Limits
F@ure 2.31. Concentrations of oil in Astarte borealis, Bay 9 by UV/F (@g).
49
6 7 8 9 10
1 2 3 4 5
PRESPILL14 AUG 81
.43 [.25, .64)*
FIRST POSTSPILL1 SEP 81
364. (320, 410)
SECOND POSTSPILL12 SEP 81
310. {210, 460)
● 95% Confidence Limits
Figure 2.32. Concentrate- of oil in lW=te bore~% MY 10 by ~/F (w/d.
50
.
.
fn
$*
51
1’
● ,.L
,-2
rI
. .J ., .-. .14
..
*?
}—
52

400
300
200
100
800
700
600
500
400
300
200
100
BAY 7Second Post-Spill”
— 1 Day-----2 Week
t!1
dBAY 11Second Post-Spill
— 1 Day‘ ---- 2Week
.
:IIIrII
IIItI
1It:;1
lot
fl f 2 T O T A LGC
Figure 2.35. Astarte aromatic profiies (Bays 7 and 11).
53
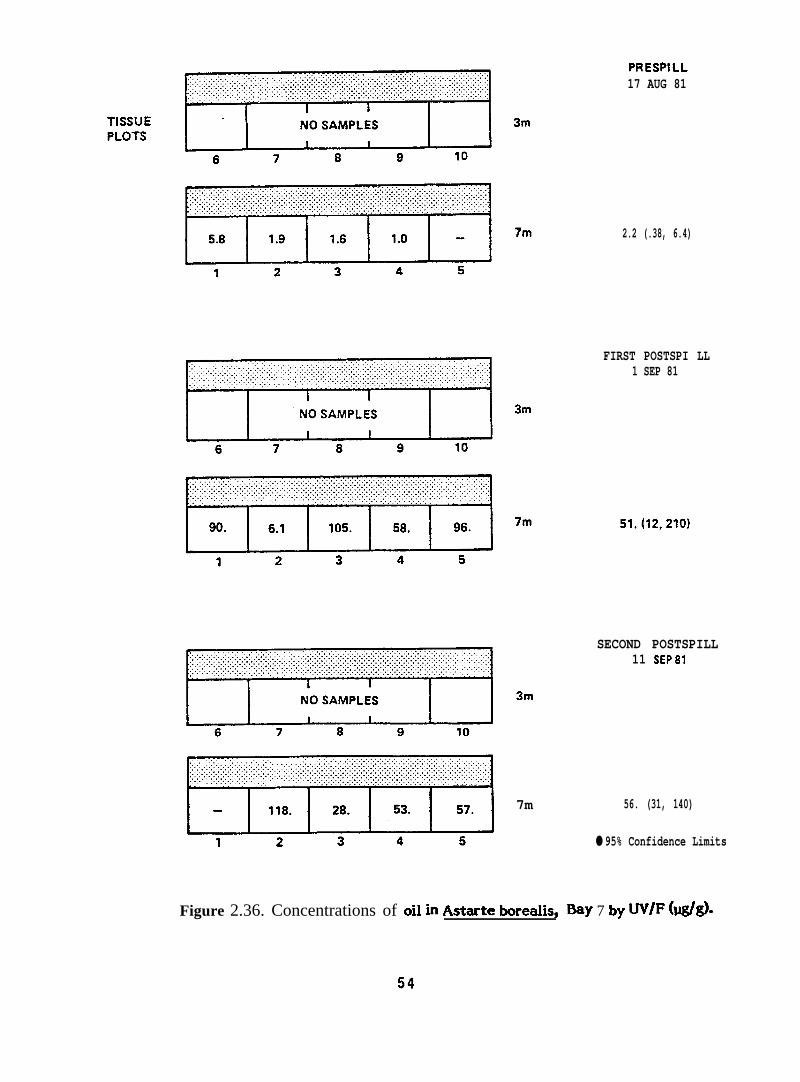
7m
PRESPILL17 AUG 81
2.2 (.38, 6.4)
FIRST POSTSPI LL1 SEP 81
SECOND POSTSPILL11 SEP81
56. (31, 140)
● 95% Confidence Limits
Figure 2.36. Concentrations of oil in Astarte borewls, Bay 7 by UV/F (w/d=
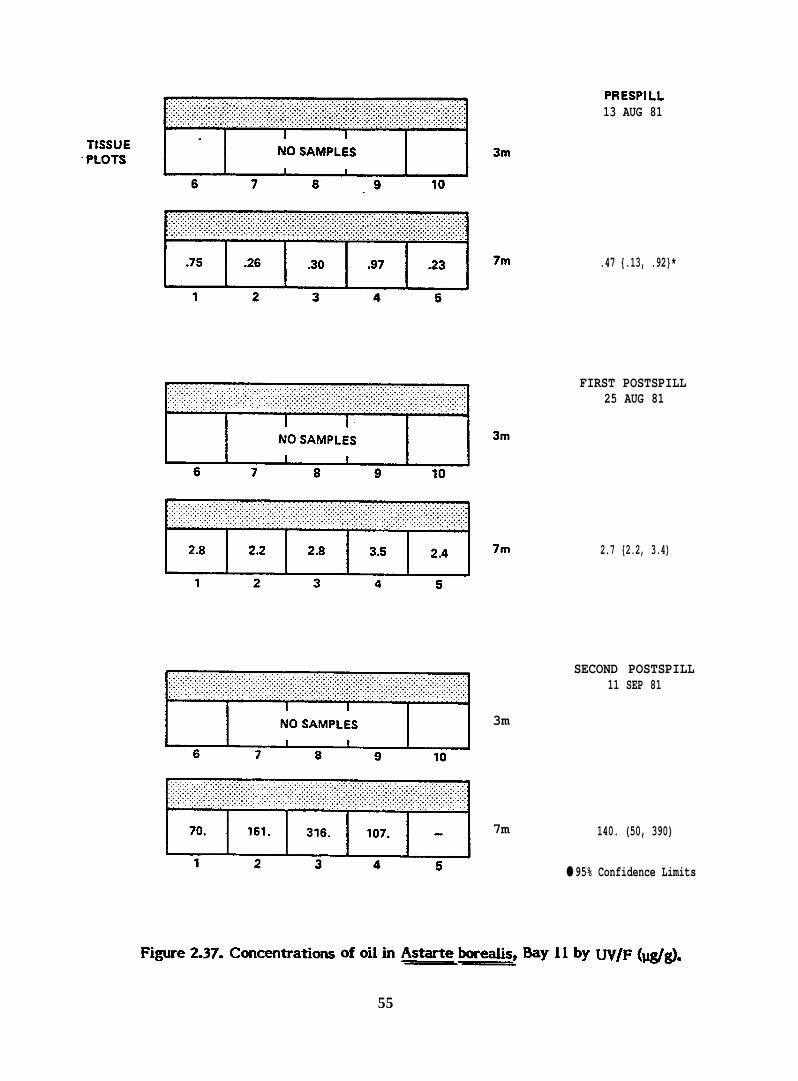
PRESPILL13 AUG 81
.47 {.13, .92}*
FIRST POSTSPILL25 AUG 81
2.7 {2.2, 3.4)
SECOND POSTSPILL11 SEP 81
3m
7m 140. (50, 390)
● 95% Confidence Limits
[email protected]. Concentrations ofotih Ast*ebe*s, Myllby W/F(@~.——
55
Astarte, Bay 9, l-day post-spill, 7 meter
Astarte, Bay 9, 2-week post-spill, 7 meter
Serripes, Bay 10, l-day post-spill, 3 meter
Serripes, Bay 10, 2-week post-spill, 7 meter
Extracts were available in sufficient quantities for PANH analyses of these
samples.
The results shown in the following GC/MS/DS data packets illustrate that
PANH compounds were only detected at low levels (<10 rig/g) in the l-day post-spill
Astarte sample. In this sample, dimethyl and trimethyl phenanthridines or acridines were
detected. The other samples did not contain detectable PANH compounds. PANH
compounds would be present at levels two orders of magnitude lower than the aromatics.
The Astarte aromatic values (Figure 2.30) were the highest of any of the animals (1000-
2000 rig/g). Therefore, it is entirely consistent to find the PANH values of K 10 rig/g. The
detection limit for the PANH compounds was <5 rig/g.
2.2.4.1 PANH Compmds in Oil. The accompanying figures are the
reconstructed mass spectra of the polycyclic aromatic nitrogen heterocyclic (PANH)
compound fraction of the Lagomedia crude oil used in the BIOS Program. C3-C6-
quinolines, C2-C 5 acridines, or phenanthridines, benzacridine, and C 1-C2 benzacridines
were identified at concentrations about two orders of magnitude lower than the aromatics
(See Appendix I).
2.2.4.2 Astarte borealis: Bay % 1 D a y . Only trace concentrations
(c 10 rig/g, parts per billion) of dimethyl- and trimethyi-acridines or phenanthridines were
detected in Astarte borealk collected from Bay 9 one day after the spill (See Appendix
11).
2.2.4.3 Astarte borealis: Bay % 2 Weeks. No PANH at concentrations
above the detection limit of 5 rig/g were detected in this sample (See Appendix I I I].
2.2.4.4 Serripes #oenlandicus: Bay l& 1 Day. No PANH at
concentrations above the detection limit of 5 rig/g were detected in this sample (See
Appendix IV).
2 . 2 . 4 . 5 Serripes groenlandicus: Bay 1* 2 weeks. No PANH at
concentrations above the detection limit of 5 rig/g were detected in this sample (See
Appendix V).
56

2.3 D&ussion
The analytical results presented here and in Boehm (1982) considerably
increase our knowledge of the differential fate and behavior of chemically dkpersed and
surf ace oil. Furthermore, the transport of oil to the benthos, its route of transport to
benthic organisms (oil acquisition), and the species-specific chemical nature of biotal oil
deputation are revealed in the wealth of data obtained in this study. We will discuss some
of the most important observations and trends here as they pertain to the behavior of oil
in the experiments, and to specific important transport paths and blotal impacts.
The quantities of oil driven into the water column as a result of chemical
dispersion are far greater than those that result from transport of untreated surface oil
into the water column. Concentrations of chemically dispersed oil in the water column
ranged from 1 to greater than 50 ppm (-100 ppm) during the dispersed oil discharge and
for as long as twelve hours after discharge ceased at some points in Bay 9. Differential
movement of oil released at different points along the diffuser resulted in direct
northward movement of oil at greater depths of release (10 m) and initial southerly
movement of oil at shallower depths followed by subsequent reversal of direction and
“reinvasion” of Bays 9 and 10 four hours after formal oil/dispersant discharge ceased. The
dispersed oil plume formed a very stable layer of oil in the water column f or perhaps 6-13
hours after dispersal. Dispersed oil droplets carried by strong shore currents were
advected for considerable distances without a significant change in the composition of the
oil. Whether this occurred due to the stability of the small (-10 ~m) oil droplets, thus
retarding f ractionat ion (i ● ., dissolution or evaporation), or whether particulate and
dissolved parcels of oil traveled coherently due to strong advection (0.5 knot currents), is
difficult to ascertain. Results of large volume water samplings which were taken outside
of these concentrated plumes and after the passage of the highest concentrations
indicated that a physical-chemical fractionation of hydrocarbon compounds did occur. It
is, however, quite significant that fresh oil with its full suite of low molecular weight
saturated and aromatic components persisted as a coherent plume for considerable periods
of time (6-13 hours), apparently cut off from evaporative loss from either the dissolved
state or by advection to the surface. Indeed, confirmation of this coherent oil layer was
made by fluorescence profiling and by discrete sampling, sometimes indicating a tenfold
57
increase in water-borne oil concentrations within a water layer sandwiched by lower
concentrations of more highly weathered oil. The persistence of low molecular weight
saturates (C 6-C 10 alkanes) and aikylated benzenes and naphthalenes in the plume in
similar proportion to the total petroleum in the neat oil was unexpected. Surely the
subsurface release of dispersed oil accounted for this. A surface release followed by
application of chemical dlspersants would have allowed some loss of light aromatics to
occur by evaporation.
The very striking similarity between the BIOS dispersed oil plume behavior and
that observed in the Ixtoc I spill ( 130ehm, Barak, Fiest and Elskus 1982) is of
no small importance. A subsurface release of oil that creates smal I oil
droplets either through shear ( Ixtoc ] Or through stabilization through
chemical dispersion (BIOS) with resulting droplets advected by strong
currents, results in subsurface coherent plumes of unweathered fresh oil with
a full contingent of toxic aromatics. The similarities between the two events
are also str ik ing given the 25°C water column temperature differential
between Gulf of Mexico and Arctic waters. Of course these initial high levels
of oil (roughly 10 ppm in the ixtoc I and 10 ppm and greater in the B I O S
scenarios) will eventually be reduced through dilution and diffusion even if the
coherent subsurface plume persists as it did for 20 km or so in the Ixtoc I
spill.During and after the dispersed oil experiment, there was little evidence for
either the large-scale beaching of dispersed oil or the surfacing, in the water column, of
dispersed oil. However, both phenomena did occur to minor extents and resulted in some
important information. Oil that was found adhering to the Bay 9 beach was present at low
levels (5-10 ppm). The oil had weathered significantly, due mainly to losses of low
molecular weight components. Both the concentration of oil on the beach and its
composition were nearly identical to those found in the offshore bent hic sediments
implying a detectable, but low sorptive affinity of dispersed oil. Oil which did appear to
have coalesced at the sea surface was highly weathered through loss of low boiling
saturates and aromatics. The state of weathering of this surface oil sampled several
hours after initial dispersed oil discharge was equivalent
surface oil (Bay 11). Thus it appears that the coalesced
stripped from the oil in the water column with the
weathered residue.
to that of nine-day-old beached
oil formed after solubles were
coalesced oil forming from a
58
Oil did impact the sediments of Bays 9 and 10 immediately after the dispersed
oil spill where initially a significant amount of the sedimented oil (-20%) resided in the
surface floe. Sedimentation rates were estimated to be in the 2-10 mg/m2/day range.
Subsequently, the floe was transported elsewhere, probably offshore, because floe from allbays sampled in the second post-spill period (September 11) was free of any detectable oil.
Levels of oil in the sediments, however, remained elevated (l-5 ppm) in Bays 9 and 10 and
although this dosing is considerably less than a “massive” dosing, it will continue to affect
benthic biota for an unknown period of time. The overall sediment impact due to passage
of dispersed oil through Bays 9 and 10 was minimal, with less than 1 % of the discharged
oil probably residing in the sediment at any time.
Results from the initial sampling of sediments indicated that 80 % of the oil
detected in the top O-3 cm was not associated with the floe. This is in contrast to results
from other spills [e. g., Boehm, Barak, Fiest and Elskus 1982; Boehm, Wait,
Fiest and Pilson 1982) and to experimental tank studies ( Gearing et al., 1980]
in which most of the initial I y sediment-associated oil was in the f Ioc layer.
What appears to be occurring in the B 10S dispersed oil spill }s a low level,
direct and rapid penetration of dispersed oil into the bulk surface sediment,
presumably a process mediated by the decrease of the oil’s interracial tension
due to chemical dispersion allowing for penetration of the solid inte~ace
perhaps into interstitial waters. Indeed chemical results from polychaete
analyses in Bays 9 and 10 ( Norstrom and Engelhardt, 1982) revealed an
initial uptake of an alkylated benzene and napthalene (i . e., water-soluble
fraction ) enriched petroleum hydrocarbon assemblage in Bays 9 and 10 only, “
perhaps associated with interstitial water penetration of fractions of the oil.
The Bay 7 “control” did receive 50-100 ppb of dispersed oil in the first few
days after the discharge. This quantity of oil was measured directly (Green et al., 1982)
and was monitored indirectly through hydrocarbon body burdens in filter-feeding bivalves
(i.e., M ya, Serripes). Direct sediment analyses and indirect evidence f rom deposit-feeding
animals (Macoma, Strongylocentrotus) indicate, however, that oil impact to Bay 7
sediments was quite minimal with only patchy low level inputs noted. The Bay 7
analytical results point to an important conclusion regarding application of UV/F and GC2
techniques to the BIOS study. While background (by UV/F) levels of “oil equivalents” in
the sediments was -0.5 ppm, many samples did exhlblt post-spill oil levels of 1.0- 1.5 ppm.
In this concentration, range levels were too low to unambiguously yield an oil/no oil
59
!.
decision based on GC2. Oil levels of -1.0 ppm would contain individual component
concentrations (i.e., n-alkanes) of -.01 ppm (or 10 rig/g). Due to significant biogenic
background in the GC2 traces, this level of individual components was often too low to
see in the GC2 traces. Thus UV/F becomes a key to assessing oil concentrations in
sediments. However, in several cases in Bay 7 sediments, low UV/F levels (-0.3 ppm),
generally associated with background levels, were shown by GC 2 to contain small amounts
of oil. The weathering of oil while in transit to Bay 7 with resulting loss of water-soluble
aromatics and a concomitant decrease in UV/F response caused whatever oil was seen in
Bay 7 sediments to be relatively enriched in saturates (not detectable by UV/F). Thus the
two techniques of UV/F and GC2 proved to be an extremely powerfuI complemental y set.
Water-borne oil in Bay 11 was initially confined to the surface (O-2 meters) layer
during which time Iarge-scaie transport of oil to the benthos via sorption and sinking did
not occur. Through large volume water samples, low levels (ppb) of oil were detected in
mid-depth and bottom waters fargel y in a particulate form, prior to any possible cross-
contamination from the dispersed oil spill occurring a week later. That oil did impact the
sediment in Bay 11 prior to the dispersed oil spill is evident from uptake patterns of all of
the benthic animals, especially those of the deposit-feeders Macoma and Nuculana and of
the filter-feeder Serripes which all revealed uptake of oil, albeit at lower levels relative
to those which were acquired in the dispersed oil scenario, prior to any possible cross-
contamination from Bays 9 and 10. We do know that the dispersed oil’s inf Iuence was far-
ranging including a transient water column impact at Bay 7 causing elevated levels of oil
in all benthic btota, especially the filter-feeders ~ and Serripes. Thus it may be logical
to “subtract” the observed Bay 7 animal levels from the Bay 11 values to derive a “pure”
Bay 11 result for the second post-spill sampling. Using this logic, it can be concluded that
although low levels of oil are acquired in Bay 11 by the filter-feeders, the major Bay 11
impact is on the deposit-feeders which are more closely linked to the sediments and which
acquire weathered oil from off of the beach face.
The most significant findings of the study concern the relationship between
water-borne levels of oil, sediment concentrations and levels in benthic biota. Initial
uptake of oil by ~ and Serripes is from the water column wherein oil is acquired
through pumping of contaminated seawater through gills. Most of this oil initially resides
in the animal’s gut as confirmed through Serripes dissections. Chemically, even the initial
60
oil residues in the gut and muscle tissue are different. The more water-soluble aromatics
(naphthalene, alkylated benzenes) are transported to the muscle tissues (including gills)
more rapidly, with the phenanthrenes and dibenzothiophenes preferentially located in the
gut. During the first two weeks after the spill, however, it is these higher molecular
weight aromatics which persist, the water-soluble aromatics being depurated more
readily.
Initial levels of oil in filter-feeders from Bay 7 are equal or greater than those
from Bays 9 and 10, where water column levels of oil were 20 to 200 times as great.
Sediments are ruled out as an oil-biotal intermediary due to the near absence of oil in
Bay 7 sediments. Thus one must postulate that while& and Serripes from Bays 9 and 10
either cease pumping due to water column levels or die after’ initial accumulation of oil,
animals in low-to-moderately contaminated waters continue to pump and acquire oil as
long as it is present in the water. At water column concentrations of 50 I.@l (50 ppb), a
clam (1 g dry weight) pumping at a rate of 1 liter per hour would pass 1.2 mg of oil
through its body in 24 hours, more than enough to acquire a 100-500 ppm concentration.
As levels of oil in Bays 9 and 10 were much higher, 1-50 ppm initially and 100-200 ppb for.
at least a day to a day and a half after cessation of the oil spillage, opportunities for
greater bioaccumulation in Bays 9 and 10 were available but were probably not achieved
due to either saturation in the gut, inability to transport oil across the membranes fast
enough to acquire more oil, or a wholesale cessation of pumping. The latter explanation is
the most likely.
& truncata and Serripes groenlandicus are filter-feeders and accumulate oil
primarily from the water column. They depurate 60-75 percent of the accumulated oil
wit hin two weeks, even though the sediments in which they reside remain contaminated
with oil. On the other hand, Macoma calcarea and Nuculana minuta are deposit-f ceders,
and accumulate petroleum hydrocarbons primarily from the sediments. In controlled
laboratory experiments, Roesijadi et al. (1978) showed that the deposit-feeder, Macoma
inquinata, accumulated higher concentrations of aromatic hydrocarbons from Prudhoe Bay
crude oil-contaminated sediments than did the filter-f ceder, Protot haca staminea. In the
BIOS study, the deposit-feeders continued to accumulate hydrocarbons during the two
weeks after the spill (Bays 9 and 11) or became heavily contaminated immediately after
the spill and retained the hydrocarbons for at least two weeks (Bay 7 and 10). The GC2
61
profiles of tissue extracts of the deposit-feeders show evidence of uptake
sediment, rather than from the water column, after an initial rapid uptake of
50 ppm oil from the water column.
of oiI from
perhaps 30-
As discussed previously, the two oil spill experiments conducted introduced oil
into the nearshore system in two distinct manners. The Bay 11 surface oil (untreated)
spill resulted in detectable water-borne oil concentrations only in the top meter or so of
the water column (Green et al., 1982). That low levels of water-soluble oil may have
, penetrated to the benthos during the first day or so following the spill can not be
confirmed from direct chemical evidence of water samples, but may have occurred,
causing the low intitial increases in petroleum hydrocarbon levels and levels of water
soluble aromatics in some of the filter-f ceders (M ya, Serripes, Ast arte). That oil did
impact the bent hos of Bay 11 as soon as one day after the spill is indicated by the uptake
of oil by Macoma, Pectinaria and Strongylocentrotus in the immediate post-spill period.
Subsequent benthic impact of oil in Bay 11 is clearly indicated in increased sediment
concentrations (-5 ppm ) as well as by the increased uptake of oil by the deposit and
detrital f ceders. The oil reaching the benthos during the 1 day to 2 week post-spill period
was weathered due to evaporation/dissolution as evidenced by the loss of alkylated
benzene and naphthalene compounds relative to the spilled oil.
- The uptake and deputation curves during the first several days are difficult to
reconstruct due to differences in sampling times. For example, it k not clear whether
higher levels of oil in Serripes in Bay 10 versus Bay 9 were due to a combination of animal
behavior and water column concentration or due to the additional day during which they
acquired oil. Alternative y, filter-feeders may very well have “shut down” their pumping
systems in Bay 9 (or were narcotized or killed outright) due to high water column oil
concentrations, while those animals in Bay 10 may have continued to pump and acquire
more oil. Indeed this seems to have been the case in Bay 7. Low levels of oil (50-100 ppb)
were detected h-i Bay 7 two days after the spill (Green et al., 1982)? as were these same
levels in Bays 9, 10, and at other Ragged Channel locations. Bay 7 Serripes were
especially efficient at concentrating oil from these lower water column levels, with oil
residing primarily in the gut initially. Serripes and ~ from Bay 7 probably did not
detect those lower levels of oil and may have continued their normal pumping of water
throughout the first several days after the spill.
62
As alike as ~ and Serripes behave vis-a-vis routes of oil uptake, they differ
in the compositional nature of the oil which they retain. During the two week post-spill
period of deputation, an in vivo biodegradation, presumably by a microbial population.—within the animal’s guts, occurred to a significant extent. At this point, the similarity
between & and Serripes erodes, because although on a gross level both species
depurated oil, on a detailed chemical basis Serripes preferentially retained a high
molecular weight saturated hydrocarbon assemblage as well as the higher alkylated
naphthalene, phenanthrene and dibenzothiophene compounds. I&, on the other hand,
depurated all hydrocarbon components, although the water-soluble alkyl benzenes and
napht halenes were depurated somewhat faster.
Thus, as the exposure levels in the water column decreased, levels of total
hydrocarbons in & and Serripes decreased. This, plus the fact that whole, undegraded
oil resided in Bay 11, 9, and 10 sediments without a concomitant increase in
concentrations of oil in the filter-feeders provides evidence of decoupling of sedimentary
sources of hydrocarbons from these animals. This decoupling is accented by the fact that
while oil residues in sediments were not degraded, residues in the animals were
microbian y degraded.
Macoma, Nuculana, Stron gylocentrotus, and Pectinaria clearly are influenced
by sediment oil levels more than those in the water column. Though there is some
indication that low levels of soluble aromatics in the water were reflected in early oil
compositions in the deposit-f ceders, steady uptake of sediment-bound oil by this group
dominates. Thus, the lack of detectable sediment-bound oil in Bay 7 is reflected in much
lower petroleum body burdens in deposit-feeders from this bay. Additionally, over two
weeks we see much less of an indication of microbial degradation in the Bay 9, 10 and 11
deposit-feeding animals due to the acquisition of undegraded oil from the sediments
appearing as a constant compositional overprint. Furthermore, those aromatic
hydrocarbon components longest-lived in the sediments (i.e., alkylated dibenzothiophene
and phenant hrene compounds) steadily increase in the deposit-feeders.
Thus, the various filter-feeders and deposit/detrital feeders reflect the fate of
oil in the system quite well. The fact that the polychaete acquires whole oil, dominated
somewhat by a water-soluble grouping of alkylated benzenes and naphthalenes, may
reflect the association of oil with interstitial waters in the upper sediment column.
63

A similar differential behavior of fiIter-feeding versus detrital feeding
kivalves was reported recently in an actual spill (Boehm et al. 1982b). In this study, the
authors found that the benthic-dwelling Macoma balthica was slower to initially acquire
oil than was the filter-f ceder M ytilus edulis which resided in the ph yt al zone. After
beaching and erosional transport, and/or direct sedimentation of oil, the petroleum body
burden increased in Macoma and only slowly decreased as the sediment levels dropped.
E!@&! On the other hand? eX P O Sed tO a IYIaSSiVe initial amount of water-borne oil ~depurated rapidly and almost completely over one year’s time.
During the first two to three weeks after the spills, there was a notable lack
of significant biodegradation of oil in the water column and in the sediments. There is no
chemical evidence for the existence of biodegradation as a removal mechanism with the
short-term post-spill period (3 weeks) either in the water column or in the sediment. One
would have predicted higher rates of biodegradation in surface sediments, especially in
the surface floe, but none was observed through degradation of the “easily” degraded n-
alkanes. However, degradation of n-alkanes in the oil resulting in the classic loss of n-
alkane relative to isoprenoid and other highly branched alkanes is observed within ~ and
Serripes and to lesser extents in other benthic species. Rapid degradation of alkanes only
occurs in vivo. Whether or not this unique finding can be ascribed to microbiotal——populations within the organism itself, a likely mechanism, must be confirmed
incfependenti y. We suspect that given an unspecified amount of time, microbial
populations will begin to utilize the hydrocarbons as an energy source (i.e., biodegradation
will become more significant).
The use of a variety of biological monitors or sentinel organisms in the BIOS
study has served to delineate oil transport paths and changing environmental compartment
levels with time during the immediate post-spill (O-3 weeks) period. Furthermore, this
study has shown that although similarly behaving animals (e.g., Mya/Serripes;
Macoma/Strongylocentrotus) may on a gross level appear to act in concert, the details of
in vivo modifications and retentions of individual petroleum components are quite.—different and may be intimately associated with long-term biological effects on the
individual benthic species.
64
3. HISTOPATHOLOGY
3.1 Materials and Methods
3.1.1. Collections. The first series of specimens of lk@ truncata werecollected by divers between August 7 and August 17, 1981. A second group of specimens
was collected between August 21 and September 3, 1981, following the application of
dispersed oil to Bay 11 on August 19, and of dispersed oiI to Bay 9 (and subsequently to
Bay 10) on August 27. Because of the unlikely possibility that any major pathological
conditions caused by the oil or dispersed oil would be apparent within the approximately
two-week period foliowing the spill, a third series of samples was not collected until a
year later, on August 27and 28, 1982.
Specimens of Macoma calcarea were collected prior to the spill only from
Bay9. Collections were made in Bay 7, the control bay, on September 2 and 3, 1981, a
few days after oil and dispersant were added to Bay 9, and almost two weeks after oil was
applied to Bay 11.
The dates and sites of collection and the number of specimens of each species
collected for histopathology investigations are shown in Tables 3.1 and 3.2.
3.1.2. Processing. Specimens were fixed at the Baffin Island location by the
collectors. Fixation for the 1981 collections was in Carson’s modified Millonig’s
phosphate-buffered formalin. This fixative was used rather than the originally proposed
Helly’s fixative because of its ease of handling by the divers under field conditions.
Neutral buffered 10 percent formalin was used for the 1982 collections for the same
reason.
For fixation, Iarger specimens such as & truncata were to have one valve
removed before being placed in the fixative. Smaller specimens such as Macoma calcarea
were to be treated similarly if possible, or at least to have the shell cracked slightly to
permit entry of the fixative. In fact, some specimens were placed intact in the fixative.
The specimens were placed in fixative in small plastic tissue bags, in which were also
placed coded identification tags. The bags were then sealed by having the tags rolled
down and secured with attached plastic strips. The bags were packed in shipping
containers and shipped to the laboratory in Duxbury, Massachusetts for histopathological
analysis.
65

Table 3.1. Dates of collection and collection sites for specimens of N&truncata for BIOS histopathology investigation
Date Bay No. ofcollected Number Specimens
8/7-8/9/1981 9 94
8/12/81 11 63
Immediate 8/1 4-8/ 15/81 10 84Pre-Spill
8/17/81 7 40
8/21/81 11 59
8/28-8/29/81 9 80
Immediate 8/29-8/30/81 10 102Post-Spill
8/31/81 7 47
8/27/82 11 77
8/27-8/28/82 10 73
1 year 8/28/82 9 75Post-Spill
8/28/82 7 75
66

Table 3.2. Dates of collection and collection sites for specimens of Macomacalcarea for BIOS histopathology investigation
Date Bay No. ofcollected Number Specimens
Immediate 8/9/81 9 83Pre-Spill
Immediate 9/2-9/3/81 7 72Post-Spill
8/27/82 10 83
1 Year 8/27/82 11 120Post-Spill
8/28/82 7 86
8/28/82 9 75
67

Fixed specimens from the 1981 collections were received at Battelle New
England Marine Research Laboratory on November 6, 1981. Specimens from the 1982
collections were received on September 22, 1982.
Upon receipt at BNEMRL, the samples were removed from the shipping
containers and logged in according to the coded label by station number, species, and date
collected. The specimens were then washed in running tapwater for several hours and
transferred to 70% ethyl alcohol until histological processing.
For processing, the specimens were trimmed to provide cross-sectional pieces
of tissue which were dehydrated and embedded in ParapIast Plus.
The embedded tissues were sectioned at 5 to 6 pm and stained with
hematoxylin and eosin using standard procedures. The stained sections were examined for
any pathological conditions.
3.2 Results
Results of histopathological observations of tissues of Baffin Island molluscs
are summarized in Tables 3.3 through 3.7. Tables 3.3, 3.4, and 3.5 show the results of
observations of N& truncata from the pre-spill, immediate post-spill, and one year post-
spill collections, respectively. Tables 3.6 and 3.7 summarize the results of the pre-spill
and one year post-spill observations of ,Macoma calcarea.
Despite indications of poor fixation, a number of pathological conditions were
noted primarily in tissues sampIed after the spill. The most serious of these included
hematopoietic neoplasms, or blood tumors, in both species of clams studied.
Details of the pathology of each of the two species studied are provided below.
3.2.1 Mya truncata. The most common pathological problems observed were
hemocytic infiltration, or inflammation, and the occurrence of an unidentified trematode
parasite (Table 3.3, 3.4, and 3.5). Immediately following the spill, the incidence of
necrotic tissue, particularly in the gills and digestive tract, increased in Bays 7, 9, and 10
(Table 3.4), but a year later this incidence had decreased considerably (Table 3.5).
Necrotic lesions in the digestive tract were accompanied by an increase in the number of
mucus-producing cells in the gastrointestinal tissues, and in Bay 10 by unidentified
basophilic inclusions in the digestive gland tubules. Bays 9 and 10 produced a few one-
year post-spill clams with granulocytomas throughout the tissues (Figure 3.1).
68

.
69
. .
.
J.

Table 3.4. Summary of Isistopatttdogiaf observations of ti~ues of the truncate soft-shelled clam ~ trmcata from the Baffin Island oilspill area immediately following the application of oil and dispsfsant
condition
DigestiveNumbers of Tubule
Bay No. Station Spimens Hemocytosis Necrosis Akcesses Vacuolization Metaplasia Hyperplasia Neoplasia Parasites Other
7 1 10 1 3 2-mucus cells in gastrointestinalepitheliums
8; 104 10 15 9
9 3 11 54 11 3 45 10 1 26 8 4 l-fibrous connective tissue7 11 38 10 2 2 2
1 3:0 :0 1 6
2
10 1 11 5 42 10 1 43 11 4 2 lmucus 041s in gastrointestinal
epitheliums4 10 3 15 9 2 1 26 10 1 57 1 1 48 :1 5 l-basophHic inclusions in digest-
ive mass of hypertro~lchemocyte tubules
9 11 1 7 l-basopMlic inclusions in digest-ive tubles
10 10 2 2-basophilic inclusion in digestive● tubules
1
11 1 12 52 11 1 53 13 64 13 55 10 1 . . 1
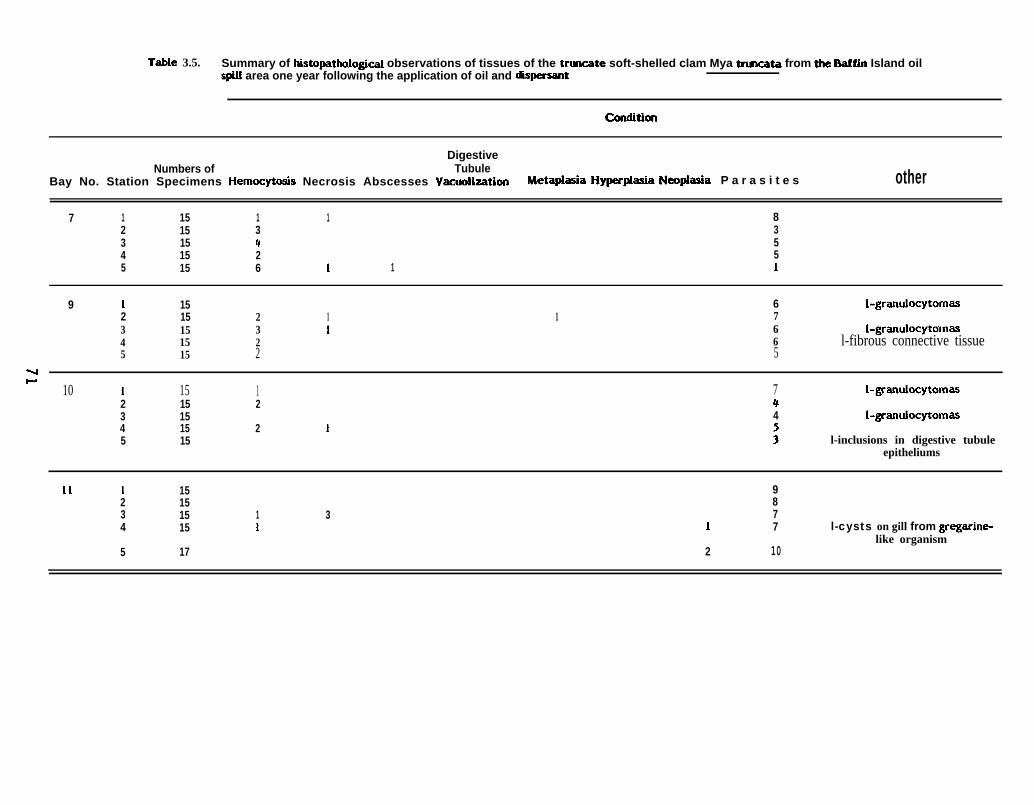
Table 3.5. Summary of hktopathdogical observations of tissues of the trtmcate soft-shelled clam Mya tmmcata from the Baffin Island oilspill area one year following the application of oil and dispersant
Ccdition
DigestiveNumbers of Tubule
Bay No. Station Specimens Hemacyto6is Necrosis Abscesses Vacuolization Metaplasia Hypeqhsia Neoplasia P a r a s i t e s other
7 1 15 1 1 82 15 3 33 15 4 54 15 2 55 15 6 1 1 1
9 1 15 62 15
I-granulocytomas2 1 1 7
3 15 3 1 6 l-granulocyhnnas4 15 2 65 15
l-fibrous connective tissue2 5
ww
10 1 15 1 7 l-granulocytomas2 15 2 43 15 4 I-granuiocytomas4 15 2 15 15 ; l-inclusions in digestive tubule
epitheliums
11 1 15 92 15 83 15 1 3 74 15 1 1 7 l-cysts on gill from gregarine-
like organism5 17 2 10
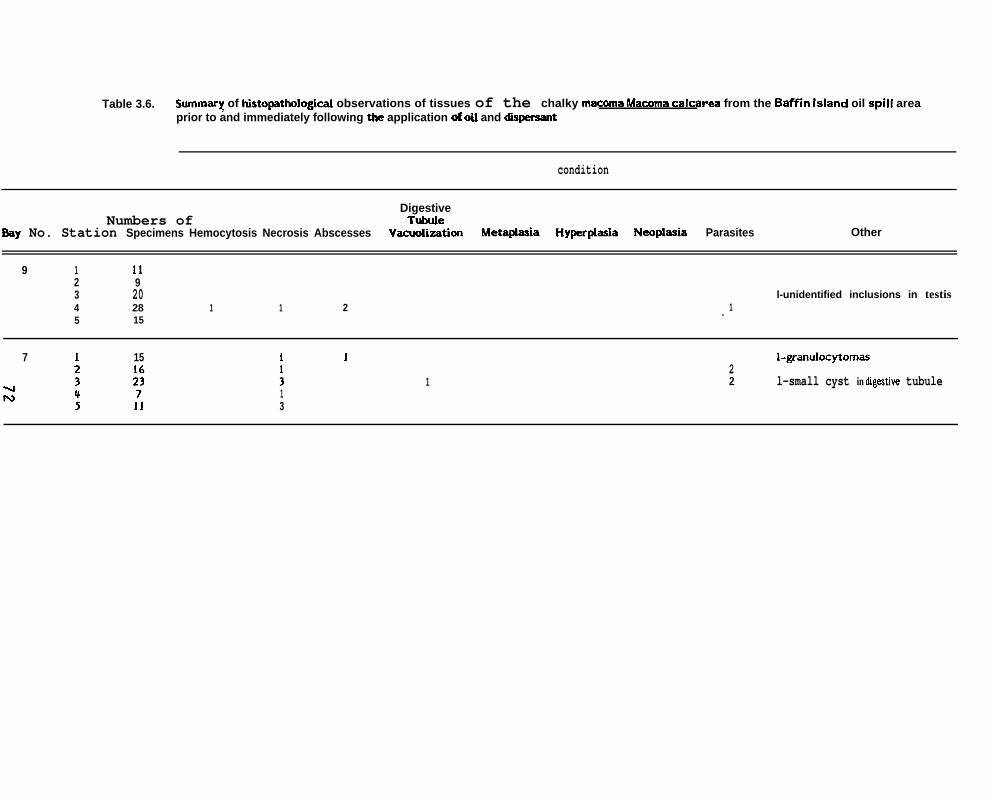
Table 3.6. summary of histopathological observations of tissues of the chalky macoma Macoma calcarea from the Baffin Island oil spill areaprior to and immediately following the application of oil and dispersant
condition
DigestiveNumbers of Tubule
Oay No. Station Specimens Hemocytosis Necrosis Abscesses Vacuolization Metaplasia Hyperplasia Neoplasia Parasites Other
9 1 112 93 20 l-unidentified inclusions in testis4 28 1 1 2 15 15
.
7 1 15 1 1
13
1
I-granulocytomas22 l-small cyst in d:gestive tubule
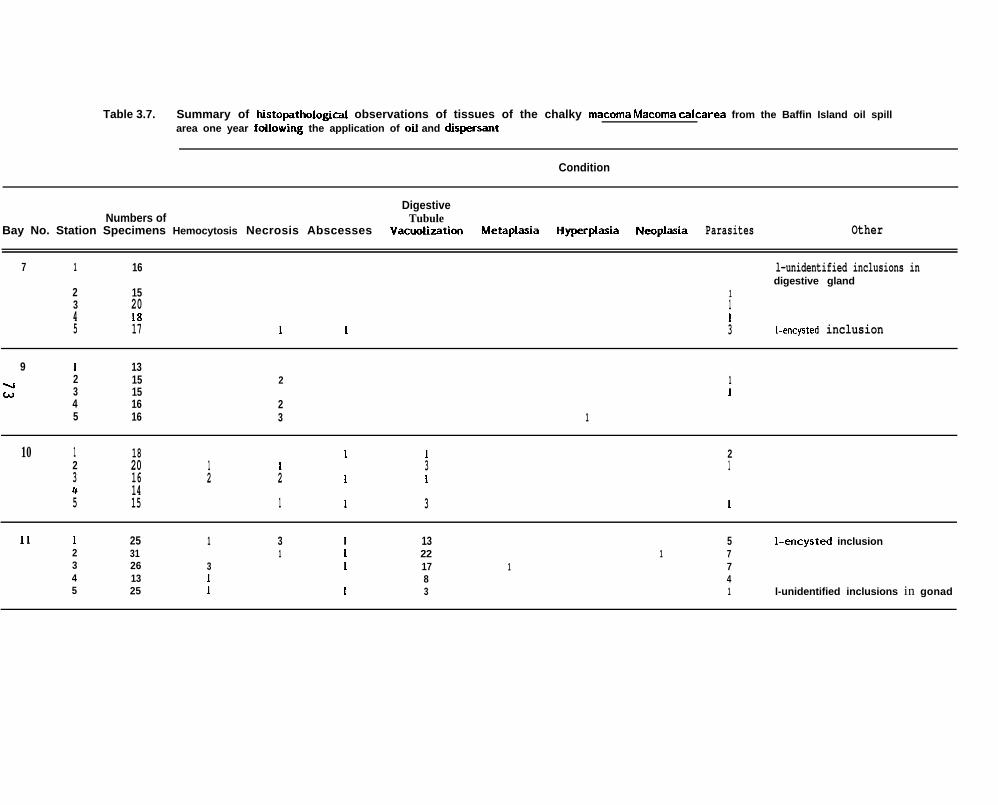
Table 3.7. Summary of histopathological observations of tissues of the chalky macoma Macoma calcarea from the Baffin Island oil spillarea one year folfowing the application of oif and dispersant
Condition
DigestiveNumbers of Tubule
Bay No. Station Specimens Hemocytosis Necrosis Abscesses Vacuolization Metaplasia Hyperplasia Neoplasia Parasites Other
7 1 16 l-unidentified inclusions in
2 15digestive gland
13 20 14 18 15 17 1 1 3 l-encysted inclusion
9 1 132 153 154 165 16
2
23
11
1
10 1 18 1 1 22 20 1 1 3 13 16 2 2 1 14 145 15 1 1 3 1
11 1 25 1 3 1 13 5 I-encysted inclusion2 31 1 1 22 1 73 26 3 1 17 1 74 13 1 8 45 25 1 1 3 1 l-unidentified inclusions in gonad
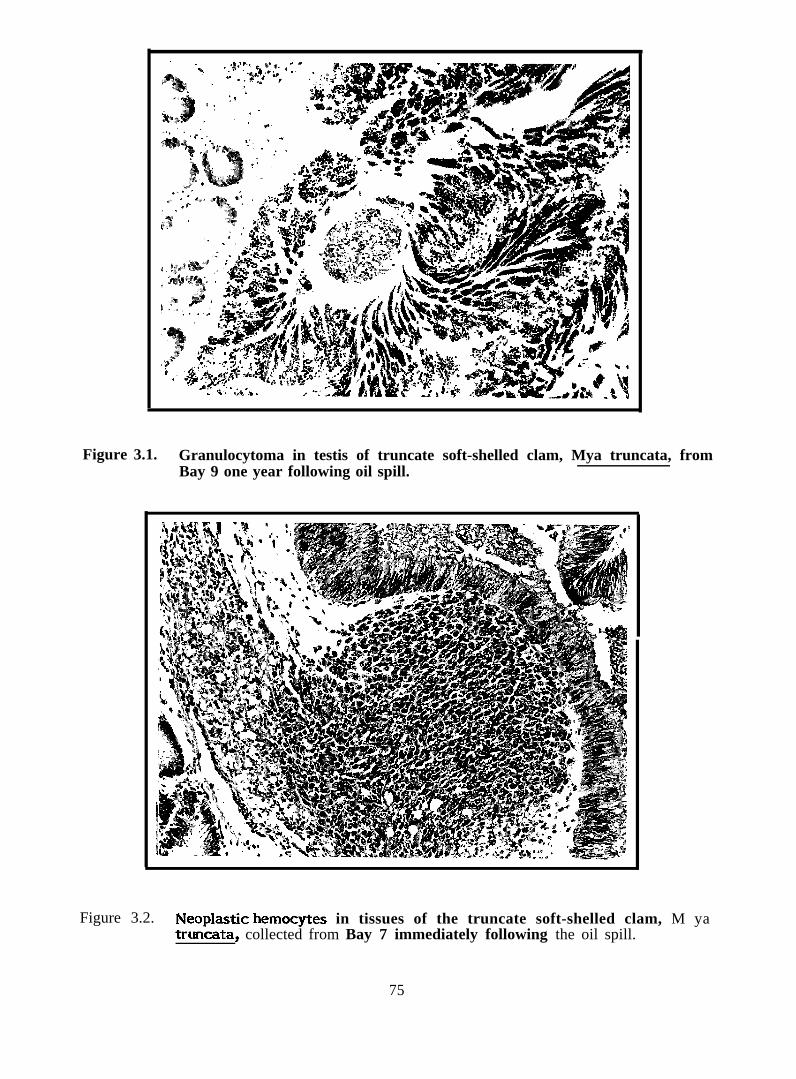
Figure 3.1. Granulocytoma in testis of truncate soft-shelled clam, Mya truncata, fromBay 9 one year following oil spill.
Figure 3.2. Neoplastic hemocytes in tissues of the truncate soft-shelled clam, M yatruncata, collected from Bay 7 immediately following the oil spill.
75
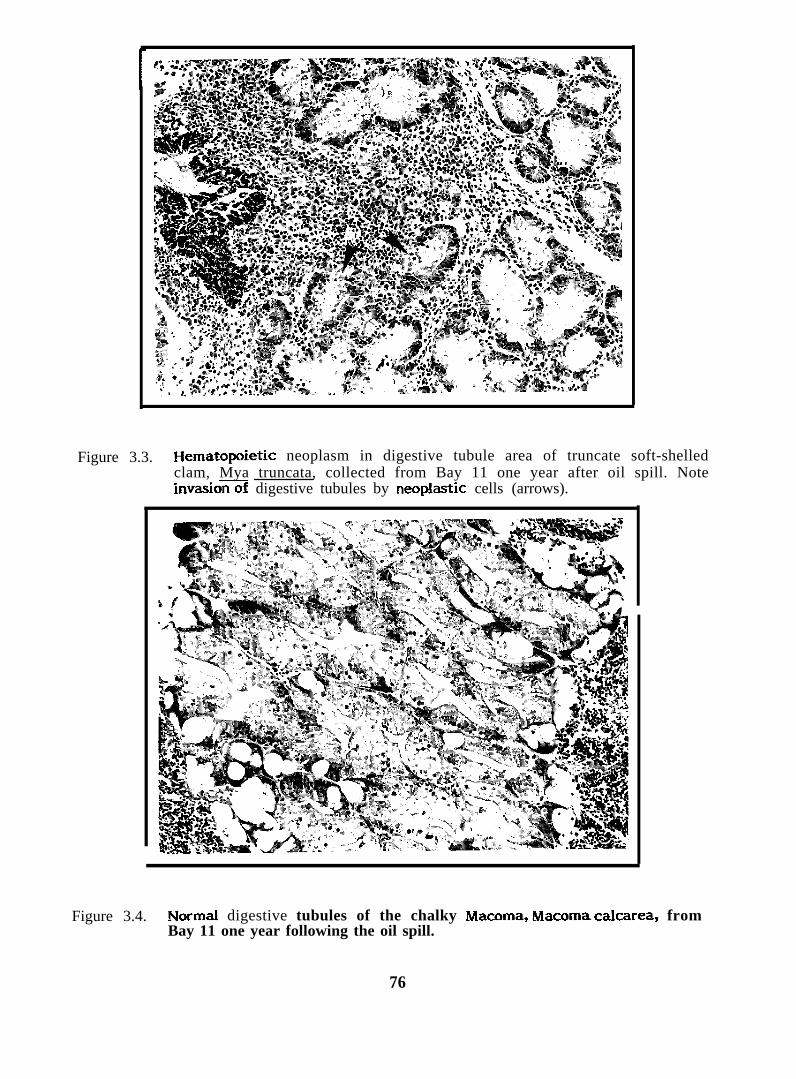
Figure 3.3. FIematopoietic neoplasm in digestive tubule area of truncate soft-shelledclam, Mya truncata, collected from Bay 11 one year after oil spill. Noteinvasio=f digestive tubules by neoplastic cells (arrows).
Figure 3.4. Normal digestive tubules of the chalky Macoma, Macoma calcarea, fromBay 11 one year following the oil spill.
76

Figure 3.5. Excessively vacuolated digestive tubules of the chalkv Macoma.cakarea, from Bay 11 one year following the oil spifl. “
. , Macoma
77
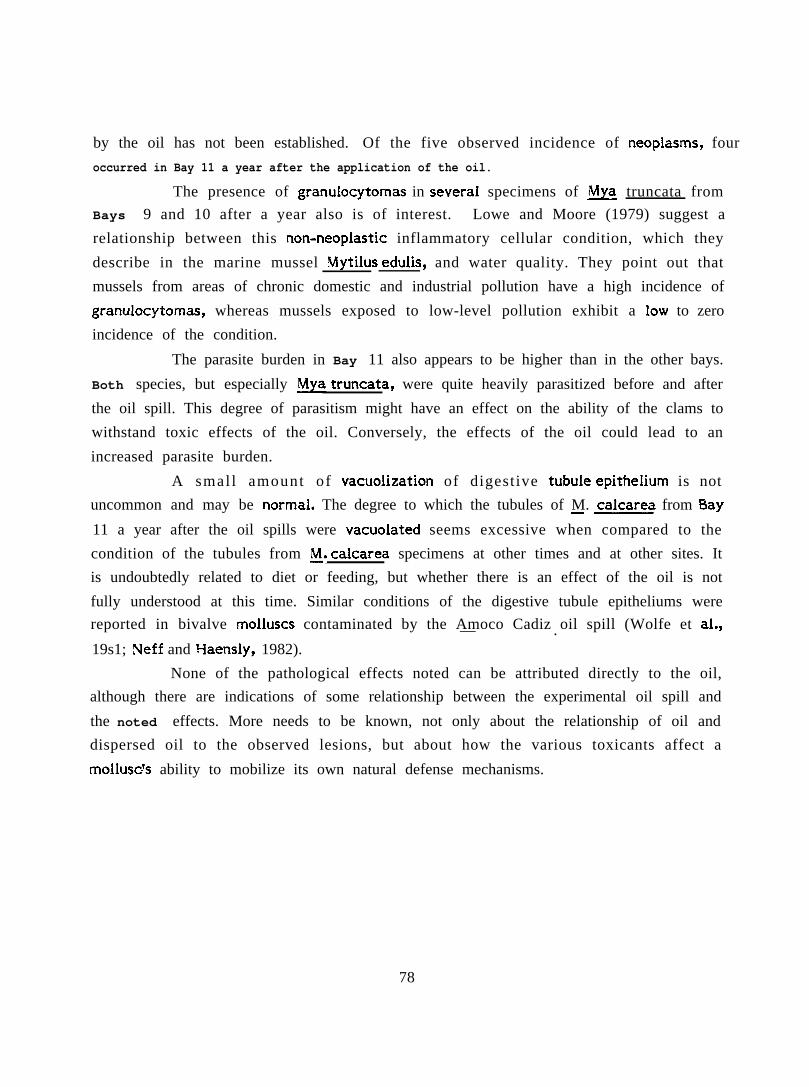
by the oil has not been established. Of the five observed incidence of neoplasms, four
occurred in Bay 11 a year after the application of the oil.
The presence of granulocytomas in severaI specimens of & truncata from
Bays 9 and 10 after a year also is of interest. Lowe and Moore (1979) suggest a
relationship between this non-neoplastic inflammatory cellular condition, which they
describe in the marine mussel Mytilus edulis, and water quality. They point out that
mussels from areas of chronic domestic and industrial pollution have a high incidence of
granulocytomas, whereas mussels exposed to low-level pollution exhibit a Iow to zero
incidence of the condition.
The parasite burden in Bay 11 also appears to be higher than in the other bays.
Both species, but especially & truncata, were quite heavily parasitized before and after
the oil spill. This degree of parasitism might have an effect on the ability of the clams to
withstand toxic effects of the oil. Conversely, the effects of the oil could lead to an
increased parasite burden.
A smal l amount of vacuolization of digestive tubule epithelium is not
uncommon and may be normai. The degree to which the tubules of M. calcarea from Bay.—11 a year after the oil spills were vacuolated seems excessive when compared to the
condition of the tubules from ~. calcarea specimens at other times and at other sites. It
is undoubtedly related to diet or feeding, but whether there is an effect of the oil is not
fully understood at this time. Similar conditions of the digestive tubule epitheliums were
reported in bivalve molluscs contaminated by the Amoco Cadiz oil spill (Wolfe et al.~— .19s1; Neff and Haensly, 1982).
None of the pathological effects noted can be attributed directly to the oil,
although there are indications of some relationship between the experimental oil spill and
the noted effects. More needs to be known, not only about the relationship of oil and
dispersed oil to the observed lesions, but about how the various toxicants affect a
mollusc% ability to mobilize its own natural defense mechanisms.
78
The objective of the biochemistry program was to compare the state of health
of infaunal bivalve molluscs from bays at the BIOS experimental site receiving dispersed
oil, undispersed oil, and no oil. A suite of diagnostic biochemical tests of proven utility
was used to diagnose sublethal pollutant stress in four populations of molluscs from the oil
spill site.
4.1 Materials and Methods
There were four experimental bays used in these experiments, located on the
northwest coast of Baffin Island, Northwest Territories, Canada. Bay 7 was considered a
reference bay (though it received oil), Bays 9 and 10 received dispersed oil, and Bay 11
received oil alone. A Lagomedio crude oil and the dispersant, Corexit 9527, were used in
these field experiments.
Mollusc specimens were collected by
stations located along two transects paralleling
isobaths in each bay. Stations 1-5 were along the
divers, using an air-lift system, at ten
the shore at the 3-meter and 7-meter
7-meter transect and Stations 6-10 were
along the 3-meter transect. Specimens were collected several days before the spill, 1-4
days after the spill, and approximately 2 weeks after the spill. Some samples were kept
over night or longer before freezing.
Mollusc specimens for biochemistry were frozen and returned to the U.S. on
dry ice. A complete set of the truncate soft-shell clam ~ truncata was available for
analysis. Only smal l numbers of Macoma calcarea, Astarte borealis, and Serripes
groenlandicus were available from a few bays at each sampling time. Therefore, we
examined only ~, but analyzed more replicate samples of this species from each
collection than originally proposed. A total of 228 specimens of ~ truncata were
analyzed for carbohydrates and lipids and 230 specimens were analyzed for tissue free
amino acids.
In the laboratory, individual clams were thawed, shucked, and weighed. Tissue
glucose, glycogen, and other glucose-containing carbohydrates (mainly trehalose, a
glucose disaccharide) were analyzed with the Beckman automatic glucose analyzer after
79
selective hydrolysis according to the method of Carr and Nef f (1983). The tissue was
homogenized. An aliquot of the homogenate was centrifuged and glucose concentration in
the supernatant was measured. Another aliquot of the homogenate was incubated
overnight in acid buffer with amyloglucosidase which selectively and quantitatively
hydrolyzes glycogen to glucose. The homogenate was centrifuged and the glucose
concentration in the supernatant was measured. For the other carbohydrates, an aliquot
of the tissue homogenate was incubated in concentrated HCL for three hours at 100oC.
The mixture then was neutralized with 12N NaOH and centrifuged. Glucose concentration
in the supernatant was measured. Glycogen concentration was calculated as glucose
concentration in the am yloglucosidase digest minus glucose concentration in the original
supernatant. The concentration of other glucose-containing carbohydrates was calculated
as the glucose concentration in the acid digest minus the glucose concentration in the
amyloglucosidase digest.
Total lipids were determined according to the methods of Holland and Gabbott
(1971). An aliquot of the tissue homogenate was extracted with chloroform-methanol,
centrifuged, and the supernatant dried and taken up in chloroform. Total lipids were
measured spectrophotometrically following treatment with H2s04 at 2000C.
Whole soft tissues of clams were extracted and analyzed fortissue free amino
acids by methods similar to those described by Roesijadi and Anderson (1979). The tissues
were homogenized in7 percent trichloroacetic acid. The homogenate was centrifuged and
thesupernatant was washed three times with diethyl ether to remove trichloroacetic acid.
The supernatant then was lyophylized and dissolved in O.lN HCI. Samples were analyzed
with a Waters Associates gradient high-performance liquid chromatography equipped for
post-column derivatization with o-phthalaldeh yde and f Iuorescence detection.
Data were analyzed for statistically significant differences between control
and treatment means by the .Mann-Whitney one-tailed U-test, Student’s t-test and
Kruskal- Wallis one-way analysis of variance. The Spearman rank correlation test was
used to detect association between pairs of biochemical parameters among animals from
cliff erent sampling times and treatment groups.
80
4.2 Results
Based on analyses of petroleum
molluscs, performed as part of this program
hydrocarbons in tissues of five species of
(see Section 2), all four bays received someoil during or after the simulated oil spill. N& truncata from Bay 10 became the most
heavily contaminated with petroleum hydrocarbons, followed in order by clams from Bays
9, 7, and 11 (Table 4.1). ~ from the two dispersed oil bays (Nos. 9 and 10) accumulated
the most oil immediately after the spill. The mean concentration of petroleum
hydrocarbons in clams from Bay 11 (oil alone) increased between one-day and 2 weeks
post-spill. Clams from the reference bay (Bay 7) were contaminated with a mean of 114
ppm (range 60-194 ppm in clams from the 5 stations on the 7-meter transect) one day
after the spill, indicating that some oil reached this bay. Before the spill, clams from all
four bays contained similar low levels of petroleum hydrocarbons.
There was a great deal of variation among replicates, experimental bays, and
sampling times in the concentration of carbohydrates and lipids in the tissues of ~
truncata (Table 4. l). Mean concentrations of free glucose were higher in clams from all
four bays two weeks after the simulated oil spills (second post,spill sample) than in
samples collected at the two earlier sampling times. There was a drop in the
concentration of free glucose in clam tissues between the pre-spill and first post-spill
samples in Bay 10 (dispersed oil) and 11 (oil alone). Glucose concentrations in tissues of
clams from the four bays were nearly the same at the time of the second post-spill
sampling. In clams collected before the spills, clams from Bays 9 and 10 had significantly
lower tissue glucose concentrations than clams from Bay 11. Immediately after the spill,
clams from the three experimental bays (9, 10, and 11) had significantly lower tissue mean
glucose concentrations than clams from the reference bay (7). Clams from the more
heavily oiled of the two bays receiving dispersed oil (Bay 10) had a significantly lower
tissue glucose concentration than clams from the less heavily oiled, dispersed oil bay (Bay
9).
There was a tendency for tissue glycogen concentration in clams to increase
between the first, second, and third collections, particularly in clams from the reference
bay. In clams from Bays 10 and 11, mean tissue glycogen concentrations dropped between
the first and second post-spill samples. The mean concentration of tissue glycogen in
81

Table 4.1. Carbohydrates and lipids in tissues of the truncated soft-shelf clam lk@ truncatacollected from the BIOS site before and after the simulated oil spill. Afl values are inmgfg wet tissue. Mean concentrations of petroleum hydrocarbons in tissues of theclams also are given.
(mg/gStatiodcolkxtion
wet wt. + SE)Petroleum Other Total
(P@ Glucose Glycogen Carbohydrates Lipi&
7 (Reference)Pre-Spill1st Post-Spill2nd Post-Spill
9 (Dispersed Oil)Pre-Spill1st Post-Spill2nd Post-Spill
10 (Dispersed Oil)Pre-Spill1st Post-Spill2nd 14 d Post-Spill
11 (Oil Alone)Pre-Spill1st Post-Spill2nd Post-Spill
0.3411447
0.38168124
0.68322144
0.432.093
0.642 + 0.0371.272 ; 0.1271.608 ~ 0.125
0.742” + 0.044C0.722 ; 0.032ABC1.517 ~ 0.098
0.744 + 0.058C0.428 ; 0.048A1.515 ~o.140
1.482 + 0.155A0.514; 0.075A1.459 ; 0.071
11.68 + 0.7713.85:0.9616.84 ; 1.30
10.32 + 0.64B11.31 ; 1.02C12.88 ; 1.40A
14.58 + 1.0217.39 ; 1.7514e50~ 1.01
12.29 + 0.9915.03 ; 0.6013.86 ~ 1.02
3011 + 1.200.26 ~ 0.190.74:0 .41
1.12 + 0.58C2.11 ; 0.601.66 ~ 0.52
0.13 + 0.07C0.63 ; 0.250.95 ~ 0.29
1.67 + 0.530.27 ; 0.261.34 ~ 0.39
158.08 + 17.76141.07 ; 15.29163.14 ~ 22.02
148.39 + 17.18183.52 ; 10.21BC166.01 ~ 13.16
170.31 + 11.98133.40 ; 8.59215.50 ~ 12.87
169.65 + 12.47118.52 ;12.10166.34 ~ 18.42
A, Significantly cliff erent from Reference (Sta. 7), Student’s T-test, or Kruskal-Wallis one-way ANOVAB, Significant y dif ferent from Disp. Oil (Sta. 10), Student’s T-test, or Kruskal-Wallis one-way ANOVAC, Significantly dif ferent from Oil Alone (Sta. 11), Student’s T-test, or Kruskal-Wallis on-way ANOVA

clams from Bay 9 in the second post-spill sample was the only value which was
significantly different from the corresponding value in clams from the reference bay.
Concentrations of total other carbohydrates, which consist of trehalose and other non-
glycogen oligosaccharides and poiysaccharides which yield glucose upon hydrolysis, were
highly variable and no obvious trends among samples from different bays or sampling
times were apparent.
Concentrations of total lipids in clams from Bays 7, 10 and 11 dropped
between the pre-spill and first post-spill samples and then returned to pre-spill or higher
values by the time of the second post-spill sampling. In clams from Bay 9, total lipid
concentration increased between pre-spill and first post-spill and then dropped to the pre-
spill range by the time of the second post-spill sampling.
The degree of contamination of ~ truncata with petroleum hydrocarbons
varied greatly within each bay depending on the station at which clams were collected
(see Section 2.). Data were available by station for petroleum hydrocarbon burden and
tissue glucose and glycogen concentration in ~ truncata from the second post-spill
collection (Table 4.2). Mean body burdens of petroleum hydrocarbons in clams from 30
stations in 4 bays ranged from 35 to 238 ~g/g (ppm). However, there was no relationship
between body burden of petroleum hydrocarbons and concentrations of glucose and
glycogen in the tissues of clams. In Bays 9 and 10, clams were collected at both the 3-
meter and 7-meter isobaths. There were no statistically significant differences between
clams from the two depths in concentration in the tissues of petroleum, glucose, or
glycogen.
Fourteen different free amino acids were identified and quantified in the
adductor muscles of @ truncata from the four bays. The mean concentration of total
free amino acids ranged from 12.45 to 23.25 @f/mg wet weight in clams from different
bays at different sampling times (Tables 4.3, 4.4, and 4.5). In clams from the two bays
receiving dispersed oil (Bays 9 and 10), the mean concentration of tissue total free amino
acids dropped between the pre-spill and first post-spill samples and then rose again in the
second post-spill samples. The opposite trend was observed in clams from the bay
receiving oil alone (Bay 11), while tissue total free amino acid concentrations in clams
from the reference bay (Bay 7) remained relatively constant (range 15.37-17.65 @l/mg).
83
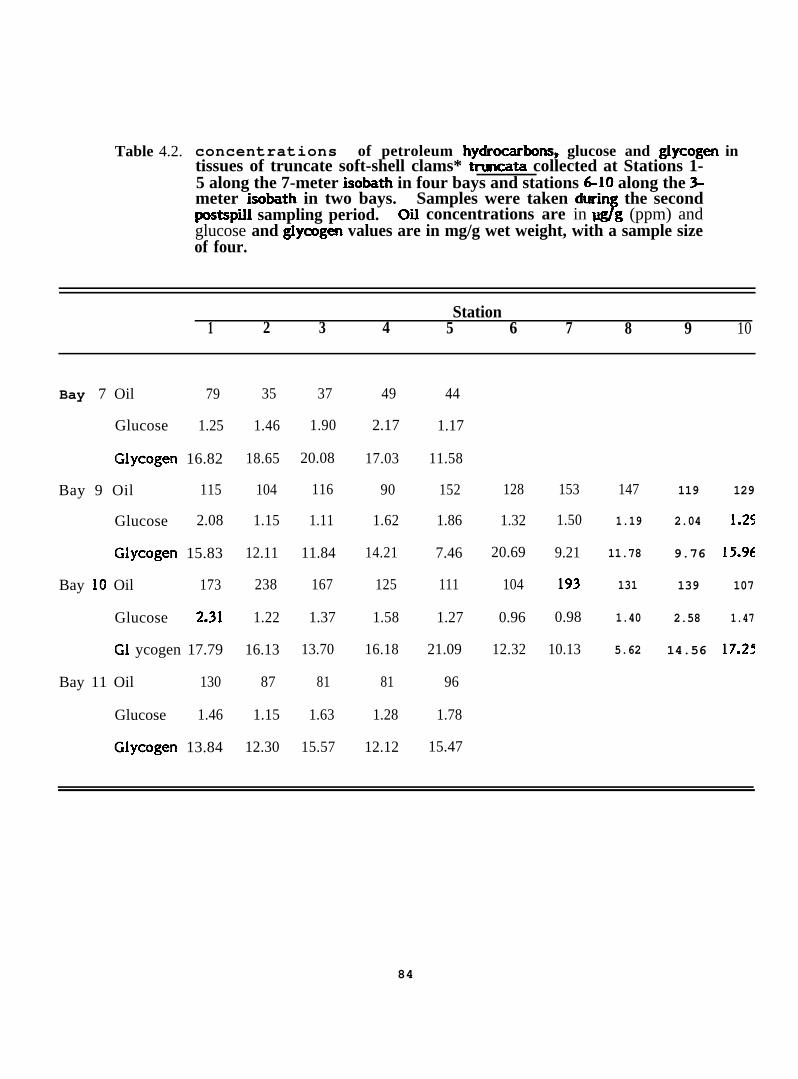
Table 4.2. concentrations of petroleum hydrmbons, glucose and glycogen intissues of truncate soft-shell clams* truncata collected at Stations 1-5 along the 7-meter isobath in four bays and stations G1O along the >meter isobath in two bays. Samples were taken durhg the secondpostspill sampling period. Od concentrations are in ~g (ppm) andglucose and glycogen values are in mg/g wet weight, with a sample sizeof four.
Station1 2 3 4 5 6 7 8 9 10
Bay 7 Oil 79
Glucose 1.25
Glycogen 16.82
Bay 9 Oil 115
Glucose 2.08
Glycogen 15.83
Bay 10 Oil 173
Glucose 2.31
G] ycogen 17.79
Bay 11 Oil 130
Glucose 1.46
Glycogen 13.84
35
1.46
18.65
104
1.15
12.11
238
1.22
16.13
87
1.15
12.30
37
1.90
20.08
116
1.11
11.84
167
1.37
13.70
81
1.63
15.57
49
2.17
17.03
90
1.62
14.21
125
1.58
16.18
81
1.28
12.12
44
1.17
11.58
152
1.86
7.46
111
1.27
21.09
96
1.78
15.47
128
1.32
20.69
104
0.96
12.32
153
1.50
9.21
193
0.98
10.13
147 119 129
1.19 2.04 1.25
11.78 9.76 15.9(
131 139 107
1.40 2.58 1.47
5.62 14.56 17.25
84
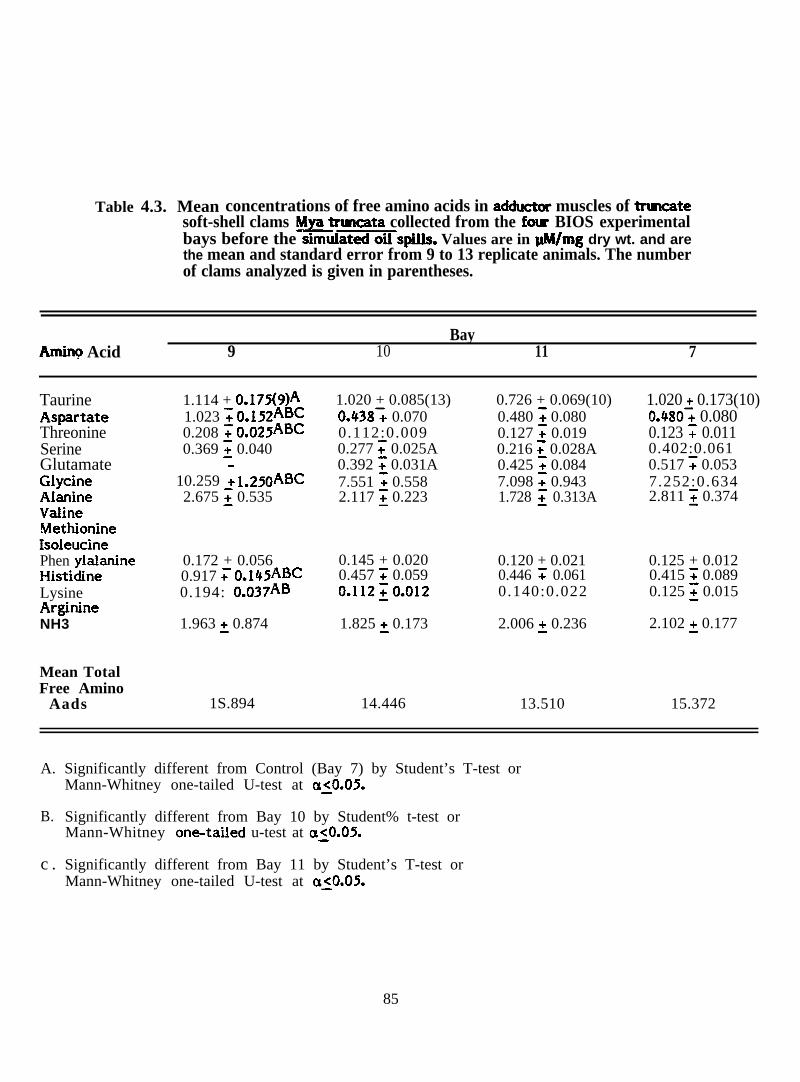
Table 4.3. Mean concentrations of free amino acids in adductor muscles of trmcatesoft-shell clams ~ tnmcata collected from the f- BIOS experimentalbays before the simd~spills. Values are in @#/mg dry wt. and arethe mean and standard error from 9 to 13 replicate animals. The numberof clams analyzed is given in parentheses.
_ AcidBay
9 10 11 7
TaurineAspartateThreonineSerineGlutamateGlycineAlanineVaiineMethionineIsoleucinePhen ylalanineHistidineLysineArginineNH3
Mean TotalFree Amino
Aads
1.114 + 0.175(9)A1.023 ~ 0.152ABC0.208 ~ 0.025ABC0.369 ~ 0.040
10.259 ; 1.250ABC2.675 ~ 0.535
0.172 + 0.0560.917 ; 0.145ABC0.194: 0.037AJ3
1.963 ~ 0.874
1S.894
1.020 + 0.085(13)0.438~ 0.0700.112:0.0090.277 ~ 0.025A0.392 ~ 0.031A7.551 ~ 0.5582.117 ~ 0.223
0.145 + 0.0200.457 T 0.059o.l12~o.o12
1.825 ~ 0.173
14.446
0.726 + 0.069(10)0.480 ~ 0.0800.127 ; 0.0190.216 ~ 0.028A0.425 ~ 0.0847.098 ; 0.9431.728 ~ 0.313A
0.120 + 0.0210.446 = 0.0610.140:0.022
2.006 ~ 0.236
13.510
1.020 + 0.173(10)0.480; 0.0800.123 ; 0.0110.402:0.0610.517 ; 0.0537.252:0.6342.811 ~ 0.374
0.125 + 0.0120.415 T 0.0890.125 ~ 0.015
2.102 ~ 0.177
15.372
A.
B.
c .
Significantly different from Control (Bay 7) by Student’s T-test orMann-Whitney one-tailed U-test at a~O.05.
Significantly different from Bay 10 by Student% t-test orMann-Whitney one-taiied u-test at ct~O.05.
Significantly different from Bay 11 by Student’s T-test orMann-Whitney one-tailed U-test at a~O.05.
85
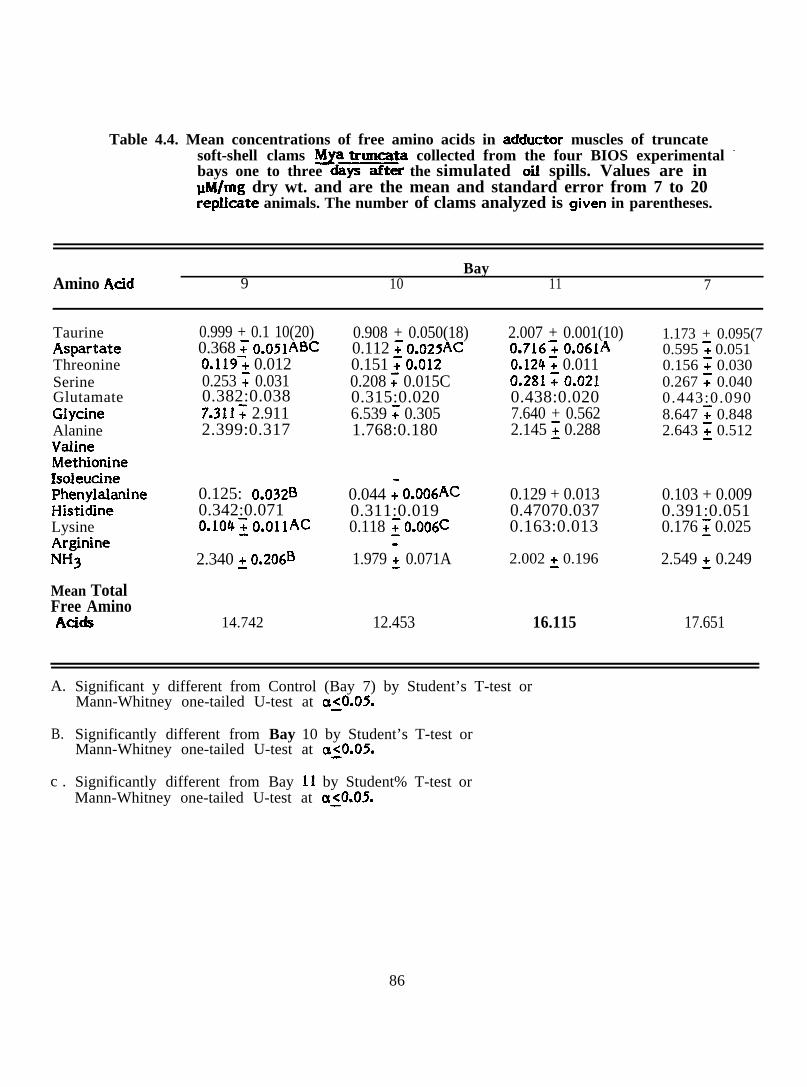
Table 4.4. Mean concentrations of free amino acids in acfductor muscles of truncatesoft-shell clams ~ truncata collected from the four BIOS experimental -
bays one to three ~~- the simulated oil spills. Values are in~M/mg dry wt. and are the mean and standard error from 7 to 20repkate animals. The number of clams analyzed is given in parentheses.
BayAmino Acid 9 10 11 7
TaurineAspartateThreonineSerineGlutamateGfycineAlanineVaiineMethionineIsoleucinePhenylalanineHistidineLysineArginine?aH3
Mean TotalFree AminoAci&
0.999 + 0.1 10(20)0.368 ; o.051Af3C0.119; 0.0120.253 ; 0.0310.382:0.0387.311 ; 2.9112.399:0.317
0.125: 0.032B0.342:0.071o.104; o.o11AC
2.340 ~ 0.206B
14.742
0.908 + 0.050(18)0.112 ; 0.025AC0.151 ;0.0120.208 ; 0.015C0.315:0.0206.539 ~ 0.3051.768:0.180
0.044 ; 0.006AC0.311:0.0190.118 ~ 0.006C
1.979 ; 0.071A
12.453
2.007 + 0.001(10)0.716: 0.061A0.124; 0.0110.281 ; 0.0210.438:0.0207.640 + 0.5622.145 ~ 0.288
0.129 + 0.0130.47070.0370.163:0.013
2.002 ~ 0.196
16.115
1.173 + 0.095(70.595 ; 0.0510.156 ~ 0.0300.267 ~ 0.0400.443:0.0908.647 ~ 0.8482.643 ~ 0.512
0.103 + 0.0090.391:0.0510.176 ~ 0.025
2.549 ~ 0.249
17.651
A.
B.
c .
Significant y different from Control (Bay 7) by Student’s T-test orMann-Whitney one-tailed U-test at a~O.05.
Significantly different from Bay 10 by Student’s T-test orMann-Whitney one-tailed U-test at a:O.05.
Significantly different from Bay 11 by Student% T-test orMann-Whitney one-tailed U-test at a~O.05.
86

Table 4.5. Mean concentrations of free amino acids in adductor muscles of trmcatesoft-shell clams M trmcata collected from the f- BIOS experimental
3bays 14 days after t ~ted oil spills. Values are in @l/mg dry wt.and are the mean and stadard error from 10 to 20 replicate animals.The number of clams analyzed is given in parentheses.
BayAmino Acid 9 10 11 7
TaurineAspartateThreonineSerineGlutamateGlycineAlanineValineMethionineIsoleucinePhen ylaknineHistidineLysineArginineNH3
Mean TotalFree AmhmAcids
1.021 + 0.011(20Y30.091: 0.012C0.249 ; 0.035B0.284 ;O.034B0.454~ 0.052B9.132: 1.070B2.130 ; 0.254ABCo.i2i: 0.0100.048 ; 0.005B0.065 ; 0.0130.072 ; 0.0200.365: 0.024BC0.182 ~ 0.022B0.396: 0.049B
1.707 :0.169B
16.317
3.924 + 0.550( 16)ACO. 106; 0.029C0.060 ; 0.018AC0.115; 0.0260.293 ; 0.028AC
12.912: 1.91oAC0.886 ; O. 120AC0.068: 0.024AC0.761:0.01 QAC0.052 ; 0.0190.053 ; 0.0110.163 ; 0.016AC0.087 ; 0.026AC2.616: 0.540AC1•154 ~ 0.099C
23.250
0.771 + 0.053(10)0.171: 0.013A0.157 ; 0.0180.21270.1090.403 ; 0.0326.946 ~ 0.4501.538 + 0.177A0.125:0.0180.04570.0100.086:0.0150.064:0.0170.282 ; 0.015Ao.157 F 0.0220.310:0.0261.738 ~0.141A
13.005
0.944 + 0.049(10)O.iol T 0.0100.266 ; 0.1090.213:0.0110.425 ; 0.0288.769 ; 0.3502.866 ; 0.2630.097:0.0080.03370.0040.010 ~ 0.0060.07070.0190.40170.0150.140 ; 0.0100.382 ; 0.0231.374:0.091
16.141
A.
B.
c .
Significant y cliff erent from Control (Bay 7) by Student’s T-test orMann-Whitney one-tailed U-test at a <0.05.
Significantly different from Bay 10 by Student’s T-test orMann-Whitney one-tailed U-test at a~O.05.
Significantly different from Bay 11 by Student’s T-test orMann-Whitney one-tailed U-test at a~O.05.
87
In clams collected immediately before the BIOS oil spills, concentrations of
several tissue free amino acids were significantly different in clams from the four bays
(Table 4.3). The mean concentration of 6 free amino acids was significantly different in
clams from the reference bay (Bay 7) and Bay 9, while concentrations of only two amino
acids in clams from Bays 10 and 11 were significantly cliff erent from those of clams from
the reference bay. Immediately after the spiIls, concentrations of 1-3 amino acids were
significantly different in clams from the reference bay and from the three bays receiving
dispersed or undispersed crude oil (Table 4.4). Concentrations of total and most individual
tissue free amino acids were Iower in clams from the most heavily contaminated bay (Bay
10) than in clams from the other two bays receiving oil and the reference bay. In clams
collected during the second post-spill sampling approximately 2 weeks after the spills,
there were many statistically significant differences in concentrations of individual tissue
free amino acids among clams from the four bays (Table 4.5). Values for clams from Bay
10 [the most heavily contaminated bay) varied most from the corresponding vaIues for
clams from the other three bays.
Two parameters which have been recommended as indices of sublethal stress
in marine invertebrates are the molar ratio of taurine to glycine and the sum of the
concentrations of threonine plus ‘“ serine. Stressed animals should have a higher
taurine/gIycine ratio and lower threonine plus serine concentration than unstressed
animals. The only oil-exposed group of clams with taurine/glycine ratio and threonine
plus serine concentration significantly different from that of clams from the reference
bay was that from the most heavily contaminated bay (Bay 10) collected during the
second post-spill sampling (Table 4.6). Taurine/gIycine ratio was elevated and threonine
plus serine concentration was depressed relative to reference animals.
Spearman rank correlation tests were performed on all biochemical
parameters measured for clams from the three sampling times and four experimental
bays. Parameters which showed a high (a< O.05) degree of interassociation, positive or
negative, are tabulated according to sampling time and inter-bay association in Table 4.7.
Clams from the second post-spill sampling had the largest number of associated pairs of
biochemical parameters (Table 4.8). One-hundred and five associated pairs were shared
by all four bays, indicating that in these samples, clams from the four bays were very
uniform in relative (though not necessarily absolute) values for the biochemical
88
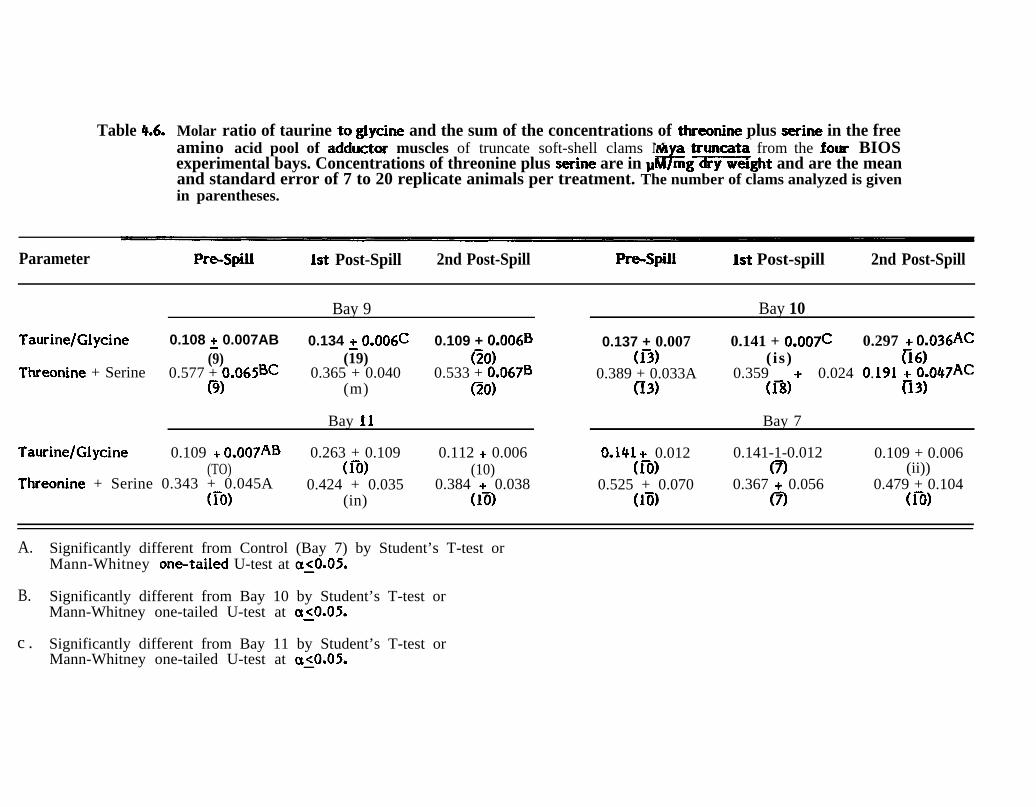
Table 4.6. Molar ratio of taurine to glycine and the sum of the concentrations of threonine plus serine in the freeamino acid pool of adductor muscles of truncate soft-shell clams M a truncata from the fom BIOS
&experimental bays. Concentrations of threonine plus serine are in v mgmght and are the meanand standard error of 7 to 20 replicate animals per treatment. The number of clams analyzed is givenin parentheses.
Parameter Pre-spill 1st Post-Spill 2nd Post-Spill Prd@ll Ist Post-spill 2nd Post-Spill
Bay 9 Bay 10
Taurine/G1ycine 0.108 ~ 0.007AB 0.134 ~ 0.006C 0.109 + 0.006B 0.137 + 0.007 0.141 + 0.007C 0.297 .+ 0.036AC(9) (19) (20) (B) (is)
Threonine + Serineo ~91 :~)047Ac
0.577 + 0.065BC 0.365 + 0.040 0.533 + 0.067B 0.389 + 0.033A(9)
0.359 -I- 0.024 .(m) (20) 03) (n) n3j
Bay 11 Bay 7
Taurine/Glycine 0.109 i- o.oo7f4B 0.263 + 0.109 0.112 + 0.006 0.141 + 0.012(TO)
0.141-1-0.012(m) (10)
0.109 + 0.006(m) m (ii))
Threonine + Serine 0.343 + 0.045A 0.424 + 0.035 0.384 + 0.038 0.525 + 0.070 0.367 + 0.056 0.479 + 0.104(io) (in) (16) (In) m (m)
A.
B.
c .
Significantly different from Control (Bay 7) by Student’s T-test orMann-Whitney onetailed U-test at a~O.05.
Significantly different from Bay 10 by Student’s T-test orMann-Whitney one-tailed U-test at a~O.05.
Significantly different from Bay 11 by Student’s T-test orMann-Whitney one-tailed U-test at a~O.05.
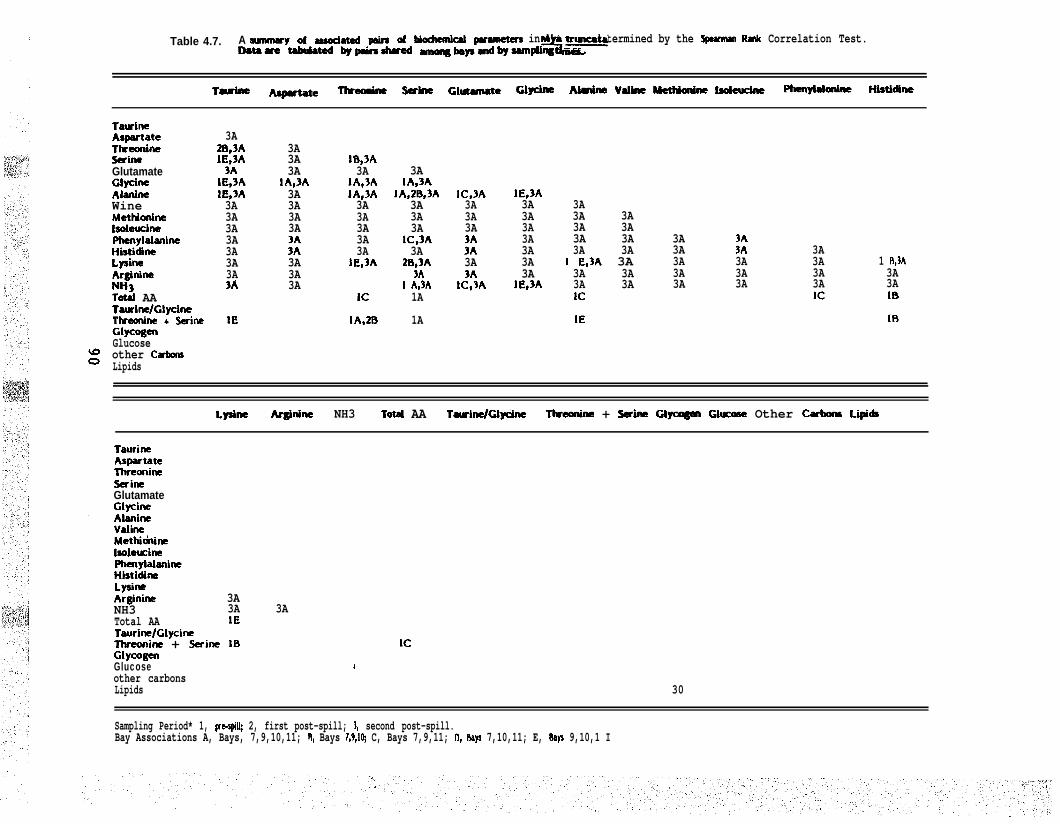
Table 4.7. A ~-y Of aaSai8ted pairs of bi~d fIW~ in M tnascata determined by the Spemswt R* Correlation Test.+—Dataare t8hufated bypairasftarad amangbaYsdh$=wfh? m=.
Tu~ ~te Threonina Serine Ghftamate Glycina Almina VaUne kthidne Isolaucina Phanylafonine Histidina
TawineAspartateTlueonineSerhteGlutamateGlycineAlanineWineMethionineIsokucinePhenylahnineHistidineLysineArgininaNli3Totaf AATaurindGlycineTlueonine + SarhwGlycogenGlucoseother CwlmnsLipids
3A2B,3AIE,3A
3A1E,3A1E,3A3A3A3A3A3A3A3A3A
lE
3A3A3A
1A,3A3A3A3A3A
E3A3A3A
1B,3A3A
1A,3AJA,3A3A3A3A3A3A
1E,3A
lC
1A,2B
3A1A,3A
lA,2~3A3A3A3A
1C,3A3A
2B,3A
1 :$A1A
1A
IC,3A 1E,3A3A 3A3A 3A3A 3A
3Ax 3A3A 3A
3Al~3A 1E,3A
3A3A 3A3A 3A3A 3A 3A3A 3A 3A ;:
1 E,3A 3A 3A 3A3A 3A 3A 3A3A 3A 3A 3AlC
lE
3A3A3A3AlC
1 B,3A3A3AIB
Lysine Arginhe NH3 Totaf AA Tawine/Glycina Tkeonb + Serine Glycqen Glumms Other C~ f.if&#s
TaurineAspartateThreonineSerineGlutamateGlycineAlanineValinaMethidnheIsoleucinePhenylalanineHktidireLysineArginine 3ANH3 3A 3ATotal AA IETaurine/G1ycineTtwonine + Serine lB lCGlycogenGlucoseother carbonsLipids 30
4
Sampling Period* 1, Prespill; 2, first post-spill; 3, second post-spill.Bay Associations A, Bays, 7,9,10,11; F), Bays 7,9,1% C, Bays 7,9,11; D, tkys 7,10,11; E, flays 9,10,1 I
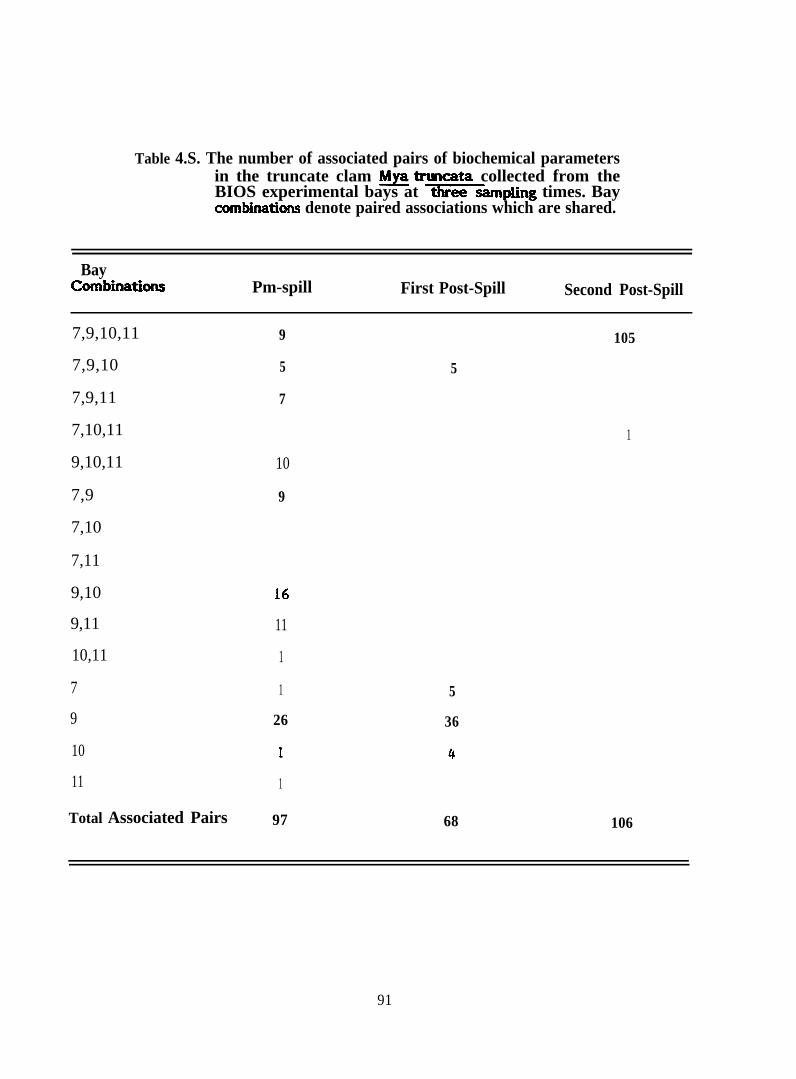
Table 4.S. The number of associated pairs of biochemical parametersin the truncate clam ~ tnmcata collected from theBIOS experimental bays at ~mpling times. Baycombiitions denote paired associations which are shared.
BayCombiitions Pm-spill First Post-Spill Second Post-Spill
7,9,10,11
7,9,10
7,9,11
7,10,11
9,10,11
7,9
7,10
7,11
9,10
9,11
10,11
7
9
10
11
Total Associated Pairs
9 105
5 5
7
1
10
9
11
1
1 5
26 36
1
97 68 106
91
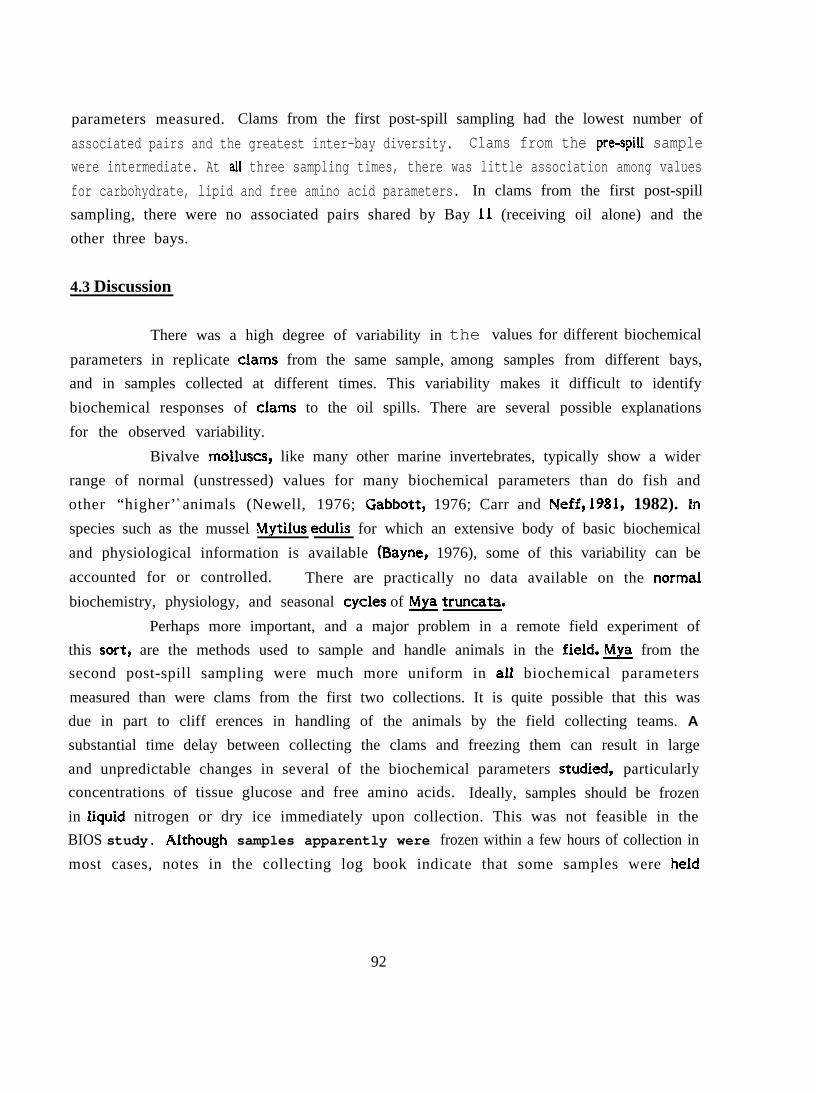
parameters measured. Clams from the first post-spill sampling had the lowest number of
associated pairs and the greatest inter-bay diversity. Clams from the pre-spill sample
were intermediate. At all three sampling times, there was little association among values
for carbohydrate, lipid and free amino acid parameters. In clams from the first post-spill
sampling, there were no associated pairs shared by Bay 11 (receiving oil alone) and the
other three bays.
4.3 Discussion
There was a high degree of variability in
parameters in replicate clams from the same sample,
the values for different biochemical
among samples from different bays,
and in samples collected at different times. This variability makes it difficult to identify
biochemical responses of clams to the oil spills. There are several possible explanations
for the observed variability.
Bivalve molluscs, like many other marine invertebrates, typically show a wider
range of normal (unstressed) values for many biochemical parameters than do fish and
other “higher’ s animals (Newell, 1976; Gabbott, 1976; Carr and Neff, 1981, 1982). hspecies such as the mussel Mytilus edulis for which an extensive body of basic biochemical
and physiological information is available (Bayne, 1976), some of this variability can be
accounted for or controlled. There are practically no data available on the normaI
biochemistry, physiology, and seasonal cycles of ~ truncata.
Perhaps more important, and a major problem in a remote field experiment of
this sort$ are the methods used to sample and handle animals in the field. ~ from the
second post-spill sampling were much more uniform in alI biochemical parameters
measured than were clams from the first two collections. It is quite possible that this was
due in part to cliff erences in handling of the animals by the field collecting teams. A
substantial time delay between collecting the clams and freezing them can result in large
and unpredictable changes in several of the biochemical parameters studied~ particularly
concentrations of tissue glucose and free amino acids. Ideally, samples should be frozen
in liquid nitrogen or dry ice immediately upon collection. This was not feasible in the
BIOS study. A~though samples apparently were frozen within a few hours of collection in
most cases, notes in the collecting log book indicate that some samples were he~d
92
overnight or even for several days in a refrigerator before f-fi& ~~ ~~~t variable .
set of samples was that from the first post-spill collection. Examinati(In of the field log
book indicated that these samples were collected over a 10-day period (from Bay 9 on
8/28, 29 and 31/81 ;from Bay 100n8/29-3Q/81; from Bay il on 8/21/81; and from Bay 7on 8/31/81). The simulated spill of oil alone in Bay 11 was on 8/19/81 and the simulated
spill of dispersed oil in Bay 9 was on 8127/81. Thus, clams from the bay receiving oil
alone (Bay 11) were sampled two days after the spill, while those from bays receiving
dispersed oil were sampled up to four days after the spill. Thus, it is difficult to compare
acute responses of clams to the different treatments. Collection of the pre-spill and
second post-spill samples also took place over several days, but the interpretive problem
in these cases is less severe. It akm shouid be pointed out that sampIes for hydrocarbon
analysis were not always taken at the same time as samples for biochemical analysis at a
given bay and station.
Despite these problems, some conclusions can be drawn f rorn the results of
these biochemical studies on & truncata. Based on results of the biochemiczd amlyses,
truncate soft-shell clams were not severely stressed by either dispersed or undispersed oil
at the contaminant levels attained in the BIOS experiment. Although all treatment groups
were exposed to and subsequent y accumulated some petroleum, and therefore there was
no true control or reference group of animals, clams from Bay 7 were the least heavily
contaminated. Therefore, they can be used$ in lieu of a true reference. Clams from Bay
11 (undispersed crude oil) differed the most from clams from Bay 7, particularly in the
second post-spill sample. Clams from Bay 10 [dispersed crude oil) became more heavily
contaminated with petroleum hydrocarbons than clams f rum the other di~persed oil bay
(Bay 9) and showed greater differences than the latter in sewers} bkchemical para~=er~,.
as compared to clams from Bayy 7. These differences were most matkd iiT the- first po&-
spill survey. Thus, we ~ri cafielucfe that chemically dispersed oil may cause mor@ $@”t#e
acute effects than undisp%ed @ in benthic infaunal molluscs, but longer-term impacts
of undispersed crude oil may be more severe than those of chemically dispersed oil. This
is undoubtedly related to the observations documented in t.hw Section 2 of this report that
petroleum. contamination ofi. fMteM&eding molluscs was g~~t~~ in the bays receiving
dispersed oil and rwzmhed a peati’ ihl tli& fiifiist post-spill sam@&l, dbsm?ating in the second
post-spill sa~”lks.- On the other hand’;, ccnttamination of clams i~~ t&J9 bay receiving oil
93
alone was more gradual and reached a peak in the second post-spill sample. Undispersed
crude oil may be more persistent than chemically dispersed oil in bottom sediments and so
lead to more serious long-term effects. We have obtained similar results in recent
mesocosm experiments with chemically dispersed oil (Neff, 1982). Benthic animals in
tanks receiving chemically dispersed crude oil experienced higher short-term mortality
and sublethal effects than animals receiving oil alone. However, after a month, sublethal
physiological and biochemical responses were more marked in animals from the
undispersed oil treatment groups than the dispersed oil treatment groups.
In this investigation, several biochemical parameters were evaluated as indices
of pollutant stress in truncate soft-shell clams exposed to dispersed and non-dispersed
crude oil in the BIOS experiment. The parameters used were chosen based on their proven
utility for this purpose, and because they could be measured in frozen samples, an
important consideration considering the remoteness of the sampling site and lack of
facilities to make measurements on-site on fresh tissues. Values for some of the
biochemical parameters were significantly different in the four populations of &
samples. Tissue free amino acid concentrations and ratios showed the most changes.
Tissue free amino acids also were the most useful index of pollutant stress in oysters
Crassostrea gigas from bays contaminated with crude oil from the Amoco Cadiz crude oil——spill (Nef f and Haensly, 1982). It is possible that other parameters would have exhibited
more significant differences than they did if there had been better control of the sampling
and sample handling in the field.
4.3.1. Weight-Length Relationships of Bivalves. Cross and Thompson (1982)
and cross et al. (1983) have performed analyses of dry weight-shell length relationships of
four species of bivalve molluscs from the four bays. Samples of up to 50 individuals each
of ~ truncata, Macoma calcarea, Astarte borealis and Serripes g roenlandicus were—— — .collected along the middle transect at the 7-meter depth in each bay on five sampling
occasions (pre-spill, September, 1980 and August, 1981; post-spill, September) 1981P
August 1982, September, 1982).
The investigators found evidence that weight-length relationships in Serripes
groenlandicus arid Macoma calcarea were affected by the experimental oil spills. The.—other species were unaffected. Larger specimens of ~. g roenlandicus from Bay 7 showed a
progressive decrease in dry weight of soft tissues adjusted to a standard shell length from
94
the second pre-spill sample (immediate pre-spill sample in this investigation) to the third -
post-spill sample (September, 1982). No progressive changes in adjusted dry weights or
weight-length regressions were observed in ~. groenlandicus from the other bays. A
decrease in weight per unit shell length or adjusted to a standard shell length indicates a
decrease in the condition or nutritional status of the mollusc. Although Bay 7 was
considered a reference bay, it did receive 50-100 ppb of dispersed oil in the first few days
after the discharge (Green et al., 1982). ~. groenlandicus from the 7-meter depth in Bay 7
accumulated hydrocarbons to higher levels immediately after the spill than did the same
species from the 7-meter depth in the other bays (See Section 2 of this report). ~.
groenlandicus from Bays 9 and 10, which received much higher levels of dispersed oil,
probably were narcotized and/or stopped filtering, and therefore became less
contaminated than animals from Bay 7. ~. g roenIandicus differed from the other filter-
feeding mollusc studied, & truncata, in that it preferentially retained in its tissues a
high molecular weight saturated hydrocarbon assemblage as well as the toxic highly
alkylated naphthalenes, phenanthrenes, and dibenzothiophenes. These observations may
partially explain the apparent impact of oil on ~. groenlandicus from Bay 7.
Whereas ~. groenlandicus is a filter-feeder and accumulates petroleum
hydrocarbons primarily from the water, hlacoma calcarea is a deposit-feeder and
accumulates petroleum hydrocarbons primarily from contaminated sediments. Thus, as
reported in the bioaccumulation section of this report, & calcarea from Bay 7 did not
accumulate significant body burdens of hydrocarbons because very littIe of the water-
borne hydrocarbons entering the bay were deposited in the sediments. In the other three
bays, substantial amounts of oil were deposited in bottom sediments and ~. calcarea
became the most heavily contaminated. Hydrocarbon body burdens in the deposit-feeders
increased between the first and second post-spill samplings. Cross and Thompson (1982)
and Cross et aL (1983) reported that ~. calcarea from Bay 7 underwent a seasonal cycle
of increasing length-adjusted tissue dry weight between August and September in both
1981 and 1982. This probably represented a natural cycle of fattening and gonadal
maturation in the animals. However, ~. calcarea f~om the other bays did not show
evidence of this cycle, and in clams from Bay 9, there actually was ZF decrease in length-
adjusted tissue dry weight between August, 1981 (pre-spill) and September, 1981 (second
post-spill sampling). These results suggest that petroleum contamination of sediments
95
interfered with feeding? gonadal development! and bioenergetics of M. calcarea. Similar.—responses have been reported in bivalve molluscs impacted by the Chedabucto Bay, Nova
Scotia oil spill (Gilfillan and Vandermeulin, 1978) and the Amoco Cadiz oil spill in— .Brittany, France (Neff and Haensly, 1982). interestingly, M. calcarea from Bay 9 did not——have an elevated incidence of histopathological lesions compared to clams from other
bays. ~. calcarea from Bay 11 (receiving undispersed crude oil) did have an increased
incidence of parasitism and hemolytic infiltration, and one specimen had a blood
neoplasm. One year after the spill, these clams had a high incidence of vacuolization of
the digestive tubule epitheliums, a pathological condition also reported in bivalve molhscs
transplanted to a site heavily contaminated by the Amoco Cadiz oil spill (Wolfe et al.,——1981).
96

5. LITERATURE CITED
Anderson, 3. W., R.G. Riley, %L. Kiesser, B.L. Thomas and G.W. Fellin~ham. 1983.
Augenfeld,
Barry, M,
Natural weathering of oil in marine sediments: tissue conta-mination andgrowth of the littleneck clam, Protothaca staminea. Can. 3. Fish. Aquat. Sci.~70-77.
J. M., J.W. Anderson, D.L. Woodruff, and 3.L. Webster. 1980. Effects ofPrudhoe Bay crude oil-contaminated sediments on Protothaca staminea(Mollusca: Pelecypodak hydrocarbon content, condition index, free aminoacid level. Mar. Environ. Res. ~ 135-143.
and P.P. Yevich. 1975. An ecological, chemical and histopathologicalevaluation of an oil spill site. Part 111. Histopathological studies. Mar. Pollut.Ml. @171-173.
Bayne, B.L. (cd.). 1976. Marine Mussels: Their Ecology and Physiology. CambridgeUniversity Press, Cambridge England.
Bayne, B.L., M.N. Moore, 3. Widdows, D.IZ. Livingstone, and P. Salkeld. 1979.Measurement of the responses of individuals to environmental stress andpollution: studies with bivalve molluscs. Phil. Trans. Roy. Sot. London B286:563-581.
Bayne, B.L., 3. Widdows, M.N. Moore, P. Salkeld, C.M. Worrall and P. Donkin. 1982.Some ecological consequences of the physiological and biochemical effects ofpetroleum compounds on marine .molluscs. Phil. Trans. Roy. Sot. Lend. B.297:219-239.
BlackaH, P.3. 1980. BIOS Project-opportunity knocks but once. Spill Technol. Newsletter~ 102.
Boehm, P.D. 1982. Baffin Island Oil Spill Project - Chemistry Componen& Report on1981 Oil Spill Experiment. Vol. 2, Summary of Analytical Biogeochemistry,Final Report, Contract No. 05581-0086. Environment Canada, EnvironmentalProtection Service, Edmonton, Alberta. 334 pp.
Boehm, P. D., 3.E. Barak, D.L. Fiest, and A. Elskus. 1982 . A chemical investigation ofthe transport and fate of petroleum hydrocarbons in littoral and benthicenvironments: the Tsesis oil spill. Mar. Environ. Res. q 157-188.
Boehm, P.D, and 3.G. Quinn. 1977. The persistence of chronically accumulatedhydrocarbons in the hard shell clam Mercenaria mercenaria. Mar. Biol.~227-233.
Boehm, P.D., A.D. Wait, D.L. Fiest, D. Pilson. 1982 . Chemical assessment -hydrocarbonanalysis, pp. 23-153, in IXTOC Oil Spill assessment, Final Report BLMContract No. AA851-CTO-71 Bureau of Land Management, New Orleans,Louisiana.
97

Brown, R. S., C.W. Brown, and S.B. Saila. 1979. Hydrocarbon pollution and the prevalenceof neoplasm in feral New England soft-shell clam & arenaria, Pages 41-51.In: F.M. Peters (cd.), AnimaIs as Models of Environm~ollution. Nat.Acad. Sci., Washington, D.C.
Capuzzo, 3.M. 1981. Predicting pollution effects in the marine environment. Oceanus24:25-33.—
Carr, R.S. and J.M. Neff. 1981. Biochemical indices of stress in the sandworm Neanthesvirens (Sars). 1. Responses to pentachlorophenol. Aquat. Toxicol. &313-327.
Carr, R.S. and J.M. Nef f. 1982. Biochemical indices of stress in the sandworm Neanthesvirens (Sam). II. Sublethal responses to cadmium. Aquat. Toxicol. ~ 319-333.
Carr, R.S. and J.M. Neff. 1983. A quantitative, semi-automated enzymatic assay fortissue glycogen. Comp. Biochem. Physiol. (in press).
Couch, 3.A. and J.T. Windstead. 1979. Concurrent neoplastic and protistan disorders inthe american oyster (Crassostrea virginica). Haliotis. & 249-253.
Cross, W.E. and D.H. Thomson. 1982. Effects of oil and dispersed oil on near shoremacrobenthos at Cape Hatt, Northern Baffin Island. II. Results of 1980 and1981 pre- and post-spill studies. BIOS Working Report 81-3. Baffin Island OilSpill Project, Environmental Protection Service, Environment Canada,Edmonton, Alberta, Canada. 105 pp.
Cross, W. E., D.H. Thomson and A.R. Maltby. 1983. Effects of oil and dispersed oil onnearshore macrobenthos at Cape Hatt, Northern Baffin Island. 111. Results of1980, 1981, and 1982 pre- and post-spill studies. BIOS Working Report 82-3.Baffin Island Oil Spill Project, Environmental Protection Service, EnvironmentCanada, Edmonton, Alberta, Canada. 135 pp.
Dow, R J. 1975. Reduced growth and survival of clams transplanted to an oil spill site.Mar. Pollut. Bull. ~:124-125.
Elmgren, R., S. Hansson, U. Larsson, B. Sundelin and P.D. Boehm. 1983. The “Tresis” oil
Farley, A.
spill: acute and long-term impact on the bent hos. Mar. BioL 7A 51-65.—
1977. Neoplasms in est uarine mollusks and approaches to ascertain causes.Pages 225-232 In: H.F. Kraybill, C .3. Dawe, J.C. Harshbarger, and R.G.Tardiff (eds.), Aquatic Pollutants and Biological Effects with Emphasis onNeoplasia. Ann. N.Y. Acad. Sci.., Vol. 298. New York.
Gabbott, P.A. 1976. Energy metabolism. Pages 293-356 In: Marine Mussels: TheirEcology and Physiology, ed. by B.L. Bayne. Cambridge University Press,Cambridge, England.
Gardner, G.R., P.P. Yevich, and P.F. Rogerson. 1975. Morphological anomalies in adultoyster, scallop and Atlantic silversides exposed to waste motor oil. Proc. 1975Conference on Prevention and Control of Oil Spills. American PetroleumInstitute, Washington, D.C. 473-477.
98
Gearing, P. J., 3.N. Gearing, R.3. Pruell, T.L. Wade and 3.G. Quinn. 1980. Partitioning ofNo. 2 fuel oil in controlled estuarine ecosystems. Sediments and suspended “particulate matter. Environ. Sci. Technol. ~1129-1136.
Gilfillan, E.S., D. Mayo, S. Hanson, D. Donovan, and L.C. Jiang. 1976. Reduction incarbon flux in ~ arenaria caused by a spill of No. 6 fuel oil. Mar. Biol.~.115-123.
Gilfillan, E.S. and 3.H. Vandermuelen. 1978. Alterations in growth and physiology ofsoft-shell clams, N& arenaria, chronically oiled with Bunker C fromChedabucto Bay, Nova Scotia, 1970-76. J. Fish. Res. Bd. Canada ~630-~36.
Green, D.R., B. Humphrey, B. Fowler. 1982. Baff in Island oil spill project; Chemistrycomponent, Report on the 1981 oil spill experiments, Vol. 1, Summary of fieldwork. BIOS Working Report. Baffin Island Oil Spill Project, EnvironmentalProtection Service, Environment Canada, Edmonton, Alberta, Canada. 111 pp.
Hodgins, H.O., B.B. McCain, and 3.W. Hawkes. 1977. Marine fish and invertebratediseases, host disease resistance, and pathological effects of petroleum. Pages95-173 In: D.C. Malins (cd.), Effects of Petroleum on Arctic and SubarcticMarine Environments and Organisms. Vol. 11. Biological Effects. AcademicPress, New York.
Holland, D.L. and P.A. Gabbott. 1971. A micro-analytical scheme for the determinationof protein, carbohydrate, lipid and RNA levels in marine invertebrate larvae.J. Mar. Biol. Ass. U.K. 51:659-668.—
Jeffries, H.P. 1972. A stress syndrome in the hard clam, Mercenaria mercenaria. J.Invert. Pathol. 20:242-251.—
Keck, R .T., R.C. Heess, 3. W ehmiller and D. Maurer. 1978. Sublethal effects of the
Lee, R.F.
Lee, R.F.
water-soluble fraction of Nigerian crude oil on the juvenile hard clams,Mercenaria mercenaria (Linne). Environ. Pollut. 15:109-119.—
1977. Accumulation and turnover of petroleum hydrocarbons in marineorganisms. Pages 60-70 In: D.A. Wolf e (cd.), Fate and Effects of PetroleumHydrocarbons in Marine Organisms and Ecosystems. Pergamon Press, NewYork.
1981. Mixed function oxygenates (MFO) in marine invertebrates. Mar. Biol.--Lett. ~ 87-105.
Lowe, D.M. and M.N. Moore. 1979. The cytology and occurrence of granulocytomas in
Mahoney,
mussels. Mar. Poll. Bull. 10:137-141. -
—
B.M .S. and G.S. Noyes. 1982. Effects of petroleum on f ceding and mortality ofthe ameiican oyster. Arch. Environm. Contain. Toxicol.~527-531.
99
!Malins, D.C. 1982. Alterations in the cellular and subrellular structure of marine teleostsand invertebrates exposed to petroleum in the laboratory and field: a criticalreview. Can. 3. Fish. Aquat. Sci. ~877-889.
Mix, M.C. 1982. Polynuclear aromatic hydrocarbons and cellular proliferative disordersin bivalve molluscs from Oregon estuaries. EPA Report, EPA-600/S4-82-026.
Neff, 3.M. 1979. Polycyclic Aromatic Hydrocarbons in the Aquatic Environment:Sources, Fates and Biological Effects. Applied Science Publishers, London.266 pp.
Nef f, J.M. 1982. Use of Large-Scale Flow-Through Exposure Systems to Study Effects ofDispersed Oil on Georges Bank Benthic Animals. Final Report to ExxonProduction Research Company, Houston, Texas.
NeffJ 3.M. and 3.W. Anderson. 1981. Response of Marine Animals to Petroleum andSpecific Petroleum Hydrocarbons. Applied Science Publishers, Barking, Essex,England.
Neff, J. M., J.W. Anderson, B.A. Cox, R.B. Laughlin, Jr., S.S. Rossi, and H.E. Tatem.1976 . Effects of petroleum on survival, respiration and growth of marineanimals. Pages 515-539 In: Sources, Effects and Sinks of Hydrocarbons in theAquatic Environment. American Institute of Biological Sciences. Washington,D.C.
Neff. J. M.. B.A. Cox. D. C)ixit and J. W. Anderson. 1976 . Accumulation and release of..— — ,—–.
Neff, 3.M.
petroIeum-derived aromatic hydrocarbons by four species of marine animals.Mar. BioL >:279-289.
and W.E. Haensly. 1982. Long-term impact of the AMOCO CADIZ crude oilspill on oysters Crassostrea gigas and plaice Pleuronectes platessa from Aber13enoit and Aber Wrac’h, Brittany, France. L Oyster histopathology. 11.Petroleum contamination” and biochemical indices of stress in oysters andplaice. Pages 269-328 In: Ecological study of the AMOCO CADIZ Oil Spill.NOAA/CNEXO Joint Scientific Commission, Boulder, CO.
Newell, R.C. (cd.). 1976. Adaptation to Environment. Butterworths, London. 539 pp.
Norstrom,
Roesijadi,
R.J. and F.R. Engelhardt. 1982. Baffin Island oil spill project. Report on the1981 oil spill experiment - Chemistry component (Part B) - Petroleumhydrocarbons in two benthic invertebrates, the urchin Strongylocentrotusdroebachiensis and the polychaete Pectinaria granulosa. B1OS Working Report.Baffin Island Oil SDill Project, Environmental Protection Service, EnvironmentCanada, Edmonto~, Alber~a, Canada. 82 pp.
G. and 3.W. Anderson. 1979. Condition index and free amino acid content of.Macoma inquinata exposed to oil-contaminated marine sediments. Pages 69-~W.B. Vernberg$ A. Calabrese, F.P. Thurberg, and F.J. Vernberg (eds.),.Marine Pollution: Functional Responses. Academic Press, New York.
100
Roesijadi, G., 3.W. Anderson and 3.W. Blaylock. 197S. Uptake of hydrocarbons frommarine sediments contaminated with Prudhoe Bay crude oih Influence offeeding type of test species and availabili ty of polycyclic aromat ichydrocarbons. J. Fish. Res. !3d. Can. ~608-614.
Rosenthal, H. and D.F. Alderdice. 1976. Sublethal effects of environmental stressors,natural and pollutional, on marine fish eggs and larvae. 3. Fish. Res. !3d.Canada ~2047-2065.
Roubal, W.T. 1974. Spin-labeling of living tissue - a method of investigating pollutant-host interaction. Page 367-379 In: F.J. Vernberg and W.B. Vernberg (eds.),Pollution and Physiology of Marine Organisms. Academic Press, New York. -
Roubal, W.T. and T.K. Collier. 1975. Spin-labeling techniques for studying mode ofaction of petroleum hydrocarbons on marine organisms. Fish. Bull. ~.299-305.
Sindermann, C.J. 1982. Implications of oil pollution in production of disease in marineorganisms. Phil. Trans. Roy Sot. Lend. B. 29fi385-399.
Southward, A.J. and E.C. Southward. 1978. Recolonization of rocky shores in Cornwallafter use of toxic dispersants to clean up the Torrey Canyon spilL J. Fish.Res. Bd. Canada 35:682-706.—
Sprague, J. B., 3.H. Vandermeulen and P.G. Wells (eds.). 1982. Oil and dispersants inCanadian seas - research appraisal and recommendations. EnvironmentalEmergency Branch, Environmental Impact Control t)irectorate, EnvironmentalProtection Service, Environment Canada, Ottawa.
Stainken, DAL 1976. A descriptive evaluation of the effects of No. 2 fuel oil on thetissues of the soft shell clam, & arenaria L. BuIL Environ. Contain. Toxicol.&730-738.
Stekoll, h4.S., L.E. Clement and !3.G. Shaw. 1980. Sublethal effects of chronic oilexposure on the intertidal clam Macoma balthica. Mar. Biol. =51-60.
Vandermuelen, 3.H. and W.R. Penrose. 1978. Absence of aryl hydrocarbon hydroxylase(AHH) in three marine bivalves. J. Fish. Res. Bd. Canada =.643-647.
Warner, J.S. 1976. Determination of aliphatic and aromatic hydrocarbons in marineorganisms. .Anal. Chem. 48:578-583.—
Widdows, J., T. Bakke, B.L. Bayne, P. Dankin, D.R. Livingstone, D.M. Lowe, M.N. Moore,S.V. Evans, and S.L. Moore. 1982. Responses of Mytilus edulis on exposure tothe water-accommodated fraction of North Sea oil. ~ Biol. 67 g 15-31.—
Wolfe, D. A., R.C. Clark, lr., C.A. Foster, 3.W. Hawkes and W.D. ‘dcCleod, 3r. 1981.Hydrocarbon accumulation and histopathology in bivalve molluscs transplantedto the Baie de $torlaix and the Rade de Brest. Pages 599-616 @ AmocoCadiz. Consequences d’une pollution accidentelle par les hydrocarbures.Fates and Effects of the Oil SpiI1. Centre National pour lrExploitation desOceans, Paris, France.
Yevich, P.P. a n d C.A. Barszcz. 1977. Neoplasia in soft-shell clams (Mya arenaria)collected from oil-impacted sties. Pages 409-426. In: H.F. Kray-. “Dawe, J.C. Harshbarger, and R.G. Tardiff (eds.), Aquatic Pollutants andBiologic Effects with Emphasis on Neoplasia. Ann. N.Y. Acad. Sci. vol. 298.New York.
101
APPENDIX 1:
PANH COMPOUNDS IN OIL
103
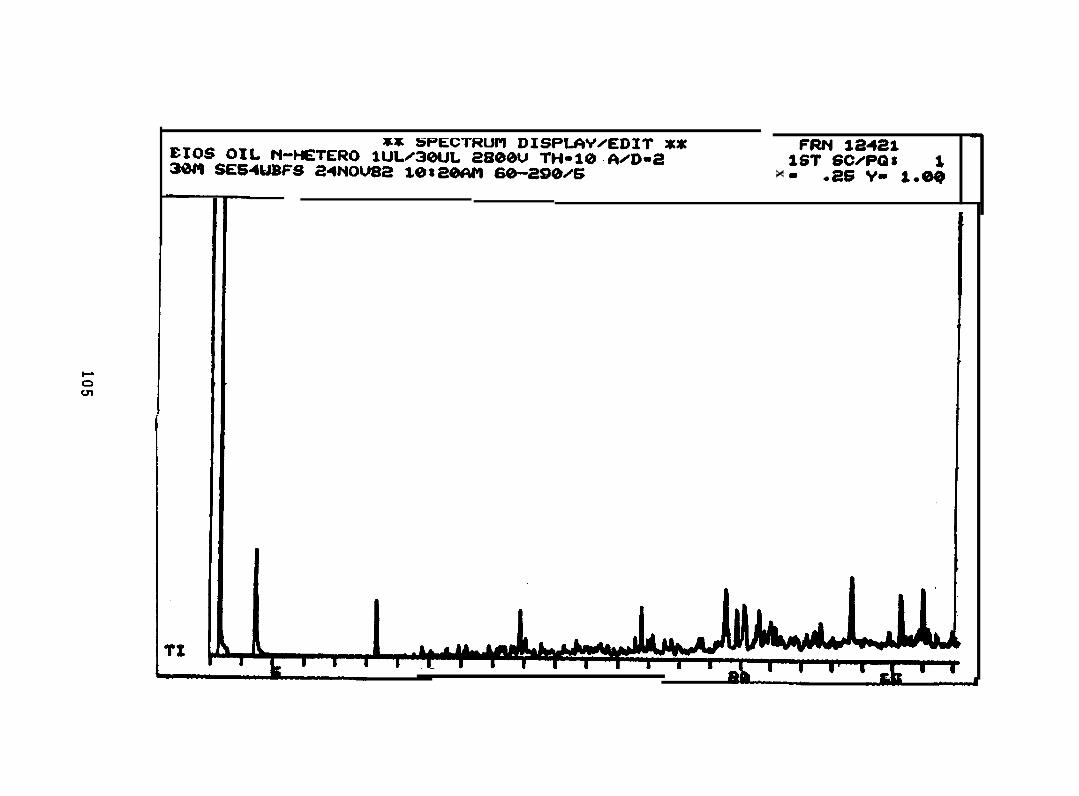
x
I
105
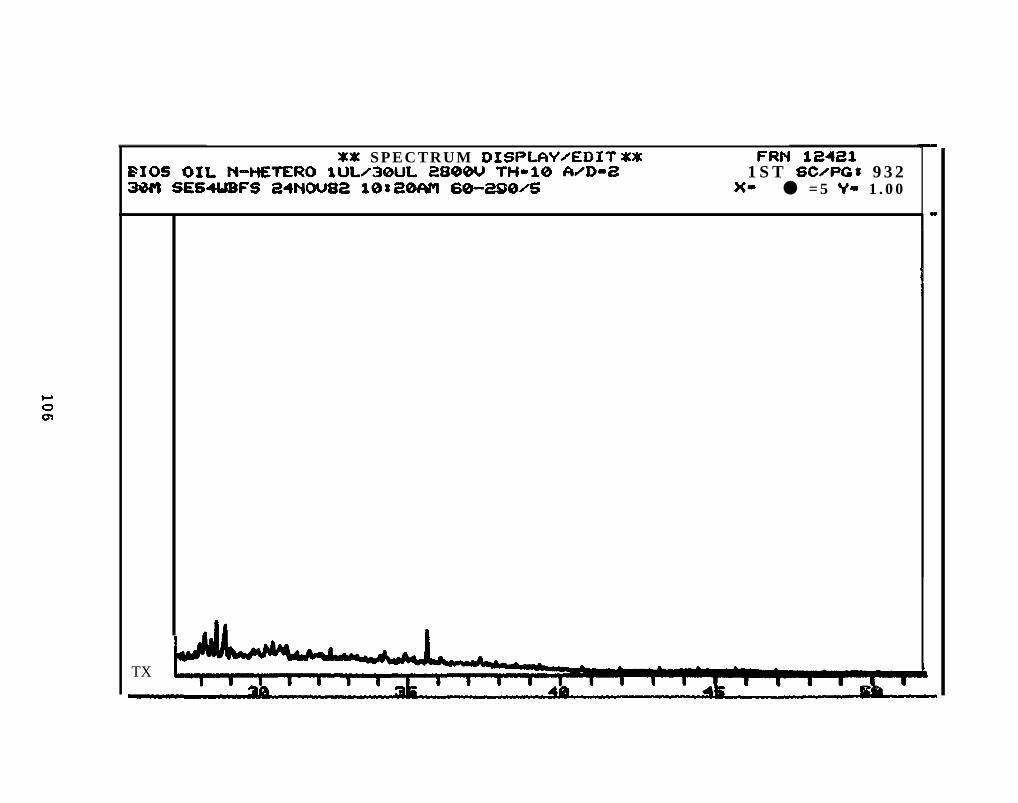
XX SPECTRUM DISPLAVZEDIT XX FRN 12421BIOS OIL N-HETERO llJL/3WJL 2800U TH-10 #WD-Z 1 S T SCHPGS 9 3 2= SES449FS MNOU82 10xW)WO’I 60-2tJ0HS )(. ● = 5 v- 1 . 0 0
I
TX

7
s% SPECTRUM DISPLW~EDIT X% Ff?ti 1Z421FIOS O I L N-HETERO lUt/3@JL iWMMW TH-10 A~D-= 1 S T SC/PQS 4 6 330fl SES4JBFS 24HOU82 14):20M 60-290~S X. ● s0 v- 1.00 I
I
+-. C5 quinolines
99.2 P
C4quinolines
h
C3 quinolines
71*Zm

+om
XX SPECTRUtl DISPLfbY/EDIT XX FRti 1 2 4 2 1~It)S OXL N+-iETERO lULZ~@iJL 2E300U THDIO AzD-~ 1 S T SCZPGS S9ii!3W’I SES41JBFS 24NOU62 10$~WUl 60-29@M
C6 quinolines
..-.. ”.“”,”.e@o,,, Mm-* OoO*,* **.-.,0*-
TI
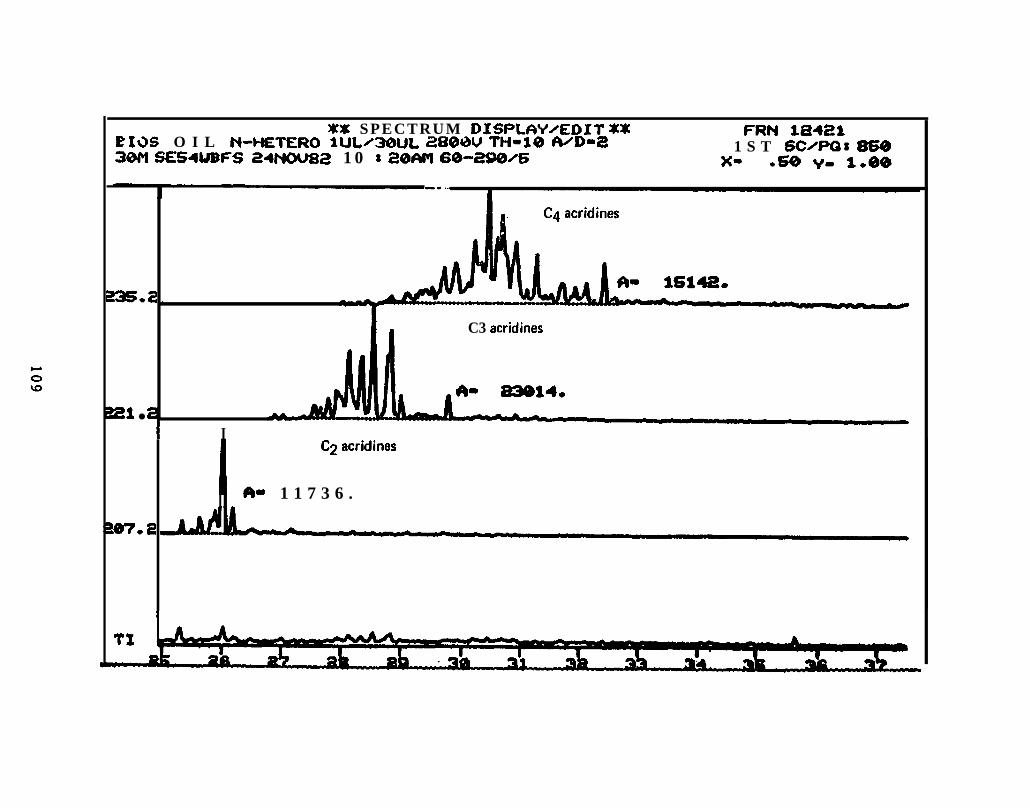
Xx SPECTRUM DISPUWZEDIT XX FRN la42tEIOS O I L N-HETERO iUL~3QN.JL 280W TH-10 -D-?! 1 S T Sc/ms 86e3@l SE54UBFS ~4NOU82 1 0 s Z@$M 60-a90/6 x. .S0 V“ 1.00
95*2 . -
El ●
I
i C3 acridines
C2 acridines
*- 1 1 7 3 6 .
e7. e
T1
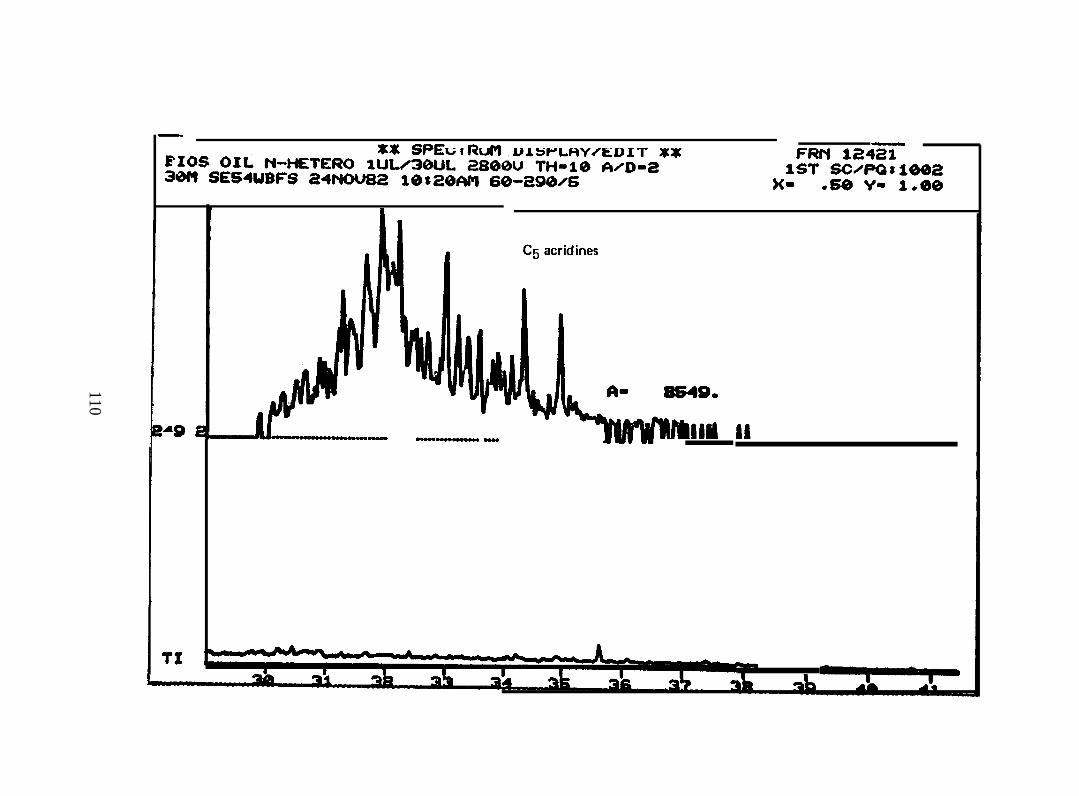
4I
110
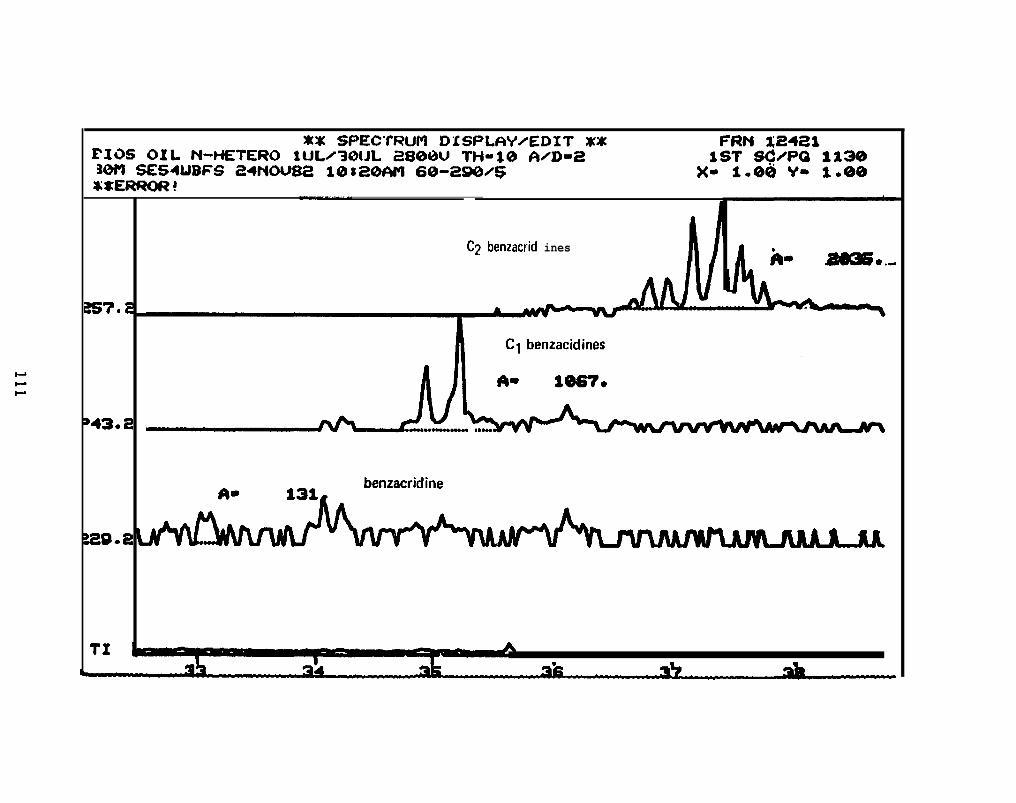
C? benzacrid ines
-..--, *99U
benzacridine*O 131
a=
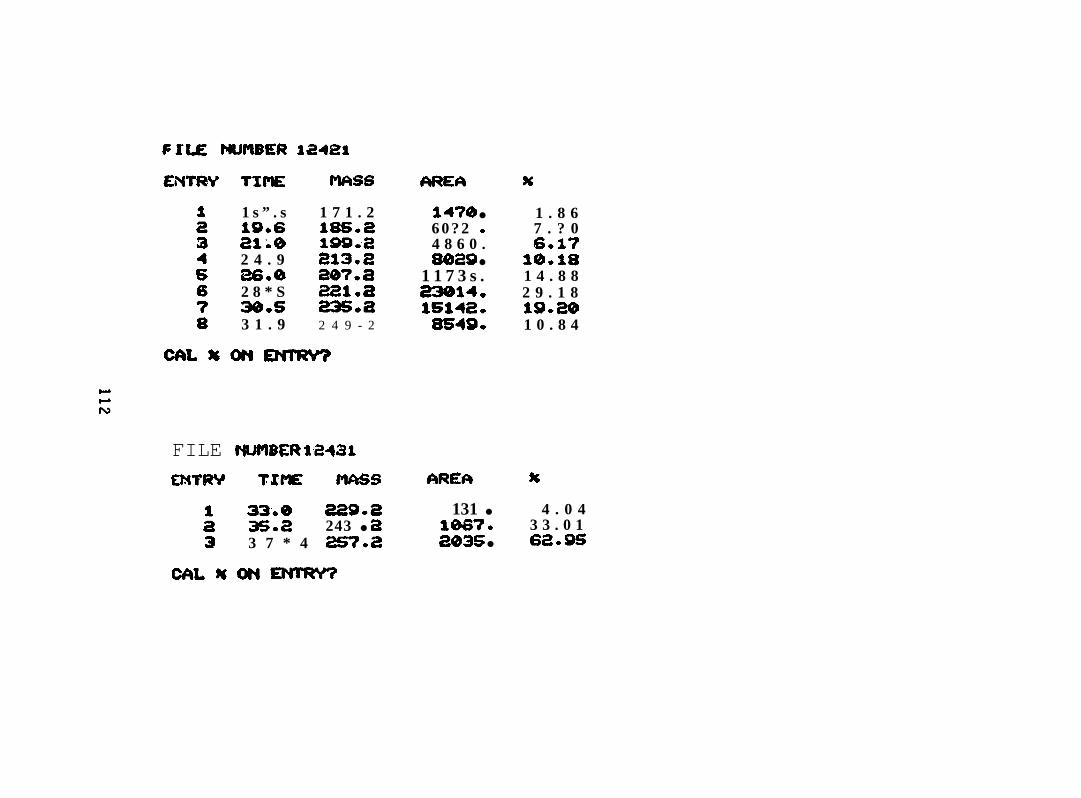
FILE NUMBER 124E1
EtiTR%’ T1lW MAss
1 s ” . s194621002 4 . 926.02 8 * S3(B*S3 1 . 9
1 7 1 . 218s.2199*a213. Eaca?. a2al*a23s.22 4 9 - 2
C4bL%ONEN1’RY?
FILE F+UMBER 12431
mmw TIME f“utss
33.0 22!3.2: 3s.2 243 ● a3 3 7 * 4 2s7.2
$4?e ●
6 0 ? 2 *4 8 6 0 .8a29 ●
1 1 7 3 s .23914.1s142.8S49.
131 ●
1W7*~03S ●
%
1 . 8 67 . ? 06.1’7
10.181 4 . 8 82 9 . 1 819.201 0 . 8 4
%
4 . 0 43 3 . 0 162.9S
CAL% ON ENTRW

APPENDIX 11:
ASTARTE BOREALIS: BAY 9: 1 DAY
113
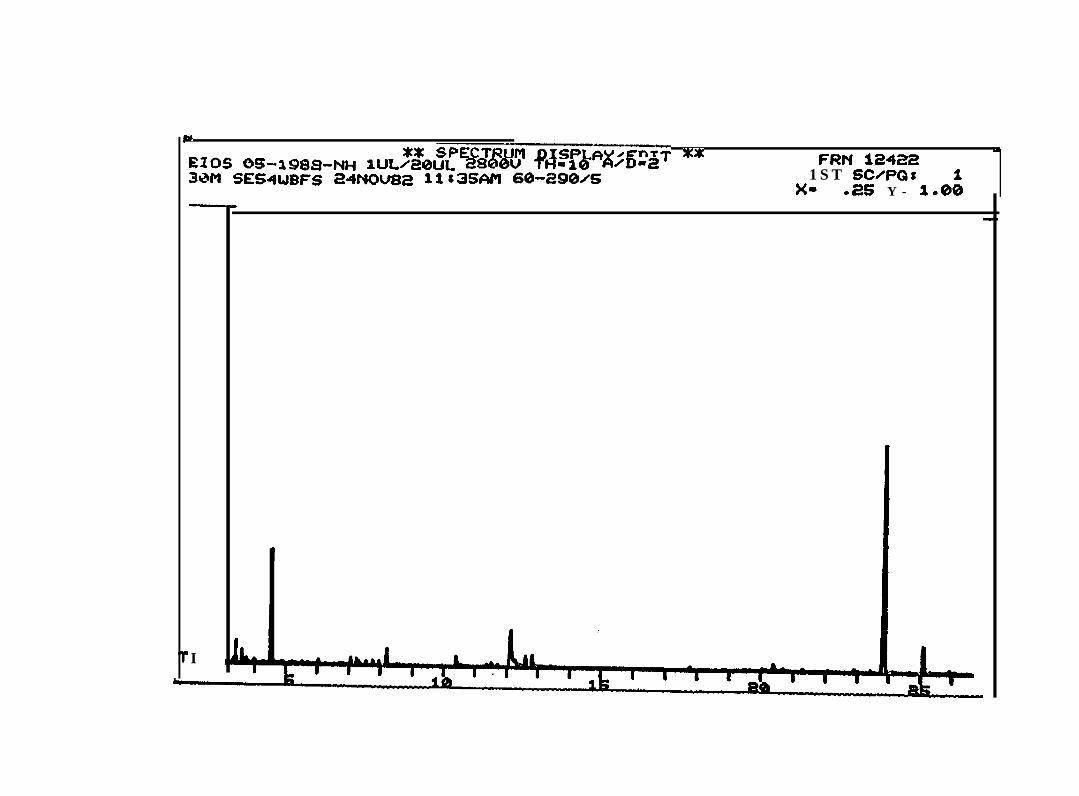
tXX SPECTH..I~AY0EDIT XX w
FFZN 12422EIOS OS-a98S-NH lUI/20UL 28Gt0U TH-10 A~D=21 S T SC/PQs3Wl SES4WBFS 24H0~2 11S35API 60-290/S
X. .25 Y - 1.0;
II

■■■●m■m.●.J●●.●{DP,D,({,
116
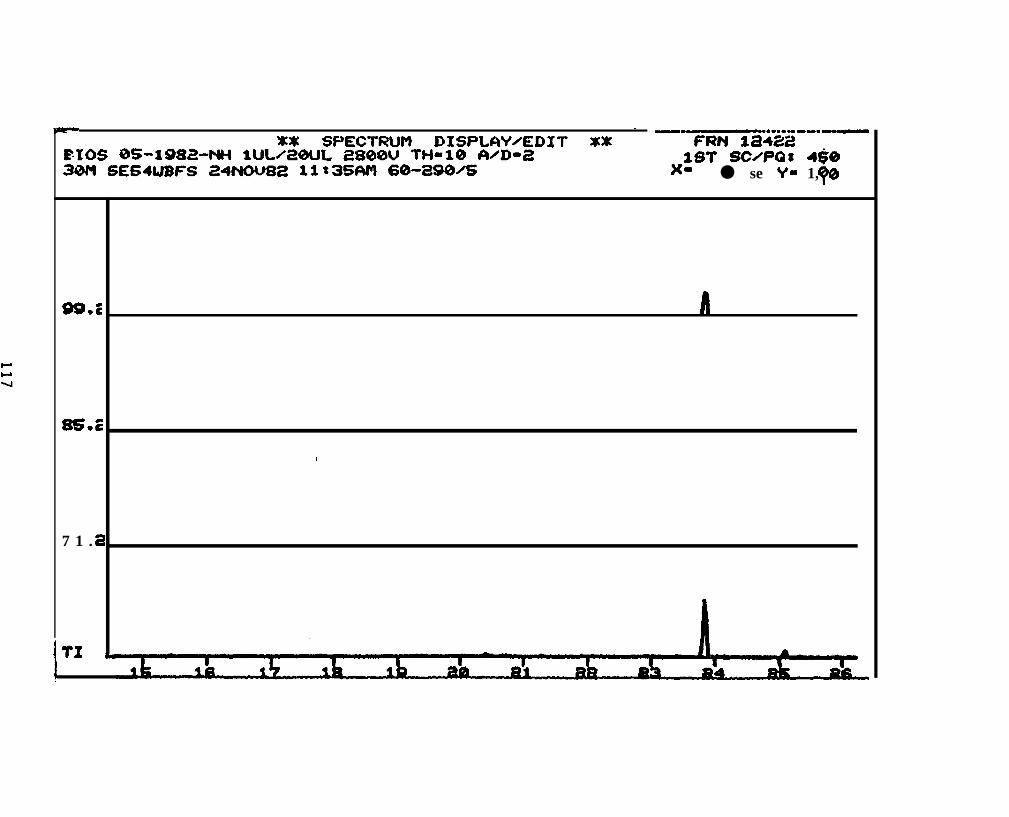
eXX SPECTRUM DISfLAY/EDIT XX ‘
—.—*.*..-.*—FRN 3a422
S10S %S--1982-IW tUL/20UL 2800U TH-10 A#D-~ 1ST SCHFOS 4$030tl SES4WBFS 24NOU8~ lls3SfWl 60-E90/S x. ● se %’- 1, g?
S9*E
Ss.z
7 1 .
#
I
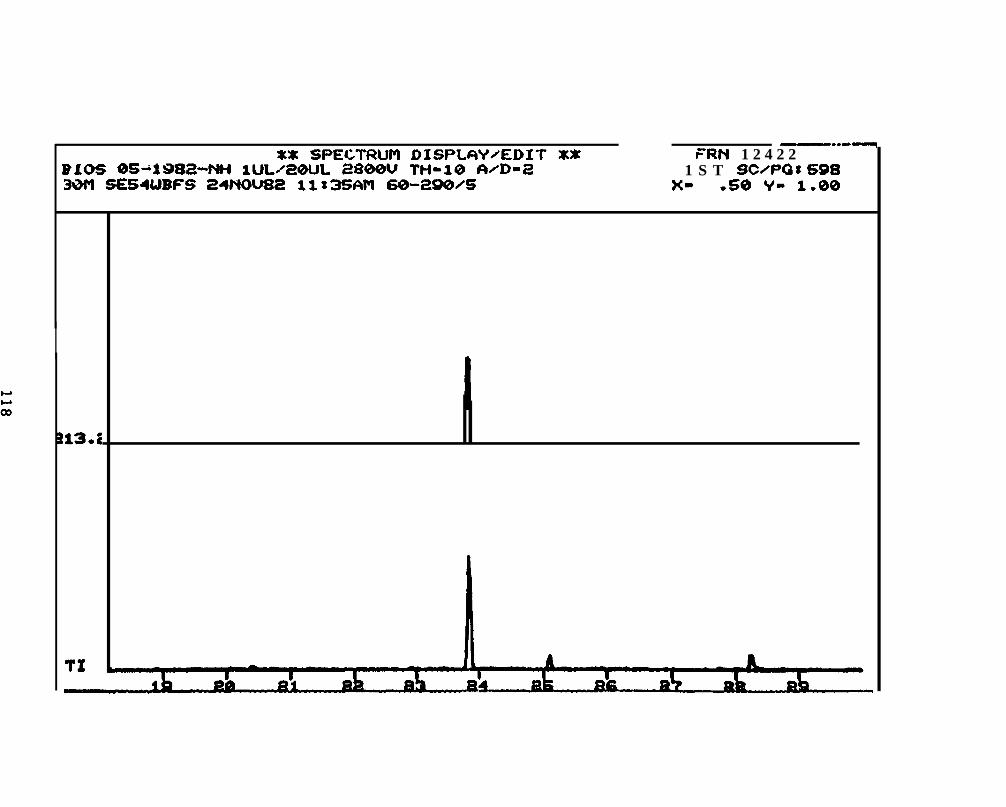
%X SPECTf?UPl DISPL6VZEDIT XX—..e~
FRN 1 2 4 2 2B1OS OS’lS8~-NH lULz~QXJL 28QWU TH”10 W’DD2 1 S T SC~PGs S9830fl SE54WBFS 2+NOU82 11Z3SAM 6(3-290/S x. .s0 v“ 1.063
13*;
TI
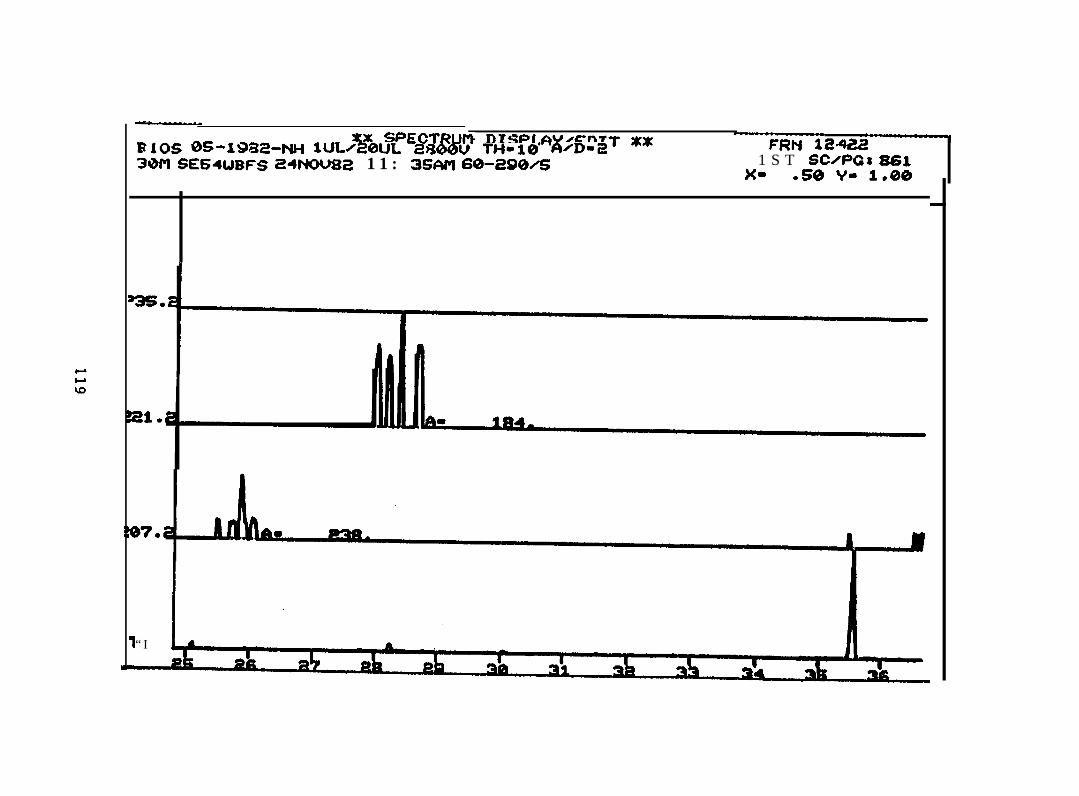
. . .
*X SPECTRUn DIsp~f+y/~DIT ** FRN 124=R1OS i3S-19&12-NH 1UW2G)UL 2SOQ)U TH-10 $wDD21 S T SC@Cs S613Wl SEG+WBFS 24NCbU8~ 1 1 : 35#q 60-~90~ x“ .s0 v- 1.00
“ I
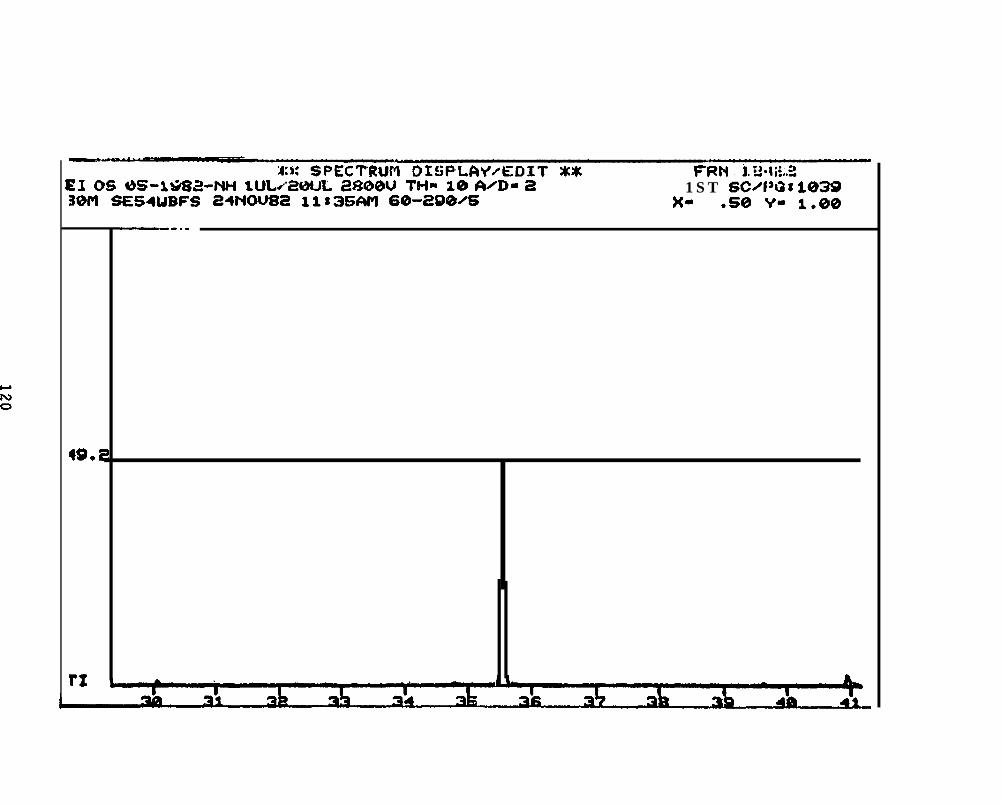
El OS WS-&@82-NH llJL/”2WL iWiMW TH- ~0 AND” ~ 1 S T SC~fWs1039301’1 SES41JBFS ~4NOU8~ l183G#l 60-29%6 x. .50 v- l.Q@
49. i
rx
—-. . .
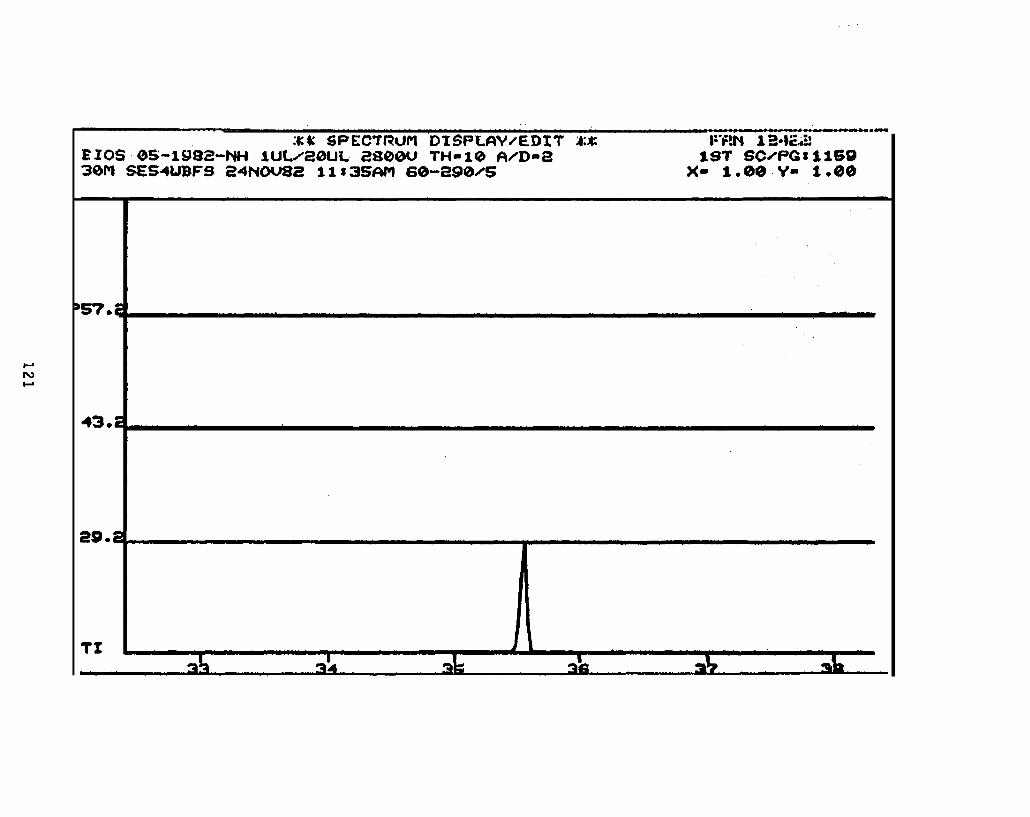
,.,
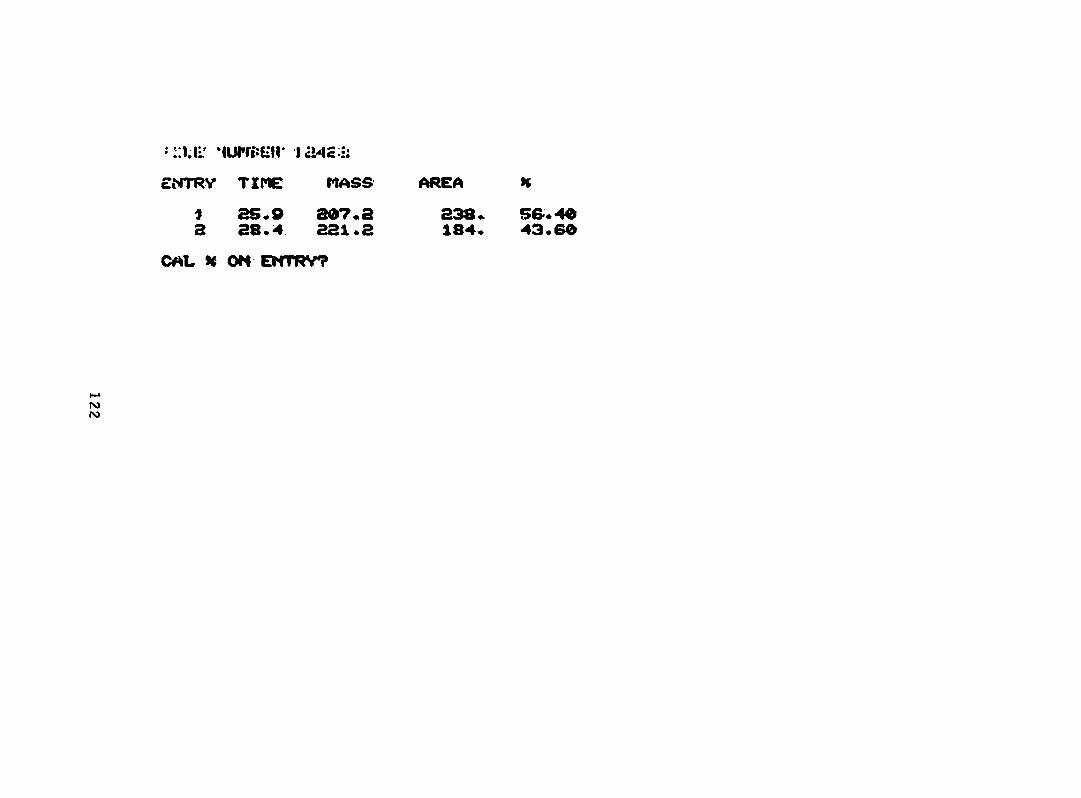
a’ruv TSME MASS tbREf? %
APPENDIX Ill :
ASTARTE BOREALIS: BAY 9: 2 WEEKS
123
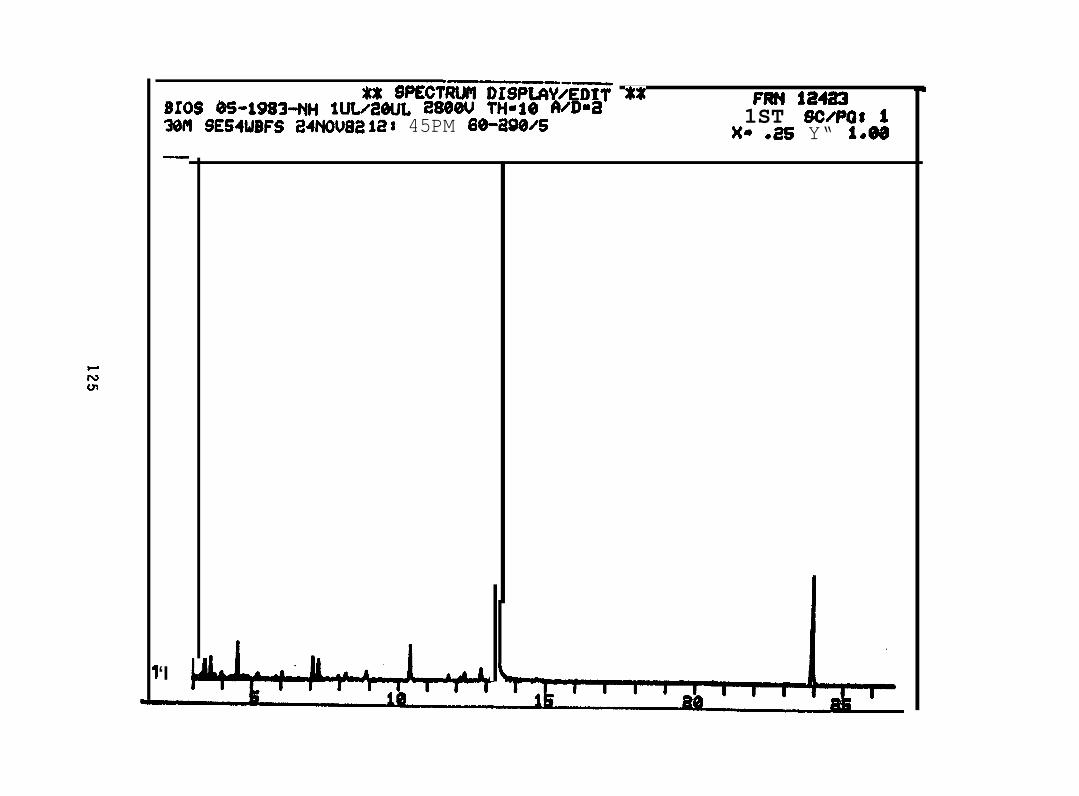
*S 8PECTiiijiiiijiiP~~iE~ *% FRN 124%30109 @S-lS?83+H 1UV26LJL 28WU TH@10 fVD=~ 1ST Sc/Pos 1WI SE54WBFS 24NOU8~ la s 45PM 60-2g0z5 X9 .8s Y“ 10W—
‘I
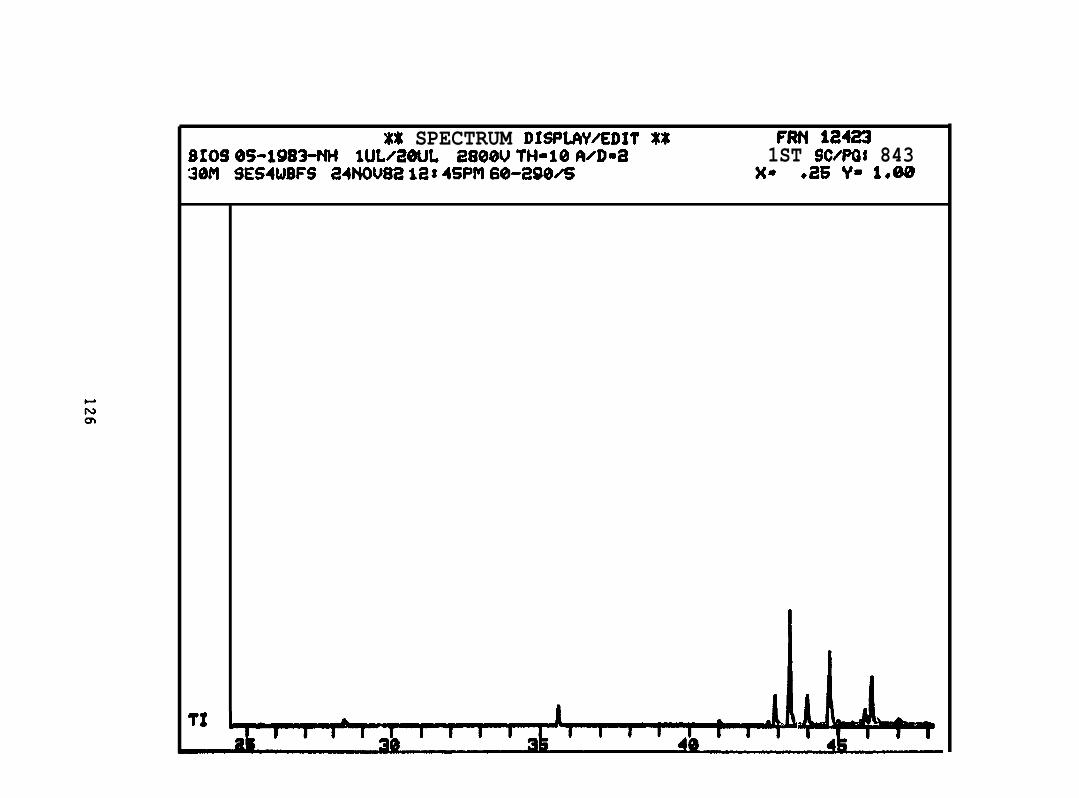
X$ SPECTRUM DISPLIWZEDIT xx FM 12423S10S OS-1983-NH lUL@OIJL ~800U 7’H”1O fizD=~ 1ST 9CHPQ8 843WI SES4WBFS 24NOU82 12$ 45PM 60-~90~ )(9 .26 Y= 1.09
71
rHQ
-
127

.Ya~-aa.4a949
128
$% SPECTRUM DISP(J3YHEX% FRN 184= “810S W-1983-NH lUL@OIJL 2800U THID1O fVl)=2 19?’ SWPO$ 691WI SE541JBFS 24NOU82 1a$4SPfl 6@-290% )(~ .S0 V- le~
1342. ~, la
‘t —iilirnd A a4
XX SPECTRUM DISPLAYZEOIT X% ml 12423BIOS W-1983-NH lUL/26UL a80$U I’I+-10 #vI)m~ 1ST SCOPQ$ ~‘30fl SES41JBFS 24NOU8~ 12*45PM 60-~90% )(. .50 v“ 1.00
3s.2 ,
M*2
07.2,~(
?1
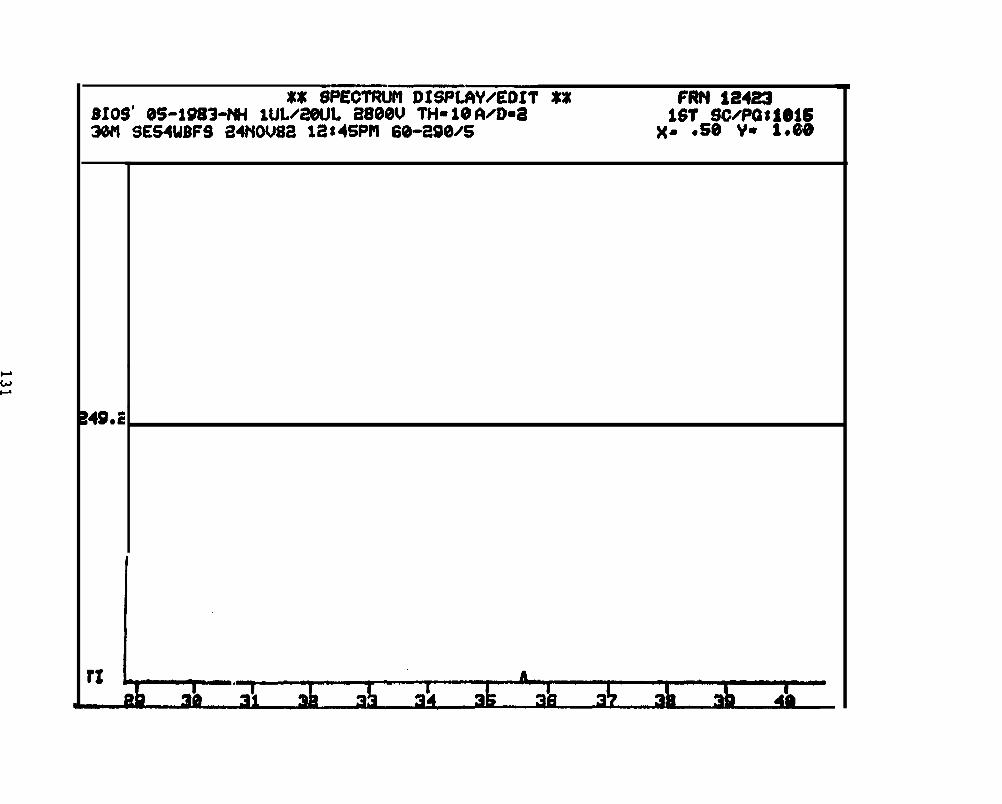
$$ 8PECTRliiiiW/EOIT %% m 12423S10S’ OS-1923-M+ lUL~201JL ~80W THIB 1$ fizD~~ 1$7 SCHPOSl@1630M SES4UBFS ~4NOU82 i2$45PM 60-2S0/S #a .s@ V* 1*$O
I
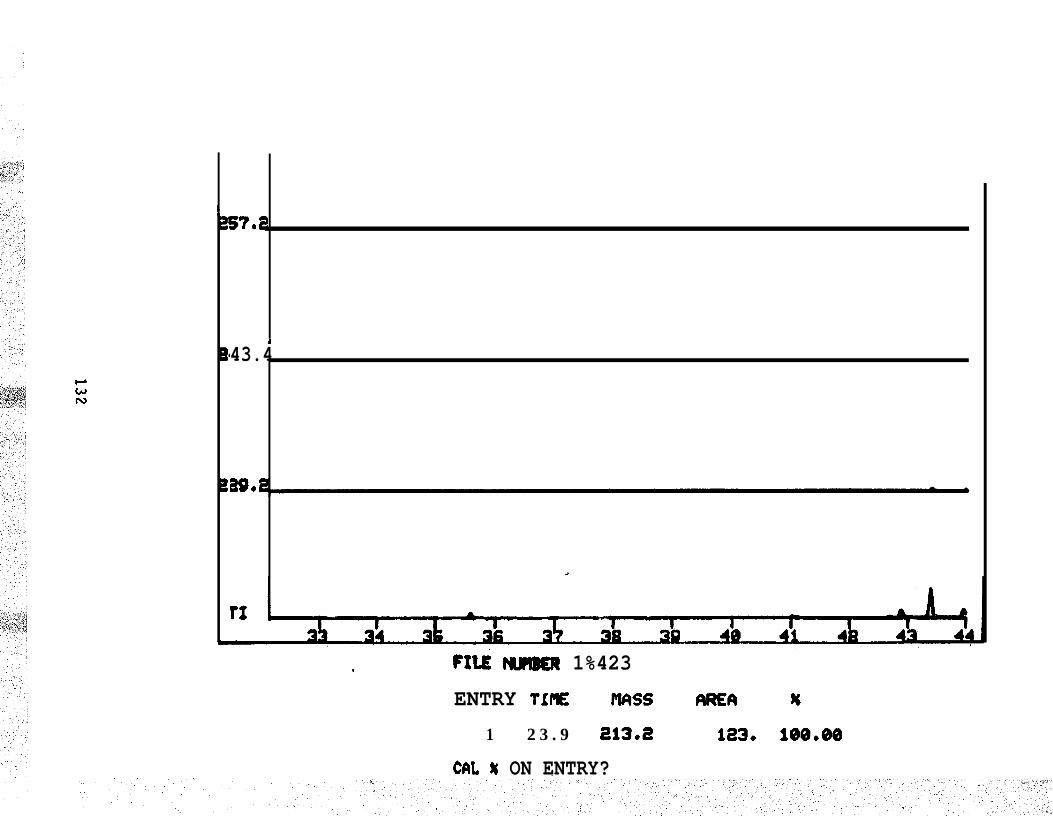
1-GJN
S?*a
I43.4
290E
& FILE NIMBER 1%423
ENTRY TIME MAss WE* %
1 2 3 . 9 213.2 la3. 100.00
CAL % ON ENTRY?
APPENDIX IV:
SERRIPES GROENLANDICUS: BAY 10: 1 D A Y
133
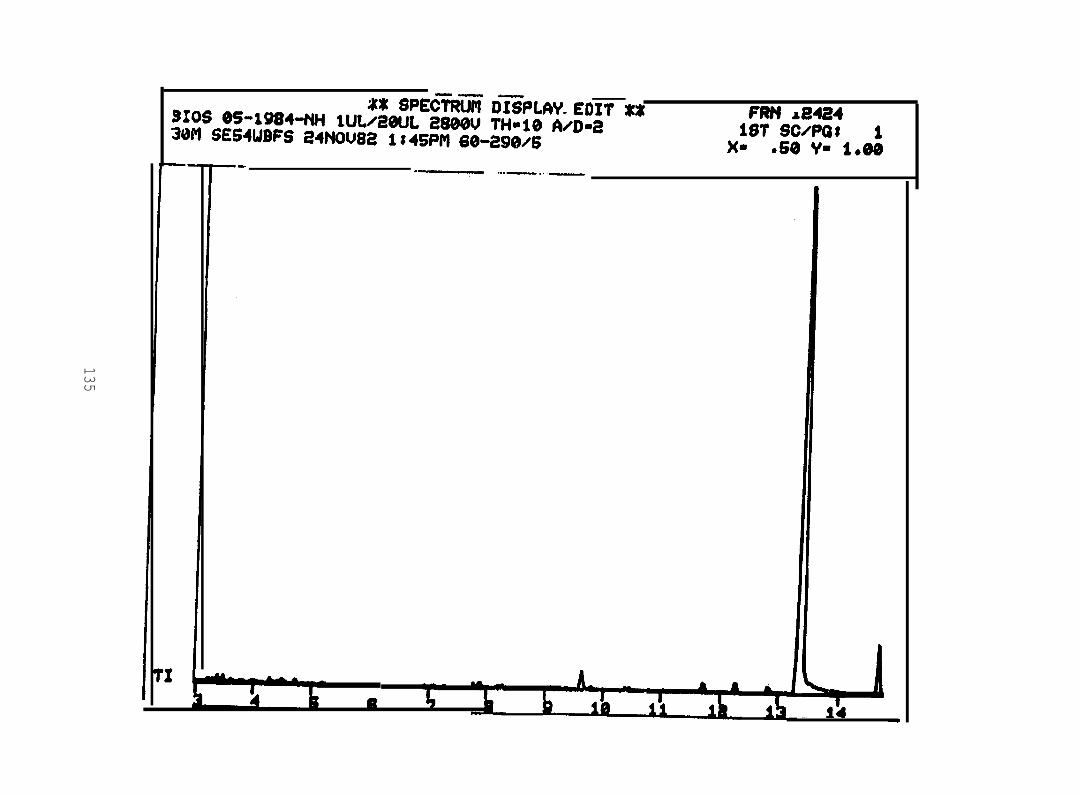
t
.4
135
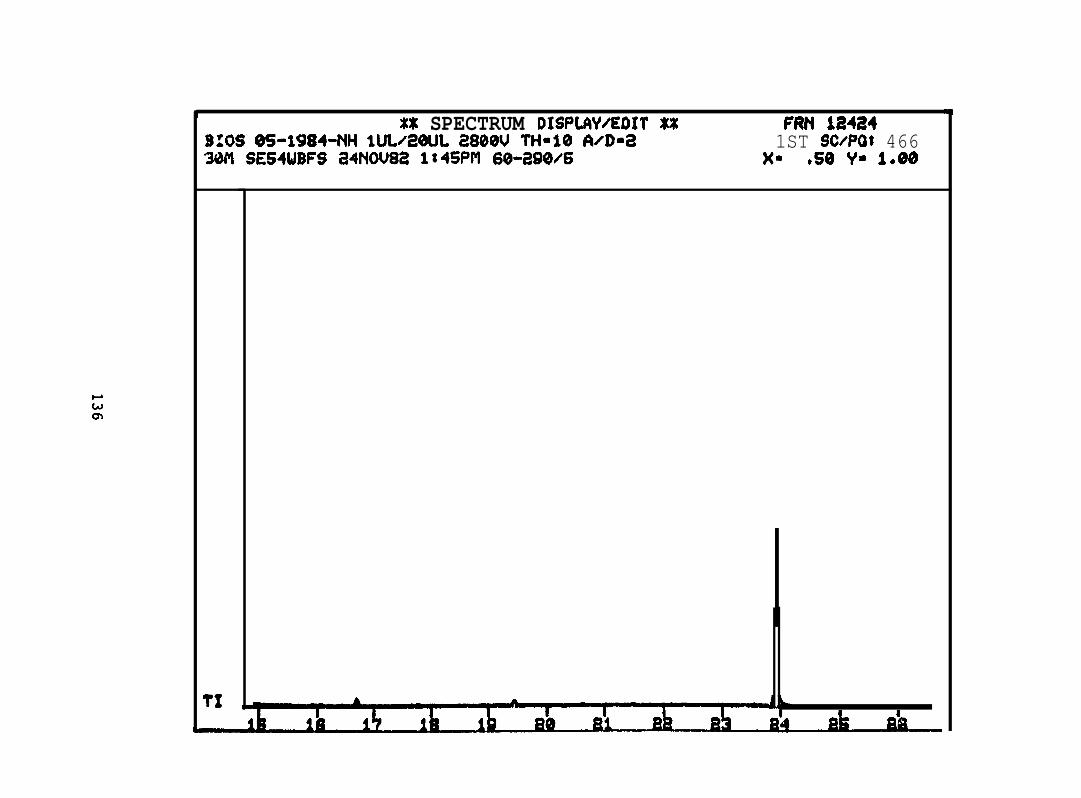
XX SPECTRUM DISPLfW~Ef)IT X% FM 124249:0S 9S-1984-l’lH lULZ20UL ~SOOV I’I4=1O RzD-~ 1ST SCZPO$ 4663WI SE54WBFS 24NOU82 l:45Pfl 60-290/6 )(. .s0 v“ 1.00
TI

/’
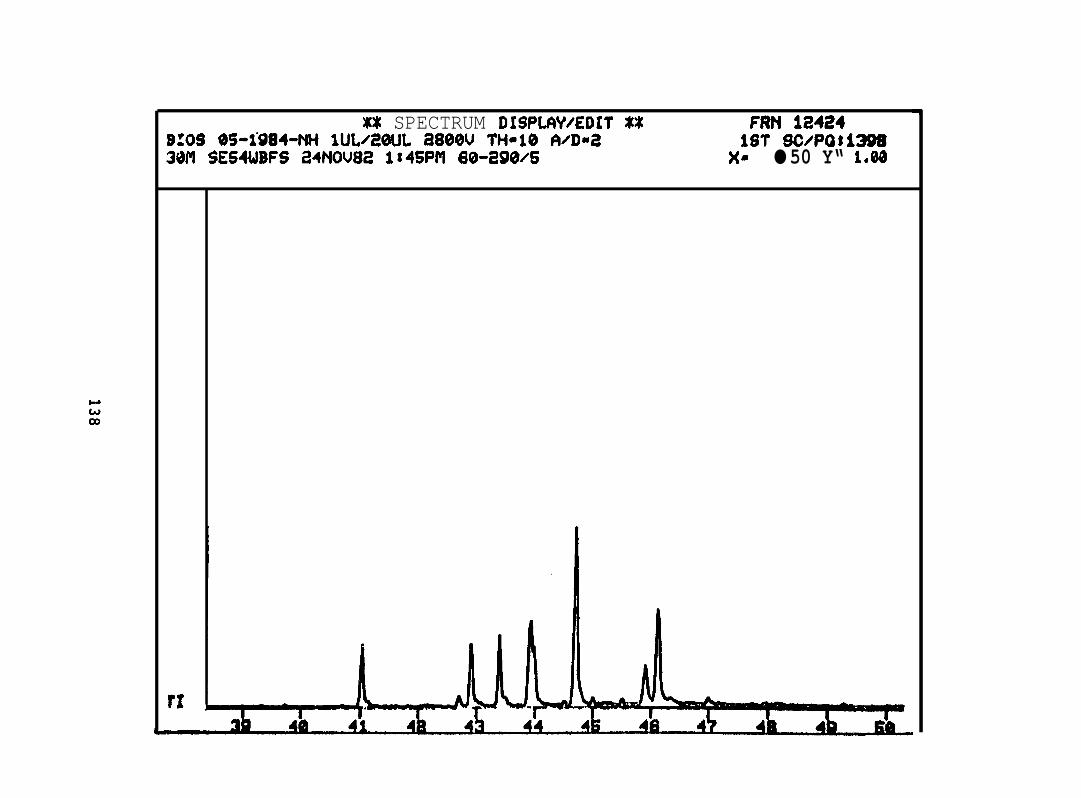
W SPECTRUM DISPLAYzEOH’ X% FRN 12424B:OS f/J5-t984-NH lUL~20UL a800U TH”1O AzD+ 1ST SCZPO$139830M SE54WBFS 24NOU82 1:45PM 60-290/S )(. ● 50 Y“ 1.00
rI
XX SPECTRUfI DfSf%AY/EOIT XX FRti.12424S:0S 05-l~84+w M#2@UL 2800U TH=1O fVD=21ST SC/’PQtl~W’1 SES4ttJBFS 241’iOU8~ 1s45PPI GO-aWW6 %- .s0 Vg 1.00
—
71
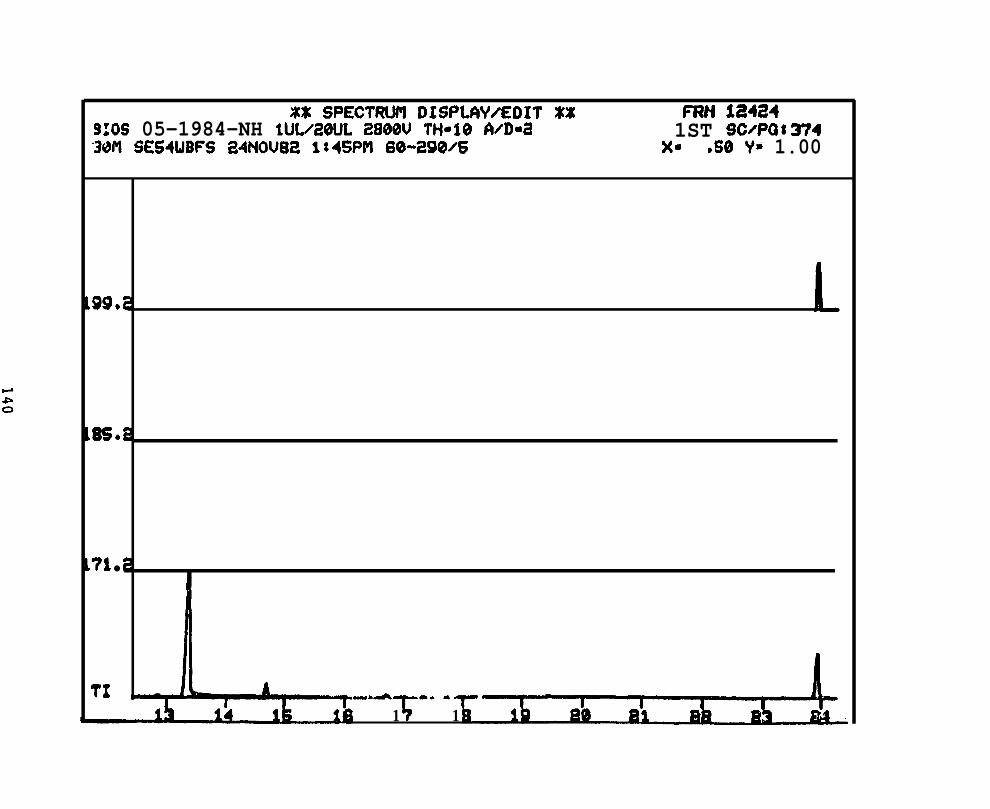
XX SPECTRIJfl DISPtAY/EDIT X% nw la424910S 05-1984-NH iULZ20UL 2800U TH”1O A/D=~ 1ST 9CA%* 374“3W”l SE54WBFS ~4NOU82 1x45PM 60-290zS )(* .50 Y“ 1.00
,99*
,8S*
,?1 ●
TI1 1
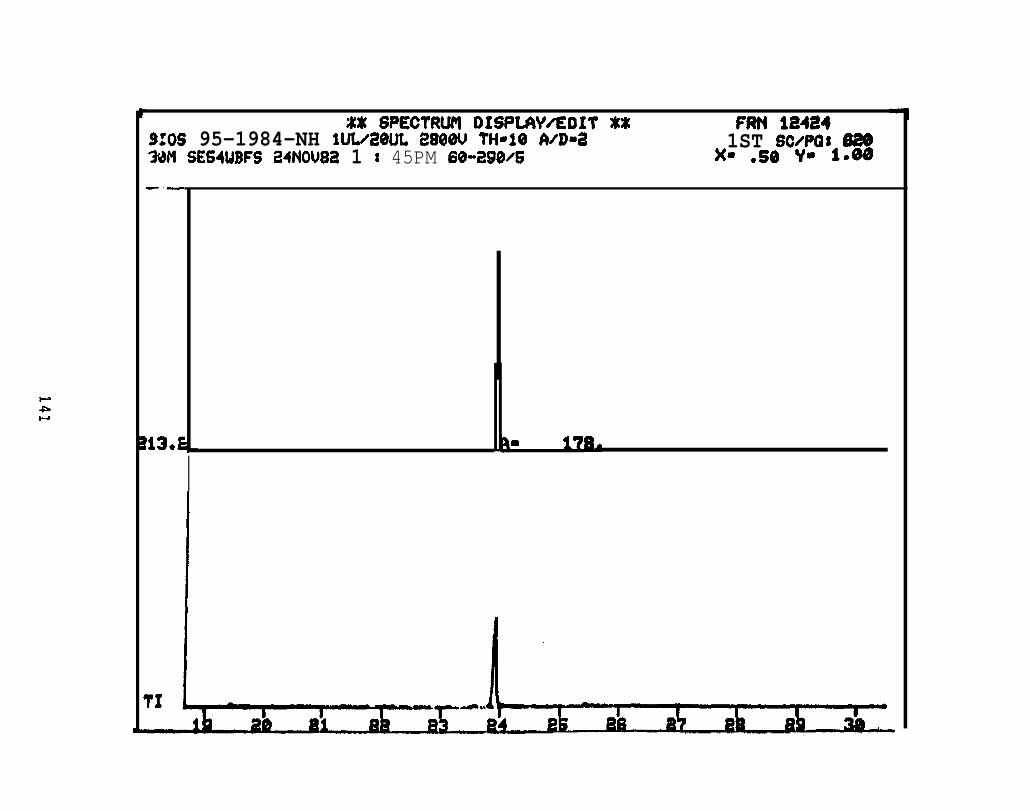
-1
Xx SPECTRUM DISPLAY/EDIT X% FRN 124849:0S 95-1984-NH lULZ20UL 2800U TH-10 WD+ 1ST SCJPG$ M@WI S&S4ttJBFS 24NOU8~ 1 t 45PM 60-290/6 )(m .50 w 1.60-—
13*E
I
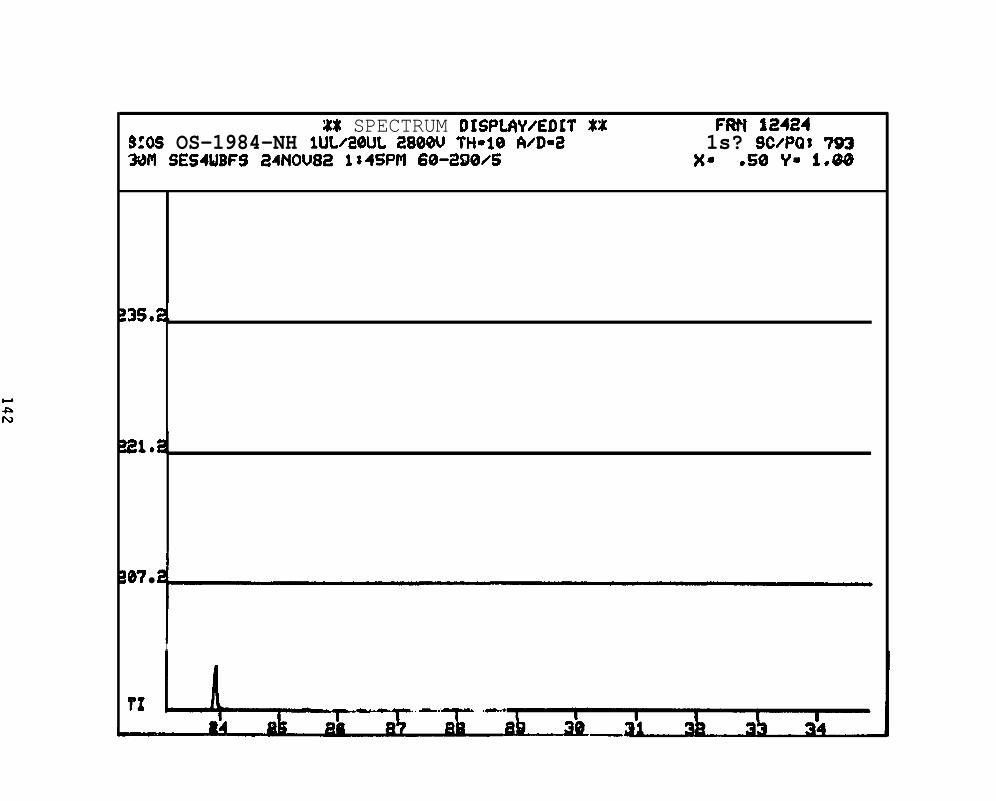
XX SPECTRUM DISPtAY/Ef)IT X@ FRN 124a49:0S OS-1984-NH lULZ20UL 2800U TH=10 RzD”2 1s? scOPQt 7$)33M SES4WBFS 24NO(J82 1x4SPM 60-290/5 )(. .s0 Y“ 1.0’0
35*4,
A
e? ●
I
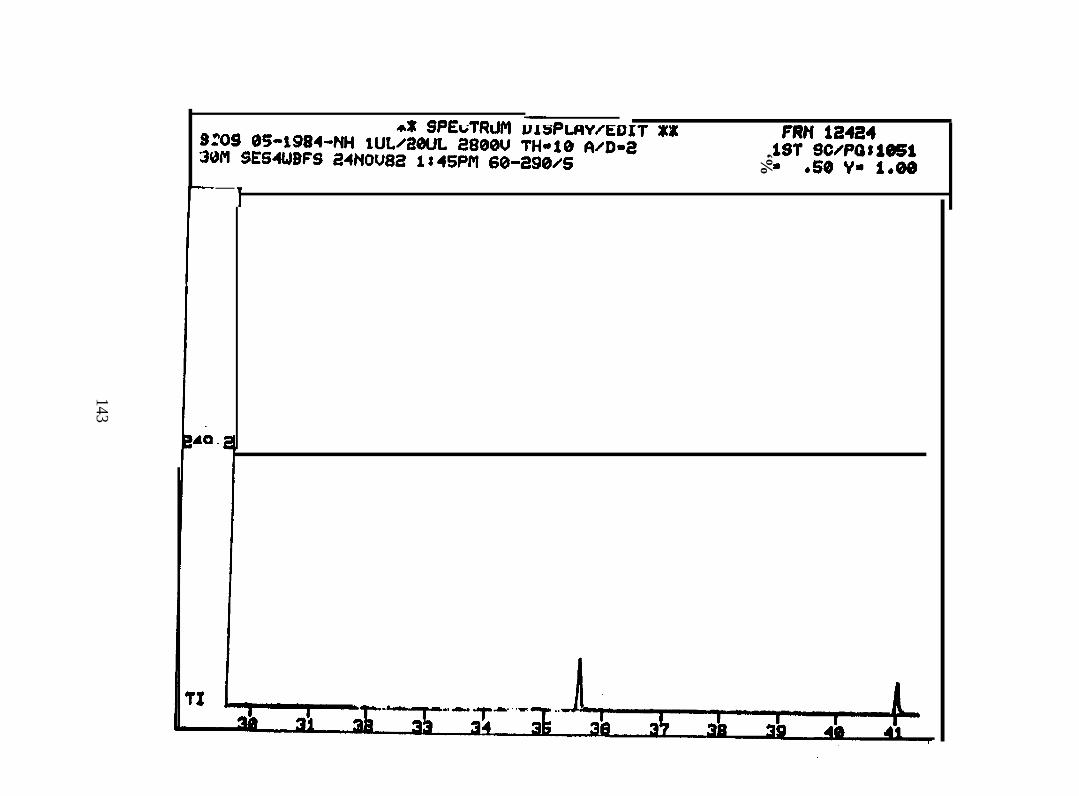
‘%
Itl
143
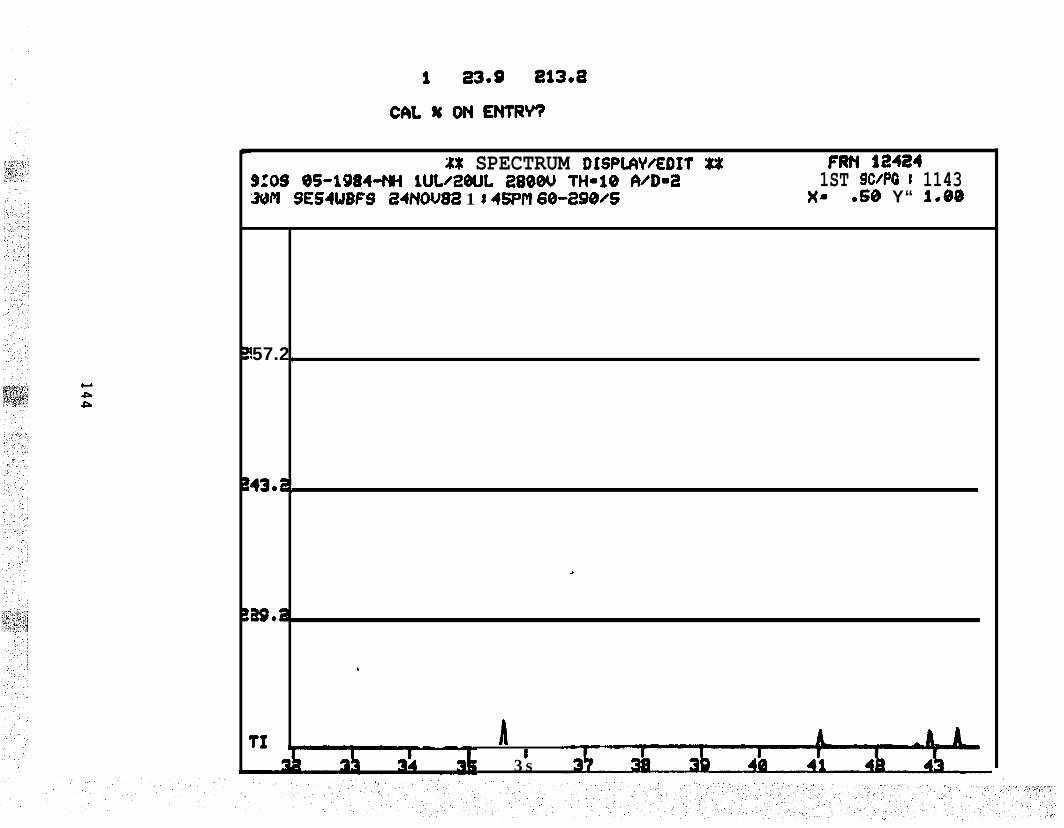
X% SPECTRUM DISPLAY/EOIT X% FRt( 12424910S OS-1984-f’Ui lULZ201JL 280W TH”1O WD+ 1ST 9C#G t 11433@M 9ES4WBFS a4NOU82 1 a 45PM 60-a90/S )(. .s0 Y“ 1.0$
57.2 ,
43.2,
*
mea
4
rxr
3s
APPENDIX V:
SERR[PES GROENLANDICUS: BAY 10: 2 WEEKS
-.
145
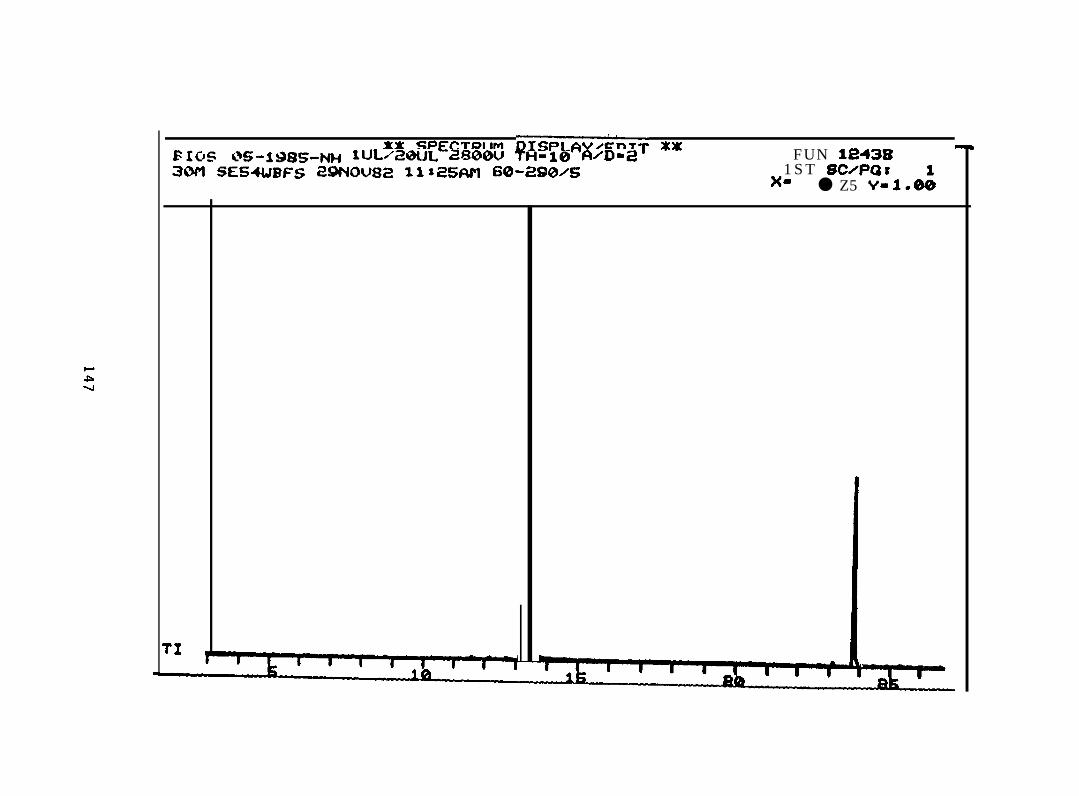
** SPECTRUrI DISPLAWEDIT XXF1OS C%-i9SS--NH lUL’2WL 2EM$OU Tt+-iO A/D-a FUN 1~438
1ST SC@Q:30M SE54JBFS 29NOUS2 lls25API 60-2$)0/Sx. ● Z5 v- 1.A
‘x
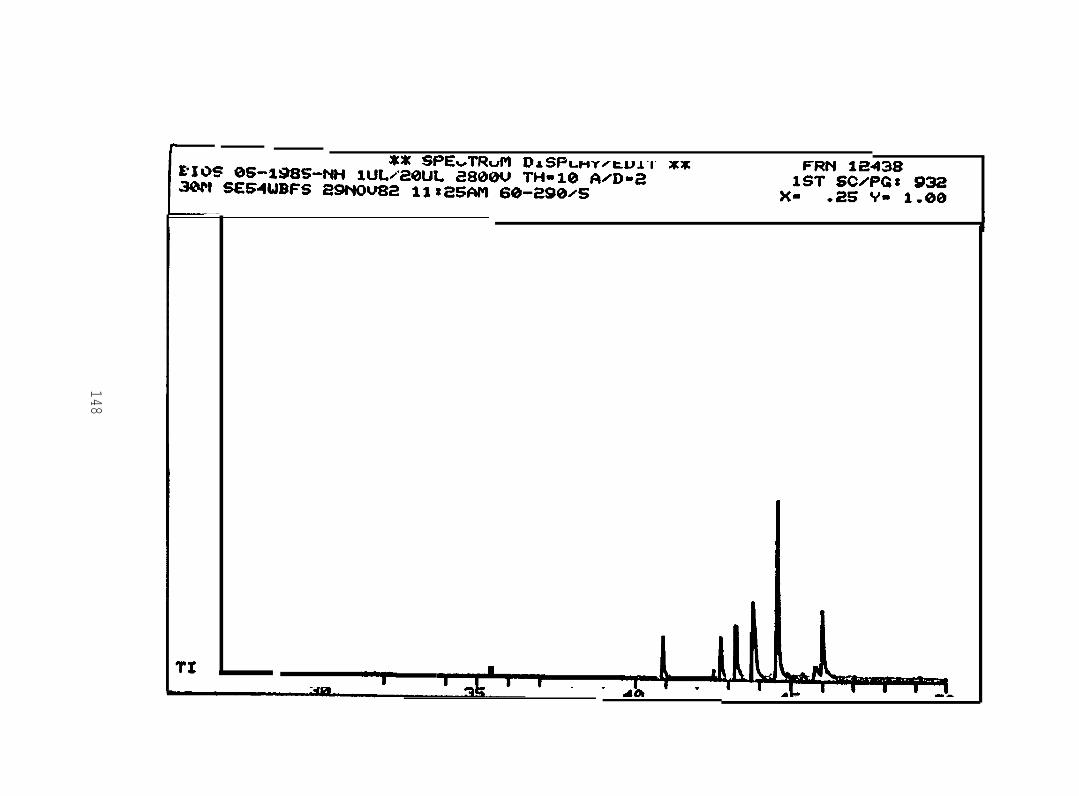
1-i
148
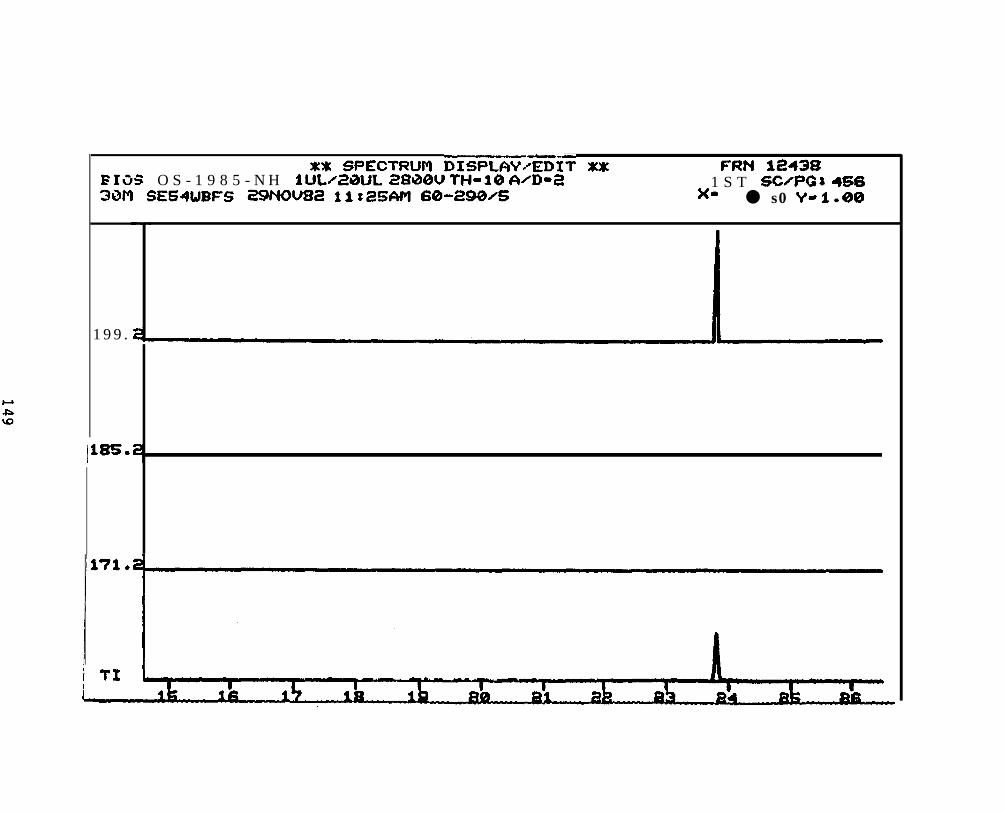
X* SPECTRUM EbISPLfW~~iT Xx FRN 1~438I?IOS O S - 1 9 8 5 - N H lU~/2t3UL ZN330U TH-10 WD-E? 1 S T SCYPGS 4663W’I SES4JBFS ~NOUS2 llx~SAPl 60-S90/S )(. ● s0 v- I.@@
199.
ps.?.
——.. —XX S P E C T R U M DISPLWXEDIT XX FRN 124323
PIdS 05-l!WS-NH ZU1/”i201JL S80W THw1O WDR2 1 S T sc~PQ$ mu3iWI S&S41JBFS ~WNOU82 li$25AM 60-290~S x. . s 0 ‘f- 1*W
!13*E
TX _
XX SPECTRUN DISPLAYZEDIT xx FRN 12438FIOS OS -1985 -NH llJI./@MlL i2800U TH=1O A/D-~ 1 S T SW?(3X 8823WI SES4LJBFS a9NOU82 11* 2SMl 60-2S$06 )(- . s0 Y - 1 .00
=.i
21.i
074i
TI.
XX SPECTf?UM DISPLfiVZEDIT XX FRN %2438BIOS 05-198S-Nti lUW~@tJL i2800U TH=1O fi@-2 1ST SC/PGJllS930Pl SE54WBFS ~U82 ll:i?WWl 60-2$JiiVS x- 1 .00 Y- 1 .00
!S’?.i
!43. i
!29 .
TI
x
$b-o
nlt-
I
153