baf base bir-sreshto matiur rahman
TRANSCRIPT

CONFIDENTIAL
1
CONFIDENTIAL
BAF BASE BIR-SRESHTO MATIUR RAHMAN
“CLIMATE OF JESSORE”
By
Wing Commander Nasir Uddin Molla Officer-in-Charge, Meteorological Squadron
November 2014
Supervisor : Wing Commander Ahmed Ali

CONFIDENTIAL
2
CONFIDENTIAL
TABLE OF CONTENTS
Ser Figure/Table Description Page No
1 - Table of Contents………………………………………………… ii
2 - Preface…………………………………………………………….. vi
CHAPTER – 1 : INTRODUCTION
3 - General Concept………………………………………………….. 1
4 - Questions for the Study, Limitations of the Study …………….. 2
5 - Scope of Further Study, Purpose of the study……………….... 3
6 - Data Used ………………………………………………………… 4
7 - Data processing and Inference………………………………….. 5
8 - Extreme Weather over Jessore…………………………………. 5
CHAPTER – II : PSYCHOTHERAPY OF TEMPERATURE
9 - General Concept………………………………………………….. 6
10 Figure - 1 Monthly mean max temp…………………………………………. 6
11 Figure - 2 Monthly highest max temp……………………………………….. 7
12 Figure -3 Monthly mean min temp………………………………………….. 8
13 Figure -4 Monthly lowest min temp…………………………………………. 8
14 Figure -5 Fortnightly mean max temp………………………………………. 9
15 Figure -6 Fortnightly mean min temp……………………………………….. 10
16 Figure -7 Fortnightly highest max temp…………………………………….. 11
17 Figure -8 Fortnightly lowest min temp………………………………………. 11
18 Figure -9 Monthly average no of days having temperature ≤100C……….. 12
19 Figure -10 Monthly average no of days having temperature ≥ 380C………. 12
CHAPTER – III : FOG INVESTIGATION
20 - General Concept……………………………………………………… 13
21 Figure -11 Monthly average no of foggy days………………………………. 13
22 Figure -12 Average Persistence of Fog in November…………………….. 14
23 Figure -13 Average Persistence of fog in December………………………. 15
24 Figure -14 Average Persistence of fog in January…………………………. 15
25 Figure -15 Average Persistence of fog in February………………………… 16
26 Figure -16 Average Persistence of fog in March……………………………. 16
CHAPTER – IV : THUNDERSTORM BEHAVIOUR
27 - General Concept …………………………………………………. 17
28 Figure -17 Monthly average no of thunderstorm days…………………….. 17
29 Figure -18 Monthly average no of Nor’wester ………………………………. 18
30 Figure -19 Time of occurrence of nor'wester………………………………... 18
31 Figure -20 Total No of Nor’wester days in February………………………… 19

CONFIDENTIAL
3
CONFIDENTIAL
32 Figure -21 Total No of Nor’wester days in March……………………………. 19
33 Figure -22 Total No of Nor’wester days in April……………………………… 20
34 Figure -23 Total No of Nor’wester days in May……………………………… 20
35 Figure -24 Monthly maximum wind speed……………………………………. 21
36 Figure -25 Yearly maximum wind speed…………………………………….. 21
CHAPTER – V : PRICIPITATION STUDY
37 - General Concept………………………………………………….. 22
38 Figure -26 Monthly average amount of rainfall (mm)……………………….. 23
39 Figure -27 Monthly average No of rainy days……………………………….. 23
40 Figure -28 Yearly total amount of rainfall (mm)…………………………….. 24
41 Figure -29 Yearly total No of rainy days……………………………………… 24
42 Figure -30 Pentad average rainy days for April……………………………… 25
43 Figure -31 Pentad average rainfall of April…………………………………… 25
44 Figure -32 Pentad average rainy days for May ……………………………… 26
45 Figure -33 Pentad average rainfall of May……………………………………. 26
46 Figure -34 Pentad average rainy days for Jun………………………………. 27
47 Figure -35 Pentad average rainfall of Jun…………………………………….. 27
48 Figure -36 Pentad average rainy days for July……………………………… 28
49 Figure -37 Pentad average rainfall of July……………………………………. 28
50 Figure -38 Pentad average rainy days for August…………………………… 29
51 Figure -39 Pentad average rainfall of August………………………………… 29
52 Figure -40 Pentad average rainy days for September………………………. 30
53 Figure -41 Pentad average rainfall of September…………………………… 30
54 Figure -42 Pentad average rainy days for October…………………………. 31
55 Figure -43 Pentad average rainfall of October………………………………. 31
56 Figure -44 Daily average amount of rainfall for February…………………… 32
57 Figure -45 No of rainy days for February……………………………………... 32
58 Figure -46 Daily average amount of rainfall for March……………………… 33
59 Figure -47 No of rainy days for March………………………………………… 33
60 Figure -48 Daily average amount of rainfall for April………………………… 34
61 Figure -49 No of rainy days for April…………………………………………... 34
62 Figure -50 Daily average amount of rainfall for May………………………… 35
63 Figure -51 No of rainy days for May…………………………………………… 35
64 Figure -52 Daily average amount of rainfall for Jun…………………………. 36
65 Figure -53 No of rainy days for Jun……………………………………………. 36
66 Figure -54 Daily average amount of rainfall for July………………………… 37
67 Figure -55 No of rainy days for July…………………………………………… 37
68 Figure -56 Daily average amount of rainfall for August……………………… 38
69 Figure -57 No of rainy days for August……………………………………….. 38
70 Figure -58 Daily average amount of rainfall for September………………… 39
71 Figure -59 No of rainy days for September………………………………….. 39
72 Figure -60 Daily average amount of rainfall for October……………………. 40
73 Figure -61 No of rainy days for October………………………………………. 40
74 Table - 1 Monthly max wind direction & speed …………………………... 41
75 Table - 2 Monthly total amount of rainfall in (mm)………………………... 42
76 Table - 3 Monthly no of rainy days………………………………………….. 43

CONFIDENTIAL
4
CONFIDENTIAL
CHAPTER – VI : CONCLUSION AND RECOMANDATIONS
77 - Conclusion…………………………………………………………. 44
78 - Recommendations………………………………………………… 48
Bibliography………………………………………………………… 49
Annexes
A Temperature………………………………………………………… A1
B Fog…………………………………………………………………… B1
C Thunderstorm……………………………………………………….. C1
D Rain…………………………………………………………………… D1
E Wind…………………………………………………………………… E1
F Hailstorm……………………………………………………………… F1
G Norwester……………………………………………………………... G1
H Extreme weather…………………………………………………….. H1

CONFIDENTIAL
5
CONFIDENTIAL
PREFACE
1. BAF Base Bir Sreshto Matiur Rahman (BAF MTR) generates highest flying hours of BAF compare to other bases; which are mostly concern with training of cadets and U/T officers. Moreover, a number of occasions in the base, where very high officials including head of the state graces, make the Base different than any other bases of BAF. Almost all of these occasions are highly dependent upon weather conditions. Everyone agrees that AOR (Area of Responsibility) of BAF MTR experiences extreme weather than any other Bases. Therefore, requirement of reliable Wx forecast for this
Base is everybody’s concern in BAF. A weather forecast is simply a scientific estimate of future weather condition. Weather condition is the state of the atmosphere at a given time expressed in terms of the most significant weather variables. The significant weather variables being forecast differ from place to place
and time to time. Therefore, in forecasting the weather, a Meteorologist must at least know something about the existing weather condition over a large area before he can make a reliable forecast. The accuracy of his forecast of a particular area depends largely upon his knowledge of the prevailing weather conditions and the climatology of that area. BAF MTR is acting as a Main Meteorological Office (MMO) of Bangladesh Meteorological Department (BMD) and it has a well heeled data bank. After getting the opportunity to work in BAF MTR, the desire of utilization of these data was attempted and the “Climate of Jessore” is the final outcome of the study. All available data have been used for preparing this climate; despite the fact that changes in climate are a long term continuous process and the scope of updating the climate remains unbolt. I am extremely grateful to Wg Cdr Md Shahidul Islam, OC 11 Sqn, for his all out support from the user point of view during the study. I am also grateful to Wg Cdr Ahmed Ali for his suggestion and guidance. I am thankful to Sgt Mokhlesur Rahman, Sgt Tuhin Ahmed and other Airmen and civ employees of Met Squadron, BAF MTR who helped in many ways while preparing this climate. The “Climate of Jessore” might help all concerns in BAF or any other organization for easy understanding the trend of weather throughout the year for their planning and execution of different events.
NASIR UDDIN MOLLA Wing Commander OIC Met Sqn BAF MTR
November 2014 Jessore
CONFIDENTIAL
6
CONFIDENTIAL
CLIMATE OF JESSORE
CHAPTER – I : INTRODUCTION
General Concept
1. Climate is commonly defined as the average pattern of variation in weather elements (temperature, humidity, atmospheric pressure, wind and precipitation) over a long period. The standard averaging period is 30 years as defined by World Meteorological Organization (WMO), but other periods may also be used depending on the purpose. Climate also includes statistics other than the average, such as the magnitudes of day-to-day or year-to-year variations. The difference between climate and weather is usefully summarized by the popular phrase "Climate is what you expect, weather is what you get”. Climatology is nothing but the study of climate.
2. Weather forecasting for flight safety is the motto of any Met Sqn in BAF. Therefore, accurate forecasting is highly demanded from every corner for planning and accomplishment of different tasks vested upon them. Forecasting for different durations like, now-casting (up to 2 hrs) and very short range forecasting (up to 12 hrs) is important for daily flying; but short range (12 hrs to 72 hrs), medium range (72 hrs to 240 hrs), extended range (10 days to 30 days) and long range (30 days to 1 year) forecasting are very much important for planning of different occasions and sustained operations including flying effort planning. Now-casting and very short range forecasting is possible based on Persistence method1 and Synoptic method2 of forecasting; but the other types of forecasting depends on either climatology or Numerical Weather Prediction3 (NWP). Again, in NWP method, different equations produce different results; so meteorologists must always use the other forecasting methods along with this one. Therefore, climatology has become an integral part of any forecasting.
3. Met Sqn, BAF MTR is a Main Meteorological Office (MMO) of BMD for Jessore area and is the only such BAF installation over southwestern part of the country. Historically, this office has acted as a hub for producing all meteorologists for BAF. For obvious reasons, BAF MTR generates the highest flying hours than any other base, and the Met Sqn plays a vital role in achieving that task. Met Sqn of BAF MTR is well equipped to collect and retain all the met data for not only daily forecasting but also long range forecast supported by valid climatological study. This study is aimed to generate the first ever climatological research for greater Jessore area using the Met data generated from this Sqn to act as future reference for all BAF flying and ceremonial activities, as well as for other relevant purposes. The Climate of Jessore is the study of total 30 years data for obtaining average conditions of different weather elements like temp, fog, thunderstorm/Nor’wester, heat wave, cold wave, rainfall, break monsoon etc. The contents of this study will certainly give an easy understanding about weather pattern of Jessore and adjoining area for the users of BAF for planning of flying effort and other occasions; or any other organization for their operational planning and execution.
1. Persistence method assumes that what the weather is doing now, it will continue to do.
2. Synoptic method uses basic rules that the atmosphere follows ie, the observations, available charts, satellite image and radar observations etc.
3. In NWP method, forecasters take their observations and plug the numbers into complicated equations. Several ultra-high-speed computers run these various equations to make computer "models" which give a forecast for the next several days.

CONFIDENTIAL
7
CONFIDENTIAL
Questions for the Study 4. This study is the effort to search the pragmatic solutions of the following questions:
a. Primary Question. What are the climatic conditions in Jessore area at any time of a year?
b. Secondary Question. The primary question is further supplemented through the following secondary questions:
(1) What are the averages and extreme conditions of different weather elements? (2) How long fog persists in winter, ie, what would be the usual flying start time in winter months?
(3) What would be the frequency and probable days for occurrence of Nor’wester in pre-monsoon season?
(4) What would be the heat wave and cold wave period in summer
and winter?
(5) What would be the onset and withdrawal date of monsoon, period of continuous rain and break monsoon period during SW monsoon? (6) How these climatic elements can significantly affect the flying, ceremonial and public life in Jessore area and when?
Limitations of the Study 5. Climatic study gets perfected by the duration of the study period, ie longer the time of study, more accurate the result likely to be. However, climate of any region is subject to change and evolvement for many reasons, For example, on 15 Sep 04, total 238mm rainfall occurred within one day and the amount of rainfall in 2004 (2477mm) was the highest rainfall within 30 years. On 05 Jun 84, total 242mm rainfall occurred within a day; as a result, the 30 years daily average rainfall became highest (20.2mm) in the month. In this way, sudden flash of very heavy rain in monsoon, effect of tropical cyclone, nor’wester etc affects the climate of a region. The weather and climate of Jessore area is also no exception. Therefore, this study should not be taken on the face value for any kind of ‘perfect forecasting’ in future abrasion, especially on now-casting. The data regarding duration of fog has been taken for 20 years in this study instead of 30 years due to data constraints. There is scarcity of data preservation regarding occurrence of hailstorm over Jessore area. Therefore, the table regarding monthly hailstorm days may not be realistic. Though the climatological data have immense impact on any type of military operations and public life of a region, but here the findings have been postulated keeping in mind the priority in aviation.

CONFIDENTIAL
8
CONFIDENTIAL
Scope of Further Study 6. The 30 years raw data of different weather elements have been attested as annex, which may be utilized for further study. There is scope here for more study on the following issues:
a. Determine the days with low cloud amount 5 okta or more, when flying activities are hampered for low clouds. b. Determine the days of poor visibility, when flying activities are hampered throughout the day.
c. Daily flying in BAF MTR is highly concern with FITS, particularly in pre-
monsoon and monsoon season. Therefore, determine the time of high FITS (danger zone), when flying activities are stopped.
d. Determine the reason behind the high variability in yearly total amount of rainfall and rainy days found within the period of Jan1984 to Dec 2013.
Purpose of the Study 7. The purpose of this study is to provide comprehensive climatology of Jessore air field and adjoining area as a ready reference of a single source archive of relevant weather data. The reference can be readily used for planning and execution of flying syllabus, operational flying, ground operation, different events/ceremonies for saving time and effort with a pre-hand knowledge on different extreme weather conditions like High/low temperature, nor’wester, heavy rain, break monsoon etc.

CONFIDENTIAL
9
CONFIDENTIAL
Data Used
8. There are several elements that build up the weather and climate of a place. The major of these elements are five: temperature1, pressure2, wind3, humidity4, and precipitation5. Analysis of these elements within a longer time scale can provide the basis for defining the climate and forecasting weather. BAF Base Bir-Sreshto Matiur Rahman is acting as a Main Meteorological Office (MMO) of Bangladesh Meteorological Department (BMD) under a MOU between BAF and BMD since 1977. Therefore, Met Sqn, BAF MTR is having a data bank of about 35 years. In this study, total of 30 years real time data (from 01 January 1984 to 31 December 2013) of major three elements: temperature, wind, precipitation and its product: fog and thunderstorm/nor’wester have been taken into consideration. The round the clock data of those elements have been used in the following form:
a. Daily maximum temperature (0C). b. Daily minimum temperature (0C). c. Daily/Monthly no of rainy days. d. Daily/Monthly total amount of rainfall (mm). e. Monthly frequency of thunderstorm/nor’wester. f. Time of occurrence of thunderstorm/nor’wester. j. Monthly frequency of fog. k. Time of cessation of fog. l. Monthly maximum wind direction and speed (kts). m. Monthly hailstorm days.
1. Temperature is how hot or cold the atmosphere is, how many degrees it is above or below freezing. Temperature is a very important factor in determining the weather, because it influences or controls other elements of the weather, such as precipitation, humidity, clouds and atmospheric pressure.
2. Humidity is the amount of water vapor in the atmosphere.
3. Precipitation is any product of the condensation of atmospheric water vapour that falls under gravity. The main forms of precipitation include drizzle, rain, sleet, snow, graupel and hail. It may also include fog and mist.
4. Atmospheric pressure (or air pressure) is the weight of air resting on the earth's surface. Pressure is shown on a weather map, often called a synoptic map, with lines called isobars.
5. Wind is the movement of air masses, especially on the Earth's surface.

CONFIDENTIAL
10
CONFIDENTIAL
Data Processing and Inference 9. Geographical location of Bangladesh is from 20°34˝ North Latitude to 26°38˝ North Latitude. From 88°01˝ East Longitude to 92°41˝ East Longitude. Location of Jessore airfield is 23° 11′ 1″ N, 89° 9′ 39″ E and Elevation is 20ft Above Mean Sea Level (AMSL). The weather is extreme compared to other parts of the country. However, last 30 years data (01 Jan 1984 to 31 Dec 2013) of different weather elements are analysed here. The simple averaging method has been used throughout study. The way of processing the raw data of each element have been discussed and the inferences obtained from that processing are shown graphically. For better and easy understanding, the average conditions of weather elements like different types of recorded temperature, no of Nor’wester, time of occurrence of Nor’wester, thunderstorm days, no of rainy days, amount of rainfall, no of foggy days, pentad normal of rainfall amount, rainy days, temperature (max and min) etc are presented as graph/histogram. Extreme Weather over Jessore
10. Some of the extreme weather elements recorded over Jessore air field within last 30 years (01 January 1984 to 31 December 2013) are listed below:
Ser No
Met Element Value Date/Time of Occurrence
1 Maximum temperature 43.20C 09 May 09
2 Minimum temperature 04.20C 09 JAN 13
3 Monthly highest mean maximum temperature
35.70C In April
4 Monthly lowest mean minimum temperature
10.70C In January
5 Maximum amount of rainfall in a day 255 mm 26 Sep 86
6 Maximum amount of rainfall in a month 856 mm Sep 04
7 Maximum amount of rainfall in a year 2477mm 2004
8 Maximum no of rainy days in a month 27 days Aug 06 & Jul 08
9 Maximum no of rainy days in a year 136 days 2013
10 Maximum no of thunderstorm in a month 23 days Sep 97
11 Maximum no of nor’wester in a month 16 days May 91
12 Maximum wind speed within 30 years 050/59kt 29 Nov 88

CONFIDENTIAL
11
CONFIDENTIAL
CHAPTER – II : PSYCHOTHERAPY OF TEMPERATURE General Concept 1. The Temperature data have been considered for maximum and minimum only. The average conditions for monthly and fortnightly maximum and minimum temperature have been obtained by using simple averaging method. The recorded highest maximum and lowest minimum temperature in different months within last 30 years have been used directly in the graph. The analysis of temperature has been carried out to have the idea about the average maximum/minimum temperature condition throughout the year and the extreme conditions ever recorded. At first the monthly values are shown, thereafter, the fortnightly values are shown for better understanding about the change of temperature in extreme summer and winter conditions. 2. Monthly Mean Maximum Temperature. For obtaining monthly mean maximum temperature, the max temperature of each day in a month is summarized and divided by no of days of that month. It is the monthly mean max temp of one month of one year. Thereafter, 30 years mean is obtained in the same way, which are added thereafter and divided by 30 for obtaining monthly mean maximum temperature. The obtained values are used in the graph.
25.4
29.0
33.4
35.7 35.5
33.832.6 32.7 28.2 32.6
30.4
26.9
23.0
25.0
27.0
29.0
31.0
33.0
35.0
37.0
39.0
MONTH
Fig-1 : Monthly mean maximum temperature for the period of 1984 to 2013
Tem
per
atu
re in
°c
3. Analysis. The above graph (Fig-1) reveals that the month April and May is having mean max temp 35°c - 36°c, March and June is having mean max temp 33°c - 34°c, July to October is having mean max temp 32°c - 33°c and other months mean max temp is 30°c or below. Therefore, the month April is the hottest month of the year and the next hottest month is the May. The max temp is almost similar in the months July - October and March. Thereafter, max temp starts falling and almost similar max temp prevail in the month February and November. The max temp in the month January is the lowest.

CONFIDENTIAL
12
CONFIDENTIAL
4. Monthly Highest Maximum Temperature. The highest max temp obtained within 30 years (01 Jan 84 to 31 Dec 13) for each month is used directly in the graph. This graph gives the idea about the recorded highest maximum temp within last 30 years.
31.2
37.8
41.0
42.8 43.2
40.8
37.2
39.9
37.0 37.4
34.4
31.2
30.031.032.033.034.035.036.037.038.039.040.041.042.043.044.0
MONTH
Fig-2 : Monthly highest maximum temperature for the period of 1984 to 2013
Tem
per
atu
re in
°c
5. Analysis. It is revealed from this graph (Fig-2) that highest max temp was obtained in the month of May (43.2ºc; 09 May 09) and the next max temp was obtained in April (42.8ºc; 27 April 09). The temp in July (37.2ºc) is less than the temp in August (39.9ºc); it may be due to the more no rainy days and cloudy sky in
July when maximum temp cannot rise. The temp in August (39.9⁰c) is more
because of break in monsoon, when cloud decreases and rainfall ceases. The temp in July (37.2ºc) is almost similar to the temp of the month of February (37.8ºc), September (37.0ºc) and October (37.4ºc). The max temp obtained in the month December and January (31.2ºc) was similar.

CONFIDENTIAL
13
CONFIDENTIAL
6. Monthly Mean Minimum Temperature. For obtaining monthly mean minimum temperature, the minimum temperature of each day in a month is summarized and divided by no of days of that month. It is the monthly mean minimum temp of one month of one year. Thereafter, 30 years mean is obtained in the same way, which are added and divided by 30 for obtaining monthly mean minimum temperature and the values are used in the graph.
Fig-3 : Monthly mean minimum temperature for the period of 1984 to 2013
26.0 25.3 26.0 25.4
23.0
17.6
12.6
10.7
14.7
19.7
23.625.0
9.010.011.012.013.014.015.016.017.018.019.020.021.022.023.024.025.026.027.028.0
MONTH
Tem
per
atu
re in
°c
7. Analysis. It is revealed from the graph (Fig-3) that the month May to September is having mean minimum temp within 25°c - 26°c, the month April & October is having the mean min temp within 23°c - 24ºc. The temp starts falling sharply from November till January and January is having mean minimum temp 10.7°c. Therefore, January is the coldest month of the year. The temp starts rising sharply from January till June. 8. Monthly Lowest Minimum Temperature. The lowest minimum temperature obtained within last 30 years (01 Jan 84 to 31 Dec 13) for each month are used directly in the graph.
20.621.5 21.2 21.0
16.4
10.0
6.04.2
7.4
10.8
14.7
18.6
4.0
6.0
8.0
10.0
12.0
14.0
16.0
18.0
20.0
22.0
MONTH
Fig-4 : Monthly lowest minimum temperature for the period of 1984 to 2013
Tem
pera
ture
in °
c
9. Analysis. It is obtained from this graph (Fig-4) that the lowest minimum
temp within last 30 years was recorded in the month of January (4.2⁰c on 09 Jan
13). The lowest temp in the month of June to September was almost similar (within 20.6ºc to 21.5ºc). The temp starts falling sharply from October till January and thereafter rising sharply till July.

CONFIDENTIAL
14
CONFIDENTIAL
10. Fortnightly Mean Max Temp. For obtaining fortnightly mean maximum temperature, the max temperature of each day in a fortnight is summarized and divided by no of days (14). It is the fortnightly mean max temp of one fortnight of one year. Thereafter, 30 years mean is obtained in the same way, which are added and divided by 30 for obtaining fortnightly mean maximum temperature and the values have been used in the graph.
23.9
24.9
27.9
30.2
32.4
34.3
35.436.2
35.6 35.334.4
3332.5 32.6 32.6 32.7 32.7 32.8 32.8
31.931
29.7
25
23.4
23
25
27
29
31
33
35
37
FORTNIGHTLY
Fig-5 : Fortnightly mean maximum temp for the period of 1984 to 2013
Tem
per
atu
re in
°c
11. Analysis. Though the monthly mean max temp graph (Fig-1) shows
that the temp in April is highest and value is 35.7⁰c but this graph (Fig-5) show that
the 2nd fortnight of April (16 April to 30 April) is having maximum average temp of
the year and the value is 36.2⁰c. Therefore, the 2nd fortnight of April (16 April to
30 April) is the hottest period of the year. The 2nd fortnight of December (16 Dec to 31 Dec) is having the lowest mean max temp (23.4ºc), thereafter it starts rising gradually till 30 April. From 01 January to 31 January the max temp rises by 1⁰c.
From 31 January to 31 March it increases with a rate of 2⁰c - 3⁰c per fortnight (14
days); thereafter it increases up to 30 April with a rate of 1⁰c - 2⁰c per fortnight. The
mean max temp starts falling slowly from 1st fortnight of May till 2nd fortnight of Jun and it remain almost similar (within 32ºc - 33ºc) till 1st fortnight of Oct (01 Oct to 15 Oct). Thereafter, mean max temp starts falling slowly till 2nd fortnight of November. In the 1st and 2nd fortnight of December, temp fall is sharp and the difference between min and max temp decreases that time. Therefore, people really fill cold after 30th November. During heat wave conditions, flying becomes restricted, people become sick due to heat stroke and human performance reduces due to sweating.

CONFIDENTIAL
15
CONFIDENTIAL
12. Fortnightly Mean Minimum Temp. For obtaining fortnightly mean minimum temperature, the minimum temperature of each day in a fortnight is summarized and divided by no of days (14). It is the fortnightly mean minimum temp of one fortnight of one year. Thereafter, 30 years mean is obtained in the same way, which are added and divided by 30 for obtaining fortnightly mean minimum temperature and the values have been used in the graph.
25.827.1
25.7 2626.9
25.9 25.7 25.224
22.1
19.3
16.1
13.4
10.9 10.411.5
13.6
15.8
18.1
21.422.8
24.6 24.625.5
10111213141516171819202122232425262728
FORTNIGHTLY
Fig-6 : Fortnightly mean minimum temp for the period of 1984 to 2013
Tem
per
atu
re in
°c
13. Analysis. It is revealed from this graph (Fig-6) that the 1st fortnight of January is the coldest period of the year with the mean temp 10.4°c. The mean minimum temp remain above 24ºc from 2nd fortnight of April to 1st fortnight of October. Thereafter, temp starts falling 2ºc - 3ºc per fortnight till 1st fortnight of January. The temp starts rising from 2nd fortnight of January till 1st fortnight of April at the rate of 2-3ºc per fortnight. Most of the cold wave occurs in the 1st fortnight of January. A cold wave can cause death and injury to livestock and wildlife. Exposure to cold mandates greater caloric intake for all animals, including humans. The belief that more deaths are caused by cold weather in comparison to hot weather is true as a result of cold, flu, pneumonia, etc.

CONFIDENTIAL
16
CONFIDENTIAL
14. Fortnightly Highest Max Temp. The highest maximum temp obtained within last 30 years (01 Jan 84 to 31 Dec 13) for each Fortnight have been used directly in the graph.
29.830.6
34.4
37.838.5
40.241
42.8 43.2
41.8 41.8
39
36.437.2
36.5 36.837.4 37 37.4
35.5
34.4 34.4
31 30.6
29303132333435363738394041424344
FORTNIGHTLY
Tem
per
atur
e in
°c
Fig-7 : Fortnightly highest maximum temp for the period of 1984 to 2013
15. Analysis. This graph (Fig-7) reveals that the highest maximum temp within last 30 years was obtained in the 1st fortnight of May and the lowest maximum temp was obtained in the 1st fortnight of January. The temp in 1st fortnight of July is less than 2nd fortnight of June and July. It may be due to more no of rainy days and cloudy sky in that period. 16. Fortnightly Lowest Minimum Temp. The lowest minimum temperature obtained within last 30 years (01 Jan 84 to 31 Dec 13) for each Fortnight have been used directly in the graph.
20
.6 22
.2
22
.5
21
.5
21
.2
21
.4 23
.4
21
20
.4
15
.8
13
.4
10
8.4
6
4.2 5
7.4
7.3
10
.8 13
.2 14
.7
18
.5
18
.6 20
3
6
9
12
15
18
21
24
FORTNIGHTLY
Fig-8 : Fortnightly lowest minimum temp for the period of 1984 to 2013
Tem
pera
ture
in °
c
17. Analysis. This graph shows that the lowest temp within last 30 years
obtained 4.2⁰c in the 1st fortnight of January. (Fig-8)

CONFIDENTIAL
17
CONFIDENTIAL
18. Monthly Average no of Days Having Temperature ≤ 10ºc. For
obtaining this value, the total no of days having temp ≤10⁰c in each month is
summarized for 30 years and then divided by 30.
12
10 0 0 0 0 0 0 0 0
4
0
2
4
6
8
10
12
14
MONTH
Num
ber o
f day
s
Fig-9: Monthly average no of days having temperature ≤ 10ºc for the period of 1984 to 2013
19. Analysis. This graph (Fig- 9) shows that the days having temp ≤10⁰c
are more in January. The average no of days are 4 days in December (max 13 days in 2007 & 2010), 12 in January (max 23 days in 2003) and 1.3 days in February (max 08 days in 2008). The study reveals that January is the coldest month of the year, then December. It is revealed from Fig-6 that the 1st fortnight of January (01
Jan to 15 Jan) is having average temp 10.4⁰c, which is the coldest period of the
year. Therefore, most cold wave occurs in January and it is mostly in the 1st fortnight
of January. The maximum no of moderate (6-8⁰c) to severe (4-6⁰c) cold wave
was found in 1st fortnight of January (12 cold wave), then in 2nd fortnight (09 cold wave); cold wave also found in 2nd fortnight of December (04 cold wave).
20. Monthly Average no of Days Having Temperature ≥380c. For obtaining this value, the total no of days having temp ≥38ºc in each month is summarized for 30 years and then divided by 30.
0 0
1
6
4
1
0 0 0 0 0 00
1
2
3
4
5
6
7
MONTH
Num
ber o
f day
s
Fig-10 : Monthly average no of days having temperature ≥ 38 0C for the period of 1984 to 2013
21. Analysis. This graph (Fig-10) shows that the days are 06 in April (max 20 days in 1992), 04 in May (Max 14 days in 2004), 0.8 day in March (max 06 days in 1995) and 1.4 days June (max 12 days in 2005). Therefore, it is revealed from the graph that, April is the hottest month of the year and then May. It is revealed from Fig-5 that the 2nd fortnight of April is having the highest average maximum temp
(36.2⁰c) of the year and 1st fortnight of May is the 2nd highest temp (35.6⁰c).
Therefore, most of the severe (temp 40-42⁰c) heat waves were found in the 2nd
fortnight of April (11 heat wave), then the 1st fortnight of May (05 heat wave); heat wave also found in the 1st fortnight of April (02 heat wave), 2nd fortnight of May (04 heat wave) and 1st fortnight of June (01 heat wave). Thus, Daily flying and public life would be affected by cold wave in January and heat wave in April and May.

CONFIDENTIAL
18
CONFIDENTIAL
CHAPTER – III : FOG INVESTIGATION General Concept 1. The data for monthly foggy days have been considered for the period from 01 Jan 84 to 31 Dec 13 (30 years). The duration of fog data have been considered for the period from 01Jan 93 to 31 Dec 12 (20 years). The monthly average cessation time of Fog has been obtained for the month November to March. As because, the foggy days in other months (Apr, Sep and Oct) are very less in number and short lived (ceases within 0800hrs).
2. Monthly Average no of Foggy Days. The total no of foggy days in each month is summarized for 30 years and divided by 30 for obtaining monthly average no of foggy days and these values are in the graph.
20
14
8
20 0 0 0 1
3
9
18
0
5
10
15
20
25
Fig-11 : Monthly average no of foggy days for the period of 1984 to 2013
Num
ber
of d
ays
3. Analysis. The study of this graph (Fig-11) reveals that fog starts in September; no of days increases gradually till January and no days decreases gradually from February to April. Maximum no of foggy days are in January; it is average 20 days. The average foggy days from September to April are 01, 03, 09, 18, 20, 14, 08 and 02 days respectively.

CONFIDENTIAL
19
CONFIDENTIAL
The Persistence of Fog in Different Months
4. Average Persistence of Fog in November. The values are obtained by averaging the cease time of foggy days in each month for last 20 years (1993 to 2012). The cease time has been rounded up in the next hour when the cease time passes 30 minutes of the hour; otherwise it is rounded up in the previous hour.
16.014.0
0.0 0.00.0
3.0
6.0
9.0
12.0
15.0
18.0
21.0
24.0
27.0
30.0
ENDING TIME OF FOG
No
of F
oggy
day
Fig-12 : Average end time of fog in November for the period of 1993 to 2012 5. Analysis. It is revealed from the study of the graph (Fig-12) that, the Fog ceased within 0800F for 16 days and 0900F for 14 days in November. It means 53% cases fog persists up to 0800F and 47% cases up to 0900F. The average foggy days in November was 09 days (from Fig-11). Therefore, in November, average 05 days fog persists up to 0800F and 04 days up to 0900F. Therefore, in November, most of the days flying would be started after 0800F.

CONFIDENTIAL
20
CONFIDENTIAL
6. Average Persistence of Fog in December. In December fog occurs average 18 days and it persists more time than November.
1.0
10.0
20.0
0.00.0
3.0
6.0
9.0
12.0
15.0
18.0
21.0
24.0
ENDING TIME OF FOG
No
of F
oggy
day
s
Fig-13 : Average end time of fog in December for the period of 1993 to 2012 7. The graph (Fig-13) shows that, the fog persists 20 days up to 1000F, 10 days up to 0900F and only one day up to 0800F within a month. It means, for 65% cases fog persists up to 1000F, for 32% cases up to 0900F and for 3% cases up to 0800F. The average foggy days in December was 18 days (from Fig-11). Therefore, in December, average 12 days fog persists up to 1000F, 5.75 days up to 0900F and only 0.25 days up to 0800F. Therefore, in December, flying would not be possible before 1000F. 8. Average Persistence of Fog in January. In January, average foggy days are 20 (Fig-11), which is the highest in the year and the persistence time also more than any other months.
0.0
12.0
15.0
4.0
0.0
2.0
4.0
6.0
8.0
10.0
12.0
14.0
ENDING TIME OF FOG
No
of F
oggy
day
Fig-14 : Average end time of fog in January for the period of 1993 to 2012 9. The graph (Fig-14) shows that the fog persists up to 0900F for 12 days, up to 1000F for 15 days and up to 1100F for 04 days in a month. It means, for 40% cases fog persists up to 0900F, for 50% cases up to 1000F and for 13% cases up to 1100F. The average foggy days in January was 20 days. Therefore, in January, average 08 days fog persists up to 0900F, 10 days up to 1000F and 02 days up to 1100F. In January, most of the days flying may be started after 1000F and some days after 1100F.
CONFIDENTIAL
21
CONFIDENTIAL
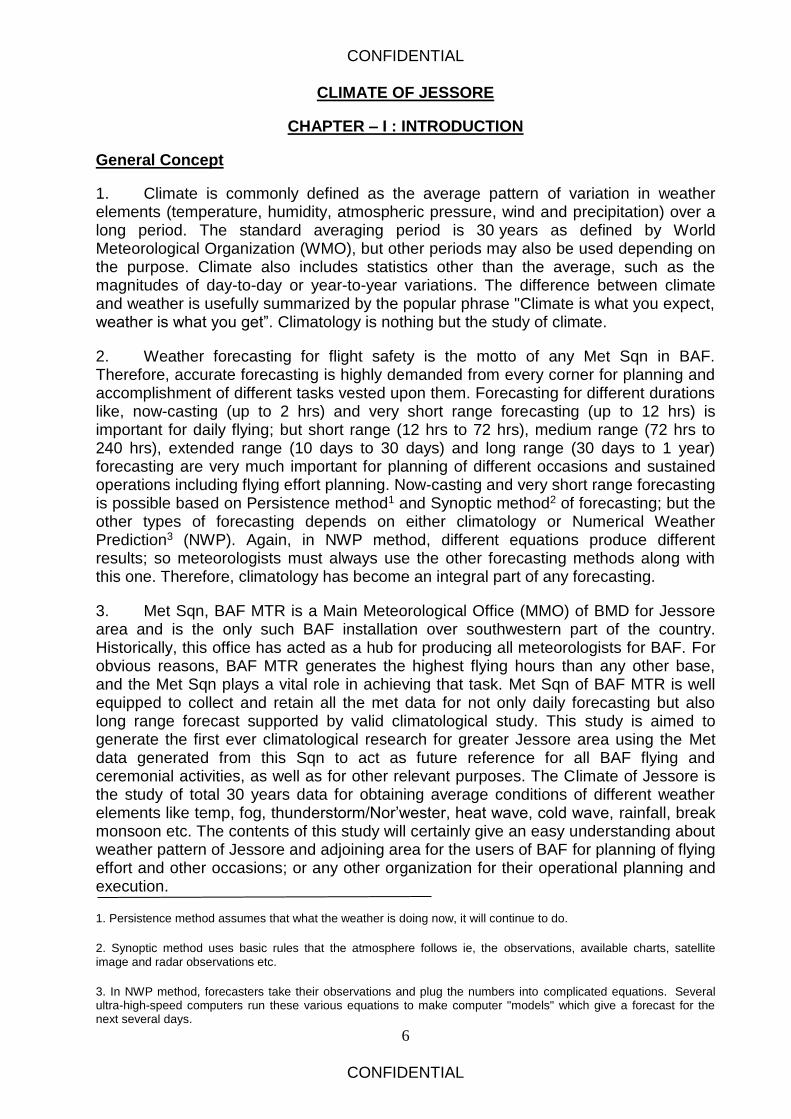
9. Average Persistence of Fog in February. In an average, 14 days fog occurs in February (Fig-11) and the persistence time also reduces than January.
0.0
23.0
5.0
0.00.0
2.0
4.0
6.0
8.0
10.0
12.0
14.0
16.0
18.0
20.0
22.0
24.0
ENDING TIME OF FOG
No
of F
oggy
day
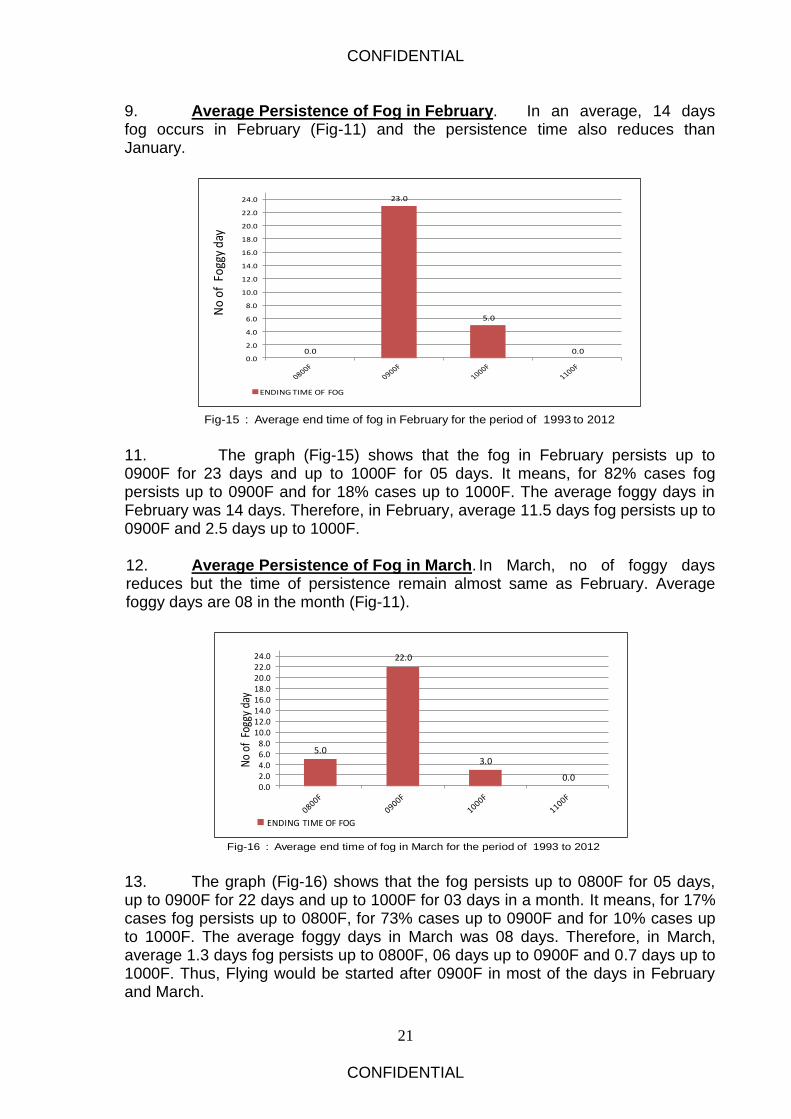
Fig-15 : Average end time of fog in February for the period of 1993 to 2012 11. The graph (Fig-15) shows that the fog in February persists up to 0900F for 23 days and up to 1000F for 05 days. It means, for 82% cases fog persists up to 0900F and for 18% cases up to 1000F. The average foggy days in February was 14 days. Therefore, in February, average 11.5 days fog persists up to 0900F and 2.5 days up to 1000F. 12. Average Persistence of Fog in March. In March, no of foggy days reduces but the time of persistence remain almost same as February. Average foggy days are 08 in the month (Fig-11).
5.0
22.0
3.0
0.00.02.04.06.08.0
10.012.014.016.018.020.022.024.0
ENDING TIME OF FOG
No
of F
oggy
day
Fig-16 : Average end time of fog in March for the period of 1993 to 2012 13. The graph (Fig-16) shows that the fog persists up to 0800F for 05 days, up to 0900F for 22 days and up to 1000F for 03 days in a month. It means, for 17% cases fog persists up to 0800F, for 73% cases up to 0900F and for 10% cases up to 1000F. The average foggy days in March was 08 days. Therefore, in March, average 1.3 days fog persists up to 0800F, 06 days up to 0900F and 0.7 days up to 1000F. Thus, Flying would be started after 0900F in most of the days in February and March.

CONFIDENTIAL
22
CONFIDENTIAL
CHAPTER – IV : THUNDERSTORM BEHAVIOUR General Concept 1. A thunderstorm is the most hazardous weather as far as flying is concern. It occurs almost all month of the year except Nov, Dec and Jan. The pre-monsoon thunderstorms occur from Feb to May (till monsoon set) are the most devastating and these thunderstorms are also called Nor’wester or Kalbaishakhy in Bengali. Thundestorms in other months though are more in no but those are monsoon or post-monsoon thunderstorms and not that much devastating. In this study, the pre-monsoon thunderstorms which had wind speed ≥22 Kts, only those have been considered as Nor’wester. The month-wise total no of Nor’wester occurred within last 30 years have been also shown in this chapter for understanding the frequency. During analysis, it was found that some nor’wester occurred with rain, some nor’wester occurred without rain and some cases considerable amount of rain occurred but wind speed did not cross 22 Kts; so it was not counted as nor’wester. Therefore, for finding out the susceptible days of nor’wester, amount of rain and no of rainy days in different months from “Precipitation Study” chapter have also been taken into consideration. The monthly and yearly maximum wind speed is also shown in this chapter, because the most destructive power of Nor’wester is the wind. The monthly or yearly maximum wind speed in pre-monsoon months is mostly associated with Nor’wester, but in the post-monsoon, it is mostly associated with Tropical Cyclone. The monthly maximum wind speed and direction for last 30 years is shown in table-1. 2. Monthly Average no of Thunderstorm Days. This value is obtained by averaging the no of thunderstorm days in each month for last 30 years.
0
2
4
8
13
1514
13
17
8
0 00
2
4
6
8
10
12
14
16
18
MONTH
Fig-17 : Monthly average no of thunderstorm days for the period of 1984 to 2013
Nu
mb
er
of
day
s
3. Analysis. It is revealed from this graph (Fig- 17) that the thunderstorm occurs from February to October and maximum no of Thunderstorm occurs in September (17 days). The average no of Thunderstorms occurs 02 days in February, 04 days in March, 08 days in April, 13 days in May, 15 days in June, 14 days in July, 13 days in August and 08 days in October. The thunderstorms occur in pre-monsoon season (February to May), most of them are associated with Nor’wester but some of them may not be Nor’wester.

CONFIDENTIAL
23
CONFIDENTIAL
4. Monthly Average No of Norwester. This value is obtained by averaging the no of Nor’wester (wind speed 22 kts or more) in each month for 30 years. Nor’wester occurs in pre-monsoon season only; thus, the month February to May is being taken into consideration.
0.5
2.2
5.5
8.5
0
1
2
3
4
5
6
7
8
9
MONTH
Fig-18 : Monthly average no of norwester for the period of 1984 to 2013
Num
ber
of d
ays
5. Analysis. The study reveals that the frequency of Nor’wester increases gradually with the progress of month from February to May. The average no of Nor’wester occurs 0.5 in February, 2.2 in March, 5.5 in April and 8.5 in May. The occurrences of Nor’wester continue till onset of Monsoon; thus, Nor’wester may occur in the 1st week of June also. (Fig- 18) 6. Time of Occurrence of Norwester. This graph shows the time of occurrence of total no of Nor’wester within last 30 years (01 Jan 84 to 31 Dec 13).
67
129
254
56
0
50
100
150
200
250
300
Fig-19 : Time of occurrence of norwester for the period of 1984 to 2013
Nu
mb
er
of o
ccu
rre
nce
Time of occurrence in UTC
7. Analysis. The study of this graph (Fig-19) reveals that the maximum no of Nor’wester (total 254) occurred within the time 1200Z - 1800Z, total 129 Nor’wester occurred within 0600Z - 1200Z, total 67 Nor’wester occurred within 0000Z - 0600Z and total 56 Nor’wester occurred within 1800Z - 2400Z. Therefore, about 50% Nor’wester occurred within 1200Z - 1800Z, 25% Nor’wester occurred within 0600Z - 1200Z, 14% Nor’wester occurred within 0000Z - 0600Z and only 11% Nor’wester occurred within 1800Z - 2400Z. Therefore, any outside activity including flying, driving or any public gathering/ceremony would be affected by nor'wester largely within 1200Z – 1800Z.

CONFIDENTIAL
24
CONFIDENTIAL
Month-wise Total No of Nor’wester 8. Total no of Norwester in February. This graph shows the total no of Nor’wester occurred in February within last 30 years. Total 18 Nor’wester occurred.
1
0
1
0 0 0
1 1 1
0
1
0
1
0 0 0
1 1
2
1 1
0 0
1
2
1
0
2
0
1
2
3
Fig- 20 : Total No of nor’wester ( wind speed ≥22 kts) for the period of 1984 to 2013
No
of
day
s
8a. Analysis. The months of February to May are known as the pre-monsoon season, as well as the Nor’wester period for Bangladesh. Therefore, the rainfall occurs within this period are mostly associated with Nor’wester. The study of this graph (Fig-20) doesn’t give any indication regarding vulnerability of nor’wester day. However, probability of occurrence of nor’wester on 19th, 25th and 28th February is more than any other day (probability <10%). 9. Total No of Norwester in March. This graph shows the total no of Nor’wester occurred in March within last 30 years. Total 68 Nor’wester occurred.
1
0 0 0 0 0
3
1
0
2
1
4
3
2
0
1
0
2 2 2
0
5 5 5
4 4
5
1
8
6
5
0
1
2
3
4
5
6
7
8
Fig-21: No of norwester ( wind speed ≥22 kts) in March for the period of 1984 to 2013
No
of
day
s
9a. Analysis. The frequency of nor’wester in March is 2.2. The study of this graph (Fig-21) reveals that the susceptible days for nor’wester may be 29th and 30th March, where the probability is 20% and 27% respectively. As the frequency of nor’wester is less in March, the maximum probable ( 20% and 27%) days have been considered as susceptible days.

CONFIDENTIAL
25
CONFIDENTIAL
10. Total No of Norwester Days in April. The graph shows the total no of Nor’wester occurred in April within last 30 years. Total 161 Nor’wester occurred.
5
3
6
5
3
4
1
6 6
4 4 4
7
3 3
4 4
2
3
6
5
10
9
6
7
11
4
10
10
6
0123456789
101112
Fig-22: No of norwester ( wind speed ≥22 kts) in April for the period of 1984 to 2013
No
of
day
s
10a. Analysis. The frequency of nor’wester in April is 5.5. The study of the graph (Fig-22) reveals that the susceptible days for nor’wester are 22nd, 23rd, 26th, 28th and 29th April and the probability is around 30%. 11. Total No of Nor’wester Days in May. This graph shows the total no of Nor’wester occurred in each year within last 30 years. Total 256 Nor’wester occurred in May.
8
10
13
8
12
9
10
10
8
10
7
5
12
7
11
5
8 8
9
8
7
5
8
11
8
9
5
6
7
6 6
123456789
1011121314
Fig-23 : No of norwester ( wind speed ≥22 kts) in May for the period of 1984 to 2013
No
of d
ays
11a. Analysis. The frequency of nor’ester in May was 8.5. The study of this graph (Fig-23) reveals that the susceptible days of nor’wester may be 2nd, 3rd, 5th, 7th, 8th, 10th, 13th, 15th and 24th May and the probability is 30% or more. However, the frequency of nor’wester increases gradually from February to May and the intensity decreases. Therefore, for finding out the susceptible days of nor’wester, amount of rain and no of rainy days in all these months from “Precipitation Study” chapter have also to be taken into consideration.

CONFIDENTIAL
26
CONFIDENTIAL
Maximum Wind Speed 12. Monthly Maximum Wind Speed. The maximum wind speeds found in each month within last 30 years have been used directly in this graph.
20
35
50 52 5055
34 33 3235
59
27
0
10
20
30
40
50
60
70
MONTH
Fig-24 : Monthly maximum wind speed for the period of 1984 to 2013
Win
d sp
eed
(kts
)
13. Analysis. It is revealed from the study of this graph (Fig-24) that the maximum wind speed within last 30 years was 59 Kts in November. As November is post-monsoon season, thus the wind speed was associated with Tropical Cyclone. The wind speeds in Mar to Jun are more than 50 Kts, which are associated with Nor’wester. 14. Yearly Maximum Wind Speed. This graph (Fig-25) shows the maximum wind speed found in each year within the period of 1984 to 2013. It is revealed that the maximum wind speed within last 30 years was found 59 Kts from Nov 1988 Cyclone.
45
55
40 4
5 48
48
38 40
50
44
43
40 42 4
5
36
46
39
37 4
0
52
42
35 37
44
33
59
41 4
6 50
50
0
10
20
30
40
50
60
70
Fig-25 : Yearly maximum wind speed for the period of 1984 to 2013
Win
d sp
eed
(kts
)

CONFIDENTIAL
27
CONFIDENTIAL
CHAPTER – V : PRICIPITATION STUDY General Concept 1. The rainfall data have been considered in the form of rainfall amount and no of rainy days for the period of 01 Jan 1984 to 31 Dec 2013. The data have been analyzed in different ways like monthly average rainfall amount and rainy days; pentad (five days) average rainfall amount and rainy days; and daily average rainfall amount and rainy days. The yearly total amount of rainfall and total no of rainy days within last 30 years have also been shown in this chapter. The pentad (five days) average rainfall is a world-wide used meteorological terminology for determining the establishment of rainy season, rainfall variability etc. Therefore, the pentad has been considered from the month April to October only as the monsoon season is from June to September for Bangladesh. The Daily rainfall data has been considered from the month February to October; because, the amount of rainfall and rainy days in other months (November to January) are not significant. Moreover, the rainfall from November to January is mostly associated with either Tropical Cyclone or western disturbances which have not been considered here.
CONFIDENTIAL
28
CONFIDENTIAL
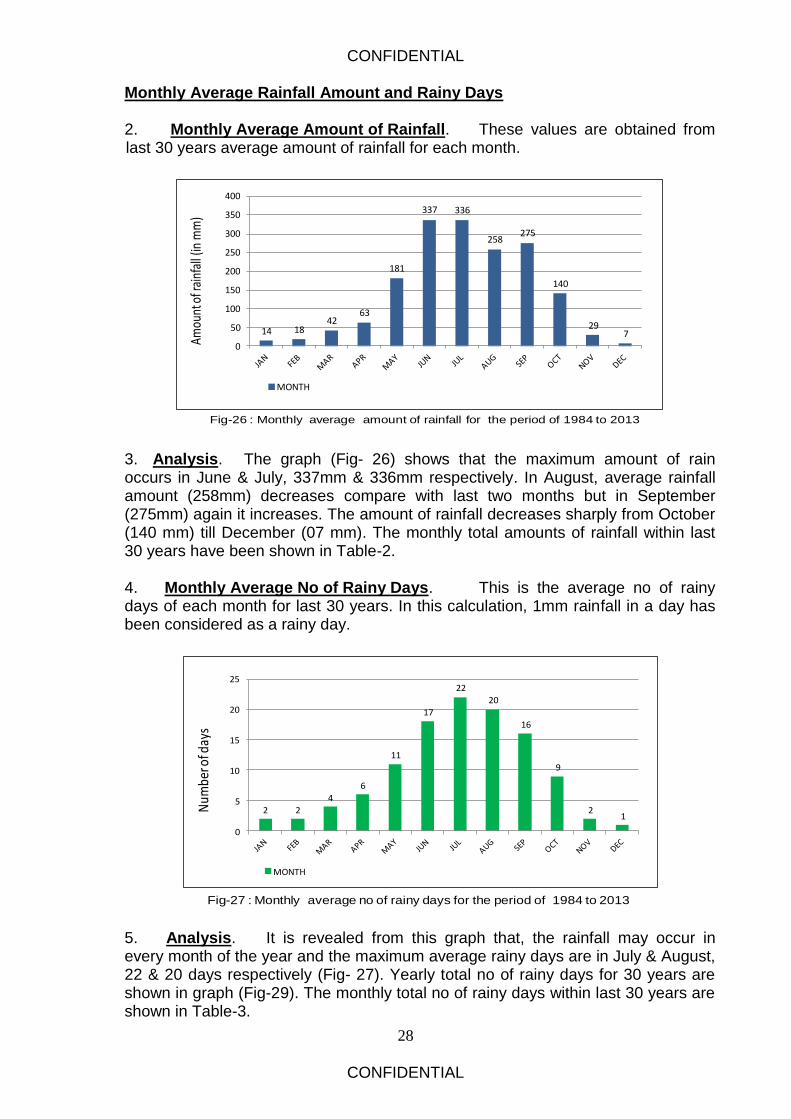
Monthly Average Rainfall Amount and Rainy Days 2. Monthly Average Amount of Rainfall. These values are obtained from last 30 years average amount of rainfall for each month.
14 1842
63
181
337 336
258275
140
297
0
50
100
150
200
250
300
350
400
MONTH
Fig-26 : Monthly average amount of rainfall for the period of 1984 to 2013
Amou
nt o
f rai
nfal
l (in
mm
)
3. Analysis. The graph (Fig- 26) shows that the maximum amount of rain occurs in June & July, 337mm & 336mm respectively. In August, average rainfall amount (258mm) decreases compare with last two months but in September (275mm) again it increases. The amount of rainfall decreases sharply from October (140 mm) till December (07 mm). The monthly total amounts of rainfall within last 30 years have been shown in Table-2. 4. Monthly Average No of Rainy Days. This is the average no of rainy days of each month for last 30 years. In this calculation, 1mm rainfall in a day has been considered as a rainy day.
2 2
4
6
11
17
22
20
16
9
21
0
5
10
15
20
25
MONTH
Fig-27 : Monthly average no of rainy days for the period of 1984 to 2013
Num
ber o
f day
s
5. Analysis. It is revealed from this graph that, the rainfall may occur in every month of the year and the maximum average rainy days are in July & August, 22 & 20 days respectively (Fig- 27). Yearly total no of rainy days for 30 years are shown in graph (Fig-29). The monthly total no of rainy days within last 30 years are shown in Table-3.

CONFIDENTIAL
29
CONFIDENTIAL
Yearly Amount of Rainfall and Rainy Days 6. Yearly Total Amount of Rainfall. The yearly total amount of rainfall for the period of Jan 1983 to Dec 2013 has been used directly in this graph.
16
68
13
05
13
73
13
71
16
62
18
94
21
91
17
60
16
00
24
77
19
17
21
25
16
42
18
88
15
86
14
88
15
38
17
57
13
97
12
69
17
16
13
32
16
22
16
48
13
25
19
57 20
59
20
73
14
37
20
30
1000
1300
1600
1900
2200
2500
2800
Fig-28 : Yearly total amount of rainfall for the period of 1984 to 2013
Am
ount
of
rain
fall
(in m
m)
7. Analysis. It is revealed from this graph that the variability in rainfall amount in each year is very high. The lowest amount of rain was found 1269mm in 1994 and the highest amount was found 2477mm in 2004. A consistency was found within the years 2010 to 2012 where rainfall was 1300mm to 1400mm but in 2013, again rainfall increased and it was similar to 2009. However, the yearly average amount of rainfall is 1703mm.
8. Yearly Total No of Rainy Days. The yearly total no of rainy days found in the period of Jan 1984 to Dec 2013 has been used in this graph. The rainfall amount 1mm within 24hrs has been considered as rainy day.
13
6
10
8
99
99 10
1
12
7
12
6
11
4
10
5 10
9
13
0
11
9 12
4
12
6
10
3
12
4
12
1
93
10
5
10
4
12
0
95
11
1
12
7
83
10
6
97
11
2
10
5
10
6
60
80
100
120
140
Fig-29 : Yearly total no of rainy days for the period of 1984 to 2013
Nu
mb
er o
f d
ays
9. Analysis. It is revealed from the study of this graph (Fig-29) that the variability in yearly total no of rainy days is also high but it is less than the variability in yearly amount of rainfall (Fig-28). The lowest no of rainy days was found 83 days in 1989 and the highest no of rainy days was found 136 days in 2013. The total no of rainy days was found within 100 days to 130 days in most of the year. However, the average no of rainy days was found 111.1 days.

CONFIDENTIAL
30
CONFIDENTIAL
Pentad Average Rainfall Amount and Rainy Days
10. The pentad average (five days mean) is obtained by averaging the data of each five days in a month for the period 01 Jan 1984 to 31 Dec 2013. The pentad is a world-wide used unit in dealing with meteorological phenomena, particularly in the tropics. The pentad analysis of precipitation is used for determining the onset and withdrawal dates of the rainy seasons, to represent temporal and spatial variations of precipitation in several regions over the globe, for examining the annual, inter-annual, and intra-seasonal variability of global precipitation etc. In this study, the panted average no of rainy days and rainfall amounts have been considered from April to October, as the rainfall in other months (Nov to March) are very less.
11. Pentad Average Rainy Days for April. The no of rainy days within each five days of April is added separately for 30 years and divided by 30 for obtaining these values.
0.5
1.2
0.50.6
1.2
1.6
0
0.2
0.4
0.6
0.8
1
1.2
1.4
1.6
1.8
Fig-30 : Pentad average no of rainy days in April for the period of 1984 to 2013
Num
ber o
f day
s
12. Pentad Average Rainfall of April. The amount of rainfall within each five days of April is added separately for 30 years and divided by 30 for obtaining these values.
5.6
8.4
5.94.6
16.2
19.1
0
5
10
15
20
25
Fig-31 : Pentad average rainfall of April for the period of 1984 to 2013
Am
ount
of
rain
fall
(in m
m)
13. Analysis. The graphs (Fig-30 & Fig-31) give the idea about the increase or decrease in no of rainy days and rainfall amount within each five days of the month. The graphs show that the 2nd pentad (06 Apr-10 Apr) has more than one day rainfall, whereas the 1st, 3rd and 4th pentad have less than one day rain; at the same time rainfall amount was also more in 2nd pentad. The rainfall increases towards the end of the month and it is more than one day. The rainfall amount also increased significantly (19.2mm) at the end period. Therefore, the 2nd, 5th and 6th pentad are vulnerable for occurrence of Nor’wester as April is pre-monsoon period.

CONFIDENTIAL
31
CONFIDENTIAL
14. Pentad Average Rainy Days for May. The no of rainy days within each five days of May is added separately for 30 years and divided by 30 for obtaining these values.
1.6
1.3
1.51.6
1.8
2.5
0
0.5
1
1.5
2
2.5
3
Fig-32 : Pentad average no of rainy days of May for the period of 1984 to 2013
Num
ber o
f day
s
15. Pentad Average Rainfall of May. The amount of rainfall within each five days of May is added separately for 30 years and divided by 30 for obtaining these values.
34.3
25.7 26.6
30.9
27.1
42
0
5
10
15
20
25
30
35
40
45
Amou
nt o
f rai
nfal
l (in
mm
)
Fig-33 : Pentad average rainfall of May for the period of 1984 to 2013 16. Analysis. The graph (Fig-32) shows that the rainy days in all pentad was more than one day. At the beginning, rainy day was 1.6 but at the 2nd pentad it decreased to 1.3 day. Thereafter, the rainy days increases gradually and at the last pentad it increased significantly; the value was 2.5 days. The rainfall amount (Fig-33) also shows almost same characteristics of rainy days. At the last pentad (26 May- 31May), the rainfall amount was 42mm which is significantly more than other pentads of the month. The month May is the pre-monsoon period and most of the rainfall is associated with Nor’wester. Therefore, it is revealed that the 1st, 4th and 6th pentads are vulnerable for occurrence of Nor’wester.

CONFIDENTIAL
32
CONFIDENTIAL
17. Pentad Average Rainy Days for June. The no of rainy days within each five days of June is added separately for 30 years and divided by 30 for obtaining these values.
2.11.9
2.9 2.8
3.5 3.5
0
0.5
1
1.5
2
2.5
3
3.5
4
Fig-34 : Pentad average no of rainy days of June for the period of 1984 to 2013
Num
ber
of d
ays
19. Pentad Average Rainfall of June. The amount of rainfall within each five days of June is added separately for 30 years and divided by 30 for obtaining these values.
47.5 45.8 48.2
60.3
71.2
56.8
0
10
20
30
40
50
60
70
80
Am
ount
of
rain
fall
(in
mm
)
Fig-35 : Pentad average rainfall of Jun for the period of 1984 to 2013 20. Analysis. The graph (Fig-34) shows that the 1st and 2nd pentad have 2.1 and 1.9 day rain; thereafter the rainy days has increased gradually up to 3.5 days at the end. The graph (Fig-35) shows that rainfall amount in the 1st, 2nd and 3rd pentad are almost similar, thereafter increased gradually. The highest amount of rain was found in the 5th pentad (21 Jun - 25 Jun) 71.2mm. At the last pentad, rainfall amount has decreased up to 56.8mm. The 5th pentad (21 Jun – 25 Jun) and 6th pentad (26 Jun – 30 Jun) have 3.5 days rain each and amount of rainfall 71.2mm & 56.8mm respectively. Therefore, these two pentads are susceptible for mostly cloudy and continuous rainy days.

CONFIDENTIAL
33
CONFIDENTIAL
21. Pentad Average Rainy Days for July. The no of rainy days within each five days of July is added separately for 30 years and divided by 30 for obtaining these values.
3.6
3.23
3.2 3.3
4.1
0
0.5
1
1.5
2
2.5
3
3.5
4
4.5
Fig-36 : Pentad average no of rainy days of July for the period of 1994 to 2013
Num
ber
of d
ays
22. Pentad Average Amount of Rainfall for July. The amount of rainfall within each five days of July is added separately for 30 years and divided by 30 for obtaining these values.
70.7
45.5
54.4
41.2
48.2
65.4
0
10
20
30
40
50
60
70
80
Am
ount
of r
ainf
all (
in m
m)
Fig-37 : Pentad average rainfall of July for the period of 1984 to 2013 23. Analysis. The graph (Fig-36) shows that, throughout the month rain was 3 days or more in each pentad. The 3rd pentad has 3 days rain, which is less in comparison with other pentads of the month. At the 1st and last pentad, rainy days were 3.6 and 4.1 respectively. The next graph (Fig-37) shows that the highest amount of rain (70.7mm) was in the 1st pentad and the second highest rainfall (65.4mm) was in the last pentad. Therefore, the 1st and last pentads are susceptible for continuous rainy days when human daily activities are hampered. The minimum rainfall in the month (41.2mm) was in the 4th pentad. Therefore, from these two graphs (Fig-36 & Fig-37), it reveals that the 2nd, 3rd and 4th pentad are susceptible for one or two break in monsoon.

CONFIDENTIAL
34
CONFIDENTIAL
24. Pentad Average Rainy Days for August. The no of rainy days within each five days of August is added separately for 30 years and divided by 30 for obtaining these values.
3.7
3.1
3.5
3.2
2.9
3.5
0
0.5
1
1.5
2
2.5
3
3.5
4
Fig-38 : Pentad average no of rainy days of August for the period of 1984 to 2013
Num
ber o
f day
s
25. Pentad Average Amount of Rainfall for August. The amount of rainfall within each five days of August is added separately for 30 years and divided by 30 for obtaining these values.
51.3
35.5
48.7
39.235.4
45.9
0
10
20
30
40
50
60
Am
ount
of r
ainf
all (
in m
m)
Fig-39 : Pentad average rainfall of August for the period of 1984 to 2013 26. Analysis. The graph (Fig-38) shows that the 1st pentad (01 Aug – 05 Aug) has maximum rainy days (3.7) and in the 2nd pentad it has reduced to 3.1 days. In the 3rd and 4th pentad it became 3.5 and 3.2 days respectively, but in 5th pentad it reduced to 2.9 days. Again, it increased to 3.5 days at the end. The next graph (Fig-39) shows that the maximum amount of rainfall (51.3mm) was in the 1st pentad (01 Aug – 05 Aug) and in the 2nd pentad it reduced to 35.5mm. Again it increased in 3rd pentad (48.7mm) and reduced in 5th pentad (35.4mm). Therefore, it is revealed from the graphs that the 2nd (06 Aug – 10 Aug) and 5th (21 Aug – 25 Aug) pentads are susceptible for break monsoon. It is also revealed that the 1st, 3rd and last pentads are susceptible for continuous rainy days with mostly cloudy sky.

CONFIDENTIAL
35
CONFIDENTIAL
27. Pentad Average Rainy Days for September. The no of rainy days within each five days of September is added separately for 30 years and divided by 30 for obtaining these values.
3.1 3
2.7
2.42.6
2.8
0
0.5
1
1.5
2
2.5
3
3.5
Fig-40 : Pentad average no of rainy days of September for the period of 1984 to 2013
Num
ber o
f day
s
28. Pentad Average Rainfall for September The amount of rainfall within each five days of September is added separately for 30 years and divided by 30 for obtaining these values.
40.8 42.6
50.6 48.2
36.341.4
0
10
20
30
40
50
60
Am
ount
of r
ainf
all (
in m
m)
Fig-41 : Pentad average rainfall of September for the period of 1984 to 2013 29. Analysis. The graph (Fig-40) shows that the maximum no of rainy days (3.1) was in the 1st pentad (01 Sep – 05 Sep) and gradually the no of days decreased to 2.4 days in the 4th pentad (16 Sep – 20 Sep). Again the days increased to 2.8 days at the end. The next graph (Fig-41) shows that the 1st pentad (01 Sep – 05 Sep) has 40.8mm rainfall which increased gradually and maximum rainfall (50.6mm) was in 3rd pentad (11 Sep – 15 Sep). Thereafter, the amount of rainfall decreased and minimum rainfall (36.3mm) was in the 5th pentad (21 Sep – 25 Sep). Therefore, it is revealed from the graphs (Fig-40 & Fig-41) that the 5th pentad (21 Sep – 25 Sep) is susceptible for break in monsoon.

CONFIDENTIAL
36
CONFIDENTIAL
30. Pentad Average Rainy Days for October. The no of rainy days within each five days of October is added separately for 30 years and divided by 30 for obtaining these values.
2.3
1.7
1.4 1.4
0.70.6
0
0.5
1
1.5
2
2.5
Fig-42 : Pentad average no of rainy days of October for the period of 1984 to 2013
Nu
mb
er o
f d
ays
31. Pentad Average Rainfall of October. The amount of rainfall within each five days of October is added separately for 30 years and divided by 30 for obtaining these values.
36.4 36.1
14.8
20.2
10.1
19
0
5
10
15
20
25
30
35
40
Am
ou
nt
of
rain
fall
(in
mm
)
Fig-43 : Pentad average rainfall of October for the period of 1984 to 2013 32. Analysis. The graph (Fig-42) shows that the 1st pentad (01 Oct – 05 Oct) has maximum no of rainy days (2.3 days) and thereafter it decreases gradually up to 0.6 days at the end period of the month. The next graph Fig-43) shows that the 1st and 2nd pentad have 36.4mm and 36.1mm rainfall respectively, thereafter the rainfall decreased significantly which indicates the withdrawal of monsoon.
CONFIDENTIAL
37
CONFIDENTIAL
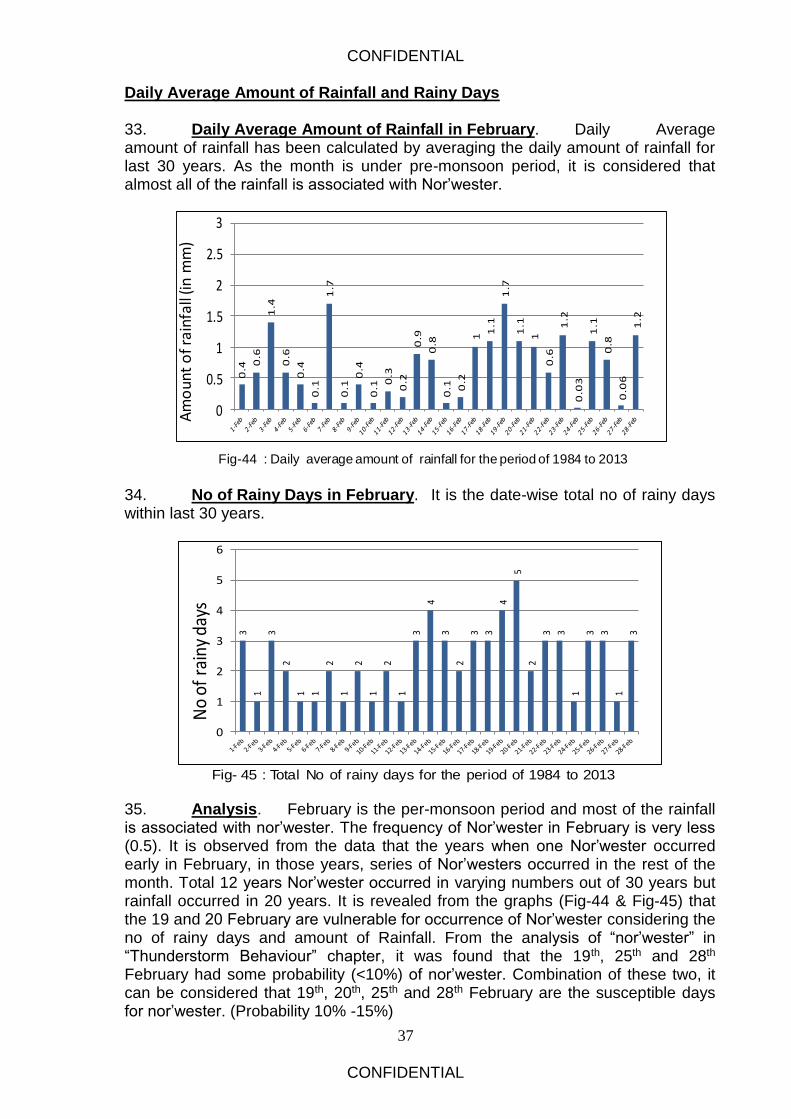
Daily Average Amount of Rainfall and Rainy Days 33. Daily Average Amount of Rainfall in February. Daily Average amount of rainfall has been calculated by averaging the daily amount of rainfall for last 30 years. As the month is under pre-monsoon period, it is considered that almost all of the rainfall is associated with Nor’wester.
0.4
0.6
1.4
0.6
0.4
0.1
1.7
0.1
0.4
0.1
0.3
0.2
0.9
0.8
0.1 0
.2
1
1.1
1.7
1.1
1
0.6
1.2
0.0
3
1.1
0.8
0.0
6
1.2
0
0.5
1
1.5
2
2.5
3
Fig-44 : Daily average amount of rainfall for the period of 1984 to 2013
Am
oun
t o
f rai
nfal
l (in
mm
)
34. No of Rainy Days in February. It is the date-wise total no of rainy days within last 30 years.
3
1
3
2
1 1
2
1
2
1
2
1
3
4
3
2
3 3
4
5
2
3 3
1
3 3
1
3
0
1
2
3
4
5
6
Fig- 45 : Total No of rainy days for the period of 1984 to 2013
No
of r
ainy
day
s
35. Analysis. February is the per-monsoon period and most of the rainfall is associated with nor’wester. The frequency of Nor’wester in February is very less (0.5). It is observed from the data that the years when one Nor’wester occurred early in February, in those years, series of Nor’westers occurred in the rest of the month. Total 12 years Nor’wester occurred in varying numbers out of 30 years but rainfall occurred in 20 years. It is revealed from the graphs (Fig-44 & Fig-45) that the 19 and 20 February are vulnerable for occurrence of Nor’wester considering the no of rainy days and amount of Rainfall. From the analysis of “nor’wester” in “Thunderstorm Behaviour” chapter, it was found that the 19th, 25th and 28th February had some probability (<10%) of nor’wester. Combination of these two, it can be considered that 19th, 20th, 25th and 28th February are the susceptible days for nor’wester. (Probability 10% -15%)

CONFIDENTIAL
38
CONFIDENTIAL
36. Daily Average Amount of Rainfall in March. Daily Average rainfall amount has been calculated by averaging the daily amount of rainfall for 30 years. The month March is under pre-monsoon season; therefore, it is considered that the rainfall is associated with Nor’wester.
0.8
0.4
0.2 0
.4
0.1
0.1
1.2
0.1 0
.3
0.3 0
.5 0.6
2.2
1.1
0.4
1.2
0.3 0.4
1.2
0.6
0
2
5.4
6
3
2.8
2.8
0.6
2.2
3.6
0.3
0
1
2
3
4
5
6
7
Fig-46 : Daily average amount of rainfall for the period of 1984 to 2013
Am
ou
nt
of
rain
fall
(in
mm
)
37. No of Rainy Days in March. It is the date-wise total no of rainy days within last 30 years.
4
3
2 2 2 2 2
3
1
2
5
4
6
3
2 2
1
3 3
2
0
6
5
8
3
5
8
2
9
7
3
0
1
2
3
4
5
6
7
8
9
10
Fig- 47 : Total No of rainy days for the period of 1984 to 2013
No
of
rain
y d
ays
38. Analysis. The average frequency of Nor’wester in March is 2.2 (Fig-18). Total 23 years Nor’wester occurred in varying numbers out of 30 years. It is revealed from the study of the graphs (Fig-46 & Fig-47) that the average amount of rainfall and rainy days have increased significantly from 22 March. Therefore, the Nor’wester mainly starts from 22 March, though few have occurred early also. The susceptible dates for occurrence of Nor’wester can be considered as 23rd, 24th, 27th, 29th and 30th March, after considering the average rainfall amount and no of total rainy days. From the analysis of “nor’wester” in “Thunderstorm Behaviour” chapter, the susceptible days were found 29th and 30th March, which commensurate with this analysis. Combination of these two, the susceptible days can be considered as 23rd, 24th, 27th, 29th and 30th March (probability 20% - 30%).
CONFIDENTIAL
39
CONFIDENTIAL
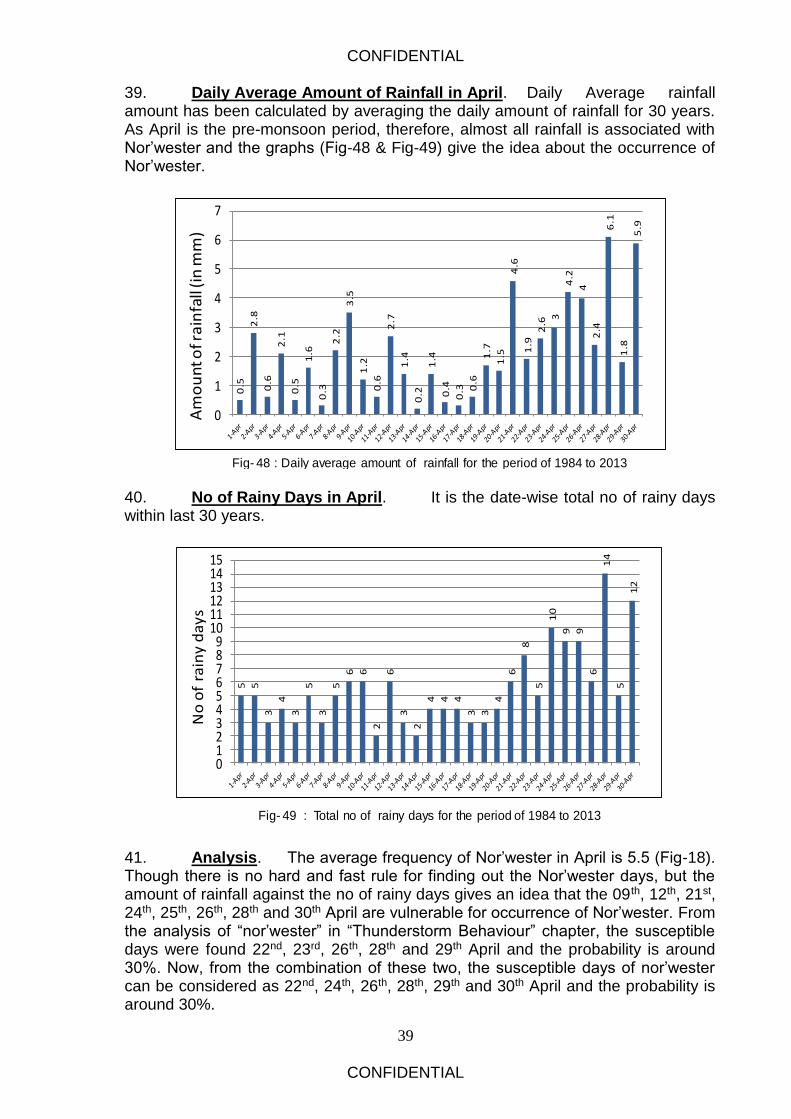
39. Daily Average Amount of Rainfall in April. Daily Average rainfall amount has been calculated by averaging the daily amount of rainfall for 30 years. As April is the pre-monsoon period, therefore, almost all rainfall is associated with Nor’wester and the graphs (Fig-48 & Fig-49) give the idea about the occurrence of Nor’wester.
0.5
2.8
0.6
2.1
0.5
1.6
0.3
2.2
3.5
1.2
0.6
2.7
1.4
0.2
1.4
0.4
0.3 0
.6
1.7
1.5
4.6
1.9
2.6
3
4.2
4
2.4
6.1
1.8
5.9
0
1
2
3
4
5
6
7
Fig- 48 : Daily average amount of rainfall for the period of 1984 to 2013
Am
ou
nt o
f ra
infa
ll (i
n m
m)
40. No of Rainy Days in April. It is the date-wise total no of rainy days within last 30 years.
5 5
3
4
3
5
3
5
6 6
2
6
3
2
4 4 4
3 3
4
6
8
5
10
9 9
6
14
5
12
0123456789
101112131415
Fig- 49 : Total no of rainy days for the period of 1984 to 2013
No
of
rain
y d
ay
s
41. Analysis. The average frequency of Nor’wester in April is 5.5 (Fig-18). Though there is no hard and fast rule for finding out the Nor’wester days, but the amount of rainfall against the no of rainy days gives an idea that the 09th, 12th, 21st, 24th, 25th, 26th, 28th and 30th April are vulnerable for occurrence of Nor’wester. From the analysis of “nor’wester” in “Thunderstorm Behaviour” chapter, the susceptible days were found 22nd, 23rd, 26th, 28th and 29th April and the probability is around 30%. Now, from the combination of these two, the susceptible days of nor’wester can be considered as 22nd, 24th, 26th, 28th, 29th and 30th April and the probability is around 30%.

CONFIDENTIAL
40
CONFIDENTIAL
42. Daily Average Amount of Rainfall for May. Daily Average rainfall amount of May has been calculated by averaging the daily amount of rainfall for 30 years. The month May is under pre-monsoon season and the rainfall is mostly from Nor’wester.
3.7
3.4
4.5 4
.8
7.7
4.7
5.4
4.2
2.9
7.3
3.1
6.6 6.8
3.5
6 5.9
8.5
4.1
6.4
5.1
6.4
2.2
3.4
8.2
8.1
9.6 1
0
5.7
6.6
7.7
5.1
1
2
3
4
5
6
7
8
9
10
11
Fig- 50 : Daily average amount of rainfall for the period of 1984 to 2013
Am
ou
nt o
f ra
infa
ll (i
n m
m)
43. No of Rainy Days in May. The date-wise total no of rainy days within last 30 years have been used directly in this graph.
9
11
14
9
8 8
9
7
10
10
9 9
10
9
13
8
11
7
10
14
9
13
8
12
14
15
15
12
13
11
12
123456789
1011121314151617
Fig-51 : Total no of rainy days for the period of 1984 to 2013
No
of r
ain
y d
ays
44. Analysis. The frequency of Norwester is highest (average 8.5) in the month of May. The graphs (Fig-50 & Fig-51) show the average amount of rainfall and average no of rainy days respectively within last 30 years (1984 to 2013). The rainy days all are not Nor’wester days. Considering the no of rainy days and average amount of rainfall, it is revealed from the study of the graphs that the 12th, 13th, 17th, 20th, 24th, 25th, 26th, 27th, 28th and 29th May are vulnerable for occurrence of Nor’wester. From the analysis of “nor’wester” in “Thunderstorm Behaviour” chapter, the susceptible days were found 2nd, 3rd, 5th, 7th, 8th, 10th, 13th, 15th and 24th May and the probability was ≥30%. Now, from the combination of these two, the susceptible days of nor’wester can be considered as 3rd, 5th, 10th, 13th, 15th, 17th, 24th, 25th, 26th and 27th April (probability is 30% - 40%).

CONFIDENTIAL
41
CONFIDENTIAL
45. Daily Average Amount of Rainfall for June. Daily Average rainfall amount of June has been calculated by averaging the daily amount of rainfall for 30 years.
5.2 5.4
9.9
11
.2
20
.2
11
.8
9.4
2.7
8.1
9.3
8.5
10
.6
8.9
8.9
13
.5
8.3
15
.8
8.1
11
.7
17
.4
13
17
.8
8.5
11
.3 12
.9
8.8 9
.4
12
.4 13
14
.7
123456789
101112131415161718192021
Fig-52 : Daily average amount of rainfall for the period of 1984 to 2013
Am
ount
of r
ainf
all (
in m
m)
46. No of Rainy Days in June. The day-wise total no of rainy days of June within last 30 years have been used directly in this graph.
12
12
17
16
14
14 1
5
14
10
14
14
19
16 1
7 18
18
17
15
18
17
21
23
19
21
18
23
17
20
23
17
1
3
5
7
9
11
13
15
17
19
21
23
25
Fig-53 : Total no of rainy days for the period of 1984 to 2013
No
of r
ainy
day
s
47. Analysis. Nor’wester occurs in the 1st and 2nd week of June also till monsoon is set over the country. After onset of monsoon, rainy days increases significantly. The graphs (Fig-52 & Fig-53) show the significant change of rainy days from 12 June onward and it may be the onset date of monsoon over Jessore area. After onset of monsoon, the 17th, 20th, 22nd, 25th and 29th June are susceptible for continuous rainy days, when normal activities may be hampered due to rain. The graphs also reveal that the 04th, 05th, 07th, 10th and 11th June are vulnerable for occurrence of Nor’wester before onset of monsoon. On 05th Jun, average rainfall amount is very high (20.2mm); because, an unusual amount of rainfall (242mm) occurred on 05 Jun 1985.

CONFIDENTIAL
42
CONFIDENTIAL
48. Daily Average Amount of Rainfall for July. Daily Average rainfall amount of July has been calculated by averaging the daily amount of rainfall for 30 years and used in the graph.
13
.61
3.1
18
.11
4.1
14
.29
.51
6.2
8.9 9.2
9.1
15
.51
0.6
8.2
10
.29
.76
.23
.97
.91
1.9 12
.91
9.4
12
.11
1.5 1
2.7
5.1
9.6
12
.61
0.5
13
.88
.31
0.1
123456789
1011121314151617181920
Fig-54 : Daily average amount of rainfall for the period of 1984 to 2013
Am
ou
nt
of
rain
fall
(in m
m)
49. No of Rainy Days in July. The day-wise total no of rainy days of July within last 30 years have been used directly in the graph.
18
22 2
3 24
22
20
23
17
17
21
21
21
15
19
22
17
20
20
22
22
20
23
21 2
21
72
0 21
23
22
21 2
2
13579
1113151719212325
Fig-55 : Total no of rainy days for the period of 1984 to 2013
No
of
rain
y d
ays
50. Analysis. The month July has the highest average no of rainy days (22 days). The graphs (Fig-54 & Fig-55) reveal that the 04, 15, 19, 21, 23, 28 and 29 July are susceptible for continuous rainy days with overcast sky when normal activities are hampered. Here, the days having rainfall ≥5mm for ≥16 days out of 30 days have considered susceptible for continuous rain. It also reveals that the 08 Jul - 09 Jul are susceptible for one break and 16 Jul - 17 Jul are susceptible for another break in monsoon.

CONFIDENTIAL
43
CONFIDENTIAL
51. Daily Average Amount of Rainfall for August. The daily average amounts of rainfall are obtained by averaging the daily amount of rainfall for last 30 years and are used in the graph.
10
9.6
13
.8
8.3
7.9
10
.1
4.8
8.8
7.9
5.1
7.2
8.4 8
.8
12
.3
8.1
5.8
6.9
6.3
12
.9
10
.1
10
.1
5.3
6.7
4.9
10
.4
8.3 8
.8 9.1
6.6
8.1
6.4
123456789
101112131415
Fig-56 : Daily average amount of rainfall for the period of 1984 to 2013
Am
ou
nt o
f ra
infa
ll (i
n m
m)
52. No of Rainy Days in August. The day-wise total no of rainy days in August within last 30 years have been used directly in the graph.
24
20
23
21
25
19
17
24
21
19
22
19
21
24
23
19
15
19
22
22
20
20
18
14
20
16 1
7
20
18 1
9
15
1
3
5
7
9
11
13
15
17
19
21
23
25
Fig- 57 : Total no of rainy days for the period of 1984 to 2013
No
of
rain
y d
ays
53. Analysis. The average no of rainy days in August is 20 days. It is revealed from the graphs (Fig-56 & Fig-57) that 06 Aug – 07 Aug, 16 Aug – 18 Aug and 23 Aug – 24 Aug are susceptible for break in monsoon. Here, the periods having ≤10 days rainfall out 30 days have considered susceptible for break. It is also revealed that the 02, 14, 15, 19 and 28 August are susceptible for continuous rainy days with cloudy to overcast sky. Here, the days having rainfall ≥5mm for ≥16 days out of 30 days have considered susceptible for continuous rain. The continuous rainy days stop all outdoor activities including flying.

CONFIDENTIAL
44
CONFIDENTIAL
54. Daily Average Amount of Rainfall for September. The daily average amounts of rainfall are obtained by averaging the daily rainfall of September for last 30 years and are used in the graph.
7.2
4.6
5.7
10
.9
8.8
7.9
6
10
.4
9.5
9.2
10
.6
6.9
13
.3
9.1
12
.1
10
.8
6.4
8.4
10
.5
8.6
5.6
8.3
9.9
11
.7
7.2
16
.1
14
.7
7
8.7
2.8
123456789
1011121314151617
Fig-58 : Daily average amount of rainfall for the period of 1984 to 2013
Am
ou
nt
of
rain
fall
(in
mm
)
55. No of Rainy Days for September. The day-wise total no of rainy days in September within last 30 years have been used directly in the graph.
19
17 1
8
20
20
17
16
19 2
0
19
21
17
17
17
16
19
17
10
14
16
16
15
18
14
17
13
13 1
4
13
8
1
3
5
7
9
11
13
15
17
19
21
23
25
Fig- 59 : Total no of rainy days for the period of 1984 to 2013
No
of
rain
y d
ays
56. Analysis. The graphs (Fig-58 & Fig-59) reveal that the 01 Sep – 02 Sep, 06 Sep – 07 Sep, 17 Sep – 21 Sep and 28 Sep – 30 Sep are susceptible for break monsoon. Here, the periods having ≤10 days rainfall out 30 days have considered susceptible for break. On the other hand, the 05, 09 and 11 September are susceptible for continuous rainy days. Here, the days having rainfall ≥5mm for ≥14 days out of 30 days have considered susceptible for continuous rain. On 13 and 26 September, average rainfall amount is high (13.3mm and 16.1mm respectively); because, unusual amount of rainfall (215mm and 255mm) occurred on 13 Sep 04 and 26 Sep 86. During the break monsoon periods, rainfall ceases and cloud decreases. As a result, these periods could be utilized for compensating the loss occurred in the days when rainfall was continuous.

CONFIDENTIAL
45
CONFIDENTIAL
57. Daily Average Amount of Rainfall for October. The daily average amounts of rainfall are obtained by averaging the daily rainfall of October for last 30 years and are used in the graph.
6.9
6.8
6.3
8
6.7 7
.1 7.8
12
.5
7
2.2
1.8
1.3
3.7
6
3.7
3.3
3.2 3
.9
5.9
5.2
2.6
1.7
3.5
1.8 2
.5
1.4
6.1
5 5
1.1
0.6
0123456789
1011121314
Fig-60 : Daily average amount of rainfall for the period of 1984 to 2013
Am
ou
nt
of
rain
fall
(in
mm
)
58. No of Rainy Days in October. The day-wise total no of rainy days in October within last 30 years have been used directly in the graph.
10
14
16
18
11
11
8
14
12
8 8
6
11
12
10
8
10
11
6
9
7
8
3 3 3
4
3
4
2
5
123456789
101112131415161718
Fig-61 : Total no of rainy days for the period of 1984 to 2013
No
of
rain
y d
ays
59. Analysis. The graphs (Fig-60 & Fig-61) shows that the rainfall amount and rainy days has reduced significantly on 10th October onward and it may be due to the withdrawal of monsoon. Therefore, 10th October may be the withdrawal date of monsoon over Jessore area.

CONFIDENTIAL
46
CONFIDENTIAL
Tables for Monthly Max Wind, Total Amount of Rainfall and Rainy Days
60. Monthly Maximum Wind Direction & Speed (In kts). Monthly maximum Wind Direction & Speed (In Kts) are shown in Table-1:
Jan Feb Mar Apr May Jun Jul Aug Sep Oct Nov Dec
1984 360/13 340/18 220/22 200/50 090/50 220/32 130/34 090/25 360/26 090/23 020/18 220/18
1985 340/10 340/10 180/30 160/50 340/35 290/27 - - 090/17 240/26 040/10 340/12
1986 360/10 360/12 220/26 230/46 340/36 310/32 200/26 090/24 090/32 230/30 040/30 360/12
1987 020/13 340/20 230/33 180/33 360/41 180/21 230/22 020/32 200/22 070/19 050/13 180/18
1988 020/12 250/18 310/42 270/36 200/34 - 160/27 050/24 230/27 160/22 050/59 360/11
1989 360/12 230/22 310/28 220/30 160/33 040/33 230/25 150/22 120/23 120/23 360/10 050/14
1990 200/16 360/21 200/44 030/40 020/42 050/32 110/24 090/29 180/24 080/20 310/28 080/27
1991 360/13 360/33 020/37 340/36 350/44 350/30 270/26 130/33 210/24 110/20 110/10 020/18
1992 340/18 350/28 280/20 230/35 240/33 160/26 180/30 100/24 180/22 050/18 010/10 320/08
1993 180/12 130/21 250/34 340/41 340/40 350/25 310/25 190/20 200/24 190/20 180/12 020/08
1994 360/20 020/20 200/31 360/52 360/42 360/32 150/20 110/27 040/25 180/19 050/12 360/09
1995 030/17 230/18 270/27 290/30 130/24 030/40 130/21 090/20 140/24 130/24 090/21 330/20
1996 360/12 310/30 320/20 320/32 320/37 190/30 180/21 030/18 360/20 060/23 130/23 330/09
1997 270/11 340/17 270/36 230/39 330/36 330/32 240/21 120/30 350/20 270/09 030/12 340/13
1998 350/10 340/20 270/28 360/46 360/33 330/25 140/21 180/13 240/24 160/21 310/27 360/07
1999 350/08 360/20 220/18 060/36 190/36 100/25 250/20 080/21 120/25 130/20 160/18 030/09
2000 090/18 010/21 290/25 290/45 260/42 120/23 190/19 190/28 190/30 020/35 360/08 010/08
2001 280/11 280/30 260/37 270/42 350/40 240/32 090/22 240/32 090/29 140/26 090/12 360/08
2002 220/09 320/22 300/24 010/35 360/40 340/40 330/30 090/20 130/20 360/20 090/25 360/10
2003 360/12 360/35 360/35 360/38 240/43 360/39 100/30 100/21 130/18 190/21 350/07 350/09
2004 350/19 200/12 250/30 330/40 330/44 050/32 220/23 100/20 170/28 150/20 360/10 360/10
2005 090/12 300/30 220/50 270/35 040/30 230/28 280/23 100/20 170/21 120/20 360/11 360/10
2006 340/11 210/13 230/18 350/40 350/30 220/18 110/21 030/30 270/26 120/17 030/08 360/07
2007 350/16 030/24 030/22 250/38 360/35 020/28 160/19 150/19 120/22 240/18 030/35 350/07
2008 340/13 060/26 270/40 290/30 350/48 190/30 270/22 200/21 080/20 020/30 010/09 030/07
2009 230/10 350/16 010/31 190/22 080/48 270/22 130/20 140/18 150/30 180/10 040/06 340/10
2010 020/16 290/26 360/37 010/35 350/45 350/40 100/18 090/18 150/18 150/26 350/16 350/10
2011 340/11 340/18 280/35 280/35 350/40 140/32 180/27 170/18 090/22 110/16 260/10 080/10
2012 110/18 350/23 310/26 250/45 230/30 330/55 160/26 270/22 120/26 030/16 360/10 360/08
2013 180/10 040/12 230/18 350/40 280/45 130/38 200/20 240/20 190/20 110/20 350/10 190/12
Table-1: Monthly maximum wind direction & speed.

CONFIDENTIAL
47
CONFIDENTIAL
61. Rainfall. Month-wise total amount of rainfall from January 1984 to December 2013 is shown in Table-2:
Jan Feb Mar Apr May Jun Jul Aug Sep Oct Nov Dec
1984 51 1 Nil 019 304 821 292 321 167 54 Nil Nil
1985 14 4 50 4 177 311 244 206 238 189 Nil Nil
1986 9 Nil 1 90 136 337 338 177 637 183 159 6
1987 1 Nil 58 165 52 327 389 714 193 136 14 10
1988 Nil 27 93 148 298 518 257 312 117 87 100 Nil
1989 Nil 3 2 41 273 202 282 120 161 234 0 7
1990 Nil 5 189 19 163 342 392 106 202 94 126 10
1991 24 24 33 54 87 408 220 335 216 145 Nil 76
1992 38 66 Nil 20 204 303 317 147 203 36 3 Nil
1993 Nil 33 115 147 142 294 335 210 333 103 4 Nil
1994 12 29 1 51 175 371 220 255 89 64 2 Nil
1995 17 25 18 5 88 196 281 286 270 95 113 3
1996 21 20 22 90 146 350 289 362 195 257 5 Nil
1997 15 33 51 70 110 232 393 240 348 12 15 19
1998 44 26 141 130 222 158 184 209 168 88 118 Nil
1999 Nil Nil Nil 31 141 262 448 251 301 151 1 Nil
2000 2 19 7 71 172 500 283 279 413 145 Nil Nil
2001 Nil 38 37 39 347 475 277 109 141 165 14 Nil
2002 18 Nil 22 134 267 539 519 258 224 32 112 Nil
2003 Nil 13 119 55 66 457 419 142 145 466 Nil 35
2004 3 Nil 10 72 176 303 398 400 856 259 Nil Nil
2005 32 15 129 33 57 181 468 113 159 411 2 Nil
2006 Nil Nil 1 52 302 231 479 318 366 7 4 Nil
2007 Nil 83 21 62 159 351 738 274 261 142 100 Nil
2008 70 38 38 38 213 268 415 200 415 199 Nil Nil
2009 Nil 7 34 Nil 198 240 279 391 417 94 1 1
2010 Nil 22 11 50 274 297 168 211 186 116 4 32
2011 Nil Nil 34 35 145 360 250 303 227 18 1 Nil
2012 31 4 5 92 26 253 304 185 271 71 61 2
2013 6 15 8 63 301 212 211 309 328 215 Nil Nil
Table-2: Monthly total amount of rainfall (in mm)
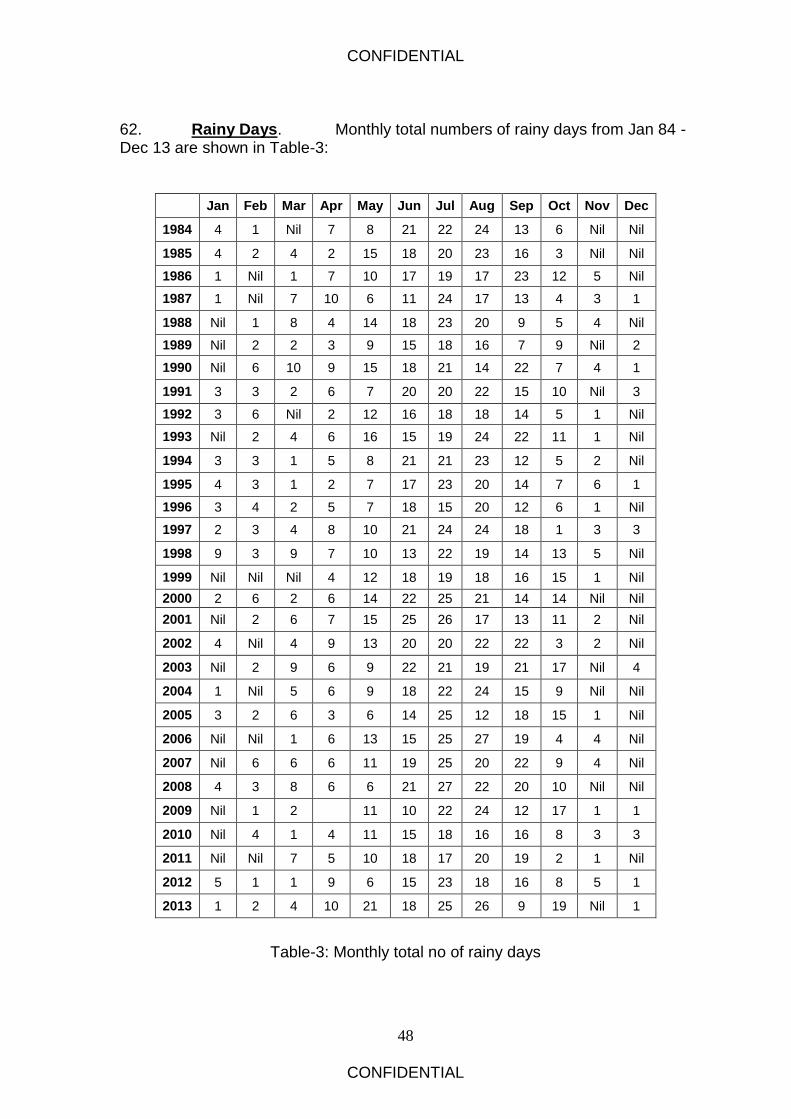
CONFIDENTIAL
48
CONFIDENTIAL
62. Rainy Days. Monthly total numbers of rainy days from Jan 84 - Dec 13 are shown in Table-3:
Jan Feb Mar Apr May Jun Jul Aug Sep Oct Nov Dec
1984 4 1 Nil 7 8 21 22 24 13 6 Nil Nil
1985 4 2 4 2 15 18 20 23 16 3 Nil Nil
1986 1 Nil 1 7 10 17 19 17 23 12 5 Nil
1987 1 Nil 7 10 6 11 24 17 13 4 3 1
1988 Nil 1 8 4 14 18 23 20 9 5 4 Nil
1989 Nil 2 2 3 9 15 18 16 7 9 Nil 2
1990 Nil 6 10 9 15 18 21 14 22 7 4 1
1991 3 3 2 6 7 20 20 22 15 10 Nil 3
1992 3 6 Nil 2 12 16 18 18 14 5 1 Nil
1993 Nil 2 4 6 16 15 19 24 22 11 1 Nil
1994 3 3 1 5 8 21 21 23 12 5 2 Nil
1995 4 3 1 2 7 17 23 20 14 7 6 1
1996 3 4 2 5 7 18 15 20 12 6 1 Nil
1997 2 3 4 8 10 21 24 24 18 1 3 3
1998 9 3 9 7 10 13 22 19 14 13 5 Nil
1999 Nil Nil Nil 4 12 18 19 18 16 15 1 Nil
2000 2 6 2 6 14 22 25 21 14 14 Nil Nil
2001 Nil 2 6 7 15 25 26 17 13 11 2 Nil
2002 4 Nil 4 9 13 20 20 22 22 3 2 Nil
2003 Nil 2 9 6 9 22 21 19 21 17 Nil 4
2004 1 Nil 5 6 9 18 22 24 15 9 Nil Nil
2005 3 2 6 3 6 14 25 12 18 15 1 Nil
2006 Nil Nil 1 6 13 15 25 27 19 4 4 Nil
2007 Nil 6 6 6 11 19 25 20 22 9 4 Nil
2008 4 3 8 6 6 21 27 22 20 10 Nil Nil
2009 Nil 1 2 11 10 22 24 12 17 1 1
2010 Nil 4 1 4 11 15 18 16 16 8 3 3
2011 Nil Nil 7 5 10 18 17 20 19 2 1 Nil
2012 5 1 1 9 6 15 23 18 16 8 5 1
2013 1 2 4 10 21 18 25 26 9 19 Nil 1
Table-3: Monthly total no of rainy days

CONFIDENTIAL
49
CONFIDENTIAL
CHAPTER – VI : CONCLUSION AND RECOMANDATIONS
CONCLUSION
1. Weather forecasting has enormous importance in all areas of military operations as well as their supporting personnel and equipments. The accuracy of weather forecast of a particular area depends largely upon the knowledge of the forecaster about the prevailing weather conditions and the climatology of that area. For providing reliable climatology of different weather elements, 30 years real time data have been analysed for obtaining average conditions of different weather elements like temp, fog, thunderstorm/Nor’wester, heat wave, cold wave, rainy days, break monsoon etc. These weather elements are indispensable for planning of flying effort, air operations, ground operations, ceremonial planning etc and their executions throughout the year. The extreme conditions of different weather elements found within last 30 years have been shown in the table. Here, the temp data have been studied in the chapter “Temperature Psychotherapy” and the data of max, min temp for monthly and fortnightly have been used for obtaining the average conditions. The fog data have been processed in the chapter “Fog Investigation” for obtaining the monthly foggy days and the average cessation time of fog in different months. The occurrence of thunderstorms/Nor’wester have been analysed in the chapter “Thunderstorm Behavior” for obtaining the frequency, time of occurrence, susceptible dates of occurrence in different months and findings are appended in the “Climate of Jessore at a glance”. The amount of rainfall and rainy days data have been analysed in the chapter “Precipitation Study” for obtaining yearly, monthly, pentad and daily average; to obtain susceptible days of continuous rain; break in monsoon etc. In the study it was found that the yearly amount of rainfall and no rainy days are highly variable. However, the yearly average amount of rainfall was found 1703mm and the average no of rainy days was 111.1 days. The findings of the study have been shown below as “climate of Jessore at a glance”.
Climate of Jessore at a Glance 2. After analyzing all the data, the findings have been shown graphically and the inferences are also discussed below the graphs of each element for easy understanding. However, the findings are appended below in brief:
a. Temperature, Heat Wave and Cold Wave Conditions. The temperature data study reveals that the hottest month of the year is April and coldest month is January. The significant findings regarding temp are as fol:
(1) April is the hottest month in the year with monthly mean max temp
35.7⁰c in April and the 2nd fortnight of April is the hottest period in the year
with fortnightly mean max 36.2⁰c. The highest max temp within last 30
years was found 43.2⁰c on 09 May 09.
(2) The mean max temp starts rising from 16 January to 31 March with
a rate of 2⁰c - 3⁰c per fortnight; thereafter it become 1⁰c – 2⁰c per fortnight
till 30 April (2nd fortnight of April).
CONFIDENTIAL
50
CONFIDENTIAL
(3) The temp ≥38⁰c was found average 06 days in April (max 20 days
in 1992) and 04 days in May (Max 14 days in 2004). This temp also found in March (0.8 day) and June (1.4 days). Therefore, most of the severe
(40-42⁰c) heat waves were found in the 2nd fortnight of April (11 heat
wave), then the 1st fortnight of May (05 heat wave); severe heat wave also found in the 1st fortnight of April (02 heat wave), 2nd fortnight of May (04 heat wave) and 1st fortnight of June (01 heat wave).
(4) During heat wave conditions, flying becomes restricted, people become sick due to heat stroke and human performance reduces due to sweating.
(5) January is the coldest month in the year with monthly mean min
temp 10.7⁰c and the 1st fortnight of January is the coldest fortnight with
fortnightly mean minimum 10.4⁰c. The lowest min temp within last 30
years was found 4.2⁰c on 09 Jan 13.
(6) The mean minimum temp starts falling from 01 October and
continues till 16 January with a rate of 2⁰c – 3⁰c per fortnight; thereafter it
increases in the same rate till 31 Mar.
(7) The temp ≤10⁰c was found average 04 days in December (max 13
days in 2007 & 2010), 12 days in January (max 23 days in 2003) and 01 day in February (max 08 days in 2008). The maximum no of moderate (6-
8⁰c) to severe (4-6⁰c) cold wave was found in 1st fortnight of January (12
cold wave), then in 2nd fortnight (09 cold wave); cold wave also found in 2nd fortnight of December (04 cold wave).
(8) A cold wave can cause death and injury to livestock and wildlife. Exposure to cold mandates greater caloric intake for all animals, including humans. The belief that more deaths are caused by cold weather in comparison to hot weather is true as a result of cold, flu, pneumonia, etc.
b. Persistence of Fog in Winter. Fog starts in September and continues till last of April. The average no of foggy days from September to April are 01, 03, 09, 18, 20, 14, 08 and 02 days respectively. Monthly average end time of fog is being calculated from November to March. Because, the foggy days in other months (Apr, Sep and Oct) are very less in number and short in duration. The persistence of fog in different months are as fol:
(1) In November the average foggy days was 09 (Fig-11). Among these, average 05 days (53%) fog persists up to 0800F and 04 days (47%) up to 0900F.
(2) In December the average foggy days was 18 (Fig-11). Among these days, average 12 days (65%) fog persists up to 1000F, 5.75 days (32%) up to 0900F and only 0.25 days (3%) up to 0800F.

CONFIDENTIAL
51
CONFIDENTIAL
(3) In January the average foggy days was 20 (Fig-11). Among these days, average 08 days (40%) fog persists up to 0900F, 10 days (50%) up to 1000F and 02 days (13%) up to 1100F.
(4) In February the average foggy days was 14 (Fig-11). Among these days, average 11.5 days (82%) fog persists up to 0900F and 2.5 days (18%) up to 1000F.
(5) In March the average foggy days was 08 (Fig-11). Among these, average 1.3 days (17%) fog persists up to 0800F, 06 days (73%) up to 0900F and only 0.7 days (10%) up to 1000F. (6) The activities which are related with visibility like flying, driving etc needs to plan according to the cessation time of fog in different months. Flying should be planned after 1000F in December and January. In the same way, flying should be planned after 0900F in February and March.
c. Occurrence of Nor’wester. The thunderstorms occur in pre-monsoon season (February to May), most of them are associated with Nor’wester but some of them may not be Nor’wester. In this study, Norw’ester has been considered when wind speed was 22 kts or more. The month-wise susceptible dates of Nor’wester are as fol:
(1) In February, the average frequency of Nor’wester is 0.5 (Fig-18). The susceptible days for occurrence of Nor’wester are 19th, 20th, 25th and 28th February (Probability 10% -15%).
(2) In March, the average frequency of Nor’wester is 2.2 (Fig-18). Nor’westers mainly starts from 22 March, though few may occur early also. The susceptible dates for occurrence of Nor’wester are 23rd, 24th, 27th, 29th and 30th March (probability 20% - 30%).
(3) In April, the average frequency of Nor’wester is 5.5 (Fig-18). The susceptible days of nor’wester can be considered as 22nd, 24th, 26th, 28th, 29th and 30th April and the probability is around 30%. .
(4) In the month of May, the frequency of Nor’wester is highest (average 8.5). The susceptible days of nor’wester can be considered as 3rd, 5th, 10th, 13th, 15th, 17th, 24th, 25th, 26th and 27th April (probability 30% - 40%).
(5) Nor’wester occurs in the 1st and 2nd week of June also, till monsoon is set over the country. The 4th, 5th, 7th, 10th and 11th June are vulnerable for occurrence of Nor’wester
(6) The maximum no of Nor’wester (254 out of 506 Nor’wester) occurred within the time 1200Z to 1800Z (50%) and 25% Nor’wester (129 out of 506 Nor’wester) occurred within 0600Z - 1200Z. (Fig-19)
CONFIDENTIAL
52
CONFIDENTIAL
(7) The susceptible days for nor'wester need to be more cautious for any type of outdoor activities including flying, driving or any public gathering/ceremony, particularly within 1200Z – 1800Z.
d. Break in Monsoon. Monsoon break is the break of rainfall
during monsoon period. After onset of monsoon, the susceptible dates of break in different months are as fol:
(1) The onset and withdrawal date of monsoon is found 12th June and 10th October respectively over Jessore area.
(2) In July, 08 - 09 Jul are susceptible for one break and 16 - 17 Jul are susceptible for another break in monsoon.
(3) In August, 06–07 Aug, 16–18 Aug and 23–24 Aug are susceptible for break in monsoon.
(4) In September, 01–02 Sep, 06–07 Sep, 17–21 Sep and 28– 30 Sep are susceptible for break monsoon.
(5) During the break monsoon periods, rainfall ceases and cloud decreases. As a result, these periods could be utilized for compensating the loss occurred in the days when rainfall was continuous.
e. Continuous Rainy days in Monsoon. During monsoon, there are few days when it rains cats and dogs and all activities are disrupted. The vulnerable days in different months are as fol:
(1) After onset of monsoon, the 17, 20, 22, 25 and 29th June are susceptible for continuous rainy days, when normal activities may be hampered due to rain.
(2) In July, the 04, 15, 19, 21, 23, 28 and 29 July are susceptible for continuous rainy days.
(3) In August, the 02, 14, 15, 19 and 28 August are susceptible for continuous rainy days.
(4) In September, the 05, 09 and 11 September are susceptible for continuous rainy days.
(5) The continuous rainy days affect the flying, ceremonial activities
and public life in a greater extent. During these days all outdoor activities bring to a halt including flying.

CONFIDENTIAL
53
CONFIDENTIAL
Recommendations 1. To ensure the effective use of climatological records for Air force operations, Military and Marine operations, the study report recommends the followings:
a. The result of the study may be taken into cognizance during the planning of any flying effort, air operation, ground operation and ceremonial activities around Jessore area. b. Necessary steps may be taken for preservation of long term Met data centrally for all bases/unites of BAF including isolated Radar unites, so that it can be compiled for climatology of whole Bangladesh.
c. Similar study may be encouraged for all bases with available data for finding out the local climate. d. Steps may be taken to disseminate sister services for utilization in their operations and for the greater benefit of the country.
e. Steps may be taken for acquisition of Met data using installations of sister services from remote areas where no BAF installations are available by providing training to them.
f. Steps may be taken to disseminate BMD for updating in media. Jessore NASIR UDDIN MOLLA Wing Commander November 2014 OIC Met Sqn, BAF MTR (Total WordsApproximately-12479)

CONFIDENTIAL
54
CONFIDENTIAL
BIBLIOGRAPHY
http://en.wikipedia.org/wiki/Climate http://en.wikipedia.org/wiki/Cold_wave http://www.sajs.co.za/sites/default/files/publications/html/470-8661-4-PB.html GPCP Pentad Precipitation Analyses: An Experimental Dataset Based on Gauge
Observations and Satellite Estimates PINGPING XIE,* JOHN E. JANOWIAK,* PHILLIP A. ARKIN,1 ROBERT ADLER,# ARNOLD GRUBER,@ **Joint Center for Earth Systems Technology, University of Maryland, Baltimore County, Baltimore, Maryland
ONSET AND END OF THE FIRST RAINY SEASON IN SOUTH CHINA QIANG Xue-Min1,2 YANG Xiu-Qun2
Extended range prediction of active-break spells of Indian summer monsoon rainfall using
an ensemble prediction system in NCEP Climate Forecast System S. Abhilash,a A. K. Sahai,a* S. Pattnaik,b B. N. Goswamia and Arun Kumarc

CONFIDENTIAL
55
CONFIDENTIAL