bacterial microflora of the cold-water coral lophelia...
TRANSCRIPT

Bacterial Microflora of the Cold-Water Coral Lophelia pertusa
(Scleractinia, Caryophylliidae)
Bakterielle Mikroflora der Kaltwasser-Koralle Lophelia pertusa
(Scleractinia, Caryophylliidae)
Dissertation zur Erlangung des akademischen Grades
Doctor rerum naturalium (Dr. rer. nat.) der
Mathematisch-Naturwissenschaftlichen Fakultät der
Christian-Albrechts-Universität zu Kiel
vorgelegt von Sven Christopher Neulinger
Kiel, im April 2008

II
Referentin: Prof. Dr. Karin Lochte
Korreferentin: Prof. Dr. Tina Treude
Tag der Disputation: 10. Juni 2008
Zum Druck genehmigt: 10. Juni 2008
………………………………….
(Der Dekan)

III
“I am a firm believer that without speculation there is no good and original observation.”
Charles Robert Darwin (1809-1882)
in a letter to Alfred Russel Wallace, 22 December 1857

INDEX
IV
Index
Summary ............................................................................................................................... 1
Kurzfassung ..........................................................................................................................2
1 Introduction ..................................................................................................................3
1.1 The Cold-Water Coral Lophelia pertusa .........................................................................................3
1.2 Coral-Associated Bacteria..............................................................................................................7
1.3 Aims of this Study ..........................................................................................................................8
1.4 General Strategy............................................................................................................................10
2 Materials and Methods ............................................................................................... 13
2.1 Location and Sampling ................................................................................................................13
2.1.1 Topographic, Hydrological, and Biological Aspects of the Trondheimsfjord ....................13
2.1.2 Sampling and Fixation .................................................................................................................14
2.2 DNA Extraction ...........................................................................................................................17
2.3 T-RFLP ..........................................................................................................................................17
2.4 Cloning and Sequencing ..............................................................................................................19
2.5 Fluorescence In-Situ Hybridisation ...........................................................................................22
3 Results .........................................................................................................................26
3.1 T-RFLP ..........................................................................................................................................26
3.1.1 Comparison of Coral and Environmental Samples.................................................................26
3.1.2 Differences between Coral Samples ..........................................................................................31
3.2 Cloning and Sequencing ..............................................................................................................35
3.2.1 Phylogenetic Analyses ..................................................................................................................35
3.2.2 Comparison of T-RFLP Data and 16S rDNA Sequences......................................................46
3.3 Fluorescence In-Situ Hybridisation ...........................................................................................48
3.3.1 Bacteria Associated with Coral Ectoderm ................................................................................48
3.3.2 Bacteria Associated with Coral Endoderm...............................................................................56
4 Discussion ...................................................................................................................58
4.1 Differences in Bacterial Assemblages of L. pertusa ..................................................................58
4.1.1 Comparison of Coral and Environmental Samples.................................................................58

INDEX
V
4.1.2 Differences between Coral Samples ..........................................................................................59
4.1.3 Comparison of T-RFLP Data and 16S rDNA Sequences......................................................61
4.2 Dominant Bacterial Groups of L. pertusa and their Ecological Potential.............................62
4.2.1 Phylogenetic and Ecological Inference .....................................................................................62
4.2.2 Sulphur Cycling.............................................................................................................................63
4.2.3 Methylotrophy...............................................................................................................................65
4.2.4 Parallels to Other Symbiotic and Parasitic Associations.........................................................67
4.3 In-Situ Location of L. pertusa-Associated Microbes ................................................................71
4.3.1 Bacteria Associated with Coral Ectoderm ................................................................................71
4.3.2 Bacteria Associated with Coral Endoderm...............................................................................72
4.3.3 Comparison of Sequence Frequencies and Bacterial in-Situ Abundances...........................73
4.4 Relations between L. pertusa and its Associated Bacteria........................................................75
4.4.1 Partitioning and Specificity of the Bacterial Community........................................................75
4.4.2 Implications for Nutrition, Health, and Dispersal of L. pertusa .............................................78
4.4.3 Bacterial Community Composition and Colouring of L. pertusa ...........................................82
4.4.4 The Role of Tissue-Associated Bona Fide TM7 and Mycoplasmataceae..................................83
4.4.5 Proposal of “Candidatus Mycoplasma corallicola” ...................................................................85
4.5 Significance and Outlook ............................................................................................................86
Acknowledgements.............................................................................................................87
References...........................................................................................................................89
Appendix ............................................................................................................................ 111
Declaration of Academic Integrity / Selbstständigkeitserklärung .................................. 128


SUMMARY
1
Summary
The pseudocolonial coral Lophelia pertusa (Scleractinia, Caryophylliidae) is a eurybathic, stenother-
mal cosmopolitan cold-water species. It occurs in two colour varieties, white and red. L. pertusa
builds vast cold-water coral reefs along the continental margins, which are among the most
diverse deep-sea ecosystems. Microbiology of L. pertusa has been in scientific focus for only a few
years. The question whether the coral holds a host-specific bacterial community is not finally
answered. Possible implications of the two colour varieties for microbial colonisation must be
taken into account. Bio imaging can reveal the in-situ location of bacterial groups on and possible
interactions with the coral. The present study aimed at investigating these aspects, drawing a
more comprehensive picture of community structure, taxonomy, and in-situ location of
L. pertusa-hosted microbes.
Bacteria on coral samples from the Trondheimsfjord (Norway) were characterised by the culture-
independent 16S rDNA- and rRNA-based techniques T-RFLP, cloning and sequencing, and
CARD-FISH. L. pertusa revealed a high microbial richness. Clone sequences were dominated by
α- and γ-Proteobacteria. Other abundant taxa were Bacteroidetes, Actinobacteria, Verrucomicrobia, Firmi-
cutes, and Planctomycetes. The bacterial community of L. pertusa differed conspicuously from that of
the environment, but was not ‘specific’ sensu stricto. It was rather divided into a tissue-bound frac-
tion that was spatially constant within the sampling area and a “liquid-associated” fraction in the
mucus and gastric fluid varying with location and colour variety of its host. Parallels to other
coral-bacterial associations suggested existence of certain ‘cold-water coral-specific’ bacterial
groups sensu lato. L. pertusa-associated bacteria appeared to play a significant role in the alimen-
tation of their host by degradation of sulphur compounds, cellulose, chitin, and end products of
the coral’s anaerobic metabolism. Different bacterial groups in red and white L. pertusa could
explain the dissimilar dispersal of these two phenotypes by different nutritional strategies. Some
microbes were regarded as opportunistic pathogens, others might even be connected to coral
colouring. Filamentous bacteria in the gastrocoel were identified as bona fide TM7, whose tight
binding to the endoderm implied exchange of metabolites with their host. A novel Mycoplasma
species on the nematocyst batteries of the coral tentacles was proposed as “Candidatus Mycoplas-
ma corallicola”. This organism appeared to be a commensal that profits from the leakage of
dissolved organic substances during prey capture activity of L. pertusa.

KURZFASSUNG
2
Kurzfassung
Lophelia pertusa (Scleractinia, Caryophylliidae) ist eine eurybathe, stenotherme Kaltwasserkoralle.
Sie tritt als rote und weiße Farbvarietät auf. L. pertusa bildet ausgedehnte Kaltwasserriffe entlang
der Kontinentalränder, die zu den artenreichsten Lebensräumen der Tiefsee zählen. Die Mikro-
biologie von L. pertusa steht erst seit wenigen Jahren im Fokus des wissenschaftlichen Interesses.
Die Frage, ob die Koralle eine wirtsspezifische Bakteriengemeinschaft beherbergt, ist nicht end-
gültig beantwortet. Mögliche Auswirkungen der unterschiedlichen Farbvarietäten auf die bakteri-
elle Besiedlung der Koralle sind zu berücksichtigen. Bildgebende Verfahren können Aufschluss
über die genaue Lage der Bakteriengruppen und mögliche Wechselwirkungen mit der Koralle ge-
ben. Ziel der dieser Arbeit ist es, diese Aspekte zu untersuchen und ein umfassenderes Bild der
Struktur, Taxonomie und Verteilung der Bakteriengemeinschaft auf L. pertusa zu zeichnen.
Bakterien von Korallenproben aus dem Trondheimsfjord (Norwegen) wurden mit den kulturun-
abhängigen, auf 16S-rDNA und rRNA basierenden Methoden T-RFLP, Klonen und Sequenzie-
rung, sowie CARD-FISH charakterisiert. L. pertusa wies eine reiche Bakterienflora auf. Klon-
Sequenzen wurden von α- und γ-Proteobacteria dominiert. Klone von Bacteroidetes, Actinobacteria,
Verrucomicrobia, Firmicutes und Planctomycetes waren ebenfalls zahlreich. Die Bakteriengemeinschaft
von L. pertusa unterschied sich deutlich von jener der Umgebung, war jedoch nicht ‚spezifisch’
i. e. S. Sie war unterteilt in eine innerhalb des untersuchten Gebietes konstante gewebeassoziierte
Fraktion, sowie eine „flüssigkeitsassoziierte“ Fraktion in Schleim und Gastralflüssigkeit. Letztere
variierte abhängig von Standort und Farbe des Wirtes. Parallelen zu anderen Korallen-Bakterien-
Assoziationen legten die Existenz ‚kaltwasserkorallen-spezifischer’ Bakteriengruppen i. w. S.
nahe. Die Bakterien auf L. pertusa schienen durch Abbau von Schwefelverbindungen, Zellulose,
Chitin und Endprodukten des anaeroben Wirtsmetabolismus eine wichtige Rolle für die Ernäh-
rung der Koralle zu spielen. Unterschiedliche bakterienbedingte Ernährungsstrategien in roten
und weißen L. pertusa könnten das abweichende Verbreitungsmuster dieser beiden Phänotypen
erklären. Neben opportunistischen Pathogenen wurden auch Bakterien entdeckt, die für die
Farbgebung der Koralle verantwortlich sein könnten. Fadenförmige Bakterien auf dem Endo-
derm, identifiziert als bona fide TM7, könnten Metabolite mit ihrem Wirt austauschen. Auf den
Nematocysten der Tentakel profitierte „Candidatus Mycoplasma corallicola“ offenbar kommensal
von gelösten organischen Substanzen, die beim Beutefang von L. pertusa freigesetzt werden.

INTRODUCTION
3
1.1
1 Introduction
The Cold-Water Coral Lophelia pertusa
The pseudocolonial scleractinian coral Lophelia pertusa (Linnaeus 1758) belongs to the family
Caryophylliidae (Wells 1956). Though it is commonly referred to as a ‘deep-water’ or ‘deep-sea’
coral, this does not mean that it lives exclusively in deep oceanic water masses, but describes the
ability of the coral to thrive at greater water depths in a cold and dark environment: Occurrence
of this species is rather defined by temperature (4-12°C; preferred range, 6-8°C), salinity
(~35-37 PSU), and dissolved oxygen (~3-5 ml·l-1) (Freiwald 1998, 2002). The coral grows from
39 m on the Tautra reef in the Norwegian Trondheimsfjord (Hovland and Risk 2003) down to
3000 m in the Atlantic (Squires 1959). In fact, L. pertusa inhabits shallow water only in Norwegian
fjords (Strømgren 1971) because of the low depth of the thermocline (Freiwald et al. 1997).
L. pertusa is thus a rather eurybathic, but stenothermal cold-water species, occurring in areas charac-
terised by high biological production and vigorous hydrodynamic regimes (Rogers 1999).
The species occurs in two colour varieties (Fig. 1): white (transparent) and red (also referred to as
“pink”) (Dons 1944; Strømgren 1971). The question whether these two phenotypes differ geneti-
cally is still open, though the molecular phylogeny of L. pertusa and its population structure in the
NE Atlantic have been addressed quite recently: The coral population in the NE Atlantic should
not be considered panmictic (random-mating) but instead forms distinct offshore and fjord
populations. The recruitment of sexually produced larvae appears to be strongly local (Le Goff-
Vitry et al. 2004).
Like all scleractinian corals from such environments, L. pertusa has no algal endosymbionts and is
thus termed ‘azooxanthellate’. Stony corals lacking zooxanthellae are commonly called ‘aherma-
typic’ (non-reef-building), as opposed to their ‘hermatypic’ relatives in shallow tropical waters.
This denomination, however, disregards the ability of L. pertusa to build vast and complex thicket
frameworks in the bathyal zone along the continental margins (Fig. 2). Though L. pertusa’s
average linear extension rate of 5.5 mm·yr-1 (Mortensen and Rapp 1998) is far less than that of
branching warm-water corals (100-200 mm·yr-1) (Buddemeier and Kienze 1976), its extreme long-

INTRODUCTION
evity of estimated 200-366 years allows the coral to build colonies up to 1.5 m in height (Wilson
1979). Post-glacial Lophelia reefs developed over periods of 1,000-10,000 years (Rogers 1999).
Fig. 1: Red and white colour variety of L. pertusa growing entwined together with associated sponges at
Tautraryggen (Tautra sill) in the Trondheimsfjord, Norway. Photo by courtesy of Erling Svensen
(http://www.uwphoto.no).
Cold-water corals do not build large continuous reef structures like, e.g., the Great Barrier Reef
off the East coast of Australia or the Belize Barrier Reef in the Caribbean Sea, but form rather
discontinuous patches and banks. Nonetheless, the overall area covered by cold-water reefs
exceeds by far the extent of their tropical coral reef counterparts (magenta areas in Fig. 2).
L. pertusa is the dominant coral in the NE Atlantic, forming giant carbonate mounds and reef
patches along the continental margin from the North Cape to the Straits of Gibraltar (Mortensen
et al. 1995; Freiwald 1998; Freiwald et al. 1999; Freiwald 2002). The coral is most abundant on
the continental shelf in mid Norway at 200-400 m depth with largest densities along the conti-
nental break and on edges of shelf-crossing trenches (Fosså et al. 2002). Illustration of known
cold-water coral reef locations (red points in Fig. 2) might convey the impression that the main
4

INTRODUCTION
5
distribution of L. pertusa is confined to the North Atlantic. However, this appears to be merely a
consequence of intensive research and mapping effort in this ocean region. As shown by the pre-
dictive distribution of L. pertusa (orange and yellow areas in Fig. 2), the species is rather assumed
to be an abundant cosmopolitan, fringing the margins of all continents.
The importance of L. pertusa in reef-forming processes with respect to lithification was discussed,
e.g., by Reitner (1993), and recently by Noé et al. (2005). Despite that, cold-water coral reefs have
long been neglected in calculations of global carbonate production. CaCO3 flux is 4%–12% of
that in tropical reefs, and a preliminary global estimate indicates that cold-water coral CaCO3 pro-
duction could add >1% to the total marine CaCO3 production (Lindberg and Mienert 2005).
Given their assumed widespread occurrence (Fig. 2), cold-water reefs might constitute a
significant carbonate sink.
Cold-water reefs are among the most diverse deep-sea ecosystems with more than 980 inverte-
brate species known to be associated with cold-water corals, belonging to a broad range of taxa:
Foraminifera, Cnidaria, Nemertini, Polychaeta, Crustacea, Gastropoda, Bivalvia, and Ophiuroidae
(Echinodermata) (Buhl-Mortensen and Mortensen 2004). Obviously, also sponges (Porifera)
occur at least on some Lophelia reefs (Fig. 1). Though most of these organisms are not found
exclusively on Lophelia banks, many of them are much less common in other habitats (Mortensen
2001).
Unfortunately, cold-water reefs are also highly endangered by human impact: Because the coral
thickets provide habitat particularly for some commercially important fish and crustacean species
(Roberts and Hirshfield 2004), they are sought grounds for industrial fishing. In the past, Lophelia
reefs were exploited by long-line and gillnet fisheries (Fosså et al. 2002). While these traditional
methods caused only limited damage to the coral framework, introduction of bottom trawling in
the 20th century led to considerable reef destruction (Fosså et al. 2002; Hall-Spencer et al. 2002).
Due to their slow growth (see above), recovery of cold-water reefs from these massive impacts is
likely to be in the order of decades or even centuries (Roberts and Hirshfield 2004).

INTRODUCTION
© U
NE
P-W
CM
C,
20
07
Fig.
2:
Glo
bal d
istrib
utio
n of
kno
wn
cold
-wat
er c
oral
reef
s (re
d), p
redi
ctiv
e di
strib
utio
n of
L. p
ertus
a (o
rang
e, ve
ry li
kely
occu
rren
ce; y
ellow
, con
ceiv
able
occ
urre
nce)
,
and
dist
ribut
ion
of w
arm
-wat
er r
eefs
(m
agen
ta).
Sour
ce: W
orld
Con
serv
atio
n M
onito
ring
Cent
re o
f th
e U
nite
d N
atio
ns E
nviro
nmen
t Pr
ogra
mm
e (U
NE
P-
WCM
C).
The
map
was
mod
ified
gra
phic
ally
afte
r co
mpi
latio
n w
ith t
he U
NE
P-W
CMC
IMap
S to
ol (
http
://b
ure.u
nep-
wcm
c.org
/mar
ine/
cold
cora
l/
view
er.h
tm).
6

INTRODUCTION
7
1.2 Coral-Associated Bacteria
Interactions between warm-water corals and bacteria have been observed for over seventy years:
Yonge (1937) and Franzisket (1970) noticed that bacterial digestion of mucus could interfere with
coral respirometric measurements. Corals are able to feed on bacteria from the water column
(DiSalvo 1971). Sieburth (1975) described bacterial “lawns” covering the tissue surface of the
ahermatypic coral Astrangia danae. Ducklow and Mitchell (1979) showed that the external mucus
layer of certain stony reef corals is inhabited by communities of heterotrophic bacteria;
population levels of these bacteria seem to be controlled by some host corals, and show response
to stresses applied to the host. Santavy (1995) observed bacteria-filled ovoids in Caribbean Porites
astreoides samples. Carbon source utilisation patterns of bacteria isolated from the mucus of
various Caribbean corals exhibited species-specific mucus-associated microbial communities
(Ritchie and Smith 1997).
It is still under debate whether such bacterial-anthozoan assemblages are specific and of ecologi-
cal importance. Nevertheless, there are copious examples that microbes do not just dwell
passively on a coral, but have noticeable impact on their host – for both its advantage and disad-
vantage: The observation that many tropical corals ingest their own mucus (Coles and
Strathmann 1973) indicates that they take advantage from the ability of the mucus-inhabiting
bacteria to scavenge low-concentrated nutrients (Knowlton and Rohwer 2003). Experiments
suggest that bacterially driven nitrification takes place in the tissue of living hermatypic corals
(Wafar et al. 1990). Diazotrophic bacteria in reef-building stony corals benefit from organic
carbon excreted by the coral tissue, supplying their hosts with nitrogen-containing compounds
(Williams et al. 1987; Shashar et al. 1994; Lesser et al. 2004). Hermatypic warm-water corals live
in close symbiosis with dinoflagellate algae of the genus Symbiodinium, known as ‘zooxanthellae’,
which are located intracellularly in the coral. In the oligotrophic, nutrient-limited environment of
the tropical coral reef, both nitrogen fixation and nitrification – as a pathway of nitrogen recy-
cling (Wafar et al. 1990) – are favourable for these zooxanthellae.
Among endolithic microborers inhabiting the corallum (=coral skeleton) of the Indo-Pacific
shallow-water species Porites lobata, bacteria were shown to be responsible for breakdown of the
organic skeletal matrix (DiSalvo 1969). More recently, the cyanobacterium Plectonema terebrans was
found in both live and dead specimens of the same coral (Lukas 1974; Le Campion-Alsumard et

INTRODUCTION
8
1.3
al. 1995). In the latter case, the consequence for the host can be considered ambivalent: On the
one hand, P. terebrans weakens the internal structure of its host through biocorrosion; on the
other hand, the coral may benefit from the nitrogen-fixing activity of the cyanobacterium as
shown for other coral-diazotroph associations (Williams et al. 1987; Lesser et al. 2004).
Hermatypic corals are prone to numerous bacterially induced diseases, among which are Coral
Bleaching (Banin et al. 2000a; Banin et al. 2000b), Black Band Disease (Cooney et al. 2002; Frias-
Lopez et al. 2002; Richardson and Kuta 2003), and White Plague (Bythell et al. 2002; Denner et
al. 2003). Microbial surface fouling is another detrimental threat. Accordingly, many scleractinians
and other anthozoans use antibiotic compounds to make chemical war on bacteria (Slattery et al.
1995; Koh 1997; Kelman et al. 1998; Wilsanand et al. 1999; Kelman et al. 2006). This kind of
antagonism is fairly common in nature. Yet, it is stunning that substances produced in certain
corals show activity against potentially pathogenic marine bacteria, but not against the associated
microbes from the animal’s tissue and mucus (Kelman et al. 1998). Thus, one may be apt to think
that corals are able to differentiate between “enemy” and “friend”. But, as Kelman et al. (1998)
and Knowlton and Rohwer (2003) point out, the source of antimicrobial activity could again be
the coral-associated bacteria themselves.
In recent years, molecular genetics has been increasingly applied to investigate the diversity and
specificity of associations between bacteria and tropical reef corals. The culture-independent
analysis of ribosomal RNA genes (16S rDNA) revealed a richness in prokaryotic gene sequence
patterns comparable to that of the eukaryotic coral reef community (Rohwer et al. 2001; Frias-
Lopez et al. 2002; Rohwer et al. 2002). These studies showed that coral-associated bacteria were
not only different to water-column bacteria, but that different coral species harbour dissimilar
bacterial communities, even when physically adjacent. Moreover, microbial patterns of the same
coral species separated by time and space remained similar. These investigations strongly suggest
that coral-bacterial associations are non-random.
Aims of this Study
Though bacteria may be of similar great ecological significance for L. pertusa as described above
for warm-water scleractinians, the microbiology of this coral has been in scientific focus for only
a few years. Microbial aspects of the bioerosion patterns in L. pertusa skeletons were presented by

INTRODUCTION
9
Beuck and Freiwald (2005). Beside some preliminary investigations on L. pertusa-associated
bacteria (Kellogg and Stone 2004; Kellogg 2006), Yakimov et al. (2006) were the first to publish
phylogenetic data on metabolically active microbes in Mediterranean specimens of this coral. By
means of clone libraries derived from reversely transcribed bacterial 16S rRNA, the authors could
show that the sampled coral specimens sheltered a microbial community different from that of
dead corals, sediment, or surrounding water. Spatial variation of the bacterial community on
L. pertusa from the Mingulay-reefs in the Sea of the Hebrides was only recently observed by
Großkurth (2007). The author also reported evidence for both antimicrobial and growth-stimula-
ting factors that may permit L. pertusa to influence composition of its epibacterial community.
Latest contribution was made by Schöttner et al. (2008), who characterised and compared the
microbial consortia of L. pertusa by means of ARISA (Automated Ribosomal Intergenic Spacer
Analysis) (Fisher and Triplett 1999). The authors found that various parts (surface, skeleton,
mucus) of corals from in-situ (fjord slope, Norway) and ex-situ (maintenance tank) environments,
ambient seawater, and proximal sediment each exhibited distinct community profiles. This sug-
gested special relations between bacteria and the different habitats. All these studies show that
living L. pertusa hosts special bacterial associations which are unlike those of the environment,
and probably actively influenced by the coral. The associations appear to differ both with the
partitioning of their host and with its habitat.
One prerequisite to call an observed coral-microbial association truly ‘specific’ is spatial con-
stancy. Thus, the next step in understanding the microbiology of L. pertusa is to compare coral-
associated bacteria not only from different stations within the same geographic region, but also
from different geographic regions. Moreover, the existence of two colour phenotypes in L. pertusa
and their possible implications for microbial colonisation must be taken into account. Finally, bio
imaging can reveal the in-situ location of bacterial groups on the coral, providing insights in
possible microbe-host interactions.
The present study aimed at investigating these points, drawing a more comprehensive picture of
community structure, taxonomy, and in-situ location of L. pertusa-hosted microbes. Therefore,
the following objectives were posed:

INTRODUCTION
10
1.4
(1) Comparison of the bacterial assemblages of L. pertusa from the Trondheimsfjord in Nor-
way with those of the surrounding environment. This fjord is a high-latitude environment
comparable to those locations examined by the two latest studies (see above) but compri-
sing the coral’s shallowest habitat (Hovland and Risk 2003). It was thus important to
know whether L. pertusa from that region harbours special bacteria as well.
(2) Determination of the variability of these assemblages with the coral’s location in the
Trondheimsfjord and with its colour variety, respectively.
(3) Identification of the dominant bacterial groups associated with L. pertusa and their poten-
tial ecological role.
(4) Locating the (tissue-associated) bacteria on L. pertusa by in-situ imaging.
Answers to these questions should illuminate the relations between L. pertusa and its associated
bacteria. In particular, the issue whether this association is specific and implications for coral
ecology (nutrition, health, dispersal, and colouring) were to be discussed.
General Strategy
Microbial variability on L. pertusa from the Trondheimsfjord was addressed by the following
strategy: Sampling sites had to feature healthy cold-water corals that were not noticeably influ-
enced by human activity. To account for intra-regional variability, sites were sampled that lay at
least a few kilometres apart from each other, and at different depths. At each location, red and
white corals were recovered to assess inter-phenotypic bacterial variance. To get a suitable num-
ber of parallels for reliable statistics, three coral colonies were randomly collected per station with
three branches of healthy polyps sampled per colony. Thus, 9 samples per station and 27 samples
in total were acquired with about equal numbers of red and white L. pertusa branches. To test
whether bacteria found in L. pertusa were also ubiquitously present in the environment, water and
sediment samples were taken from the adjacency of the corals.
The Trondheimsfjord in mid Norway was chosen as sampling region for the following reasons:
Healthy and undisturbed L. pertusa reefs are known to grow at various locations within the fjord,
including its shallowest habitat on the Tautra reef (Hovland and Risk 2003). Infrastructure of

INTRODUCTION
11
Trondhjem Biological Station facilitated flexible land-based operation. The remotely operated
vehicle (ROV) “Minerva” of the Norwegian University of Science and Technology in Trondheim
was an ideal tool for the recovery of corals from deep locations. With the chartered research
vessel “Vita” providing a dynamic positioning system, precise navigation of the ROV was
ensured.
Marine prokaryotes are known for their extremely poor culturability (Amann et al. 1995). To
overcome this problem, culture-independent approaches were employed to meet the proposed
objectives (→ 1.3):
Objectives (1) and (2) were accomplished by Terminal Restriction Fragment Length Polymor-
phism (T-RFLP) (Liu et al. 1997) of the bacterial gene for the small ribosomal subunit RNA (16S
rDNA). In this method, DNA of complex bacterial communities is amplified by polymerase
chain reaction (PCR) with fluorescently labelled primers, and subsequently digested by a restric-
tion enzyme. Bacterial groups differ in number and location of restriction sites on the gene,
which results in restriction fragments (RFs) of different number and length for each group. These
RFs are separated according to their length by gel electrophoresis in an automated gene sequen-
cer. Only the fluorescently labelled terminal RFs (T-RFs) are detected by the machine, thereby
reducing the high complexity of the RF pattern of a multi-species environmental sample. An
electropherogram is produced with the T-RF signals that can be regarded as a ‘genetic finger-
print’ of the microbial community. Comparison of such ‘fingerprints’ from coral and environ-
mental samples was a means to detect differences and variations in bacterial community patterns.
Detailed phylogenetic analysis (objective (3)) was based on cloning and sequencing of PCR-
amplified prokaryotic 16S rDNA. This gene provides an excellent means of identification of bac-
terial species, as for it large nucleotide sequence databases and powerful tools for sequence com-
parison exist on the internet. Comparison with closely related organisms and evaluation of
common features of a phylogenetic group allows to infer the ecological potential of coral-hosted
bacteria, which was also part of objective (3).
The location of tissue-associated bacteria within the coral polyps (objective (4)) was determined
by Fluorescence In-Situ Hybridisation (FISH) on coral thin sections. Stony corals exhibit a typical
strong tissue autofluorescence that interferes with the signals of fluorescently labelled DNA

INTRODUCTION
12
probes commonly used to detect bacteria in situ. To surmount this impediment, a special FISH
technique named Catalysed Reporter Deposition Fluorescence In-Situ Hybridisation (CARD-
FISH) (Schönhuber et al. 1997; Pernthaler et al. 2002) was used. CARD-FISH employs DNA
probes labelled with horseradish peroxidase (HRP) at their 5’ end. This HRP catalyses the
deposition of fluorochrome-coupled tyramide molecules in the vicinity of the probe binding site
(a 16S or 23S rRNA molecule). This technique, known as Tyramide Signal Amplification (TSA),
provides up to 20-fold brighter signals relative to conventional monolabeled probes (Schönhuber
et al. 1997), and thus enables detection of marked cells even against the bright coral tissue
background.

MATERIALS AND METHODS
13
2.1
2 Materials and Methods
Location and Sampling
2.1.1 Topographic, Hydrological, and Biological Aspects of the
Trondheimsfjord
The Trondheimsfjord is located between 63°30’–64°N and 9°30’–11°30’E on the coast of mid
Norway (Fig. 3). From the seaward Agdenes sill with a depth of 195m, three consecutive basins
stretch to the inland: The seaward basin drops to the maximum depth of the fjord of 617 m
immediately behind the Agdenes sill and has a mean depth of 212 m, followed by the large middle
basin with a maximum depth of 440 m and a mean depth of 130 m. The innermost part,
Beitstadfjord, is also the shallowest with a maximum depth of 210 m and a mean depth of 86 m
(Jacobson 1983; Børsheim et al. 1999). The overall distance from the Agdenes sill to the end of
Beitstadfjord is approximately 135 km, making the Trondheimsfjord the third largest in Norway.
Seasonal variation of the fresh water supply from various rivers affects the surface salinity. The
less saline surface water is mixed with the more saline water from below while it moves seaward.
This produces a residual compensating current below the surface layer known as ‘estuarine circu-
lation’ (Jacobson 1983). Tidal currents up to 100 cm·s-1 at the Agdenes sill and up to 86 cm·s-1 at
the Tautra sill (separating seaward and middle basin) have been measured (Jacobson 1983). Water
masses below the surface layer in the fjord usually change twice a year, through the inflow of
deep water in winter and an intermediate coastal water inflow at 20-70 m depth in late summer or
early autumn (Jacobson 1983). Measurements of Børsheim et al. (1999) indicate that the water
column of the seaward basin is de-stratified in midwinter, and stratification starts in spring. In the
seaward fjord, below 100 m depth both temperature and salinity appear to be rather stable (7-8°C
and 34-34.7 PSU, respectively) (Jacobson 1983; Børsheim et al. 1999). The euphotic zone of the
Trondheimsfjord is not likely to exceed 20 m in depth (Sakshaug and Myklestad 1973).
Two spring blooms of diatoms are persistent from year to year in the area (Sakshaug and
Myklestad 1973): The first one starts in March and culminates in early April, nourished mainly by
nutrients accumulated during the winter. The second takes place in brackish waters during May-
June. This bloom is kept in a physiologically more or less steady state for up to more than one

MATERIALS AND METHODS
14
month apparently related to river floods due to snow melting. Through ‘estuarine circulation’ (see
above) the seaward transport of phytoplankton is compensated for by a continuous replenish-
ment of the populations, as in a chemostat system (Sakshaug and Myklestad 1973). High produc-
tivity favours the growth zooplankton, which in turn serves as prey for L. pertusa (cf.
Kiriakoulakis et al. 2005). The coral occurs on the Agdenes reef complex in the seaward basin
and on the Tautra sill. The Tautra reef complex is one of the world’s shallowest cold-water coral
reefs, reaching up to a depth of only 39 m below the sea surface. Because it has become a target
for scuba diving and other activity, the reef has been protected by Norwegian law as a marine
nature reserve on an interim basis, as of June 2000 (Fosså et al. 2002; Hovland and Risk 2003).
2.1.2 Sampling and Fixation
L. pertusa specimens were collected at three stations on the Tautra sill and in the seaward basin of
the Trondheimsfjord, on 20 and 21 October 2004: (1) ‘Tautra’ (geographic position, 63°35’34’’N,
10°31’4’’W; depth, 54 m; temperature, 9.6°C; salinity, 30.1 PSU), (2) ‘Stokkbergneset’
(63°28’14’’N, 9°55’8’’W; 264 m; 8.1°C; 31.9 PSU), and (3) ‘Røberg’ (63°28’36’’N, 9°59’43’’W;
240 m; 8.1°C; 31.2 PSU). Station ‘Tautra’ was characterised by silty sediment. The sites
‘Stokkbergneset’ and ‘Røberg’, both with rocky steep slope, lay about 30 km further south-west
to ‘Tautra’ at the transition to the sound connecting the seaward fjord basin and Norwegian Sea
(Fig. 3). All sampling sites featured apparently healthy coral communities without signs of pollu-
tion or other direct human influence.

MATERIALS AND METHODS
10° 00' E 11° 00' E
63° 30' N
63° 45' N
64° 00' N
0 5 10
km
Tautra(54 m)
Stokkbergneset(264 m)
Røberg(240 m)
TRONDHEIMSFJO
RD
NORWEG
IAN
SEA
Fig. 3: Map of stations in the Trondheimsfjord (Norway) sampled for this study. The mean sampling
depth is given in brackets for each station. (Created with Online Map Creation (OMC; http://
www.aquarius.ifm-geomar.de/omc) based on The Generic Mapping Tools (GMT) (Wessel and
Smith 1995).)
Sampling was accomplished with the SUB-Fighter 7500 remotely operated vehicle (ROV)
“Minerva” from the Norwegian University of Science and Technology (NTNU), Trondheim, in
cooperation with the ROV pilots J Järnegren from Trondhjem Biological Station (TBS) and
M Ludvigsen from NTNU. A landing net attached to the ROV served as collection device. The
net was cleaned after every sampling and also rinsed by the strong water current during the
descent of the ROV, so cross-contamination by remains of coral debris and mucus from the
previous sampling was unlikely to occur. Moreover, sampling of coral parts that had been in con-
tact with the net was avoided. Three colonies (white and red colour varieties) were randomly
collected at each station within a radius of about 10 m around the positions given above, and
three living branches with 3-5 polyps were randomly taken per colony, summing up to a total of
27 coral samples (15 white and 12 red). The branches were rinsed with sterile filtered seawater to
15

MATERIALS AND METHODS
16
remove loosely attached microbes from their surface, and individually put into sterile centrifuge
tubes.
All coral samples were incubated in sterile filtered MgCl2 solution to anaesthetise the coral polyps
for 30 minutes. Anaesthesia was regarded as beneficial for FISH (→ 2.5) in order to prevent the
polyps from full retraction, providing an unobscured view on the tentacles (cf. Bythell et al.
2002). Samples for DNA extraction were frozen at -20°C. Samples for FISH were incubated in a
sterile filtered solution of 4% paraformaldehyde in PBS (phosphate-buffered saline: 8.0 g NaCl,
0.2 g KH2PO4, 1.15 g Na2HPO4, 0.2 g KCl, H2O ad 1000 ml, pH 8.3) for 5-7 hrs, then
transferred into 50% [v/v] ethanol in sterile filtered seawater and frozen at -20°C.
Two samples of surrounding water (1 L each) were collected about 1 m apart from the coral
colonies at each station using a Niskin bottle that was attached to the ROV and disengaged
remotely. Water samples were cooled to 4°C until return to the laboratory at TBS (4-6 hrs) and
filtered through polycarbonate Nucleopore® membrane filters (0.2 µm pore size, ∅ 47 mm)
(Whatman). The filters were frozen at -20°C in small Petri dishes. Two sediment samples were
taken from the basis of two separate corals from station ‘Tautra’ and stored at -20°C in sterile
centrifuge tubes. It was not possible to collect sediment samples at the other two stations because
of their rocky steep slope.
For evaluation of the CARD-FISH method and the applied oligonucleotide probes the following
bacterial test strains were used: DSM498 (γ-Proteobacteria, Escherichia coli); DSM347 (Firmicutes,
Bacillus subtilis); environmental isolate, 98% 16S rDNA sequence similarity to type strain
022-2-10T (α-Proteobacteria, Erythrobacter vulgaris); environmental isolate, 99% 16S rDNA sequence
similarity to type strain ATCC 25495T (Actinobacteria, Streptomyces sampsonii). All strains were
cultured on agar plates and harvested during exponential growth phase (by courtesy of
A Gärtner). After fixation with 4% formaldehyde in PBS (pH 8.3) at 4°C overnight, bacterial cells
were spread onto polycarbonate Nucleopore® membrane filters (0.2 µm pore size, ∅ 47 mm)
(Whatman) by vacuum filtration, and frozen at -20°C in small Petri dishes. Sections of these
filters were processed the same way as coral thin sections in CARD-FISH (→ 2.5).

MATERIALS AND METHODS
17
2.2
2.3 T-RFLP
Freshly harvested polyps of aquarium-reared L. pertusa were used for testing the preparation and
CARD-FISH procedure on the coral. These specimens were fixed in PBS with 4% formaldehyde
for 5 hrs and immediately decalcified thereafter (→ 2.5).
DNA Extraction
Whole coral samples were pounded in liquid nitrogen with a mortar and pestle. To avoid carry-
over of DNA from consecutive sample treatments, tools were sterilised with 3 M HCl and
neutralised with sterile filtered PBS (pH 7.4). DNA was extracted from all sample types with the
UltraClean™ Soil DNA Kit (Mo Bio). About 1 g of material (corals/sediment) and approxi-
mately one eighth of the polycarbonate filter area (corresponding to the filtrate of about 125 ml
seawater) were employed in each extraction, respectively. To minimise DNA shearing, the
‘alternative lysis method’ proposed by the manufacturer (heating to 70°C instead of vortexing)
was applied with 4 times elongated incubation as compared to the manufacturer’s protocol.
DNA amplification. PCR with template DNA from environmental and coral samples was
conducted with the Phusion™ High-Fidelity PCR Kit (Finnzymes) according to manufacturer’s
instructions, and the Bacteria-specific primer 27f (5’-AGAGTTTGATCMTGGCTCAG-3’) and
universal primer 1492r (5’-GGTTACCTTGTTACGACTT-3’). This primer combination was
chosen in order to amplify a broad range of bacterial 16S rDNA sequences. Archaea were not
investigated in this study. Primers for T-RFLP were 5’-labelled with the fluorescent dyes 6-FAM
(27f) and VIC (1492r), respectively. The total reaction volume was 20 µl, containing 6 µl of
template DNA. Since it was impossible to measure the amount of bacterial DNA in the extract
(because eukaryotic DNA was present, too), concentration of template DNA was adjusted to
obtain clearly visible 16S-rDNA bands on the agarose gel (~10-50 ng per band, estimated by
ethidium bromide staining): undiluted DNA extract from coral samples, 1:400 diluted DNA
extract from sediment and water samples. PCR conditions were 3 min at 98°C; 35 cycles of: 10
sec at 95°C, 30 sec at 55°C, 45 sec at 72°C; 1 terminal elongation step of 5 min at 72°C. The
number of cycles had been adjusted to get a clear signal of coral-derived bacterial PCR products
in gel electrophoresis. Since this cycle number was kept constant in the whole assay, the PCR bias

MATERIALS AND METHODS
18
as systematic error remained comparable for all samples. PCR products were obtained from all
coral samples but one red from station ‘Tautra’, resulting in 26 coral PCR products.
Restriction digests. PCR products were purified by excision from a 1% agarose gel in Tris-
Acetate-EDTA buffer and subsequent extraction with the NucleoSpin® Extract II Kit
(Macherey-Nagel), and eluted from spin columns with 100 µl elution buffer. They were concen-
trated by conventional isopropanol precipitation and re-suspended with 30 µl elution buffer. The
PCR products were digested with two restriction endonucleases commonly used in T-RFLP,
Hha I and Alu I, respectively (New England Biolabs). 10 µl of purified PCR product were mixed
with 10 µl of restriction enzyme master mix containing 5 U of the respective enzyme. Restriction
reactions were incubated for 6 h at 37°C, followed by 20 min at 65°C to denature the enzyme.
Analysis. Restriction products were purified by ethanol precipitation and re-suspended in 12 µl
of Hi-Di™ formamide (Applied Biosystems). For determination of fragment lengths (‘size
calling’), a size standard mix was prepared containing 5.9 µl of Hi-Di™ formamide and 0.1 µl of
GeneScan® - 500 [ROX]™ size standard (Applied Biosystems) per sample. 6 µl of the size
standard mix were merged with 6 µl of the re-suspended restriction product and denatured at
95°C for 5 min. T-RF signals were detected by capillary electrophoresis on an ABI PRISM® 310
Genetic Analyser with POP-6™ Polymer in a 30 cm capillary (Applied Biosystems) under the
following conditions: injection time 15 sec, injection / electrophoresis voltage 15 kV, electropho-
resis current ~7 mA, gel temperature 60°C, run time 44 min. Electropherograms were analysed
with the program GeneScan® v2.0.2 (Applied Biosystems).
Statistics. Peak data of T-RFs between 30 and 500 nucleotides (nt) and signal intensities ≥50
(arbitrary units) were exported as tabular data from the Genetic Analyser. A data matrix was crea-
ted from the combined Hha I and Alu I peak data with samples as columns and peak positions
(T-RF lengths) as rows. The area under each peak was used as a measure of T-RF abundance,
standardised as percentage of total peak area as described by Lukow et al. (2000). Due to roun-
ding errors and minor variations in size determination, the length of defined T-RFs varied by
±1 nt among samples. Peaks were aligned within this range from their expected mean (cf. Lukow
et al. 2000). Rows without T-RF data were deleted from the matrix. Two distance matrices were
derived from the peak matrix employing (1) Manhattan distances and (2) percent mismatch

MATERIALS AND METHODS
19
2.4
distances based on binary (presence – absence) data of peaks. Non-metric Multidimensional
Scaling (MDS) was applied to ordinate samples in three dimensions according to the distance
matrices. Statistical analyses were performed with (1) average peak numbers of the sample types
and (2) the three MDS dimensions as independent variables, and ‘sample type’, ‘station’, and
‘colour variety’ (of the coral samples) as categorical predictors. The Shapiro-Wilk W statistic was
used to test the variables for normality. With normally distributed variables, a multivariate
analysis of variances (MANOVA) was performed, followed by Duncan’s test for post hoc evalu-
ation of significant differences. For non-normally distributed variables, non-parametric Kruskal-
Wallis-ANOVA was applied, combined with the Mann-Whitney U test for post hoc evaluation.
All statistics were executed with Statistica v6.1 (StatSoft).
Cloning and Sequencing
DNA amplification. For cloning, DNA extracts of all three stations were pooled according to
environmental sample type ( water / sediment) and colour variety (corals). In a first step, three
parallel PCRs were conducted for each pool ( water / sediment / white corals / red corals), each
with a total reaction volume of 20 µl containing 6 µl (corals) or 1 µl (water / sediment) of
undiluted DNA extract as template. PCR was conducted with the Phusion™ High-Fidelity PCR
Kit (Finnzymes) according to manufacturer’s instructions and primers 27f and 1492r. PCR condi-
tions were 3 min at 98°C; 20 cycles of: 10 sec at 95°C, 30 sec at 55°C, 45 sec at 72°C; 1 terminal
elongation step of 5 min at 72°C. PCR products of the three parallels were pooled and purified as
described above (→ 2.3, Restriction digests). Elution from spin columns was done in 25 µl
elution buffer. In a second step, the purified PCR products were re-amplified in a total reaction
volume of 50 µl containing 6 µl of template DNA (all samples). PCR conditions were 3 min at
98°C; 10 (water / sediment) or 20 (corals) cycles of: 10 sec at 95°C, 30 sec at 55°C, 45 sec at
72°C; 1 terminal elongation step of 5 min at 72°C. This two-step procedure aimed at obtaining
high quality PCR products for cloning while reducing formation of chimeric sequences.
Cloning. PCR products were purified and precipitated as described above (→ 2.3, Restriction
digests). Cloning was carried out with the TOPO TA Cloning® Kit for Sequencing with One
Shot® TOP10 Chemically Competent E. coli (Invitrogen). This kit was preferred for its high
reliability, but it required DNA inserts with a 3’ adenosine overlap for ligation with the cloning
MATERIALS AND METHODS
20
vector. Since the Phusion™ polymerase produces blunt-ended PCR products, a terminal deoxy-
adenosine had to be added to the 3’ ends of the amplified DNA prior to ligation. For this
purpose, the natural non-template-dependent terminal transferase activity of Taq polymerase was
exploited: PCR products were incubated in 50 µl of 1x ThermoPol buffer (New England Biolabs)
with 1 Unit of Taq DNA Polymerase (New England Biolabs) and 200 µM dATP (Roche) for
30 min at 72°C. After terminal adenosine addition, PCR products were purified and precipitated
as described above (→ 2.3, Restriction digests) and re-suspended with 25 µl elution buffer. Puri-
fied products were ligated into the vector, followed by transformation of competent E. coli accor-
ding to manufacturer’s instructions. Cells were spread onto LB agar-plates amended with kana-
mycin (recipe given in the TOPO TA Cloning® Kit manual) and grown at 37°C overnight. Clone
forming units were separated into 96-well plates filled with liquid LB medium, and re-grown at
37°C overnight. Cloned 16S rDNA inserts were re-amplified with the primer pair T3 / T7
(contained in the cloning kit). The total reaction volume was 45 µl containing 0.5 µl of E. coli cell
suspension, 1 U of Taq DNA Polymerase (New England Biolabs), 0.1 µM of each primer, 50 µM
of each dNTP, and 1x ThermoPol buffer. PCR conditions were 5 min at 95°C; 35 cycles of:
10 sec at 95°C, 30 sec at 55°C, 1 min at 72°C; 1 terminal elongation step of 10 min at 72°C.
Aliquots of 5 µl were taken from each PCR product and tested for their correct length (about
1,600 base pairs, including the T3 and T7 priming sites) by agarose gel electrophoresis.
Sequencing. PCR products from clones showing correct length were sequenced at the Institute
for Clinical Molecular Biology at Kiel University Hospital (Kiel, Germany). Purification of PCR
products and sequencing procedure were as described by Gärtner et al. (2008). Partial sequences
were obtained by sequencing with primer 27f. For nearly complete sequences, PCR products
were additionally sequenced with primer 1492r, followed by assembling of the two overlapping
partial sequences.
Phylogenetic analysis. Sequence data were visually checked for quality issues. Putative chimeric
sequences were detected and eliminated using the online tools Chimera Check v2.7 of the
Ribosomal Database Project II (RDP II) release 8.1 (Cole et al. 2003) and the Bellerophon
chimera detection program (Huber et al. 2004). The sequence classifier of RDP II release 9
(http://rdp.cme.msu.edu/classifier/classifier.jsp) (Cole et al. 2007) and BLAST (Basic Local
Alignment Search Tool; http://www.ncbi.nlm.nih.gov/blast/Blast.cgi) (Altschul et al. 1990) were

MATERIALS AND METHODS
21
used for classification of the bacterial sequences and determination of closest relatives. The latter
were obtained from the EMBL nucleotide sequence database (http://srs.ebi.ac.uk/) (Kulikova et
al. 2004). Data of sequences from this study, their closest relatives, and sequences of coral-
associated bacteria from other studies were imported into a sequence library of ARB v2.5b
(Ludwig et al. 2004) and aligned according to 16S rRNA secondary structure information. A posi-
tional mask was applied that only allowed for unambiguously alignable sequence positions in all
following phylogenetic assays. This mask comprised E. coli 16S rRNA positions (Brosius et al.
1981) 28-68, 101-183, 220-451, 480-838, 848-1003, 1037-1134, 1140-1440, and 1461-1491.
Aligned sequences were incorporated into the phylogenetic ‘backbone’ tree of the ARB library
consisting of over 52,000 sequences, using parsimony as inference method. Sequences were
grouped into operational taxonomic units (OTUs) if the proportion of identical sequence posi-
tions shared between any two of them was ≥97%, which corresponds approximately to affiliation
with the same species (Stackebrandt and Goebel 1994). A rarefaction analysis was conducted,
applying the algorithm of Hurlbert (1971) implemented in the program aRarefactWin (http://
www.uga.edu/~strata/software/). Theoretical coverage of microbial diversity in the different
sample types was estimated from rarefaction curves with the method of Thiel, Neulinger et al.
(2007b) (→ Appendix). A maximum likelihood tree with sequences of interest was calculated
with 100 bootstrap replicates using the program PHYML (Guindon and Gascuel 2003). To
ensure clearness and reliability of this tree, a subset of 133 sequences from the initial ARB align-
ment was used. This subset contained only reference sequences of relevant OTUs from this
study, sequences of coral-associated bacteria from other studies, and reference sequences. An
OTU was considered ‘relevant’ if it (1) comprised at least two sequences from this study that
were not from water or sediment clones, or (2) was related to a sequence of a coral-associated
bacterium form another study. The corresponding subset of the ARB ‘backbone’ tree was used as
starting tree in PHYML sustaining topology and branch lengths. The most appropriate model of
nucleotide substitution for the maximum likelihood calculation was determined with the program
ModelGenerator v0.84 (Keane et al. 2006). A detailed phylogeny for classification of L. pertusa-
hosted Mycoplasmataceae was calculated the same way. For comparison of results from cloning and
T-RFLP the T-RFs of clone sequences were determined in silico with the tool TRF-CUT (Ricke
et al. 2005) integrated in ARB.

MATERIALS AND METHODS
22
2.5
Nucleotide sequence accession numbers. Reference clone sequences of all OTUs from
L. pertusa samples and clone sequences from water and sediment samples obtained in this study
were deposited in the EMBL nucleotide sequence database (Kulikova et al. 2004) under accession
numbers AM911346-AM911622.
Fluorescence In-Situ Hybridisation
Decalcification and thin sectioning. The polyps had to be decalcified for CARD-FISH, since
the carbonate of the corallum would have hampered thin sectioning as well as epifluorescence
microscopy (see below) because of its autofluorescence. Coral branches were decalcified in 20%
[w/v] EDTA in PBS (pH 8.3). The solution was changed 2-3 times over two days until the coral
skeleton was completely dissolved and polyps remained connected only by the coenosarc. The
polyps were then singularised and dehydrated in a graded ethanol/xylene series (ethanol 70% –
90% – 95% – 2×100%, xylene 3×100% [v/v]) at room temperature (RT) for 20 min each step,
followed by 2× infiltration in paraffin at 60°C for 10 min each and paraffin embedding in cuboid
tin foil molds. Series of 4-5 longitudinal sagittal sections (6-10 µm) of the embedded polyps were
immobilised onto SuperFrost Plus slides (Menzel) (2 series per slide). They were de-paraffinated
by heating to 60°C and immediate washing in pure xylene and ethanol for 30 sec each step.
Permeabilisation and peroxidase inactivation. Coral thin sections were re-hydrated in ethanol
(100% – 70% [v/v]) and H2O for 30 sec each step. To avoid merging of liquids on the slide, thin
sections were framed with a hydrophobic border using a paraffin crayon. Bacterial cell walls were
permeabilised by incubation in 100-200 µl lysozyme buffer (1.355·106 U·ml-1 lysozyme (Serva),
500 mM EDTA (pH 8.0), 300 mM Tris-HCl (pH 8.0), H2O ad 100% [v/v]) at 37°C for 2 hrs.
After washing with H2O at RT for 3×1 min, some samples were additionally permeabilised with
100-200 µl achromopeptidase buffer (60 U·ml-1 achromopeptidase (Sigma), 10 mM NaCl, 10 mM
Tris-HCl (pH 8.0), H2O ad 100% [v/v]) at 37°C for 1 hr. Slides were again washed with H2O at
RT for 3×1 min and air-dried. For inactivation of endogenous peroxidases, thin sections were
incubated in 100-200 µl of 3% [v/v] H2O2 at RT for 30 min, followed by washing with H2O at
RT for 3×1 min, air-drying, and storage at -20°C until further processing.

MATERIALS AND METHODS
23
Hybridisation. HRP-labelled oligonucleotide probes (Table 1) were purchased from biomers.net
(http://www.biomers.net). The lyophilised probes were rehydrated in H2O, quantified with a
NanoDrop ND-1000 spectrophotometer (Thermo Fisher Scientific), and adjusted to 50 ng·µl-1
(probe working solution). The hybridisation buffer consisted of 20-60% [v/v] formamide (depen-
ding on the probe, see Table 1), 900 mM NaCl, 20 mM Tris-HCl (pH 8.0), 10% [w/v] dextran
sulphate (Sigma), 0.01% [w/v] sodium dodecyl sulphate (SDS), 10% [v/v] blocking solution, and
H2O ad 100% [v/v]. The blocking solution was made of 10% [w/v] blocking reagent for nucleic
acid hybridisation (Roche), 1.16% [w/v] maleic acid (Fluka), 150 mM NaCl, and H2O ad 100%
[v/v], pH 7.5. 100-200 µl of a 1:200 [v/v] mixture of probe working solution and hybridisation
buffer were spread onto the thin sections.
Table 1: Oligonucleotide probes used in FISH for identification of bacterial populations. Names, targeted
taxa, targeted rRNA molecules and sites, and sequences of the probes, and the formamide con-
centrations in the hybridisation buffer required for specific in-situ hybridisation are stated.
Probe Target group Target rRNA Target site2) Sequence (5'→3') % formamide Reference
ALF968 α-Proteobacteria 16S 968−985 GGTAAGGTTCTGCGCGTT 45 Neef (1997)EUB338 I most Bacteria 16S 338−355 GCTGCCTCCCGTAGGAGT 55 Amann et al. (1990)EUB338 II Planctomycetes 16S 338−355 GCAGCCACCCGTAGGTGT 55 Daims et al. (1999)EUB338 III Verrucomicrobia 16S 338−355 GCTGCCACCCGTAGGTGT 55 Daims et al. (1999)GAM42a γ-Proteobacteria 23S 1027−1043 GCCTTCCCACATCGTTT 50 Manz et al. (1992)BET42a1) β-Proteobacteria 23S 1028−1043 GCCTTCCCACTTCGTTT 50 Manz et al. (1992)HGC236 Actinobacteria 16S 236−253 AACAAGCTGATAGGCCGC 30 Erhart et al. (1997)LGC0355 Firmicutes 16S 355−373 GGAAGATTCCCTACTGCTG 45 Hallberg et al. (2006)LGC0355b Mycoplasmataceae 16S 355−373 GGAATATTCCCTACTGCTG 35 this studyMYC850 Mycoplasmataceae from this study 16S 850−867 CGTTAGCTACGCCAGTGA —3) this studyNON338 — (control) — — ACTCCTACGGGAGGCAGC 55 Wallner et al. (1993)1) Used as unlabeled competitor with probe GAM42a. 2) E. coli numbering (Brosius et al. 1981). 3) No signal with 20% formamide.
Slides were incubated at 35°C for 3-4 hrs in a vapour saturated repository and subsequently
washed in Falcon tubes containing 50 ml of washing buffer at 37°C for 5 min. The washing
buffer consisted of NaCl (concentration corresponding to the amount of formamide in the hybri-
disation buffer, see Table 2), 20 mM Tris-HCl (pH 8.0), 5 mM EDTA (pH 8.0), 0.01% [w/v]
SDS, and H2O ad 100% [v/v].

MATERIALS AND METHODS
24
Table 2: Concentration of NaCl in the washing buffer corresponding to the amount of formamide in the
hybridisation buffer. Concentrations are determined for stringent washing at 37°C after hybridi-
sation at 35°C.
% formamide in hybridisation buffer mM NaCl in washing buffer
20 135 25 95 30 64 35 42 40 27 45 16 50 9 55 3 60 0
Tyramide Signal Amplification (TSA). Cyanine 3 (Cy3) and fluorescein tyramide conjugates
from TSA™ Tyramide Reagent Packs (PerkinElmer) were dissolved according to the manufac-
turer’s instructions. The amplification buffer contained 10% [v/v] blocking solution (see above),
2 M NaCl, 10% [w/v] dextran sulphate, 0.0015% [v/v] H2O2, and PBS (pH 7.3) ad 100% [v/v].
Thin sections were equilibrated with PBS (pH 7.3) at RT for 15 min. 100-200 µl of a 1:500 [v/v]
mixture of tyramide solution and amplification buffer were spread onto the thin sections. Incuba-
tion of the slides at 46°C for 30 min in a dark, vapour saturated repository was followed by
washing with PBS (pH 7.3) at RT for 20 min and H2O at RT for 3×1 min.
Double hybridisation. Simultaneous marking of bacteria with two different probes was accom-
plished as follows: After the first signal amplification with Cy3 tyramide HRP was inactivated
with H2O2 as described above. Then a second hybridisation and signal amplification with fluores-
cein tyramide was carried out. In a parallel treatment, probe NON338 was used for the second
hybridisation to prove that these signals did not result from persisting HRP activity of the first
hybridisation.
Mounting. Air-dried thin sections were covered in mountant (80% [v/v] Citifluor AF1 (Citifluor
Ltd.), 14% [v/v] VECTASHIELD® Mounting Medium (Vector Laboratories), 1 µg·ml-1 4’,6’-
diamidino-2-phenylindole (DAPI) (Sigma), and PBS (pH 9) ad 100% [v/v]) and stored at -20°C
until microscopic analysis.
Microscopy and image processing. Thin sections were viewed on a Leitz DMRB epifluores-
cence microscope, equipped with filter sets A, N2.1, and I3 (for fluorescence detection of DAPI,

MATERIALS AND METHODS
25
Cy3, and fluorescein, respectively), and 40× and 100× PL FLUOTAR objectives (all from Leica).
Image stacks were taken with a digital still camera by advancing the focus layer through the z-axis
of the whole thin section in steps of ~2 µm and ~1 µm for the 40× and 100× objective, respec-
tively. Deconvolved composite images were produced from these stacks with the software
Helicon Focus v4.21 (Helicon Soft Ltd.). Overlay images for the simultaneous display of fluores-
cence signals of different dyes were produced with Photoshop® CS (Adobe).
Probe specificity assay. To cross-check specificity of the newly designed probe LGC0355b, a
culture of B. subtilis DSM347 (which has the probe LGC0355 target site) was hybridised with
probes LGC0355 and LGC0355b, respectively, each with 35% formamide. Signal brightness was
compared between the two approaches after TSA with Cy3 tyramide. As bacterial cultures har-
vested during their exponential growth phase have a vast number of ribosomes, even sub-optimal
probe binding results in bright fluorescence signals. This makes it difficult to assess brightness
differences with the naked eye. Therefore, digital image analysis was employed to compare signal
intensities: Of each hybridisation five digital images from filter sections densely covered with bac-
teria were taken with identical camera settings. Cumulative histograms of pixel brightness values
were obtained with ImageJ v1.37 (Rasband 1997-2007). To ensure that results were not biased by
dark spaces between the bacterial cells or pixel super saturation, only intermediate brightness
values between 80 and 165 (arbitrary units) were taken into account.

RESULTS
26
3.1 T-RFLP
3 Results
3.1.1 Comparison of Coral and Environmental Samples
T-RFLP, like other PCR-based fingerprinting methods, generates datasets (patterns, electrophe-
rograms; Fig. 4) that relate each signal (peak) – in the best case – to a single taxon (Casamayor et
al. 2002). T-RFLP analysis of this study yielded such datasets for 26 coral, 6 water, and 2 sedi-
ment samples. A total of 517 different electropherogram peak positions were observed. Overlay
plots of electropherograms from the three sample types are shown for restriction enzymes Hha I
(Fig. 4 a) and Alu I (Fig. 4 b) in combination with primer 27f. The figure gives an impression of
what the raw data obtained from the genetic analyser looked like. However, it does neither pro-
vide a detailed view due to the limited resolution of the graphic, nor does it allow direct compa-
rison of relative peak intensities. Analyses were therefore solely conducted on the peak matrices.
Comparative values for T-RF profiles of the different sample types are summarised in Table 3. In
the peak matrix, 167 (32.3%) peaks belonged exclusively to corals, while the others were shared
with sediment (34 peaks, 6.6%), water (49 peaks, 9.5%), or both (78 peaks, 15.1%), summing up
to a total of 161 shared peaks (31.1%).
Table 3: Absolute and relative numbers of T-RFLP peaks shared by the respective sample types.
corals only
sediment only
water only
corals + sediment
corals + water
sediment + water
all samples ∑
167 32.3%
85 16.4%
74 14.3%
34 6.6%
49 9.5%
30 5.8%
78 15.1%
517 100.0%

RESULTS
co
rals
wa
ter
se
dim
en
t
3 00
0
600
900
1200
1600
300
0
600
900
1200
1600
300
0
600
900
1200
1600
30 60 90 120 150 180 210 240 270 300 330 360 390 420 450 480
Hha I - 27f: Fragment length / nucleotidesS
ign
al in
ten
sity /
arb
itra
ry u
nits
1 clone 2-5 clones >5 clones
a
cora
lsw
ate
rsedim
ent
3 00
0
600
900
1200
1600
300
0
600
900
1200
1600
300
0
600
900
1200
1600
30 60 90 120 150 180 210 240 270 300 330 360 390 420 450 480
Alu I - 27f: Fragment length / nucleotides
1 clone 2-5 clones >5 clones
Sig
nal in
tensity / a
rbitra
ry u
nits
b
Fig. 4: T-RFLP chromatograms produced by restriction enzymes Hha I (a) and Alu I (b) in combination
with primer 27f. All chromatograms of a respective sample type were combined to a single over-
lay plot to illustrate the overall pattern. T-RFs of clone sequences (→ 3.2.2) as determined by
TRF-CUT are indicated as triangles at the respective positions.
27

RESULTS
28
The average number of peaks per sample was highest for sediment (150.5), followed by water
(83.8), red (54.3) and white (39.4) coral samples. Significance of these differences was tested by
Kruskal-Wallis-ANOVA and Mann-Whitney U test, because the distribution of average peak
numbers deviated from normality. Kruskal-Wallis-ANOVA indicated significant differences
between average peak numbers of the respective sample types (p <0.01). However, the diver-
gence between average peak numbers of red and white coral samples was insignificant according
to the Mann-Whitney U test.
Non-metric Multidimensional Scaling (MDS) is used in data visualisation for exploring similarities
or dissimilarities between items. In this case the items were coral and environmental samples and
the measure of dissimilarity was the Manhattan or percent mismatch distance between any pair of
samples based on their T-RFLP peak patterns. Manhattan distance is more robust to outliers than
the conventional Euclidean distance measure in the case of normalised peak areas, while percent
mismatch measure is particularly suited for binary (presence – absence) data. For comparison of
N items a matrix of N·(N-1)/2 pairwise distances has to be constructed. A diagram with up to
N-1 dimensions would be needed to visualise the distances between all items correctly, which can
become impractical for N >4. MDS takes the distance matrix as input and yields a smaller matrix
of item ‘dimensions’, the configuration of which minimises a loss function called ‘stress’. Coordi-
nates are plotted in a diagram with 2 or 3 dimensions. Proximity of the items to each other in the
diagram indicates how similar they are. The fewer dimensions, the easier it is to interpret the
results, but also the worse is the statistical fit. The stress value reported along with each ordi-
nation specifies the quality of preservation of the original distance values in the diagram:
Following Clarke (1993), stress values <0.10 indicates an ideal preservation, i.e., the configuration
of items is close to their actual distances. A stress value ≤0.15 still means a good ordination.
Higher values (around 0.20) indicate that the original relations between items are depicted in an
exceedingly contorted manner and details of the plot should not be over-interpreted.
MDS is an appropriate means for the exploration of relationships between biological samples,
because the method does not assume normal distribution of the raw data. This property is almost
never met by biological data in general and T-RFLP patterns in particular. On the other hand, the
resulting coordinates often feature normal distribution and can be used as input for further
statistical analyses.

RESULTS
29
For clearness, of the three dimensions calculated by MDS only the two with the most conspicu-
ous differences were plotted in the following diagrams. Coral, water, and sediment samples of all
stations were clearly separated from each other by MDS based on normalised peak areas (Fig. 5 a)
(stress: 0.10). Data points clustered closely together within their respective sample type with no
overlap between different sample types. This separation of coral, water, and sediment samples
was corroborated by MANOVA (p <0.00). A similar picture was given by MDS based only on
the presence or absence of T-RFs, so-called ‘binary’ peak data (Fig. 5 b) (stress: 0.05), though this
analysis led to greater scattering as compared to MDS based on normalised peak areas. The two
more remote sample points in question (one from water and one from sediment) belonged to
samples with above-average peak numbers in their T-RFLP profiles. For binary peak data the
same clear separation of sample types as for normalised peak data was confirmed by Kruskal-
Wallis-ANOVA (p<0.00 for dimensions 1 and 2).

RESULTS
Dimension 1 / arbitrary units
-1.5 -1.0 -0.5 0.0 0.5 1.0 1.5 2.0
Dim
en
sio
n 3
/ a
rbitra
ry u
nits
-1.5
-1.0
-0.5
0.0
0.5
1.0
1.5
corals
sediment
water
a
Dimension 1 / arbitrary units
-1.0 0.0 1.0 2.0 3.0 4.0 5.0
Dim
en
sio
n 2
/ a
rbitra
ry u
nits
-2.0
-1.0
0.0
1.0
2.0
3.0
corals
sediment
water
b
30
Fig. 5: Multidimensional scaling (MDS) ordination of coral (26 data points), sediment (2 data points),
and water samples (6 data points). Ordination was based on Manhattan distances (a) and percent
mismatch distances (b) derived from the T-RF peak matrix. For clearness, of the three calculated
MDS dimensions only the two with the most conspicuous differences were plotted. Stress values
for dimensional downscaling were 0.10 (a) and 0.05 (b), respectively.

RESULTS
3.1.2 Differences between Coral Samples
For analysis of coral samples, T-RFs were divided into two categories: (1) ‘rare’ peaks occurring
in less than one third (<9) of the coral samples (291 T-RFs) and (2) ‘consistent’ peaks occurring
in at least one third (≥9) of the coral samples (37 T-RFs). Fig. 6 illustrates that, though only
about one out of nine coral-derived T-RFs was consistent according to the above definition, the
second category comprised all dominant peaks (i.e., peaks with highest relative abundance
values).
median
25%-75%
min-max
Rare
coral T-RFs
Consistent
coral T-RFs
0
5
10
15
20
25
30
35
Ave
rag
e r
ela
tive
ab
un
da
nce
/ p
erc
en
t
291 37
Fig. 6: Distribution of average relative abundances for rare and consistent coral T-RFs. For each distri-
bution the median, central quartiles (25%-75%), and extremes (min-max) are plotted. The number
of T-RFs falling into the respective category is stated below the box plots.
31
MDS dimensions derived from relative abundances of rare peaks (stress: 0.12) (not shown)
deviated considerably from normal distribution. Kruskal-Wallis-ANOVA revealed significant
differences between stations in dimension 1 (p <0.01). Pairwise comparison by the Mann-
Whitney U test denoted the differences between stations 1 and 2 (p =0.03), and between stations
2 and 3 (p <0.01) to be significant. The effect of ‘colour variety’ was insignificant.

RESULTS
MDS data of consistent peaks (Fig. 7) (stress: 0.09) were approximately normally distributed.
With two-way MANOVA the predictor ‘station’ accounted for a significant difference between
corals from different sampling sites (Fig. 7 a) (p =0.03). Post hoc comparison with Duncan’s test
revealed significant differences between stations 1 and 2 (p <0.01). This is also visible in Fig. 7 a,
where values of dimension 2 were mostly positive for coral samples from station 1, while coral
samples from station 2 had mostly negative values.
In addition, also dissimilarities between T-RFLP profiles from corals of different colour (Fig.
7 b), denoted by the predictor ‘colour variety’, were significant (p =0.05). This difference became
only clear from two-way MANOVA of MDS coordinates of the coral samples, since it was not as
evident from the distribution of sample points as the differences between sampling sites (see
above). However, the means of sample coordinates of MDS dimension 2 were more positive for
red than for white coral samples (Fig. 8).
The crossover effect ‘station’ × ‘colour variety’ that could be evaluated by two-way MANOVA
was insignificant.
Dimension 1 / arbitrary units
-1.5 -1.0 -0.5 0.0 0.5 1.0 1.5
Dim
en
sio
n 2
/ a
rbitra
ry u
nits
-1.5
-1.0
-0.5
0.0
0.5
1.0
1.5
station 1
station 2
station 3
a
32

RESULTS
33
Dimension 1 / arbitrary units
-1.5 -1.0 -0.5 0.0 0.5 1.0 1.5
Dim
en
sio
n 2
/ a
rbitra
ry u
nits
-1.5
-1.0
-0.5
0.0
0.5
1.0
1.5
red corals
white coralsb
Fig. 7: Multidimensional scaling (MDS) ordination of coral samples (26 data points) based on relative
abundances of consistent peaks. The plot is shown twice with samples differentiated into groups
from same station (a) and of same colour variety (b), respectively. For clearness, of the three cal-
culated MDS dimensions only the two with the most conspicuous differences were plotted. The
stress value for dimensional downscaling was 0.09.

RESULTS
Dim
ensio
n 2
/ a
rbitra
ry u
nits
white corals red corals
mean
+/-
standard
error
-0.3
-0.2
-0.1
0.0
0.1
0.2
0.3
Fig. 8: Summary of the MDS ordination of coral samples differentiated into groups of same colour
variety (Fig. 7 b). Means and standard errors of sample coordinates of MDS dimension 2 are
given for white and red coral samples.
Corresponding analyses were carried out with MDS dimensions based on (1) rare binary peak
data (stress: 0.00), and (2) dominant binary peak data (stress: 0.15) (not shown). Since variables
considerably deviated from normal distribution in both cases, Kruskal-Wallis-ANOVA and
Mann-Whitney U test were employed to test differences between samples.
In consideration of rare binary T-RF data the predictor ‘station’ accounted for significant differ-
ences between coral samples in dimensions 1 (p =0.02) and 3 (p =0.04). Post hoc comparisons
yielded significant differences between stations 1 and 2 (dimension 3; p <0.01), and between
stations 2 and 3 (dimension 1; p =0.02). The effect of ‘colour variety’ was insignificant.
No significant differences were observed for any of the two predictors in consideration of
dominant binary T-RF data.
34

RESULTS
35
3.2 Cloning and Sequencing
3.2.1 Phylogenetic Analyses
A total of 536 16S rDNA clone sequences passed quality checks and were subjected to phylo-
genetic analysis: 177 from white corals, 163 from red corals, 71 from water, and 125 from sedi-
ment. Length of partial sequences ranged from 294 nt (one sequence) to 902 nt (average, 765 nt).
12 nearly complete sequences from selected bacterial OTUs were retrieved for comparison with
FISH probe target sites, design of new FISH probes, and to increase the data basis for phylo-
genetic calculations. These sequences were 1318 nt to 1421 nt long (average, 1374 nt), and
marked by the suffix “full” in the phylogenetic tree (Fig. 11). Based on 97% sequence similarity
the number of OTUs found in the respective sample types were 27 (white corals), 54 (red corals),
28 (water), and 74 (sediment). Rarefaction analysis (Fig. 9) assigned highest bacterial OTU rich-
ness to the sediment, followed by red L. pertusa, water, and white L. pertusa. Consequently, theore-
tical coverage of total bacterial diversity was highest in white L. pertusa (83.2%), followed by water
(64.7%), sediment (60.3%), and red L. pertusa (42.1%). Table 4 summarises these properties of the
sequence library.

RESULTS
Number of clones sampled
0 100 200 300 400
Num
ber
of O
TU
s o
bserv
ed
0
20
40
60
80
100
120red corals
white corals
sediment
water
Fig. 9: Rarefaction analysis. The expected number of OTUs is plotted against the number of analysed
clones from red and white L. pertusa, sediment, and water. Dotted lines mark the extrapolations of
the respective rarefaction curves according to the calculation method of Thiel, Neulinger et al.
(2007b). The asymptotes of these curves give an estimate of the expected number of OTUs to be
found if an infinite number of clones were sampled, which is tantamount to the maximum
expectable OTU richness.
Table 4: Summary of properties of the sequence library. For all sample types, the following values are
given: Number of analysed clones, number of OTUs based on 97% sequence similarity, and theo-
retical coverage of total bacterial richness estimated by rarefaction analysis.
white corals red corals water sediment
no. of clones 177 163 71 125
no. of OTUs 27 54 28 74
coverage 83.2% 42.1% 64.7% 60.3%
36

RESULTS
Affiliation with bacterial phyla and classes (in case of Proteobacteria) and relative abundances of
16S rDNA sequences from corals, water, and sediment are shown in Fig. 10. Qualitative and
quantitative differences of the large-scale bacterial community compositions between coral,
water, and sediment samples are visible at first sight. Sequences assigned to the phylum Proteobac-
teria constituted the largest fraction, not only in water and sediment but also in both coral colour
varieties (64% in white, 50% in red L. pertusa). In either case this fraction was dominated by the
classes α- and γ-Proteobacteria. Other major taxa (relative abundance ≥10%) occurring on both
coral phenotypes were Actinobacteria, Verrucomicrobia, Firmicutes, and Planctomycetes. Some minor
taxa (relative abundance <10%) were exclusively found on either colour variety, namely candidate
division TM7 on white L. pertusa and δ-Proteobacteria as well as Bacteroidetes on red L. pertusa. A
small group of cyanobacterial sequences was found on both coral colour varieties but not in the
water.
Sediment
Acidobacteria
2%
Chloroflexi
10%
Planctomycetes
12%
OP11
2%γ−Proteobacteria
16%
δ−Proteobacteria
30%
uncertain
1%
Actinobacteria
6%
Bacteroidetes
3%
Gemmatimonadetes
2%
Spirochaetes
3%α−Proteobacteria
12%WS3
2%
Water
Actinobacteria
4%
Deferribacteres
6%
α−Proteobacteria
41%
β−Proteobacteria
1%
γ−Proteobacteria
41%
δ−Proteobacteria
1%
Bacteroidetes
4%
Spirochaetes
1%
red Lophelia pertusa
Actinobacteria 10%
Bacteroidetes 6%
Cyanobacteria 1%
Firmicutes 2%
Planctomycetes 4%
Verrucomicrobia 28%α−Proteobacteria
28%
γ−Proteobacteria
20%
δ−Proteobacteria 2%
white Lophelia pertusa
Actinobacteria
19%
Cyanobacteria
1%
Firmicutes
6%
Planctomycetes
3%
TM7
1%
Verrucomicrobia
6%
α−Proteobacteria
61%
γ−Proteobacteria 3%
Fig. 10: Affiliation with bacterial phyla and classes (Proteobacteria) and relative abundances of 16S rDNA
sequences. Data are given separately for red and white L. pertusa, water, and sediment. Equal
colours in the respective pie charts denote equal taxa.
37

RESULTS
38
Detailed analysis on the OTU level revealed that, despite the number of phyla and classes shared
among coral colour variations, white and red L. pertusa had only twelve OTUs in common. This
equals mere 16% of the combined bacterial richness of 75 OTUs for both coral colour varieties.
Commonalities between corals and environment were confined to the class γ-Proteobacteria, where
three OTUs were common to corals and seawater, and one OTU was shared between corals and
sediment.
A phylogeny of 133 reference sequences of relevant OTUs is shown in Fig. 11. These OTUs (1)
comprised at least two sequences from this study that were not from water or sediment clones or
(2) were related to a sequence of a coral-associated bacterium form another study. The phyloge-
netic tree was based on maximum likelihood calculation according to the GTR+I+G model of
nucleotide substitution.
Relevant OTUs affiliated with eight bacterial phyla (Proteobacteria, Bacteroidetes, Firmicutes, Cyanobac-
teria, candidate division TM7, Actinobacteria, Verrucomicrobia, and Planctomycetes). Several sequences
published by Yakimov et al. (2006) belonged to three additional phyla (Gemmatimonadetes, Acidobac-
teria, and Nitrospira) that were exclusively associated with Mediterranean L. pertusa. Details on
these bacterial groups are presented in the following, emphasising microbes of potential signifi-
cance for the ecology of L. pertusa. Taxonomic classification below the phylum / class level is
given for L. pertusa-associated OTUs as far it could be reliably determined. For all database
sequences their accession numbers and similarity to L. pertusa-originating sequences are stated in
brackets. In cases with no overlap between a L. pertusa-originating and a database sequence the
similarity to the closest common relative was determined instead.

RESULTS
α−Proteobacteria
γ−Proteobacteria
other Bacteria (b)
mucus bacterium 23, Oculina patagonica, AY654769
slope strain EI1*, North Atlantic slope sediment, AF254105
clone ctg_CGOAB33, Bamboo Coral, DQ395503
slope strain DIII4*, North Atlantic slope sediment, AF254106
D05_CW03_full, white D05_CW03_full, white Lophelia pertusa, Lophelia pertusa, AM911409, 65AM911409, 65
A02_CR01, red A02_CR01, red Lophelia pertusa, Lophelia pertusa, AM911347, 1AM911347, 1
E03_CW03, white E03_CW03, white Lophelia pertusa, Lophelia pertusa, AM911415, 5AM911415, 5
Sulfitobacter sp. clone F2C43, Antarctic seawater, AY697883
E07_CR02_full, red E07_CR02_full, red Lophelia pertusa, Lophelia pertusa, AM911377, 1AM911377, 1
H07_CW02_full, white H07_CW02_full, white Lophelia pertusa, Lophelia pertusa, AM911425, 7AM911425, 7
A04_CR01_full, red A04_CR01_full, red Lophelia pertusa, Lophelia pertusa, AM911350, 1AM911350, 1
A04_CW03, white A04_CW03, white Lophelia pertusa, Lophelia pertusa, AM911401, 6AM911401, 6
Roseobacter sp. strain MBT22, Flustra foliacea, AJ344506
D08_CW03, white D08_CW03, white Lophelia pertusa, Lophelia pertusa, AM911410, 2AM911410, 2
clone PDC-OTU3, Pocillopora damicornis, AY700622
D10_CW02, white D10_CW02, white Lophelia pertusa, Lophelia pertusa, AM911411, 3AM911411, 3
H11_CR02, red H11_CR02, red Lophelia pertusa, Lophelia pertusa, AM911400, 1AM911400, 1
clone 131839, whale bone off West Antarctic Peninsula Shelf, AY922245
B04_CR02, red B04_CR02, red Lophelia pertusa, Lophelia pertusa, AM911354, 2AM911354, 2
Sphingobium yanoikuyae strain GIFU9882, D16145
H05_CW03, white H05_CW03, white Lophelia pertusa, Lophelia pertusa, AM911424, 2AM911424, 2
Erythrobacter litoralis HTCC2594, CP000157
F06_CR02, red F06_CR02, red Lophelia pertusa, Lophelia pertusa, AM911382, 2AM911382, 2
B05_CW03, white B05_CW03, white Lophelia pertusa, Lophelia pertusa, AM911405, 7AM911405, 7
H11_CR01, red H11_CR01, red Lophelia pertusa, Lophelia pertusa, AM911399, 2AM911399, 2
clone MTAD4, brewery bottling plant, AJ619049
F09_CW03, white F09_CW03, white Lophelia pertusa, Lophelia pertusa, AM911419, 1AM911419, 1
Methylobacterium radiotolerans strain DSM 760, AB175637
H07_CR01, red H07_CR01, red Lophelia pertusa, Lophelia pertusa, AM911397, 1AM911397, 1
Bosea massiliensis strain 63287, AF288309
F07_CW02, white F07_CW02, white Lophelia pertusa, Lophelia pertusa, AM911418, 2AM911418, 2
Afipia birgiae strain 34632, freshwater supply, AF288304
E06_CR01, red E06_CR01, red Lophelia pertusa, Lophelia pertusa, AM911375, 1AM911375, 1
clone ctg_CGOF042, Bamboo Coral, DQ395711
A04_CR02_full, red A04_CR02_full, red Lophelia pertusaLophelia pertusa, AM911351, 19, AM911351, 19
A10_CW03_full, white A10_CW03_full, white Lophelia pertusa, Lophelia pertusa, AM911404, 7AM911404, 7
Brevundimonas terrae strain KSL-145, alkaline soil, DQ335215
B05_CR01, red B05_CR01, red Lophelia pertusa, Lophelia pertusa, AM911355, 1AM911355, 1
clone ctg_CGOF287, Bamboo Coral, DQ395857
Brevundimonas nasdae strain GTC1043, space laboratory, AB071954
D11_CR01, red D11_CR01, red Lophelia pertusa, Lophelia pertusa, AM911371, 2AM911371, 2
clone ctg_CGOAA08, Bamboo Coral, DQ395424
C10_CR02, red C10_CR02, red Lophelia pertusa, Lophelia pertusa, AM911363, 2AM911363, 2
B02_CR01, red B02_CR01, red Lophelia pertusa, Lophelia pertusa, AM911353, 3AM911353, 3
clone ctg_CGOAB38, Bamboo Coral, DQ395443
E07_CR01, red E07_CR01, red Lophelia pertusa, Lophelia pertusa, AM911376, 1AM911376, 1
clone CSCor-21Eub, Mediterranean Lophelia pertusa, AJ876953
clone MBMPE38, Pacific deep-sea sediment, AJ567552
clone ss1_B_08_64, Arctic coastal sediment, EU050760
clone CSCor-28Eub, Mediterranean Lophelia pertusa, AJ876954
C02_CR01, red C02_CR01, red Lophelia pertusa, Lophelia pertusa, AM911358, 1AM911358, 1
clone MT09A_B02, human chronic wound, DQ170293
clone PmeaMucE2, Pocillopora meandrina, EU249970
H03_CW02, white H03_CW02, white Lophelia pertusa, Lophelia pertusa, AM911421, 1AM911421, 1
C08_CR01, red C08_CR01, red Lophelia pertusa, Lophelia pertusa, AM911361, 1AM911361, 1
clone PDC-OTU7, Pocillopora damicornis, AY700625
Calyptogena phaseoliformis gill symbiont, AF035724
endosymbiont of Bathymodiolus aff. brevior, DQ077891
E12_CR02_full, red E12_CR02_full, red Lophelia pertusa, Lophelia pertusa, AM911378, 17AM911378, 17
G02_CR02_full, red G02_CR02_full, red Lophelia pertusa, Lophelia pertusa, AM911391, 2AM911391, 2
clone CSCor-31Eub, Mediterranean Lophelia pertusa, AJ876951
clone MBMPE4, Pacific deep-sea sediment, AJ567535
C05_CR02, red C05_CR02, red Lophelia pertusa, Lophelia pertusa, AM911359, 2AM911359, 2
C08_S02A, Trondheimsfjord sediment, AM911542
F09_CR01, red F09_CR01, red Lophelia pertusa, Lophelia pertusa, AM911385, 1AM911385, 1
clone cw5, soil, AY850300
clone A139, Pacific deep-sea sediment, AY373401
clone CSCor-26Eub, Mediterranean Lophelia pertusa, AJ876957
clone CSCor-32Eub, Mediterranean Lophelia pertusa, AJ876956
A06_CR02, red A06_CR02, red Lophelia pertusa, Lophelia pertusa, AM911352, 3AM911352, 3
clone SIMO-1228, salt marsh sediment, AY710668
82
83
100
93
99
100
73
87
57
100
78
99
80
95
85
55
100
100
100
100
100
56
100
100
98
100
100
76
100
93
100
87
100
100
100
89
90
51
100
100
100
61
99
73
100
86
86
100
99
52
100
100
52
72
100
81
96
97
52
58
72
100
99
100
92
0.10
a
100
39

RESULTS
Aquifex aeolicus, AE000709
A03_CR02, red A03_CR02, red Lophelia pertusa, Lophelia pertusa, AM911349, 3AM911349, 3
clone 9NBGBact_66, East Pacific basalt glass, DQ070805
D01_CR02, red D01_CR02, red Lophelia pertusa, Lophelia pertusa, AM911365, 2AM911365, 2
clone Therm01-A12, hydrocarbon sedim., AY534034
C07_CR01, red C07_CR01, red Lophelia pertusa, Lophelia pertusa, AM911360, 1AM911360, 1
Chryseobacterium hispanicum strain VP48, AM159183
clone HKT72, Porites sp., DQ188008
E03_CR02, red E03_CR02, red Lophelia pertusa, Lophelia pertusa, AM911373, 2AM911373, 2
clone CH3_12_BAC_16SrRNA_9N_EPR, hydrothermal vent,AY672513
clone ME154, Muricea elongata, DQ917898
clone ctg_CGOCA66, Bamboo Coral, DQ395509
D11_CW02_full, white D11_CW02_full, white Lophelia pertusa, Lophelia pertusa, AM911412, 9AM911412, 9
Mycoplasma sphenisci strain UCMJ, Spheniscus demersus, AY756171D12_CW02, white D12_CW02, white Lophelia pertusa, Lophelia pertusa, AM911413, 1AM911413, 1
Staphylococcus caprae strain ATCC 35538T, AB009935
isolate DGGE gel band 22 Pocillopora damicornis, AY700659
Clostridium sp. strain U40A-5, anaerobic sludge compost, AB059480
F11_CR01, red F11_CR01, red Lophelia pertusa, Lophelia pertusa, AM911387, 2AM911387, 2
B10_CW03, white B10_CW03, white Lophelia pertusa, Lophelia pertusa, AM911406, 2AM911406, 2
G05_CR01, red G05_CR01, red Lophelia pertusa, Lophelia pertusa, AM911392, 1AM911392, 1
Synechococcus sp. strain Almo3, Red Sea water column, AY172800
clone PDM-OTU8, Pocillopora damicornis, AY700638
F05_CW03, white F05_CW03, white Lophelia pertusa, Lophelia pertusa, AM911417, 2AM911417, 2
clone SBR2001, activated sludge, X84546
D07_CR02_full, red D07_CR02_full, red Lophelia pertusa, Lophelia pertusa, AM911370, 5AM911370, 5
clone JdFBGBact_23, East Pacific basalt glass, DQ070822
G01_CR02, red G01_CR02, red Lophelia pertusa, Lophelia pertusa, AM911389, 1AM911389, 1
clone ctg_CGOAA22, Bamboo Coral, DQ395502
A02_CR02_full, red A02_CR02_full, red Lophelia pertusa, Lophelia pertusa, AM911348, 9AM911348, 9
H04_CW03_full, white H04_CW03_full, white Lophelia pertusa, Lophelia pertusa, AM911422, 32AM911422, 32
clone KT-2K12, brine-seawater interface of Red Sea Kebrit Deep, AJ309523
clone CSCor-08Eub, Mediterranean Lophelia pertusa, AJ876950
clone BD2-11, deep-sea sediment, AB015540
clone CSCor-04Eub, Mediterranean Lophelia pertusa, AJ876958
clone PAUC37f, Theonella swinhoei, AF186413
clone CSCor-39Eub, Mediterranean Lophelia pertusa, AJ876960
clone BPC102, hydrocarbon seep sediment, AF154083
clone mb2430, Z95735
clone CSCor-17Eub, Mediterranean Lophelia pertusa, AJ876955
clone AT-s3-24, Mid-Atlantic Ridge hydrothermal sediment, AY225641
clone CSCor-38Eub, Mediterranean Lophelia pertusa, AJ876952
clone AT-s3-56, Mid-Atlantic Ridge hydrothermal sediment, AY225651
clone CSCor-30Eub, Mediterranean Lophelia pertusa, AJ876949
clone Belgica2005/10-ZG-15, marine sediment, DQ351808
clone ctg_CGOAB70, Bamboo Coral, DQ395470
clone CSCor-02Eub, Mediterranean Lophelia pertusa, AJ876959
A01_CR02, red A01_CR02, red Lophelia pertusa, Lophelia pertusa, AM911346, 13AM911346, 13
C04_CW03, white C04_CW03, white Lophelia pertusa, Lophelia pertusa, AM911407, 4AM911407, 4
F07_CR01, red F07_CR01, red Lophelia pertusa, Lophelia pertusa, AM911383, 18AM911383, 18
clone ctg_CGOCA75, Bamboo Coral, DQ395537
E04_CR02, red E04_CR02, red Lophelia pertusa, Lophelia pertusa, AM911374, 13AM911374, 13
clone IndB1-5, inactive deep-sea hydrothermal vent chimney, AB099995
A05_CW03, white A05_CW03, white Lophelia pertusa, Lophelia pertusa, AM911403, 4AM911403, 4
E07_CW02, white E07_CW02, white Lophelia pertusa, Lophelia pertusa, AM911416, 2AM911416, 2
clone ctg_CGOCA60, Bamboo Coral, DQ395513
C10_CR01, red C10_CR01, red Lophelia pertusa, Lophelia pertusa, AM911362, 2AM911362, 2
clone Therm30-E08, hydrocarbon sediment, AY534070
F05_CR02, red F05_CR02, red Lophelia pertusa, Lophelia pertusa, AM911380, 3AM911380, 3
clone JdFBGBact_75, East Pacific basalt glass, DQ070834
H05_CW02, white H05_CW02, white Lophelia pertusa, Lophelia pertusa, AM911423, 4AM911423, 4
clone pIR3BE02, Rainbow hydrothermal vent sediment, AY354172
Firmicutes
Bacteroidetes
TM7
Acidobacteria
Verrucomicrobia
Planctomycetes
Actinobacteria
Gemmatimonadetes
Nitrospira
Cyanobacteria
Proteobacteria (a)b
91
100
100
100
100
99
100
100
100
100
100
100
100
54
100
62
100
100
75
77
83
56
100
100
100
100
100
100
100
100
100
68
100
100
100
90
100
92
94
100
82
100
100
98
93
96
72
100
100
76
97
100
100
100
98
0.10
40

RESULTS
41
Fig. 11: Maximum likelihood tree sub-divided into proteobacterial (a) and other bacterial (b) relevant
OTUs from white and red Norwegian L. pertusa (grey and red), Mediterranean L. pertusa (orange),
other corals (blue), and from reference organisms (black). For each sequence its name, source (if
available), EMBL accession number, and the number of similar clones with 97% identity cut-off
(sequences from this study) are given. Bootstrap proportions ≥50% from 100 re-samples are
shown next to the clusters they support. The sequence of Aquifex aeolicus (AE000709) was used to
root the tree. The shaded box in (b) marks a group of coral-inhabiting Mycoplasmataceae. The scale
bar (a) and b), bottom left) denotes 0.10 nucleotide substitutions per alignment position.
The α-Proteobacteria contained most of the coral-derived OTUs from this study. Within this
class sequences of the family Rhodobacteraceae constituted the largest sub-cluster, dominated by
clones from white L. pertusa. In particular, 65 identical sequences from white L. pertusa (37% of all
white L. pertusa-hosted sequences; reference: D05_CW03_full) showed high similarity to two bac-
terial strains DIII4* (AF254106; 98%) and EI1* (AF254105; 98%) (asterisks are part of the clone
names) isolated from North Atlantic continental slope sediments at 1500 m depth (Teske et al.
2000). These strains were capable of thiosulphate (S2O32-) oxidation. A sequence of presumably
the same bacterial species (DQ395503, 98%) had also been found on deep-sea octocorals of the
family Isididae, so-called “Bamboo Corals” (Octocorallia, Gorgonacea, Isididae; scientific species
names not provided) growing on seamounts in the Gulf of Alaska (Penn et al. 2006). 3 sequences
from white (reference: D10_CW02) and sequence H11_CR02 from red corals (both Rhodobacter-
aceae) were closely related to a clone (AY922245, 97% and 98%, respectively) associated with the
remains of a deep-sea “whale fall” off the West Antarctic Peninsula Shelf (Tringe et al. 2005).
Several bacterial sequences from red L. pertusa within the α-Proteobacteria affiliated with sequences
from other animal-associated bacteria: A group of 6 sequences (reference: A04_CW03) in the
above-mentioned Rhodobacteraceae cluster were identical with the 16S rDNA of a cultivated bacte-
rium (AJ344506) from the North Sea bryozoan Flustra foliacea (Pukall et al. 2001). D08_CW03
(also Rhodobacteraceae) was similar to a sequence (AY700622; 97%) associated with the tropical
scleractinian coral Pocillopora damicornis (Astrocoeniina, Pocilloporidae) (Bourne and Munn 2005).
Several sequences from L. pertusa associated with sequences form Isididae (accession numbers
DQ395xxx): E06_CR01 (Afipia sp.) with DQ395711 (98%); a cluster of 19 sequences from red
and 7 sequences from white L. pertusa (references: A04_CR02_full and A10_CW03_full) and
B05_CR01 from red L. pertusa (all Brevundimonas sp.) with DQ395857 (97%, 98%, and 100%,

RESULTS
42
respectively); 2 sequences (reference: D11_CR01; Rhizobiales) with DQ395424 (99%); 3 sequences
(reference: B02_CR01; unclassified α-Proteobacteria) with DQ395443 (99%). E07_CR01 (Rhodo-
spirillaceae) associated with a sequence (AY654769; 97%) obtained from the mucus of the shallow-
water scleractinian Oculina patagonica (Faviina, Oculinidae) (Koren and Rosenberg, unpubl.). Other
α-proteobacterial sequences from both white and red L. pertusa (F09_CW03 and H07_CR01) were
virtually identical with that of Methylobacterium radiotolerans (AB175637; 100% in both cases) (Kato
et al. 2005); a larger sister-cluster of 7 sequences from white and 2 from red corals (references:
B05_CW03 and H11_CR01) also belonged to the genus Methylobacterium.
The γ-Proteobacteria cluster was dominated by bacterial sequences from red L. pertusa. The
largest group of them comprised 17 sequences with reference E12_CR02_full (unclassified
γ-Proteobacteria). This cluster showed closest relatedness to endosymbionts of the two deep-sea
mussels Calyptogena phaseoliformis (AF035724; 94%) (Peek et al. 1998) and Bathymodiolus aff. brevior
(DQ077891; 93%) (McKiness and Cavanaugh 2005). 2 other sequences (reference:
G02_CR02_full) belonged to the same cluster but were more distantly related to the above-men-
tioned database sequences (88% and 87%, respectively). Out of each 100 hits for BLAST
searches with references E12_CR02_full and G02_CR02_full, respectively, about 60 sequences
originated from sulphur oxidising symbiotic bacteria hosted by the above-mentioned and other
species of deep-sea mussels. Even sequences of free-living bacteria with lowest similarity values
were clearly related to thiotrophy or hydrothermal activity, respectively. Sequences C02_CR01
from red and H03_CW02 (both Shigella sp.) from white corals were almost identical with a clone
sequence (DQ170293; 100% in both cases) obtained from a human wound (Frank et al.,
unpubl.). Sequence C08_CR01 (Vibrio sp.) from red L. pertusa was identical with that of another
bacterium from the tropical scleractinian P. damicornis (AY700625; 100%). A clone of probably
the same species has also been identified on mucus of the scleractinian coral Pocillopora meandrina
(Astrocoeniina, Pocilloporidae) (EU249970; 99% to both L. pertusa-derived sequences) (Speck et
al., unpubl.).
The Bacteroidetes cluster exclusively consisted of sequences associated with red L. pertusa.
3 sequences (reference: A03_CR02; Flavobacteriaceae) were closely related to sequence DQ070805
(98%) acquired from basalt glass of the East Pacific Rise (Di Meo-Savoie et al., unpubl.). 2 other
sequences of Flavobacteriaceae (reference: D01_CR02) were identical to sequence AY534034
(100%) obtained from Mediterranean sediments rich in petroleum hydrocarbons and n-alkanes

RESULTS
43
(Polymenakou et al. 2005). 2 sequences (reference: E03_CR02; Bacteroidetes) were remotely related
to a clone sequence (AY672513; 91%) associated with distinct mineralogical layers of a white
smoker spire from a deep-sea hydrothermal vent site (Kormas et al. 2006). Sequence C07_CR01
(Chryseobacterium sp.) was phylogenetically related to sequence DQ188008 obtained from the
shallow-water scleractinian Porites sp. (Fungiina, Poritidae) from the Arabian Sea (Kapley et al.
2007). There was no overlap between C07_CR01 and DQ188008, but DQ188008 was 96%
similar to Chryseobacterium hispanicum AM159183, which in turn showed 100% similarity to
C07_CR01.
The Firmicutes cluster comprised mostly sequences from white L. pertusa that were closely
related to bacteria form other corals: D12_CW02 (Staphylococcus sp.) affiliated with a sequence
from P. damicornis (AY700659; no overlap, 99% to Staphylococcus caprae AB009935), and
2 sequences (reference: F11_CR01, Clostridiaceae) were highly similar to an isolate from an
enriched anaerobic microbial community (AB059480; 100%) (Ueno et al. 2001).
A cluster of 9 sequences (reference: D11_CW02_full, Mycoplasmataceae) were only distantly related
to the next cultivated relative Mycoplasma sphenisci (AY756171; 89%) (Frasca et al. 2005). They
formed a separate cluster with bacteria associated with Isididae (DQ395509; 91%) and the
Caribbean coral Muricea elongata (Octocorallia, Gorgonacea, Plexauridae) (DQ917898; 90%)
(Ranzer et al., unpublished), which is marked by a shaded box in Fig. 11 b. An additional
maximum likelihood tree (Fig. 12) was constructed with closest cultivated and uncultivated rela-
tives of L. pertusa-hosted Mycoplasmataceae to determine the exact position of this coral-related
sub-cluster. The model of nucleotide substitution was again GTR+I+G. Several sequences of the
Mycoplasma pneumoniae group, Spiroplasma group, and “Candidatus Hepatoplasma crinochetorum”
(Wang et al. 2004) were used as outgroup. (Note that taxonomy is not always congruent with
phylogeny in Mycoplasmataceae). The bootstrap proportion of 55% (marked with an asterisk in Fig.
12) for the overall group of coral-related Mycoplasmataceae (shaded box in Fig. 12) was deteriorated
as compared to 100% in the complete phylogeny (Fig. 11 b). This was most likely due to the
inclusion of partial sequences into the calculations (dotted branches in Fig. 12), which are known
to impair bootstrap analysis (cf. Gutiérrez et al. 2002). Yet, these sequences had to be considered
because they obviously constituted the next relatives to the coral-inhabiting Mycoplasmataceae.
Repeated bootstrap analysis without these partial sequences (not shown) resulted in high
bootstrap values near 100% for the coral-related sequence cluster. Other sequences of cultivated

RESULTS
Mycoplasma species appeared to be slightly closer to D11_CW02_full than that of M. sphenisci
(AY756171), but the latter still featured highest similarity to the L. pertusa-derived sequence
(89%).
clone ME154, Muricea elongata, DQ917898
clone ctg_GCOCA66, Bamboo Coral, DQ395509
D11_CW02_full, white Lophelia pertusa, AM911412
100
clone FS312_454_1000bp_0993B, marine hydrothermal vent fluids, DQ910085
clone A9, abalone gut, AY720906
55*
clone TLStrainConBH10, rainwater from Trout Lake lakeshore, EU136885
87
Mycoplasma iguanae strain 2327(T), AY714305
Mycoplasma lagogenitalium strain 12MS(T), AF412983
Mycoplasma hyorhinis strain BTS7(T), AF258792
78
Mycoplasma columborale strain MMP4(T), AF412975
Mycoplasma sphenisci strain UCMJ, AY756171
100
100
87
52
Mycoplasma faucium strain DC333(T), AF125590
Mycoplasma gypis strain B1/T1(T), AF125589
91
83
Mycoplasma genitalium strain G37, U39694
Ureaplasma gallorale strain ATCC 43346, U62937
"Candidatus Hepatoplasma crinochetum" clone 48, AY500249
100
Spiroplasma chinense strain ATCC 43960(T), AY189126
Spiroplasma lampyridicola strain ATCC 43206(T), AY189134
75
100
100
83
Staphylococcus caprae, AB009935
0.10
Mycoplasma hominis group
Mycoplasma pneumoniae group
Spiroplasma group
Fig. 12: Maximum likelihood tree of L. pertusa-inhabiting Mycoplasmataceae with sequences of cultivated and
uncultivated relatives within the Mycoplasma hominis group. The coral-related sequences are marked
by a shaded box. For each sequence its name, source (if clone), and EMBL accession number are
given. A ‘(T)’ behind the strain designation denotes a type strain. Bootstrap proportions ≥50%
from 100 re-samples are shown next to the clusters they support. The low bootstrap proportion
of 55% for the coral-related cluster (marked with an asterisk) is most likely due to incorporation
of partial sequences (≤1012 nt, dotted branches). The sequence of Staphylococcus caprae (AB009935)
was used to root the tree. The scale bar (bottom left) denotes 0.10 nucleotide substitutions per
alignment position.
Cyanobacteria were found in both white and red L. pertusa (references B10_CW03 and
G05_CR01, respectively) and belonged to the genus Synechococcus. Bacteria of the same genus are
hosted by the tropical reef coral P. damicornis (AY700638; 98% to both references).
44

RESULTS
45
Candidate division TM7 had 2 representatives from white L. pertusa (reference: F05_CW03)
that were 98% similar to the partial 16S rDNA sequence X84546 obtained from activated sludge
(Bond et al. 1995).
The Actinobacteria cluster comprised sequences from both white and red L. pertusa. 5 sequences
(reference: D07_CR02_full; unclassified Actinobacteria) were closely related to DQ070822 (98%)
acquired from basalt glass of Cobb Seamount at the Juan de Fuca Ridge (Di Meo-Savoie et al.,
unpubl.). Sequence G01_CR02 (unclassified Actinobacteria) affiliated with a sequence from Isidi-
dae (DQ395502; 97%). A large sub-cluster consisting of 9 sequences from red L. pertusa
(reference: A02_CR02_full) and 32 sequences from white L. pertusa (reference: H04_CW03_full;
Propionibacterium acnes) were identical with sequence AJ309523 (100%) obtained from the brine-
seawater interface of Kebrit Deep in the Red Sea (Eder et al. 2001).
In the Verrucomicrobia a large proportion of sequences affiliated with sequences from Isididae
(accession numbers DQ3955xx): 18 sequences (reference: F07_CR01; Rubritalea sp.) were identi-
cal with DQ395537 (100%); a large sister cluster of 13 sequences from red and 4 sequences from
white L. pertusa (references: A01_CR02 and C04_CW03) belonged to the same genus Rubritalea
(92% similarity to DQ395537); 2 sequences (reference: E07_CW02, Verrucomicrobiales) were
identical with DQ395513 (100%). Another sub-cluster consisted of 13 sequences from red
L. pertusa (reference: E04_CR02) and 4 sequences from white L. pertusa (reference: A05_CW03)
(both Rubritalea sp.) that showed high similarity to sequence AB099995 (98% and 97%,
respectively) of an uncultured bacterium from inactive deep-sea hydrothermal vent chimneys
(Suzuki et al. 2004).
The Planctomycetes cluster comprised coral-associated sequences of both white and red
L. pertusa, too. 2 sequences of Planctomycetaceae from red corals (reference: C10_CR01) were
almost identical to sequence AY534070 (99%) acquired from petroleum- and n-alkane-rich
sediment in the Eastern Mediterranean Sea (Polymenakou et al. 2005). 3 other sequences from
red corals (reference: F05_CR02; Planctomycetaceae) were closely related to sequence DQ070834
(97%) from basalt glass of Cobb Seamount at the Juan de Fuca Ridge (Di Meo-Savoie et al.,
unpubl.). 4 sequences from white L. pertusa (reference: H05_CW02; Planctomyces sp.) showed
closest relatedness to sequence AY354172 (98%) of an uncultured bacterium from sediment of
Rainbow vent field on the Mid-Atlantic Ridge (Nercessian et al. 2005).

RESULTS
46
Bacteria from Mediterranean L. pertusa (accession numbers AJ8769xx) (Yakimov et al. 2006)
did not show direct affiliation with Norwegian L. pertusa-hosted bacteria. Because the authors
sequenced their bacterial clones partially from the 3’ end, while 5’ partial sequencing was used for
most clones in the present study, straight comparison was impeded by missing sequence overlap.
Still, Mediterranean and Norwegian sequences did not even have common relatives from the
online database in most cases except for two instances: AJ876951 and 2 sequences from red
L. pertusa (reference: C05_CR02; γ-Proteobacteria) both clustered with a clone obtained from deep-
sea sediment (AJ567535; 97% and 90%, respectively), and sequences AJ876956 and F09_CR01
(γ-Proteobacteria) from red L. pertusa showed 96% and 99% similarity to an uncultured soil bacte-
rium (AY850300). However, F09_CR01 was the one sequence closely related to a sequence from
Trondheimsfjord sediment (C08_S02A; 99%) and the corresponding bacterium was thus not
exclusively confined to L. pertusa in its Norwegian habitat. AJ876953 from Mediterranean
L. pertusa was in a sister clade of E07_CR01 (α-Proteobacteria, Rhodospirillaceae) associated with a
sequence originating form O. patagonica (see above). A very conspicuous feature of several
sequences from Mediterranean L. pertusa was their affiliation with clones from hydrocarbon seep
or hydrothermal sediments.
The clusters Gemmatimonadetes, Acidobacteria, and Nitrospira exclusively consisted of
sequences from Mediterranean L. pertusa. Sequence AJ876950 had been classified as member of
Actinobacteria in the original study and was re-classified as member of Gemmatimonadetes in this
study. Within the Nitrospira cluster sequence AJ876959 (Nitrospira sp.) showed moderate related-
ness to another sequence from an isidid coral (DQ395470; 95%). The above-mentioned affili-
ation with deep-sea and seep-related bacteria was most distinct within the Gemmatimonadetes and
Acidobacteria.
3.2.2 Comparison of T-RFLP Data and 16S rDNA Sequences
From the sequences of 16S rDNA clones the lengths of their theoretical terminal restriction frag-
ments (T-RFs) can be calculated assuming that the molecules had been digested by a respective
restriction enzyme. Such ‘in-silico’ digestion enables comparison between 16S rDNA sequences
of a certain sample type and the actual T-RF profiles of that sample type. In this way it can be
determined in retrospect which bacterial phylotype gave rise to a distinct peak in the T-RFLP
electropherograms. This comparison can also be used to consider the resolution of T-RFLP, i.e.,

RESULTS
47
whether certain peaks comprise more than one bacterial group. Taking the abundances of clones
and the area (or height) of electropherogram peaks into account one can also assess the degree of
congruence between the two methods: If both methods ideally depicted the bacterial communi-
ties in the same manner, it could be expected that every clone matches a peak (and vice versa)
and abundant clones coincide with dominant peaks. Since most clones of this study were
sequenced partially from the 5’ end, only 5’ clone T-RFs were compared to T-RFLP electro-
pherograms based on the forward primer (27f).
T-RFs of clone sequences as determined by TRF-CUT were grouped into three abundance cate-
gories: T-RF positions occupied by (1) one clone (‘rare’), (2) two to five clones (‘intermediate fre-
quency’), and (3) more than five clones (‘frequent’). In most cases clone T-RF lengths and fre-
quencies correlated with peak positions and intensities in the electropherograms (Fig. 4), although
with a slight displacement between peak positions and clone T-RF lengths. Very often clones of
two or more different phyla or classes shared the same T-RF length. For example, with the
enzyme / primer combination Alu I / 27f, T-RF length 74 nt comprised sequences of Bacteroide-
tes, Firmicutes, Planctomycetes, α-Proteobacteria, and γ-Proteobacteria. Furthermore, several OTUs had
T-RFs longer than 500 nt and thus showed no corresponding peak in the respective electro-
pherogram (e.g., in Verrucomicrobia and Bacteroidetes).

RESULTS
48
3.3 Fluorescence In-Situ Hybridisation
3.3.1 Bacteria Associated with Coral Ectoderm
For testing of the CARD-FISH method freshly harvested polyps of aquarium-reared L. pertusa
were hybridised with a mixture of probes EUB338 I-III. This probe combination targets the
majority of all known bacteria (Daims et al. 1999). Bright fluorescence signals were obtained
from remains of mucus attached to the thin-sectioned coral tissue (Fig. 13) indicating that the
coral mucus was densely inhabited by microbes.
Thin sections of coral samples from the Trondheimsfjord hybridised with probes EUB338 I-III
did not feature mucus-colonising bacteria like those in aquarium-reared L. pertusa, obviously
because the mucus had been washed off the polyps. Instead, fluorescence signals in the periphe-
ral ectoderm of the tentacles were observed (Fig. 14 a) that were not as abundant and dense as
compared to the signals in Fig. 13. Brightest fluorescence was caused by aggregates of bacterial
cells situated on the distal ends of nematocysts of the spirocyst type (cf. Rifkin 1991) arranged in
nematocyst batteries (Fig. 14 c, e). The fluorescing bacterial cells had a flask-like shape (about
1.6 µm long and 0.5 µm wide) with a tip at one end (Fig. 14 f). DAPI counterstaining confirmed
that the bacterial cells highlighted by CARD-FISH contained DNA and were thus no artefacts
(Fig. 14 b, d). Documentation of DAPI signals was hampered though by coral tissue autofluores-
cence and the much brighter signals of the coral cell nuclei underneath or in direct vicinity of the
prokaryote aggregates. Beside bacterial cells some other structures were marked by the fluores-
cent dyes, in particular stylets of nematocysts belonging to the stenotele type (Fig. 14 c, e) and
other nematocyst parts. However, from their size, shape, and lack of a DAPI signal, these struc-
tures could be clearly distinguished from bacterial cells. No unspecific marking of bacterial cells
was observed after hybridisation with control probe NON338 (not shown). The flask-like
bacteria described above prevailed on the nematocyst batteries. Sporadic cells of the same mor-
photype were only observed on the coral coenosarc (not shown) but not on the endoderm.

RESULTS
Fig. 13: Epifluorescence micrographs of bacteria in the mucus of an aquarium-reared L. pertusa polyp. The
image is an overlay of DAPI signals (blue) targeting DNA of coral cell nuclei and bacteria, and
hybridisation signals of probes EUB338 I-III with Cy3 TSA (red). Arrows mark mucus secretions
with considerably large amounts of bacteria. Scale bar, 100 µm.
To identify the prokaryotes on a sub-domain level probes targeting all abundant L. pertusa-associ-
ated bacterial groups in the sequence library (Table 1) were employed. In all cases hybridisation
under stringent conditions failed to mark the majority of ectoderm-associated bacteria. Cells
hybridised with α- and γ-Proteobacteria-specific probes were observed only few and far between on
the ectoderm (not shown). Additional application of achromopeptidase to support cell wall per-
meabilisation had no effect. Subsequently, hybridisation was repeated with only 20% formamide
in the hybridisation buffer allowing the probes also to bind to not strictly complementary target
sites. This procedure proved successful in case of the Firmicutes-specific probe LGC0355. Compa-
rison with the sequence library revealed two clusters with a single-nucleotide deviation from the
probe’s target sequence (5’-CAGCAGTAGGGAATCTTCC-3’): the Mycoplasmataceae cluster with
reference sequence D11_CW02_full (target site, 5’-CAGCAGTAGGGAATATTCC-3’) and the
49

RESULTS
TM7 cluster with reference sequence F05_CW03 (target site, 5’-CAGCAGTAGGGAATTT-
TCC-3’). No mismatches were observed for the other (16S rRNA-targeting) FISH probes with
their respective binding sites in sequences originating from Norwegian L. pertusa.
b
a
nb
nb
**
*
c
d e f
nbs
nbsnu
50

RESULTS
51
Fig. 14: Epifluorescence micrographs of bacteria on a thin section in the tentacle region of a L. pertusa
polyp (red coral colour variety, station 3). a) Overview of a cross-sectioned tentacle. The image is
an overlay of coral tissue autofluorescence (green), DAPI signals of coral cell nuclei (blue), and
hybridisation signals of probes EUB338 I-III with Cy3 TSA (red). b-e) Micrograph details 1 (b, c)
and 2 (d, e) showing DAPI (b, d) and Cy3 (c, e) signals of bacterial aggregates on the nematocyst
batteries of the tentacle ectoderm. f) Single flask-shaped bacterial cells. Annotations: *, frame of
micrograph detail 1; **, frame of micrograph detail 2; nb, nematocyst battery; nu, coral cell nuclei;
s, nematocyst stylet; arrows in b-e), corresponding DAPI and Cy3 signals of selected bacterial
aggregates; arrow in f), tip at one end of a bacterial cell. Scale bars, 100 µm (a), 20 µm (b-e), 5 µm
(f).
For the larger Mycoplasmataceae cluster a modified probe LGC0355b (Table 1) was designed that
compensated the sequence deviation in the target site of the original probe LGC0355. If the bac-
teria on the coral ectoderm had the same target site as the Mycoplasmataceae sequences in the
library, binding efficiency of the modified probe would be higher than that of the original probe.
Accordingly, there should be a stringency condition (formamide concentration) in hybridisation
that allowed for specific binding of probe LGC0355b but not of probe LGC0355. In addition,
probe MYC850 (Table 1) was designed following the recommendations of Hugenholtz et al.
(2002). While both probes LGC0355b and MYC850 were designed to hybridise Mycoplasmataceae
sequences, the target site of probe MYC850 was highly specific only to the coral-borne Mycoplas-
mataceae and thus suitable for direct identification of corresponding microbes.

RESULTS
a b
c d
Fig. 15: Epifluorescence micrographs of bacteria on thin sections in the tentacle region of L. pertusa
polyps. The images are overlays of DAPI (blue) and Cy3 signals (red). a, b) Red coral colour
variety, station 1. c, d) White coral colour variety, station 3. Thin sections were hybridised with
probes LGC0355 (a, c) and LGC0355b (c, d), respectively, under the same conditions (35%
formamide in hybridisation buffer). Arrows mark DAPI and Cy3 signals of selected bacterial cells.
Scale bars, 20 µm (a-d).
Hybridisation with 35% formamide gave a negative result for the original probe LGC0355 (Fig.
15 a, c) but yielded conspicuous specific signals for the modified probe LGC0355b (Fig. 15 c, d).
Test hybridisations of probe MYC850 with 20% formamide were negative. Results of the specifi-
city cross check for probes LGC0355 and LGC0355b are shown in Fig. 16. For hybridisation of
Bacillus subtilis (with the binding site of probe LGC0355) the main fluorescence peak of the newly
designed probe LGC0355b is less pronounced and shifted towards lower brightness values as
compared to the original probe LGC0355. In addition, probe LGC0355b exhibits more pixels
with low brightness values than probe LGC0355. These results indicate a lower binding efficiency
of probe LGC0355b with B. subtilis as compared to that of probe LGC0355.
52

RESULTS
Pixel brightness / arbitrary units
80 100 120 140 160
Rela
tive p
ixel abundance / p
erc
ent
0,0
0,5
1,0
1,5
2,0
2,5
3,0
3,5 LGC0355
LGC0355b
Fig. 16: Specificity cross check for probes LGC0355 and LGC0355b. Histograms of signal brightness
(expressed as pixel brightness values of digital images) for hybridisation of the firmicute Bacillus
subtilis with probes LGC0355 and LGC0355b under the same conditions (35% formamide in
hybridisation buffer). Arrows denote the main fluorescence signals of both probes.
An additional assay was conducted to test whether cell wall permeabilisation was crucial for
hybridisation with HRP-coupled oligonucleotide probes (Fig. 17). Permeabilisation by lysozyme
was necessary for both gram-negative (Fig. 17 a-d) and gram-positive bacteria (Fig. 17 e, f) having
thin and thick peptidoglycan cell walls, respectively. For the bacteria on L. pertusa tentacles, how-
ever, omission of lysozyme treatment resulted in no apparent loss in abundance and brightness of
hybridisation signals (Fig. 17 g-k).
Double hybridisation with probes LGC0355b and EUB338 I demonstrated that virtually all
detectable bacteria on L. pertusa thin sections could also be hybridised with the Mycoplasmataceae-
specific probe (Fig. 18 a, c, e). Lack of signals from control probe NON338 confirmed specificity
of the double hybridisation (Fig. 18 b, d, f). No evident discrepancies in bacterial abundances
were observed between coral samples from different stations or of different colour.
53

RESULTS
a c e
fdb
g
kh
j
Fig. 17: Epifluorescence micrographs of bacteria hybridised with probe EUB338 I. a-f) Overlay images of
DAPI (blue) and Cy3 signals (red). a, b) α-Proteobacteria, environmental isolate. c, d) γ-Proteobacteria,
Escherichia coli. e, f) Firmicutes, Bacillus subtilis. g-k) Thin sections in the tentacle region of L. pertusa
polyps. g, h) Red coral colour variety, station 1. j, k) Red coral colour variety, station 2. Bacteria
had been permeabilised with lysozyme (a, c, e, g, j) or not permeabilised (b, d, f, h, k) prior to
hybridisation. Scale bars, 20 µm (a-k).
54

RESULTS
a
dc
fe
b
Fig. 18: Epifluorescence micrographs of bacteria on thin sections in the tentacle region of L. pertusa
polyps. a, b) Red coral colour variety, station 1. c, d) Red coral colour variety, station 2. e, f) White
coral colour variety, station 3. The images are overlays of Cy3 (red) and fluorescein signals
(green). Double hybridisation with probes LGC0355b (+ Cy3) and EUB338 I (+ fluorescein)
resulted in a yellowish overlay signal (a, c, e). Double hybridisation with probes LGC0355b
(+ Cy3) and NON338 (+ fluorescein) resulted in a red overlay signal since no hybridisation signal
was obtained with control probe NON338 (b, d, f). Scale bars, 20 µm (a-f).
55

RESULTS
56
3.3.2 Bacteria Associated with Coral Endoderm
Corals from all stations and both colour varieties harboured filamentous structures in their
endoderm (Fig. 19). These structures were thin (0.6 µm) twisted chains about 20 µm long con-
sisting of short rod-shaped cells about 1 µm in length (Fig. 19 a, b). Filaments were scattered
within the septal tissue of the gastral cavity. Despite the lack of conspicuous DAPI signals the
structures exhibited bright fluorescence upon hybridisation with probe EUB338 I (Fig. 19 c, d).
Negative results with control probe NON338 on parallel thin sections (not shown) confirmed
the specificity of this hybridisation.
Identification on the sub-domain level was approached as described above (→ 3.3.1). As with the
tentacle-associated microbes, only hybridisation with the Firmicutes-specific probe LGC0355
under low-stringency conditions (20% formamide in the hybridisation buffer) resulted in positive
FISH signals (Fig. 19 a, b). The filaments did not hybridise with probe LGC0355b under
stringent conditions (not shown). Omitting the cell wall permeabilisation step in the CARD-
FISH protocol resulted in a visible weakening, though not complete loss of the hybridisation
signal (Fig. 19 d) as compared to permeabilised cells (Fig. 19 a-c). As in the case of ectoderm-
associated bacteria, abundances of filamental structures did not diverge conspicuously between
coral samples from different stations or of different colour.

RESULTS
a b
c d
*
Fig. 19: Epifluorescence micrographs of bacteria on thin sections of the gastral cavity of L. pertusa polyps.
a, b) White coral colour variety, station 3. b) Micrograph detail of (a) showing a filament that
consists of nine cells. c, d) Red coral colour variety, station 1. Thin sections were hybridised with
probe LGC0355 under low stringency conditions (20% formamide in hybridisation buffer) (a, b)
and probe EUB338 I (c, d), respectively, with Cy3 TSA. Bacteria had been permeabilised with
Lysozyme (a-c) or not permeabilised (d) prior to hybridisation. Annotations: *, frame of micro-
graph detail (b). Arrows in b) mark the gaps between a single cell and adjacent cells in the fila-
ment. Scale bars, 20 µm (a, c, d) and 5 µm (b).
57

DISCUSSION
58
4.1
4 Discussion
Differences in Bacterial Assemblages of L. pertusa
4.1.1 Comparison of Coral and Environmental Samples
In this study first evidence of special bacterial associations in Norwegian L. pertusa from the
Trondheimsfjord is presented. Bacterial associations clearly differed from microbial communities
of the environment, which was in accordance with results of other studies (Großkurth 2007;
Schöttner et al. 2008).
T-RFLP fingerprinting was used to compare microbial communities in L. pertusa to those of the
coral’s environment. The method was demonstrated to be robust in identifying similarities and
differences in the composition of complex microbial communities (Dunbar et al. 2000). The
main advantages of T-RFLP over the commonly used Denaturing Gradient Gel Electrophoresis
(DGGE) lie in higher resolution (Moeseneder et al. 1999) and direct availability of electrophero-
grams in digital form providing high precision and easy downstream data processing. Average
peak numbers found in the respective sample types mirrored the complexity (richness) of their
microbial assemblages: While the sediment is commonly expected to house the most species-rich
microflora, seawater bacteria were found to be less diverse than the sediment but richer than the
coral samples, which present a rather special environment for bacteria. This was corroborated by
non-parametric Kruskal-Wallis-ANOVA. The microflora hosted by red L. pertusa appeared to be
richer than that of white L. pertusa, but this difference was insignificant for the given dataset.
MDS-aided comparison of T-RFLP profiles demonstrated clear differences between coral, water,
and sediment samples (Fig. 5). Since stress values of all ordinations were mostly below 0.10 and
never exceeded 0.15, results form dimensional downscaling could be safely used to infer relations
between the samples (cf. Clarke 1993). Differences between sample types were again substanti-
ated by both parametric (MANOVA and Duncan’s test) and non-parametric (Kruskal-Wallis-
ANOVA and Mann-Whitney U test) statistics. Separation of the three sample types was no mere
bias caused by different concentrations of the respective PCR products, or only due to water- or
sediment-specific T-RFs. It could also be ascribed to a great number of peaks occurring exclu-
sively in the corals (Table 3) denoting a special bacterial community on L. pertusa. Consequently,

DISCUSSION
59
MDS ordination based only on binary (presence – absence) peak data (Fig. 5 b) led to the same
conclusion regarding sample clustering as ordination based on normalised peak areas (Fig. 5 a).
Two more remote water and sediment sample points were observed in the MDS plot based on
binary peak data (Fig. 5 b). This scattering mirrors a certain lack of reproducibility in DNA
extraction with the UltraClean™ Soil DNA Kit that was only recently documented by Carrigg et
al. (2007). The kit extracted bacterial DNA from different samples with varying efficiency (i.e.,
the amount of DNA per unit of sample material). This in turn affected amplification of 16S
rRNA genes from different bacterial groups in subsequent PCR. DNA extraction efficiency was
apparently above average with the water and sediment sample in question resulting in more PCR
products. This was also seen in the analysis of binary peak data because all peaks were weighted
equally regardless of their mostly very low signal intensities. However, the aberrant data points
showed greater distance to the coral data than did the other water and sediment samples. This
indicated that their additional peaks even enhanced the differences to coral-hosted bacterial
communities. Thus, performance issues of the extraction kit did not affect the study in an
unacceptable way. In addition, DNA extracts had been pooled prior to phylogenetic analyses:
Mixing of parallel extracts of the same sample type levelled differences in their DNA composi-
tion. As a result, cloning and sequencing characterised the “average” bacterial community to be
covered by DNA extraction from a respective sample type.
4.1.2 Differences between Coral Samples
Associations between L. pertusa and bacteria varied within the Trondheimsfjord: For both rare
and consistent T-RF data post hoc tests revealed differences between stations 1 (‘Tautra’) and 2
(‘Stokkbergneset’) 32.5 km apart from each other. For rare T-RFs (i.e., organisms of more vari-
able occurrence within L. pertusa) differences also manifested between stations 2 and 3 (‘Røberg’)
that lay only 3.9 km apart but on opposite sides of the bottleneck connecting the seaward fjord
basin with the open sea (Fig. 3). In contrast, variations between stations 1 and 3 remained insigni-
ficant in all analyses, though their distance of 28.7 km was almost as large as between stations 1
and 2. Accordingly, divergence in bacterial community composition was not related to distances
between sampling sites. Results from binary T-RF data suggested that these differences were not
only caused by shifts in relative bacterial abundances: Though there was no indication that

DISCUSSION
60
presence of dominant groups varied between stations, changes in presence of rare species or
groups were significant.
Also Großkurth (2007) observed spatial variation of L. pertusa-associated bacterial communities
from adjacent locations by analysis of DGGE patterns and suggested influence of the local envi-
ronment as an explanation for these inconstancies. Salinity measurements of the present study
(→ 2.1.2; 30.1-31.9 PSU) deviated considerably from values (34-34.7 PSU) reported by other
authors for comparable locations in the Trondheimsfjord (Jacobson 1983; Børsheim et al. 1999).
Since the possibility of exceptional environmental conditions during the sampling time appears
rather remote, a systematic measurement error was assumed to be responsible for the aberrant
salinity values of the present study. Nevertheless, relative differences in salinity could still be con-
sidered in a meaningful way. Relative differences in the temperature and salinity revealed the
presence of slightly warmer and more brackish sub-surface water at station 1, while no conspicu-
ous divergences of water masses were observed between stations 2 and 3. However, this does not
explain the differences between bacterial associations of coral samples from the three stations
(see above). Other physicochemical environmental factors might vary in the sampling region
(e.g., current velocity, oxygen saturation, light, non-conservative ions, trace gases, dissolved and
particulate organic matter). In addition, site-specific macrofaunal associations or differences in
the developmental stage of the corals could account for the observed variations (Großkurth
2007).
In contrast, the finding that the two colour varieties of L. pertusa diverged in their bacterial com-
position (Fig. 7 b, Fig. 8) was unexpected and constituted one of the most intriguing results of
this study. Although not as striking as the discrepancies between coral and environmental
samples this divergence was statistically significant for relative abundances of consistent peaks,
which comprise the most dominant T-RFs (Fig. 6). Contrary to the site-dependent variations,
these colour-dependent differences in microbial communities are not explicable ad hoc. This was
the reason to lay focus on the latter aspect. Details and implications of this finding are discussed
in the following chapters.

DISCUSSION
61
4.1.3 Comparison of T-RFLP Data and 16S rDNA Sequences
T-RFLP data were based on PCR products from single-sample DNA extractions, whereas 16S
rDNA sequences were obtained from amplified pooled DNA. Also, PCR protocols differed
between the two methods. Nevertheless, there were conspicuous congruities between peak posi-
tions and intensities of T-RFLP data on the one hand, and T-RF lengths and frequencies of
clones on the other (Fig. 4). In particular, most dominant electropherogram peaks were mirrored
by frequent clone T-RFs. The slight displacement between peak positions and clone T-RF
lengths can be explained by a systematic error introduced by the GeneScan® software during size
calling. Given the necessity to limit the number of analysed clones one must not expect to find a
matching clone T-RF for every electropherogram peak. Peaks without corresponding clone
T-RFs might also constitute artefacts, so-called pseudo-T-RFs. These are caused either by intra-
strand reannealing of PCR products, which is strongly dependent on the number of PCR cycles
(Egert and Friedrich 2003), or by incomplete restriction enzyme digestion (Osborn et al. 2000).
Pseudo-T-RFs may lead to an overestimation of microbial diversity. However, since all samples
had been treated in the same way (i.e., equal number of PCR cycles and digestion time), they were
also equally prone to this kind of error, so that statistical analysis was not expected to be biased.
Fingerprints generated by T-RFLP reproducibly reflect the composition of the dominant PCR-
targeted members of the community, while rare members are likely to be overlooked due to
detection threshold effects (Lukow et al. 2000; Osborn et al. 2000). Factoring peak intensity
(T-RF abundance) into the analysis must be treated with caution keeping in mind ubiquitous
biases in PCR-aided analyses (von Wintzingerode et al. 1997). However, final PCR product con-
centrations are generally biased toward a 1:1 ratio regardless of the initial template concentrations
(Suzuki and Giovannoni 1996). This means that infrequent ribotypes tend to become more abun-
dant with increasing cycle number, while frequent ribotypes remain frequent throughout the
PCR. It is thus still safe to assume that dominating phylotypes depicted by both PCR-based
methods were also most abundant in situ. This is of importance when it comes to considering
bacterial richness: Due to the great variety of bacterial ribotypes (OTUs) in red L. pertusa, to reach
a theoretical coverage as high as that of white L. pertusa (Fig. 9, Table 4) more than 770 clones
would have had to be analysed in red L. pertusa according to Thiel, Neulinger et al. (2007b). Since
this would have been far too cost-intensive and time-consuming, infrequent ribotypes remained

DISCUSSION
62
4.2
elusive to detailed phylogenetic analysis. For these reasons, conclusions on the ecology of
L. pertusa-associated microbes (chapter 4.2) were chiefly limited to abundant phylotypes.
Comparison of the two methods also solves seemingly contradictory results: (1) While over one
third (37%) of the T-RFs occurred both in corals and environmental samples (water and / or
sediment; Table 3), the sequence library shows virtually no common overlap of bacterial con-
sortia for corals and environmental samples except for three proteobacterial OTUs. (2) T-RFLP
only detected differences in relative bacterial abundances between coral colour varieties, whereas
phylogenetic analysis revealed far more striking disparities between bacterial communities of both
coral phenotypes. (3) Phylogenetic analysis supported predictions of bacterial richness by
T-RFLP (average peak numbers per sample) with respect to the relations between sediment and
water, between sediment and corals, and among coral colour varieties. Yet, contrary to T-RFLP
bacterial richness assigned to red corals by phylogenetic analysis was unequivocally higher than
that of white corals, even higher than bacterial richness of the surrounding seawater (Fig. 9, Fig.
10, Table 4). The solution for all three issues lies in the fact that different bacterial species, even if
they were of different phyla, could produce the same T-RFs with a given restriction enzyme
digestion, which reduced resolution of T-RFLP. This was especially the case with dominant
peaks. As a consequence thereof, fingerprinting did not resolve the minor differences between
corals and environment or differences among coral colour varieties as accurately as the phyloge-
netic approach. Interestingly, data of Schöttner et al (2008) even suggested highest bacterial diver-
sity to exist in L. pertusa, not in the sediment. Whether this is a matter of methodology, or inher-
ent to different properties of sediment or corals sampled in both studies, remains speculative for
the time being.
Dominant Bacterial Groups of L. pertusa and their Ecological
Potential
4.2.1 Phylogenetic and Ecological Inference
Molecular phylogenetic inference involves comparison of nucleotide sequences – in this case, of
the 16S rDNA – according to mathematical algorithms. All such comparisons base on an align-
ment that defines homologous sequence positions. There are regions of the 16S rDNA with base

DISCUSSION
63
counts strongly varying between taxa, wherein assignment of homologous sequence positions is
extremely ambiguous. It is therefore impossible to align sequences from diverse bacterial groups
(as present in this study) consistently over their whole length. Errors likely to be made here
would severely affect downstream analyses (cf. Swofford et al. 1996). The positional mask
employed in ARB (→ 2.4) ensured dependable phylogenetic analyses because it admitted only
unambiguously alignable sequence positions into phylogenetic analyses. A similar strategy was
also used by other authors (e.g., Lanoil et al. 2001). The resulting phylogenies (Fig. 11, Fig. 12)
were consistent with high-level bacterial taxonomy and reliably assorted sequences within their
respective clusters as confirmed by bootstrapping.
Naturally, the ecology of bacteria is not directly evident from their molecular phylogeny, since
16S rDNA, as a structural gene, does not contain information on the physiological capabilities of
the respective organisms. However, evidence of their ecological potential can be deduced from
comparison with closely related organisms, whose biochemistry is well known, or by evaluation
of common features innate to the whole phylogenetic group they affiliate with.
Bacteria of L. pertusa from the Trondheimsfjord mostly affiliated with organisms or groups
featuring the following aspects: (1) Cycling of sulphur compounds, (2) methylotrophy, or
(3) symbiotic or parasitic relationships with other organisms, especially other corals. It therefore
appeared reasonable to examine the potential ecological role of L. pertusa-related microbial bio-
diversity from these angles. In several cases the mentioned aspects were interconnected, as
shown in the following.
4.2.2 Sulphur Cycling
Sequences of coral-hosted bacteria with potential thiotrophic abilities (i.e., hydrogen sulphide
(H2S) /thiosulphate (S2O32-) oxidation) were confined to the phylum Proteobacteria. The class
α-Proteobacteria was dominated by sequences of the family Rhodobacteraceae from white L. pertusa
(over one third of all sequences obtained from white corals), which plays an important role in the
marine sulphur cycle (Gonzalez et al. 1999). Like purple sulphur bacteria, this family of non-obli-
gately aerobic purple bacteria often features red pigments. Many (but not all) representatives
perform aerobic anoxygenic phototrophy, but mostly with organic carbon sources (Buchan et al.
2005). Despite their trivial name “non-sulphur” purple bacteria, several groups of Rhodobacteraceae

DISCUSSION
64
are also able to transform inorganic forms of sulphur, including elemental sulphur, sulphide,
sulphite, and thiosulphate. These pathways facilitate sulphur-based lithoheterotrophy (Buchan et al.
2005), which represents a special type of mixotrophy. It makes their metabolism more flexible as
compared to that of obligately chemotrophic species (Sorokin et al. 2005): By drawing energy
from sulphur oxidation the bacteria can exploit even small amounts of organic material as carbon
sources. Reference strains DIII4* and EI1* showed greatly increased S2O32- oxidation after
pyruvate supplementation (Teske et al. 2000). This indicates that these organisms are lithohetero-
trophic as well. Rhodobacteraceae can use a variety of organic substances as carbon sources, among
which are organic and amino acids, sugars, and alcohols (Madigan et al. 2003). Besides, members
of the clade are able to degrade N-acetyl-D-glucosamine (chitin) (Cottrell et al. 2000). Some
L. pertusa-affiliated Rhodobacteraceae were related to microorganisms found on whale bones. These
bacteria profit from H2S that is produced through coupling between decomposition of bone
lipids and seawater sulphate reduction (Goffredi et al. 2004). Moreover, almost all representatives
of the α-Proteobacteria (Rhodobacteraceae, Rhodospirillaceae, Methylobacterium, and Afipia) are able or
likely to exploit dimethylsulphoniopropionate (DMSP), or its derivatives such as dimethyl-
sulphide (DMS), methanesulphonate, and dimethylsulphone as a source of energy (González et
al. 1999; González et al. 2000; Zubkov et al. 2001; Yoch 2002; Moosvi et al. 2005). This property
links them to methylotrophy (→ 4.2.3).
Two OTUs within the γ-Proteobacteria comprising 19 sequences exclusively from red L. pertusa
showed closest relation to endosymbionts of two deep-sea mussels, Calyptogena phaseoliformis and
Bathymodiolus aff. brevior. These mussels are part of the fauna colonising hydrothermal vents at the
ocean floor spreading centres, an environment rich in H2S. With their foot tucked in fissures in
the seafloor they take up H2S from hydrothermal fluid seeping from beneath. Since H2S is toxic
for the mussels, it is detoxified either by binding to high molecular binding factors in the hemo-
lymph (Calyptogena) (Arp et al. 1984; Powell and Somero 1986) or by transformation into other
compounds (Bathymodiolus) (Pruski et al. 2002). The transformed reduced sulphur is transported
to the bacteria in the gills. They oxidise the reduced sulphur species with oxygen from the
surrounding seawater to obtain energy and electrons for CO2 fixation. These endosymbionts are
thus lithoautotrophic, more precisely, thioautotrophic organisms as opposed to the lithohetero-
trophic α-Proteobacteria discussed above. Coral-hosted sequences from the present study form an
unambiguously monophyletic cluster with the group of these thiotrophs. Taking also the results

DISCUSSION
65
from additional BLAST searches into account, these organisms represented by reference sequen-
ces E12_CR02_full and G02_CR02_full obviously constitute novel thiotrophs associated with
the red colour variety of L. pertusa.
Representatives of four other bacterial phyla, Bacteroidetes, Actinobacteria, Verrucomicrobia, and Planc-
tomycetes, once more point to the importance of sulphur metabolism in L. pertusa-associated bacte-
ria: Closest relatives of these groups were found at active and inactive deep-sea hydrothermal
vent sites (Suzuki et al. 2004; Nercessian et al. 2005), basalt glass from an ocean spreading zone
(Di Meo-Savoie et al., unpubl.), and in hydrocarbon-rich sediments (Polymenakou et al. 2005).
Even at sites without active fluid venting, chemolithotrophy can still occur via metal sulphide oxi-
dation, e.g. by Archaea (Edwards et al. 2000); the outer glassy part of submarine erupted basalt
contains high amounts of reduced sulphur (Moore and Fabbi 1971); and presence of hydrocar-
bons in the sediment always implies the release of H2S through anaerobic methane oxidation:
CH4 + SO42- + 2 H+ → CO2 + H2S + 2 H2O (e.g., Hansen et al. 1998). Admittedly, a direct
involvement in the cycling of sulphur cannot be assumed for all members of the groups in ques-
tion: A recently described novel member of Flavobacteriaceae (Bacteroidetes), Flaviramulus basaltis, was
also found at basalt glass, but with a chemoorganotrophic metabolism and no reported utilisation
of sulphur compounds (Einen and Øvreås 2006). The same holds for the representatives of
Verrucomicrobia, which belong to the genus Rubritalea (→ 4.2.4) from inactive deep-sea hydro-
thermal vent chimneys (Suzuki et al. 2004). These organisms might rather profit from metabolites
of sulphur-oxidising bacteria. In contrast, Actinobacteria are known to possess highly variable phy-
siological and metabolic properties. Their direct physical association with marine gas hydrates as
reported by Lanoil et al. (2001) suggests straight participation in sulphur cycling. This is also con-
ceivable for Planctomycetes, as for instance representatives of this phylum isolated from sulphidic
sediments were shown to reduce elemental sulphur to sulphide under strictly anaerobic con-
ditions (Elshahed et al. 2007).
4.2.3 Methylotrophy
Methylotrophs have the capacity to aerobically exploit organic single-carbon (C1) compounds as a
sole source of carbon and energy. If the C1 compound is methane the organism is termed a
methanotroph. The presence of apparent thiotrophs in L. pertusa, related to endosymbionts in

DISCUSSION
66
Bathymodiolus, raises the question whether there could be a bimodal symbiosis in L. pertusa
combining thiotrophy and methanotrophy, as was observed in other Bathymodiolus species
(Duperron et al. 2005; Duperron et al. 2006). From both white and red L. pertusa bacterial
sequences identified as those of Methylobacterium radiotolerans and other members of Methylobacte-
rium were obtained. M. radiotolerans is a facultative methylotroph. Like all members of the genus it
is aerobic and features pink pigmentation. However, this species does not exploit methane (Kato
et al. 2005), which rules out a direct link to methanotrophy. Methane utilisation of other mem-
bers of the genus has been suggested (Van Aken et al. 2004), but is still discussed controversially
(Dedysh et al. 2004). While methanotrophic bacteria are confined to exploiting organic C1 sub-
stances (i.e., carbon compounds without C-C bonds), methane-non-utilising methylotrophs such
as Methylobacterium can also degrade, for instance, organic acids, ethanol, or sugars (Madigan et al.
2003) just like “non-sulphur” purple bacteria (→ 4.2.2).
Another organism abundant in both white and red corals was identified as Propionibacterium acnes.
Though this actinobacterium is predominantly known as a parasite of the human skin, it is found
in the environment as well (e.g., Salvador Pedro et al. 2001): Propionibacterium was observed in
methanogenic reactors (Fernández et al. 1999; Tsurumi et al. 2000) and in direct association with
gas hydrates (Lanoil et al. 2001). Most notably, a sequence identical to those of the present study
was obtained from the brine-seawater interface of Kebrit Deep (Arab. kebrit, sulphur), a site with
considerable concentrations of CH4 (22 ml l-1) and H2S (sulphur content 12 to 14 mg l-1). For this
location archaeal methanogenesis in sedimentary organic matter as well as biotic methane oxida-
tion at the brine-seawater interface were suggested (Eder et al. 2001). These examples demon-
strate a correlation of Propionibacterium with methane- and / or sulphide-rich habitats linking it
indirectly to thiotrophs (→ 4.2.2). A main characteristic of this genus is the production of large
amounts of organic acids, especially propionic and acetic acid, by fermentation of more complex
organic substrates such as lactate, carbohydrates, and polyhydroxyl alcohols (Madigan et al. 2003).
Relatives of the Clostridiaceae obtained from red L. pertusa live strictly anaerobic and occur ubiqui-
tously in nature, particularly in the digestive tract of mammals (Madigan et al. 2003). Like the
microbes discussed above they degrade high molecular substances such as sugars, amino acids,
and cellulose to low molecular carbon and sulphur compounds including H2S (Madigan et al.
2003). Clostridiaceae are also able to degrade chitin (Schwarz 2001).

DISCUSSION
67
4.2.4 Parallels to Other Symbiotic and Parasitic Associations
Almost every bacterial phylum detected in L. pertusa from the Trondheimsfjord comprised OTUs
that were closely related to sequences obtained from other coral species. Relatives of bacteria
associated with several other scleractinians from different suborders and families were found:
Pocillopora damicornis (4 OTUs), Porites sp., (1 OTU), Oculina patagonica (1 OTU), and Pocillopora
meandrina (1 OTU). They are all hermatypic warm-water species.
By far the most similarities (9 OTUs from Norwegian and 1 OTU from Mediterranean L. pertusa)
were however observed with bacterial lineages from deep-sea gorgonians, so-called “Bamboo
Corals” (Isididae), named after their likeness to bamboo plants (Noé and Dullo 2006). Source
specimens of bacterial sequence data were sampled from three seamounts in the Gulf of Alaska
at depths between 634 m and 3,300 m (Penn et al. 2006). The family’s range of distribution
exhibits remarkable parallels to that of L. pertusa (→ 1.1): It lives from less than 100 m to more
than 4,000 m depth along the Indo-Pacific and Atlantic margins and in the Mediterranean (Roark
et al. 2005) in areas of high hydrodynamic energy and sufficient advection of zooplankton and
particulate organic matter as food sources (Heikoop et al. 2002). In addition, another gorgonian
Muricea elongata, was found to host bacteria similar to that from Isididae and L. pertusa (1 OTU).
Representatives of the Roseobacter clade (α-Proteobacteria) form symbiotic relationships with various
marine organisms (Buchan et al. 2005), as was demonstrated for some Rhodobacteraceae species
from L. pertusa that equally live on the bryozoan Flustra foliacea (Pukall et al. 2001). Notably,
bacteria of the genus Sulfitobacter within this clade are associated with the tubeworm Lamelli-
brachia sp. from cold seeps (Kimura et al. 2003). α-Proteobacteria involved in sulphur cycling and
methylotrophy (→ 4.2.2, 4.2.3) were also regularly found on other corals: Roseobacter strains are
known as coral pathogens, e.g., as agents of Black Band Disease in scleractinians (Buchan et al.
2005). They are obviously an integral part of the coral holobiont in both warm- and cold-water
habitats as demonstrated by bacterial sequences from Isididae, P. damicornis, and L. pertusa from
this study. Sequences of Rhodospirillaceae, another lineage of “non-sulphur” purple bacteria were
equally found in O. patagonica, Norwegian L. pertusa, and – even if not in the same OTU – in
Mediterranean L. pertusa. Also members of the Rhizobiales were found in both Isididae and
Norwegian L. pertusa, among which is Afipia sp. Members of this genus have been shown to

DISCUSSION
68
exploit methanesulphonate and dimethylsulphone (Moosvi et al. 2005) and may be both
significant sulphur cyclers and methylotrophs in natural environments.
Also γ-Proteobacteria in L. pertusa can be assigned to other symbiotic bacteria: Relatedness of a
distinct group of γ-Proteobacteria in red L. pertusa to thiotrophic symbionts of deep-sea mussels was
already discussed (→ 4.2.2). Similar sulphur-oxidisers were again present on O. patagonica (Koren
and Rosenberg 2006). Contrary to the thiotrophs of the present study these bacteria belonged to
another clade of symbionts predominantly associated with vestimentiferan tubeworms and were
not as abundant as in L. pertusa. One OTU of the genus Shigella was found on both red and white
corals. Shigella is a facultatively anaerobic pathogen commonly inhabiting the intestinal tract of
humans and other primates (Zaika et al. 1998). A closely related organism has also been identified
on the scleractinian coral P. meandrina (Speck et al., unpubl.) and another scleractinian, Acropora
palmata, shows antibiotic activity against this germ (Ritchie 2006). It can thus not be ruled out that
Shigella sp. also affects stony corals as a potential pathogen. One γ-proteobacterial OTU compri-
sing a sequence from P. damicornis belonged to the genus Vibrio (Bourne and Munn 2005). Vibrio
appears to be a common part of both hard and soft coral microflora (e.g., Ducklow and Mitchell
1979; Koren and Rosenberg 2006). Members are non-obligate anaerobes (Madigan et al. 2003)
and able to degrade chitin (Hunt et al. 2007). But the genus also holds many pathogenic species,
some of which are agents of coral diseases: V. shiloi (isolated from O. patagonica) (Banin et al.
2000b), V. coralliilyticus and V. harveyi (both isolated from P. damicornis) (Ben-Haim et al. 2003;
Luna et al. 2007), and V. tasmaniensis (isolated from a diseased gorgonian coral) (Vattakaven et al.
2006). Yet, all specimens of L. pertusa analysed in the present study were apparently healthy, as
were the specimens of P. damicornis in the study of Bourne and Munn (2005). Consequently,
Vibrio sp. found in both coral species may be an opportunistic pathogen constituting a normal
component of the healthy coral microbiota until environmental or physiological factors trigger a
pathogenic response (Bourne and Munn 2005). The same might hold for Chryseobacterium sp.
(Bacteroidetes) and Staphylococcus sp. (Firmicutes) that were also found in corals: Clone HKT72
(DQ188008) from Porites sp. (Kapley et al. 2007) was identified as uncultured Chryseobacterium
reported in diseased aquatic animals (Bernardet et al. 2005). The genus Staphylococcus, also
observed on P. damicornis (Bourne and Munn 2005), is likewise associated with diseases of marine
crustaceans (Costa et al. 1998; Becker et al. 2004). The role of Staphylococcus as potential coral
pathogen was very recently discussed by Dinsdale et al. (2008).

DISCUSSION
69
The occurrence of the photoautotrophic cyanobacterium Synechococcus sp. in both coral colour
varieties seems surprising at first glance, since sampling was performed well below the euphotic
zone of the Trondheimsfjord, which is not likely to exceed a depth of 20 m (Sakshaug and
Myklestad 1973). The possibility that these organisms are mere planktonic bycatch exported from
surface waters seems remote in view of the absence of cyanobacterial sequences in the water
column. A great variety of hermatypic scleractinians produce secondary metabolites against this
very cyanobacterial genus (Koh 1997): According to this author Synechococcus sp. could be
repressed because it features the same cell wall characteristics as Phormidium corallyticum, one of the
members of a pathogenic microbial consortium causing Black Band Disease (Richardson and
Kuta 2003). Synechococcus sp. could also be antagonised by hermatypic corals because it might
compete with the symbiotic zooxanthellae for photosynthetic resources. Both these arguments
are untenable in the case of L. pertusa, since the species neither suffers from Black Band Disease
nor hosts zooxanthellae. The genus Synechococcus frequently forms symbiotic relationships with
sponges, which was recently shown for Tethya aurantium by Thiel, Neulinger et al. (2007b). Diazo-
trophic symbiosis was also described for other cyanobacteria-scleractinian associations (Williams
et al. 1987; Lesser et al. 2004) with cyanobacteria residing intracellularly in the host tissue. As the
latter was not observed in this study, Synechococcus sp. appears to live extracellularly on or in
L. pertusa polyps. Thermophilic Synechococcus spp. in microbial mats perform photosynthesis by
day and seem to ferment stored carbohydrates to generate reduction equivalents for nitrogen
fixation in the dark (Steunou et al. 2006). Cyanobacteria – specifically symbiotic species – can
completely resort to chemoheterotrophy in the absence of light while maintaining their capability
of nitrogen fixation (Tredici et al. 1988). Under the assumption that such light-independent
chemoheterotrophic nitrogen fixation also occurs in Synechococcus sp. from the present study a
diazotrophic relationship with L. pertusa is conceivable.
Most members of the Verrucomicrobia found in L. pertusa (predominantly in the red colour variety)
belonged to the genus Rubritalea. This genus owes its name to the production of carotenoids of
orange or reddish colour (L. ruber, red and talea, rod). All four species described to date were iso-
lated from marine sponges: R. marina (Scheuermayer et al. 2006), R. squalenifaciens (Kasai et al.
2007), and R. spongiae and R. tangerina (Yoon et al. 2007). All but R. marina produced squalene, a
triterpenic hydrocarbon that acts as an antioxidant (Ko et al. 2002), as is the case with the carote-
noids (Shindo et al. 2007). R. squalenifaciens was reported to catabolise chitin (Kasai et al. 2007).

DISCUSSION
70
Sequences affiliating with the family Mycoplasmataceae (Firmicutes, Mollicutes) found in this study
were phylogenetically remote from their next characterised relative Mycoplasma sphenisci, which is a
parasite isolated from a Jackass Penguin (Spheniscus demersus) (Frasca et al. 2005). Phylogenetic
analysis (Fig. 12) suggested that the Mycoplasmataceae from L. pertusa formed a monophyletic and
well-defined cluster within the Mycoplasma hominis group together with above-mentioned se-
quences from Isididae and M. elongata. Most mollicutes live as commensals but are also wide-
spread in nature as parasites of a variety of animal groups (including humans) and plants (Razin et
al. 1998). (Note that the trivial terms “mycoplasmas” or “mollicutes” are often used synony-
mously to refer to any species of the class Mollicutes.) Though members of the class Mollicutes have
evolved from cell wall-possessing bacteria and are classified into the phylum Firmicutes (L. firmus,
strong and cutis, skin), they are distinguished phenotypically from all other bacteria by their total
lack of a cell wall (Razin et al. 1998). This circumstance also led to their name (L. mollis, soft).
Since the cell membrane is their only barrier, the mycoplasmas are osmotically much more sensi-
tive than other bacteria; however, the constant milieu of their host offers protection (Razin et al.
1998). Due to this deformable membrane the dominating shape of mycoplasmas is a sphere, but
cytoskeletal elements in various groups facilitate other appearances, too: Many pathogenic myco-
plasmas have a flask- or club-like cell shape with a protruding tip, which serves as an organelle
for cytadhesion to epithelial linings of their host (Razin et al. 1998). Mycoplasmas usually exhibit
a rather strict host and tissue specificity probably reflecting their nutritionally exacting nature and
obligate parasitic mode of life (Razin et al. 1998). They underwent a distinct reductive way of
evolution characterised by ‘genetic economisation’. Surveys have shown a particular scarcity of
genes in mycoplasmas coding for energy and intermediary metabolism (Razin et al. 1998).
Because of the absence of cytochromes the major route for ATP synthesis in mycoplasmas is
probably substrate-level phosphorylation (Dybvig and Voelker 1996). Lacking the ability of de-
novo synthesis of amino and fatty acids makes them totally reliant on external sources of these
vital compounds (Razin et al. 1998).
Candidate division TM7 is one of several newly described bacterial divisions exclusively charac-
terised by environmental sequence data (Hugenholtz et al. 1998; Hugenholtz et al. 2001). TM7
sequences have been detected in a range of chemically and geographically diverse habitats
(Hugenholtz et al. 2001). These include activated sludges (Bond et al. 1995) as well as hydrother-
mal sediment at Rainbow vent site (López-García et al. 2003). The latter constitutes yet another

DISCUSSION
71
4.3
link towards sulphur cycling (→ 4.2.2). TM7 were even found in the human oral cavity, where it
is believed to be a pathogen connected to the development of periodontitis (Brinig et al. 2003;
Ouverney et al. 2003). Yet, the recent discovery of TM7 as part of the natural microflora of the
marine sponge Chondrilla nucula (Thiel et al. 2007a) represents further analogy between coral- and
sponge-associated bacteria. This indicates a symbiotic potential of this candidate division.
In-Situ Location of L. pertusa-Associated Microbes
4.3.1 Bacteria Associated with Coral Ectoderm
Autofluorescence of the coral tissue could be successfully surmounted by CARD-FISH. By far
the most bacteria were detected on the nematocyst batteries of L. pertusa (Fig. 14). The bacteria
could be successfully hybridised with a modified Firmicutes-specific oligonucleotide sequence,
probe LGC0355b (Table 1), targeting the 16S rRNA of Mycoplasmataceae present in the sequence
library. Results of hybridisations at stringent conditions (Fig. 15) and specificity cross check (Fig.
16) showed that the modified probe LGC0355b specifically detects the single-nucleotide devia-
tion from the target sequence of the original probe LGC0355.
Like most oligonucleotide probes LGC0355b is not exclusively specific to Mycoplasmataceae but
also targets other taxa, predominantly of the class Bacilli in the common phylum Firmicutes.
Morphology of the latter is quite similar to that of the observed microbes. For that reason, probe
MYC850 was designed to confirm that the tentacle-associated bacteria on L. pertusa belonged to
the family Mycoplasmataceae. Unfortunately, probe MYC850 did not yield a specific hybridisation
signal. Since such a failure is quite common with untested FISH probes (Amann et al. 1995), this
negative result was not rated as counterevidence for the identity of Mycoplasmataceae in this study.
Re-evaluation of probe MYC850 according to the approach of Yilmaz and Noguera (2004)
revealed that its overall binding efficiency was too low to perform well under CARD-FISH con-
ditions. Hence, alternative evidence had to be furnished to corroborate that the microbes discov-
ered on L. pertusa tentacles were indeed mycoplasmas. The lack of a cell wall is an exclusive pro-
perty of representatives of the Mollicutes (Razin et al. 1998). It could be demonstrated that with
the CARD-FISH protocol used in the present study, cell wall permeabilisation was crucial to
obtain brightest fluorescence after TSA. The fact that an equally strong hybridisation signal was

DISCUSSION
72
obtained from the ectoderm-associated bacteria even without lysozyme treatment confirmed that
these prokaryotes lacked a cell wall.
In summary, the results of phylogenetic analysis and CARD-FISH led to the conclusion that the
microbes colonising the nematocyst batteries of L. pertusa are representatives of a thus far
unknown Mycoplasmataceae species. Their cell morphology (Fig. 14 f) resembled the flask-shaped
and elongate forms with unipolar tip structures of M. sphenisci (Frasca et al. 2005), which was the
closest characterised relative to the Mycoplasmataceae sequences from this study.
Double hybridisation with probes LGC0355b and EUB338 I (Fig. 18) was used to determine the
abundance of the new Mycoplasmataceae species relative to other bacterial groups on L. pertusa thin
sections. It could be shown for all coral samples, regardless of their provenience or colour
variety, that the bacterial clusters situated on their nematocyst batteries consisted almost entirely
of mycoplasmas.
4.3.2 Bacteria Associated with Coral Endoderm
Long and twisted filamentous structures were found in the gastral cavity of red and white coral
phenotypes from all stations. Due to the lack of a visible DAPI signal, these structures were first
considered artefacts. However, similar filaments had been observed with FISH in L. pertusa
samples from other Norwegian locations (S Schöttner, pers. comm.) and specificity of the
hybridisation was proven by means of the control probe NON338. Poor DNA staining with
DAPI was previously reported for other microbes (Boetius et al. 2000).
The phylum Actinobacteria abundantly represented in the corals by 16S rDNA sequences is rich in
filamentous morphotypes. In contrast, like all sub-phylum level probes used in this survey, also
the Actinobacteria-specific probe HGC236 failed to hybridise the filaments under stringent condi-
tions. The filamentous bacteria could only hybridise with the Firmicutes-specific probe LGC0355
with low stringency, just like the ectoderm-associated mycoplasmas. The only L. pertusa-associ-
ated sequences, except for those of Mycoplasmataceae, which permitted such unspecific probe
binding, were that of candidate division TM7 (reference: F05_CW03). The sequence of probe
LGC0355 is 5’-GGAAGATTCCCTACTGCTG-3’), its original target site on the bacterial
ribosome is 5’-CAGCAGUAGGGAAUCUUCC-3’ (the reverse complement of the probe

DISCUSSION
73
sequence). TM7 sequences show only one mismatch as compared to this site (5’-CAGCAG-
UAGGGAAUUUUCC-3’), which is at the same position as with Mycoplasmataceae (5’-CAGCAG-
UAGGGAAUAUUCC-3’) but has uridine instead of adenosine. This could also explain why
hybridisation of filamentous bacteria with the Mycoplasmataceae-specific probe LGC0355b
(5’-GGAATATTCCCTACTGCTG-3’) failed under stringent conditions: ΔG (Gibbs free energy)
of hybrid formation is less negative for the U-T mismatch between the TM7 target site and probe
LGC0355b than it is for the matching pair A-T in Mycoplasmataceae under the same hybridisation
conditions.
The filaments found in this study also resembled morphotypes of TM7 bacteria from the human
oral cavity (Brinig et al. 2003; Ouverney et al. 2003) and from a laboratory scale bioreactor
(Hugenholtz et al. 2001). The latter study reported members of candidate division TM7 to be
gram-positive. Coral endoderm-associated bacteria showed visible fluorescence attenuation when
cell wall permeabilisation was omitted (unlike Mycoplasmataceae). This indicates that they have a
cell wall. It though appears to be a priori more permeable to the large CARD-FISH probe mole-
cules than the cell walls of other, namely gram-positive bacteria (cf. Fig. 17 a-f). Other filamen-
tous bacteria were described to occur endolithically (i.e., in the skeleton) in the Mediterranean
coral O. patagonica (Ainsworth et al. 2008), but due to their autofluorescence typical for chloro-
phyll they were most likely cyanobacteria.
For the time being, identity of the endoderm-associated filaments found in L. pertusa cannot be
determined with sufficient confidence. Nevertheless, indirect evidence presented here permits
addressing of these bacteria as bona fide TM7.
4.3.3 Comparison of Sequence Frequencies and Bacterial in-Situ Abundances
The high microbial diversity of 27 OTUs in white and 54 OTUs in red corals as depicted by the
sequence library is in marked contrast to CARD-FISH results: Irrespective some sporadic α- and
γ-Proteobacteria only two groups of bacteria (probably two species) were abundant and in direct
association with the coral tissue, namely Mycoplasmataceae and bona fide TM7. Test hybridisations
with aquarium-reared L. pertusa polyps (Fig. 13) indicated that the mucus of this coral was densely
populated by bacteria, which were apparently far more abundant than bacteria on coral tissue thin

DISCUSSION
74
sections. These findings reveal that the major bacterial diversity – and most likely the numerical
majority of bacteria – is sited in the mucus and probably also in the gastric fluid of L. pertusa.
The reason why bacteria associated with coral mucus and gastric fluid were observed by 16S
rDNA analysis but not CARD-FISH is given by the different preparation procedure of the two
techniques: For DNA extraction mucus and gastric fluid were never completely removed from
coral-specimens. In contrast to that, storage, decalcification, paraffin embedding and de-paraffi-
nation, and the multiple washing steps of the thin sections during the CARD-FISH procedure
washed away mucus as well as gastric fluid from the polyps. Loose bacteria living therein were
thus not preserved on the slides except for very few cells of α- and γ-Proteobacteria, the apparently
largest groups on L. pertusa. Even in the aquarium-reared polyps that were immediately decalci-
fied after fixation without additional storage time, only wisps of mucus remained attached to the
tissue thin sections. Thus, the starting material was different for both techniques.
Embedding the polyps in artificial resin prior to thin sectioning might have better preserved
unbound bacteria. However, resin embedding has a considerable drawback in combination with
CARD-FISH, because the dense matrix of the resin obstructs diffusion of the large HRP-labelled
probe. Moreover, tissue boundaries stand out much clearer in paraffin-embedded samples than in
resin-embedded as observed for test samples in Histocryl acrylic resin. It would neither have
been useful to examine the mucus of aquarium-hatched coral samples, because significant com-
positional changes in L. pertusa’s microbial community were reported to occur in the artificial
environment (Schöttner et al. 2008). For all these reasons, the present study was confined to
investigate the in-situ location of the tissue-associated bacteria of L. pertusa (→ 1.3).
Both coral colour varieties hosted Mycoplasmataceae and bona fide TM7 without discernible differ-
ences in abundance. This finding conflicted with phylogenetic analysis, according to which both
groups of bacteria should live exclusively on the white L. pertusa colour variety (Fig. 10, Fig. 11).
This inconsistence can be explained by statistical effects and PCR interference: The probability
for a distinct PCR product to become cloned and sequenced is a function of its relative propor-
tion in the overall mixture of amplified gene fragments. This probability is particularly low for
rare fragments in a diverse mixture as in the case of red L. pertusa (Fig. 9). Since the two epithe-
lium-bound bacterial groups most probably constituted minor fractions of the total bacterial

DISCUSSION
75
4.4
quantum on the coral polyps (see above), they are less likely to be detected in red corals by clo-
ning and sequencing than in white corals.
Furthermore, obstruction of primer annealing or elongation could have occurred: Primer-tem-
plate mismatch can never be ruled out with primers targeting a broad range of phylogenetic
groups and might occur in both Mycoplasmataceae and TM7. In many mycoplasmas, the adenine
residues at GATC sites are methylated, while in others the cytosine residues are methylated
(Razin et al. 1998). Because this motif is part of the forward primer 27f sequence (5’-AGAGTT-
TGATCMTGGCTCAG-3’) and its reverse complement reads the same, binding of the primer is
likely to be restricted in Mycoplasmataceae (Herman et al. 1996). Methylation may also inhibit elon-
gation (Rountree and Selker 1997). These factors could also have reduced the yield of respective
PCR products in white L. pertusa leading to the observed underrepresentation of Mycoplasmataceae
and TM7 sequences. In red L. pertusa the effects of low primer binding probability (see above)
and obstruction of primer annealing or elongation would be combined. Consequently, the proba-
bility of Mycoplasmataceae and TM7 sequences to become retrieved from red L. pertusa would be
further impaired, which could explain why no sequences of these groups were found in that coral
colour variety.
Relations between L. pertusa and its Associated Bacteria
4.4.1 Partitioning and Specificity of the Bacterial Community
The present study confirmed that also L. pertusa from the Trondheimsfjord hosted a special and
highly diverse bacterial community, as do members of the same coral species from other geogra-
phic regions (Yakimov et al. 2006; Großkurth 2007; Schöttner et al. 2008) (→ 4.1.1). Members of
this bacterial community are – preponderantly – not present in the coral’s environment (→
4.1.3). Notably, this was also true for samples from station 1 (‘Tautra’), one of the shallowest
occurrences of L. pertusa (Hovland and Risk 2003) and thus likely to show greater variations in
environmental conditions than deeper habitats.
Data presented here and by Großkurth (2007) displayed spatial variations of coral associated bac-
teria within the respective sampling areas. Even more outstanding differences were shown in the
present study by comparative analysis of L. pertusa-derived DNA sequences from different geo-

DISCUSSION
76
graphic regions: Apart from marginal intersections in the α- and γ-Proteobacteria Mediterranean
L. pertusa (Yakimov et al. 2006) hosted bacterial phylotypes that were almost completely different
from those in Norwegian specimens. Oceanographic data from the Central Mediterranean where
these corals had been sampled show that bottom temperature and salinity are generally around
13.6°C and 38.7 PSU (Klein et al. 1999; Seritti et al. 2003). These values are much higher than
those reported for the Trondheimsfjord (→ 2.1.1). L. pertusa actually lives at the limits of its
physiological niche (→ 1.1) in the Mediterranean, which might be the reason why living deep-
water coral banks are generally rare there (Delibrias and Taviani 1985; Tursi et al. 2004). A
species existing in a suboptimal milieu may unsurprisingly host a bacterial community that is
adapted to these specific conditions. This strongly suggests temperature and salinity to be addi-
tional physicochemical factors (→ 4.1.2) accounting for the divergence between prokaryotic
consortia from Norwegian and Mediterranean L. pertusa.
A considerable partitioning of the bacterial community was observed on L. pertusa by comparison
of 16S rDNA sequence frequencies and bacterial in-situ abundances (→ 4.3.3): Only two groups
of bacteria (Mycoplasmataceae and bona fide TM7) were bound to the coral tissues, while most bac-
teria were apparently present in the mucopolysaccharide layer and gastric fluid. Data from other
studies obtained with the fingerprinting methods DGGE (Großkurth 2007) and ARISA
(Schöttner et al. 2008) indicated a similar partitioning of bacterial groups in L. pertusa. The tissue-
bound bacteria were equally found on corals from all stations and both colour varieties (→ 4.3.1,
4.3.2). Hence, the observed location- and colour-related differences between coral-associated
groups (→ 4.1.2) could only be ascribed to communities in the “liquid” parts of the host, i.e., in
the mucus and gastric fluid. These communities fluctuated in their relative abundances and – in
the case of spatial variation – even in presence and absence. They appear thus to be sensitive to
physicochemical factors (→ 4.1.2) varying from site to site. Association of these “liquid-
inhabiting” bacterial groups with the coral can thus not be regarded as constitutive but rather as
adaptive to the prevailing environmental conditions.
To call the observed coral-microbial association truly ‘specific’ it has to be constant over time and
space. While temporal variations still need to be investigated, results of the present study gave evi-
dence for a spatially constant fraction of tissue-associated bacteria in L. pertusa. Yet, this was not
mirrored on a wider geographic level, since Großkurth (2007) reported spatial variations of both

DISCUSSION
77
mucus- and tissue-associated bacteria on L. pertusa from offshore locations in the NE Atlantic.
This coral is known to form distinct, genetically isolated offshore and fjord populations in the
NE Atlantic (Le Goff-Vitry et al. 2004). Thus, it could be speculated that each of these popu-
lations hosts a unique bacterial community and that there is no really constitutive coral-bacterial
association in L. pertusa at all. Also Yakimov et al. (2006) did not find Mycoplasmataceae and TM7
on Mediterranean L. pertusa. Then again, there is the possibility that these bacterial groups had
simply been overlooked in the former studies, since culture-independent techniques had been
employed which are susceptible to biases similar to those described in this study (→ 4.3.3).
Unpublished FISH data suggested the presence of at least bona fide TM7 on corals from other
Norwegian locations (S Schöttner, pers. comm.). There is a good chance that the use of CARD-
FISH or other bio imaging techniques in future studies will reveal these tissue-associated
microbes on L. pertusa from other geographic regions.
The coral’s microbiology features numerous similarities to other bacterial symbioses, notably with
marine sponges. Similarities to sponge symbionts were also described for Mediterranean L. pertusa
by Yakimov et al. (2006), who point out that specialised microbiota may be important for protec-
ting the coral from pathogens through the production of secondary antibiotics as demonstrated
for some sponges. Parallels between microbial inhabitants of L. pertusa and symbionts from other
warm- and cold-water corals indicate that microbial populations associated with corals are glo-
bally distributed as postulated by Bourne and Munn (2005). Such parallels are particularly fre-
quent in the case of Isididae, cold-water corals whose distribution and habitat requirements are
very similar to those of L. pertusa.
In summary, the bacterial community of L. pertusa from the Trondheimsfjord could not be
termed ‘specific’ sensu stricto but had to be divided into two sub-communities differing in their
location on the coral: (1) a tissue-bound bacterial fraction on the ecto- and endoderm that was
spatially constant at least on a regional scale and (2) a “liquid-associated” bacterial fraction in the
mucus and gastric fluid varying with location and colour variety of its host. Parallels to other
coral-bacterial associations suggested the existence of certain ‘cold-water coral-specific’ bacterial
groups sensu lato.
The “liquid-associated” community comprised bacterial groups with important alimentary charac-
teristics, in particular thio- and methylotrophy (→ 4.2.2, 4.2.3). Their implications on various

DISCUSSION
78
aspects of the ecology of L. pertusa are discussed in detail in the following chapters 4.4.2 and
4.4.3, while the roles of tissue-associated bacteria are addressed in chapter 4.4.4.
4.4.2 Implications for Nutrition, Health, and Dispersal of L. pertusa
L. pertusa is thought to feed primarily on mesozooplankton (Kiriakoulakis et al. 2005). However,
in radiocarbon labelling experiments conducted with several species of stony corals Sorokin
(1973) showed that the polyps actively incorporate planktonic bacteria. The amount of this
bacterial organic carbon assimilated per day was equivalent to 10-20% of the carbon content of
the polyp’s body. Bacteria could thus provide subsidiary alimentation for L. pertusa. In fact, corals
have been suggested to harbour microbial communities for beneficial effect (Rohwer and Kelley
2004) which amongst others also includes nutrition: By ingesting their own mucus (Coles and
Strathmann 1973), a process that was also observed with L. pertusa (Mortensen 2001), corals can
harvest contained bacteria after the continuous-flow culture principle. It has been shown that the
growth rate of microbes living in the corals’ surface mucopolysaccharide layer can be accelerated
through elevation of DOC levels by an order of magnitude (Kline et al. 2006). In the Trond-
heimsfjord large amounts of DOC accumulate in the euphotic zone during the productive season
(Børsheim et al. 1999). A considerable proportion of mono- and particularly polysaccharides are
exported from the euphotic zone to the deep fjord, probably through the sinking of phytoplank-
ton cells which are degraded in the depth (Børsheim et al. 1999). Though L. pertusa is unable to
benefit from dissolved substances in the water column, most members of its bacterial consortium
can degrade these sugar compounds (→ 4.2.2 f) and incorporate them into their own biomass.
This can in turn be utilised by the coral. In a way, that scenario shows similarities to a “host-
bound” variant of the water column ‘microbial loop’ (Azam et al. 1983) without nanoplanktonic
heterotrophic flagellates as interlink but the coral as direct terminal consumer.
In this context, also a diazotrophic symbiosis between Synechococcus sp. (assuming the ability of
light-independent nitrogen fixation) and L. pertusa would make sense: Though the coral may not
directly suffer nitrogen limitation from feeding on zooplankton, utilisation of organic compounds
from the water column by its bacterial inhabitants could require a supplementary source of nitro-
gen, since exported organic matter is known to be nitrogen-depleted.

DISCUSSION
79
Additionally, the associated bacterial groups can catabolise cellulose from phytoplankton that was
ingested either through mucus entrapment (Lewis and Price 1975) or as part of the diet of the
coral’s prey. Even the chitin in the exoskeleton of prey crustaceans can be degraded by Vibrio,
Clostridiaceae, probably Rubritalea sp., and most notably, by the dominant Rhodobacteraceae. This
offers a significant contribution to the carbon and nitrogen budget (McCarthy et al. 1997;
Aluwihare et al. 2005) of the coral holobiont.
Almost all α-Proteobacteria occurring in Norwegian L. pertusa can exploit DMSP or its derivatives
(→ 4.2.2). DMSP is an osmoprotectant produced in high concentrations by marine phytoplank-
ton. It was even measured in a variety of tropical coral reef invertebrates as a consequence either
of their phytoplankton diet or, in the case of cnidarians, their symbiosis with zooxanthellae (Van
Alstyne et al. 2006). Damm et al. (2008) argued that DMSP degradation is responsible for a direct
in-situ methane production / consumption cycle in another NE Atlantic fjord environment
(Storfjorden, Svalbard Archipelago). The substance and its derivatives should thus also occur in
considerable amounts in highly productive coastal regions and fjords such as the Trondheims-
fjord, especially during phytoplankton blooms. In addition to providing the coral with energy
from DMSP-degradation, the mentioned α-Proteobacteria are regarded to play an important role in
the cycling of these organic sulphur compounds (Penn et al. 2006) produced in and exported
from the euphotic zone.
Several bacterial groups observed in Norwegian L. pertusa (Rhodobacteraceae, Rhodospirillaceae, Vibrio,
Propionibacterium, Planctomyces, Clostridiaceae) can tolerate or even strictly require anaerobic condi-
tions. Finding sequences from coral-associated Archaea closely related to strict and facultative
anaerobes on coral surface microlayers led Kellogg (2004) to hypothesise that anaerobic micro-
niches may exist in the mucus of tropical reef corals. Anthozoan polyps and colonies are in fact
diffusion-limited in their oxygen consumption even under well-stirred, air-saturated conditions
(Shick 1990). This can result in total oxygen depletion within the diffusion boundary layer on the
surface of coral polyps (Shashar et al. 1993). This layer is 0.2-4 mm thick depending on the
growth form of the colony, polyp size, and current velocity (Shashar et al. 1993; Kühl et al. 1995).
Contraction of the polyps even enhances hypoxia, thus favouring anaerobic metabolism in the
gastral cavity (Levy et al. 2001). Observations on aquarium-reared L. pertusa showed that its
polyps can stay retracted for three weeks and longer (Mortensen 2001) and also retract after

DISCUSSION
80
feeding for up to several days (A Form, pers. comm.). This strongly implies that hypoxia occurs
in L. pertusa’s polyps and, as a consequence, fermentation may significantly contribute to the
nutrition of this coral. The above-mentioned bacterial groups appear to constitute a specialised
community that profits from further degrading end products of the coral’s own anaerobic meta-
bolism. Low molecular organic acids produced by P. acnes and Clostridiaceae can thereby in turn
serve as substrates for Rhodobacteraceae and Rhodospirillaceae, and for Methylobacterium under
(temporarily) oxic conditions.
Deep-water coral reefs are highly endangered ecosystems (Fosså et al. 2002; Hall-Spencer et al.
2002; Roberts and Hirshfield 2004). The direct consequences of ocean acidification by anthropo-
genic CO2 on the calcification process in cold-water corals have already been recognised (Orr et
al. 2005). But shifts in both pH and temperature can also threaten these animals indirectly through
detrimental responses of their bacterial microflora: Coral-pathogenic Vibrio (V. shiloi, V. corallii-
lyticus) become virulent only at higher water temperatures (Ben-Haim and Rosenberg 2002; Ben-
Haim et al. 2003; Vattakaven et al. 2006). One must be apprehensive of the possibility that
Vibrio sp., but also Shigella sp., Chryseobacterium sp., and Staphylococcus sp. found in L. pertusa exhibit
a pathogenic potential that is likewise stimulated by temperature rise. Environmental changes can
also affect other members of the microbial community. Resulting disruption of the balance
between the coral and its associated microbiota (even if they are harmless under natural circum-
stances) can trigger coral mortality as well (Kline et al. 2006).
To my knowledge, no investigations have been made so far on the nature of the two phenotypes
of L. pertusa. It is not even known whether they are genetically or environmentally controlled
(Mortensen 2001). Both colour varieties of L. pertusa were found growing entwined at all stations
in the Trondheimsfjord (cf. Fig. 1), so divergence in their bacterial composition cannot be
explained by spatial separation. In contrast, personal observations by myself and other research-
ers imply that L. pertusa’s white colour variety occurs more frequently along the NE Atlantic con-
tinental margin than the red one. Cold-water reefs along the southern and central parts of this
margin comprise exclusively white L. pertusa (A Freiwald, pers. comm.). What does the red coral
phenotype cause to be rarer than the white one? Their distribution may be limited by some
hitherto unknown internal or external factor that affects red L. pertusa more than white, conse-
quently allowing common occurrence only in locations where this factor is optimal for both

DISCUSSION
81
corals. The dominance of Rhodobacteraceae in white corals (or rather, the scarcity of them in red
corals) might constitute an internal factor: Because of their mixotrophy these bacteria can be
highly productive also under conditions of moderate carbon supply. This would enable the white
phenotype to exist also in regions that offer less amounts of dissolved and / or particulate
organic matter, where the red phenotype could not survive according to this line of thought. An
external factor that might affect coral dispersal is given by the ‘Hydraulic Theory’ proposed by
Hovland and colleagues (Hovland 1990; Hovland and Thomsen 1997; Hovland et al. 1998;
Hovland and Risk 2003). These authors proposed that chemotrophic bacteria might provide the
corals with supplementary nutriment at sites where hydrocarbon-rich fluids emanate from the
seafloor. Remarkably enough, the vast majority of sequences with relatives from marine environ-
ments rich in reduced sulphur compounds are found on red L. pertusa. In particular, the red coral
colour variety exclusively features a phylogenetic cluster of γ-Proteobacteria, whose relatedness to
thiotrophic endosymbionts strongly suggests their aptitude to draw energy from the oxidation of
reduced sulphur compounds. The latter can be formed by anaerobic methane oxidation occurring
along with fluid seepage (→ 4.2.2). If red L. pertusa, because of these specialised bacterial consor-
tia, preferred higher concentrations of substrates for chemotrophy in the ambient seawater than
white L. pertusa, the two colour varieties would only occur together at sites where fluid-seepage is
sufficiently high for both phenotypes. From statistical analysis of fingerprinting data, station 2
(‘Stokkbergneset’) showed the most pronounced dissimilarities to the other stations in terms of
relative and absolute composition of L. pertusa-related bacterial communities (→ 4.1.2). Acoustic
measurements provided evidence for hydrocarbon-enriched pore water seepage in the Agdenes
reef complex (Hovland and Risk 2003) fringing the southern side of the sound between seaward
fjord and Norwegian Sea. Judging from its position in the Trondheimsfjord (Fig. 3) it is well con-
ceivable that station 2 lies within the reach of this seepage and fluid emanation may constitute
another physicochemical factor (→ 4.1.2) controlling the bacterial consortia on L. pertusa in the
sense of the ‘Hydraulic Theory’.
Albeit thiotrophic γ-Proteobacteria on red corals could be positively influenced by seepage-coupled
anaerobic methane oxidation, this coral phenotype is obviously not completely reliant on
hydrocarbon seepage, since it also grows in regions for which such activity can be ruled out (e.g.,
station 1) (Hovland and Risk 2003). A trophic linkage appears to exist that enables independence
of the above-mentioned γ-Proteobacteria from exogenous H2S: The gas can also be produced

DISCUSSION
82
through decomposition of sulphur-containing amino acids by Clostridiaceae. Strikingly enough,
that group, too, appears to occur exclusively on red L. pertusa. Of course, this proposition calls
for further studies including stocktaking of coral phenotypes and detailed measurements of water
chemistry on various sites.
Interestingly, relatedness of bacteria from Mediterranean L. pertusa to microbes from hydro-
carbon seep or hydrothermal sediments (→ 3.2.1) suggests that they, too, are involved in
metabolising reduced sulphur compounds. This in turn implies that, howbeit Mediterranean
corals hosts different bacterial groups owing to the special environmental conditions, these
groups occupy the same or similar ecological niches connected to sulphur cycling as microbes in
Norwegian L. pertusa (→ 4.4.2).
4.4.3 Bacterial Community Composition and Colouring of L. pertusa
The finding of coral colour-dependent variations in the bacterial consortia of L. pertusa imposes
two other questions: What is the cause for the observed differences in bacterial community com-
position of the two coral phenotypes? And: Could bacteria cause the different colouring in
L. pertusa?
Mucus-mediated selection of bacterial symbionts was shown in the scleractinian coral Acropora
palmata, suggesting the coral mucus to play a role in the structuring of beneficial coral-associated
microbial communities (Ritchie 2006). Selection of certain bacterial groups by antibiotic or
growth-stimulating coral metabolites was also demonstrated for L. pertusa (Großkurth 2007). The
variability of the “liquid-associated” bacterial fraction (→ 4.4.1) observed in the present study
could be caused by such metabolites. Colour-related differences in bacterial community compo-
sition imply that white and red L. pertusa colonies produce different microbiologically active sub-
stances that lead to colour-specific selection of certain bacterial groups over others.
Bacterial pigmentation is already well known to play a role in eukaryote-prokaryote symbioses. In
particular, bacterially induced colouring applies to the Caribbean scleractinian coral Montastraea
cavernosa (Lesser et al. 2004): Its bright fluorescent orange colour is not caused by the animal itself
but by accessory pigments belonging to symbiotic cyanobacteria inside the coral tissue. It is of
course unlikely that staining in L. pertusa is caused by photosynthesis-related pigments, as this

DISCUSSION
83
species grows in virtually complete darkness. But pigmentation is a common phenomenon in
bacteria and does not necessarily coincide with photosynthesis or light protection. Light-indepen-
dent carotenoid formation, so-called scotochromogenesis, has been suggested to be a protection
against oxidative damage involving oxygen radicals (Madigan et al. 2003). Several bacteria found
in this study are know to produce reddish pigments: Rhodobacteraceae, Methylobacterium, and Rubri-
talea sp. All three groups occurred in both white and red L. pertusa. The Roseobacter clade, though
more abundant in white corals, does not necessarily produce red pigments: Closest cultivated
relatives from the most abundant Roseobacter group in white L. pertusa, strains DIII4* and EI1*,
were in fact colourless (Teske et al. 2000). Methylobacterium was only of minor abundance in the
two colour varieties. This leaves Rubritalea sp. (Verrucomicrobia), the only microbe both obligatory
red and prevailing on red L. pertusa, as the potential candidate for coral colouration. Since Verruco-
microbia were not detected on or in the coral tissue, a direct colouring of the tissue by the bacteria
as observed in M. cavernosa (Lesser et al. 2004) can be ruled out. Instead, conservation of the
carotenoids by the host cells upon digestion of the bacteria is conceivable. They could serve the
corals as protective agents against oxidative stress, as is the case for the squalene produced by
Rubritalea sp.
4.4.4 The Role of Tissue-Associated Bona Fide TM7 and Mycoplasmataceae
Two bacterial groups, Mycoplasmataceae and bona fide TM7, were found in close association with
the tissues of L. pertusa. From the interpretation of CARD-FISH data (→ 4.3) a schematic illus-
tration was created (Fig. 20). This scheme is meant to serve as a synoptic impression elucidating
positions and proportions of the two groups in relation to their host. Bacteria associated with the
coral’s mucus and gastric fluid are not shown in Fig. 20.
For the first time, sequences of candidate division TM7 were found in corals. With high probabi-
lity, those sequences belong to the filamentous bacteria observed in the gastrocoel of L. pertusa
(Fig. 20). General physiology and ecology of this group remain subject to speculation until addi-
tional knowledge from isolation assays becomes available. From what was said above on hypoxia
in the coral (→ 4.4.2), the location of these bona fide TM7 filaments indicates an anaerobic
metabolism. Their obviously tight attachment to the endodermal tissue suggests an interaction
with the gastromuscular cells probably involving the exchange of metabolites with its host.

DISCUSSION
10 mm
gastral
cavity
septa
10 µm
10 µm
nematocyst battery
(mainly spirocysts)
Mycoplasmataceae
ectoderm
filamentous bacteria
(bona fide TM7)
Fig. 20: Schematic illustration of L. pertusa polyps and bacteria hosted on their ectoderm and endoderm.
Bacteria associated with mucus and gastric fluid of the coral are not shown.
Mycoplasmas commonly live either attached to interior epithelia or inside cells of their hosts.
Several species were reported to colonise the external ear canal of goats (Cottew and Yeats 1981;
DaMassa et al. 1994). To my knowledge, the present study constitutes the first report on Mycoplas-
mataceae residing on exterior parts of their host, directly facing the environment. Given the
osmotic sensivity of this group (→ 4.2.4) their protection at this exposed location could be
ascribed to buffer properties of the coral’s mucopolysaccharide layer. Conclusions from the
84

DISCUSSION
85
general biology of mycoplasmas (→ 4.2.4) and their distinct boundedness to L. pertusa’s spiro-
cysts (Fig. 20) lead to the following theory: Capturing procedure in corals involves discharge of
stenoteles and other penetrant cnidocysts that perforate the prey and inject neurotoxins. Spiro-
cyst threads bear hollow tubules that solubilise upon discharge and contact with sea water and
adhere to the prey (Mariscal et al. 1977). Thus, the prey is kept affixed to the tentacles while the
paralysing effect of the neurotoxins evolves. Penetration of the prey will lead to leakage of hemo-
lymph. This process is comparable to the release of DOC from planktonic algae by ‘sloppy
feeding’ in zooplankton (e.g., Møller 2005). Their location on the distal ends of the spirocysts
allows coral-associated Mycoplasmataceae to directly assimilate from the leaking hemolymph amino
and fatty acids that they cannot synthesise themselves. The bacteria prevent themselves from
getting removed during the coral’s feeding process by adhesion to the host tissue via their tip
structure. The available evidence suggests that these L. pertusa-associated mycoplasmas live as
commensals in contrast to many of their parasitic relatives. They profit from the prey capture
activity but are neither advantageous nor detrimental to their coral host.
Closest relatives of the newly discovered Mycoplasmataceae are common on octocorals (Isididae
and M. elongata) (Fig. 11). Together these sequences form a monophyletic cluster within the Myco-
plasma hominis group (Fig. 12) (→ 3.2.1, 4.2.4). It is therefore reasoned that these organisms are
members of a novel phylogenetic lineage currently consisting of three apparently coral-specific
Mycoplasmataceae species. Its representative from L. pertusa is proposed as a novel candidate
species, “Candidatus Mycoplasma corallicola”, which is formally described in the following
chapter.
4.4.5 Proposal of “Candidatus Mycoplasma corallicola”
As suggested by Murray and Stackebrandt (1995), the category “Candidatus” should be used for a
description of prokaryotic entities that is based on more information than just a DNA sequence
but which lacks characteristics required according to the International Code of Nomenclature of
Bacteria. The Mycoplasmataceae described here represent a novel lineage of Mollicutes. 16S rDNA
sequence similarity is 89% and below to all other described Mycoplasma species, which justifies
proposition of a new candidate species. The lineage should be designated “Candidatus Myco-
plasma corallicola” (co.ral.li.co’la. L. n. corallum, coral; L. suff. -cola, inhabitant dweller; N.L. n.

DISCUSSION
86
4.5
corallicola, coral-dweller, referring to the host of the microorganism). The phylotype inhabiting the
cold-water coral L. pertusa is currently the only representative of this candidate species.
Assignment to “Candidatus Mycoplasma corallicola” is based on (1) the 16S rRNA gene sequence
of the above-mentioned phylotype (D11_CW02_full, EMBL accession number AM911412), (2) a
flask-shaped cell morphology of 0.5 × 1.6 µm, (3) the absence of a cell wall, (4) preferential
attachment to the spirocysts on the tentacle ectoderm of L. pertusa, and (5) positive hybridisation
with the oligonucleotide probe LGC0355b (5’-GGAATATTCCCTACTGCTG-3’).
Significance and Outlook
The present study tries to provide comprehensive report on the bacterial microflora associated
with the cold-water coral L. pertusa. Connections between the microbiology of this and other
marine hosts, most notably other corals were discovered. The association with certain types of
bacteria gave a number of clues about the ecology of L. pertusa. However, this indirect evidence
has to remain necessarily speculative in some points. Further studies based on these results will
offer new directions for research. In particular, the following aspects might be addressed:
(1) Comparison of L. pertusa-associated communities from a range of other locations to
broaden the data pool for conclusions on distribution patterns.
(2) Examination of the novel thiotrophic γ-Proteobacteria, bona fide TM7, and “Candidatus
Mycoplasma corallicola” by use of both cultivation and culture-independent methods.
(3) Investigation into the role of sulphur cycling, methylotrophy, and anaerobiosis in the
coral, e.g., by microsensor measurements and enzyme assays.
(4) Finding the cause of different colouring of L. pertusa by chemical analysis of its pigments
and comparing them to bacterial ones.
(5) Examination of the mechanisms used by L. pertusa colour varieties to maintain different
microbial communities, e.g., by analysis of antimicrobial factors in the coral mucus.
Investigation into these aspects will further elucidate the role of bacteria for the ecology of this
important cold-water coral species.

ACKNOWLEDGEMENTS
87
Acknowledgements
− First of all, I would like to express my greatest thanks to Prof. Dr. Karin Lochte (now
director of the Alfred Wegener Institute for Polar and Marine Research (AWI), Bremer-
haven) for her ingratiating, patient, and encouraging supervision, and for offering me
additional financial support through the AWI.
− Equal thanks go to my co-supervisor Prof. Dr. Wolf-Christian Dullo (Leibniz Institute
for Marine Sciences (IFM-GEOMAR), Kiel) who offered me the opportunity to work on
the fascinating relationship between L. pertusa and bacteria. In particular, my research was
part of the “Moundforce” project (DU/29/35-1) of the German Research Foundation
(DFG) and received considerable co-financing through Prof. Dr. Dullo’s Leibniz award
(DU/29/33).
− I am deeply indebted to Dr. Johanna Järnegren (now Norwegian Institute for Nature
Research, Trondheim) and Martin Ludvigsen (Norwegian University of Science and
Technology, Trondheim), Prof. Dr. Egil Sakshaugh, Prof. Dr. Jon-Arne Sneli, the staff of
Trondhjem Biological Station, the crew of R/V “Vita”, and – not least – Dr. Eike
Breitbarth (now University of Göteborg) for their organisational aid.
− Prof. Dr. Ulf Riebesell and Dipl.-Biol. Armin Form (IFM-GEOMAR) not only provided
me with aquarium-reared L. pertusa specimens but also with loads of valuable information
on this species.
− My T-RFLP analyses were enabled by the kind donation of GeneScan® software by Dr.
Klaus Heidorn (Institute for Hematopathology, Kiel University Hospital) and the permis-
sion of Prof. Dr. Johannes F. Imhoff and his work group (IFM-GEOMAR) to use their
facilities.
− High-quality genetic sequencing service was provided by Anita Dietsch and Melanie
Friskovec (Institute for Clinical Molecular Biology, Kiel University Hospital).
− Dipl. Biol. Miriam Weber (Max Planck Institute for Marine Microbiology, Bremen) taught
me the art of CARD-FISH.

ACKNOWLEDGEMENTS
88
− Dipl.-Biol. Andrea Gärtner (IFM-GEOMAR) provided me with the bacterial test strains
for CARD-FISH. I very much appreciate her efforts to culture them several times only
for this purpose.
− Prof. Dr. Ulrich Sommer and his work group (IFM-GEOMAR) allowed me to use their
epifluorescence microscope.
− Dipl.-Biol. Annegret Stuhr (IFM-GEOMAR) put the digital still camera at my disposal.
− It is thanks to Dipl.-Biol. Sandra Schöttner (Max Planck Institute for Marine Micro-
biology, Bremen) that I re-examined my coral thin sections and realised the irregular fila-
ments on them were no artefacts.
− Many thanks to Dr. Vera Thiel (IFM-GEOMAR) for her constructive critique on metho-
dology and contents of this thesis.
− Erling Svensen provided me generously with a free top quality underwater photograph of
L. pertusa (Fig. 1).
− This work would not have been successful without the precious advice and aid of many
persons. Some who definitely deserve to be mentioned here are (in alphabetical order):
Dr. Martina Blümel, Peter Fritsche, Dr. Michael Hügler, Diana Hümmer, Tania Klüver,
B.Sc. Rebecca Langlois, Dr. Frank Lappe, Kerstin Nachtigall, Dr. Andres Rüggeberg, Dr.
Jörg Süling, Dipl.-Biol. Marcus Tank, and Dr. Jutta Wiese (all IFM-GEOMAR).
− I am grateful to all people I made friends with during the time of my work.

REFERENCES
89
References
Ainsworth TD, Fine M, Roff G, Hoegh-Guldberg O (2008) Bacteria are Not the Primary Cause
of Bleaching in the Mediterranean Coral Oculina patagonica. ISME J 2:67-73
Altschul SF, Gish W, Miller W, Myers EW, Lipman DJ (1990) Basic Local Alignment Search
Tool. J Mol Biol 215:403-410
Aluwihare LI, Repeta DJ, Pantoja S, Johnson CG (2005) Two Chemically Distinct Pools of
Organic Nitrogen Accumulate in the Ocean. Science 308:1007-1010
Amann R, Binder BJ, Olson RJ, Chrisholm SW, Devereux R, Stahl DA (1990) Combination of
16S rRNA-Targeted Oligonucleotide Probes with Flow Cytometry for Analyzing Mixed
Microbial Populations. Appl Environ Microbiol 56:1919-1925
Amann R, Ludwig W, Schleifer K-H (1995) Phylogenetic Identification and in Situ Detection of
Individual Microbial Cells without Cultivation. Microbiol Rev 59:143-169
Arp AJ, Childress JJ, Fisher CR (1984) Metabolic and Blood-Gas Transport Characteristics of the
Hydrothermal Vent Bivalve Calyptogena magnifica. Physiol Zool 57:648-662
Azam F, Fenchel T, Field JG, Gray JS, Meyer-Reil LA, Thingstad F (1983) The Ecological Role
of Water-Column Microbes in the Sea. Mar Ecol Prog Ser 10:257-263
Banin E, Ben-Haim Y, Israely T, Loya Y, Rosenberg E (2000a) Effect of the Environment on the
Bacterial Bleaching of Corals. Water Air Soil Poll 123:337-352
Banin E, Israely T, Kushmaro A, Loya Y, Orr E, Rosenberg E (2000b) Penetration of the Coral-
Bleaching Bacterium Vibrio shiloi into Oculina patagonica. Appl Environ Microbiol 66:3031-
3036
Becker P, Smolowitz R, Porter M, Hsu A, Roberts S (2004) Characterization of Bacteria
Associated with Lobster Shell Disease. Biol Bull 207:171-171

REFERENCES
90
Ben-Haim Y, Rosenberg E (2002) A Novel Vibrio sp. Pathogen of the Coral Pocillopora Damicornis.
Mar Biol 141:47-55
Ben-Haim Y, Thompson FL, Thompson CC, Cnockaert MC, Hoste B, Swings J, Rosenberg E
(2003) Vibrio coralliilyticus sp. nov., a Temperature-Dependent Pathogen of the Coral
Pocillopora Damicornis. Int J Syst Evol Microbiol 53:309-315
Bernardet JF, Vancanneyt M, Matte-Tailliez O, Grisez L, Tailliez P, Bizet C, Nowakowski M,
Kerouault B, Swings J (2005) Polyphasic Study of Chryseobacterium Strains Isolated from
Diseased Aquatic Animals. Syst Appl Microbiol 28:640-660
Beuck L, Freiwald A (2005) Bioerosion Patterns in a Deep-Water Lophelia pertusa (Scleractinia)
Thicket (Propeller Mound, Northern Porcupine Seabight). In: Freiwald A, Roberts JM (eds)
Cold-Water Corals and Ecosystems. Springer, Berlin, Heidelberg, pp 915-936
Boetius A, Ravenschlag K, Schubert CJ, Rickert D, Widdel F, Gieseke A, Amann R, Jørgensen
BB, Witte U, Pfannkuche O (2000) A Marine Microbial Consortium Apparently Mediating
Anaerobic Oxidation of Methane. Nature 407:623-626
Bond PL, Hugenholtz P, Keller J, Blackall LL (1995) Bacterial Community Structures of
Phosphate-Removing and Non-Phosphate-Removing Activated Sludges from Sequencing
Batch Reactors. Appl Environ Microbiol 61:1910-1916
Børsheim KY, Myklestad SM, Sneli J-A (1999) Monthly Profiles of DOC, Mono- and
Polysaccharides at Two Locations in the Trondheimsfjord (Norway) During Two Years.
Mar Chem 63:255-272
Bourne DG, Munn CB (2005) Diversity of Bacteria Associated with the Coral Pocillopora
Damicornis from the Great Barrier Reef. Environ Microbiol 7:1162-1174
Brinig MM, Lepp PW, Ouverney CC, Armitage GC, Relman DA (2003) Prevalence of Bacteria of
Division TM7 in Human Subgingival Plaque and Their Association with Disease. Appl
Environ Microbiol 69:1687-1694
Brosius J, Dull TJ, Sleeter DD, Noller HF (1981) Gene Organization and Primary Structure of a
Ribosomal Operon from Escherichia coli. J Mol Biol 148:107-127

REFERENCES
91
Buchan A, González JM, Moran MA (2005) Overview of the Marine Roseobacter Lineage. Appl
Environ Microbiol 71:5665-5677
Buddemeier RW, Kienze RA (1976) Coral Growth. Oceanogr Mar Biol Ann Rev 14:183-225
Buhl-Mortensen L, Mortensen PB (2004) Symbiosis in Deep-Water Corals. Symbiosis 37:33-61
Bythell JC, Barer MR, Cooney RP, Guest JR, O'Donnell AG, Pantos O, Le Tissier MDA (2002)
Histopathological Methods for the Investigation of Microbial Communities Associated
with Disease Lesions in Reef Corals. Lett Appl Microbiol 34:359-364
Carrigg C, Rice O, Kavanagh S, Collins G, O'Flaherty V (2007) DNA Extraction Method Affects
Microbial Community Profiles from Soils and Sediment. Appl Microbiol Biot 77:955-964
Casamayor EO, Massana R, Benlloch S, Øvreås L, Diez B, Goddard VJ, Gasol JM, Joint I,
Rodriguez-Valera F, Pedrós-Alió C (2002) Changes in Archaeal, Bacterial and Eukaryal
Assemblages Along a Salinity Gradient by Comparison of Genetic Fingerprinting Methods
in a Multipond Solar Saltern. Environ Microbiol 4:338-348
Clarke KR (1993) Nonparametric Multivariate Analyses of Changes in Community Structure.
Aust Ecol 18:117-143
Cole JR, Chai B, Farris RJ, Wang Q, Kulam-Syed-Mohideen AS, McGarrell DM, Bandela AM,
Cardenas E, Garrity GM, Tiedje JM (2007) The Ribosomal Database Project (RDP-II):
Introducing myRDP Space and Quality Controlled Public Data. Nucleic Acids Res
35:D169-D172
Cole JR, Chai B, Marsh TL, Farris RJ, Wang Q, Kulam SA, Chandra S, McGarrell DM, Schmidt
TM, Garrity GM, Tiedje JM (2003) The Ribosomal Database Project (RDP-II): Previewing
a New Autoaligner That Allows Regular Updates and the New Prokaryotic Taxonomy.
Nucleic Acids Res 31:442-443
Coles SL, Strathmann R (1973) Observations on Coral Mucus 'Flocs' and Their Potential Trophic
Significance. Limnol Oceanogr 18:673-678

REFERENCES
92
Cooney RP, Pantos O, Le Tissier MDA, Barer MR, O'Donnell AG, Bythell JC (2002)
Characterization of the Bacterial Consortium Associated with Black Band Disease in Coral
Using Molecular Microbiological Techniques. Environ Microbiol 4:401-413
Costa R, Mermoud I, Koblavi S, Morlet B, Haffner P, Berthe F, Legroumellec M, Grimont P
(1998) Isolation and Characterization of Bacteria Associated with a Penaeus stylirostris
Disease (Syndrome 93) in New Caledonia. Aquaculture 164:297-309
Cottew GS, Yeats FR (1981) Occurrence of Mycoplasmas in Clinically Normal Goats. Aust Vet J
57:52-53
Cottrell MT, Wood DN, Yu LY, Kirchman DL (2000) Selected Chitinase Genes in Cultured and
Uncultured Marine Bacteria in the Alpha- and Gamma-Subclasses of the Proteobacteria. Appl
Environ Microbiol 66:1195-1201
Daims H, Brühl A, Amann R, Schleifer K-H, Wagner M (1999) The Domain-Specific Probe
Eub338 Is Insufficient for the Detection of All Bacteria: Development and Evaluation of a
More Comprehensive Probe Set. Syst Appl Microbiol 22:434-444
DaMassa AJ, Tully JG, Rose DL, Pitcher D, Leach RH, Cottew GS (1994) Mycoplasma auris sp.
nov., Mycoplasma cottewii sp. nov., and Mycoplasma yeatsii sp. nov., New Sterol-Requiring
Mollicutes from the External Ear Canals of Goats. Int J Syst Bacteriol 44:479-484
Damm E, Kiene RP, Schwarz J, Falck E, Dieckmann G (2008) Methane Cycling and Its
Relationship with DMSP During a Phytoplankton Bloom. Geophys Res Abs 10:1607-
7962/gra/EGU2008-A-03226
Dedysh SN, Dunfield PF, Trotsenko YA (2004) Methane Utilization by Methylobacterium Species:
New Evidence but Still No Proof for an Old Controversy. Int J Syst Evol Microbiol
54:1919-1920
Delibrias G, Taviani M (1985) Dating the Death of Mediterranean Deep-Sea Scleractinian Corals.
Mar Geol 62:175-180

REFERENCES
93
Denner EBM, Smith GW, Busse H-J, Schumann P, Narzt T, Polson SW, Lubitz W, Richardson
LL (2003) Aurantimonas coralicida gen. nov., sp. nov., the Causative Agent of White Plague
Type II on Caribbean Scleractinian Corals. Int J Syst Evol Microbiol 53:1115-1122
Dinsdale EA, Pantos O, Smriga S, Edwards RA, Angly F, Wegley L, Hatay M, Hall D, Brown E,
Haynes M, Krause L, Sala E, Sandin SA, Thurber RV, Willis BL, Azam F, Knowlton N,
Rohwer F (2008) Microbial Ecology of Four Coral Atolls in the Northern Line Islands.
PLoS ONE 3:e1584
DiSalvo LH (1969) Isolation of Bacteria from the Corallum of Porites lobata (Vaughn) and Its
Possible Significance. Am Zool 9:735-740
DiSalvo LH (1971) Regenerative Functions and Microbial Ecology of Coral Reefs: Labelled
Bacteria in a Coral Reef Microcosm. J Exp Mar Biol Ecol 7:123-136
Dons C (1944) Norges Korallrev. Det Kongelige Norske Videnskabers Selskab. Forhandlinger
16:37-82
Ducklow HW, Mitchell R (1979) Bacterial Populations and Adaptations in the Mucus Layers on
Living Corals. Limnol Oceanogr 24:715-725
Dunbar JM, Ticknor LO, Kuske CR (2000) Assessment of Microbial Diversity in Four
Southwestern United States Soils by 16S rRNA Gene Terminal Restriction Fragment
Analysis. Appl Environ Microbiol 66:2943-2950
Duperron S, Bergin C, Zielinski F, Blazejak A, Pernthaler A, McKiness ZP, DeChaine E,
Cavanaugh CM, Dubilier N (2006) A Dual Symbiosis Shared by Two Mussel Species,
Bathymodiolus azoricus and Bathymodiolus puteoserpentis (Bivalvia: Mytilidae), from Hydrothermal
Vents Along the Northern Mid-Atlantic Ridge. Environ Microbiol 8:1441-1447
Duperron S, Nadalig T, Caprais JC, Sibuet M, Fiala-Medioni A, Amann R, Dubilier N (2005)
Dual Symbiosis in a Bathymodiolus sp. Mussel from a Methane Seep on the Gabon
Continental Margin (Southeast Atlantic): 16S rRNA Phylogeny and Distribution of the
Symbionts in Gills. Appl Environ Microbiol 71:1694-1700
Dybvig K, Voelker LL (1996) Molecular Biology of Mycoplasmas. Annu Rev Microbiol 50:25-57

REFERENCES
94
Eder W, Jahnke LL, Schmidt M, Huber R (2001) Microbial Diversity of the Brine-Seawater
Interface of the Kebrit Deep, Red Sea, Studied Via 16S rRNA Gene Sequences and
Cultivation Methods. Appl Environ Microbiol 67:3077-3085
Edwards KJ, Bond PL, Gihring TM, Banfield JF (2000) An Archaeal Iron-Oxidizing Extreme
Acidophile Important in Acid Mine Drainage. Science 287:1796-1799
Egert M, Friedrich MW (2003) Formation of Pseudo-Terminal Restriction Fragments, a PCR-
Related Bias Affecting Terminal Restriction Fragment Length Polymorphism Analysis of
Microbial Community Structure. Appl Environ Microbiol 69:2555-2562
Einen J, Øvreås L (2006) Flaviramulus basaltis gen. nov., sp. nov., a Novel Member of the Family
Flavobacteriaceae Isolated from Seafloor Basalt. Int J Syst Evol Microbiol 56:2455-2461
Elshahed MS, Youssef NH, Luo Q, Najar FZ, Roe BA, Sisk TM, Buhring SI, Hinrichs K-U,
Krumholz LR (2007) Phylogenetic and Metabolic Diversity of Planctomycetes from
Anaerobic, Sulfide- and Sulfur-Rich Zodletone Spring, Oklahoma. Appl Environ Microbiol
73:4707-4716
Erhart R, Bradford D, Seviour RJ, Amann R, Blackall LL (1997) Development and Use of
Fluorescent in Situ Hybridization Probes for the Detection and Identification of
''Microthrix Parvicella'' in Activated Sludge. Syst Appl Microbiol 20:310-318
Fernández A, Huang S, Seston S, Xing J, Hickey R, Criddle C, Tiedje JM (1999) How Stable Is
Stable? Function Versus Community Composition. Appl Environ Microbiol 65:3697-3704
Fisher MM, Triplett EW (1999) Automated Approach for Ribosomal Intergenic Spacer Analysis
of Microbial Diversity and Its Application to Freshwater Bacterial Communities. Appl
Environ Microbiol 65:4630-4636
Fosså JH, Mortensen PB, Furevik DM (2002) The Deep-Water Coral Lophelia pertusa in
Norwegian Waters: Distribution and Fishery Impacts. Hydrobiologia 471:1-12
Franzisket L (1970) The Effect of Mucus on Respirometry of Reef Corals. Int Rev Gesamt
Hydrobiol 55:409-412

REFERENCES
95
Frasca S, Jr., Weber ES, Urquhart H, Liao XF, Gladd M, Cecchini K, Hudson P, May M, Gast
RJ, Gorton TS, Geary SJ (2005) Isolation and Characterization of Mycoplasma sphenisci sp.
nov. From the Choana of an Aquarium-Reared Jackass Penguin (Spheniscus demersus). J Clin
Microbiol 43:2976-2979
Freiwald A (1998) Geobiology of Lophelia pertusa (Scleractinia) Reefs in the North Atlantic.
Habilitation thesis, Universität Bremen, Bremen
Freiwald A (2002) Reef-Forming Cold-Water Corals. In: Wefer G, Billett D, Hebbeln D,
Jørgensen BB, Schlüter M, van Weering TCE (eds) Ocean Margin Systems. Springer,
Berlin, Heidelberg, pp 365-385
Freiwald A, Henrich R, Paetzold J (1997) Anatomy of a Deep-Water Coral Reef Mound from
Stjernsund, West Finnmark, Northern Norway. In: James NP, Clarke Jonathan AD (eds)
Cool-Water Carbonates. SEPM (Society for Sedimentary Geology), Tulsa, pp 141-162
Freiwald A, Wilson JB, Henrich R (1999) Grounding Pleistocene Icebergs Shape Recent Deep-
Water Coral Reefs. Sed Geol 125:1-8
Frias-Lopez J, Zerkle AL, Bonheyo GT, Fouke BW (2002) Partitioning of Bacterial Communities
between Seawater and Healthy, Black Band Diseased, and Dead Coral Surfaces. Appl.
Environ. Microbiol. 68:2214-2228
Gärtner A, Wiese J, Imhoff JF (2008) Amphritea atlantica gen. nov., sp. nov., a
Gammaproteobacterium from the Logatchev Hydrothermal Vent Field. Int J Syst Evol
Microbiol 58:34-39
Goffredi SK, Paull CK, Fulton-Bennett K, Hurtado LA, Vrijenhoek RC (2004) Unusual Benthic
Fauna Associated with a Whale Fall in Monterey Canyon, California. Deep Sea Res I
51:1295-1306
Gonzalez JM, Kiene RP, Moran MA (1999) Transformation of Sulfur Compounds by an
Abundant Lineage of Marine Bacteria in the Alpha -Subclass of the Class Proteobacteria.
Appl. Environ. Microbiol. 65:3810-3819

REFERENCES
96
González JM, Kiene RP, Moran MA (1999) Transformation of Sulfur Compounds by an
Abundant Lineage of Marine Bacteria in the Alpha-Subclass of the Class Proteobacteria. Appl
Environ Microbiol 65:3810-3819
González JM, Simó R, Massana R, Covert JS, Casamayor EO, Pedrós-Alió C, Moran MA (2000)
Bacterial Community Structure Associated with a Dimethylsulfoniopropionate-Producing
North Atlantic Algal Bloom. Appl Environ Microbiol 66:4237-4246
Großkurth AK (2007) Analysis of Bacterial Community Composition on the Cold-Water Coral
Lophelia pertusa and Antibacterial Effects of Coral Extracts. Diploma thesis, Carl von
Ossietzky Universität, Oldenburg, 105 pages
Guindon S, Gascuel O (2003) A Simple, Fast, and Accurate Algorithm to Estimate Large
Phylogenies by Maximum Likelihood. Syst Biol 52:696-704
Gutiérrez G, Sánchez D, Marín A (2002) A Reanalysis of the Ancient Mitochondrial DNA
Sequences Recovered from Neandertal Bones. Mol Biol Evol 19:1359-1366
Hallberg KB, Coupland K, Kimura S, Johnson DB (2006) Macroscopic Streamer Growths in
Acidic, Metal-Rich Mine Waters in North Wales Consist of Novel and Remarkably Simple
Bacterial Communities. Appl Environ Microbiol 72:2022-2030
Hall-Spencer J, Allain V, Fosså JH (2002) Trawling Damage to Northeast Atlantic Ancient Coral
Reefs. P Roy Soc Lond B Bio 269:507-511
Hansen LB, Finster K, Fossing H, Iversen N (1998) Anaerobic Methane Oxidation in Sulfate
Depleted Sediments: Effects of Sulfate and Molybdate Additions. Aquat Microb Ecol
14:195-204
Heikoop JM, Hickmott DD, Risk MJ, Shearer CK, Atudorei V (2002) Potential Climate Signals
from the Deep-Sea Gorgonian Coral Primnoa resedaeformis. Hydrobiologia 471:117-124
Herman JG, Graff JR, Myohanen S, Nelkin BD, Baylin SB (1996) Methylation-Specific PCR: A
Novel PCR Assay for Methylation Status of CpG Islands. P Natl Acad Sci USA 93:9821-
9826
Hovland M (1990) Do Carbonate Reefs Form Due to Fluid Seepage? Terra Nova 2:8-18

REFERENCES
97
Hovland M, Mortensen PB, Brattegard T, Strass P, Rokoengen K (1998) Ahermatypic Coral
Banks Off Mid-Norway: Evidence for a Link with Seepage of Light Hydrocarbons. Palaios
13:189-200
Hovland M, Risk MJ (2003) Do Norwegian Deep-Water Coral Reefs Rely on Seeping Fluids?
Mar Geol 198:83-96
Hovland M, Thomsen E (1997) Cold-Water Corals - Are They Hydrocarbon Seep Related? Mar
Geol 137:159-164
Huber T, Faulkner G, Hugenholtz P (2004) Bellerophon: A Program to Detect Chimeric
Sequences in Multiple Sequence Alignments. Bioinformatics 20:2317-2319
Hugenholtz P, Goebel BM, Pace NR (1998) Impact of Culture-Independent Studies on the
Emerging Phylogenetic View of Bacterial Diversity. J Bacteriol 180:6793-
Hugenholtz P, Tyson GW, Blackall LL (2002) Design and Evaluation of 16S rRNA-Targeted
Oligonucleotide Probes for Fluorescence in Situ Hybridization. Methods Mol Biol 179:29-
42
Hugenholtz P, Tyson GW, Webb RI, Wagner AM, Blackall LL (2001) Investigation of Candidate
Division TM7, a Recently Recognized Major Lineage of the Domain Bacteria with No
Known Pure-Culture Representatives. Appl Environ Microbiol 67:411-419
Hunt DE, Gevers D, Vahora NM, Polz MF (2007) Conservation of the Chitin Utilization
Pathway in the Vibrionaceae. Appl Environ Microbiol DOI: 10.1128/AEM.01412-07
Hurlbert S (1971) The Nonconcept of Species Diversity: A Critique and Alternative Parameters.
Ecology 52:577–586
Jacobson P (1983) Physical Oceanography of the Trondheimsfjord. Geophys Astro Fluid 26:3-26
Kapley A, Siddiqui S, Misra K, Ahmad S, Purohit H (2007) Preliminary Analysis of Bacterial
Diversity Associated with the Porites Coral from the Arabian Sea. World J Microbiol
Biotechnol 23:923-930

REFERENCES
98
Kasai H, Katsuta A, Sekiguchi H, Matsuda S, Adachi K, Shindo K, Yoon J, Yokota A, Shizuri Y
(2007) Rubritalea squalenifaciens sp. nov., a Squalene-Producing Marine Bacterium Belonging
to Subdivision 1 of the Phylum 'Verrucomicrobia'. Int J Syst Evol Microbiol 57:1630-1634
Kato Y, Asahara M, Arai D, Goto K, Yokota A (2005) Reclassification of Methylobacterium
chloromethanicum and Methylobacterium dichloromethanicum as Later Subjective Synonyms of
Methylobacterium extorquens and of Methylobacterium lusitanum as a Later Subjective Synonym of
Methylobacterium rhodesianum. J Gen Appl Microbiol 51:287-299
Keane TM, Creevey CJ, Pentony MM, Naughton TJ, McInerney JO (2006) Assessment of
Methods for Amino Acid Matrix Selection and Their Use on Empirical Data Shows That
Ad Hoc Assumptions for Choice of Matrix are Not Justified. BMC Evol Biol 6
Kellogg CA (2006) Microbial Ecology of the Deep-Sea Coral Lophelia pertusa [Abstract Only].
EOS Trans AGU 87.
Kellogg CA (2004) Tropical Archaea: Diversity Associated with the Surface Microlayer of Corals.
Mar Ecol Prog Ser 273:81-88
Kellogg CA, Stone RP (2004) A Pilot Study of Deep Water Coral Microbial Ecology [Abstract
Only]. ASLO/TOS Ocean Research Conference.
Kelman D, Kashman Y, Rosenberg E, Kushmaro A, Loya Y (2006) Antimicrobial Activity of
Red Sea Corals. Mar Biol 149:357-363
Kelman D, Kushmaro A, Kashman Y, Loya Y, Benayahu Y (1998) Antimicrobial Activity of a
Red Sea Soft Coral, Parerythropodium fulvum fulvum: Reproductive and Developmental
Considerations. Mar Ecol Prog Ser 169:87-95
Kimura H, Higashide Y, Naganuma T (2003) Endosymbiotic Microflora of the Vestimentiferan
Tubeworm (Lamellibrachia sp.) from a Bathyal Cold Seep. Mar Biotechnol 5:593-603
Kiriakoulakis K, Fisher E, Wolff GA, Freiwald A, Grehan A, Roberts JM (2005) Lipids and
Nitrogen Isotopes of Two Deep-Water Corals from the North-East Atlantic: Initial Results
and Implications for Their Nutrition. In: Freiwald A, Roberts JM (eds) Cold-Water Corals
and Ecosystems. Springer, Berlin, Heidelberg, pp 715-729

REFERENCES
99
Klein B, Roether W, Manca BB, Bregant D, Beitzel V, Kovacevic V, Luchetta A (1999) The
Large Deep Water Transient in the Eastern Mediterranean. Deep Sea Res I 46:371-414
Kline DI, Kuntz NM, Breitbart M, Knowlton N, Rohwer F (2006) Role of Elevated Organic
Carbon Levels and Microbial Activity in Coral Mortality. Mar Ecol Prog Ser 314:119-125
Knowlton N, Rohwer F (2003) Multispecies Microbial Mutualisms on Coral Reefs: The Host as a
Habitat. Am Nat 162:S51-S62
Ko T-F, Weng Y-M, Chiou RY-Y (2002) Squalene Content and Antioxidant Activity of Terminalia
catappa Leaves and Seeds. J Agric Food Chem 50:5343-5348
Koh EGL (1997) Do Scleractinian Corals Engage in Chemical Warfare against Microbes? J Chem
Ecol 23:379-398
Koren O, Rosenberg E (2006) Bacteria Associated with Mucus and Tissues of the Coral Oculina
patagonica in Summer and Winter. Appl Environ Microbiol 72:5254-5259
Kormas KA, Tivey MK, Von Damm K, Teske A (2006) Bacterial and Archaeal Phylotypes
Associated with Distinct Mineralogical Layers of a White Smoker Spire from a Deep-Sea
Hydrothermal Vent Site (9°N, East Pacific Rise). Environ Microbiol 8:909-920
Kühl M, Cohen Y, Dalsgaard T, Jørgensen BB, Revsbech NP (1995) Microenvironment and
Photosynthesis of Zooxanthellae in Scleractinian Corals Studied with Microsensors for O2,
pH and Light. Mar Ecol Prog Ser 117:159-172
Kulikova T, Aldebert P, Althorpe N, Baker W, Bates K, Browne P, van den Broek A, Cochrane
G, Duggan K, Eberhardt R, Faruque N, Garcia-Pastor M, Harte N, Kanz C, Leinonen R,
Lin Q, Lombard V, Lopez R, Mancuso R, McHale M, Nardone F, Silventoinen V, Stoehr
P, Stoesser G, Tuli MA, Tzouvara K, Vaughan R, Wu D, Zhu W, Apweiler R (2004) The
Embl Nucleotide Sequence Database. Nucleic Acids Res 32:D27-30
Lanoil BD, Sassen R, La Duc MT, Sweet ST, Nealson KH (2001) Bacteria and Archaea Physically
Associated with Gulf of Mexico Gas Hydrates. Appl Environ Microbiol 67:5143-5153
Le Campion-Alsumard T, Golubic S, Hutchings P (1995) Microbial Endoliths in Skeletons of
Live and Dead Corals: Porites lobata (Moorea, French Polynesia). Mar Ecol Prog Ser 117

REFERENCES
100
Le Goff-Vitry MC, Pybus OG, Rogers AD (2004) Genetic Structure of the Deep-Sea Coral
Lophelia pertusa in the Northeast Atlantic Revealed by Microsatellites and Internal
Transcribed Spacer Sequences. Mol Ecol 13:537-549
Lesser MP, Mazel CH, Gorbunov MY, Falkowski PG (2004) Discovery of Symbiotic Nitrogen-
Fixing Cyanobacteria in Corals. Science 305:997-1000
Levy O, Mizrahi L, Chadwick-Furman NE, Achituv Y (2001) Factors Controlling the Expansion
Behavior of Favia favus (Cnidaria: Scleractinia): Effects of Light, Flow, and Planktonic Prey.
Biol Bull 200:118-126
Lewis JB, Price WS (1975) Feeding Mechanisms and Feeding Strategies of Atlantic Reef Corals. J
Zool 176:527-544
Lindberg B, Mienert J (2005) Postglacial Carbonate Production by Cold-Water Corals on the
Norwegian Shelf and Their Role in the Global Carbonate Budget. Geology 33:537-540
Linnaeus C (1758) Systema Naturae Per Regna Tria Naturae, Secundum Classes, Ordines,
Genera, Species, Cum Characteribus, Differentiis, Synonymis, Locis. 10th edition,
Stockholm
Liu WT, Marsh TL, Cheng H, Forney L (1997) Characterization of Microbial Diversity by
Determining Terminal Restriction Fragment Length Polymorphisms of Genes Encoding
16S rRNA. Appl Environ Microbiol 63:4516-4522
López-García P, Duperron S, Philippot P, Foriel J, Susini J, Moreira D (2003) Bacterial Diversity
in Hydrothermal Sediment and Epsilon Proteobacterial Dominance in Experimental
Microcolonizers at the Mid-Atlantic Ridge. Environ Microbiol 5:961-976
Ludwig W, Strunk O, Westram R, Richter L, Meier H, Yadhukumar, Buchner A, Lai T, Steppi S,
Jobb G, Forster W, Brettske I, Gerber S, Ginhart AW, Gross O, Grumann S, Hermann S,
Jost R, Konig A, Liss T, Lussmann R, May M, Nonhoff B, Reichel B, Strehlow R,
Stamatakis A, Stuckmann N, Vilbig A, Lenke M, Ludwig T, Bode A, Schleifer K-H (2004)
ARB: A Software Environment for Sequence Data. Nucleic Acids Res 32:1363-1371

REFERENCES
101
Lukas KJ (1974) Two Species of the Chlorophyte Genus Ostreobium from Skeletons of Atlantic
and Caribbean Reef Corals. J Phycol 10:331-335
Lukow T, Dunfield PF, Liesack W (2000) Use of the T-RFLP Technique to Assess Spatial and
Temporal Changes in the Bacterial Community Structure within an Agricultural Soil
Planted with Transgenic and Non-Transgenic Potato Plants. FEMS Microbiol Ecol 32:241-
247
Luna GM, Biavasco F, Danovaro R (2007) Bacteria Associated with the Rapid Tissue Necrosis of
Stony Corals. Environ Microbiol 9:1851-1857
Madigan MT, Martinko JM, Parker J (2003) Brock. Mikrobiologie. 9th Edition (in German).
Spektrum Akademischer Verlag, Heidelberg, Berlin
Manz W, Amann R, Ludwig W, Wagner M, Schleifer K-H (1992) Phylogenetic
Oligodeoxynucleotide Probes for the Major Subclasses of Proteobacteria - Problems and
Solutions. Syst Appl Microbiol 15:593-600
Mariscal RN, McLean RB, Hand C (1977) The Form and Function of Cnidarian Spirocysts. Cell
Tissue Res 178:427-433
McCarthy M, Pratum T, Hedges J, Benner R (1997) Chemical Composition of Dissolved Organic
Nitrogen in the Ocean. Nature 390:150-154
McKiness ZP, Cavanaugh CM (2005) The Ubiquitous Mussel: Bathymodiolus aff. brevior Symbiosis
at the Central Indian Ridge Hydrothermal Vents. Mar Ecol Prog Ser 295:183-190
Moeseneder MM, Arrieta JM, Muyzer G, Winter C, Herndl GJ (1999) Optimization of Terminal-
Restriction Fragment Length Polymorphism Analysis for Complex Marine
Bacterioplankton Communities and Comparison with Denaturing Gradient Gel
Electrophoresis. Appl Environ Microbiol 65:3518-3525
Møller EF (2005) Sloppy Feeding in Marine Copepods: Prey-Size-Dependent Production of
Dissolved Organic Carbon. J Plankton Res 27:27-35
Moore JG, Fabbi BP (1971) An Estimate of the Juvenile Sulfur Content of Basalt. Contrib
Mineral Petrol 33:118-127

REFERENCES
102
Moosvi SA, Pacheco CC, McDonald IR, De Marco P, Pearce DA, Kelly DP, Wood AP (2005)
Isolation and Properties of Methanesulfonate-Degrading Afipia felis from Antarctica and
Comparison with Other Strains of A. felis. Environ Microbiol 7:22-33
Mortensen PB (2001) Aquarium Observations on the Deep-Water Coral Lophelia pertusa (L.,
1758) (Scleractinia) and Selected Associated Invertebrates. Ophelia 54:83-104
Mortensen PB, Hovland M, Brattegard T, Farestveit R (1995) Deep Water Bioherms of the
Scleractinian Coral Lophelia pertusa (L.) at 64°N on the Norwegian Shelf: Structure and
Associated Megafauna. Sarsia 80:145-158
Mortensen PB, Rapp HT (1998) Oxygen and Carbon Isotope Ratios Related to Growth Line
Patterns in Skeletons of Lophelia pertusa (L) (Anthozoa, Scleractinia): Implications for
Determination of Linear Extension Rates. Sarsia 83:433-446
Murray RGE, Stackebrandt E (1995) Taxonomic Note - Implementation of the Provisional
Status Candidatus for Incompletely Described Prokaryotes. Int J Syst Bacteriol 45:186-187
Neef A (1997) Anwendung der in Situ Einzelzell-Identifizierung von Bakterien zur
Populationsanalyse in komplexen mikrobiellen Biozönosen. PhD thesis, Technische
Universität, Munich
Nercessian O, Fouquet Y, Pierre C, Prieur D, Jeanthon C (2005) Diversity of Bacteria and
Archaea Associated with a Carbonate-Rich Metalliferous Sediment Sample from the
Rainbow Vent Field on the Mid-Atlantic Ridge. Environ Microbiol 7:698-714
Noé SU, Dullo W-C (2006) Skeletal Morphogenesis and Growth Mode of Modern and Fossil
Deep-Water Isidid Gorgonians (Octocorallia) in the West Pacific (New Zealand and Sea of
Okhotsk). Coral Reefs 25:303-320
Noé SU, Titschack J, Freiwald A, Dullo W-C (2005) From Sediment to Rock: Diagenetic
Processes of Hardground Formation in Deep-Water Carbonate Mounds of the NE
Atlantic. Facies DOI: 10.1007/s10347-005-0037-x
Orr JC, Fabry VJ, Aumont O, Bopp L, Doney SC, Feely RA, Gnanadesikan A, Gruber N, Ishida
A, Joos F, Key RM, Lindsay K, Maier-Reimer E, Matear R, Monfray P, Mouchet A, Najjar

REFERENCES
103
RG, Plattner G-K, Rodgers KB, Sabine CL, Sarmiento JL, Schlitzer R, Slater RD,
Totterdell IJ, Weirig M-F, Yamanaka Y, Yool A (2005) Anthropogenic Ocean Acidification
over the Twenty-First Century and Its Impact on Calcifying Organisms. Nature 437:681-
686
Osborn AM, Moore ERB, Timmis KN (2000) An Evaluation of Terminal-Restriction Fragment
Length Polymorphism (T-RFLP) Analysis for the Study of Microbial Community Structure
and Dynamics. Environ Microbiol 2:39-50
Ouverney CC, Armitage GC, Relman DA (2003) Single-Cell Enumeration of an Uncultivated
TM7 Subgroup in the Human Subgingival Crevice. Appl Environ Microbiol 69:6294-6298
Peek AS, Feldman RA, Lutz RA, Vrijenhoek RC (1998) Cospeciation of Chemoautotrophic
Bacteria and Deep Sea Clams. P Natl Acad Sci USA 95:9962-9966
Penn K, Wu D, Eisen JA, Ward NL (2006) Characterization of Bacterial Communities
Associated with Deep-Sea Corals on Gulf of Alaska Seamounts. Appl Environ Microbiol
72:1680-1683
Pernthaler A, Pernthaler J, Amann R (2002) Fluorescence in Situ Hybridization and Catalyzed
Reporter Deposition for the Identification of Marine Bacteria. Appl Environ Microbiol
68:3094-3101
Polymenakou PN, Bertilsson S, Tselepides A, Stephanou EG (2005) Bacterial Community
Composition in Different Sediments from the Eastern Mediterranean Sea: A Comparison
of Four 16S Ribosomal DNA Clone Libraries. Microb Ecol 50:447-462
Powell MA, Somero GN (1986) Adaptations to Sulfide by Hydrothermal Vent Animals: Sites and
Mechanisms of Detoxification and Metabolism. Biol Bull 171:274-290
Pruski AM, Rousse N, Fiala-Medioni A, Boulegue J (2002) Sulphur Signature in the
Hydrothermal Vent Mussel Bathymodiolus azoricus from the Mid-Atlantic Ridge. J Mar Biol
Assoc UK 82:463-468
Pukall R, Kramer I, Rohde M, Stackebrandt E (2001) Microbial Diversity of Cultivatable Bacteria
Associated with the North Sea Bryozoan Flustra foliacea. Syst Appl Microbiol 24:623-633

REFERENCES
104
Rasband W (1997-2007) ImageJ. National Institutes of Health, Bethesda, Maryland, USA
Razin S, Yogev D, Naot Y (1998) Molecular Biology and Pathogenicity of Mycoplasmas.
Microbiol Mol Biol R 62:1094-1156
Reitner J (1993) Modern Cryptic Microbialite/Metazoan Facies from Lizard Island (Great Barrier
Reef, Australia); Formation and Concepts. Facies 29:3-40
Richardson LL, Kuta KG (2003) Ecological Physiology of the Black Band Disease
Cyanobacterium Phormidium corallyticum. FEMS Microbiol Ecol 43:287-298
Ricke P, Kolb S, Braker G (2005) Application of a Newly Developed ARB Software-Integrated
Tool for in Silico Terminal Restriction Fragment Length Polymorphism Analysis Reveals
the Dominance of a Novel pmoA Cluster in a Forest Soil. Appl Environ Microbiol
71:1671-1673
Rifkin JF (1991) A Study of the Spirocytes from the Ceriantharia and Actiniaria (Cnidaria,
Anthozoa). Cell Tissue Res 266:365-373
Ritchie KB (2006) Regulation of Microbial Populations by Coral Surface Mucus and Mucus-
Associated Bacteria. Mar Ecol Prog Ser 322:1-14
Ritchie KB, Smith GW (1997) Physiological Comparison of Bacterial Communities from Various
Species of Scleractinian Corals. Proceedings of the 8th International Coral Reef Symposium
1:521-526.
Roark EB, Guilderson TP, Flood-Page S, Dunbar RB, Ingram BL, Fallon SJ, McCulloch M
(2005) Radiocarbon-Based Ages and Growth Rates of Bamboo Corals from the Gulf of
Alaska. Geophys Res Lett 32:L04606
Roberts S, Hirshfield M (2004) Deep-Sea Corals: Out of Sight, but No Longer out of Mind.
Front Ecol Environ 2:123-130
Rogers AD (1999) The Biology of Lophelia pertusa (Linnaeus 1758) and Other Deep-Water Reef-
Forming Corals and Impacts from Human Activities. Int Rev Hydrobiol 84:315-406
Rohwer F, Breitbart M, Jara J, Azam F, Knowlton N (2001) Diversity of Bacteria Associated with
the Caribbean Coral Montastraea franksi. Coral Reefs 20:85-91

REFERENCES
105
Rohwer F, Kelley S (2004) Culture Independent Analyses of Coral-Associated Microbes. In:
Rosenberg E, Loya Y (eds) Coral Health and Disease. Springer, New York, Berlin, pp 265–
277
Rohwer F, Seguritan V, Azam F, Knowlton N (2002) Diversity and Distribution of Coral-
Associated Bacteria. Mar Ecol Prog Ser 243:1-10
Rountree MR, Selker EU (1997) DNA Methylation Inhibits Elongation but Not Initiation of
Transcription in Neurospora crassa. Genes Dev 11:2383-2395
Sakshaug E, Myklestad SM (1973) Studies on the Phytoplankton Ecology of the
Trondheimsfjord. III. Dynamics of Phytoplankton Blooms in Relation to Environmental
Factors, Bioassay Experiments and Parameters for the Physiological State of the
Populations. J Exp Mar Biol Ecol 11:157-188
Salvador Pedro M, Haruta S, Hazaka M, Shimada R, Yoshida C, Hiura K, Ishii M, Igarashi Y
(2001) Denaturing Gradient Gel Electrophoresis Analyses of Microbial Community from
Field-Scale Composter. J Biosci Bioeng 91:159-165
Santavy DL (1995) The Diversity of Microorganisms Associated with Marine Invertebrates and
Their Roles in the Maintenance of Ecosystems. In: Allsopp D, Colwell RR, Hawksworth
DL (eds) Microbial Diversity and Ecosystem Funktion. CAB International, Wallingford, pp
211-229
Scheuermayer M, Gulder TAM, Bringmann G, Hentschel U (2006) Rubritalea marina gen. nov., sp.
nov., a Marine Representative of the Phylum 'Verrucomicrobia', Isolated from a Sponge
(Porifera). Int J Syst Evol Microbiol 56:2119-2124
Schönhuber W, Fuchs BM, Juretschko S, Amann R (1997) Improved Sensitivity of Whole-Cell
Hybridization by the Combination of Horseradish Peroxidase-Labeled Oligonucleotides
and Tyramide Signal Amplification. Appl Environ Microbiol 63:3268-3273
Schöttner S, Wild C, Ramette A, Hoffmann F, Boetius A (2008) Habitat Differentiation by the
Cold-Water Coral Lophelia pertusa (Scleractinia) Governs Bacterial Diversity. Geophys Res
Abs 10, DOI: 1607-7962/gra/EGU2008-A-10666

REFERENCES
106
Schwarz WH (2001) The Cellulosome and Cellulose Degradation by Anaerobic Bacteria. Appl
Microbiol Biot 56:634-649
Seritti A, Manca BB, Santinelli C, Murru E, Boldrin A, Nannicini L (2003) Relationships between
Dissolved Organic Carbon (DOC) and Water Mass Structures in the Ionian Sea (Winter
1999). J Gephys Res 108, C9, 8112, DOI: 10.1029/2002JC001345
Shashar N, Cohen Y, Loya Y (1993) Extreme Diel Fluctuations of Oxygen in Diffusive Boundary
Layers Surrounding Stony Corals. Biol Bull 185:455-461
Shashar N, Cohen Y, Loya Y, Sar N (1994) Nitrogen Fixation (Acetylene Reduction) in Stony
Corals: Evidence for Coral-Bacteria Interactions. Mar Ecol Prog Ser 111:259-264
Shick JM (1990) Diffusion Limitation and Hyperoxic Enhancement of Oxygen Consumption in
Zooxanthellate Sea Anemones, Zoanthids, and Corals. Biol Bull 179:148-158
Shindo K, Mikami K, Tamesada E, Takaichi S, Adachi K, Misawa N, Maoka T (2007)
Diapolycopenedioic Acid Xylosyl Ester, a Novel Glyco-C30-Carotenoic Acid Produced by a
New Marine Bacterium Rubritalea squalenifaciens. Tetrahedron Lett 48:2725-2727
Sieburth JM (1975) Microbial Seascapes: A Pictorial Essay on Marine Microorganisms and Their
Environments. University Park Press, Baltimore
Slattery M, McClintock JB, Heine JN (1995) Chemical Defenses in Antarctic Soft Corals:
Evidence for Antifouling Compounds. J Exp Mar Biol Ecol 190:61-77
Sorokin DY, Tourova TP, Muyzer G (2005) Citreicella thiooxidans gen. nov., sp. nov., a Novel
Lithoheterotrophic Sulfur-Oxidizing Bacterium from the Black Sea. Syst Appl Microbiol
28:679-687
Sorokin YI (1973) On the Feeding of Some Scleractinian Corals with Bacteria and Dissolved
Organic Matter. Limnol Oceanogr 18:380-385
Squires DF (1959) Deep Sea Corals Collected by the Lamont Geological Observatory. 1. Atlantic
Corals. Am Mus Nov 1965:1-42

REFERENCES
107
Stackebrandt E, Goebel BM (1994) A Place for DNA-DNA Reassociation and 16S Ribosomal-
RNA Sequence-Analysis in the Present Species Definition in Bacteriology. Int J Syst
Bacteriol 44:846-849
Steunou AS, Bhaya D, Bateson MM, Melendrez MC, Ward DM, Brecht E, Peters JW, Kuhl M,
Grossman AR (2006) In Situ Analysis of Nitrogen Fixation and Metabolic Switching in
Unicellular Thermophilic Cyanobacteria Inhabiting Hot Spring Microbial Mats. P Natl
Acad Sci USA 103:2398-2403
Strømgren T (1971) Vertical and Horizontal Distribution of Lophelia pertusa (Linnaeus) in
Trondheimsfjorden on the West Coast of Norway. Det Kongelige Norske Videnskabers
Selskab. Forhandlinger 6:1-9
Suzuki MT, Giovannoni SJ (1996) Bias Caused by Template Annealing in the Amplification of
Mixtures of 16S rRNA Genes by PCR. Appl Environ Microbiol 62:625-630
Suzuki Y, Inagaki F, Takai K, Nealson KH, Horikoshi K (2004) Microbial Diversity in Inactive
Chimney Structures from Deep-Sea Hydrothermal Systems. Microb Ecol 47:186-196
Swofford DL, Olsen GJ, Waddell PJ, Hillis DM (1996) Phylogenetic Inference. In: Hillis DM,
Moritz C, Mable BK (eds) Molecular Systematics. Sinauer, Sunderland, pp 407-514
Teske A, Brinkhoff T, Muyzer G, Moser DP, Rethmeier J, Jannasch HW (2000) Diversity of
Thiosulfate-Oxidizing Bacteria from Marine Sediments and Hydrothermal Vents. Appl
Environ Microbiol 66:3125-3133
Thiel V, Leininger S, Schmaljohann R, Brümmer F, Imhoff JF (2007a) Sponge-Specific Bacterial
Associations of the Mediterranean Sponge Chondrilla nucula (Demospongiae,
Tetractinomorpha). Microb Ecol 54:101-111
Thiel V, Neulinger SC, Staufenberger T, Schmaljohann R, Imhoff JF (2007b) Spatial Distribution
of Sponge-Associated Bacteria in the Mediterranean Sponge Tethya aurantium. FEMS
Microbiol Ecol 59:47–63

REFERENCES
108
Tredici M, Margheri M, Giovannetti L, Philippis R, Vincenzini M (1988) Heterotrophic
Metabolism and Diazotrophic Growth of Nostoc sp. From Cycas circinalis. Plant Soil 110:199-
206
Tringe SG, von Mering C, Kobayashi A, Salamov AA, Chen K, Chang HW, Podar M, Short JM,
Mathur EJ, Detter JC, Bork P, Hugenholtz P, Rubin EM (2005) Comparative
Metagenomics of Microbial Communities. Science 308:554-557
Tsurumi R, Takeda K, Tonouchi A (2000) Characteristics and Propionate Production of
Propionibacterium Isolated from a Methane Fermentation Digester. Microb Environ 15:151-
159
Tursi A, Mastrototaro F, Matarrese A, Maiorano P, D'onghia G (2004) Biodiversity of the White
Coral Reefs in the Ionian Sea (Central Mediterranean). Chem Ecol 20:107-116
Ueno Y, Haruta S, Ishii M, Igarashi Y (2001) Microbial Community in Anaerobic Hydrogen-
Producing Microflora Enriched from Sludge Compost. Appl Microbiol Biot 57:555-562
Van Aken B, Peres CM, Doty SL, Yoon JM, Schnoor JL (2004) Methylobacterium populi sp. nov., a
Novel Aerobic, Pink-Pigmented, Facultatively Methylotrophic, Methane-Utilizing
Bacterium Isolated from Poplar Trees (Populus deltoides x nigra DN34). Int J Syst Evol
Microbiol 54:1191-1196
Van Alstyne K, Schupp P, Slattery M (2006) The Distribution of Dimethylsulfoniopropionate in
Tropical Pacific Coral Reef Invertebrates. Coral Reefs 25:321-327
Vattakaven T, Bond P, Bradley G, Munn CB (2006) Differential Effects of Temperature and
Starvation on Induction of the Viable-but-Nonculturable State in the Coral Pathogens
Vibrio shiloi and Vibrio tasmaniensis. Appl Environ Microbiol 72:6508-6513
Wafar M, Wafar S, David JJ (1990) Nitrification in Reef Corals. Limnol Oceanogr 35:725-730
Wallner G, Amann R, Beisker W (1993) Optimizing Fluorescent in Situ Hybridization with
rRNA-Targeted Oligonucleotide Probes for Flow Cytometric Identification of
Microorganisms. Cytometry 14:136–143

REFERENCES
109
Wang YJ, Stingl U, Anton-Erxleben F, Geisler S, Brune A, Zimmer M (2004) "Candidatus
Hepatoplasma crinochetorum", a New, Stalk-Forming Lineage of Mollicutes Colonizing the
Midgut Glands of a Terrestrial Isopod. Appl Environ Microbiol 70:6166-6172
Wells JW (1956) Scleractinia. In: Moore RC (ed) Treatise on Invertebrate Paleontology,
Coelenterata, Part F. Geological Society of America and University of Kansas Press,
Lawrence, pp 328-440
Wessel P, Smith WHF (1995) New Version of the Generic Mapping Tools Released. EOS Trans
AGU 76:329
Williams WM, Viner AB, Broughton WJ (1987) Nitrogen Fixation (Acetylene Reduction)
Associated with the Living Coral Acropora variabilis. Mar Biol 94:531-535
Wilsanand V, Wagh AB, Bapuji M (1999) Antibacterial Activities of Anthozoan Corals on Some
Marine Microfoulers. Microbios 99:137-145
Wilson JB (1979) Patch Development of the Deep-Water Coral Lophelia pertusa (L) on Rockall
Bank. J Mar Biol Assoc UK 59:165-177
von Wintzingerode F, Gobel UB, Stackebrandt E (1997) Determination of Microbial Diversity in
Environmental Samples: Pitfalls of PCR-Based rRNA Analysis. FEMS Microbiol Rev
21:213-229
Yakimov MM, Cappello S, Crisafi E, Tursi A, Savini A, Corselli C, Scarfi S, Giuliano L (2006)
Phylogenetic Survey of Metabolically Active Microbial Communities Associated with the
Deep-Sea Coral Lophelia pertusa from the Apulian Plateau, Central Mediterranean Sea. Deep
Sea Res I 53:62-75
Yilmaz LS, Noguera DR (2004) Mechanistic Approach to the Problem of Hybridization
Efficiency in Fluorescent in Situ Hybridization. Appl Environ Microbiol 70:7126-7139
Yoch DC (2002) Dimethylsulfoniopropionate: Its Sources, Role in the Marine Food Web, and
Biological Degradation to Dimethylsulfide. Appl Environ Microbiol 68:5804-5815
Yonge CM (1937) Studies on the Biology of Tortugas Corals. III. The Effect of Mucus on
Oxygen Consumption. Pap Tortugas Lab Carnegie Inst Wash 31:207-214

REFERENCES
110
Yoon J, Matsuo Y, Matsuda S, Adachi K, Kasai H, Yokota A (2007) Rubritalea spongiae sp. nov.
And Rubritalea tangerina sp. nov., Two Carotenoid- and Squalene-Producing Marine Bacteria
of the Family Verrucomicrobiaceae within the Phylum 'Verrucomicrobia', Isolated from Marine
Animals. Int J Syst Evol Microbiol 57:2337-2343
Zaika LL, Phillips JG, Fanelli JS, Scullen OJ (1998) Revised Model for Aerobic Growth of Shigella
flexneri to Extend the Validity of Predictions at Temperatures between 10 and 19°C. Int J
Food Microbiol 41:9-19
Zubkov MV, Fuchs BM, Archer SD, Kiene RP, Amann R, Burkill PH (2001) Linking the
Composition of Bacterioplankton to Rapid Turnover of Dissolved
Dimethylsulphoniopropionate in an Algal Bloom in the North Sea. Environ Microbiol
3:304-311

APPENDIX
Appendix
Spatial distributionof sponge-associated bacteria in theMediterranean spongeTethyaaurantiumVera Thiel, Sven C. Neulinger, Tim Staufenberger, Rolf Schmaljohann & Johannes F. Imhoff
Leibniz-Institut fur Meereswissenschaften, IFM-GEOMAR, Kiel, Germany
Correspondence: Johannes F. Imhoff,
Leibniz-Institut fur Meereswissenschaften,
IFM-GEOMAR, Dusternbrooker Weg 20,
D-24105 Kiel, Germany. Tel.: 149 (0) 431
6004450; fax: 149 (0) 431 6004452; e-mail:
Received 19 April 2006; revised 12 August
2006; accepted 15 August 2006.
DOI:10.1111/j.1574-6941.2006.00217.x
Editor: Patricia Sobecky
Keywords
16S rRNA gene; DGGE; rarefaction analysis;
sponge–bacteria association; local distribution;
sponge-specific.
Abstract
The local distribution of the bacterial community associated with the marine
sponge Tethya aurantium Pallas 1766 was studied. Distinct bacterial communities
were found to inhabit the endosome and cortex. Clear differences in the associated
bacterial populations were demonstrated by denaturing gradient gel electrophor-
esis (DGGE) and analysis of 16S rRNA gene clone libraries. Specifically associated
phylotypes were identified for both regions: a new phylotype of Flexibacteria was
recovered only from the sponge cortex, while Synechococcus species were present
mainly in the sponge endosome. Light conduction via radiate spicule bundles
conceivably facilitates the unusual association of Cyanobacteria with the sponge
endosome. Furthermore, a new monophyletic cluster of sponge-derived 16S rRNA
gene sequences related to the Betaproteobacteria was identified using analysis of
16S rRNA gene clone libraries. Members of this cluster were specifically associated
with both cortex and endosome of T. aurantium.
Introduction
The phylum Porifera contains an estimated 15 000 species in
three taxonomic classes: Calcarea (calcareous sponges),
Hexactinellida (glass sponges) and Demospongiae (demos-
ponges) (Hooper & van Soest, 2002). As sessile filter-feeding
organisms sponges pump large amounts of water through
their aquiferous channel system. They take up bacteria,
single-celled algae and other food particles from the filtered
water by phagocytosis within the choanocyte chambers,
which are located within the inner part of the sponge, the
endosome ( = choanosome). The endosome is protected
against strong currents and high light intensities by an outer
region, the cortex (or ectosome) (Sara, 1987); this has also
been used as a basis for taxonomic classification. As a
protective device (Burton, 1928), the cortex is found to be
particularly thick and well structured in species living in
shallow waters subject to strong currents and high light
intensities. By contrast, species living in more protected
habitats have a thin, almost indistinct cortex (Sara, 1987).
Tethya aurantium (Fig. 1a) is characterized by a globular
shape and a thick and well-developed cortex, clearly differ-
entiated from the endosome by texture and colour of the
tissue (Fig. 1b). In the Mediterranean Sea T. aurantium
cooccurs with the very similar species of Tethya citrina, but
inhabits different niches and can be distinguished by the
development of its cortex. Tethya aurantium generally
inhabits areas that are more exposed to light and current in
depths of 1–40m, while T. citrina prefers more sheltered
places and possesses a thinner cortex than T. aurantium
(Sara, 1987).
Associations between microorganisms and sponges have
been systematically studied using microscopy and isolation
methods since the 1970s (Vacelet, 1970, 1971, 1975; Vacelet
& Donadey, 1977; Manz et al., 2000; Webster & Hill, 2001;
Lafi et al., 2005). These studies have shown that bacteria are
abundant within the mesohyl of sponges and can form up to
40% of the sponge volume (Wilkinson, 1978). More recent
studies on sponge–microbe associations were based mainly
on culture-independent molecular methods (Hinde et al.,
1994; Althoff et al., 1998; Burja et al., 1999; Burja & Hill,
2001; Webster & Hill, 2001; Webster et al., 2001). Compar-
ison of 16S rRNA gene clone libraries obtained from several
sponges of different geographical origin have revealed
unexpected conformity between the different sponge spe-
cies, and a uniform sponge-associated bacterial community
was proposed (Hentschel et al., 2002).
The aim of this study was to characterize the microbial
community associated with T. aurantium. We demonstrate
specific differences between bacteria associated with the
cortex and endosome. Furthermore, we report on a new
phylogenetic cluster of sponge-associated Betaproteobacteria
FEMS Microbiol Ecol xx (2006) 1–11 c� 2006 Federation of European Microbiological SocietiesPublished by Blackwell Publishing Ltd. All rights reserved
111

APPENDIX
and a possible association of T. aurantium with Cy-
anobacteria.
Materials and methods
Sampling sites
The Limski kanal is a semiclosed fjord-like bay in the
Adriatic Sea near Rovinj (Istrian Peninsula, Croatia) (4517,9720N; 13143, 7340E). It extends along an east–west axis,
with an c. length of 11 km, a maximum width of about
650m and a depth of up to 32m. The bottom is generally
muddy, with insular sites consisting of stones and shallow
rocky slopes along the sides. It is characterized by a very high
sedimentation rate and rapid water exchange (Kuzmanovic,
1985). In a recent study, 42 sponge species were found in the
Limski kanal including three species of the genus Tethya:
T. aurantium Pallas 1766, Tethya limskiMuller & Zahn 1969
and T. citrina Sara & Melone 1965 (Brummer et al., 2004).
Sponge sampling
Specimens of T. aurantium were collected by SCUBA diving
from a depth of 5–15m in April 2003, June 2004 and May
2005. The sponges were placed into sterile plastic bags,
cooled in an isolation box, immediately transported to the
laboratory and processed within 3 h. In the laboratory the
sponges were washed carefully three times in filter-sterilized
seawater (0.2mm) prior to cutting. The sponges were
separated into cortex and endosome sections and washed
again separately in sterile seawater. Tissues were cut into
small pieces of c. 20–30mg each, frozen in liquid nitrogen
and kept frozen (� 80 1C) until further investigation.Ambient seawater was collected into sterile glass bottles
(Duran; 1 L) prior to sponge sampling. The water was
cooled on the way back to the laboratory and immediately
filtered through a cellulose-acetate filter (0.2mm pore
size; Sartorius). The filters were placed in a cryovial, frozen
in liquid nitrogen and stored at � 80 1C until further
investigation.
Electron microscopy
Sponge samples were prepared for scanning electron micro-
scopy by fixation with 1% glutaraldehyde in seawater,
replacement of water with an ethanol series and subsequent
critical-point drying. After mounting, samples were sput-
tered with Au/Pd and observed with a Zeiss DSM 940
scanning electron microscope.
DNA extraction
Genomic DNA was extracted and purified using the QIA-
GEN DNeasys Tissue Kit following the manufacturer’s
protocol for Gram-positive bacteria and animal tissue.
PCR and cloning procedure
Amplification of ribosomal DNA was performed using
puReTaqTM Ready-To-GoTM PCR Beads (Amersham Bios-
ciences). For amplification of the nearly complete 16S rRNA
gene the eubacterial primers 27f and 1492r (Lane, 1991)
were used. The conditions for this PCR were: initial
co
en
2 μm2 μm2 μm
(a) (b)
(c) (d) (e)
Fig. 1. (a) Photograph of the Mediterranean
sponge Tethya aurantium Pallas in situ. A cross
section (b) shows the morphologically different
regions endosome (en) and cortex (co). Electron
microscopic photography shows no apparent
accumulation of bacteria in the cortex (c) and a
moderate number of different bacterial morpho-
types within the endosome (d and e).
FEMS Microbiol Ecol xx (2006) 1–11c� 2006 Federation of European Microbiological SocietiesPublished by Blackwell Publishing Ltd. All rights reserved
2 V. Thiel et al.
112
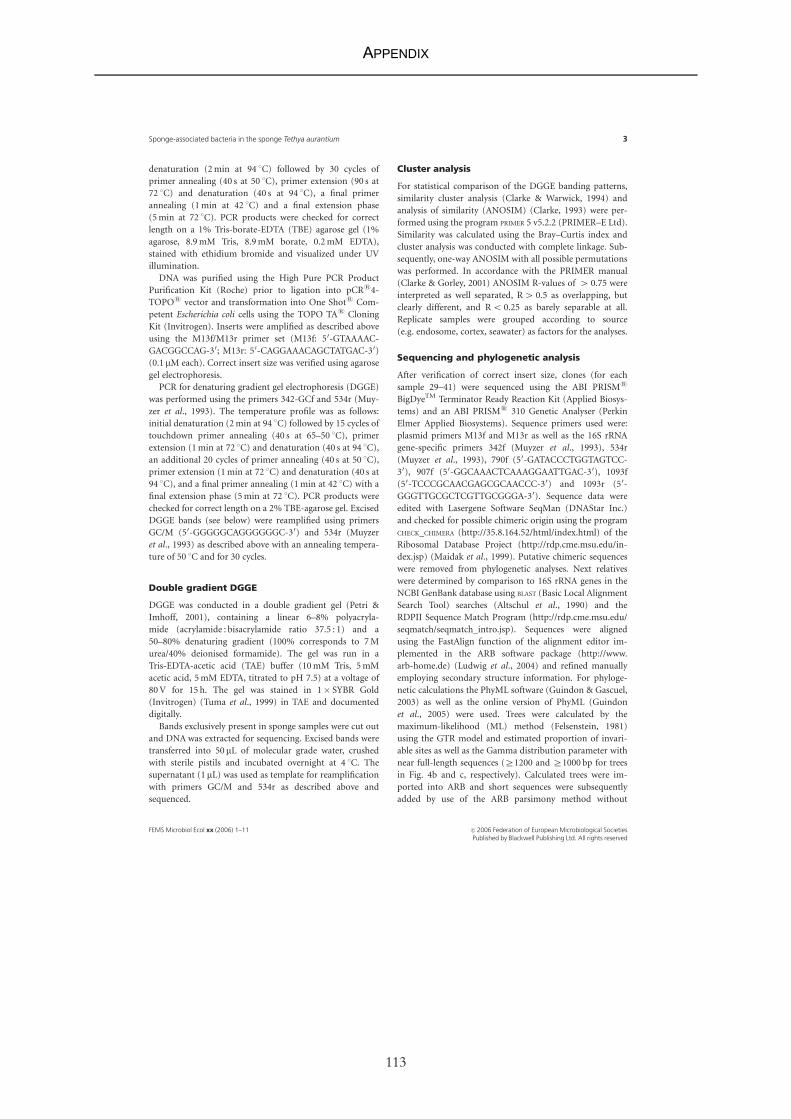
APPENDIX
denaturation (2min at 94 1C) followed by 30 cycles of
primer annealing (40 s at 50 1C), primer extension (90 s at
72 1C) and denaturation (40 s at 94 1C), a final primer
annealing (1min at 42 1C) and a final extension phase
(5min at 72 1C). PCR products were checked for correct
length on a 1% Tris-borate-EDTA (TBE) agarose gel (1%
agarose, 8.9mM Tris, 8.9mM borate, 0.2mM EDTA),
stained with ethidium bromide and visualized under UV
illumination.
DNA was purified using the High Pure PCR Product
Purification Kit (Roche) prior to ligation into pCRs4-
TOPOs vector and transformation into One Shots Com-
petent Escherichia coli cells using the TOPO TAs Cloning
Kit (Invitrogen). Inserts were amplified as described above
using the M13f/M13r primer set (M13f: 50-GTAAAAC-GACGGCCAG-30; M13r: 50-CAGGAAACAGCTATGAC-30)(0.1mM each). Correct insert size was verified using agarose
gel electrophoresis.
PCR for denaturing gradient gel electrophoresis (DGGE)
was performed using the primers 342-GCf and 534r (Muy-
zer et al., 1993). The temperature profile was as follows:
initial denaturation (2min at 94 1C) followed by 15 cycles of
touchdown primer annealing (40 s at 65–50 1C), primer
extension (1min at 72 1C) and denaturation (40 s at 94 1C),an additional 20 cycles of primer annealing (40 s at 50 1C),primer extension (1min at 72 1C) and denaturation (40 s at
94 1C), and a final primer annealing (1min at 42 1C) with a
final extension phase (5min at 72 1C). PCR products were
checked for correct length on a 2% TBE-agarose gel. Excised
DGGE bands (see below) were reamplified using primers
GC/M (50-GGGGGCAGGGGGGC-30) and 534r (Muyzer
et al., 1993) as described above with an annealing tempera-
ture of 50 1C and for 30 cycles.
Double gradient DGGE
DGGE was conducted in a double gradient gel (Petri &
Imhoff, 2001), containing a linear 6–8% polyacryla-
mide (acrylamide : bisacrylamide ratio 37.5 : 1) and a
50–80% denaturing gradient (100% corresponds to 7M
urea/40% deionised formamide). The gel was run in a
Tris-EDTA-acetic acid (TAE) buffer (10mM Tris, 5mM
acetic acid, 5mM EDTA, titrated to pH 7.5) at a voltage of
80V for 15 h. The gel was stained in 1� SYBR Gold
(Invitrogen) (Tuma et al., 1999) in TAE and documented
digitally.
Bands exclusively present in sponge samples were cut out
and DNA was extracted for sequencing. Excised bands were
transferred into 50 mL of molecular grade water, crushed
with sterile pistils and incubated overnight at 4 1C. Thesupernatant (1mL) was used as template for reamplification
with primers GC/M and 534r as described above and
sequenced.
Cluster analysis
For statistical comparison of the DGGE banding patterns,
similarity cluster analysis (Clarke & Warwick, 1994) and
analysis of similarity (ANOSIM) (Clarke, 1993) were per-
formed using the program PRIMER 5 v5.2.2 (PRIMER–E Ltd).
Similarity was calculated using the Bray–Curtis index and
cluster analysis was conducted with complete linkage. Sub-
sequently, one-way ANOSIM with all possible permutations
was performed. In accordance with the PRIMER manual
(Clarke & Gorley, 2001) ANOSIM R-values of 4 0.75 were
interpreted as well separated, R4 0.5 as overlapping, but
clearly different, and Ro 0.25 as barely separable at all.
Replicate samples were grouped according to source
(e.g. endosome, cortex, seawater) as factors for the analyses.
Sequencing and phylogenetic analysis
After verification of correct insert size, clones (for each
sample 29–41) were sequenced using the ABI PRISMs
BigDyeTM Terminator Ready Reaction Kit (Applied Biosys-
tems) and an ABI PRISMs 310 Genetic Analyser (Perkin
Elmer Applied Biosystems). Sequence primers used were:
plasmid primers M13f and M13r as well as the 16S rRNA
gene-specific primers 342f (Muyzer et al., 1993), 534r
(Muyzer et al., 1993), 790f (50-GATACCCTGGTAGTCC-30), 907f (50-GGCAAACTCAAAGGAATTGAC-30), 1093f
(50-TCCCGCAACGAGCGCAACCC-30) and 1093r (50-GGGTTGCGCTCGTTGCGGGA-30). Sequence data were
edited with Lasergene Software SeqMan (DNAStar Inc.)
and checked for possible chimeric origin using the program
CHECK_CHIMERA (http://35.8.164.52/html/index.html) of the
Ribosomal Database Project (http://rdp.cme.msu.edu/in-
dex.jsp) (Maidak et al., 1999). Putative chimeric sequences
were removed from phylogenetic analyses. Next relatives
were determined by comparison to 16S rRNA genes in the
NCBI GenBank database using BLAST (Basic Local Alignment
Search Tool) searches (Altschul et al., 1990) and the
RDPII Sequence Match Program (http://rdp.cme.msu.edu/
seqmatch/seqmatch_intro.jsp). Sequences were aligned
using the FastAlign function of the alignment editor im-
plemented in the ARB software package (http://www.
arb-home.de) (Ludwig et al., 2004) and refined manually
employing secondary structure information. For phyloge-
netic calculations the PhyML software (Guindon & Gascuel,
2003) as well as the online version of PhyML (Guindon
et al., 2005) were used. Trees were calculated by the
maximum-likelihood (ML) method (Felsenstein, 1981)
using the GTR model and estimated proportion of invari-
able sites as well as the Gamma distribution parameter with
near full-length sequences (Z1200 and Z1000 bp for trees
in Fig. 4b and c, respectively). Calculated trees were im-
ported into ARB and short sequences were subsequently
added by use of the ARB parsimony method without
FEMS Microbiol Ecol xx (2006) 1–11 c� 2006 Federation of European Microbiological SocietiesPublished by Blackwell Publishing Ltd. All rights reserved
3Sponge-associated bacteria in the sponge Tethya aurantium
113

APPENDIX
changing the tree topologies. Phylogenetic positions of short
sequences (o 1200 bp/o 1000 bp) were additionally veri-
fied by phylogenetic analysis (ML, 100 bootstraps) of full
and partial sequences.
Nucleotide sequence accession numbers
The 16S rRNA gene sequences obtained in this study have
been deposited in the EMBL database. They have been
assigned accession numbers AM259730–AM259769,
AM259770–AM259831 and AM259832–AM259898 for the
sequences obtained from seawater, endosome and cortex,
respectively.
Diversity estimation
Sequences with similarities 4 99.0% were defined as one
phylotype, i.e. one operational taxonomic unit (OTU). The
proportion of prokaryotic diversity represented by the clone
libraries was estimated by rarefaction analysis combined
with nonlinear regression, and by calculation of the chao1
estimator as proposed by Kemp & Aller (2004). Rarefaction
analysis calculations were performed applying the algorithm
described by Hurlbert (1971) with the program aRarefact-
Win (http://www.uga.edu/strata/software.html). Rarefac-
tion curves were plotted and regressions performed using
two different regression equations:
y1 ¼ a1ð1� e�b1xÞ ð1Þ
y2 ¼ a2ð1� e�b2xcÞ ð2Þwhere x is the sample size, y the observed number of OTUs
and a the number of OTUs to be expected with infinite
sample size (i.e. total diversity) (Koellner et al., 2004).
Equation (1) is the most common regression approach for
rarefaction analysis and has been used by many authors (e.g.
Webster et al., 2004; Yakimov et al., 2006). However, curves
derived from regression (1) exhibited an apparent misfit to
the data points of the rarefaction analysis. The increase in
the regression curves was too steep at small OTU numbers
and curves flattened visually too early at large sample sizes.
The expected underestimation of the maximum species
number proposed a modification of regression (1), namely
Equation (2). To prove this, we developed an algorithm to
simulate sampling of specimens for rarefaction analysis that
has the potential to produce datasets ranging from highly
diverse (each OTU occurring only once or twice) to almost
uniform (one or two abundant OTUs): a cohort of random
integer numbers ki (iAN; 1 � i � 50) were created with the
equation ki= 5 �Gai(zi), where G is the standard Gamma
function of zi (randomized; 0 � zo 1) with shape para-
meter ai (randomized; 0.1 � aio 0.6). Of this cohort, n
numbers k were taken so thatPn
i¼1 ki � s (randomized;
30 � so 70). This procedure is tantamount to sampling up
to s specimens (i.e. clones) representing n OTUs of abun-
dance ki. The randomized Gamma function causes the
distribution of ki to be skewed more or less to the right,
resembling abundance proportions in most natural com-
munities. The simulated datasets were subjected to rarefac-
tion analysis, and the resulting rarefaction curves were fitted
by regressions (1) and (2), respectively. From both equa-
tions, the asymptote a and the PRESS (Predicted Residual
Error Sum of Squares) statistic were obtained. PRESS is a
gauge of how well a regression predicts new data. The
smaller the PRESS statistic, the better is the predictive ability
of the regression. To test whether the two equations differed
statistically from each other, we calculated the ratios A= a2/
a1 and P=PRESS1/PRESS2. If there is one highly abundant
OTU (kiZ20) beside many OTUs of low abundance (kio 3)
in the sampling datasets, the rarefaction curve tends to
converge to a line without apparent limit. This occurred
three times with our simulated datasets with a2 � a1(104o a2o 107; 6o a1o 40). For these cases, ratio A was
not calculated. Transformed ratios A0 = ln(ln(A11/100))
and P0 = ln(P11/100) did not show significant devia-
tions from the normal distribution (Shapiro–Wilk W-test).
A0 and P0 were tested against the null hypotheses
A0 ¼ �4:61 ðA ¼ 1Þand P0 ¼ 0:01ðP ¼ 1Þ, respectively.SigmaPlot v6.0 (SPSS) was used for plotting and regres-
sion analysis. Statistical tests were performed with Statistica
v6.1 (StatSoft).
Results
Electron microscopy
Tethya aurantium cortex and endosome (Fig. 1) samples
were studied separately and sponge samples from consecu-
tive years were compared. Electron micrographs revealed
large differences between cortex and endosome. Only low
numbers of bacteria were associated with the sponge cortex
region while bacteria were fairly abundant in the endosome
(Fig. 1c–e). Different morphotypes, especially a high abun-
dance of rod-shaped bacteria, were found associated with
the sponge endosome.
Cortex- and endosome-specific bacteria
DGGE banding patterns clearly showed the presence of
different bacterial communities in endosome and cortex of
T. aurantium (Fig. 2). Additionally, both parts of the sponge
differed in their DGGE banding patterns from surrounding
seawater samples. Bacterial phylotypes specifically asso-
ciated with distinct sponge regions were represented by
DGGE bands that were exclusively present in all endosome
or cortex samples, respectively, but not found in seawater
(Fig. 2a). Other bands were found in all sponge samples
(Fig. 2a). Whereas the patterns in subsamples of endosome
FEMS Microbiol Ecol xx (2006) 1–11c� 2006 Federation of European Microbiological SocietiesPublished by Blackwell Publishing Ltd. All rights reserved
4 V. Thiel et al.
114

APPENDIX
and cortex of one individual were apparently identical, slight
variations were found between endosome as well as cortex
samples from consecutive years (2003–2005) (Fig. 2b and c).
Nevertheless, bacterial communities inhabiting the same
sponge region (endosome or cortex) were more similar than
populations from different regions (Fig. 2a and b). In
contrast to the subsamples of a sponge individual (2005)
that showed identical DGGE banding patterns, seawater
samples from different nearby locations varied between each
other to some extent (Fig. 2c). The clusters of DGGE
banding patterns of endosome, cortex and seawater samples,
respectively, were confirmed to be well separated by ANO-
SIM (R-value4 0.75).
Methods of diversity estimation
Comparison of the two regressions (Table 1) showed that
rarefaction analysis using regression (2) resulted in higher
estimated maximum OTU numbers a2 as compared with a1of regression (1). a2 is, in most cases, comparable with the
richness estimation using the nonparametric estimator
chao1, as proposed by Kemp & Aller (2004) (Table 1).
Equality of parameters a1 and a2 and the statistics PRESS1and PRESS2 of the two regressions could be rejected on a
highly significant level (Po 10�6) in both cases. We can
therefore state that (i) Equation (2) fits significantly better
than Equation (1) as a regression for fitting rarefaction
curves and predicting total diversity, and that (ii) the total
diversity a1 calculated with the conventional Equation (1) is
systematically lower than a2 calculated with regression (2).
Diversity of sponge-associated bacteria
A total of 171 clone sequences were obtained (29–41
sequences for each clone library). Observed numbers of
OTUs and the total diversity estimated by rarefaction
analyses revealed high variability in the sponge-associated
bacterial community (i) between sponge endosome and
cortex, (ii) between sponge and ambient seawater and (iii)
between the different sampling times. In the sponge samples
from June 2004, in cortex and endosome, six and nine OTUs
were identified, respectively (Table 1). By contrast, seawater
collected at the same time displayed 27 identified OTUs
(Table 1). Tethya aurantium sampled in April 2003 displayed
0 100
Similarity
Similarity
Co-05bCo-04Co-03SW-04En-04En-03
Co-05a
En-05aEn-05b
SW-05-2SW-05-1SW-05-3En-05-2En-05-1En-05-3
Co-05-2Co-05-1Co-05-3
TA-
-
I
2003 2004 2005 2005 2003 2004 2005 20052004
TA II
cortexendosome
a b a b
SW
8020 40 60
0 1008020 40 60
-- -
SW 05-3
3
(a)
(b)
(c)
Fig. 2. (a) DGGE banding patterns of amplified bacterial DNA extracted from Tethya aurantium Pallas cortex region (2003, 2004 and 2005-a/b),
endosomal region (2003, 2004 and 2005-a/b) and surrounding seawater (SW). Specialised bands, which are not present in seawater, occur in all sponge
samples (TA-I) and in the cortex only (TA-II). (b and c) Dendograms of similarity cluster analysis with DGGE banding patterns of amplified bacterial DNA
extracted from T. aurantium cortex (co) and endosomal (en) samples. Comparison of sponge individuals from 2003, 2004 and 2005 and surrounding
seawater (b) show that, although not identical, a clear clustering of the banding patterns is seen. Regardless of the year, samples of endosomal regions
are more similar to each other than to the cortex samples of the same individual. Replicate subsamples from one individual (May 2005) (c) show identical
banding patterns and precise differences between endosome and cortex, as well as to several nearby seawater samples, which differ to some extent.
FEMS Microbiol Ecol xx (2006) 1–11 c� 2006 Federation of European Microbiological SocietiesPublished by Blackwell Publishing Ltd. All rights reserved
5Sponge-associated bacteria in the sponge Tethya aurantium
115

APPENDIX
a higher diversity: 26 and 13 OTUs were identified in cortex
and endosome, respectively (four-fold higher compared
with cortex in 2004). The total number of OTUs obtained
from the sponge cortex (30) was higher than each of the
values calculated individually for 2003 (26) and 2004 (6).
Applying rarefaction analysis, regression (2) always
showed higher r2 values and led to a higher estimated total
diversity (Fig. 3, Table 1). According to regression (1), the
total bacterial diversity seems to be well covered by the gene
libraries obtained from the sponge sampled in June 2004
(88–103%). However, rarefaction analysis using regression
(2) demonstrated that these proportions are overestimated
under regression (1). When applying regression (2),
c. 48–76% of the diversity seems to be covered by the clone
libraries in this study (Table 1). Only three phylotypes were
obtained from endosome or cortex in both years. The
majority of the sequences were found only in one of the
years. Thus, the total diversity of endosome- and cortex-
associated sequences (as determined by rarefaction analy-
sis), respectively, is much higher if both years are included
than if each year is considered separately. These differences
in the diversity possibly demonstrate annual and seasonal
variation in the bacterial communities.
Phylogenetic analysis
A high phylogenetic diversity was observed for the 171
bacterial sequences obtained from both sponge samples
and surrounding seawater, including members of the Alpha-
proteobacteria, Betaproteobacteria, Gammaproteobacteria
and Deltaproteobacteria, Bacteroidetes, Verrucomicrobia,
Planctomycetales, Gemmatimonadales, Acidobacteria, Actino-
bacteria, Spirochaeta and Cyanobacteria (Table 2). However,
the majority of sequences was affiliated with the Proteobac-
teria (38%), the Cyanobacteria (27%) and the Bacteroidetes
(25%).
Some phylotypes were found in T. aurantium from
both years. They form monophyletic clusters (i) related to
the Betaproteobacteria (Tethya-I, Fig. 4a), (ii) affiliated with
the Cyanobacteria (Tethya-II, Fig. 4b) and (iii) within the
Bacteroidetes (Tethya-III, Fig. 4c). Within each of these
Table 1. Observed and estimated total bacterial diversity of phylotypes (OTUs) in the different sponge and seawater samples. Rarefaction analysis and
the nonparametric richness estimator chao1 were used for diversity estimation. Rarefaction analysis was conducted with a commonly used regression
(1) and a modified regression (2). In all cases regression (2) gave higher r2 values and a higher expected diversity than regression (1). Except for the
seawater clone library, chao1 coverage resembles total coverage estimated by the use of regression (2). Total diversity was best covered by the analysed
clones for the clone library from the sponge cortex in 2004 (76–103% depending on method used)
Clone library n OTU
Rarefaction analysis (RA) Chao1
Regression (1) Regression (2)
Schao1 Cchao1a1 r2RA1 CRA1 a2 r2RA2 CRA2
Seawater 2004 41 27 46.2 0.99976 58% 56.5 0.99993 48% 88.2 31%
Sponge cortex total 66 30 41.1 0.99816 73% 67.7 0.99996 44% 59.0 51%
Sponge cortex 2003 37 26 49.5 0.99992 52% 56.6 0.99998 46% 60.0 43%
Sponge cortex 2004 29 6 5.8 0.97321 103% 7.9 0.99814 76% 6.7 90%
Sponge endosome total 65 21 23.0 0.99246 91% 36.1 0.99954 58% 35.5 59%
Sponge endosome 2003 33 13 14.8 0.99599 88% 20.5 0.99968 63% 20.6 63%
Sponge endosome 2004 32 9 9.1 0.99010 99% 11.8 0.99920 76% 12.4 73%
n, number of clones in clone library; OTU, number of phylotypes/OTU in clone library; a, asymptote of regression equation, giving the estimated total
diversity; r2, square of correlation-coefficient; C, OTU/estimated diversity, a measure of coverage of a clone library; Cchao1=Observed phylotypes/
predicted SChao1 =Coverage.
Fig. 3. Example analytical rarefaction curve plotted for one sponge-
derived 16S rRNA gene clone library (sponge cortex 2004). The expected
number of OTUs as determined by the analytical algorithm described by
Hurlbert (1971) were plotted against the number of analysed clones
(circles). Extrapolated regression curves (solid line and dashed line) are
shown for the different regression Equations (1) and (2). The expected
total diversity determined by the asymptotes (a1/a2) is indicated by
dotted lines. Regression (1), which has been used in former studies
(Webster et al., 2004; Yakimov et al., 2006), results in a lower expected
total diversity compared with regression (2) (a1o a2) with also lower
values for the nonlinear coefficient of determination (r21o r22).
FEMS Microbiol Ecol xx (2006) 1–11c� 2006 Federation of European Microbiological SocietiesPublished by Blackwell Publishing Ltd. All rights reserved
6 V. Thiel et al.
116

APPENDIX
Table 2. List of phylogenetic affiliations of 16S rRNA gene clone sequences obtained from the cortex and endosome of Tethya aurantium sampled in
2003 and 2004 as well as surrounding seawater (2004)
Clone Source
Length
[bp] Next relative Acc.
Overlap
[bp] Identity
Phylogenetic
affiliation
TAA-10-30v [1] Cortex 2003 1498 Sponge clone L35 (Latrunculia apicalis) AY321419 881 93% Betaproteobacteria- related
TAA-5-01v [12] Cortex 2004 1489 Sponge clone L35 (Latrunculia apicalis) AY321419 882 94% Betaproteobacteria- related
DGGE TA-Ia [2] Cortex 03/04 142 Sponge clone HRV40 (Halichondria
panicea)
UBZ88592 113 99% Betaproteobacteria- related
TAA-10-50v [1] Cortex 2003 1376 Mangrove bacterioplankton clone
DS143
DQ234225 1376 96% Gammaproteobacteria,
Oceanospirallales
TAA-10-78v [1] Cortex 2003 1393 Sponge clone E01-9c-26 (Axinella
verrucosa)
AJ581351 1312 95% Gammaproteobacteria,
Oceanospirallales
TAA-10-33v [2] Cortex 2003 1388 Uncultured bacterium clone
A314926
AY907761 1216 93% Gammaproteobacteria
TAA-10-62v [1] Cortex 2003 1372 Gammaproteobacterium
17X/A02/237
AY576771 1375 91% Gammaproteobacteria
TAA-10-90v [2] Cortex 2003 1387 unc. sediment proteobacterium
SIMO-2184
AY711550 810 93% Gammaproteobacteria
TAA-10-60v [1] Cortex 2003 1393 Uncultured bacterium clone
SDKAS1_6
AY734243 1290 91% Gammaproteobacteria,
Coxiella group
TAA-10-18v [1] Cortex 2003 1303 Marine Alphaproteobacterium
clone MB11B07
AY033299 1313 99% Alphaproteobacteria
TAA-5-11v [2] Cortex 2004 1405 Seamount Alphaproteobacterium clone
JdFBGBact_40
AF323257 1174 88% Alphaproteobacteria
TAA-10-03v [1] Cortex 2003 1367 Mucus bacterium 23 AY654769 1175 95% Alphaproteobacteria
TAA-10-13v [1] Cortex 2003 1335 Hypersaline bacterium clone E6aH10 DQ103609 765 92% Alphaproteobacteria
TAA-10-23v [2] Cortex 2003 1404 Holophaga sp. oral clone CA002 AF385537 1184 93% Deltaproteobacteria
TAA-5-46v [1] Cortex 2004 1435 Synechococcus sp. WH 8016 AY172834 1436 99% Cyanobacteria,
Synechococcus group
TAA-10-02v [3] cortex 2003 1339 Synechococcus sp. WH 8016 AY172834 1322 99% Cyanobacteria,
Synechococcus group
TAA-10-19v [1] Cortex 2003 1335 Antithamnion sp. plastid DANN X54299 1335 95% Cyanobacteria, chloroplasts
TAA-10-96v [3] Cortex 2003 1387 Tenacibaculum lutimaris strain TF-42 AY661693 1303 98% Bacteroidetes,
Flavobacteriaceae
TAA-10-10v [4] Cortex 2003 1368 Flavobacteriaceae bacterium CL-TF09 AY962293 1368 96% Bacteroidetes,
Flavobacteriaceae
TAA-10-14v [2] Cortex 2003 1392 Unc. Bacteroidetes bacterium
C319a-R8C-C8
AY678510 1384 97% Bacteroidetes,
Flavobacteriaceae
TAA-10-29v [1] Cortex 2003 1386 Flavobacteriaceae str. SW334 AF493686 1252 96% Bacteroidetes,
Flavobacteriaceae
TAA-10-74v [1] Cortex 2003 1390 Bacterium K2-15 AY345434 1390 90% Bacteroidetes,
Flavobacteriaceae
TAA-10-77v [1] Cortex 2003 1381 Uncultured bacterium clone LC1408B-
77
DQ270634 1180 91% Bacteroidetes,
Flavobacteriaceae
TAA-5-15v [3] Cortex 2004 1430 Bacteroidetes bacterium PM13 AY548770 1201 89% Bacteroidetes,
Flavobacteriaceae
TAA-10-32v [1] Cortex 2003 1385 Microscilla furvescens AB078079 1340 91% Bacteroidetes,
Flexibacteriaceae
TAA-5-103v [10] Cortex 2004 1375 Microscilla furvescens AB078079 1301 91% Bacteroidetes,
Flexibacteriaceae
DGGE TA-II [2] Cortex 03/04 137 Bacteroidetes clone GCTRA14_S AY701461 135 97% Bacteroidetes,
Flexibacteriaceae
TAA-5-25v [1] Cortex 2004 1485 Flexibacter aggregans AB078038 1399 88% Bacteroidetes,
Flexibacteriaceae
TAA-10-06v [1] Cortex 2003 1385 Uncultured marine eubacterium
HstpL64
AF159640 876 92% Planctomycetales
TAA-10-04v [1] Cortex 2003 1387 Uncultured bacterium clone
FS142-21B-02
AY704401 1183 90% Planctomycetales
Continued
FEMS Microbiol Ecol xx (2006) 1–11 c� 2006 Federation of European Microbiological SocietiesPublished by Blackwell Publishing Ltd. All rights reserved
7Sponge-associated bacteria in the sponge Tethya aurantium
117

APPENDIX
Table 2. Continued.
Clone Source
Length
[bp] Next relative Acc.
Overlap
[bp] Identity
Phylogenetic
affiliation
TAA-10-09v [1] Cortex 2003 1369 Uncultured Pirellula clone 6N14 AF029078 1369 97% Planctomycetales
TAA-10-101v [1] Cortex 2003 1419 sponge clone TK19 (Aplysina
aerophoba)
AJ347028 1416 93% Gemmatimonadales
TAA-10-43 [2] Cortex 2003 1375 Unc. marine bacterium
SPOTSFEB02_70m35
DQ009431 1357 92% Actinobacteria,
Acidimicrobiaceae
TAA-10-01v [1] Cortex 2003 1382 Uncultured Actinobacterium
clone Bol7
AY193208 1365 96% Actinobacteria
TAI-8-03v [1] Endosome 2003 1436 Sponge clone L35 (Latrunculia apicalis) AY321419 881 94% Betaproteobacteria- related
TAI-2-47f [12] Endosome 2004 1436 Sponge clone L35 (Latrunculia apicalis) AY321419 882 94% Betaproteobacteria- related
DGGE TA-Ib [2] endosome 03/04 142 Sponge clone HRV40 (Halichondria
panicea)
UBZ88592 113 99% Betaproteobacteria- related
TAI-2-153v [2] Endosome 2004 1384 Sponge clone 34P16 (Phyllospongia
papyracea)
AY845231 950 86% Gammaproteobacteria
TAI-8-61v [1] Endosome 2003 1370 Uncultured marine bacterium clone
SPOTSAUG01_5m75
DQ009136 1370 99% Gammaproteobacteria
TAI-8-75 [2] Endosome 2003 864 Uncultured Gammaproteobacterium
KTc1119
AF235120 860 99% Gammaproteobacteria
TAI-8-99k [1] Endosome 2003 462 Uncultured Gammaproteobacterium
clone PI_4j5b
AY580744 438 100% Gammaproteobacteria
TAI-8-76v [4] Endosome 2003 1370 Uncultured marine bacterium clone
SPOTSAPR01_5m185
DQ009135 1370 99% Gammaproteobacteria
TAI-8-20v [2] Endosome 2003 1388 Unidentified Gammaproteobacterium
OM60
U70696 1389 99% Gammaproteobacteria
TAI-8-64v [1] Endosome 2003 1339 Photobacterium phosphoreum strain
RHE-01
AY435156 1303 99% Gammaproteobacteria
TAI-2-166v [5] Endosome 2004 1443 Cyanobacterium 5X15 AJ289785 1443 99% Cyanobacteria,
Synechococcus group
TAI-8-58v [6] Endosome 2003 1332 Cyanobacterium 5X15 AJ289785 1331 99% Cyanobacteria,
Synechococcus group
TAI-8-74v [9] Endosome 2003 1340 Synechococcus so. Almo3 AY172800 1326 99% Cyanobacteria,
Synechococcus group
TAI-2-160v [6] endosome 2004 1419 Synechococcus sp. RS9920 AY172830 1402 99% Cyanobacteria,
Synechococcus group
TAI-8-17v [3] Endosome 2003 1372 Flexibacter sp. IUB42 AB058905 1375 95% Bacteroidetes,
Flavobacteriaceae
TAI-8-94v [1] Endosome 2003 1380 Uncultured marine bacterium ZD0255 AJ400343 1381 96% Bacteroidetes,
Flavobacteriaceae
TAI-8-51v [1] Endosome 2003 1388 Uncultured CFB group bacterium clone
AEGEAN_179
AF406541 1368 97% Bacteroidetes,
Flavobacteriaceae
TAI-2-145v [1] Endosome 2004 1438 Uncultured marine bacterium clone
Chl1.12
DQ071033 1419 99% Bacteroidetes,
Flavobacteriaceae
TAI-2-81v [1] Endosome 2004 1372 Uncultured marine bacterium clone
SPOTSAPR01_5m235
DQ009115 1353 97% Bacteroidetes,
Flavobacteriaceae
TAI-2-123v [1] Endosome 2004 1385 Flexibacter aggregans strain:IFO 15974 AB078038 1457 88% Bacteroidetes,
Flexibacteriaceae
TAI-2-130f [3] Endosome 2004 1418 Uncultured marine eubacterium
HstpL83
AF159642 1008 99% Planctomycetes
TAI-2-28v [1] Endosome 2004 1407 Uncultured Verrucomicrobia
Arctic96BD-2
AY028221 1193 95% Verrucomicrobia
TAI-8-67v [1] Endosome 2003 1369 Uncultured bacterium clone
ELB16-004
DQ015796 1369 98% Actinobacteria
TAU-7-56k [1] Seawater 2004 430 Uncultured Gammaproteobacterium
clone SIMO-2629
DQ189604 367 99% Gammaproteobacteria
TAU-7-53p [1] Seawater 2004 937 Uncultured marine bacterium clone
SPOTSOCT00_5m102
DQ009138 882 98% Gammaproteobacteria
Continued
FEMS Microbiol Ecol xx (2006) 1–11c� 2006 Federation of European Microbiological SocietiesPublished by Blackwell Publishing Ltd. All rights reserved
8 V. Thiel et al.
118

APPENDIX
clusters, sequences share 4 99% similarity. Of special
interest is cluster Tethya–I, which is represented by 26 clone
sequences (19%) and was found in the cortex and endosome
of all T. aurantium individuals. Tethya-I forms a monophy-
letic cluster with sponge-derived 16S rRNA gene sequences
from different sponges from Antarctic (Webster et al., 2004)
and Australian waters (Taylor et al., 2004), as well as the
Mediterranean Sea (Althoff et al., 1998). This sponge-
specific monophyletic cluster is related to the Betaproteo-
bacteria and branches deeply (dotted frame in Fig. 4a). In
addition, the DGGE band TA-I, assigned to the sponge-
specific cluster Tethya-I, was unique to all T. aurantium
Table 2. Continued.
Clone Source
Length
[bp] Next relative Acc.
Overlap
[bp] Identity
Phylogenetic
affiliation
TAU-7-30p [4] Seawater 2004 835 uncultured Gammaproteobacterium
CHAB-III-7
AJ240921 840 98% Gammaproteobacteria
TAU-7-93 [1] Seawater 2004 496 Uncultured Gammaproteobacterium
OCS44
AF001650 495 99% Gammaproteobacteria
TAU-7-25 [1] Seawater 2004 407 Uncultured Gammaproteobacterium
NAC11-19
AF245642 407 97% Gammaproteobacteria
TAU-7-100v [1] Seawater 2004 1509 Uncultured Gammaproteobacterium
KTc1119
AF235120 1491 99% Gammaproteobacteria
TAU-7-63p [1] Seawater 2004 866 Uncultured bacterium clone MP104-
1109-b35
DQ088799 843 99% Gammaproteobacteria
TAU-7-71p [3] Seawater 2004 866 Uncultured bacterium MabScd-NB AB193929 833 99% Alphaproteobacteria
TAU-7-36p [1] Seawater 2004 858 Uncultured Proteobacterium clone
SIMO-855
AY712392 748 99% Alphaproteobacteria
TAU-7-38 [1] Seawater 2004 414 Uncultured bacterium clone CD3B11 AY038391 410 97% Alphaproteobacteria
TAU-7-44p [1] Seawater 2004 862 Uncultured Alphaproteobacterium
clone PI_4t1g
AY580547 809 95% Alphaproteobacteria
TAU-7-79v [1] Seawater 2004 1438 Unidentified eukaryote clone OM21
plastid 16S rRNA gene
U32671 1251 96% Cyanobacteria, chloroplasts
group
TAU-7-26p [2] Seawater 2004 747 Environmental clone OCS50 chloroplast
gene
AF001656 746 98% Cyanobacteria, chloroplasts
group
TAU-7-39p [1] Seawater 2004 833 Unidentified haptophyte OM153 U70720 768 95% Cyanobacteria, chloroplasts
group
TAU-7-57p [1] Seawater 2004 801 Uncultured diatom clone Hot Creek 8 AY168751 802 95% Cyanobacteria, chloroplasts
group
TAU-7-73p [1] Seawater 2004 756 Unidentified eukaryote clone OM20 U32670 755 98% Cyanobacteria, chloroplasts
group
TAU-7-97p [3] Seawater 2004 803 Environmental clone OCS20 AF001654 800 98% Cyanobacteria, chloroplasts
group
TAU-7-68v [4] Seawater 2004 1436 Neoptilota densa plastid DQ028877 1334 94% Cyanobacteria, chloroplasts
group
TAU-7-74p [1] Seawater 2004 864 Environmental clone OCS162 AF001659 617 92% Cyanobacteria, chloroplasts
group
TAU-7-50p [1] Seawater 2004 803 Uncultured Bacteroidetes bacterium
clone SIMO-780
AY712317 580 96% Bacteroidetes,
Flavobacteriaceae
TAU-7-28p [2] Seawater 2004 690 Uncultured Bacteroidetes bacterium
clone CONW90
AY828420 582 99% Bacteroidetes,
Flavobacteriaceae
TAU-7-43 [1] Seawater 2004 476 Uncultured Bacteroidetes bacterium
clone CONW90
AY828420 457 95% Bacteroidetes,
Flavobacteriaceae
TAU-7-02v [1] Seawater 2004 1490 Uncultured marine bacterium clone
Chl1.12
DQ071033 1452 99% Bacteroidetes,
Flavobacteriaceae
TAU-7-69v [3] Seawater 2004 1487 Unc. marine bacterium
SPOTSAPR01_5m235
DQ009115 1468 97% Bacteroidetes,
Flavobacteriaceae
TAU-7-61p [1] Seawater 2004 813 Unc. Bacteroidetes bacterium
3iSOMBO27
AM162576 817 96% Bacteroidetes,
Flexibacteriaceae
TAU-7-58 [1] Seawater 2004 277 Uncultured bacterium gene for 16S
rRNA, clone:JS624-8
AB121106 288 93% Spirochaetes
TAU-7-55p [1] Seawater 2004 804 Bacillus sp. C93 DQ091008 797 99% Firmicutes, Bacillus group
Numbers in brackets indicate no. of sequences in the phylotype represented by listed clones.
FEMS Microbiol Ecol xx (2006) 1–11 c� 2006 Federation of European Microbiological SocietiesPublished by Blackwell Publishing Ltd. All rights reserved
9Sponge-associated bacteria in the sponge Tethya aurantium
119

APPENDIX
samples but was not found in seawater. Moreover, no clone
sequences belonging to the Betaproteobacteriawere obtained
from seawater in this study.
Within the Cyanobacteria, three phylotypes comprising
30 Synechococcus species sequences (22%) were obtained
from T. aurantium-derived clone libraries. One of the
phylotypes was found repeatedly in consecutive years
(Tethya-II, Fig. 4b). Synechococcus species sequences were
found mainly in the endosome samples (Table 2), but not in
the surrounding seawater. All cyanobacteria-like sequences
obtained from the surrounding seawater belonged to chlor-
oplasts of different algae. Only one chloroplast sequence was
also found in the sponge cortex in April 2003.
Within the Bacteroidetes one bacterial cluster (Tethya-III)
of Flexibacteriaceae was repeatedly found in T. aurantium
(Fig. 4c, Table 2). The sequences of the cluster shared highest
similarity with Microscilla furvescens (AB078079, 91%) and
were found in the cortex only. Additionally, DGGE band TA-
II, present exclusively in cortex samples and absent from
endosome and seawater, was assigned to this cluster (Fig.
4c). A further cluster of T. aurantium-derived Flexibacter-
iacea was found in both endosome and cortex in June 2004
samples (Fig. 4c). Similarity between the clusters was 90%.
Flexibacteriaceae related (92%) to putative vertically trans-
mitted sponge-symbionts (Enticknap et al., 2006) were
found in the sponge cortex from 2004 only (TAA-5-15v,
Fig. 4c). All other T. aurantium-derived sequences within
the Bacteroidetes belonged to the Flavobacteriaceae and
Saprospiraceae, regardless of their origin from sponge cortex
or endosome (Fig. 4c). All sequences showed a high degree
of similarity to sequences retrieved from various marine
environments (Fig. 4c, Table 2).
Thirty T. aurantium-derived 16S rRNA gene sequences
(22%) were closely related to other sponge-derived 16S
Beta-proteobacteria
Gamma-proteobacteria
Alpha-proteobacteria
Tethya-I
(a)
Fig. 4. Phylogenetic trees constructed from 16S rRNA gene sequences related to the Betaproteobacteria (a), Cyanobacteria (b) and Bacteroidetes (c).
Sequences obtained from Tethya aurantium are shown in bold type. Adriatic seawater clone sequences are underlined. Numbers of represented clones
in each OTU are given in brackets after the clone names. Clusters of T. aurantium-associated bacterial phylotypes found in both years (Tethya-I, Tethya-II
and Tethya-III) are framed with dotted line. The new sponge-specific cluster related to the Betaproteobacteria is framed with a dashed line (a). All trees
were generated using the maximum likelihood method. Tree (a) is based on sequences of 500–1500bp length. The DGGE sequence (o 500) was added
without changing the tree topology using the parsimony method in ARB. Trees (b) and (c) are based on almost complete sequences (b, Z1000 bp; c,
Z1200 bp). Partial sequences (o 1000/o 1200 bp) were added without changing the tree topology using the parsimony method in ARB and are
indicated by dashed branches. The phylogenetic positions of partial sequences were verified by calculation of all length sequences separately.
Bootstrapping analysis (100 datasets) was conducted. Values equal to or greater than 50% are shown. Bootstrap values in parentheses refer to tree
calculations including short sequences. The scale bars indicate the number of substitutions per nucleotide position.
FEMS Microbiol Ecol xx (2006) 1–11c� 2006 Federation of European Microbiological SocietiesPublished by Blackwell Publishing Ltd. All rights reserved
10 V. Thiel et al.
120

APPENDIX
rRNA gene sequences. Twenty-six of these belonged to
cluster Tethya-I, with the remaining four sequences affiliated
to the Gemmatimonadales, the Gammaproteobacteria, the
Actinobacteria and the Acidobacteria: Clone TAA-10-101v,
obtained from T. aurantium cortex in 2003, clustered
monophyletically with the sponge-specific cluster ‘uncer-
tain-I’ described by Hentschel et al. (2002) within the
Gemmatimonadales (represented by sponge clone TK19,
Table 2). Clone TAA-10-78v from the T. aurantium cortex
(April 2003) was related to sequences obtained from sponges
as well as other marine habitats within the Gammaproteo-
bacteria (data not shown). BLAST search results showed
closest association to sponge-associated bacteria (Table 2),
but phylogenetic analysis could not identify monophyly of
the sponge-derived gammaproteobacterial sequences. TAI-
2-153v, representing two sequences obtained from the
sponge endosome in 2004, was most similar to the Phyllos-
pongia papyracea-associated Gammaproteobacteria clone
34P16 (Ridley et al., 2005) (sequence similarity of 86%,
Table 2). Again, phylogenetic analysis did not support
monophyletic clustering of the sponge-derived sequences.
Actinobacteria as well as Acidobacteria derived from sponges
have been reported previously (Hentschel et al., 2002; Imh-
off & Stohr, 2003; Kim et al., 2005; Schirmer et al., 2005) and
sponge-specific clusters have been described (Hentschel
et al., 2002). Tethya aurantium-derived sequences TAI-8-
Chloroplasts
Synechococcus sp.Tethya-II
(b)
Fig. 4. Continued
FEMS Microbiol Ecol xx (2006) 1–11 c� 2006 Federation of European Microbiological SocietiesPublished by Blackwell Publishing Ltd. All rights reserved
11Sponge-associated bacteria in the sponge Tethya aurantium
121

APPENDIX
Flex
Flav
Sapr
Tethya-III
aFlav= Flavobacteriaceae, Sapr= Saprospiraceae, Flex= Flexibacteriaceae
(c)
Fig. 4. Continued
FEMS Microbiol Ecol xx (2006) 1–11c� 2006 Federation of European Microbiological SocietiesPublished by Blackwell Publishing Ltd. All rights reserved
12 V. Thiel et al.
122

APPENDIX
67v and TAA-10-43v showed similarities of 84–95% to
different sponge-associated Actinobacteria sequences but
did not group with any of the three described sponge-
specific Actinobacteria clusters (Hentschel et al., 2002).
TAA-10-23v, which represents two clones obtained from
the T. aurantium cortex, showed o 90% sequence similarity
to the sponge-specific cluster Acido-I (Hentschel et al., 2002)
and did not cluster monophyletically with it.
Several sequences obtained from T. aurantium were
not specifically related to sequences found in sponges,
but were either closely related to seawater-derived
bacteria or to bacteria associated with other marine macro-
organisms (Vergin et al., 1998; Cho & Giovannoni, 2004;
Brown et al., 2005) [i.e. TAI-8-61v, TAI-8-64v, TAI-8-20v
(Gammaproteobacteria) and TAI-2-130v, TAA-10-09v
(Planctomycetales); Table 2]. Bacteria affiliated with the
Gammaproteobacteria (TAU-7-100v/TAI-8-75p) and the
Flavobacteriaceae (Bacteroidetes) (TAI-2-145v/TAU-7-02v
and TAI-2-81v/TAU-7-69) were found in both T. aurantium
endosome and seawater in this study. No sequence obtained
from the sponge cortex showed similarity to seawater-
derived sequences obtained in this study.
Alphaproteobacteria were exclusively found in the
T. aurantium cortex and in ambient seawater in June 2004
(Table 2). The sponge-derived sequences were related to
bacterioplankton-derived sequences (Suzuki et al., 2001),
coral mucus-associated bacteria (O. Koren & E. Rosenberg,
unpublished data, GenBank accession no. AY654769) and a
filamentous bacterium from a wastewater treatment plant
(Levantesi et al., 2004). Alphaproteobacteria closely related
to those found in seawater in this study (TAU-7-44p and
TAU-7-38) have been obtained from sponges (Halichondria
panicea and Halichondria okadai) previously (Althoff et al.,
1998; I. Okano et al., unpublished data, GenBank accession
no. AB054143).
Discussion
Although sponges do not possess organs or real tissues,
cortex and endosome are clearly differentiated with respect
to structure and function. For the first time, our studies on
Tethya aurantium have revealed that they also differ in their
bacterial communities. Distinct phylotypes, represented by
DGGE bands and 16S rRNA gene clone sequences, were
affiliated with the different regions of the sponge.
Tethya aurantium supports a relatively low diversity of
specifically associated bacteria. Only three bacterial phylo-
types were found in sponge specimens from both years
investigated. For diversity estimation we applied rarefaction
analysis in combination with two nonlinear regressions. The
commonly used regression (1) was shown to underestimate
systematically the total diversity, while regression (2) results
in estimates comparable with those from chao1. Regression
(2) was demonstrated to be significantly better suited as a
regression for fitting rarefaction curves and predicting total
diversity, and therefore is recommended to be used for
diversity estimation of clone libraries in future studies.
Under application of the more conservative regression (2),
rarefaction analysis displays only two (cortex) and four
(endosome) expected additional bacterial phylotypes
(OTUs) not identified in this study for the T. aurantium
specimen from 2004.
One characteristic cluster closely related to the Betapro-
teobcteria (cluster Tethya-I) is associated with both endo-
some and cortex of T. aurantium. Betaproteobacteria, with
the exception of ammonium oxidizers (Voytek & Ward,
1995), are not abundant in open oceans (Giovannoni &
Rappe, 2000), but are characteristic of freshwater habitats
(Methe et al., 1998; Schweitzer et al., 2001) and have also
been observed in coastal waters (Rappe et al., 1997; Fuhr-
man & Ouverney, 1998). Nonetheless, Betaproteobacteria-
affiliated bacteria have previously been found in sponges by
culture-independent methods (Althoff et al., 1998; Webster
et al., 2001, 2004; Thoms et al., 2003; Taylor et al., 2004). In
Rhopaloides odorabile, they were located intracellularly in
some cases by fluorescence in situ hybridization (Webster
et al., 2001). Tethya-I clusters monophyletically with those
other sponge-derived sequences (Althoff et al., 1998; Web-
ster et al., 2004; Taylor et al., 2004, 2005), forming a sponge-
specific monophyletic cluster (Fig. 4a). Our studies indicate
that this cluster branches deeply within the Betaproteobac-
teria, but its exact phylogenetic affiliation remains uncer-
tain. Phylogenetic analysis using the backbone tree and the
parsimony method implemented in the ARB program
(Ludwig et al., 2004) demonstrated a consistent affiliation
with the Betaproteobacteria, although within this group the
phylogenetic position of the Tethya-I cluster largely depends
on the (DNA)-filter used. By contrast, complete phyloge-
netic calculations including a reasonable number of repre-
sentatives of the Betaproteobacteria, Gammaproteobacteria
and Alphaproteobacteria, using the ML method (Felsenstein,
1981), placed the sponge-specific cluster outside the known
Betaproteobacteria (Fig. 4a).
Finding of Tethya-I-related sequences in Halichondria
panicea from the Adriatic Sea but not in individuals from
the North Sea or the Baltic Sea (Althoff et al., 1998) possibly
indicates a synergistic sponge–microbe association. Yet, the
occurrence of members of the Betaproteobacteria-related
sponge-specific cluster is not limited to the Mediterranean
Sea, as formerly unaffiliated sequences obtained from the
Antarctic sponges Latrunculia apicalis and Mycale acerata
(Webster et al., 2004) can now be assigned to the cluster. As
Betaproteobacteria are abundant in freshwater habitats
(Methe et al., 1998; Schweitzer et al., 2001) a freshwater
origin cannot be excluded for the T. aurantium-derived
sequences obtained from the river-fed Limksi kanal.
FEMS Microbiol Ecol xx (2006) 1–11 c� 2006 Federation of European Microbiological SocietiesPublished by Blackwell Publishing Ltd. All rights reserved
13Sponge-associated bacteria in the sponge Tethya aurantium
123

APPENDIX
However, no Betaproteobacteria were found in the seawater
surrounding the T. aurantium habitat and furthermore no
freshwater-derived bacteria closely related to the Tethya-I
cluster have been described.
Cyanobacterial associations in sponges have been known
for many years. Within the Synechococcus group one speci-
fically sponge-associated cluster and several additional
sponge-associated Cyanobacteria have been identified
(Steindler et al., 2005). Besides symbiotic associations, the
genus Synechococcus is also known as a member of marine
picoplankton communities and serves as food for different
filter-feeding animals, including sponges (Pile et al., 1996).
For T. aurantium no cyanobacterial associations have been
reported in the literature. Interestingly, we found Synecho-
coccus species sequences making up a major part of the
endosome-derived clone library (n= 26%, 39%) (Fig. 4b,
Table 2). They represent three closely related phylotypes,
only distantly related to the sponge-specific group of
Synechococcus species strains. They show high sequence
similarity to several cultured and uncultured Synechococcus
strains, also including sponge- and sponge-larvae-associated
uncultured strains obtained from Chondrilla sp. and Mycale
laxissima (Usher et al., 2004; Enticknap et al., 2006). The
close relationship to putative vertically transmitted sponge-
associated Synechococcus strains indicates constant and ob-
ligate association to sponges. However, unlike the T. aur-
antium-derived sequences in this study, the closely related
cyanobacterial symbionts from Chondrilla sp. were also
found in seawater. It was hypothesized that these Cyanobac-
teria have become symbiotic with sponges relatively recently
(Usher et al., 2004). Owing to the close phylogenetic
relationship to planktonic Synechococcus strains, a seawater
origin cannot be excluded for the T. aurantium-associated
strains either. Cyanobacteria in sponges have generally been
found in the thin (few millimetres) outer tissue regions,
where light energy is available for photosynthesis. The
endosome of T. aurantium is covered by a thick and dense
cortex region, but spicule bundles might function as a
natural light conductor, similar to fibre-optic systems, as
was postulated for the growth of the sponge-associated
green alga Ostreobium sp. in Tethya seychellensis (Gaino &
Sara, 1994).
A specifically cortex-associated bacterial cluster was iden-
tified within the division Bacteroidetes, affiliated with the
family Flexibacteriaceae (clone cluster Tethya-III and DGGE
band TA-II, Fig. 2). Although several previous studies have
demonstrated Bacteroidetes belonging to the family Flavo-
bacteriaceae to be associated with sponges (Webster et al.,
2001, 2004; Lafi et al., 2005), only very recently have sponge-
associated Flexibacteriaceae been obtained from sponge
larvae by culture-independent methods (Enticknap et al.,
2006). These putative vertically transmitted sponge sym-
bionts are closely related to sequences obtained from T.
aurantium cortex in 2004 and distantly related to cluster
Tethya-III found in both years. Cluster Tethya-III has been
observed in sponges for the first time in this study. The
bacteria were not detected in the ambient seawater and in
the sponge endosome. Given the occurrence in the sponge
cortex exclusively and presence in specimens from consecu-
tive years as well as the phylogenetically relatively
large distance (o 91%) to known sequences, we assume
specific association between theMicroscilla-like bacteria and
T. aurantium.
As sponges are filter-feeding animals, a seawater origin of
sponge-derived bacterial sequences cannot be excluded
despite repeated washing steps in sterile seawater prior to
DNA extraction. Several sequences obtained from seawater
in this study share high similarity with clone sequences
found in both T. aurantium and other sponges. Thus, some
of the endosome-associated bacterial sequences may solely
resemble DNA of ambient seawater bacteria ingested in the
choanocyte chambers. Additionally, the high variability of
different phylotypes observed either implies seasonal
differences in the sponge-associated bacterial communities
or possibly reflects seasonal microbial population dynamics
in the ambient seawater. The similarity between the
sponge endosome-associated bacterial community and the
ambient seawater bacterioplankton as demonstrated in
DGGE and phylogenetic analysis again emphasizes the need
to differentiate between sponge-specific and merely ingested
bacteria.
Hentschel et al. (2002) found 70% of all sponge-derived
sequences clustering together in different phylogenetic
clades. By contrast, a minor fraction (22%) of the T.
aurantium-derived sequences were closely related to other
sponge-associated bacteria. Apart from cluster Tethya–I
related to the Betaproteobacteria, only two additional se-
quences obtained from T. aurantium cluster with other
known sponge-derived sequences. The monophyly of the
sponge-specific cluster indicates common ancestry for
members of this group. Furthermore, limitation of these
bacteria to associations with the phylum Porifera can be
hypothesized. However, because abundance and diversity of
bacteria associated with different sponges depends to a large
extent on the sponge species and possibly on seasonal
influences, a uniform specifically sponge-associated bacter-
ial community as proposed by Hentschel et al. (2002)
probably does not exist.
We suggest a specific association of both the Betaproteo-
bacteria-related cluster Tethya–I and the Flexibacteriaceae
cluster Tethya-III with the sponge T. aurantium. The new
cluster of specifically associated Flexibacteriaceae has so far
been exclusively found in T. aurantium and its presence in
sponges of other taxonomic affiliation and geographical
regions remains to be investigated. The unusual association
of Synechococcus species strains with the T. aurantium
FEMS Microbiol Ecol xx (2006) 1–11c� 2006 Federation of European Microbiological SocietiesPublished by Blackwell Publishing Ltd. All rights reserved
14 V. Thiel et al.
124

APPENDIX
endosome and the putative light conduction by sponge
spicule bundles will be studied in future research.
Acknowledgements
We gratefully acknowledge the help of R. Batel and the
personnel at the Ruder Boskovic Institut (Rovinj, Croatia)
and F. Brummer (University of Stuttgart, Germany) during
sampling of the sponges. This work was supported by the
German Federal Ministry of Education and Research
(bmb1f) as part of the Kompetenz-Zentrum BIOTECmarin
(grant no. 03F0345B)
References
Althoff K, Schutt C, Steffen R, Batel R & Muller WEG (1998)
Evidence for a symbiosis between bacteria of the genus
Rhodobacter and the marine sponge Halichondria panicea:
harbor also for putatively toxic bacteria? Mar Biol 130:
529–536.
Altschul SF, Gish W, Miller W, Myers EW & Lipman DJ (1990)
Basic local alignment search tool. J Mol Biol 215: 403–410.
Brown MV, Schwalbach MS, Hewson I & Fuhrman JA (2005)
Coupling 16S-ITS rDNA clone libraries and automated
ribosomal intergenic spacer analysis to show marine microbial
diversity: development and application to a time series.
Environ Microbiol 7: 1466–1479.
Brummer F, Calcinai B, Gotz M, Leitermann F, Nickel M, Schillak
L, Sidri M & Zucht W (2004) Overview on the sponge fauna of
the Limski kanal, Croatia, Northern Adriatic Sea. Boll Musei
Institut Biol 2004 (Genova) 68: 219–227.
Burja AM & Hill RT (2001) Microbial symbionts of the
Australian great barrier reef sponge, Candidaspongia flabellata.
Hydrobiologia 461: 41–47.
Burja AM, Webster NS, Murphy PT & Hill RT (1999) Microbial
symbionts of great barrier reef sponges.Mem Queensl Mus 44:
63–75.
Burton M (1928) A comparative study of the characteristics of
shallow-water and deep-sea sponges, with notes on their
external form and reproduction. J Queckett Microsc Club Ser 2
16: 49–70.
Cho JC & Giovannoni SJ (2004) Cultivation and growth
characteristics of a diverse group of oligotrophic marine
Gammaproteobacteria. Appl Environ Microbiol 70: 432–440.
Clarke KR (1993) Non-parametric multivariate analysis of
changes in community structure. Australian Journal of Ecology
18: 117–143.
Clarke KR & Gorley RN (2001) PRIMER v5: User Manual/
Tutorial, PRIMER-E. Plymouth UK.
Clarke KR &Warwick RM (1994) Similarity-based testing for
community pattern–the 2-way layout with no replication.Mar
Biol 118: 167–176.
Enticknap JJ, Kelly M, Peraud O & Hill RT (2006)
Characterization of a culturable alphaproteobacterial
symbiont common to many marine sponges and evidence for
vertical transmission via sponge larvae. Appl Environ Microbiol
72: 3724–3732.
Felsenstein J (1981) Evolutionary trees from DNA-sequences–a
maximum-likelihood approach. J Mol Evol 17: 368–376.
Fuhrman JA & Ouverney CC (1998) Marine microbial diversity
studied via 16S rRNA sequences: cloning results from coastal
waters and counting of native archaea with fluorescent single
cell probes. Aquat Ecol 32: 3–15.
Gaino E & Sara M (1994) Siliceous spicules of Tethya seychellensis
(Porifera) support the growth of a green-alga – a possible light
conducting system. Mar Ecol Prog Ser 108: 147–151.
Giovannoni SJ & Rappe MS (2000) Evolution, diversity, and
molecular ecology of marine prokaryotes. Microbial Ecology of
the Oceans (Kirchman DL, ed), pp. 47–84. Wiley-Liss, New
York.
Guindon S & Gascuel O (2003) A simple, fast, and accurate
algorithm to estimate large phylogenies by maximum
likelihood. Syst Biol 52: 696–704.
Guindon S, Lethiec F, Duroux P & Gascuel O (2005) PHYML
Online–a web server for fast maximum likelihood-based
phylogenetic inference. Nucleic Acids Res 33: W557–W559.
Hentschel U, Hopke J, Horn M, Friedrich AB, Wagner M, Hacker
J & Moore BS (2002) Molecular evidence for a uniform
microbial community in sponges from different oceans. Appl
Environ Microbiol 68: 4431–4440.
Hinde R, Pironet F & Borowitzka MA (1994) Isolation of
Oscillatoria spongeliae, the filamentous cyanobacterial
symbiont of the marine sponge Dysidea herbacea.Mar Biol
119: 99–104.
Hooper NJA & van Soest RWM (2002) Systema Porifera: A Guide
to the Classification of Sponges. Kluwer Academic/Plenum
Publishers, New York.
Hurlbert S (1971) The nonconcept of species diversity: a critique
and alternative parameters. Ecology 52: 577–586.
Imhoff JF & Stohr R (2003) Sponge-associated bacteria: general
overview and special aspects of bacteria associated with
Halichondria panicea. Sponges (Porifera) (Muller WEG, ed),
pp. 35–56. Springer Verlag, Berlin.
Kemp PF & Aller JY (2004) Estimating prokaryotic diversity:
when are 16S rDNA libraries large enough? Limnol Oceanogr-
Meth 2: 114–125.
Kim TK, Garson MJ & Fuerst JA (2005) Marine actinomycetes
related to the Salinospora group from the great barrier reef
sponge Pseudoceratina clavata. Environ Microbiol 7: 509–518.
Koellner T, Hersperger AM & Wohlgemuth T (2004) Rarefaction
method for assessing plant species diversity on a regional scale.
Ecography 27: 532–544.
Kuzmanovic N (1985) Preliminarna Istrazivanja Dinamike
Vodenih Masa Limskog Kanala (Zavrsni Izvjestaj). Rep.
‘‘Institut Ruder Boskovic’’, Rovinj, Croatia.
Lafi F, Garson M& Fuerst J (2005) Culturable bacterial symbionts
isolated from two distinct sponge species (Pseudoceratina
clavata and Rhabdastrella globostellata) from the great barrier
reef display similar phylogenetic diversity.Microb Ecol 50:
213–220.
FEMS Microbiol Ecol xx (2006) 1–11 c� 2006 Federation of European Microbiological SocietiesPublished by Blackwell Publishing Ltd. All rights reserved
15Sponge-associated bacteria in the sponge Tethya aurantium
125

APPENDIX
Lane DL (1991) 16S/23S rRNA sequencing. Nucleic Acid
Techniques in Bacterial Systematics (Stackebrandt E &
Goodfellow M, eds), pp. 115–175. John Wiley & Sons, New
York.
Levantesi C, Beimfohr C, Geurkink B, Rossetti S, Thelen K,
Krooneman J, Snaidr J, van der Waarde J & Tandoi V (2004)
Filamentous Alphaproteobacteria associated with bulking in
industrial wastewater treatment plants. Syst Appl Microbiol 27:
716–727.
Ludwig W, Strunk O, Westram R et al. (2004) ARB: a software
environment for sequence data. Nucleic Acids Res 32:
1363–1371.
Maidak BL, Cole JR, Parker CT et al. (1999) A new version of the
RDP (ribosomal database project). Nucleic Acids Res 27:
171–173.
Manz W, Arp G, Schumann-Kindel G, Szewzyk U & Reitner J
(2000) Widefield deconvolution epifluorescence microscopy
combined with fluorescence in situ hybridization reveals the
spatial arrangement of bacteria in sponge tissue. J Microbiol
Meth 40: 125–134.
Methe BA, Hiorns WD & Zehr JP (1998) Contrasts between
marine and freshwater bacterial community composition:
analyses of communities in Lake George and six other
Adirondack lakes. Limnol Oceanogr 43: 368–374.
Muyzer G, Dewaal EC & Uitterlinden AG (1993) Profiling of
complex microbial populations by denaturing gradient gel
electrophoresis analysis of polymerase chain reaction-
amplified genes coding for 16S ribosomal-RNA. Appl Environ
Microbiol 59: 695–700.
Petri R & Imhoff JF (2001) Genetic analysis of sea-ice bacterial
communities of the Western Baltic Sea using an improved
double gradient method. Polar Biol 24: 252–257.
Pile AJ, Patterson MR &Witman JD (1996) In situ grazing on
plankton o 10 mm by the boreal spongeMycale lingua. Mar
Ecol Prog Ser 141: 95–102.
Rappe MS, Kemp PF & Giovannoni SJ (1997) Phylogenetic
diversity of marine coastal picoplankton 16S rRNA genes
cloned from the continental shelf off Cape Hatteras, North
Carolina. Limnol Oceanogr 42: 811–826.
Ridley CP, Faulkner DJ & Haygood MG (2005) Investigation of
Oscillatoria spongeliae-dominated bacterial communities in
four dictyoceratid sponges. Appl Environ Microbiol 71:
7366–7375.
Sara M (1987) A study on the genus Tethya (Porifera,
Demospongiae) and new perspectives in sponge systematics.
Taxonomy of Porifera, G13 (Vacelet J & Boury-Esnault N, eds),
pp. 205–225. Springer, Berlin.
Schirmer A, Gadkari R, Reeves CD, Ibrahim F, DeLong EF &
Hutchinson CR (2005) Metagenomic analysis reveals diverse
polyketide synthase gene clusters in microorganisms
associated with the marine sponge Discodermia dissoluta. Appl
Environ Microbiol 71: 4840–4849.
Schweitzer B, Huber I, Amann R, Ludwig W & Simon M (2001)
Alpha- and Betaproteobacteria control the consumption and
release of amino acids on lake snow aggregates. Appl Environ
Microbiol 67: 632–645.
Steindler L, Huchon D, Avni A & Ilan M (2005) 16S rRNA
phylogeny of sponge-associated cyanobacteria. Appl Environ
Microbiol 71: 4127–4131.
Suzuki MT, Beja O, Taylor LT & DeLong EF (2001) Phylogenetic
analysis of ribosomal RNA operons from uncultivated coastal
marine bacterioplankton. Environ Microbiol 3: 323–331.
Taylor MW, Schupp PJ, Dahllof I, Kjelleberg S & Steinberg PD
(2004) Host specificity in marine sponge-associated bacteria,
and potential implications for marine microbial diversity.
Environ Microbiol 6: 121–130.
Taylor MW, Schupp PJ, de Nys R, Kjelleberg S & Steinberg PD
(2005) Biogeography of bacteria associated with the marine
sponge Cymbastela concentrica. Environ Microbiol 7: 419–433.
Thoms C, Horn M, Wagner M, Hentschel U & Proksch P (2003)
Monitoring microbial diversity and natural product profiles of
the sponge Aplysina cavernicola following transplantation.Mar
Biol 142: 685–692.
Tuma RS, Beaudet MP, Jin XK, Jones LJ, Cheung CY, Yue S &
Singer VL (1999) Characterization of SYBR gold nucleic acid
gel stain: a dye optimized for use with 300-nm ultraviolet
transilluminators. Anal Biochem 268: 278–288.
Usher KM, Fromont J, Sutton DC & Toze S (2004) The
biogeography and phylogeny of unicellular cyanobacterial
symbionts in sponges from Australia and the Mediterranean.
Microb Ecol 48: 167–177.
Vacelet J (1970) Description de cellules a bacteries intranucleaires
chez des eponges Verongia. J Microsc-Paris 9: 333–346.
Vacelet J (1971) Etude en microscopie electronique de
l’association entre une cyanophycee chroococcale et une
eponge du genre Verongia. J Microsc-Paris 12: 363–380.
Vacelet J (1975) Etude en microscopie electronique de
l’association entre bacteries et spongiaires du genre Verongia
(Dictyoceratida). J Microscopie Biol Cell 23: 271–288.
Vacelet J & Donadey C (1977) Electron microscope study of the
association between some sponges and bacteria. J Exp Mar Biol
Ecol 30: 301–314.
Vergin KL, Urbach E, Stein JL, DeLong EF, Lanoil BD &
Giovannoni SJ (1998) Screening of a fosmid library of marine
environmental genomic DNA fragments reveals four clones
related to members of the order Planctomycetales. Appl
Environ Microbiol 64: 3075–3078.
Voytek M & Ward B (1995) Detection of ammonium-oxidizing
bacteria of the beta-subclass of the class Proteobacteria in
aquatic samples with the PCR. Appl Environ Microbiol 61:
1444–1450.
Webster NS & Hill RT (2001) The culturable microbial
community of the great barrier reef sponge Rhopaloeides
odorabile is dominated by an Alpha-Proteobacterium.Mar Biol
138: 843–851.
Webster NS, Wilson KJ, Blackall LL & Hill RT (2001)
Phylogenetic diversity of bacteria associated with the marine
sponge Rhopaloeides odorabile. Appl Environ Microbiol 67:
434–444.
FEMS Microbiol Ecol xx (2006) 1–11c� 2006 Federation of European Microbiological SocietiesPublished by Blackwell Publishing Ltd. All rights reserved
16 V. Thiel et al.
126

APPENDIX
Webster NS, Negri AP, Munro MMHG & Battershill CN (2004)
Diverse microbial communities inhabit Antarctic sponges.
Environ Microbiol 6: 288–300.
Wilkinson CR (1978) Microbial associations in sponges. III.
Ultrastructure of the in situ association in coral reef sponges.
Mar Biol 1978: 177–185.
Yakimov MM, Cappello S, Crisafi E, Tursi A, Savini A, Corselli C,
Scarfi S & Giuliano L (2006) Phylogenetic survey of
metabolically active microbial communities associated
with the deep-sea coral Lophelia pertusa from the Apulian
plateau, Central Mediterranean Sea. Deep-Sea Res Pt I 53:
62–75.
FEMS Microbiol Ecol xx (2006) 1–11 c� 2006 Federation of European Microbiological SocietiesPublished by Blackwell Publishing Ltd. All rights reserved
17Sponge-associated bacteria in the sponge Tethya aurantium
127

DECLARATION OF ACADEMIC INTEGRITY / SELBSTSTÄNDIGKEITSERKLÄRUNG
128
Declaration of Academic Integrity / Selbstständigkeitserklärung
With this statement I declare that I have independently completed the above thesis, except for
scientific consulting by my supervisor Prof. Dr. Karin Lochte. The thoughts taken directly or
indirectly from external sources are properly marked as such. This thesis was not previously
submitted to another academic institution.
Hiermit erkläre ich, dass ich diese Arbeit selbstständig verfertigt habe, abgesehen von der
wissenschaftlichen Beratung durch meine Betreuerin Prof. Dr. Karin Lochte. Alle direkten und
indirekten Zitate aus externen Quellen sind als solche gekennzeichnet. Auf der Grundlage dieser
Arbeit wurde noch kein Promotionsversuch an einer anderen akademischen Einrichtung
unternommen.
Kiel, ………………………………….