bacteria from wastewater m-peg/pcl nanoparticles in
TRANSCRIPT

Page 1/20
Enhanced Antibacterial activity of eugenol loadedm-PEG/PCL nanoparticles in eliminating resistantbacteria from wastewaterMojgan Shajari ( [email protected] )
Islamic Azad University https://orcid.org/0000-0002-8139-3883Kobra Rostamizadeh
Zanjan University of Medical SciencesReza Shapouri
Islamic Azad UniversityLobat Taghavi
Islamic Azad University
Research Article
Keywords: Polymeric nanoparticle, Pathogenic bacteria, Eugenol, Hospital Wastewater, antibacterial,Eliminate
Posted Date: June 17th, 2021
DOI: https://doi.org/10.21203/rs.3.rs-627508/v1
License: This work is licensed under a Creative Commons Attribution 4.0 International License. Read Full License

Page 2/20
AbstractIn this study, eugenol loaded m-PEG/PCL nanoparticles were used to make better the anti-bacterialproperties of eugenol in an attempt to eliminate the resistant bacteria. m-PEG/PCL copolymer wasprepared by ring-opening polymerization of ε-caprolactone monomer in the vicinity of dry m-PEG and tin(II) octoate catalyst. Polymeric nanoparticles were prepared by nanoprecipitation procedure. The particlesize and zeta potential of mPEG/PCL/eugenol were speci�ed to be 157.23 ± 3.81 nm and − 6.95 ± 0.19mv, respectively. The polymeric nanoparticle structure was identi�ed by AFM, FT-IR, and DSC techniques.To evaluate and compare the anti-bacterial e�ciency of m-PEG/PCL/eugenol and free eugenol, a turbidityassay was used in association with gram-positive and gram-negative bacteria. Images of SEM weretaken from bacteria before and after exposure to the mPEG/PCL/eugenol. Colony-forming unit permilliliter (CFU/ml) method was considered to follow the effect of mPEG/PCL/eugenol on bacteria growthrate in the original hospital wastewater. The results showed that m-PEG/PCL/eugenol nanoparticles at 40µM concentration show the enormous antibacterial effect at 37°C. In original hospital wastewater, m-PEG/PCL/eugenol in the concentration of 0.125 µM at 25 ° C showed the greatest growth decrease ofmicrobial total count.
1. IntroductionWater pollution by wastewater contaminants has become harmful for human health and ecosystem andattracted a great deal of public and scienti�c attention. The main contaminants in wastewater includesnutrients material, heavy metals, hydrocarbons, organic matter, and microbes that lead to harmful effectson human safety and the environment (1). Among the various environmental contaminations, antibioticshave attracted speci�c interest due to their severe adverse effects. To remove these contaminants, onestrategy could be the implementation of the antibacterial effect of metallic nanoparticles. For example,ZnO nanoparticles prevent the growth of Staphylococcus aureus, and Ag nanoparticles showantibacterial effect against Escherichia coli and Pseudomonas aeruginosa (2). In contrast to the highpotential, metallic nanoparticles are costly for being used for wastewater treatment. In this regard, it isimperative to take advantage of natural organic materials as low-cost and environmentally-friendlysources. There is little research on usage of non-metallic nanoparticles for wastewater treatment. Forinstance, carbon nanotube-based nanomaterials, due to special features such as vast surface area, vastchemical stability and mesoporous structure have great potential for wastewater treatment (3). Chitosannanocomposite has been used for the elimination of heavy metals and microbial agents (4).
Medicinal plants because of having several compounds such as �avonoids, alkaloids, essential oil,polyphenols, and terpenoids show good antimicrobial and antioxidant properties (5, 6). The antimicrobialtraits of the variety of plants have been studied. Eugenol has been introduced as an effective ingredientagainst antibiotic-resistant bacteria (7). Eugenol is a phenylpropene compound and a main component ofclove essential oil which play a determinant role against bacterial growth (8). There are many reports onthe antibacterial properties of eugenol against pathogenic bacteria. According to the kamtou et al report,eugenol inhibits the growth rate of gram-positive (Bacillus cereus; B. subtilis; Staphylococcus aureus) and

Page 3/20
gram-negative (Escherichia coli; Salmonella typhi; Pseudomonas aeruginosa) bacteria at a concentrationof 1,000 ppm (9). In another study, eugenol showed an obvious antibacterial activity againstStaphyloccocus aureus, Escherichia coli, Salmonella enteritidis, and Bacillus cereus (10). However, waterslightly solubility of eugenol components restricts its vast applications. To resolve this issue, a variety offormulations such as microemulsions, nanoemulsions and nanocapsules have been investigated toincrease the solubility and effectiveness of eugenol in water (11). Studies have shown that the use ofnanoparticles such as liposomes, emulsions and ethosome enhances the antibacterial activity of eugenolbecause of high permeability and sustainable release properties (12–15).
Nanoparticles composed of mPEG-PCL copolymer are considered as a promising carrier with the privilegeof biodegradability, good release properties and simple production process (16). Polymeric nanoparticlesloaded with active antibacterial ingredients also show good antibacterial effects. For example, Jaglone-loaded poly-lactic acid glycolic acid polymer nanoparticles show high antibacterial effect on gram-positive bacteria (17). In another study, chitosan-loaded polymeric nanoparticles were more effectiveagainst the pathogens Klebsiella pneumoniae, Escherichia coli, Pseudomonas and Staphylococcusaureus (18).
The aim of this research was the investigation of the antibacterial e�cacy of eugenol-loaded m-PEG/PCLagainst bacteria isolated from hospital wastewater. The nanoparticles were designed to release the activeingredient slowly to control pathogenic bacteria effectively in the environment and achieve a long-termantibacterial action. In contrast to other methods used to eliminate pathogenic bacteria from wastewaterwhich have many side adverse effects, the most remarkable feature of the nanoparticles is that they haveno considerable harmful effects on the environment and its components can be degraded by theenvironment.
2. Materials And Methods2.1 Materials
m-PEG (Mn=5000 Da), Eugenol, and tin (II) octoate catalyst were purchased from (Aldrich, St. Louis, USA).ε-caprolactone (98% purity) were supplied by Acros (New Jersi, USA).
2.2 Synthesis of m-PEG/PCL copolymer
m-PEG/PCL copolymer was prepared by ring-opening polymerization of ε-caprolactone monomer withthe vicinity of dry m-PEG as the molecular initiator and tin (II) octoate catalyst. ε-caprolactone (4 g) wasplaced in calcium hydride for dehydration for one week. Brie�y, m-PEG (2 g) (with a molecular mass of5000 g / mol) and ε-caprolactone (4 g), and tin(II) octoate catalyst (0.01 mmol) was heated to 120°C and the reaction was performed for 12 hrs. After the reaction, the copolymer was solved in chloroform andprecipitated in cold diethyl ether, then the precipitate was gathered by �ltration and then dried (19).
2.3 Characterization of m-PEG/PCL copolymer

Page 4/20
Nuclear magnetic resonance spectroscopy (1H NMR) was used to detect the structure of m-PEG/PCL copolymer. The spectra were captured by a device (Bruker, Avance 400) at 25 °C. Deuteratedchloroform was consumed as solvent and trimethylsilane was used as an internal standard.
2.4 Preparation of polymeric nanoparticles from m-PEG/PCL copolymer
The nanoparticles were synthesized by the nanoprecipitation procedure (20). Brie�y, m-PEG/PCL copolymer (10 mg) and (1.74 mg) of eugenol were solved in 1 ml of acetone and added bysyringe pump to 25 ml of distilled water. It was also stirred by a magnetic stirrer, until completeevaporation of organic solvent. Blank/m-PEG/PCL was made by the same method but the drug was notadded to the formulation.
2.5 Characterization of m-PEG/PCL/eugenol
2.5.1 Particle shape
Atomic Force Microscope (AFM) was used to determine the shape of the m-PEG/PCL/eugenol (JPK,Berlin, Germany, Wizard 2). m-PEG/PCL/eugenol solution was diluted with distilled water, then a dropplaced on the mica substrate (1 cm2) and dried in the air. AFM device was worked through a contactmethod (21).
2.5.2 Determination of m-PEG/PCL/eugenol size
The particle size distribution, polydispersity index (PDI), and zeta potential of the m-PEG/PCL/eugenol was determined by dynamic light scattering (DLS) technology by MalvernZetasizer instrument at 25°C (Zetasizer Nano ZS, Malvern Instruments, UK).
2.5.3 Drug-loading e�ciency
To de�ne the drug-loading e�ciency in the nanoparticles, the drug loading (DL) ratio and entrapmente�ciency (EE) were studied. Brie�y, 1 mg of m-PEG/PCL/eugenol was dispersed in 1 mL of ethanol, andthe drug substance was assayed by a UV-Vis spectrophotometer (JE Norway 6300, Switzerland) atλmax=281 nm. The EE and DL were calculated using the following equations:(22)
Where the amount of the drug in nanoparticles, the amount of nanoparticles, and amount of initialdrug show the amount of the entrapped drug, the total amount of polymer added in the preparation step,and the drug added to the formulation, respectively.

Page 5/20
2.5.4 FTIR analysis
FT-IR analysis was used to observe changes in peak positions and to investigate the interaction betweenthe components in the nanocarrier system. In general, the interaction between the components arestudied by the band shift of functional groups. FT-IR analysis by a Fourier transform infraredspectrometer (Bruker Tensor 27, Germany) was done in the range of 500-4000 cm-1.
2.5.5 DSC analysis
To carry out the differential scanning calorimetry (DSC) analysis of m-PEG/PCL copolymer as well astheir nanoparticles, the samples were heated at a speed of 10 °C/ min in the range of 25-250 °C by athermal analyzer (Mettler Toledo, Switzerland) (19).
2.5.6 Drug release study
To study the release behavior of eugenol from m-PEG/PCL/eugenol, 1 ml of nanoparticles solution waspoured into dialysis bags (Mw 12 kDa) and immersed in water containing 2% (v/v) DMSO. Thesuspension was put in a thermal shaker (Memmert, Germany) at 50 rpm at 37 °C for 48 hrs. DMSO wasused in the release media to facilitate drug release from the nanoparticles. Then, at regular intervals, 2 mlof the release media was removed and replaced by 2 ml freshly release media.
2.6 Antibacterial effect of m-PEG/PCL/eugenol
To evaluate the anti-bacterial performance of m-PEG/PCL/eugenol and free eugenol on bacteria growth, aturbidity assay was used. The colony-forming units per milliliter (CFU/ml) method was used to estimatethe m-PEG/PCL/eugenol performance on wild strains in original wastewater. Con�rmatory andcomplementary tests were performed on wild strains isolated from wastewater, which were fully reportedin our previous paper (23).
2.6.1 Bacteria growth rate in Luria-Bertani in the presence of m-PEG/PCL/eugenol
The antibacterial activity of m-PEG/PCL/eugenol and free eugenol were investigated on gram-positivebacteria (Staphilococcus aureus, Enterococcus faecalis) and gram-negative bacteria (Escherichia coli,Pseudomonas aeruginosa) using the turbidity assay. The bacteria growth rate in Luria-Bertani in thepresence of m-PEG/PCL/eugenol and free eugenol at different concentrations (0.125-40 µm) weremeasured by a microplate reader (in�nite 200, Tecan, Switzerland) at OD (600 nm) for 24 hrs. DMSO wereused in the bacteria culture media for ease of drug release from the nanoparticles (24).
The reduction percentage of bacteria was examined using the following equation 3 (25):
Page 6/20
where A is the OD 600 value of growth rate of bacteria in the culture media containing m-PEG/PCL/eugenol nanoparticles or free eugenol and B is the OD 600 value of growth rate of bacteria inthe culture media without an antibacterial agent.
2.6.2 Antibacterial properties of m-PEG/PCL/eugenol in real wastewater
The wastewater was sterilized by autoclave for 15 min at a pressure of 200 KP and a temperature of 121° C. Then, the optical density value of the wild type bacteria suspension was adjusted to 0.1 and thensuspension was diluted with sterilized physiological saline. 100 µl of this dilution, sterilized wastewater,m-PEG/PCL/eugenol, and free eugenol at two different concentrations (0.125 and 40 mM) were pouredinto microtubes and placed at 4 °C, 25 °C and 37 °C for 24 hrs. The samples were diluted up to 1/1000with sterilized physiological saline. Then, 10 µl of the samples were cultured on a plate containing MüllerHinton agar, and the plates were heated at 37 °C for 24 hrs. Effect of m-PEG/PCL/eugenol and freeeugenol was also performed according to the above method on the original wastewater (beforesterilization) to obtain the colony-forming units per milliliter (CFU/ml). All experiments were performedwith triplications.
2.7 Scanning Electron Microscopy (SEM)
Scanning electron microscopy (SEM) was used to examine the morphological changes in Staphilococcusaureus as gram-positive bacteria and Escherichia coli as gram-negative bacteria after exposure to m-PEG/PCL/eugenol nanoparticles. SEM analysis was done by AIS 2100 scanning electron microscope(Seron, Korea).
2.8 Statistical analysis
Statistical comparisons were expressed by ANOVA analysis, where P-values <0.05 were meaningful. Datawere reported as average±SD.
3. Results And Discussion3.1 Characterization of mPEG/ PCL copolymer
m-PEG/PCL copolymer was prepared by ring-opening polymerization of ε-caprolactone monomer in thevicinity of dry m-PEG as the molecular initiator and tin (II) octoate catalyst. Chemical structure of m-PEG/PCL copolymer was determined using Nuclear magnetic resonance spectroscopy (1H NMR). In thenuclear magnetic resonance spectrum of the copolymer, the peak in the region of 3.4 ppm (3H, a) and3.67 ppm (4H, b) corresponds to the methoxy group hydrogens and the polyethylene glycol groupshydrogens. The peak of 1.445 ppm (2H, d), 1.670 ppm (2H, e), 2.33 ppm (2H, c), and 4.085 ppm (2H, f)correspond to the caprolactone hydrogens, respectively Fig. 1 (21)
3.2 Characterization of polymeric nanoparticles
Page 7/20
The resulting mPEG/PCL/eugenol polymeric nanoparticles were characterized by different methods suchas dynamic light scattering (DLS) and atomic force microscopy (AFM). According to the AFM images,mPEG/PCL/eugenol polymeric nanoparticles showed almost spherical shape with the average particlesize of 146.75 ± 5.39 nm, Fig. 2. According to the DLS method, the particle size of mPEG/PCL/eugenoland m-PEG/PCL/Blank were determined to be 157.23 ± 3.81 nm (n = 3) and 85.22 ± 3.26 nm (n = 3),respectively. PDI values of mPEG/PCL/eugenol and m-PEG/PCL/Blank were 0.21 ± 1.14 and 0.35 ± 3.81,respectively, and zeta potential of mPEG/PCL/eugenol and m-PEG/PCL/Blank were − 6.95 ± 0.19 mv (n = 3) and − 6.25 ± 3.26 mv (n = 3), respectively. The particle size of mPEG/PCL/eugenol measured bydynamic light scattering method (DLS) was a bit bigger than the one of AFM which can be explained bythe fact that AFM determines the particle size of the sample after evaporation of water, while the diameterof the nanoparticles measured by the DLS indicates the hydrodynamic diameter (26). The drug loading(DL) ratio and entrapment e�ciency (EE) of eugenol loaded mPEG/PCL nanoparticles were de�ned to be13.81% and 98.33 ± 0.004%, respectively.
3.3 FTIR analysisTo determine the possible interactions between eugenol and the copolymer, fourier transform infraredspectroscopy was performed (Fig. 3). The results show that there is a strong, wide peak in the 3400 cm− 1
region, which belongs to the hydroxyl group in the eugenol chemical structure. The peak in the region of1108 cm− 1 is related to the carbonyl group's stretching bonds, the peak in the region of 1730 cm− 1 isrelated to the ester functional group of the mPEG-PCL copolymer. The outcomes indicate that theinteraction between mPEG/PCL copolymer and eugenol successfully has been formed.
3.4 DSC analysisFigure 4 demonestrates the DSC thermograms of m-PEG/PCL/Blank, and mPEG/PCL/eugenol (21). Thecurve for the m-PEG/PCL/Blank displayed a melting peak in the range of 58.24°C, indicating the meltingof the crystalline part of PCL copolymer (19), while the mPEG/PCL/eugenol thermogram shows themelting peak in the range of 55.33 ° C. The shift in the melting peak of the copolymer manifests thephysical interaction between copolymer and eugenol during the drug loading process in the nanoparticles(27).
3.5 drug release studyThe eugenol release from mPEG/PCL/eugenol was studied. As shown in Fig. 5, the percentage of eugenolreleased from polymeric nanoparticles raised over the time and the maximum accessible drug releasewas 18.54% that was achieved after 24 hrs. The controlled drug release behavior of eugenol loadedpolymeric nanoparticles can increase the e�ciency of eugenol as a hydrophobic antibacterial agent inthe environment. Besides, eugenol entrapment into the nanoparticles increases the dissolution rate andthe level of dissolved drugs which in turn causes a higher e�ciency for the nanoparticles compared tofree eugenol.
3.6 Bacteria growth rate

Page 8/20
To evaluate the performance of m-PEG/PCL/eugenol and free eugenol on gram-positive (Staphilococcusaureus, Enterococcus faecalis) and gram-negative (Escherichia coli, Pseudomonas aeruginosa) bacteriaboth standard and wild bacteria strains turbidity assay was used. The characteristics of all bacteria havebeen reported in our previous article (23). According to the results, the antibacterial effect of m-PEG/PCL/eugenol was greater than the free eugenol at equal concentration and it was different againstgram-positive and gram-negative bacteria (28). This �nding can be interpreted by the improved propertiesof eugenol through loading into the polymeric nanoparticles in terms of antibacterial e�ciency, stability,and drug solubility (29). The outcomes are consistent with past studies. For example, polymericnanoparticles loaded with lauric acid showed higher antibacterial activity against peripronium bacteriacompared to free lauric acid (30). Poly lactic-co-glycolic acid loaded with clarithromycin show a higherbactericidal effect than free clarithromycin (31). In addition to the higher antibacterial e�ciency of thenanoparticles, the most important feature of m-PEG/PCL/eugenol is its long-lasting antibacterial activitydue to the slow release of payload drug compared to the free drug as shown in Fig. 6.
There are various reports about eugenol minimum inhibitory concentration (MIC). According to thekamtou et al report, eugenol inhibited the growth rate of gram-positive (Bacillus cereus; B. subtilis;Staphylococcus aureus) and gram-negative (Escherichia coli; Salmonella typhi; Pseudomonasaeruginosa) bacteria at a concentration of 1000 ppm. The results demonstrate that the least e�cientconcentration of m-PEG/PCL/eugenol was 40 µM, at which free eugenol did not show any antibacterialeffect because it was much lower than eugenol MIC (9). In this study, gram-negative bacteria were moresensitive than gram-positive bacteria and the highest inhibition effect was at 40 µM against standard andwild-type of Escherichia coli (Fig. 6).
The observed results can be explained by the interaction of nanoparticles with the cell wall of gram-negative bacteria that is more than that of gram-positive bacteria, which in turn may be related to thebulky peptidoglycan layer in the cell wall of gram-positive bacteria (32). On the other hand, drugencapsulation e�ciency by polymeric nanoparticles, instability of polymeric nanoparticles due to lowzeta potential, and drug release from polymeric nanoparticles can affect their function (33–35).PEG/PCL/eugenol showed a long-term antibacterial effect toward both types of bacteria, particularlygram-negative bacteria, exposing them as a promising materials for wastewater treatment in the future.
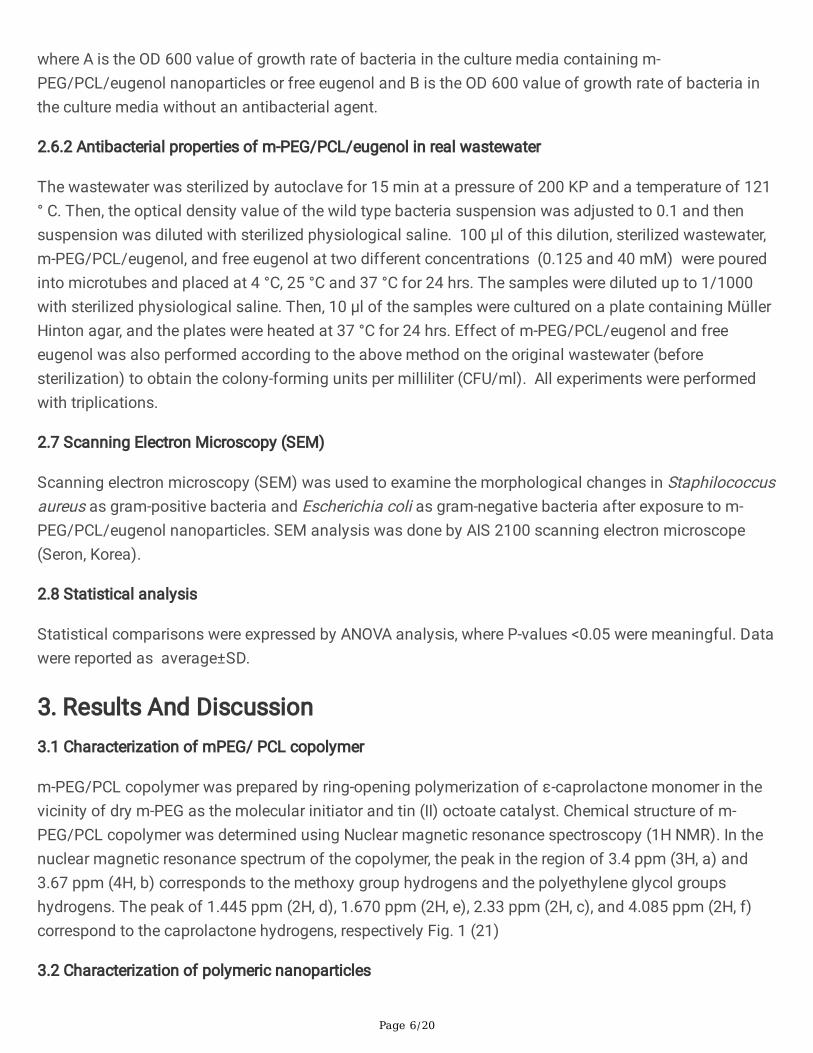
Scanning electron microscopy (SEM) was performed to recognize the morphological change onStaphilococcus aureus (gram-positive bacteria) and Escherichia coli (gram-negative bacteria) afterexposure to m-PEG/PCL/eugenol (see Fig. 8). The results showed that the structure of the bacteria cellwall exposed to m-PEG/PCL/eugenol was damaged after 24 hrs. Our previous results have demonstratedthat long and slow release of curcumin from nanostructure lipid carriers can eliminate gram-positive andgram-negative bacteria by cell wall degradation, con�rmed by SEM images (23). The results areconsistent with the previous reports.
3.7 Antibacterial properties of m-PEG/PCL/eugenol in real wastewater

Page 9/20
The sterile wastewater containing the bacteria (wild strains of bacteria) was exposed to m-PEG/PCL/eugenol. The effect of different temperatures (37°C, 25°C and 4°C) on the performance of m-PEG/PCL/eugenol was investigated. Colony-forming unit per milliliter (CFU/ml) method and bacteriareduction rate was used to report the m-PEG/PCL/eugenol function. The antibacterial effect of m-PEG/PCL/eugenol was studied in two different concentrations (0.125 µM and 40 µM). The resultsshowed that m-PEG/PCL/eugenol in high concentration (40 µM) had an enormous antibacterial effect ongram-negative bacteria especially Pseudomonas aeruginosa (w) and Escherichia coli (w) at 37 ° C. Theresults obtained for the sterile wastewater were consistent with the results obtained in the in vitro (SeeFig. 9). Again, in the same concentration of eugenol, free eugenol showed no antibacterial effect.
To investigate the reduction rate of microbial total count in original hospital wastewater by m-PEG/PCL/eugenol, colony-forming unit per milliliter (CFU/ml) was used, then reduction rate percentage ofthe microbial total count was followed. The greatest growth decrease of microbial total count by m-PEG/PCL/eugenol (0.125 µM) was observed at 25°C. m-PEG/PCL/eugenol (40µM) showed fewer effecton the growth decreases of microbial total count in original hospital wastewater at 37° C (See Fig. 10).
Conclusions
This study reports the development of biodegradable and environmentally-friendly nanoparticles inassociation with the plant active ingredients for wastewater treatment. Eugenol loaded m-PEG/PCL wereprepared to improve the solubility of eugenol and provide controlled release properties hoping to increaseeugenol antibacterial activity. The size and zeta potential of polymeric nanoparticles ready by thenanoprecipitation precedure were 157.23 ± 3.81 nm and − 6.95 ± 0.19 mv, respectively. The sphericalstructure of the polymeric nanoparticles was proved by AFM. Turbidity assay was used to evaluate andcompare the antibacterial e�ciency of m-PEG/PCL/eugenol and free eugenol, on gram-positive andgram-negative bacteria. SEM images of bacteria showed the wall destruction of bacteria after exposureto mPEG/PCL/eugenol. Colony-forming unit per milliliter (CFU/ml) method was used to follow the effectof mPEG/PCL/eugenol on bacteria growth rate in the original hospital wastewater. The results showedthat m-PEG/PCL/eugenol nanoparticles at 40 µM concentration show the enormous antibacterial effectat 37°C. However, in original hospital wastewater, the greatest growth decrease of microbial total count bym-PEG/PCL/eugenol was observed in the concentration of 0.125 µM at 25 ° C.
DeclarationsFunding
The authors declare no funding body for this research.
Con�ict of Interests
The authors express that they have no con�ict of bene�t.
Ethics approval

Page 10/20
Not applicable for section.
Consent to participate
The authors are completely agree to participate in this research study.
Consent for publication
The authors are completely satis�ed with the publication of the article.
Availability of data
The datasets used during the current study are available from the corresponding author on reasonablerequest.
Code availability
Not applicable for section.
Authors' contributions
Not applicable for section.
Acknowledgment
The authors are most thankful for the assistance of this project by the School of Pharmacy, ZanjanUniversity of Medical Sciences.
References1. Davies PS. The biological basis of wastewater treatment. Strathkelvin Instruments Ltd. 2005;3.
2. Ramalingam B, Parandhaman T, Das SK. Antibacterial effects of biosynthesized silvernanoparticles on surface ultrastructure and nanomechanical properties of gram-negative bacteria viz.Escherichia coli and Pseudomonas aeruginosa. ACS applied materials & interfaces. 2016;8(7):4963-76.
3. Yin Z, Cui C, Chen H, Yu X, Qian W. The Application of Carbon Nanotube/Graphene‐BasedNanomaterials in Wastewater Treatment. Small. 2020;16(15):1902301.
4. Aizat MA, Aziz F. Chitosan nanocomposite application in wastewater treatments. Nanotechnology in Water and Wastewater Treatment: Elsevier; 2019. p. 243-65.
5. Talib WH, Mahasneh AM. Antimicrobial, cytotoxicity and phytochemical screening of Jordanianplants used in traditional medicine. Molecules. 2010;15(3):1811-24.

Page 11/20
6. Bouyahya A, Bakri Y, Khay E, Edaoudi F, Talbaoui A, Et-Touys A, et al. Antibacterial, antioxidant andantitumor properties of Moroccan medicinal plants: a review. Asian Pac J Trop Dis. 2017;7(1):57-64.
7. Das B, Mandal D, Dash SK, Chattopadhyay S, Tripathy S, Dolai DP, et al. Eugenol provokes ROS-mediated membrane damage-associated antibacterial activity against clinically isolated multidrug-resistant Staphylococcus aureus strains. Infectious Diseases: Research and Treatment. 2016;9:IDRT.S31741.
8. Oyedemi S, Okoh A, Mabinya L, Pirochenva G, Afolayan A. The proposed mechanism ofbactericidal action of eugenol,∝-terpineol and g-terpinene against Listeria monocytogenes, Streptococcuspyogenes, Proteus vulgaris and Escherichia coli. African Journal of Biotechnology. 2009;8(7).
9. Kamatou GP, Vermaak I, Viljoen AM. Eugenol—from the remote Maluku Islands to the internationalmarket place: a review of a remarkable and versatile molecule. Molecules. 2012;17(6):6953-81.
10. DOBRE A, NICULIÅ P. Antibacterial pro�le of essential oils against pathogen bacteria. Bulletin ofUniversity of Agricultural Sciences and Veterinary Medicine Cluj-Napoca Agriculture. 2012;69(2).
11. Mak K-K, Kamal M, Ayuba S, Sakirolla R, Kang Y-B, Mohandas K, et al. A comprehensive review oneugenol's antimicrobial properties and industry applications: A transformation from ethnomedicine toindustry. Pharmacognosy Reviews. 2019;13(25):1-9.
12. Garg A, Singh S. Enhancement in antifungal activity of eugenol in immunosuppressed ratsthrough lipid nanocarriers. Colloids and Surfaces B: Biointerfaces. 2011;87(2):280-8.
13. Jin P, Yao R, Qin D, Chen Q, Du Q. Enhancement in antibacterial activities of eugenol-entrappedethosome nanoparticles via strengthening its permeability and sustained release. Journal of agriculturaland food chemistry. 2019;67(5):1371-80.
14. Sutradhar KB, Amin ML. Nanoemulsions: increasing possibilities in drug delivery. EuropeanJournal of Nanomedicine. 2013;5(2):97-110.
15. Woranuch S, Yoksan R. Eugenol-loaded chitosan nanoparticles: I. Thermal stability improvementof eugenol through encapsulation. Carbohydrate Polymers. 2013;96(2):578-85.
16. Gou M, Wei X, Men K, Wang B, Luo F, Zhao X, et al. PCL/PEG copolymeric nanoparticles: potentialnanoplatforms for anticancer agent delivery. Current drug targets. 2011;12(8):1131-50.
17. Arasoglu T, Derman S, Mansuroglu B, Yelkenci G, Kocyigit B, Gumus B, et al. Synthesis,characterization and antibacterial activity of juglone encapsulated PLGA nanoparticles. Journal ofapplied microbiology. 2017;123(6):1407-19.
18. Divya K, Vijayan S, George TK, Jisha M. Antimicrobial properties of chitosan nanoparticles: Modeof action and factors affecting activity. Fibers and Polymers. 2017;18(2):221-30.

Page 12/20
19. Danafar H, Davaran S, Rostamizadeh K, Valizadeh H, Hamidi M. Biodegradable m-PEG/PCL core-shell micelles: preparation and characterization as a sustained release formulation for curcumin.Advanced pharmaceutical bulletin. 2014;4(Suppl 2):501.
20. Hans ML, Lowman AM. Biodegradable nanoparticles for drug delivery and targeting. CurrentOpinion in Solid State and Materials Science. 2002;6(4):319-27.
21. Manjili HK, Shara� A, Danafar H, Hosseini M, Ramazani A, Ghasemi MH. Poly (caprolactone)–poly(ethylene glycol)–poly (caprolactone)(PCL–PEG–PCL) nanoparticles: a valuable and e�cient system forin vitro and in vivo delivery of curcumin. Rsc Advances. 2016;6(17):14403-15.
22. Danafar H. Preparation and characterization of PCL-PEG-PCL polymersomes for delivery ofclavulanic acid. Cogent Medicine. 2016;3(1):1235245.
23. Shajari M, Rostamizadeh K, Shapouri R, Taghavi L. Eco-friendly curcumin-loaded nanostructuredlipid carrier as an e�cient antibacterial for hospital wastewater treatment. Environmental Technology &Innovation. 2020:100703.
24. Cortesi R, Valacchi G, Muresan XM, Drechsler M, Contado C, Esposito E, et al. Nanostructured lipidcarriers (NLC) for the delivery of natural molecules with antimicrobial activity: production,characterisation and in vitro studies. Journal of microencapsulation. 2017;34(1):63-72.
25. Kim H, Makin I, Skiba J, Ho A, Housler G, Stojadinovic A, et al. Antibacterial e�cacy testing of abioelectric wound dressing against clinical wound pathogens. The open microbiology journal. 2014;8:15.
26. Song Z, Feng R, Sun M, Guo C, Gao Y, Li L, et al. Curcumin-loaded PLGA-PEG-PLGA triblockcopolymeric micelles: Preparation, pharmacokinetics and distribution in vivo. Journal of colloid andinterface science. 2011;354(1):116-23.
27. Danafar H. Study of the composition of polycaprolactone/poly (ethylene glycol)/polycaprolactonecopolymer and drug-to-polymer ratio on drug loading e�ciency of curcumin to nanoparticles.Nanotechnology. 2016;8:9.
28. Gursoy RN, Benita S. Self-emulsifying drug delivery systems (SEDDS) for improved oral delivery oflipophilic drugs. Biomedicine & pharmacotherapy. 2004;58(3):173-82.
29. Anh N, Cuong N, Hoang N, editors. Formation of Biodegradable Copolymeric Nanoparticles forAnticancer Drug Delivery. The Third International Conference on the Development of BiomedicalEngineering in Vietnam; 2010: Springer.
30. Tran T-Q-M, Hsieh M-F, Chang K-L, Pho Q-H, Nguyen V-C, Cheng C-Y, et al. Bactericidal effect oflauric acid-loaded PCL-PEG-PCL nano-sized micelles on skin commensal Propionibacterium acnes.Polymers. 2016;8(9):321.

Page 13/20
31. Valizadeh H, Mohammadi G, Ehyaei R, Milani M, Azhdarzadeh M, Zakeri-Milani P, et al.Antibacterial activity of clarithromycin loaded PLGA nanoparticles. Die Pharmazie-An InternationalJournal of Pharmaceutical Sciences. 2012;67(1):63-8.
32. Slavin YN, Asnis J, Häfeli UO, Bach H. Metal nanoparticles: understanding the mechanisms behindantibacterial activity. Journal of nanobiotechnology. 2017;15(1):65.
33. Son G-H, Lee B-J, Cho C-W. Mechanisms of drug release from advanced drug formulations such aspolymeric-based drug-delivery systems and lipid nanoparticles. Journal of Pharmaceutical Investigation.2017;47(4):287-96.
34. Mura S, Nicolas J, Couvreur P. Stimuli-responsive nanocarriers for drug delivery. Nature materials.2013;12(11):991.
35. Hoffman AS. The origins and evolution of “controlled” drug delivery systems. Journal of controlledrelease. 2008;132(3):153-63.
Figures
Figure 1

Page 14/20
H NMR spectra of mPEG–PCL copolymer
Figure 2
AFM image of mPEG/PCL/eugenol
Figure 3
FT-IR spectra of a) mPEG/PCL/eugenol, b) Blank/m-PEG/PCL, c) eugenol

Page 15/20
Figure 4
DSC thermogram of a) m-PEG/PCL/Blank, b) mPEG/PCL/eugenol
Figure 5
The drug release behavior of mPEG/PCL/eugenol. Each data point shows the mean±SD (n=3)

Page 16/20
Figure 6
Comparison of bacteria growth rate exposed to m-PEG/PCL/eugenol 40 µM and free eugenol 40 µM: a)Staphilococcus aureus, b) Enterococcus faecalis c) Escherichia coli and d) Pseudomonas aeruginosa(standard and wild strains)

Page 17/20
Figure 7
The reduction percentage of the bacteria growth in culture media exposed to m-PEG/PCL/eugenol (0.125-40 µM) for gram-positive and gram-negative bacteria (standard and wild strains) after 24 hrs.
Page 18/20
Figure 8
Scanning electron microscopy images of Staphilococcus aureus (a) without m-PEG/PCL/eugenol, (b)after exposed to m-PEG/PCL/eugenol 40 µM and Escherichia coli (c) without m-PEG/PCL/eugenol, (d)after exposed to m-PEG/PCL/eugenol 40 µM

Page 19/20
Figure 9
a) % Bacteria reduction rate in culture media incubated with various concentration of m-PEG/PCL/eugenol at 37 °C and b) % Bacteria reduction rate in culture media incubated with m-PEG/PCL/eugenol 40 µM at different temperature

Page 20/20
Figure 10
% Reduction rate of microbial total count in original wastewater exposed to different concentration of m-PEG/PCL/eugenol at different temperature