backyard spectroscopy and photometry of titan, uranus and neptune
TRANSCRIPT

Available online at www.sciencedirect.com
Planetary and Space Science 51 (2003) 113–125
www.elsevier.com/locate/pss
Backyard spectroscopy and photometry of Titan, Uranus and Neptune
Ralph D Lorenza ;∗, Jessica M Dooleya, J. Doug Westb, Mitsugu Fujiic
aLunar and Planetary Laboratory, University of Arizona, Tucson, AZ 85721-0092, USAbWest Skies Observatory, P.O. Box 517, Derby, KS 67037, USAc4500 Kurosaki Tamashima Kurashiki, Okayama 713-8126, Japan
Received 9 November 2001; accepted 15 June 2002
Abstract
We present and discuss observations of Titan (photometry and spectroscopy) and Uranus and Neptune (spectroscopy only) obtainedusing o3-the-shelf equipment, a3ordable and available to many amateur astronomers and small colleges. Spectral observations comparewell with published results from front-line observatories, and some evidence of seasonal change is evident in both spectra and narrowbandphotometry. Scattered Saturn light presents a signi6cant problem for Titan observations, in particular, for slitless spectroscopy, and ourattempts to reproduce Titan’s lightcurve have so far been unsuccessful.? 2003 Elsevier Science Ltd. All rights reserved.
1. Introduction
The outer planet atmospheres are dynamic objects whosefull understanding requires constant monitoring. Althoughmuch of our understanding of them derives from the de-tailed, but brief, observations during the Voyager encoun-ters and more recently by spaceborne observatories andlarge ground-based telescopes with advanced adaptive op-tics systems, there remains much to be gained from sim-ple disk-integrated observations. The aim of this paper isto highlight and demonstrate those measurements likely tobe of most use, rather than to be a guide to observing tech-niques per se.
As an example, Titan’s photometric variability wasknown from historical compilations (e.g. Andersson, 1977)of earlier observation, but signi6cant progress was not madeuntil systematic monitoring by Wes Lockwood and col-leagues at Lowell Observatory—using a modest telescope,but one dedicated to obtaining a consistent photometrydataset of the outer planets and Titan over some 30 years, adataset which has helped understanding of Titan’s seasonalcycle (e.g. Lockwood and Thompson, 1999; Lorenz et al.,1997, 1999).
∗ Corresponding author. Tel.: +1-520-621-5585; fax: +1-520-621-4933.
E-mail address: [email protected] (R.D. Lorenz).
Titan’s spectrum is very distinct from that of stars andother planetary satellites in that it shows strong methaneabsorption bands. These were responsible for Kuiper’s dis-covery of Titan’s atmosphere in 1944. Spectrophotometricmeasurements in the near-infrared generated a ‘modern’Titan spectrum as early as 1967 (McCord et al., 1971)but it was only in the early 1990s that it was realized thatTitan shows short-term variability in the near-infrared, inthe windows between methane bands. Noll and Knacke(1993) using data from Cruikshank and Morgan (1980)augmented by data of their own noted some system-atic variation of near-infrared brightness with longitude;Lemmon et al. (1993) independently showed that Titan’sspectrum in the windows is brighter on Titan’s leadinghemisphere. Coustenis et al. (1995), GriIth (1995) andLemmon et al. (1995) con6rmed these results. Cousteniset al. (1995), GriIth et al. (1991) and Lemmon etal. (1995) applied haze scattering and methane absorp-tion models to attempt to derive surface reJectivities (andthereby constrain surface composition) using these data.
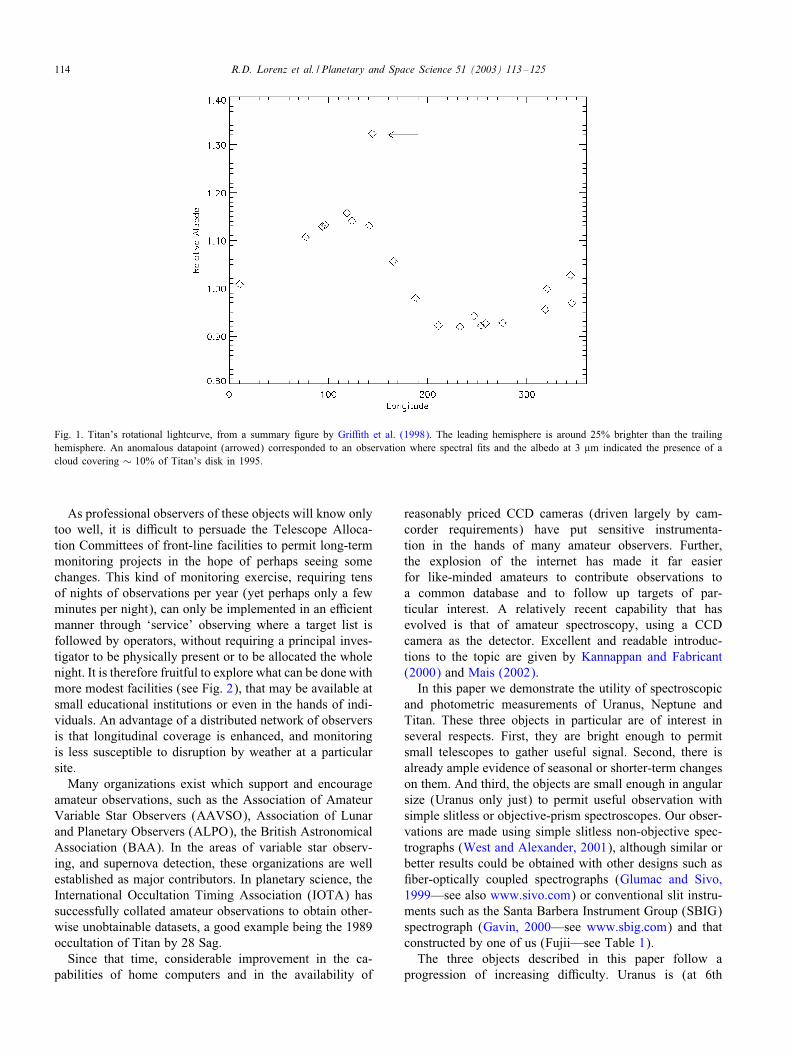
Titan, whose near-infrared lightcurve was ostensibly rea-sonably well known, appears to have variations in albedothat are not correlated with longitude and are interpretedto indicate cloud activity (see Fig. 1 and GriIth et al.,1998). Only continued monitoring permitted the detectionof anomalous brightening attributable to weather activity(GriIth et al., 1998, 2000).
0032-0633/03/$ - see front matter ? 2003 Elsevier Science Ltd. All rights reserved.PII: S0032 -0633(02)00141 -1
114 R.D. Lorenz et al. / Planetary and Space Science 51 (2003) 113–125
Fig. 1. Titan’s rotational lightcurve, from a summary 6gure by GriIth et al. (1998). The leading hemisphere is around 25% brighter than the trailinghemisphere. An anomalous datapoint (arrowed) corresponded to an observation where spectral 6ts and the albedo at 3 �m indicated the presence of acloud covering ∼ 10% of Titan’s disk in 1995.
As professional observers of these objects will know onlytoo well, it is diIcult to persuade the Telescope Alloca-tion Committees of front-line facilities to permit long-termmonitoring projects in the hope of perhaps seeing somechanges. This kind of monitoring exercise, requiring tensof nights of observations per year (yet perhaps only a fewminutes per night), can only be implemented in an eIcientmanner through ‘service’ observing where a target list isfollowed by operators, without requiring a principal inves-tigator to be physically present or to be allocated the wholenight. It is therefore fruitful to explore what can be done withmore modest facilities (see Fig. 2), that may be available atsmall educational institutions or even in the hands of indi-viduals. An advantage of a distributed network of observersis that longitudinal coverage is enhanced, and monitoringis less susceptible to disruption by weather at a particularsite.
Many organizations exist which support and encourageamateur observations, such as the Association of AmateurVariable Star Observers (AAVSO), Association of Lunarand Planetary Observers (ALPO), the British AstronomicalAssociation (BAA). In the areas of variable star observ-ing, and supernova detection, these organizations are wellestablished as major contributors. In planetary science, theInternational Occultation Timing Association (IOTA) hassuccessfully collated amateur observations to obtain other-wise unobtainable datasets, a good example being the 1989occultation of Titan by 28 Sag.
Since that time, considerable improvement in the ca-pabilities of home computers and in the availability of
reasonably priced CCD cameras (driven largely by cam-corder requirements) have put sensitive instrumenta-tion in the hands of many amateur observers. Further,the explosion of the internet has made it far easierfor like-minded amateurs to contribute observations toa common database and to follow up targets of par-ticular interest. A relatively recent capability that hasevolved is that of amateur spectroscopy, using a CCDcamera as the detector. Excellent and readable introduc-tions to the topic are given by Kannappan and Fabricant(2000) and Mais (2002).
In this paper we demonstrate the utility of spectroscopicand photometric measurements of Uranus, Neptune andTitan. These three objects in particular are of interest inseveral respects. First, they are bright enough to permitsmall telescopes to gather useful signal. Second, there isalready ample evidence of seasonal or shorter-term changeson them. And third, the objects are small enough in angularsize (Uranus only just) to permit useful observation withsimple slitless or objective-prism spectroscopes. Our obser-vations are made using simple slitless non-objective spec-trographs (West and Alexander, 2001), although similar orbetter results could be obtained with other designs such as6ber-optically coupled spectrographs (Glumac and Sivo,1999—see also www.sivo.com) or conventional slit instru-ments such as the Santa Barbera Instrument Group (SBIG)spectrograph (Gavin, 2000—see www.sbig.com) and thatconstructed by one of us (Fujii—see Table 1).
The three objects described in this paper follow aprogression of increasing diIculty. Uranus is (at 6th

R.D. Lorenz et al. / Planetary and Space Science 51 (2003) 113–125 115
Fig. 2. Author Doug West with observing equipment. Moderncomputer-guided telescopes can be set up within a few minutes, makinga permanent observatory installation largely unnecessary. For monitor-ing projects the small manpower overhead in setup outweighs the largeraperture of mountaintop observatories.
magnitude) by far the brightest of the three, and easily iden-ti6ed against the stars by its perceptible disk. Neptune isconsiderably fainter (8th magnitude) and smaller, and isperhaps most easily identi6ed in a star 6eld by its spectrum.Finally, Titan is of comparable faintness to Neptune, but itsspectrum must be pulled out of a much brighter backgrounddue to scattered light from Saturn. This e3ect is a particularissue for small telescopes.
2. Spectroscopy of Uranus
Fig. 3 shows a spectrum of Uranus obtained with ama-teur equipment in RL’s home backyard. The site is approx.2 km East of the University of Arizona at an altitude ofapprox. 800 m. The equipment used was an alt-az mountedSchmitt–Cassegrain Telescope (SCT) with a 20 cm aper-ture (Meade LX200 8′′). The detector was a commercial
512 × 290 CCD camera (Starlight Express MX5) with a4:9× 3:6 mm2 chip, a built-in Peltier cooler and 16-bit dig-itization, read out via a parallel interface to a laptop com-puter. A blazed 200 line=mm di3raction grating (RainbowOptics Star Spectroscope) was placed in the optical pathto operate as a slitless spectroscope. The telescope, cameraand grating cost about $2500 (although mechanically lighterbut optically equivalent telescopes are around half of thiscost), $1000 and $200, respectively. The exposure time was60 s.
The grating, equipped with a screw thread, was attachedto the front of the camera as would an ordinary optical 6lter.The grating is therefore some 4 cm or so in front of theCCD chip, and the dispersion such that the zeroth-orderimage of the object under study, and its 6rst-order spectrum,cannot both 6t on the image. For bright objects, this is nota signi6cant obstacle, since the source of the spectrum canbe readily identi6ed. An alternative approach requires somemachining to place the grating closer to the chip. Some trialand error is needed to adjust the orientation of the gratingsuch that the dispersion occurs along rows of pixels, whichis most convenient for data analysis. The grating could alsobe inserted in a 6lter wheel.
Tracking glitches and 6eld rotation of a few pixels tendto occur in alt-az tracking mode with exposures longerthan about 1 min. Since the observation cycle (acquisition,download and inspection) is of order a minute, however,only moderate persistence is required to obtain a subset ofadequate results. For fainter objects or fainter parts of thespectrum, many short (and therefore unsmeared) exposurescan be stacked computationally—public-domain softwareexists to perform this stacking, which is straightforwardproviding the total time-span occupied by the exposures isnot so large that signi6cant 6eld-rotation occurs, althoughthat too can be corrected computationally. It may also benoted that in addition to the more familiar IRAF packages,easy-to-use public-domain software speci6cally designedfor the reduction of CCD spectra in a Windows environ-ment is also available—see, e.g. the Visual Spec (VSPEC)software package at http://valerie.desnoux.free.fr/vspec/.
Note that the solar spectrum, convolved with Uranus’albedo and the responsivity of this CCD detector, are suchthat there is no need for order-separation 6lters, providedthe wavelength range studied extends to less than 700 nm,since typical CCD sensitivities only become signi6cantabove 350 nm. It may be noted that the (blazed) RainbowOptics grating used here puts 10% or less of the light intothe second order.
Although more sophisticated wavelength calibrationscan be applied, the spectrum shown in Fig. 2 was obtainedsimply by relating wavelength by a polynomial (in thisinstance, two terms only—a linear function) and adjustingthe polynomial terms by trial and error until the best matchwith the published spectrum was found. The responsivity ofthe CCD was corrected for by similarly analyzing a spec-trum of Vega (admittedly at a rather higher airmass) which
116 R.D. Lorenz et al. / Planetary and Space Science 51 (2003) 113–125
Table 1Observing sites and equipment
Observer Site Equipment
West Mulvane, KS, USA 0:2 m SCT (Meade LX200) at f/6.337◦28′N 97◦15′W SBIG ST-8 CCD as slitless non-objective spectrograph usingaltitude 300 m Rainbow Optics 200 grooves=mm blazed transmission grating
and Murnaghan I,V 6lters
Lorenz Tucson AZ, USA 0:2 m SCT (Meade LX200) at f/1032◦12′N 111◦54′W Starlight Express MX516 CCD as slitless spectrograph usingaltitude 700 m Rainbow Optics 200 grooves=mm blazed transmission grating
Dooley Tucson AZ, USA 0:53 m Cassegrain at f/5.632◦11′N 111◦54′W Starlight Express MX516 CCD with Coherent Opticsaltitude 700 m narrowband 6lters
Fujii Okayama, Japan 0:28 m SCT (Celestron C11) at f/1034◦40′N 133◦32′E SBIG ST-6 CCD coupled to homebuilt spectrograph usingaltitude 400 m Bausch & Lomb 600 grooves=mm reJectance grating
0:1 mm slit on Al coated glass150 mm focal length 25 mm diameter collimator mirror50 mm Canon camera lens (f/1.4)
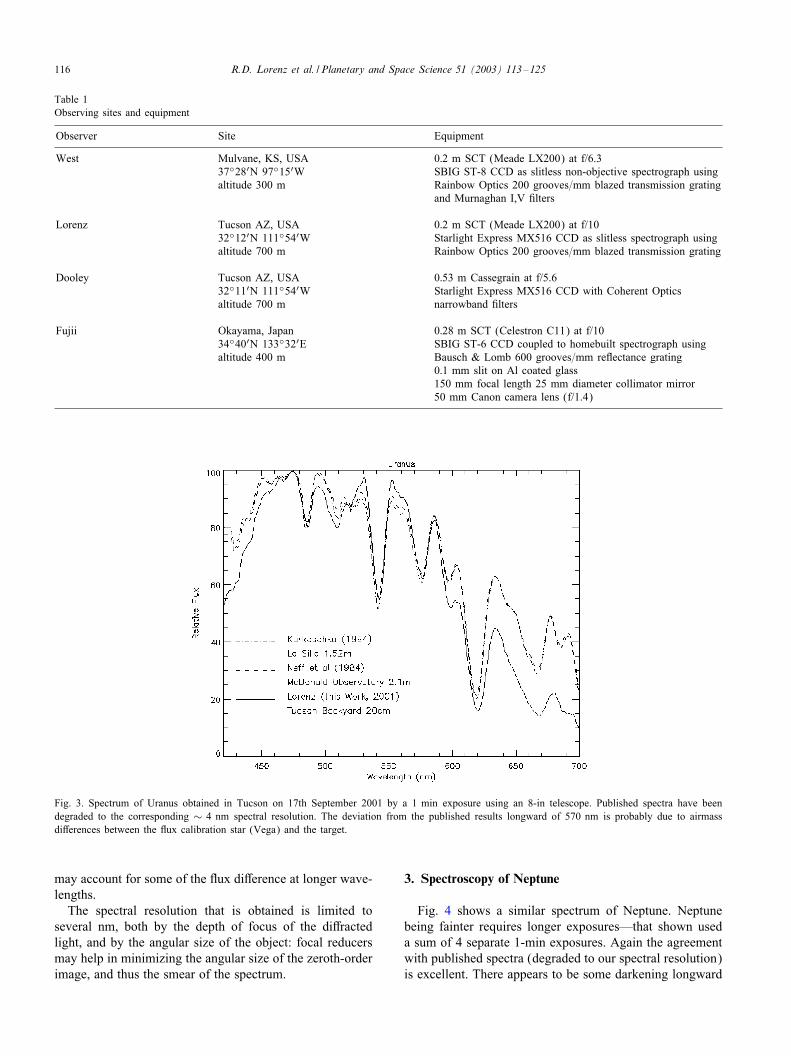
Fig. 3. Spectrum of Uranus obtained in Tucson on 17th September 2001 by a 1 min exposure using an 8-in telescope. Published spectra have beendegraded to the corresponding ∼ 4 nm spectral resolution. The deviation from the published results longward of 570 nm is probably due to airmassdi3erences between the Jux calibration star (Vega) and the target.
may account for some of the Jux di3erence at longer wave-lengths.
The spectral resolution that is obtained is limited toseveral nm, both by the depth of focus of the di3ractedlight, and by the angular size of the object: focal reducersmay help in minimizing the angular size of the zeroth-orderimage, and thus the smear of the spectrum.
3. Spectroscopy of Neptune
Fig. 4 shows a similar spectrum of Neptune. Neptunebeing fainter requires longer exposures—that shown useda sum of 4 separate 1-min exposures. Again the agreementwith published spectra (degraded to our spectral resolution)is excellent. There appears to be some darkening longward

R.D. Lorenz et al. / Planetary and Space Science 51 (2003) 113–125 117
Fig. 4. Spectrum of Neptune obtained in Tucson on 23rd September 2001 by summing four 1-min exposures using an 8-in telescope. Published spectrahave been degraded to the corresponding ∼ 4 nm spectral resolution. The deviation from the published results around 640 nm again is probably due toairmass di3erences in Jux calibration.
of 570 nm—although this is consistent with the trend ob-served by Karkoschka (1998) between 1993 and 1995 itseems a little strong, and a likely explanation is that theJux calibration star Vega was at a lower airmass than Nep-tune. This exercise is intended as a proof-of-concept only,however, and it is clear that even this simple equipment canobtain useful results: with more careful use of calibrationstars seasonal and possibly cloud-related changes may bemonitored.
4. Spectroscopy of Titan
Fig. 5 shows a spectrum of Titan obtained with a smalltelescope and a 1 min exposure. Note that the CCD cameraused in this case was an SBIG ST-8; this camera has a betternear-infrared response than the Starlight Express unit usedfor Uranus and Neptune, and thus the wavelength rangeshown is slightly redder.
To obtain the Titan spectrum from the image, scat-tered light from Saturn had to be removed by interpolation(i.e. subtracting the mean of the rows of pixels above andbelow those containing the Titan spectrum). This back-ground amounts typically to a signi6cant fraction of theTitan signal (one quarter at the peak Titan wavelength):although it is not diIcult to 6nd the Titan signal andremove the background such that the spectrum is recogniz-ably that of Titan, quantitative interpretation will requirethat the scattered light problem be tackled with extremecare.
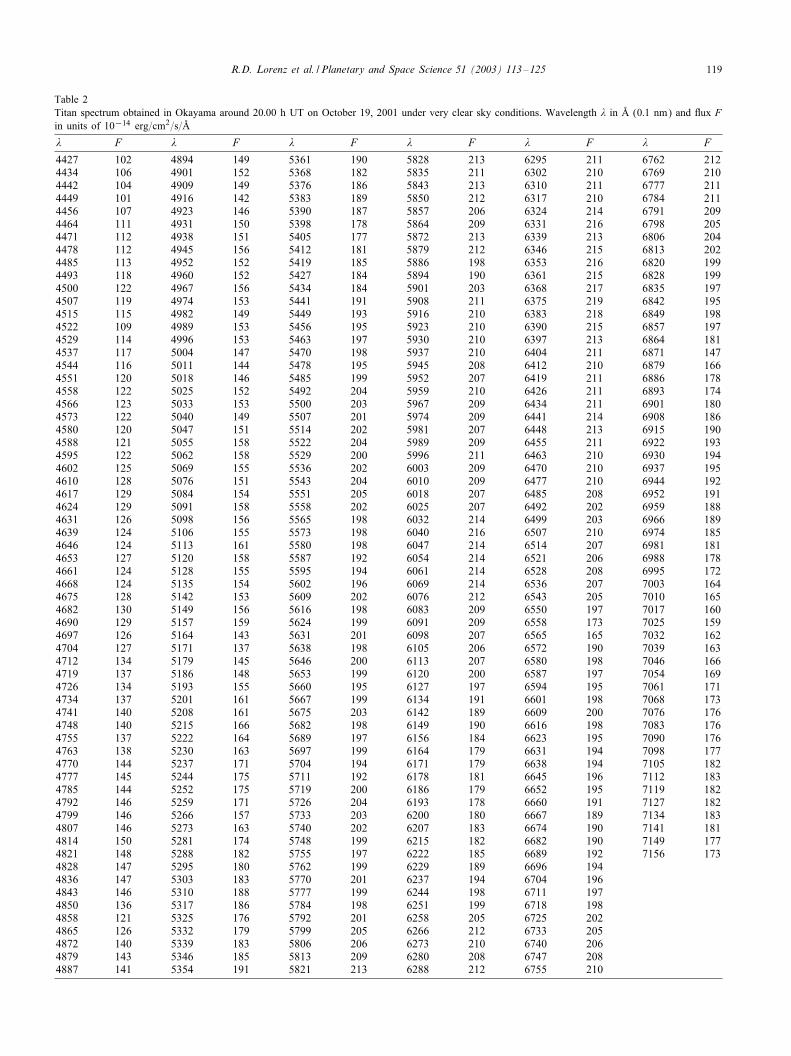
Rather better results can be obtained with conventionalslit spectrometers. An example is the unit by SBIG, whichsells for around $4000. One of us (Fujii) has built a sim-ilar instrument and the resultant spectrum, of Titan with aresolution of about 1 nm is given in Tables 2 and 3 andshown in Figs. 6 and 7. Other details and spectra can beinspected at http://www1.harenet.ne.jp/∼aikow/. Flux cal-ibration was performed by observing the 4th magnitudestandard HR 1544 which was at the same (within 1◦ or2◦) airmass as Titan—the calibration spectrum was down-loaded from the website of the European Southern Obser-vatory. Wavelength calibration was performed using a neonlamp.
Both the darkening towards the blue and a feature ataround 550 nm may be a real seasonal change, associatedwith the methane band at that wavelength. Some weakbrightening relative to previously published spectra mayalso be apparent in the 619 nm methane band, detail ofwhich is shown in Fig. 6 where the reproducibility of theobservations (and equivalently, the apparent short-termnonvariability of Titan) is evident from the agreement ofseveral nights’ spectra taken over a period spanning threemonths.
5. Photometry of Titan
In an attempt to measure a lightcurve for Titan andpossibly search for cloud activity, we also performedphotometry on Titan in December 2000 to March 2001.

118 R.D. Lorenz et al. / Planetary and Space Science 51 (2003) 113–125
Fig. 5. Spectrum of Titan obtained on 16th December 2000 from a 1-min exposure with an 8-in telescope. Darkening at visible wavelengths is consistentwith trend observed 1993–1995 by Karkoschka. The poorer quality of this spectrum is apparent—Titan would clearly bene6t from longer exposures—butit is recognizably Titan.
Johnson V and Kron-Cousins I-band measurements weretaken. (Kron-Cousins 6lters are designed to match mag-nitudes established with these 6lters and CCD detectorswith photographic magnitudes taken with the widely-usedJohnson 6lter system, compensating for the di3erent spec-tral responsivities of the detectors.) The I-band 6lter hasa full-width at half-maximum of 150 nm, centered around800 nm, and the V-band is 90 nm wide, centered at 550 nm.It may be noted that this is one of the largest photometricdatasets ever published on Titan (see Andersson, 1977).
It was hoped that a longitudinal lightcurve would be de-tectable with the I-6lter, since this 6lter probes the methanewindow at around 830 nm, and that this lightcurve wouldhave an order of 5% (based on the strength of the lightcurveat 940 nm). This corresponds to a variation of 0.05–0.10magnitudes.
The observed magnitudes were reduced to a normalizedform (i.e. the corresponding zero-phase angle magnitude at1 AU from the sun, 1 AU from the Earth) by the formula
I(1; 0) = Io + 5 log10(r�) − k�;
where r is the distance from the sun in AU, � the distancefrom Earth and � the phase angle at the time the ob-served magnitude Io was recorded. k is a phase coeIcient(0.055 magnitudes/deg for V-band, 0.001 magnitudes/degfor I-band: this empirical coeIcient—see, e.g. Lockwoodet al., 1986—takes into account both the phase angledependence of Titan’s surface brightness, as well as thepurely geometric dependence of total brightness due to the
illuminated area fraction). Details of the calibration starsused are available on request—the data themselves are givenin Table 1.
Fig. 8 shows the results—a variation of rather largerthan expected amplitude was found, and not of the ex-pected pattern. While the short-wavelength window we areprobing would be sensitive to cloud e3ects, it seems thatascribing such a cause is not justi6ed. It is notable that theextreme brightness values are apparent near longitudes 0and 180, in other words when Titan is closest to Saturnas seen in the sky. Photometric observations by Schmudeet al. (1993), also with a small telescope, show strongscattered light in the vicinity of Titan, varying by abouthalf-to-one magnitude per ring diameter—see also Gennetand Binzel (1983). Thus small errors in background sub-traction can lead to signi6cant errors in the photometry ofTitan.
The challenges of the lightcurve notwithstanding, the av-erage magnitudes obtained are likely to be more robust, sincethey only depend on absolute (rather than longitude-relative)background subtraction error. The average values obtainedare V (1; 0) =−1:29± 0:08 and I(I; 0) =−2:03± 0:06. TheV magnitude of Titan corresponds closely to the Stromgreny-magnitude recorded by Lockwood et al. over the years(see, e.g. Lorenz et al., 1999), and our data point seems tofall on the expected curve.
We also performed narrowband CCD photometry us-ing the University of Arizona campus 21′′ telescope andnarrowband 6lters. The 6lters were chosen to be centeredon a methane band and a window, at 790 and 750 nm,
R.D. Lorenz et al. / Planetary and Space Science 51 (2003) 113–125 119
Table 2Titan spectrum obtained in Okayama around 20:00 h UT on October 19, 2001 under very clear sky conditions. Wavelength � in SA (0:1 nm) and Jux Fin units of 10−14 erg=cm2=s= SA
� F � F � F � F � F � F
4427 102 4894 149 5361 190 5828 213 6295 211 6762 2124434 106 4901 152 5368 182 5835 211 6302 210 6769 2104442 104 4909 149 5376 186 5843 213 6310 211 6777 2114449 101 4916 142 5383 189 5850 212 6317 210 6784 2114456 107 4923 146 5390 187 5857 206 6324 214 6791 2094464 111 4931 150 5398 178 5864 209 6331 216 6798 2054471 112 4938 151 5405 177 5872 213 6339 213 6806 2044478 112 4945 156 5412 181 5879 212 6346 215 6813 2024485 113 4952 152 5419 185 5886 198 6353 216 6820 1994493 118 4960 152 5427 184 5894 190 6361 215 6828 1994500 122 4967 156 5434 184 5901 203 6368 217 6835 1974507 119 4974 153 5441 191 5908 211 6375 219 6842 1954515 115 4982 149 5449 193 5916 210 6383 218 6849 1984522 109 4989 153 5456 195 5923 210 6390 215 6857 1974529 114 4996 153 5463 197 5930 210 6397 213 6864 1814537 117 5004 147 5470 198 5937 210 6404 211 6871 1474544 116 5011 144 5478 195 5945 208 6412 210 6879 1664551 120 5018 146 5485 199 5952 207 6419 211 6886 1784558 122 5025 152 5492 204 5959 210 6426 211 6893 1744566 123 5033 153 5500 203 5967 209 6434 211 6901 1804573 122 5040 149 5507 201 5974 209 6441 214 6908 1864580 120 5047 151 5514 202 5981 207 6448 213 6915 1904588 121 5055 158 5522 204 5989 209 6455 211 6922 1934595 122 5062 158 5529 200 5996 211 6463 210 6930 1944602 125 5069 155 5536 202 6003 209 6470 210 6937 1954610 128 5076 151 5543 204 6010 209 6477 210 6944 1924617 129 5084 154 5551 205 6018 207 6485 208 6952 1914624 129 5091 158 5558 202 6025 207 6492 202 6959 1884631 126 5098 156 5565 198 6032 214 6499 203 6966 1894639 124 5106 155 5573 198 6040 216 6507 210 6974 1854646 124 5113 161 5580 198 6047 214 6514 207 6981 1814653 127 5120 158 5587 192 6054 214 6521 206 6988 1784661 124 5128 155 5595 194 6061 214 6528 208 6995 1724668 124 5135 154 5602 196 6069 214 6536 207 7003 1644675 128 5142 153 5609 202 6076 212 6543 205 7010 1654682 130 5149 156 5616 198 6083 209 6550 197 7017 1604690 129 5157 159 5624 199 6091 209 6558 173 7025 1594697 126 5164 143 5631 201 6098 207 6565 165 7032 1624704 127 5171 137 5638 198 6105 206 6572 190 7039 1634712 134 5179 145 5646 200 6113 207 6580 198 7046 1664719 137 5186 148 5653 199 6120 200 6587 197 7054 1694726 134 5193 155 5660 195 6127 197 6594 195 7061 1714734 137 5201 161 5667 199 6134 191 6601 198 7068 1734741 140 5208 161 5675 203 6142 189 6609 200 7076 1764748 140 5215 166 5682 198 6149 190 6616 198 7083 1764755 137 5222 164 5689 197 6156 184 6623 195 7090 1764763 138 5230 163 5697 199 6164 179 6631 194 7098 1774770 144 5237 171 5704 194 6171 179 6638 194 7105 1824777 145 5244 175 5711 192 6178 181 6645 196 7112 1834785 144 5252 175 5719 200 6186 179 6652 195 7119 1824792 146 5259 171 5726 204 6193 178 6660 191 7127 1824799 146 5266 157 5733 203 6200 180 6667 189 7134 1834807 146 5273 163 5740 202 6207 183 6674 190 7141 1814814 150 5281 174 5748 199 6215 182 6682 190 7149 1774821 148 5288 182 5755 197 6222 185 6689 192 7156 1734828 147 5295 180 5762 199 6229 189 6696 1944836 147 5303 183 5770 201 6237 194 6704 1964843 146 5310 188 5777 199 6244 198 6711 1974850 136 5317 186 5784 198 6251 199 6718 1984858 121 5325 176 5792 201 6258 205 6725 2024865 126 5332 179 5799 205 6266 212 6733 2054872 140 5339 183 5806 206 6273 210 6740 2064879 143 5346 185 5813 209 6280 208 6747 2084887 141 5354 191 5821 213 6288 212 6755 210

120 R.D. Lorenz et al. / Planetary and Space Science 51 (2003) 113–125
Table 3Instrumental photometric magnitudes for Titan
Calendar date Time (CST) Band, mag, Comparison stars Note
12/4/00 18:47 V, 8.06 TYC 1239 553, TYC 1239 753 1 712/16/00 18:24 V, 8.067 TYC 1238 1126 1, TYC 1238 1120 1, TYC 1234 705 1 312/21/00 18:20 V, 8.198 HIP 16538, HIP 16469, TYC 1234 705 1a; HIP 16598 112/21/00 18:32 I, 7.38 HIP 16538, HIP 16469 112/22/00 18:58 V, 8.151 HIP 16538, HIP 16469, TYC 1234 705 1a 112/22/00 19:23 I, 7.315 HIP 16469, HIP 16538 112/29/00 19:51 V, 8.195 HIP 16469 2, 412/29/00 20:48 I, 7.276 HIP 16469 2, 41/3/01 21:14 V, 8.176 HIP 16268 11/3/01 20:42 I, 7.472 HIP 16268 11/4/01 21:14 V, 8.124 HIP 16268 11/4/01 20:43 I, 7.358 HIP 16268 11/5/01 19:34 V, 8.202 HIP 16268 31/14/01 20:06 V, 8.103 HIP 16268, TYC 1234 288 1 1, 21/14/01 20:28 I, 7.418 HIP 16268, TYC 1234 288 1 1, 21/17/01 20:17 V, 8.153 HIP 16268, TYC 1234 288 1, HIP 16117 11/17/01 19:56 I, 7.425 HIP 16268, TYC 1234 288 1 11/18/01 20:17 V, 8.141 HIP 16268, TYC 1234 288 1, HIP 16117 11/18/01 19:56 I, 7.466 HIP 16268, TYC 1234 288 1, HIP 16117 11/19/01 20:49 V, 8.199 HIP 16268, TYC 1234 288 1, HIP 16117 11/19/01 21:02 I, 7.490 HIP 16268, TYC 1234 288 1, HIP 16117 11/22/01 19:07 V, 8.011 HIP 16268, TYC 1234 288 1, HIP 16117 1, 21/22/01 18:42 I, 7.378 HIP 16268, TYC 1234 288 1, HIP 16117 1, 21/24/01 20:15 V, 8.200 HIP 16268, TYC 1234 288 1, HIP 16117 11/24/01 18:42 I, 7.489 HIP 16268, TYC 1234 288 1, HIP 16117 11/26/01 21:44 V, 8.149 HIP 16268, TYC 1234 288 1 11/26/01 21:20 I, 7.410 HIP 16268, TYC 1234 288 1 11/29/01 21:29 V, 8.225 HIP 16268, TYC 1234 288 1 11/29/01 21:23 I, 7.471 HIP 16268, TYC 1234 288 1 11/31/01 21:21 V, 8.28 HIP 16268, TYC 1234 288 1 101/31/01 21:31 I, 7.506 HIP 16268, TYC 1234 288 1 102/01/01 19:16 V, 8.225 HIP 16268, TYC 1234 288 1, HIP 16117 12/01/01 19:10 I, 7.504 HIP 16268, TYC 1234 288 1, HIP 16117 12/03/01 19:56 V, 8.229 HIP 16268, TYC 1234 288 1, HIP 16152 12/03/01 19:45 I, 7.481 HIP 16268, HIP 16152 12/04/01 20:39 V, 8.209 HIP 16268, TYC 1234 288 1 12/04/01 20:34 I, 7.525 HIP 16268, TYC 1234 288 1 12/09/01 18:54 V, 8.248 HIP 16268, TYC 1234 288 1 12/09/01 19:09 I, 7.501 HIP 16268, TYC 1234 288 1 12/10/01 19:30 V, 8.275 HIP 16268, TYC 1234 288 1 12/10/01 19:25 I, 7.528 HIP 16268, TYC 1234 288 1 12/11/01 19:27 V, 8.292 HIP 16268 12/11/01 19:00 I, 7.560 HIP 16268 12/15/01 19:24 V, 8.292 HIP 16268 52/15/01 19:00 I, 7.729 HIP 16268 52/16/01 19:08 V, 8.309 TYC 1238 68 1a, TYC 1238 141 1, TYC 1238 66 1, TYC 1238 25 1 92/16/01 19:15 I, 7.557 TYC 1238 68 1a, TYC 1238 141 1, TYC 1238 66 1, TYC 1238 25 1 62/17/01 21:09 V, 8.345 TYC 1238 68 1a, TYC 1238 141 1, TYC 1238 66 1, TYC 1238 25 1a, HIP 16469a 62/17/01 21:14 I, 7.712 TYC 1238 68 1a, TYC 1238 141 1, TYC 1238 66 1, TYC 1238 25 1 102/18/01 19:54 V, 8.370 TYC 1238 68 1, TYC 1238 141 1, TYC 1238 66 1, TYC 1238 25 1 92/18/01 20:09 I, 7.664 TYC 1238 68 1, TYC 1238 141 1, TYC 1238 66 1, TYC 1238 25 1 92/19/01 19:28 V, 8.391 TYC 1238 68 1, TYC 1238 141 1, TYC 1238 66 1a,TYC 1238 25 1a 92/19/01 19:40 I, 7.603 TYC 1238 68 1, TYC 1238 141 1, TYC 1238 66 1, TYC 1238 25 1 92/22/01 19:39 V, 8.078 HIP 16538 2, 112/22/01 19:51 I, 7.266 HIP 16538 2, 112/25/01 20:03 V, 8.419 HIP 16598, TYC 1238 550 1, HIP 16512 12/25/01 20:24 I, 7.670 HIP 16598, HIP 16512 13/3/01 19:51 V, 8.424 TYC 1234 705 1, TYC 1238 1126 1, HIP 16598, TYC 1238 550 1 103/3/01 19:28 I, 7.604 TYC 1234 705 1, HIP 16598, TYC 1238 550 1 103/4/01 20:26 V, 8.400 HIP 16641, HIP 16598, TCY 1238 1126 1, TYC 1234 705 1 103/4/01 20:14 I, 7.668 HIP 16469, HIP 16598, TYC 1234 705 1 103/5/01 19:49 V, 8.436 HIP 16641, TYC 1238 1126 1, HIP 16598 10

R.D. Lorenz et al. / Planetary and Space Science 51 (2003) 113–125 121
Table 3 (continued)
Calendar date Time (CST) Band, mag, Comparison stars Note
3/5/01 19:30 I, 7.677 HIP 16641, HIP 16598 103/12/01 20:02 V, 8.346 HIP 16802, TYC 1239 9201 1 13/12/01 19:57 I, 7.618 HIP 16802 13/13/01 19:22 V, 8.362 TYC 1239 920 1, TYC 1239 1016 1, TYC 1239 553 1, TYC 1239 753 1 33/17/01 19:52 V, 8.486 HIP 16983, TYC 1239 998 1, TYC 1239 147 1, TYC 1239 629 1 10, 113/17/01 19:38 I, 7.707 HIP 16983 10, 11
aGiven a photometric weight of 0.5 in MIRA software due to residual¿ 0:1.Notes: 1. Average magnitude from measurement of two images per band. 2. Titan was very close to Saturn, Saturn’s glare a3ected photometry. 3.
Two V band measurements, no I band measurements. 4. Two V band measurements, one I band measurement. 5. Clouds resulted in lower s=n. Three offour observations had s=n¡ 100. 6. Observation is average from measurements of two di3erent 6elds (di3erent comparison stars). 7. One measurementin V band only. 8. Larger dispersion in measurements than normal. 9. Average of three observations in that band, average weighted by the number ofreference stars used in individual observations. 10. Based on four observations per band, average weighted by the number of reference stars used toderive the magnitude. 11. Cloud cover resulted in some measurements with s=n¡ 100.
Fig. 6. Spectrum of Titan obtained by Mitsugu Fujii from an urban Japanese site on 10 October 2001. Flux calibration was performed against star HR1544(Pi2 Orionis), which was at the same altitude (59–60◦) during the observations as Titan, combining 4 exposures totalling 26 min. The observation useda homebuilt spectrograph with a 0:1 mm (7 arc s) slit, and hence permits much higher spectral resolution than the previous (slitless) spectra reported inthis paper. The agreement with published data is excellent. Slight darkening below 520 nm is probably a real seasonal change, as may be the apparentdepth of the 619 nm methane band. Bright feature at 550 nm is not yet explained.
respectively. These wavelengths (suggested to us byBouchez, pers. commun., 2001, Roe, pers. commun., 2001)are short enough in wavelength that our CCD has reason-able sensitivity, and the 750 nm window is free of signif-icant terrestrial water absorption (unlike the better known940 nm window). The 6lters we used were obtained fromCoherent Optics Inc. (part numbers 35-4266 and 35-4365,with measured central wavelengths of 753.4 and 792:7 nm,respectively, and FWHM bandpass of 11.2 and 10:6 nm).The bandpasses, together with those of the standard V; Iand R 6lters, are shown in Fig. 9. The 6lters we used lackantireJection coatings, which may have exacerbated the
scattered light problem and in our initial observing run.Although (Fig. 10) we would expect a ∼ 2% lightcurve,the scatter in our data was too large to discern the surfacelightcurve (and indeed was similar in both the 750 and790 nm 6lters).
Averaging the narrowband observations (10 nights)yields normalized (opposition) Juxes of 1:43 ± 0:26 ×10−12 erg=s=cm2=A (one sigma) for the 750 nm 6lter and0:74 ± 0:14 × 10−12 erg=s=cm2=A (one sigma) for the790 nm 6lter. With these errors, the 750 nm Jux is inagreement with the values (∼ 1:67 × 10−12 erg=s=cm2=A)reported by Lockwood et al. (1986), but the 790 nm Jux

122 R.D. Lorenz et al. / Planetary and Space Science 51 (2003) 113–125
Fig. 7. Detail of the 619 nm methane band in Titan’s spectrum. The symbols represent observations by Fujii on October 10th and 19th, December 2001,and 2nd and 6th January 2002. Narrowing and shallowing of the band would be expected were clouds to be present in the upper troposphere: no evidencefor cloud variations at a ∼ 10% level are seen. The band appears to by slightly (1–2%) shallower in 2001 than in the previous observations—perhapssymptomatic of the southern polar opacity observed in the lower atmosphere by Lorenz et al. (2001) and Roe et al. (2002).
Fig. 8. Photometry using amateur equipment. Top panel is a set of I-band observations over 3 months by West in late 2000/early 2001 plotted against orbitallongitude. The well-known lightcurve peaking around longitude 110 is not seen. The lower panel is the average of the corresponding V-band observations(solid circle with 1-sigma error bar) compared with y-photometry by Lockwood over the last 30 years—the backyard result seems quite reasonable.

R.D. Lorenz et al. / Planetary and Space Science 51 (2003) 113–125 123
Fig. 9. Titan albedo spectrum from Karkoschka (1995) with 6lter bandpasses superimposed. Note that the Kron–Cousins 6lters (Rc, Ic- dot-dash line)have substantially di3erent bandpasses from the Johnson 6lters (R, I) shown with dotted lines; V bandpasses are the same for both 6lter systems, butdo not sample a particularly interesting part of Titan’s spectrum. The e3ective wavelengths sensed will be modi6ed by the shape of the solar spectrum(biasing R and I towards shorter wavelengths) and the spectral sensitivity of the detector used. The narrowband 6lters used in this work at 750 and790 nm are shown with dashed lines.
Fig. 10. Titan’s lightcurve measured from a set of disk-integrated spectra recorded with the Space Telescope Imaging Spectrograph in 2000 (PI Young,see e.g. Lorenz et al., 2001). Symbols show normalized Titan Jux averaged unweighted over the wavelength ranges shown (i.e. the albedo curve isweighted by the solar Jux, but not by any assumed instrument responsivity.) The 940 nm window shows a ∼ 9% lightcurve, but this wavelength regionis signi6cantly a3ected by water vapor absorption and the responsivity of many amateur CCDs decline at this long wavelength. The broad 780–900 nmwavelength (simulating approximately the Johnson I-band 6lter) shows approximately a 2% lightcurve, as does a narrowband region centered on 750 nm,which is una3ected by water vapor.
appears to be lower at the two-sigma level: Lockwood gives∼ 1:0×10−12 erg=s=cm2=A. The drop in methane-band Juxwould be consistent with a reduction in the high-altitudehaze over Titan’s southern hemisphere which is presentlyexposed to the Earth (see Lorenz et al., 2001).
6. Conclusions
We have shown that small telescopes and relativelyinexpensive instrumentation can make useful contributionsin the study of the outer planets and Titan. This equipment,
124 R.D. Lorenz et al. / Planetary and Space Science 51 (2003) 113–125
and the manpower required to take and reduce the obser-vations, are well within the capabilities of most collegesand amateur astronomers. Observed spectra agree well withpublished results, and some seasonal change—consistentwith previously observed trends—can be detected.
Titan is a particularly attractive object to study spec-troscopically in coming years. Not only will interest beparticularly high owing to the imminent arrival of theCassini–Huygens mission, but there is a progression ofnovelty in studying it which encourages both amateursand astronomy students to pursue its study further. A 6rstspectrum shows clearly how Titan is very di3erent fromthe Galileans, reproducing Kuiper’s 1944 discovery. Morepatient monitoring over a few weeks should bring outTitan’s near-infrared lightcurve, reproducing work by Lem-mon, Coustenis, Noll, GriIth and others of 1992–1995(although technologically this discovery could have beenmade some 20 years earlier!). It remains to be seen whethersmall-telescope observations can repeat and extend upon—more particularly in a believable manner with a realistic andaccurate discussion of uncertainties—the detection of cloudson Titan. Successful observers are urged to contact the 6rstauthor and to publish their observations via the BAA, ALPOor through the referred literature. Although slitless observa-tions are of pedagogical interest and with care might showseasonal changes, the accuracy required for robust detectionof clouds may present too great a challenge to small-aperturetelescopes. Although our attempts at CCD photometry havemet with only limited success, more experienced observersand especially careful removal of scattered Saturn light canlikely do better. Conventional (slit) spectrometers seem too3er most promise for believable and robust results for Titan.
Another similar project of probable interest and useful-ness would be monitoring of Io for volcanic activity—Io oc-casionally shows dramatic brightening in the near-infraredas short as 1 �m. As for Titan’s surface and cloud con-trasts, these events are also much more easily detected atlonger wavelengths than those accessible to simple CCDcameras. A technological development that would consid-erably enhance small-telescope observers in these areas(since surface contrasts become 10–20% rather than onlya few, and contrasts associated with clouds may be evenlarger—see GriIth et al., 1998) would be low-cost andsensitive cameras able to operate in the 1–2 �m range. Anamateur infrared photometer for use in the J- and H-bandshas also recently been developed (G. Persha, pers. com-mun., see www.optecinc.com) although scattered Saturnlight presents severe diIculties to aperture photometry ofTitan (see e.g. Schmude, 1993).
Acknowledgements
The authors are grateful to the editors and Planetary andSpace Science for providing a forum for the discussionof these observations. J.M. Dooley was supported by the
Arizona Space Grant Consortium. We thank AntoninBouchez of Caltech and Henry Roe of Berkeley for dis-cussion of narrowband 6lters, and the Lunar and PlanetaryLaboratory and Astronomy department of the University ofArizona for making available a CCD camera and the cam-pus telescope respectively. Eliot Young and an anonymousreferee made suggestions which improved the paper.
References
Andersson, L.F., 1977. Variability of Titan—1896–1974. In: Burns, J.A.(Ed.), Planetary Satellites. University of Arizona Press, Tucson, pp.451–459.
Coustenis, A.C., Lellouch, E., Maillard, J-P., McKay, C.P., 1995. Titan’ssurface: composition and variability from near-infrared Albedo. Icarus118, 87–104.
Cruikshank, D.P., Morgan, J.S., 1980. Titan: suspected near-infraredvariability. Astrophys. J. 235, L53–L54.
Gavin, M., 2000. Backyard spectroscopy. Sky Telescope 57–62.Gennet, R., Binzel, R., 1983. Solar System Photometry Handbook.
Willmann-Bell, Richmond, VA.Glumac, N., Sivo, J., 1999. Building a 6ber-optic spectrograph. Sky
Telescope 134–139.GriIth, C.A., 1995. Evidence for surface heterogeneity on Titan. Nature
364, 511–514.GriIth, C.A., Owen, T., Wagener, R., 1991. Titan’s surface
and troposphere, investigated with ground-based, near-infraredobservations. Icarus 93, 362–378.
GriIth, C.A., Owen, T., Miller, G.A., Geballe, T., 1998. Transient cloudsin Titan’s lower atmosphere. Nature 395, 575–578.
GriIth, C.A., Hall, J.L., Geballe, T., 2000. Detection of daily clouds onTitan. Science 290, 509.
Kannappan, S., Fabricant, D., 2000. Getting the most from a CCDspectrograph. Sky Telescope 125–132.
Karkoschka, E., 1995. Spectrophotometry of the Jovian planets and Titanat 300- to 1000-nm wavelength: the methane spectrum. Icarus 111,174–192.
Karkoschka, E., 1998. Methane, ammonia, and temperature measurementsof the Jovian planets and Titan from CCD-spectrophotometry. Icarus133, 134–146.
Lemmon, M.T., Karkoschka, E., Tomasko, M., 1993. Titan’s rotation:surface feature observed. Icarus 103, 329–332.
Lemmon, M.T., Karkoschka, E., Tomasko, M., 1995. Titan’s rotationallight-curve. Icarus 113, 27–38.
Lockwood, G.W., Thompson, D.T., 1999. Photometric variability ofUranus, 1972–1996. Icarus 137, 2–12.
Lockwood, G.W., Lutz, B.L., Thompson, D.T., Bus, E.S., 1986. Thealbedo of Titan. Astrophys. J. 303, 511–530.
Lorenz, R.D., Smith, P.H., Lemmon, M.T., Karkoschka, E., Lockwood,G.W., Caldwell, J., 1997. Titan’s north–south asymmetry from HSTand Voyager imaging: comparisons with models and groundbasedphotometry. Icarus 127, 173–189.
Lorenz, R.D., Lemmon, M.T., Smith, P.H., Lockwood, G.W., 1999.Seasonal change on Titan observed with the hubble space telescopeWFPC-2. Icarus 142, 391–401.
Lorenz, R.D., Young, E.F., Lemmon, M.T., 2001. Titan’s smile and collar:HST observations of seasonal change 1994–2000. Geophys. Res. Lett.28, 4453–4456.
Mais, D., 2002. Amateur astronomical spectroscopy. Astronomy Now 16(3), 52–54.
McCord, T., Johnson, T.V., Elias, J.H., 1971. Saturn and its satellites:narrowband spectrophotometry (0.3–1:1 mm). Astrophys. J. 165,413–424.

R.D. Lorenz et al. / Planetary and Space Science 51 (2003) 113–125 125
Ne3, J.S., Humm, D.C., Bergstrahl, J.T., Cochran, A.L., Cochran, W.D.,Barker, E.S., Tull, R.G., 1984. Absolute spectrophotometry of Titan,Uranus and Neptune 3500–10; 500 SA. Icarus 60, 221–235.
Noll, K., Knacke, R.F., 1993. Titan: 1–5 micron photometry andspectrophotometry and a search for variability. Icarus 101,272–281.
Roe, H.G., de Pater, I., Macintosh, B.A., Gibbard, S., Max, C.E., Mckay,C.P., 2002. Titan’s atmosphere in late southern spring observed with
adaptive optics on the W.M. Keck II 10-Meter Telescope. Icarus 157,254–258.
Schmude Jr., R.W., Bruton, D., 1993. Wideband photometry of Titan in1992. IAPPP Commun. 51, 37–40.
West, J.D., Alexander, D.R., 2001. Design of a low-resolutionnon-objective slitless spectrograph. Astron. Society of the Paci6c,submitted for publication.