backpack colors - noyce foundation: improving …€¦ · second graders recorded the color of...
TRANSCRIPT
2nd Grade – 2007 Copyright ©2007 by Noyce Foundation. All rights reserved.
30
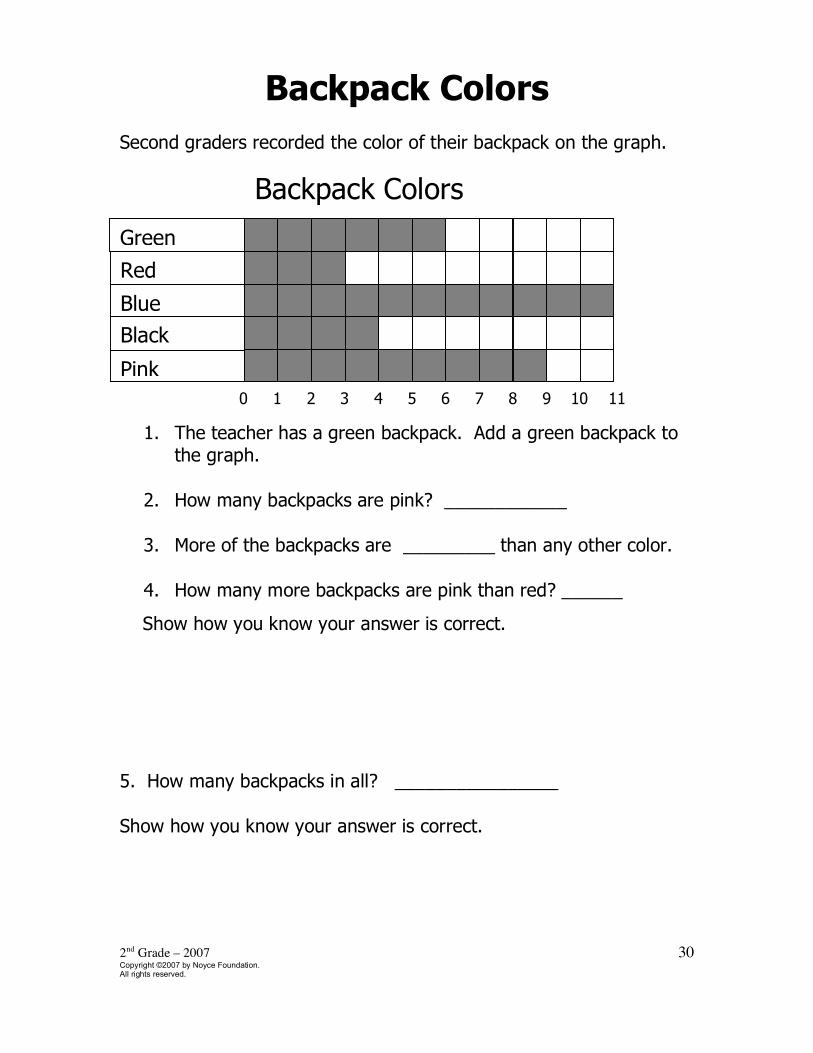
Backpack Colors Second graders recorded the color of their backpack on the graph.
1. The teacher has a green backpack. Add a green backpack to the graph.
2. How many backpacks are pink? ____________
3. More of the backpacks are _________ than any other color.
4. How many more backpacks are pink than red? ______
Show how you know your answer is correct.
5. How many backpacks in all? ________________
Show how you know your answer is correct.
Backpack Colors
Green Red Blue Black Pink 0 1 2 3 4 5 6 7 8 9 10 11
2nd Grade – 2007 Copyright ©2007 by Noyce Foundation. All rights reserved.
31
6. Write one new fact about this Backpack Colors graph.
___________________________________________________
___________________________________________________
7. Write another new fact about this Backpack Colors graph.
______________________________________________________
______________________________________________________
2nd Grade – 2007 Copyright ©2007 by Noyce Foundation. All rights reserved.
32
Backpack Colors Mathematics Assessment Collaborative
Performance Assessment Rubric Grade 2
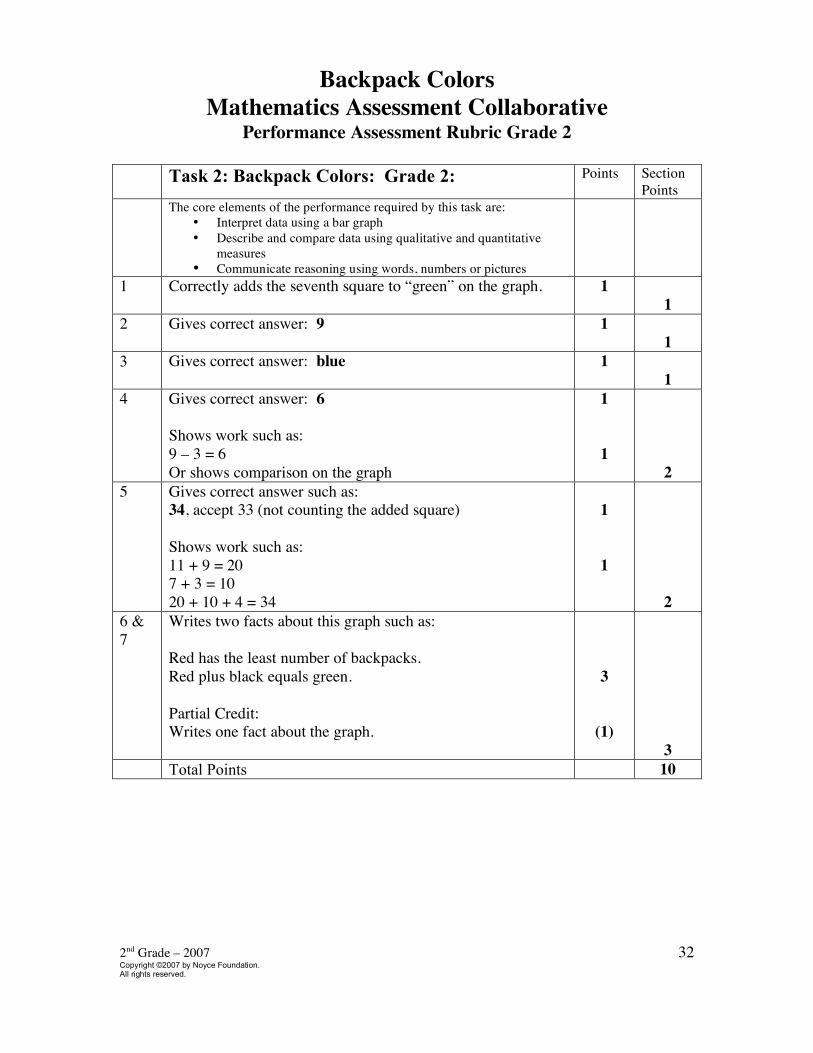
Task 2: Backpack Colors: Grade 2: Points Section Points
The core elements of the performance required by this task are: • Interpret data using a bar graph • Describe and compare data using qualitative and quantitative
measures • Communicate reasoning using words, numbers or pictures
1 Correctly adds the seventh square to “green” on the graph. 1 1
2 Gives correct answer: 9 1 1
3 Gives correct answer: blue 1 1
4 Gives correct answer: 6 Shows work such as: 9 – 3 = 6 Or shows comparison on the graph
1
1
2
5 Gives correct answer such as: 34, accept 33 (not counting the added square) Shows work such as: 11 + 9 = 20 7 + 3 = 10 20 + 10 + 4 = 34
1
1
2
6 & 7
Writes two facts about this graph such as: Red has the least number of backpacks. Red plus black equals green. Partial Credit: Writes one fact about the graph.
3
(1)
3
Total Points 10
2nd Grade – 2007 Copyright ©2007 by Noyce Foundation. All rights reserved.
33
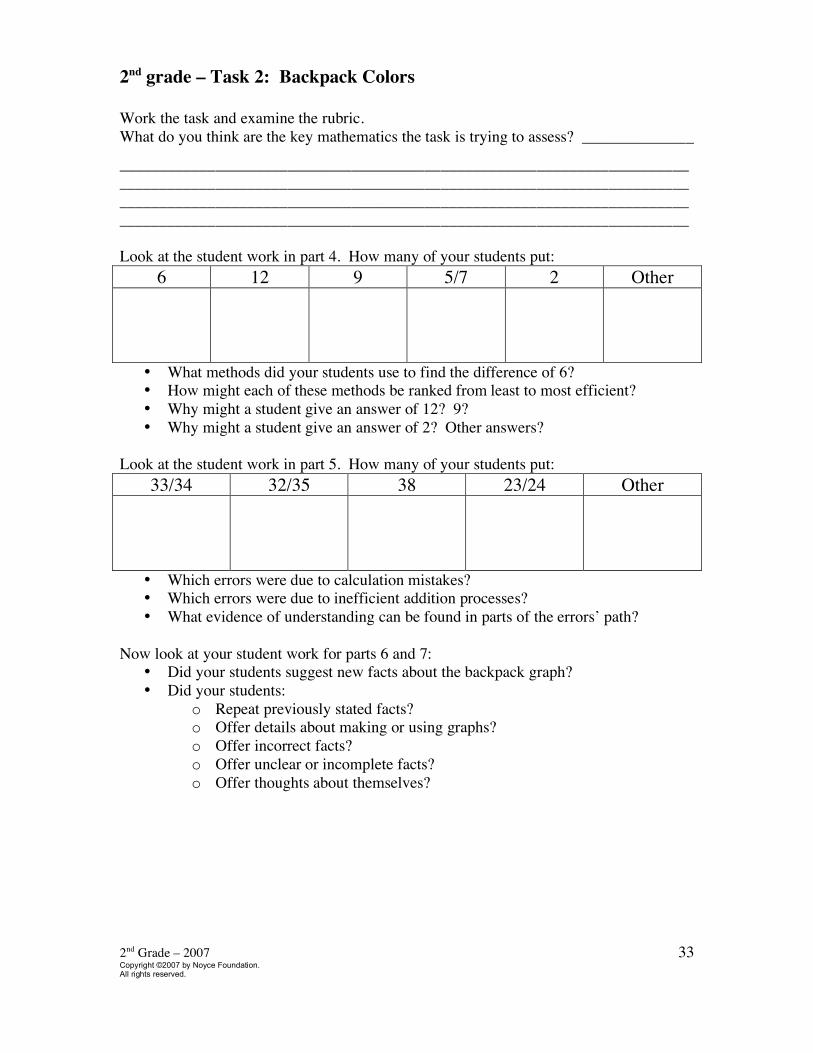
2nd grade – Task 2: Backpack Colors Work the task and examine the rubric. What do you think are the key mathematics the task is trying to assess? ______________
____________________________________________________________________________________________________________________________________________________________________________________________________________________________________________________________________________________________ Look at the student work in part 4. How many of your students put:
6 12 9 5/7 2 Other
• What methods did your students use to find the difference of 6? • How might each of these methods be ranked from least to most efficient? • Why might a student give an answer of 12? 9? • Why might a student give an answer of 2? Other answers?
Look at the student work in part 5. How many of your students put:
33/34 32/35 38 23/24 Other
• Which errors were due to calculation mistakes? • Which errors were due to inefficient addition processes? • What evidence of understanding can be found in parts of the errors’ path?
Now look at your student work for parts 6 and 7: • Did your students suggest new facts about the backpack graph? • Did your students:
o Repeat previously stated facts? o Offer details about making or using graphs? o Offer incorrect facts? o Offer unclear or incomplete facts? o Offer thoughts about themselves?
2nd Grade – 2007 Copyright ©2007 by Noyce Foundation. All rights reserved.
34
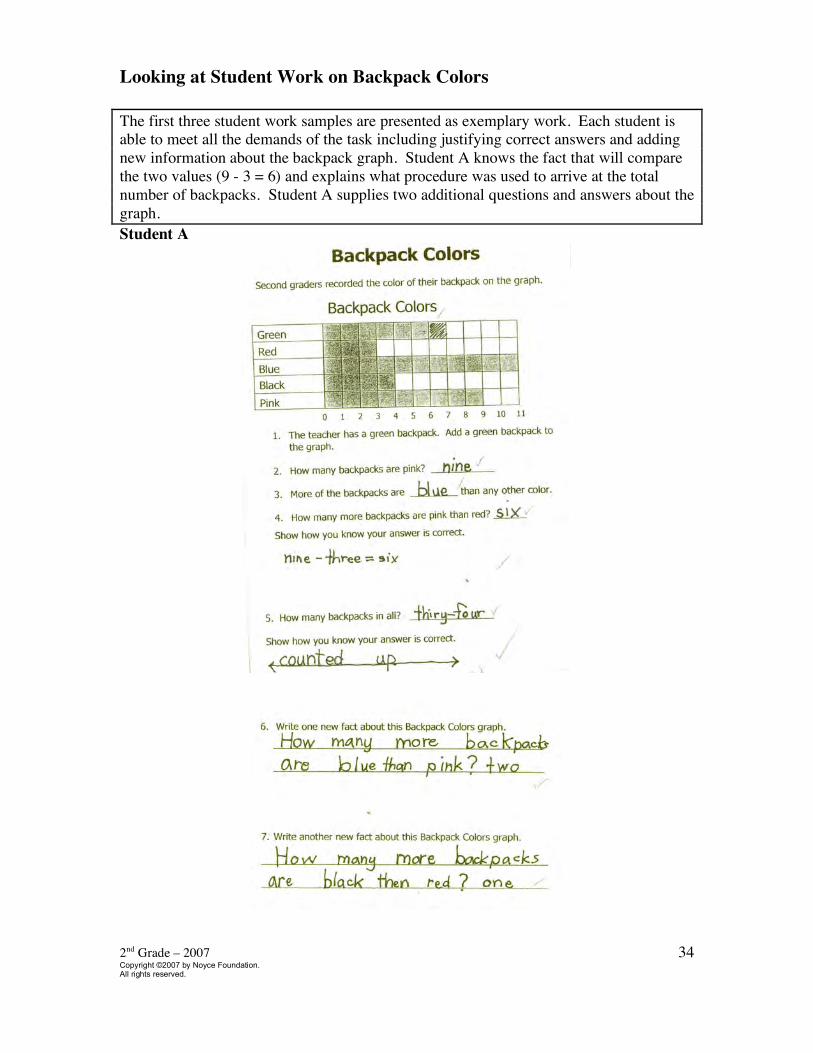
Looking at Student Work on Backpack Colors The first three student work samples are presented as exemplary work. Each student is able to meet all the demands of the task including justifying correct answers and adding new information about the backpack graph. Student A knows the fact that will compare the two values (9 - 3 = 6) and explains what procedure was used to arrive at the total number of backpacks. Student A supplies two additional questions and answers about the graph. Student A
2nd Grade – 2007 Copyright ©2007 by Noyce Foundation. All rights reserved.
35
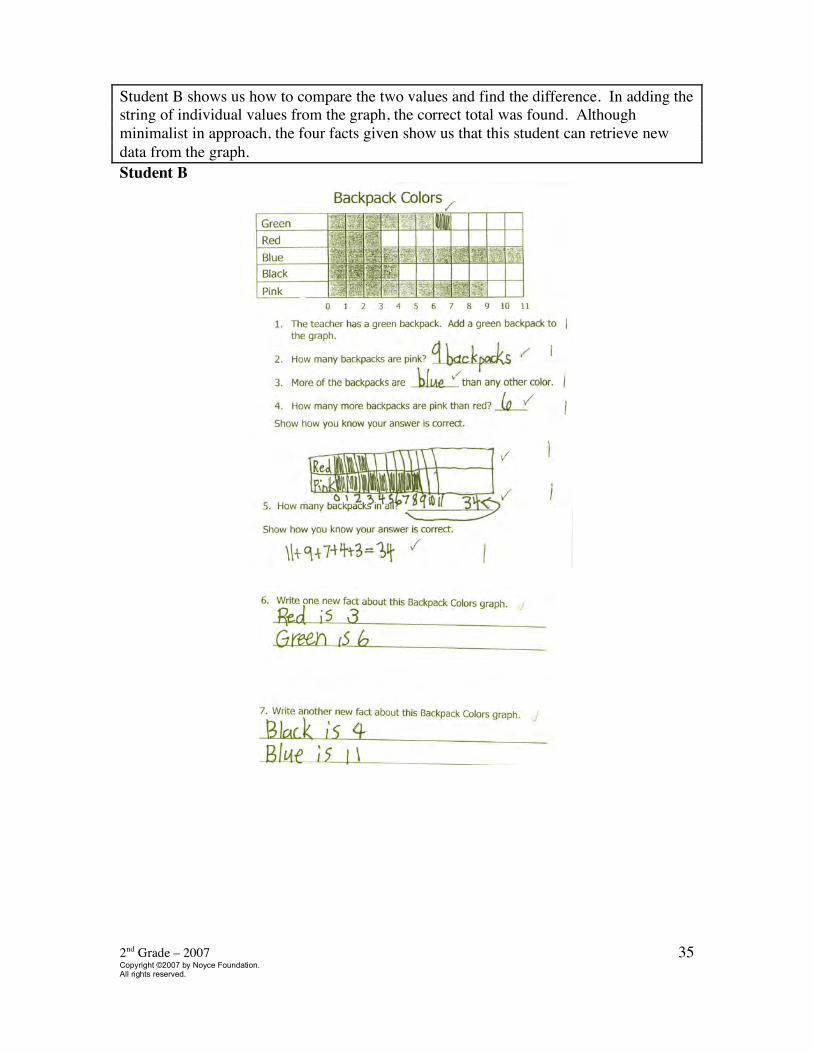
Student B shows us how to compare the two values and find the difference. In adding the string of individual values from the graph, the correct total was found. Although minimalist in approach, the four facts given show us that this student can retrieve new data from the graph. Student B
2nd Grade – 2007 Copyright ©2007 by Noyce Foundation. All rights reserved.
36
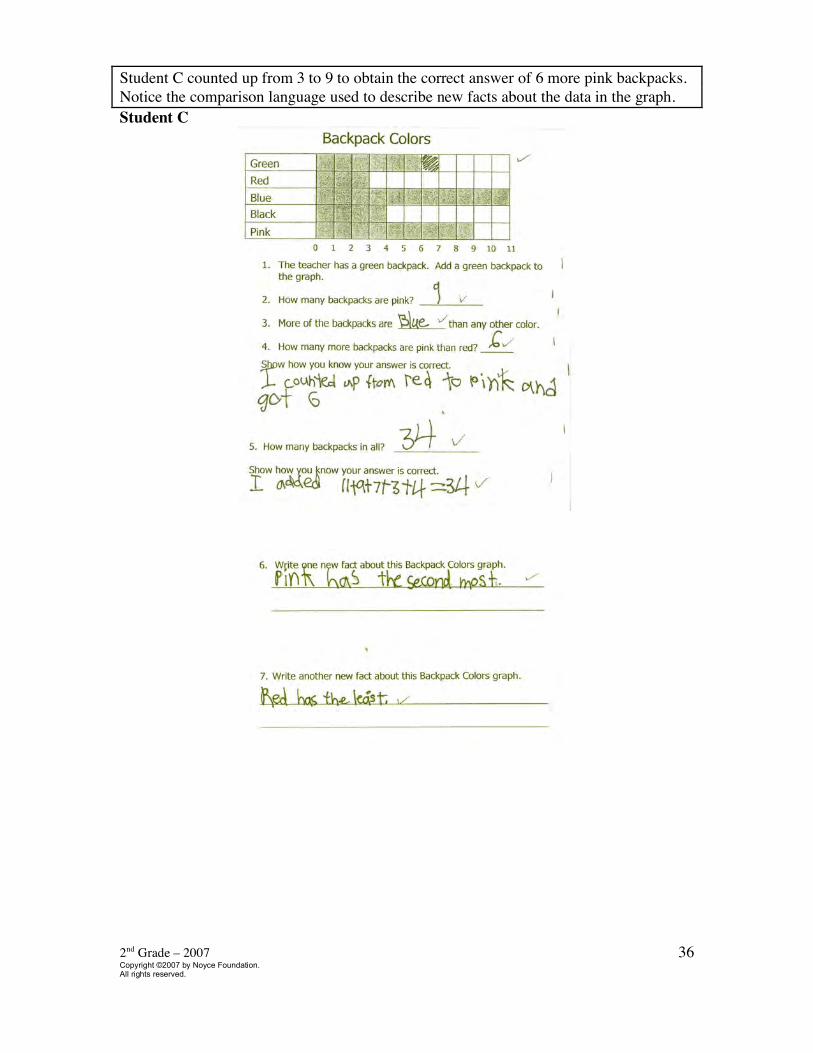
Student C counted up from 3 to 9 to obtain the correct answer of 6 more pink backpacks. Notice the comparison language used to describe new facts about the data in the graph. Student C
2nd Grade – 2007 Copyright ©2007 by Noyce Foundation. All rights reserved.
37
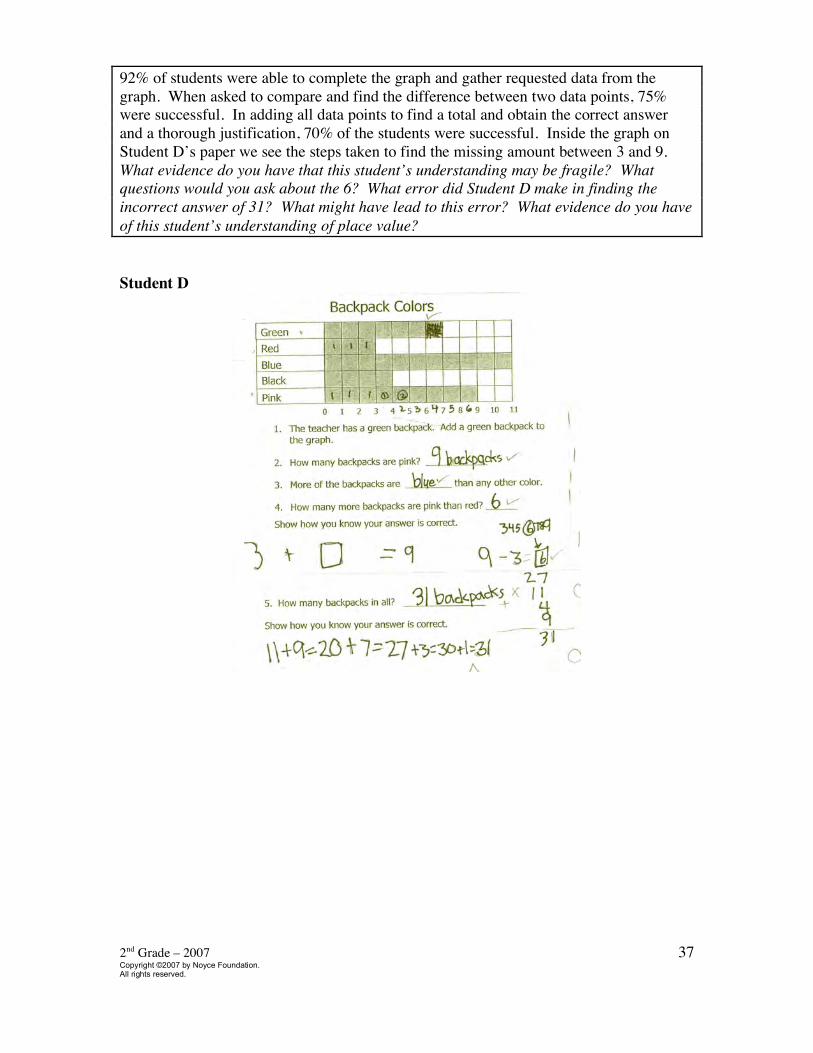
92% of students were able to complete the graph and gather requested data from the graph. When asked to compare and find the difference between two data points, 75% were successful. In adding all data points to find a total and obtain the correct answer and a thorough justification, 70% of the students were successful. Inside the graph on Student D’s paper we see the steps taken to find the missing amount between 3 and 9. What evidence do you have that this student’s understanding may be fragile? What questions would you ask about the 6? What error did Student D make in finding the incorrect answer of 31? What might have lead to this error? What evidence do you have of this student’s understanding of place value? Student D
2nd Grade – 2007 Copyright ©2007 by Noyce Foundation. All rights reserved.
38
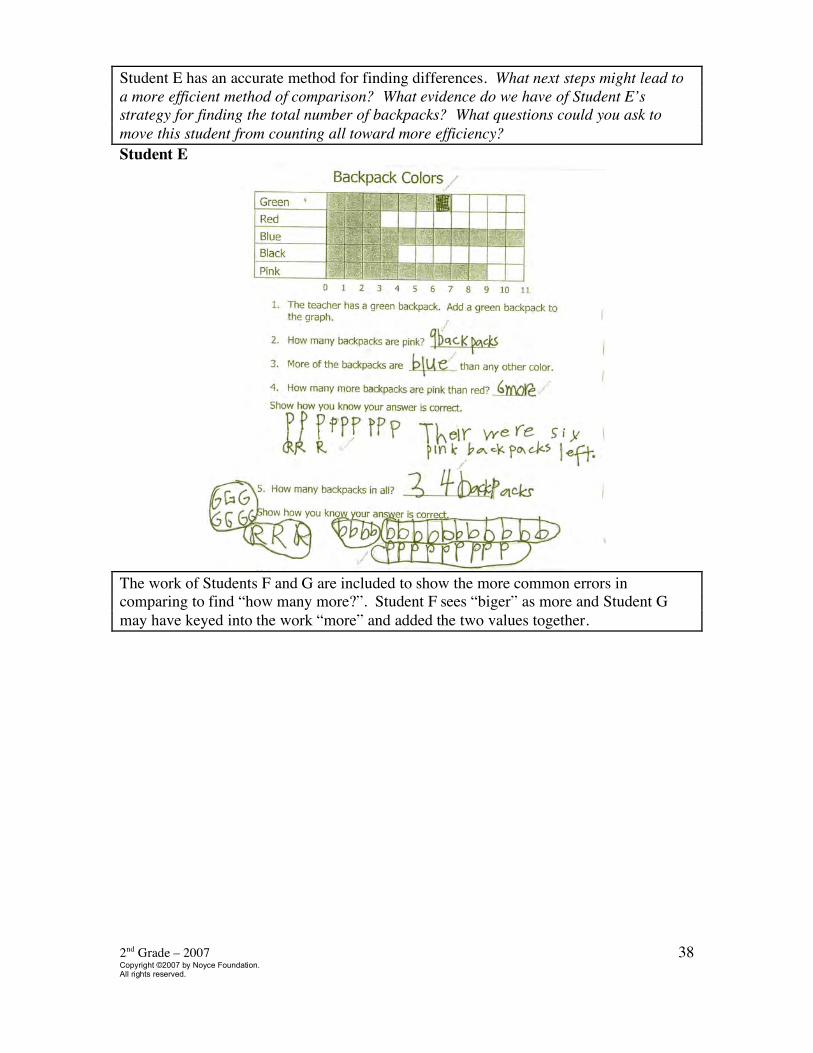
Student E has an accurate method for finding differences. What next steps might lead to a more efficient method of comparison? What evidence do we have of Student E’s strategy for finding the total number of backpacks? What questions could you ask to move this student from counting all toward more efficiency? Student E
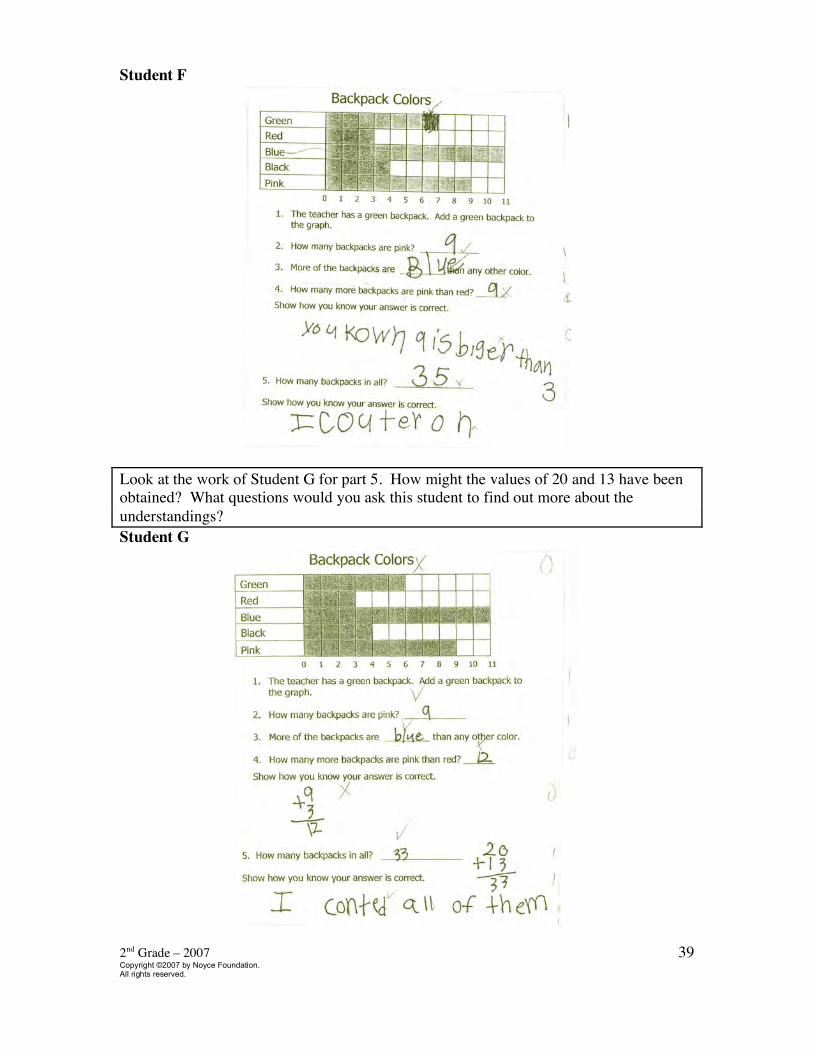
The work of Students F and G are included to show the more common errors in comparing to find “how many more?”. Student F sees “biger” as more and Student G may have keyed into the work “more” and added the two values together.
2nd Grade – 2007 Copyright ©2007 by Noyce Foundation. All rights reserved.
39
Student F
Look at the work of Student G for part 5. How might the values of 20 and 13 have been obtained? What questions would you ask this student to find out more about the understandings? Student G
2nd Grade – 2007 Copyright ©2007 by Noyce Foundation. All rights reserved.
40
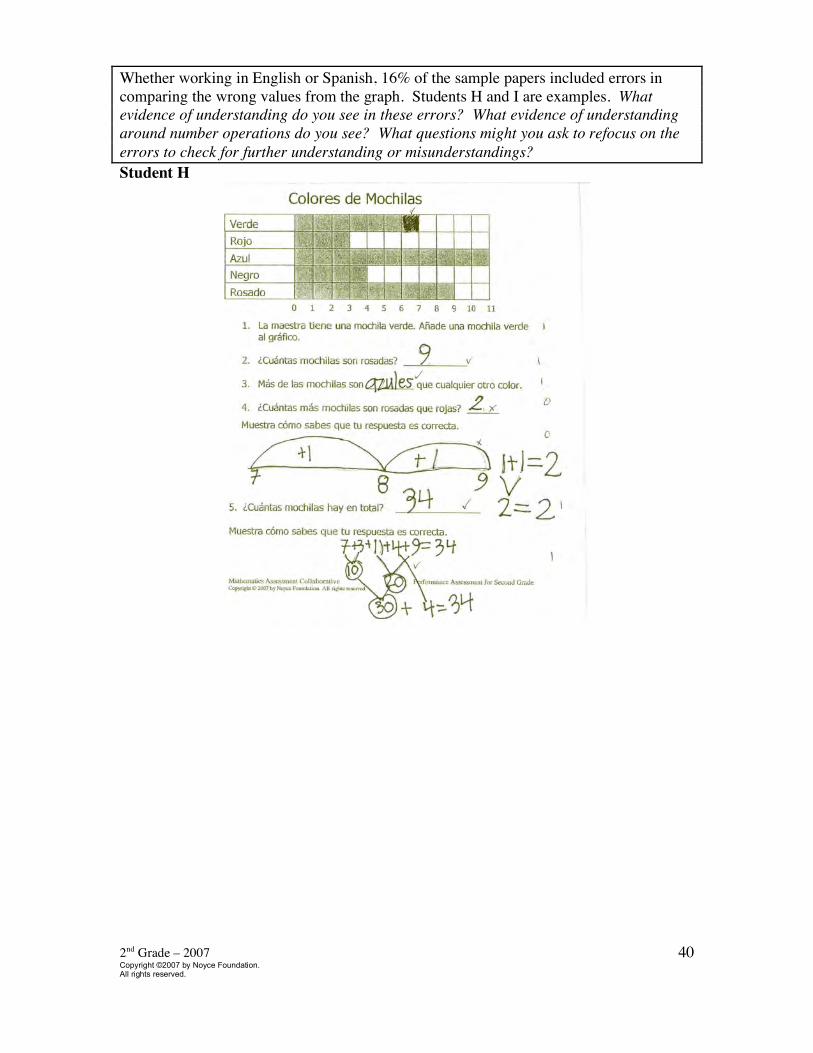
Whether working in English or Spanish, 16% of the sample papers included errors in comparing the wrong values from the graph. Students H and I are examples. What evidence of understanding do you see in these errors? What evidence of understanding around number operations do you see? What questions might you ask to refocus on the errors to check for further understanding or misunderstandings? Student H
2nd Grade – 2007 Copyright ©2007 by Noyce Foundation. All rights reserved.
41
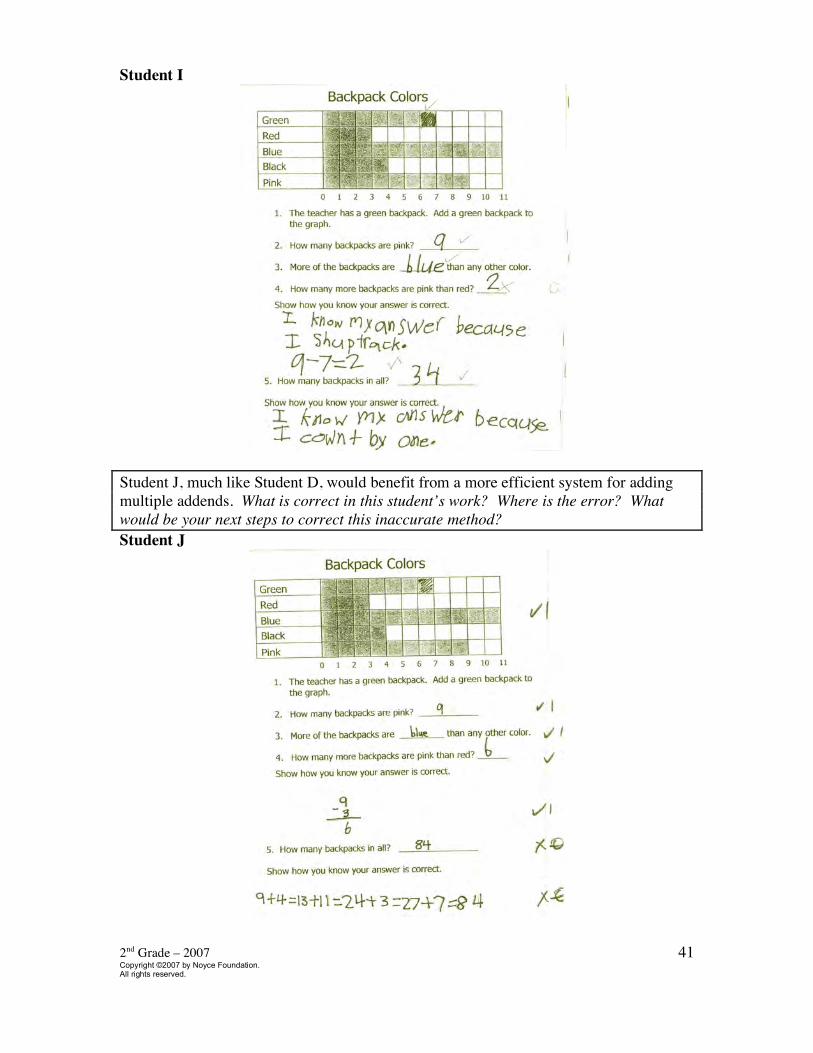
Student I
Student J, much like Student D, would benefit from a more efficient system for adding multiple addends. What is correct in this student’s work? Where is the error? What would be your next steps to correct this inaccurate method? Student J
2nd Grade – 2007 Copyright ©2007 by Noyce Foundation. All rights reserved.
42
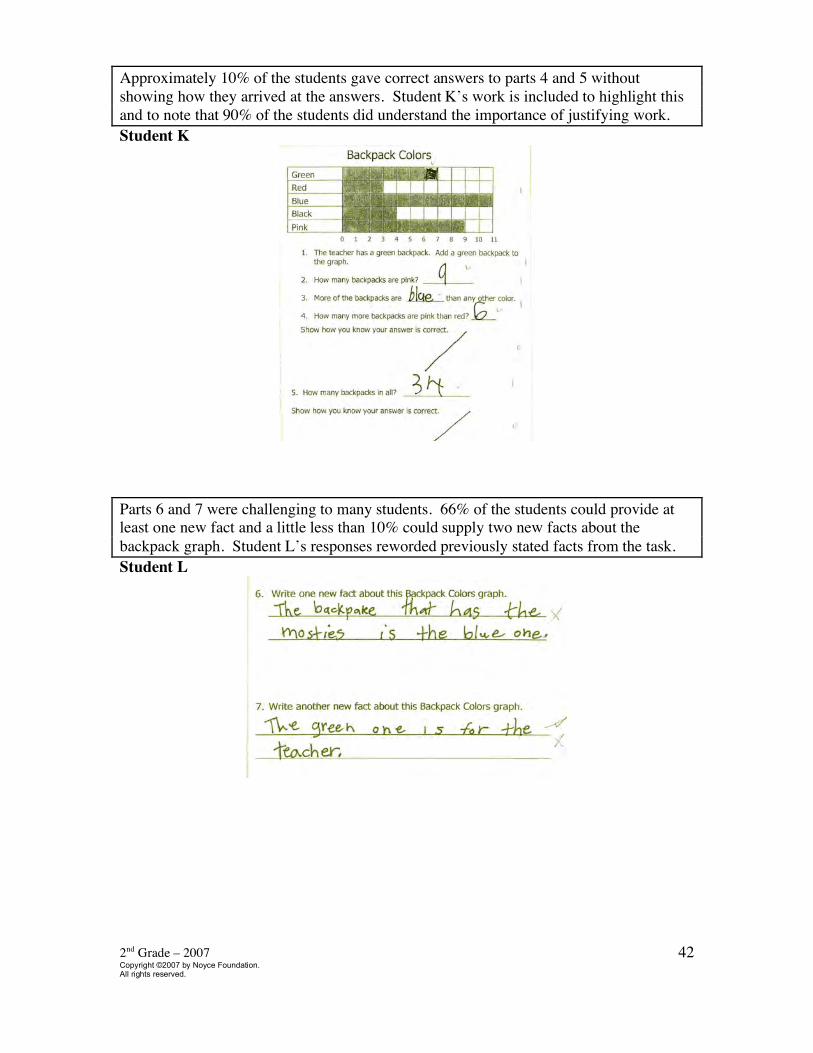
Approximately 10% of the students gave correct answers to parts 4 and 5 without showing how they arrived at the answers. Student K’s work is included to highlight this and to note that 90% of the students did understand the importance of justifying work. Student K
Parts 6 and 7 were challenging to many students. 66% of the students could provide at least one new fact and a little less than 10% could supply two new facts about the backpack graph. Student L’s responses reworded previously stated facts from the task. Student L
2nd Grade – 2007 Copyright ©2007 by Noyce Foundation. All rights reserved.
43
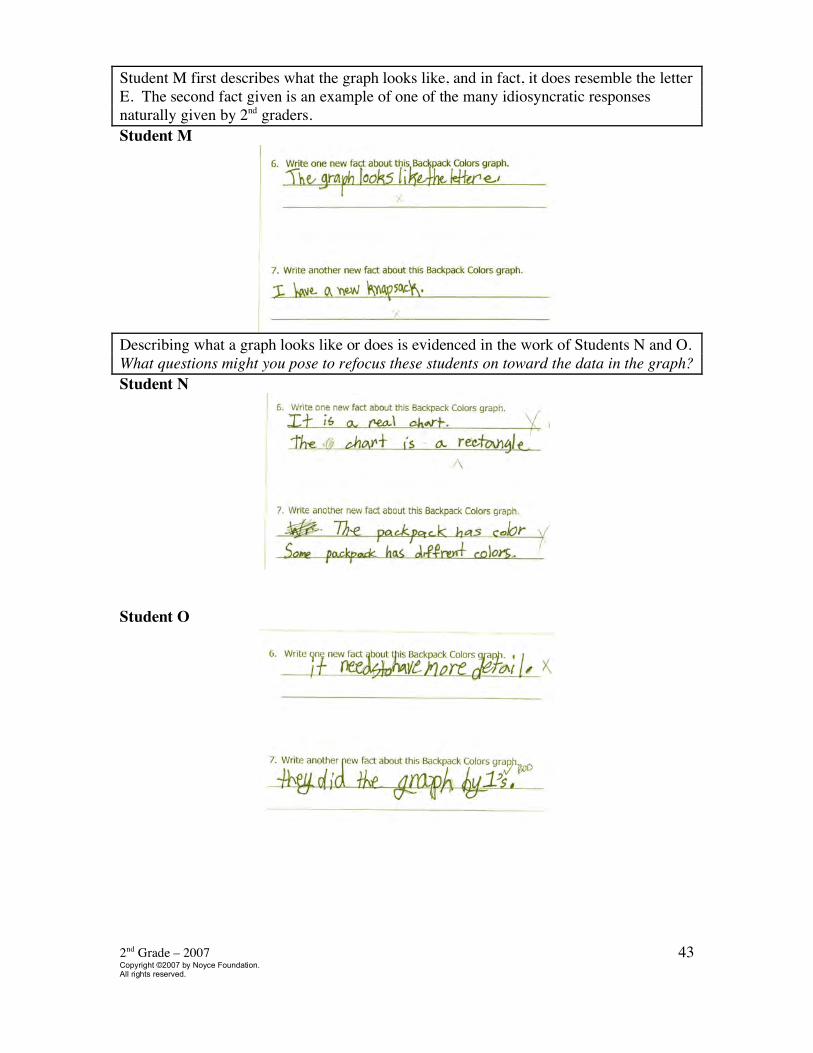
Student M first describes what the graph looks like, and in fact, it does resemble the letter E. The second fact given is an example of one of the many idiosyncratic responses naturally given by 2nd graders. Student M
Describing what a graph looks like or does is evidenced in the work of Students N and O. What questions might you pose to refocus these students on toward the data in the graph? Student N
Student O
2nd Grade – 2007 Copyright ©2007 by Noyce Foundation. All rights reserved.
44
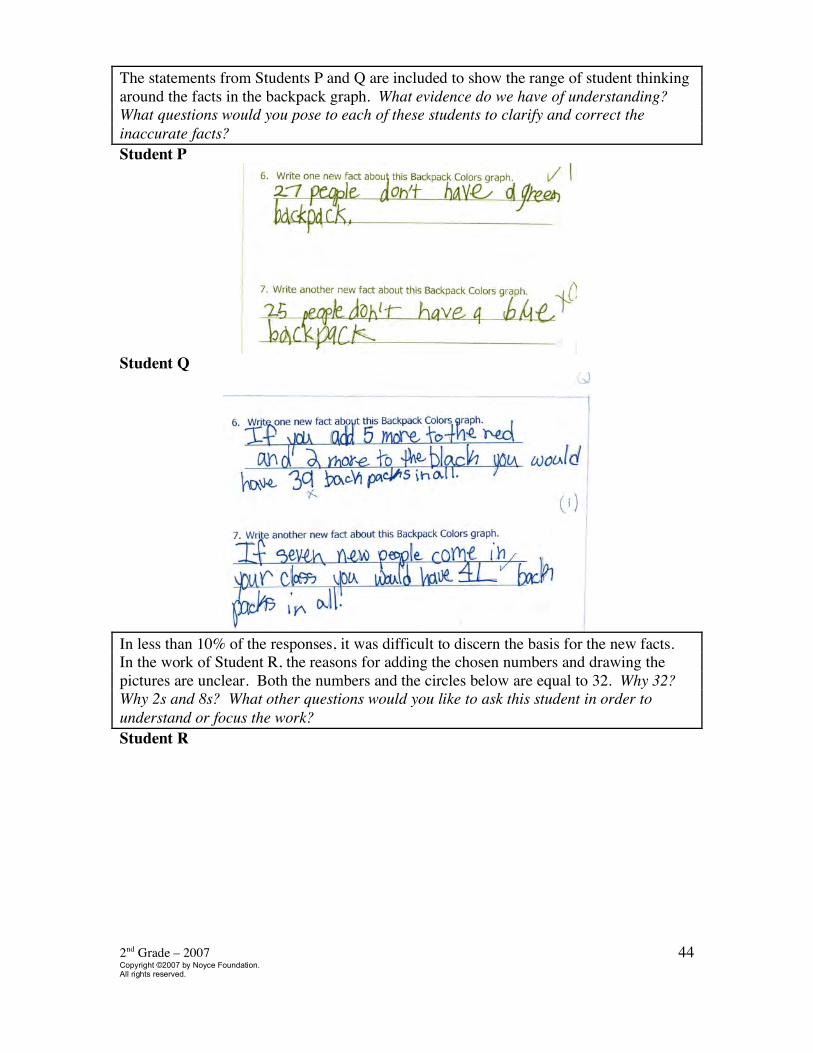
The statements from Students P and Q are included to show the range of student thinking around the facts in the backpack graph. What evidence do we have of understanding? What questions would you pose to each of these students to clarify and correct the inaccurate facts? Student P
Student Q
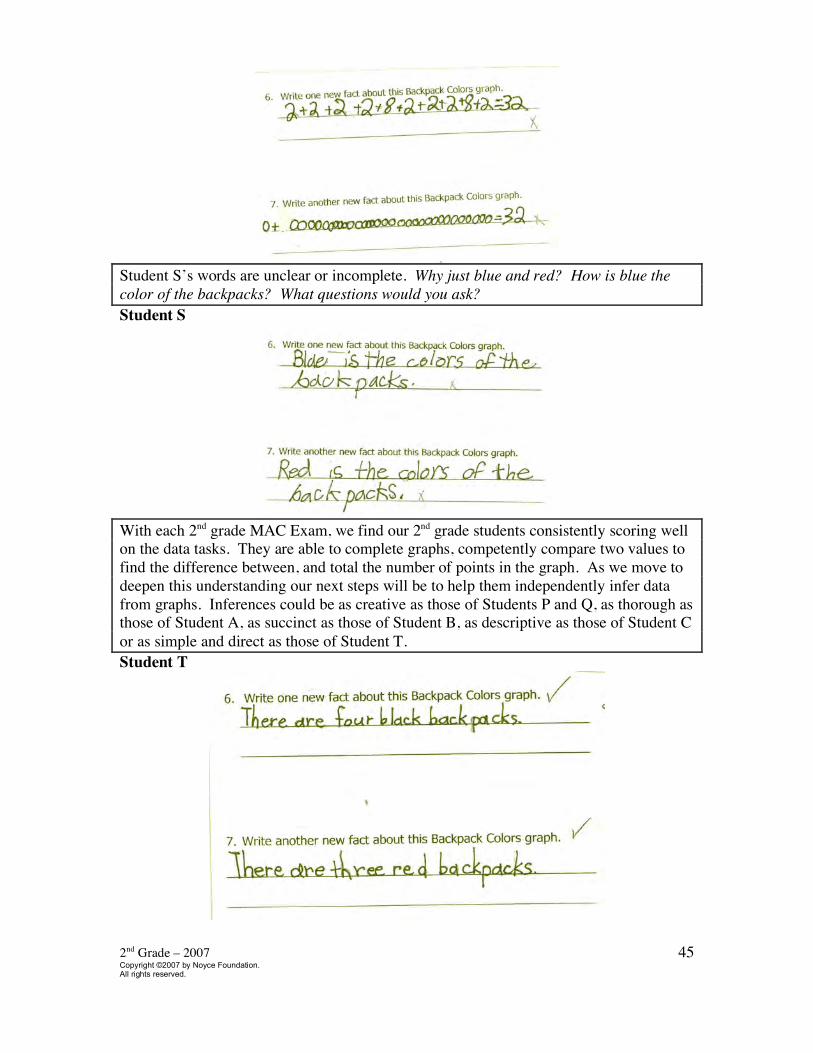
In less than 10% of the responses, it was difficult to discern the basis for the new facts. In the work of Student R, the reasons for adding the chosen numbers and drawing the pictures are unclear. Both the numbers and the circles below are equal to 32. Why 32? Why 2s and 8s? What other questions would you like to ask this student in order to understand or focus the work? Student R
2nd Grade – 2007 Copyright ©2007 by Noyce Foundation. All rights reserved.
45
Student S’s words are unclear or incomplete. Why just blue and red? How is blue the color of the backpacks? What questions would you ask? Student S
With each 2nd grade MAC Exam, we find our 2nd grade students consistently scoring well on the data tasks. They are able to complete graphs, competently compare two values to find the difference between, and total the number of points in the graph. As we move to deepen this understanding our next steps will be to help them independently infer data from graphs. Inferences could be as creative as those of Students P and Q, as thorough as those of Student A, as succinct as those of Student B, as descriptive as those of Student C or as simple and direct as those of Student T. Student T

2nd Grade – 2007 Copyright ©2007 by Noyce Foundation. All rights reserved.
46
2nd Grade – 2007 Copyright ©2007 by Noyce Foundation. All rights reserved.
47
Backpack Colors 2nd grade Task 2 Backpack Colors Student Task
Read and interpret data from a class bar graph. Complete a graph with additional information. Find numerical and categorical information and compare values. Provide two additional facts about the graph.
Core Idea 5: Data Analysis
Students organize, display, and interpret data about themselves and their surroundings.
• Represent and interpret data using bar graphs • Describe and compare data using qualitative and quantitative
measures
Core Idea 2: Number Operations
Understand the meanings of operations and how they relate to each other, make reasonable estimates, and compute fluently.
• Demonstrate fluency in adding and subtracting whole numbers
Mathematics of the task:
• Ability to add data to a graph • Ability to read and interpret data using a bar graph • Ability to compare values in a graph and show which is more and why • Ability to describe and compare data using qualitative and quantitative measures
Based on teacher observation, this is what second graders knew and were able to do: • Add data to the graph • Identify and name the greatest value, and • Find the difference between quantities. • Compute the total number of backpacks
Areas of difficulty for second graders: • Showing how they knew their answer was correct • Confusing how many and how many more • Writing a “new” or different math fact
Strategies used by successful students:
• Drawing pictures or writing equations to show comparisons or find totals • Used “making a ten” strategy to add totals • Generated comparison facts of two of the colors in the graph or stated facts such
as “There were 11 blue backpacks”
2nd Grade – 2007 Copyright ©2007 by Noyce Foundation. All rights reserved.
48
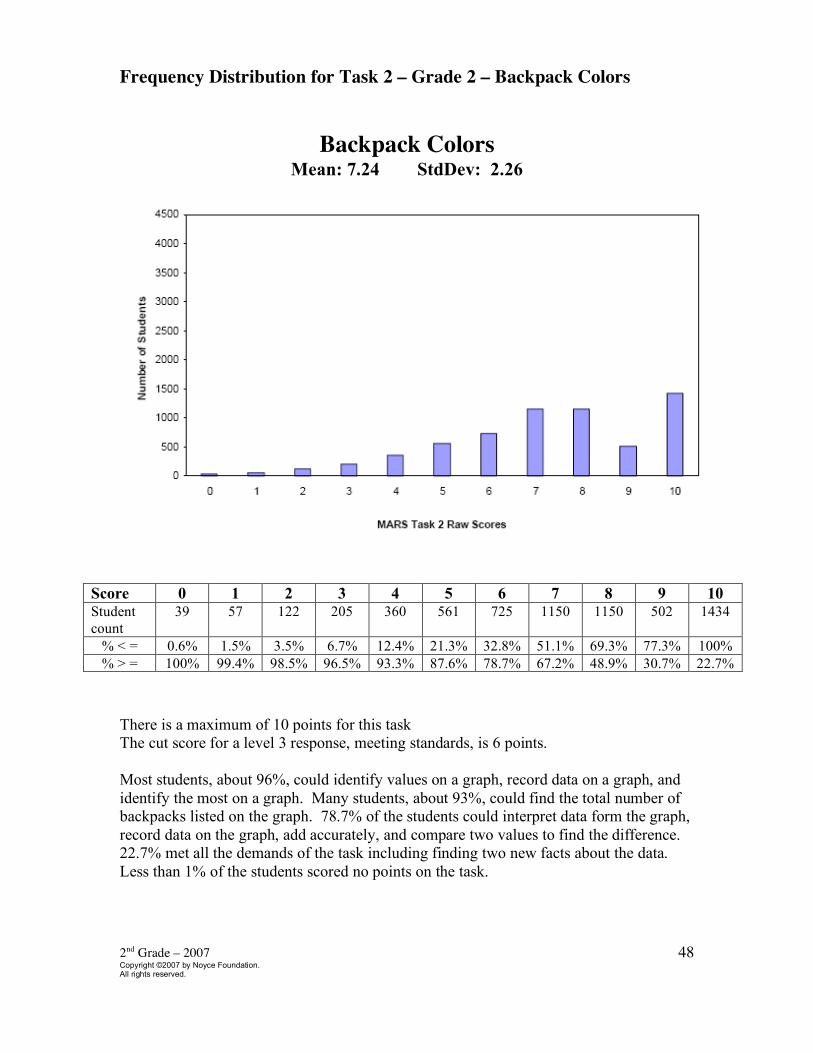
Frequency Distribution for Task 2 – Grade 2 – Backpack Colors
Backpack Colors Mean: 7.24 StdDev: 2.26
Score 0 1 2 3 4 5 6 7 8 9 10 Student count
39 57 122 205 360 561 725 1150 1150 502 1434
% < = 0.6% 1.5% 3.5% 6.7% 12.4% 21.3% 32.8% 51.1% 69.3% 77.3% 100% % > = 100% 99.4% 98.5% 96.5% 93.3% 87.6% 78.7% 67.2% 48.9% 30.7% 22.7%
There is a maximum of 10 points for this task The cut score for a level 3 response, meeting standards, is 6 points. Most students, about 96%, could identify values on a graph, record data on a graph, and identify the most on a graph. Many students, about 93%, could find the total number of backpacks listed on the graph. 78.7% of the students could interpret data form the graph, record data on the graph, add accurately, and compare two values to find the difference. 22.7% met all the demands of the task including finding two new facts about the data. Less than 1% of the students scored no points on the task.
2nd Grade – 2007 Copyright ©2007 by Noyce Foundation. All rights reserved.
49
Backpack Colors Points Understandings Misunderstandings
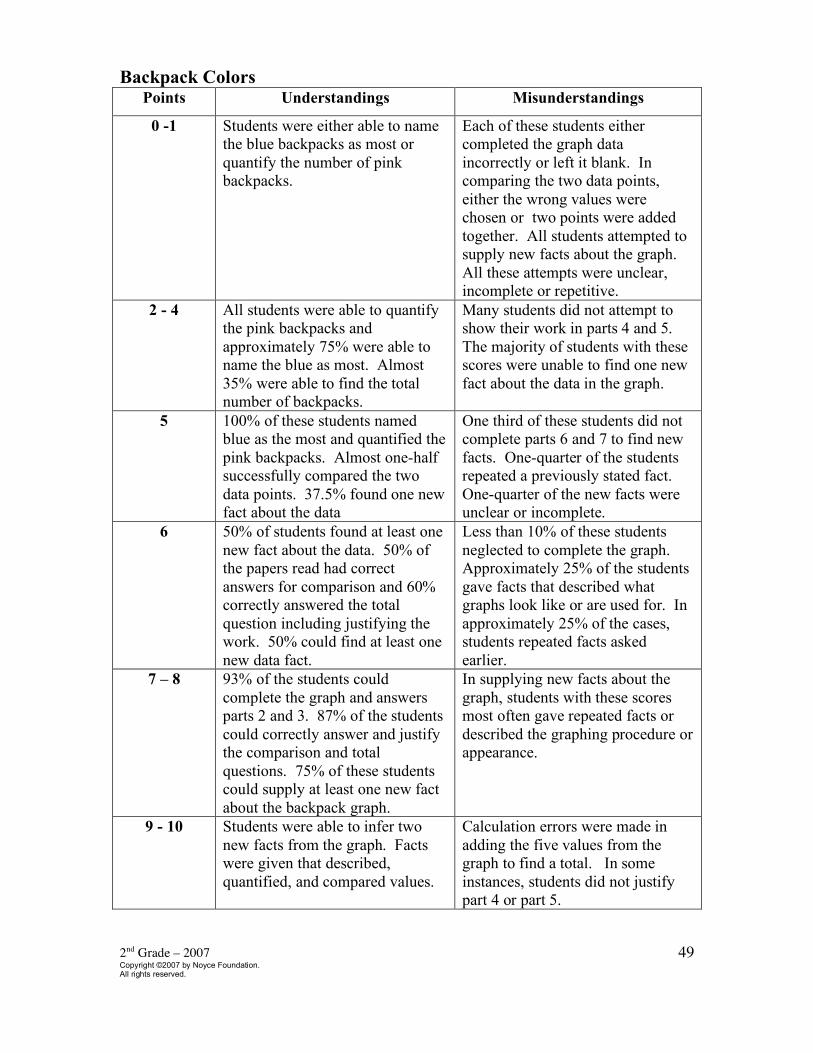
0 -1 Students were either able to name the blue backpacks as most or quantify the number of pink backpacks.
Each of these students either completed the graph data incorrectly or left it blank. In comparing the two data points, either the wrong values were chosen or two points were added together. All students attempted to supply new facts about the graph. All these attempts were unclear, incomplete or repetitive.
2 - 4 All students were able to quantify the pink backpacks and approximately 75% were able to name the blue as most. Almost 35% were able to find the total number of backpacks.
Many students did not attempt to show their work in parts 4 and 5. The majority of students with these scores were unable to find one new fact about the data in the graph.
5 100% of these students named blue as the most and quantified the pink backpacks. Almost one-half successfully compared the two data points. 37.5% found one new fact about the data
One third of these students did not complete parts 6 and 7 to find new facts. One-quarter of the students repeated a previously stated fact. One-quarter of the new facts were unclear or incomplete.
6 50% of students found at least one new fact about the data. 50% of the papers read had correct answers for comparison and 60% correctly answered the total question including justifying the work. 50% could find at least one new data fact.
Less than 10% of these students neglected to complete the graph. Approximately 25% of the students gave facts that described what graphs look like or are used for. In approximately 25% of the cases, students repeated facts asked earlier.
7 – 8 93% of the students could complete the graph and answers parts 2 and 3. 87% of the students could correctly answer and justify the comparison and total questions. 75% of these students could supply at least one new fact about the backpack graph.
In supplying new facts about the graph, students with these scores most often gave repeated facts or described the graphing procedure or appearance.
9 - 10 Students were able to infer two new facts from the graph. Facts were given that described, quantified, and compared values.
Calculation errors were made in adding the five values from the graph to find a total. In some instances, students did not justify part 4 or part 5.
2nd Grade – 2007 Copyright ©2007 by Noyce Foundation. All rights reserved.
50
Implications for Instruction: Students at this grade benefit from making and interpreting graphs. In the course of making displays of information, they have the opportunity to organize and show information graphically and numerically. They are applying mathematics in a useful and motivating experience. Students can use counts, tallies, tables, bar graphs and line plots. They find a use for titles and labels of the data they represent. As they work, students should begin to sort out the meaning of the different numbers in graphs – those that represent values (“I have four cats”) and those that represent how often a value occurs in a data set (“Three people have four cats”). A central part of data analysis is dialogue and discussion. A significant amount of time should be devoted to reading and reflecting about the meaning of the data. The students must grapple with interpreting the results of the collecting of data. If someone who didn’t know us came along and saw this chart, what could that person find out from the chart? If we have the outcomes in mind when we set out in the discussion, we may guide students’ thoughts too quickly in predetermined ways. We lose out on learning where students are in understanding the patterns and trends in data and where they might need to head next. Ask students to reflect on, clarify, and extend their ideas. How many more people have blue that read backpacks? What method did you use to figure this out? What might be a reasonable estimate of the number of pink, red and green backpacks? How did you make your estimate? What do you notice about the number of 2nd grader backpacks? How do you know? Make sure that they listen to their classmates and ask questions of one another. Encourage students to write summary statements of the data as well as asking and answering questions. Inference and prediction are more-advanced aspects of the standard at this grade level. The development of these concepts requires time and energy but we should encourage our students to move toward this goal. Ideas for Action Research: Collecting and Analyzing Data with Primary Children: Animal Die Adapted from The Communicator Volume 19, Number 3 March 1995 Use a die to collect data. The die should have three faces with a picture of a giraffe, two with pictures of a turtle, and one with a picture of an elephant. The die pattern can be used with other pictures on its faces to create what the children perceive as a “new” activity. Early in the year, use the animal die activity to have 2nd graders gather and analyze data. Ask the children to roll the die 30 times and record the data. This is best accomplished in partner pairs. Resist the temptation to give ideas on how to organize the data. Let the students grapple with this issue. When the data has been collected, compare the methods for recording the data. Talk briefly about the methods of recording that would be easiest to read and most efficient. Focus a part of the discussion on what they noticed about the data. Ask for summary statements about the data. Save the children’s work for later use.
2nd Grade – 2007 Copyright ©2007 by Noyce Foundation. All rights reserved.
51
In a month or two, cut and paste seasonal or holiday pictures to change the die but keep them in the same ratios of 3:2:1 – for example, 3 pumpkins, two witches and a cat. Ask the children to again roll the die 30 times and record their data. Of primary interest is whether or not the discussion of the recording methods had an influence over how they collected the data. Observe children as they work and note any efficient methods to highlight during the discussion period. Again, the debrief session should focus on efficient methods of collecting data as well as analyzing the data. Compare this month’s work to the previous work. As an extension, maybe in March, the die ratio and pictures could be changed to four shamrocks and two rainbows to see how the recording changes and how the inferences and predictions continue to develop.
2nd grade – 2007 Copyright ©2007 by Noyce Foundation. All rights reserved.
52
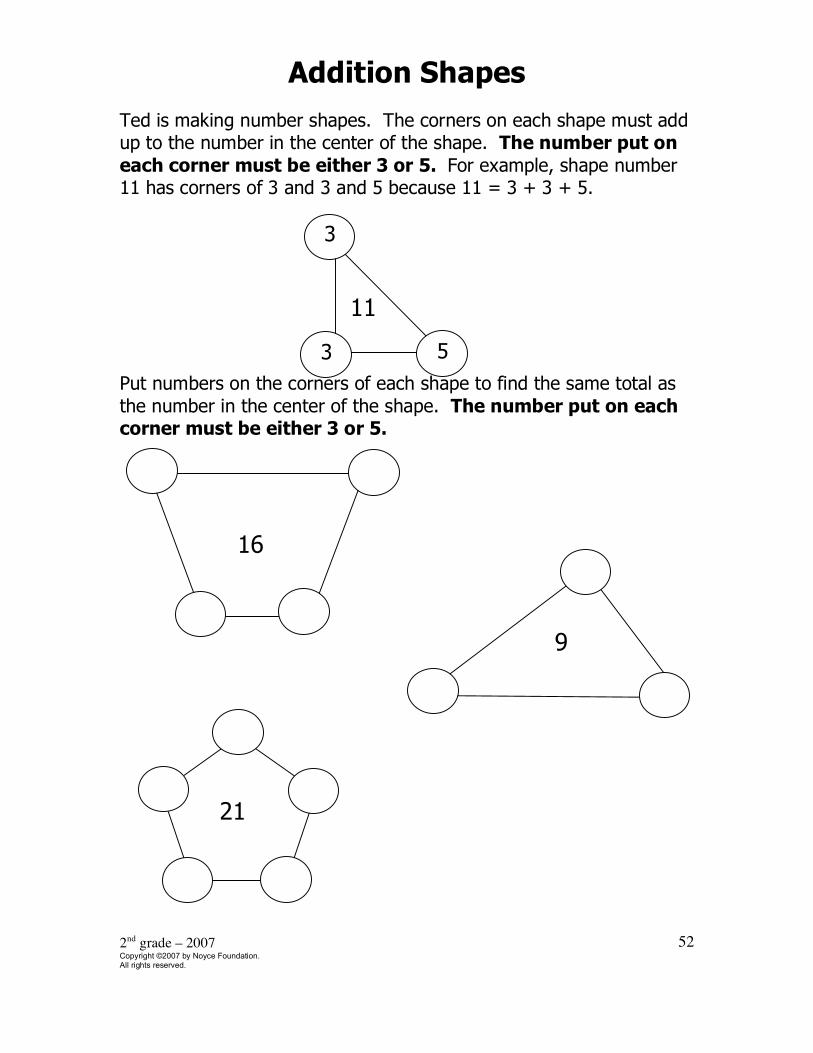
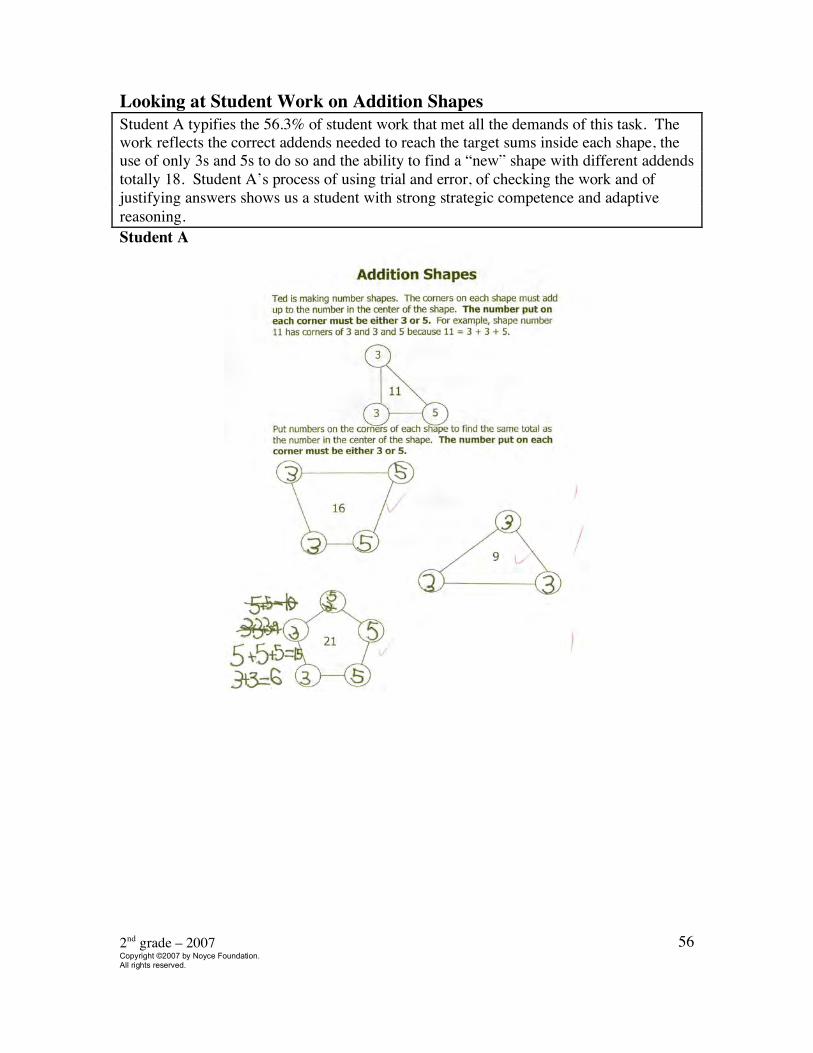
Addition Shapes Ted is making number shapes. The corners on each shape must add up to the number in the center of the shape. The number put on each corner must be either 3 or 5. For example, shape number 11 has corners of 3 and 3 and 5 because 11 = 3 + 3 + 5.
Put numbers on the corners of each shape to find the same total as the number in the center of the shape. The number put on each corner must be either 3 or 5.
3
3 5
11
16
9
21
2nd grade – 2007 Copyright ©2007 by Noyce Foundation. All rights reserved.
53
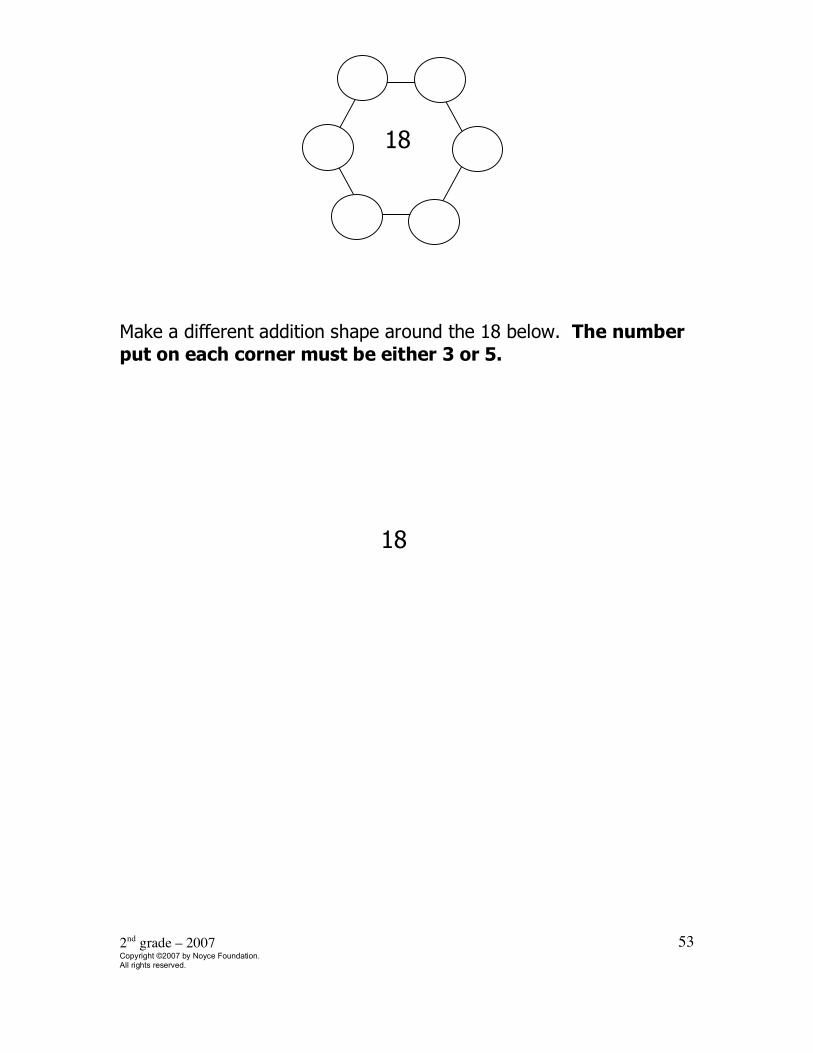
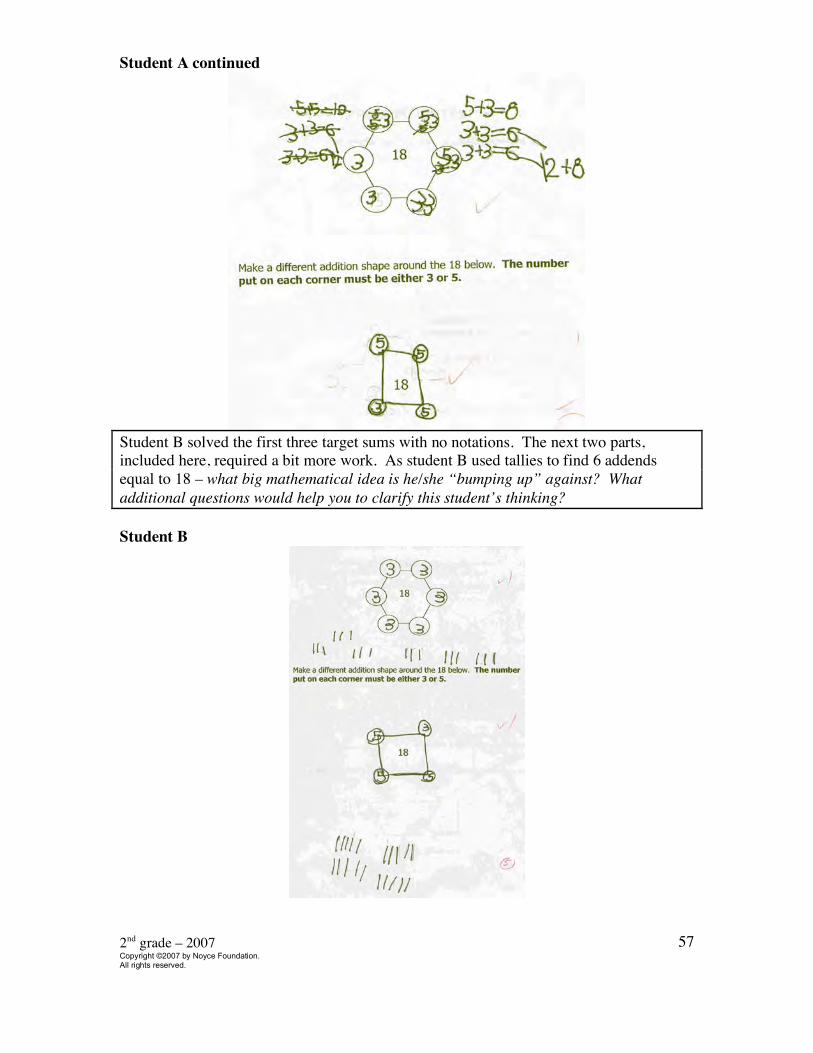
Make a different addition shape around the 18 below. The number put on each corner must be either 3 or 5.
18
18
2nd grade – 2007 Copyright ©2007 by Noyce Foundation. All rights reserved.
54
Addition Shapes Mathematics Assessment Collaborative
Performance Assessment Rubric Grade 2 Task 3: Addition Shapes: Grade 2: Points Section
Points
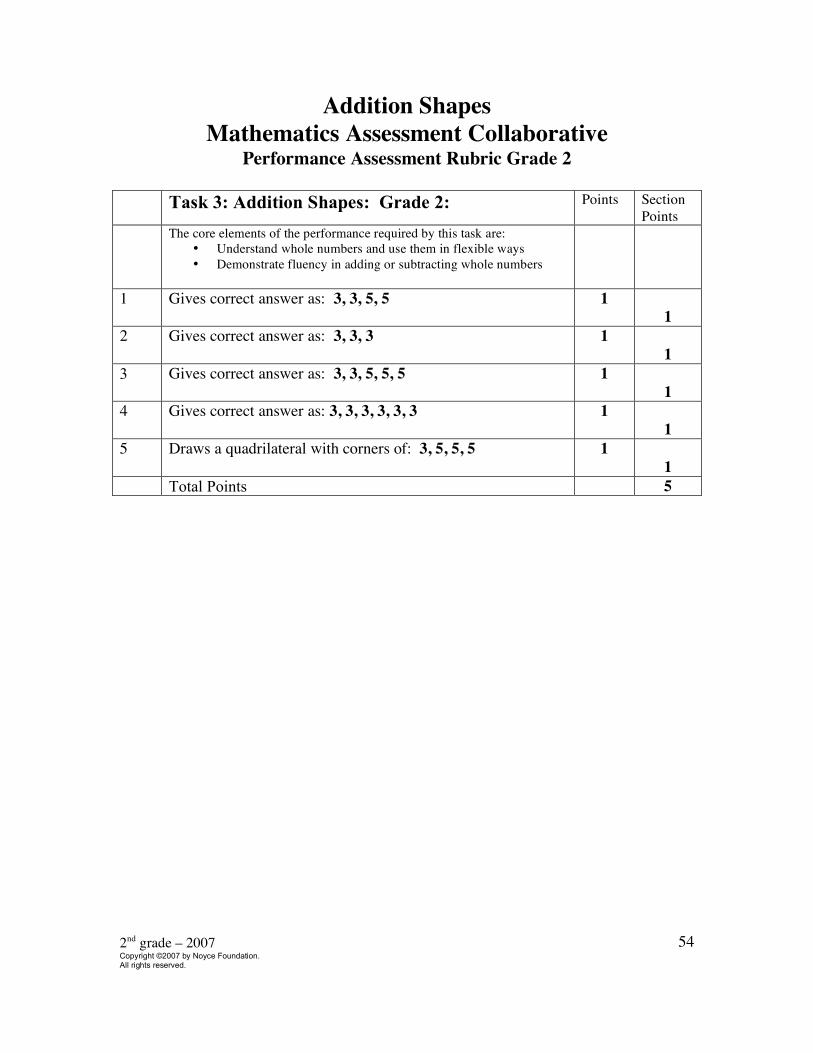
The core elements of the performance required by this task are: • Understand whole numbers and use them in flexible ways • Demonstrate fluency in adding or subtracting whole numbers
1 Gives correct answer as: 3, 3, 5, 5 1 1
2 Gives correct answer as: 3, 3, 3 1 1
3 Gives correct answer as: 3, 3, 5, 5, 5 1 1
4 Gives correct answer as: 3, 3, 3, 3, 3, 3 1 1
5 Draws a quadrilateral with corners of: 3, 5, 5, 5
1 1
Total Points 5
2nd grade – 2007 Copyright ©2007 by Noyce Foundation. All rights reserved.
55
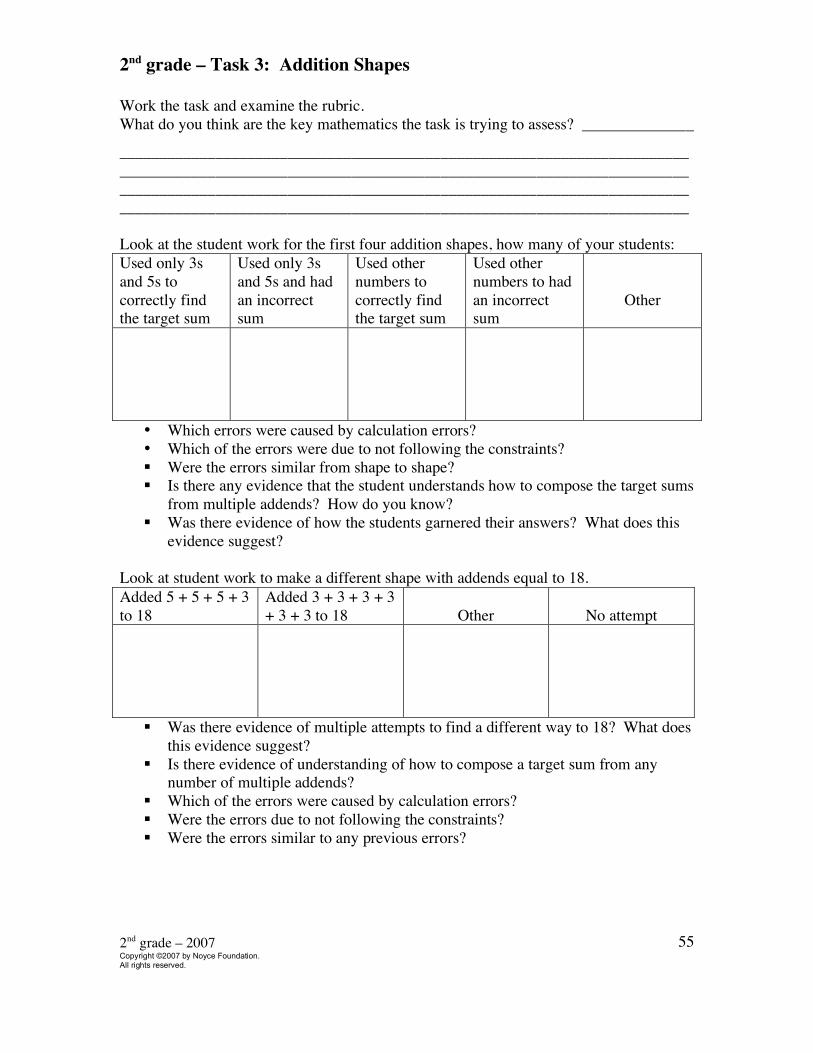
2nd grade – Task 3: Addition Shapes Work the task and examine the rubric. What do you think are the key mathematics the task is trying to assess? ______________
____________________________________________________________________________________________________________________________________________________________________________________________________________________________________________________________________________________________ Look at the student work for the first four addition shapes, how many of your students: Used only 3s and 5s to correctly find the target sum
Used only 3s and 5s and had an incorrect sum
Used other numbers to correctly find the target sum
Used other numbers to had an incorrect sum
Other
• Which errors were caused by calculation errors? • Which of the errors were due to not following the constraints? Were the errors similar from shape to shape? Is there any evidence that the student understands how to compose the target sums
from multiple addends? How do you know? Was there evidence of how the students garnered their answers? What does this
evidence suggest? Look at student work to make a different shape with addends equal to 18. Added 5 + 5 + 5 + 3 to 18
Added 3 + 3 + 3 + 3 + 3 + 3 to 18
Other
No attempt
Was there evidence of multiple attempts to find a different way to 18? What does this evidence suggest?
Is there evidence of understanding of how to compose a target sum from any number of multiple addends?
Which of the errors were caused by calculation errors? Were the errors due to not following the constraints? Were the errors similar to any previous errors?
2nd grade – 2007 Copyright ©2007 by Noyce Foundation. All rights reserved.
56
Looking at Student Work on Addition Shapes Student A typifies the 56.3% of student work that met all the demands of this task. The work reflects the correct addends needed to reach the target sums inside each shape, the use of only 3s and 5s to do so and the ability to find a “new” shape with different addends totally 18. Student A’s process of using trial and error, of checking the work and of justifying answers shows us a student with strong strategic competence and adaptive reasoning. Student A
2nd grade – 2007 Copyright ©2007 by Noyce Foundation. All rights reserved.
57
Student A continued
Student B solved the first three target sums with no notations. The next two parts, included here, required a bit more work. As student B used tallies to find 6 addends equal to 18 – what big mathematical idea is he/she “bumping up” against? What additional questions would help you to clarify this student’s thinking? Student B
2nd grade – 2007 Copyright ©2007 by Noyce Foundation. All rights reserved.
58
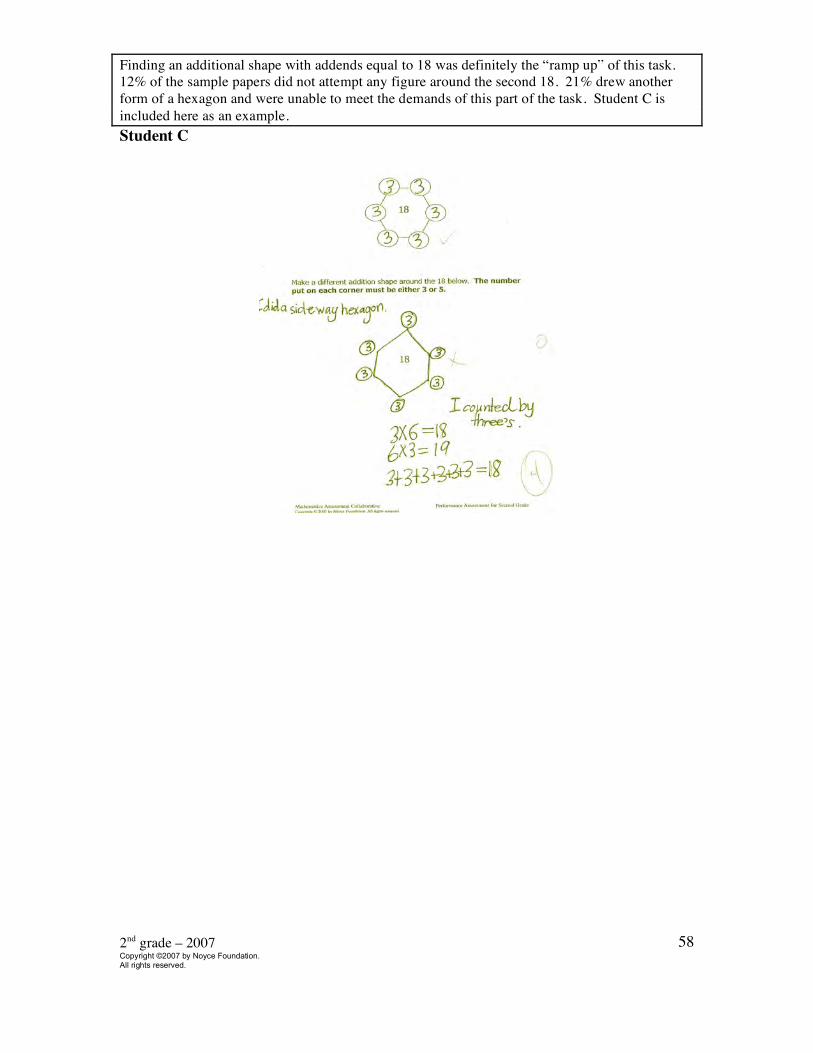
Finding an additional shape with addends equal to 18 was definitely the “ramp up” of this task. 12% of the sample papers did not attempt any figure around the second 18. 21% drew another form of a hexagon and were unable to meet the demands of this part of the task. Student C is included here as an example. Student C
2nd grade – 2007 Copyright ©2007 by Noyce Foundation. All rights reserved.
59
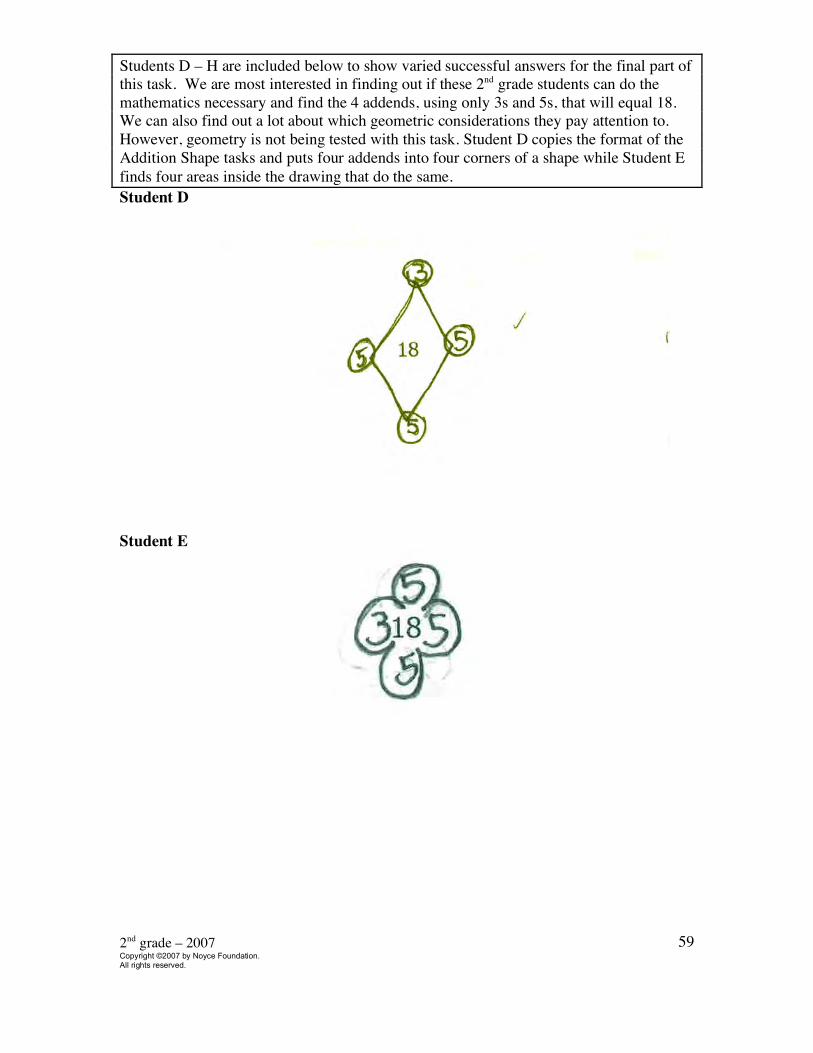
Students D – H are included below to show varied successful answers for the final part of this task. We are most interested in finding out if these 2nd grade students can do the mathematics necessary and find the 4 addends, using only 3s and 5s, that will equal 18. We can also find out a lot about which geometric considerations they pay attention to. However, geometry is not being tested with this task. Student D copies the format of the Addition Shape tasks and puts four addends into four corners of a shape while Student E finds four areas inside the drawing that do the same. Student D
Student E
2nd grade – 2007 Copyright ©2007 by Noyce Foundation. All rights reserved.
60
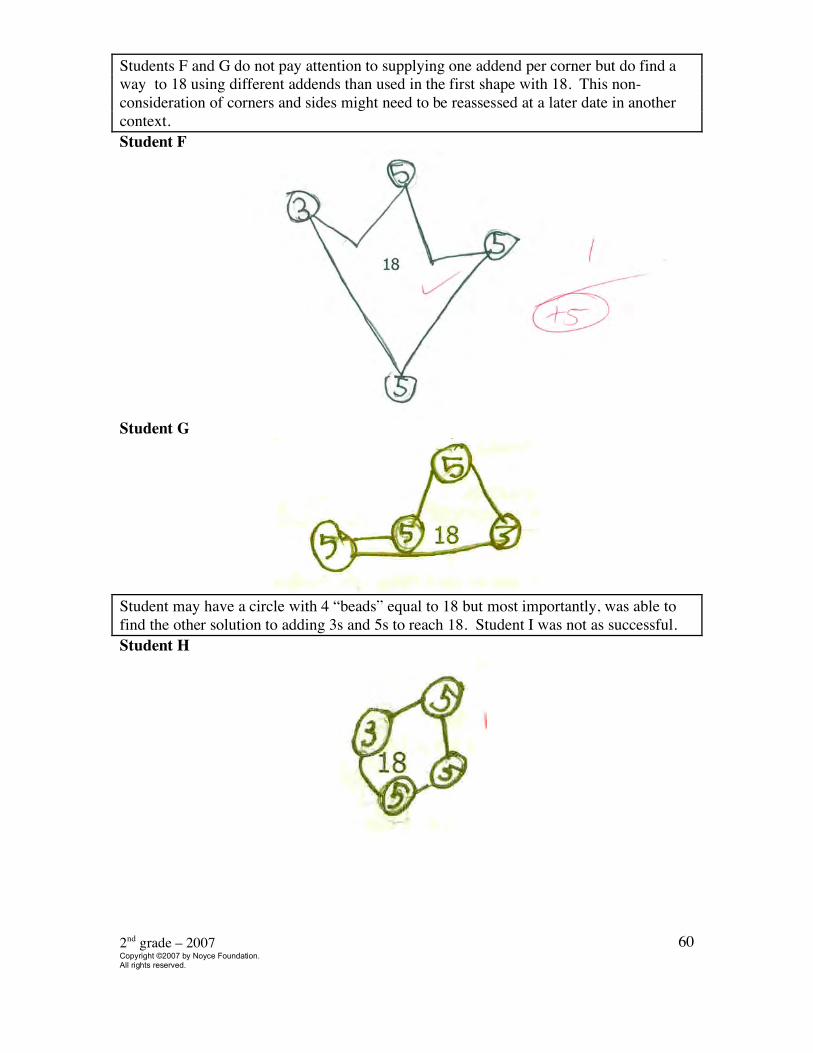
Students F and G do not pay attention to supplying one addend per corner but do find a way to 18 using different addends than used in the first shape with 18. This non-consideration of corners and sides might need to be reassessed at a later date in another context. Student F
Student G
Student may have a circle with 4 “beads” equal to 18 but most importantly, was able to find the other solution to adding 3s and 5s to reach 18. Student I was not as successful. Student H
2nd grade – 2007 Copyright ©2007 by Noyce Foundation. All rights reserved.
61
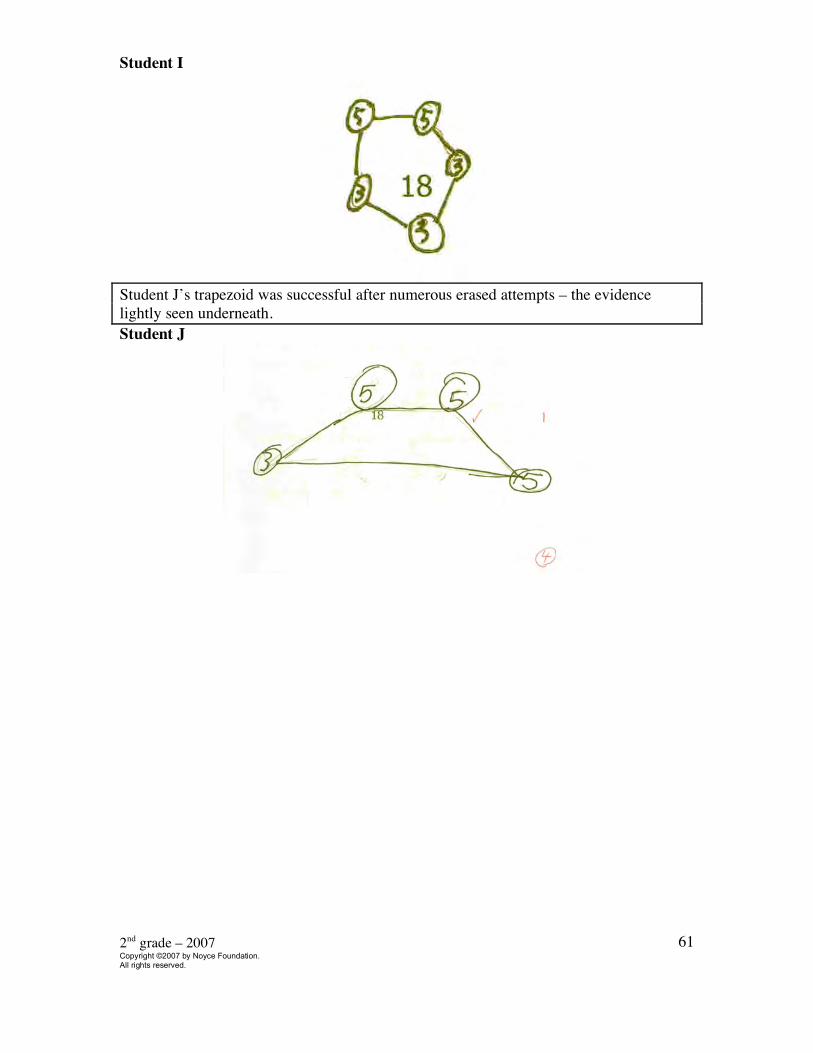
Student I
Student J’s trapezoid was successful after numerous erased attempts – the evidence lightly seen underneath. Student J
2nd grade – 2007 Copyright ©2007 by Noyce Foundation. All rights reserved.
62
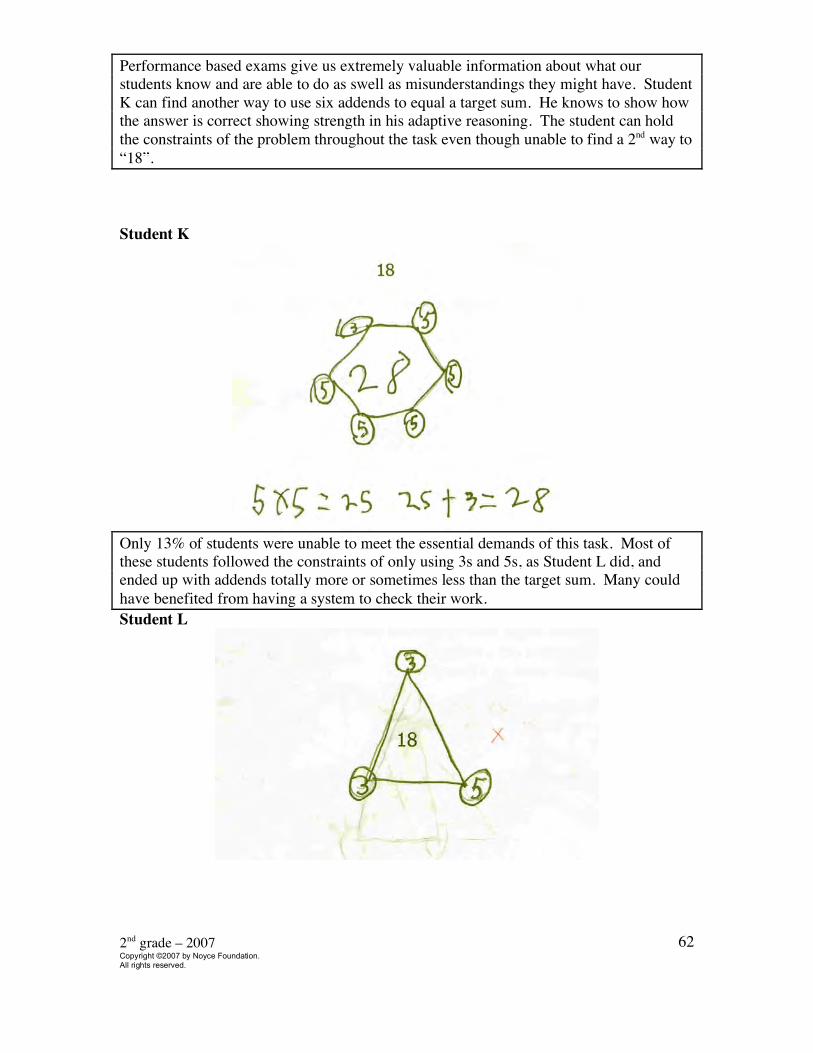
Performance based exams give us extremely valuable information about what our students know and are able to do as swell as misunderstandings they might have. Student K can find another way to use six addends to equal a target sum. He knows to show how the answer is correct showing strength in his adaptive reasoning. The student can hold the constraints of the problem throughout the task even though unable to find a 2nd way to “18”. Student K
Only 13% of students were unable to meet the essential demands of this task. Most of these students followed the constraints of only using 3s and 5s, as Student L did, and ended up with addends totally more or sometimes less than the target sum. Many could have benefited from having a system to check their work. Student L
2nd grade – 2007 Copyright ©2007 by Noyce Foundation. All rights reserved.
63
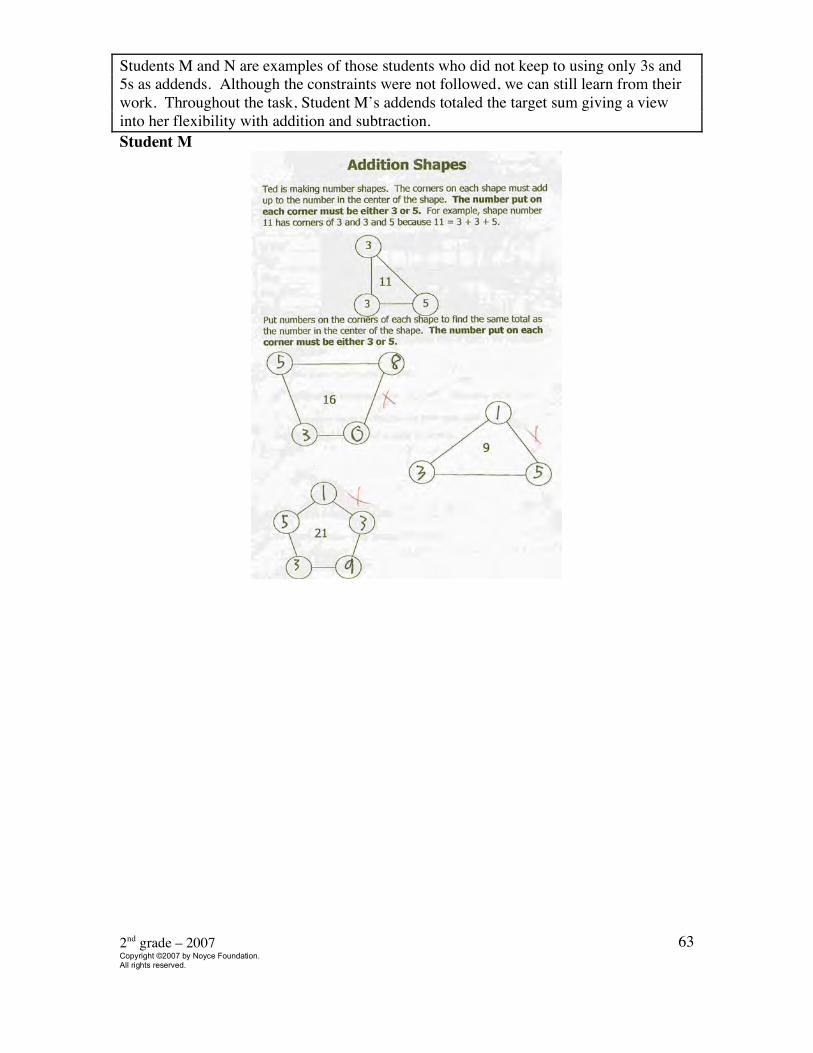
Students M and N are examples of those students who did not keep to using only 3s and 5s as addends. Although the constraints were not followed, we can still learn from their work. Throughout the task, Student M’s addends totaled the target sum giving a view into her flexibility with addition and subtraction. Student M
2nd grade – 2007 Copyright ©2007 by Noyce Foundation. All rights reserved.
64
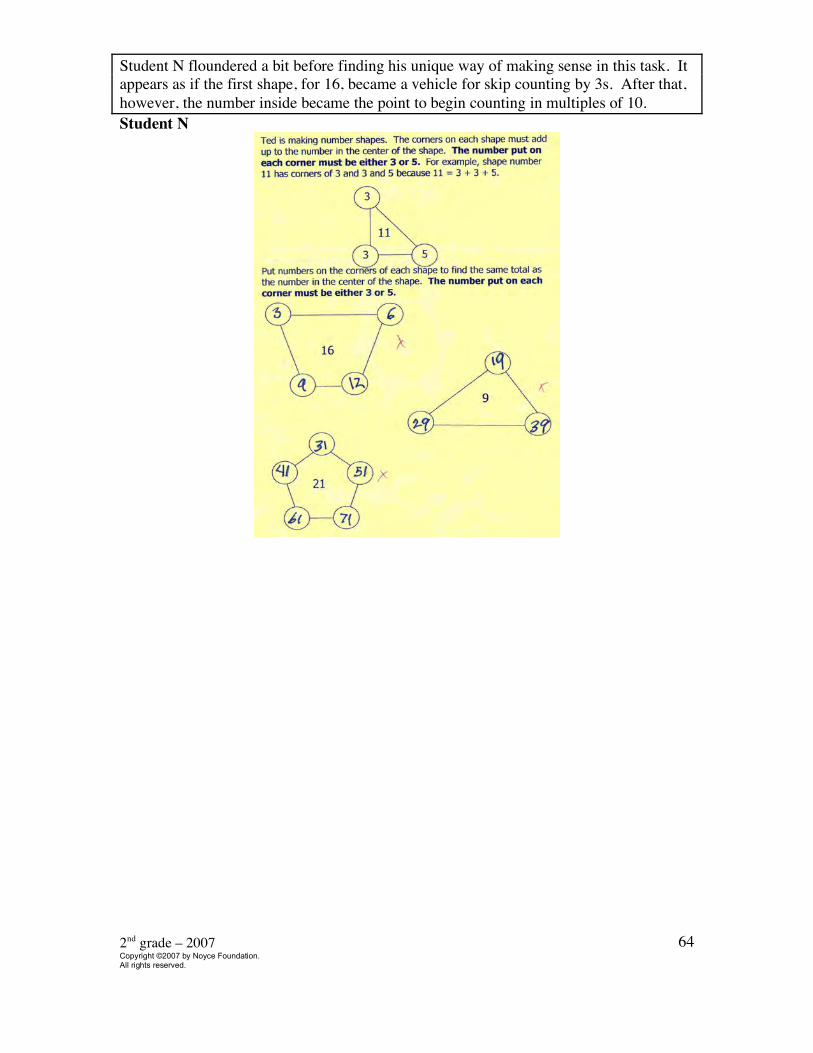
Student N floundered a bit before finding his unique way of making sense in this task. It appears as if the first shape, for 16, became a vehicle for skip counting by 3s. After that, however, the number inside became the point to begin counting in multiples of 10. Student N
2nd grade – 2007 Copyright ©2007 by Noyce Foundation. All rights reserved.
65
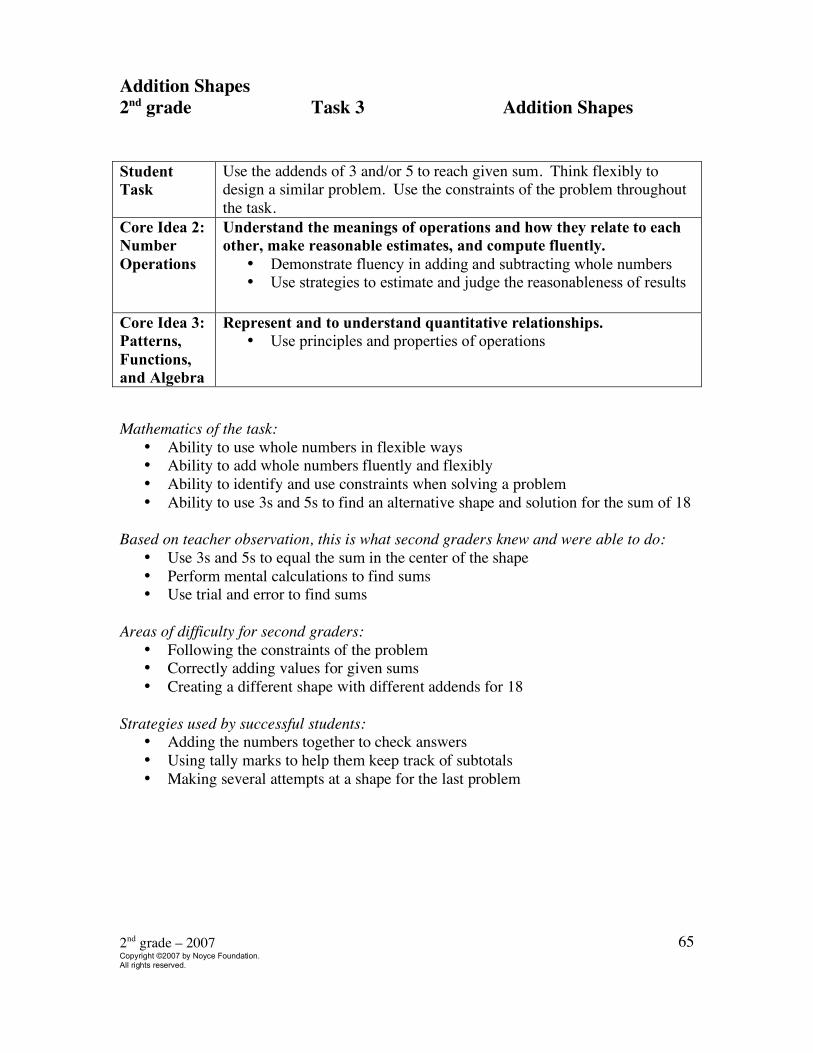
Addition Shapes 2nd grade Task 3 Addition Shapes Student Task
Use the addends of 3 and/or 5 to reach given sum. Think flexibly to design a similar problem. Use the constraints of the problem throughout the task.
Core Idea 2: Number Operations
Understand the meanings of operations and how they relate to each other, make reasonable estimates, and compute fluently.
• Demonstrate fluency in adding and subtracting whole numbers • Use strategies to estimate and judge the reasonableness of results
Core Idea 3: Patterns, Functions, and Algebra
Represent and to understand quantitative relationships. • Use principles and properties of operations
Mathematics of the task:
• Ability to use whole numbers in flexible ways • Ability to add whole numbers fluently and flexibly • Ability to identify and use constraints when solving a problem • Ability to use 3s and 5s to find an alternative shape and solution for the sum of 18
Based on teacher observation, this is what second graders knew and were able to do: • Use 3s and 5s to equal the sum in the center of the shape • Perform mental calculations to find sums • Use trial and error to find sums
Areas of difficulty for second graders: • Following the constraints of the problem • Correctly adding values for given sums • Creating a different shape with different addends for 18
Strategies used by successful students: • Adding the numbers together to check answers • Using tally marks to help them keep track of subtotals • Making several attempts at a shape for the last problem
2nd grade – 2007 Copyright ©2007 by Noyce Foundation. All rights reserved.
66
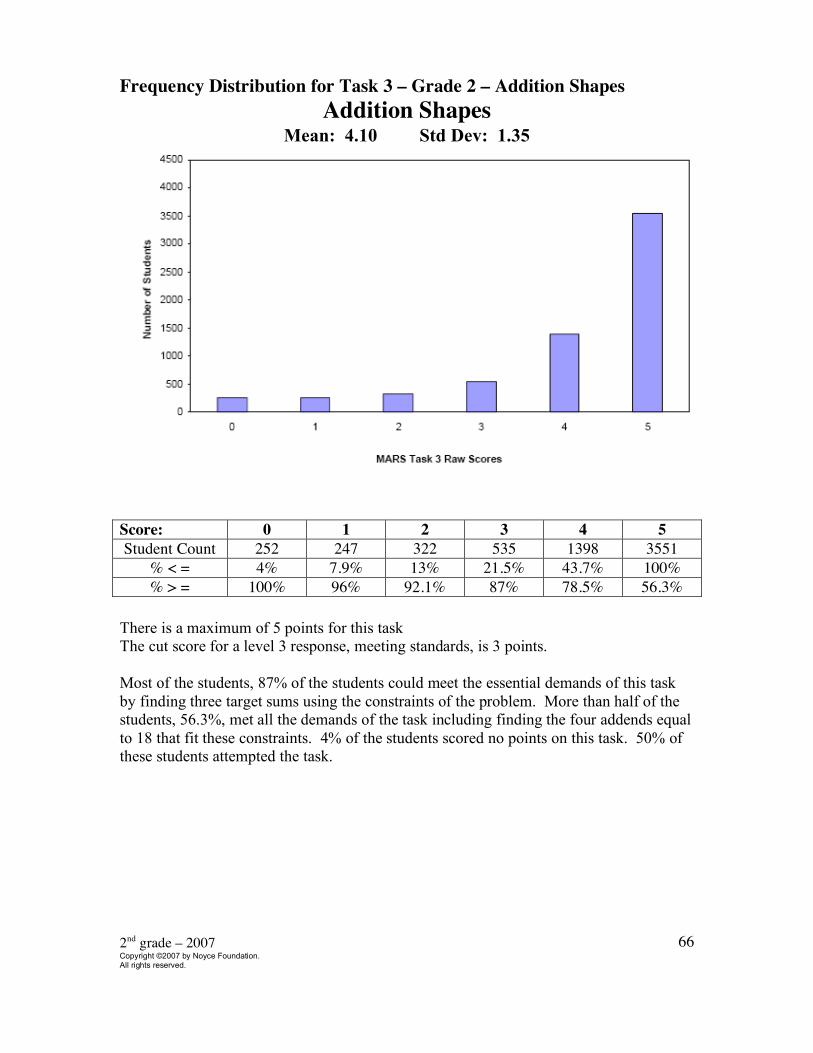
Frequency Distribution for Task 3 – Grade 2 – Addition Shapes
Addition Shapes Mean: 4.10 Std Dev: 1.35
Score: 0 1 2 3 4 5 Student Count 252 247 322 535 1398 3551
% < = 4% 7.9% 13% 21.5% 43.7% 100% % > = 100% 96% 92.1% 87% 78.5% 56.3%
There is a maximum of 5 points for this task The cut score for a level 3 response, meeting standards, is 3 points. Most of the students, 87% of the students could meet the essential demands of this task by finding three target sums using the constraints of the problem. More than half of the students, 56.3%, met all the demands of the task including finding the four addends equal to 18 that fit these constraints. 4% of the students scored no points on this task. 50% of these students attempted the task.
2nd grade – 2007 Copyright ©2007 by Noyce Foundation. All rights reserved.
67
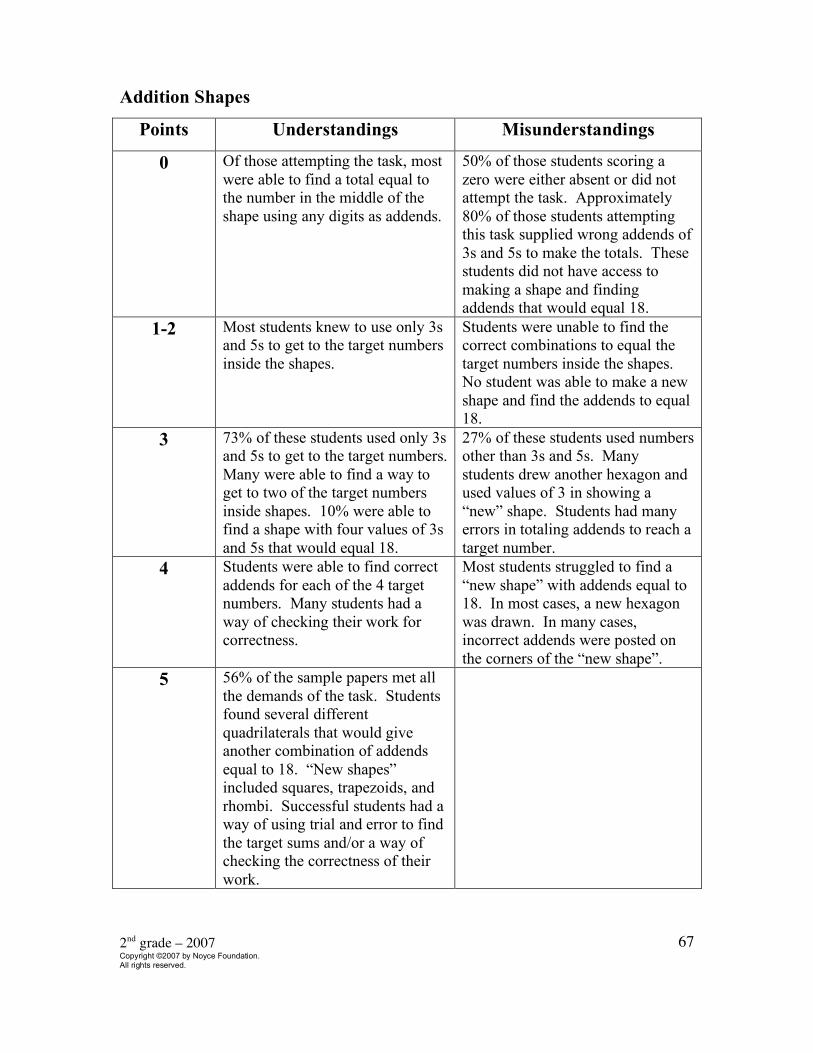
Addition Shapes
Points Understandings Misunderstandings
0 Of those attempting the task, most were able to find a total equal to the number in the middle of the shape using any digits as addends.
50% of those students scoring a zero were either absent or did not attempt the task. Approximately 80% of those students attempting this task supplied wrong addends of 3s and 5s to make the totals. These students did not have access to making a shape and finding addends that would equal 18.
1-2 Most students knew to use only 3s and 5s to get to the target numbers inside the shapes.
Students were unable to find the correct combinations to equal the target numbers inside the shapes. No student was able to make a new shape and find the addends to equal 18.
3 73% of these students used only 3s and 5s to get to the target numbers. Many were able to find a way to get to two of the target numbers inside shapes. 10% were able to find a shape with four values of 3s and 5s that would equal 18.
27% of these students used numbers other than 3s and 5s. Many students drew another hexagon and used values of 3 in showing a “new” shape. Students had many errors in totaling addends to reach a target number.
4 Students were able to find correct addends for each of the 4 target numbers. Many students had a way of checking their work for correctness.
Most students struggled to find a “new shape” with addends equal to 18. In most cases, a new hexagon was drawn. In many cases, incorrect addends were posted on the corners of the “new shape”.
5 56% of the sample papers met all the demands of the task. Students found several different quadrilaterals that would give another combination of addends equal to 18. “New shapes” included squares, trapezoids, and rhombi. Successful students had a way of using trial and error to find the target sums and/or a way of checking the correctness of their work.
2nd grade – 2007 Copyright ©2007 by Noyce Foundation. All rights reserved.
68
Implications for Instruction: The concepts and skills necessary to understand number and operations are the emphasis of the early elementary years. Our students come to us with informal knowledge of numbers that is rich and varied and as they work with more and more complex tasks in a variety of settings, they deepen their understanding of operations and number. Students at this grade level need to solve story problems, play number games and participate in mathematical investigations that allow them to use and share efficient and accurate strategies. Through these varied settings, students can encounter the same numbers in different situations, notice and use the inverse relationships between addition and subtraction, solve missing addend problems and most importantly share their strategies, explain the strategies of others and “try on” another student’s strategy. Our goal is always to compute efficiently and accurately and this can become a cornerstone of the discussion process when sharing strategies. An efficient strategy is one that can be done quickly and mentally. The emphasis is on efficient. Counting is not efficient. We want students to build and use number relationships to increase efficiency and accuracy. Take, for example, the addition shape with the target sum of 16. It has four addends of either 3s or 5s. What number relationships would you want your students to use to solve this problem efficiently and accurately? What missteps might you expect? Answer these two questions before reading on. Would you want your students to be making a ten with two fives? What next step might happen? Hopefully, some of the earlier taught and practiced doubles facts might come into play in solving this addition shape. Making these strategies explicit in your class discussions will help build flexible thinkers and doers. The ability to think of numbers in terms of part-whole relationships is one of the landmarks important to building flexible and fluent mathematics students. We want students to understand that a quantity can be decomposed into different sized parts and that those chunks can be composed back into the original quantity. This ability to deal with part –whole relationships allows student to go beyond simple counting to more efficient solutions of number problems. Most listings of mathematics standards, be they state, national or district standards, include the standard of computing fluently. Students with a strong, flexible understanding of number relationships and of efficient and accurate strategies can compute fluently. They can apply what they know to new situations. Fluency happens through meaningful practice rather than from drill of isolated skills. Meaningful practice would include practice of efficient strategies, practice with calculators, with mental addition and subtraction problems as well as paper and pencil practice. We help most when we provide tasks that help develop the relationships within addition and subtraction and that allow us to elicit the sharing of efficient and accurate strategies.
2nd grade – 2007 Copyright ©2007 by Noyce Foundation. All rights reserved.
69
Ideas for Action Research: Think of an addition or subtraction story problem. Early in the year it might be one that subtracts a single digit number from a double digit number. Create a context that is familiar and pose the problem. Encourage your students to find at least two ways to solve the problem. Make sure that manipulatives, math tools and writing materials are available. As the students work, note which strategies they are using. Are they efficient? Are they accurate? Assess their understanding by asking them to explain the reasons for each step in their solutions. Have the students present the various solutions to the class. Have students share one another’s strategies but explain them in their own words. Only students who understand the solutions may explain it. Invite other students to discuss and evaluate each strategy for its efficiency. Try to avoid indicating that you value one strategy more than another. Over the next few months, pose a similar problem and debrief in a similar fashion. Determine whether student understanding increases and whether students progress naturally toward more accurate and efficient strategies.