background report reference section number: 1 1 · · 2015-09-10gaseous results and example...
TRANSCRIPT

Background Report Reference
AP-42 Section Number: 1 1.17
Background Chapter: 4
Reference Number: 33
Title: Emission Testing report of Woodville Lime and Chemical Company
PEDCO Environmental
PEDCO Environmental
July 1974

-!
PEDCO- ENVIRONMENTAL SUITE13 * A T K I N S O N S O U A R E
CINCINNATI. OHIO 4 5 2 4 6 513 1 7 7 1 - 4 3 3 0
E M I S S I O N T E S T I N G REPORT
E P A REPORT 74-LIM-3-A
WOODVILLE LIME AND WOODVILLE ,
Prepared by:
W i l l i a m G. D e W e e s R i c h a r d W. G e r s t l e , P . E .
P E D C o - E n v i r o n m e n t a l S p e c i a l i s t s S u i t e 13, A t k i n s o n Square
C i n c i n n a t i , O h i o 45246
C o n t r a c t N o . 68-02-0237 T a s k O r d e r N o . 2 6

PEDCO - ENVlR0NMENTA.L SUITE13 * A T K I N S O N SOUARE
t i CINCINNATI. OHIO 4 5 2 4 6 513 / 7 7 1 - 4 3 3 0
EMISSION T E S T I N G REPORT
EPA REPORT 74-LIM-3-A
WOODVILLE LIME AND CHEMICAL CO. WOODVILLE, OHIO
FINAL
P r e p a r e d by:
W i l l i a m G. D e W e e s R i c h a r d W. G e r s t l e , P . E .
P E D C o - E n v i r o n m e n t a l Spec ia l i s t s , I n c . S u i t e 1 3 , A t k i n s o n Square
C i n c i n n a t i , O h i o 4 5 2 4 6
c
C o n t r a c t N o . 6 8 - 0 2 - 0 2 3 7 T a s k O r d e r N o . 26

I. TABLE OF CONTENTS
11. INTRODUCTION
111. SUMMARY OF RESULTS
1
3
I V . PROCESS D E S C R I P T I O N 9
V. LOCATION O F SAMPLING P O I N T S 11
V I . PROCESS OPERATION 13
V I I . SAMPLING AND ANALYTICAL PROCEDURES 1 6
A P P E N D I C E S
A. PARTICULATE RESULTS AND EXAMPLE CALCULATIONS
B. GASEOUS RESULTS AND EXAMPLE CALCULATION
C. V I S I B L E E M I S S I O N RESULTS
D. OPERATIONAL RESULTS
E . F I E L D DATA
F. LAB REPORT
G. SAMPLING METHODS
H . T E S T LOG
I . RELATED REPORTS
J. P R O J E C T P A R T I C I P A N T S
K. SUMMARY OF T E S T I N G COST

I II z L 11. INTRODUCTION
.
Ir I' 1
Under t h e Clean A i r A c t of 1 9 7 0 , as amended, t h e Environ-
mental P r o t e c t i o n Agency (EPA) is charged w i t h t h e e s t a b l i s h m e n t
of performance s t a n d a r d s for s t a t i o n a r y s o u r c e s which may con-
t r i b u t e s i g n i f i c a n t l y t o a i r p o l l u t i o n . A performance s t a n d a r d
is based on t h e best emiss ion r e d u c t i o n systems which have been
shown t o be t e c h n i c a l l y and economical ly f e a s i b l e .
I n order t o set r e a l i s t i c performance s t a n d a r d s , a c c u r a t e
d a t a on p o l l u t a n t emiss ions must be g a t h e r e d from t h e s t a t i o n a r y
source ca t egory under c o n s i d e r a t i o n .
Woodville L i m e and Chemical Company i n Woodville, Ohio, was
d e s i g n a t e d as a w e l l - c o n t r o l l e d s t a t i o n a r y source i n t h e l i m e
producing i n d u s t r y and w a s t he reby s e l e c t e d by EPA f o r an e m i s s i o n
t e s t i n g program. The tests w e r e conducted d u r i n g t h e p e r i o d of
May 2 0 t o 21, 1 9 7 4 . The p r o c e s s under i n v e s t i g a t i o n i n t h i s t e s t
series was t h e N o . 1 l i m e k i l n a t t h e Woodville p l a n t . E m i s s i o n s
from t h e l i m e k i l n are c o n t r o l l e d by a cyclone i n series w i t h a n
e l e c t r o s t a t i c p r e c i p i t a t o r . During t h e t e s t p e r i o d d i f f i c u l t i e s
encountered wi th p rocess o p e r a t i o n and above-normal p roduc t ion
r a t e s r e s u l t e d i n n o n t y p i c a l e m i s s i o n s ; t h e t es t program was
t h e r e f o r e r e schedu led for a l a t e r d a t e ( J u l y 8 , 1 9 7 4 ) .
R e s u l t s o b t a i n e d i n p r e l i m i n a r y t e s t i n g on May 20 and i n
one complete tes t on May 2 1 are p r e s e n t e d h e r e . The complete
1 I

tes t run inc luded measurements o f f i l t e r a b l e p a r t i c u l a t e s , t o t a l
p a r t i c u l a t e , ox ides of n i t r o g e n , and s u l f u r d i o x i d e i n e f f l u e n t
from t h e e x i t s t a c k o f t h e l i m e k i l n . I n a d d i t i o n , mo i s tu re
c o n t e n t and dry molecular weight of t h e e x i t gas were de termined ,
and o p a c i t y of v i s i b l e emis s ions was recorded by two t r a i n e d
o b s e r v e r s and a l s o w i t h a cont inuous o p a c i t y t ransmissometer .
E 1 I ff
2

111. SUMMARY OF RESULTS
A summary o f d a t a on p a r t i c u l a t e emiss ions from t h e No. 1
l i m e k i l n ESP e x i t s t a c k is p r e s e n t e d i n Table 1. The p re -
l imina ry test ( A ) , which was conducted on May 2 0 , 1974, covered
on ly 40 of t h e 48 t r a v e r s e p o i n t s ; t h e second t e s t ( N o . 11, con-
duc ted on May 21, 1974, covered on ly 44 of t h e 48 t r a v e r s e
p o i n t s . I n a d d i t i o n , t h e p l a n t was o p e r a t i n g a t an above-normal
product ion r a t e , which caused o v e r l o a d i n g of t h e ESP emiss ion
c o n t r o l dev ice . The re fo re , t h e emis s ions d a t a p r e s e n t e d i n
t h i s r e p o r t a r e cons ide red t o be q u e s t i o n a b l e and n o n r e p r e s e n t a t i v e
of a w e l l - c o n t r o l l e d l i m e p roducing p rocess .
The EPA Process Engineer dec ided t o conduct s e v e r a l tests
on t h e e f f l u e n t g a s s t r e a m from t h e ESP even though t h e p r o c e s s
r a t e exceeded normal o p e r a t i o n a l parameters . This d e c i s i o n was
based on t h e need f o r i n f o r m a t i o n w i t h which t o de termine
c o r r e l a t i o n of emiss ions c o n c e n t r a t i o n s and v i s i b l e o p a c i t y
o b s e r v a t i o n s . EPA had t r a n s p o r t e d t o t h e p l a n t s i t e a cont inuous
moni tor ing t ransmissometer f o r o p a c i t y measurements; t h e emission
measurements t h e r e f o r e were performed f o r purposes of c o r r e l a t i o n
w i t h r ead ings from t h i s i n s t r u m e n t , even though emiss ion rates
were known t o be above normal f o r t h i s p l a n t .
The f i l t e r a b l e p a r t i c u l a t e , as measured by t h e probe and
f i l t e r c a t c h , averaged 30.35 pounds p e r hour a t a c o n c e n t r a t i o n of
3

Tab le 1. SU!IIARY OF PARTICULATE RESULTS L1I"IE KILN
1 Average - A - Run Number
Date 5/20/74 5/21/74
Volume of G a s Sampled, - DSCFa 56.155 121.814
Average S t a c k Temperature , OF 675 686 681
Percent M o i s t u r e by Volume 12.17 10.65 1 1 . 4 1
S t ack V o l u m e t r i c Flow Rate, DSCFMb 26994 27142 27068
S tack Volunietric Flow R a t e , ACFMC 66504 66504 66504
P e r c e n t I s o k i n e t i c 99.3 98.2
Feed Rate, ton /h r
P a r t i c u l a t e s - probe , bypass, and f i l t e r c a t c h
mg 277.2 1463.4
gr/DSCF 0.0762 0.1854 0.131
gl-/ACF 0.0310 0.0757 0.0533
l b / h r 17.6 43.1 30.35
lb / ton
P a r t i c u l a t e s - t o t a l
*3 635.2 1586.8
gr/DSCF
gr /A:: F
lb/i..r 40.4 46.8 43.6
.~
0.1746 0.2010 0.188
0.0710 0.0820 0.0765
lb / ton - ..
a D r y s t a n d a r d c u b i c f e e t a t 7OoF, 29.92 i n Hg. Dry s t a n d a r d c u b i c f ee t per m i n u t e a t 70°F, 29.92 i n . Hg. a c t u a l c u b i c f ee t p e r minute . C
4

0.131 g r a i n s p e r DSCF. T o t a l p a r t i c u l a t e emiss ions averaged 43.6
pounds p e r hour a t a c o n c e n t r a t i o n of 0.188 g r a i n s p e r DSCF.
R e s u l t s of t h e second tes t y i e l d e d h i g h e r c o n c e n t r a t i o n s o f
f i l t e r a b l e p a r t i c u l a t e t han were o b t a i n e d i n t h e f i r s t t e s t ,
probably because of d i s c o n t i n u i t i e s i n p rocess o p e r a t i o n and
p roduc t ion r a t e s .
Emissions of ox ides of n i t r o g e n and s u l f u r d i o x i d e were
determined only d u r i n g t h e second t e s t . A summary of ox ides
of n i t r o g e n d a t a i s p r e s e n t e d i n Table 2. These d a t a show
average emiss ions of 481 ppm by volume and 93.2 pounds p e r hour .
The method f o r sampling of s u l f u r d i o x i d e w a s i n t ended t o
measure emis s ions i n t h e 1 0 0 0 ppm range. Ana lys i s of t h e samples
o b t a i n e d , however, showed s u l f u r d i o x i d e c o n c e n t r a t i o n s much
lower t h a n t h o s e expec ted , about 2 0 ppm; sample volume was t h e r e -
f o r e inadequa te t o y i e l d measurable r e s u l t s . Th i s l o w concen-
t r a t i o n w a s a t t r i b u t a b l e t o t h e n e u t r a l i z a t i o n o f t h e s u l f u r
d i o x i d e by t h e a l k a l i n e d u s t produced i n t h e p r o c e s s .
Determina t ions of v i s u a l o p a c i t y of emiss ions from t h e l i m e
k i l n s t a c k were performed independen t ly by two PEDCo p e r s o n n e l
u s ing F e d e r a l R e g i s t e r Method 9 . Opaci ty was also measured by t h e
Lear S i e g l e r cont inuous t r ansmissomete r . Data on v i s i b l e emiss ions
are summarized i n Tab le 3 . The average o p a c i t y was 1 4 p e r c e n t
f o r a l l r e a d i n g s d u r i n g t h e test p e r i o d s .
l e v e l was exceeded abou t 8.5 p e r c e n t of t h e t e s t t i m e . T h i s h igh
v i s i b l e o p a c i t y was a n o t h e r i n d i c a t i o n o f emiss ions much h i g h e r
than t h o s e expec ted .
A 20 p e r c e n t o p a c i t y
5

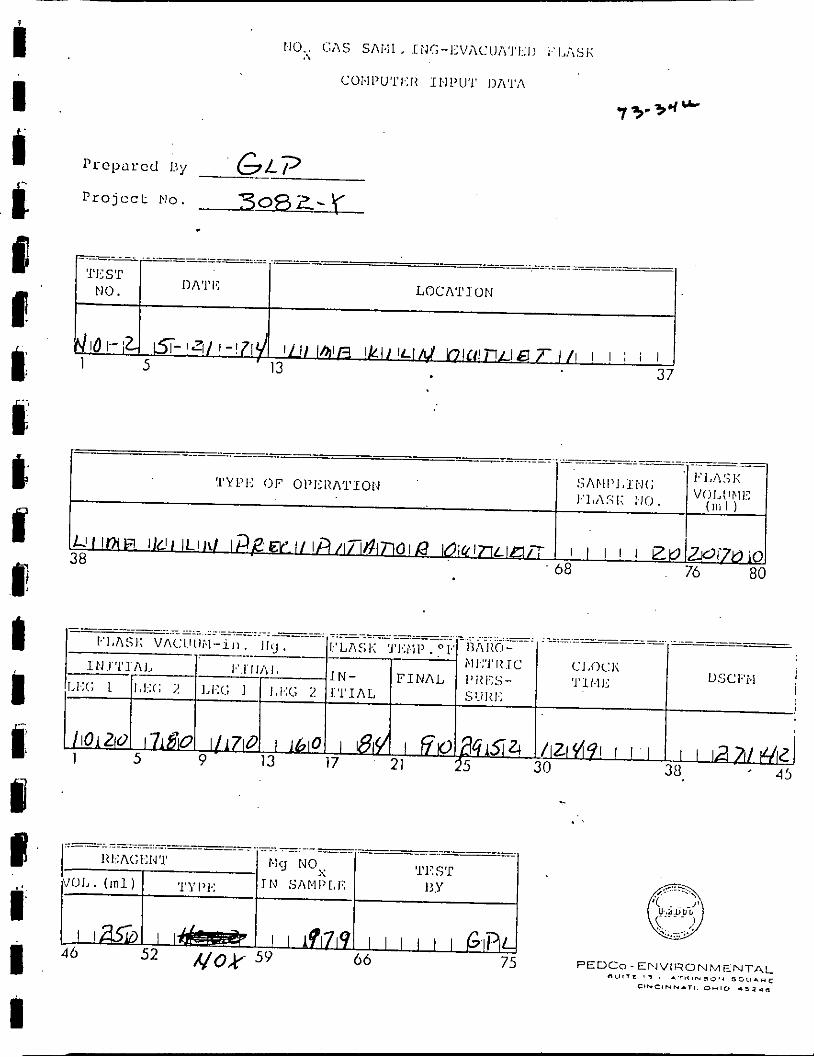
T a b l e 2. SUMMARY OF NITROGEN OXIDES EMISSIONS FROM
LIME KILN
T e s t no. 2 - 3 - Date : 5/21/74 5/21/74
T ime , 24 h r 1 2 4 9 1 3 3 9
Flow rate, DSCFM 27142 27142
Sample volume, m l 1025 .46 1145 .04
Mi l l i g rams of NO2 0 .979 1 . 0 0 9
Concent ra t ion , ppm 500 .7 462 .2
Emiss ions , l b / h r 9 6 . 9 4 89 .48
6
Aver a g e column
27142
481.5
9 3 . 2 1

Run No. 2 Table 3. 'Summary of Visual Opacity Readings
0
28.9
59.4
__ --
I I
Date 5/21/74
I n t e r v a l o f O b s e r v a t i o n s 1 Start
. . .End
Lear ~
S i e g l e r U l G . 1 ... r .... 2 . CI!5. 1 ...... -. . 011.. . .......
.
.
1158 1158
1441 1458 __.-
Dura t ion o f O b s e r v a t i o n ( : t i in) 2
l o t a l Ho. of Readings 3
tnqs Unobservab le
rigs 0 0'; Upaci ty
163 .....
180
653 720
- Ho. o f Read
No. o f Read 0
0 __ 4
.....
- ..
. - - .. - .
- . ...
... .
.
. . _. -. .
. . . .
........
--. - -
.........
....
..........
.. ~. .
. . . _. ..
........
.....
. . . . . . .
-- ..
5 7;
10%
15%
20::
' 2 5 X
307;
35%
4 0;;
45%
50%
I 'erccnt Readings Utiol:
118 I o 189
388 -.
'201 I 42
11 I I
270
64 54 14
0
0
____ .-
21 22
15 1 - ..... ~
I.."..' 0'' 0 18
' 6 0
0 - -
- 2 -
0 0 0 .. -
0
0 __--
rvabl - 0.6
16.4
27.9
37.5
8.9
8.8
...
....
52.5
. 30.0
17.5
--
. - . . . . ...........
.............. ......
I o
......
8.3
3.4
- ........
...... ..
.............
1' I i

i The t e s t i n g series was terminated by O M personnel before
the des i red number o f tests were run because the l i m e k i l n was
running a t a h igh production r a t e , and v i s i b l e emissions were
exceeding the average 5 percent opaci ty l e v e l t h a t was normal
for t h e No. 1 l i m e k i l n e x i t s tack .
I 1
I
f
a

IV. PROCESS DESCRIPTION
Limestone consisting primarily of calcium carbonate or combina-
tions of calcium and magnesium carbonate with varying amounts of
impurities is quarried at the Woodville Plant. The limestone is
calcined or burned to form lime, commonly divided into two basic pro-
ducts--quicklime and hydrated lime. Calcination expels carbon
dioxide from the raw limestone, leaving calcium oxide (quicklime).
With the addition of water, calcium hydroxide (hydrated lime) is
formed.
The basic processes in production are: (1) quarrying the lime-
stone raw material, ( 2 ) preparing the limestone for kilns by crushing
and sizing, ( 3 ) calcining the limestone, and ( 4 ) optionally processing
the quicklime,further by additional crushing and sizing followed by
hydration. The majority of lime is produced in rotary kilns which
can be fired by coal, oil, or gas. Rotary kilns have the advantage
of producing high production per man-hour and a more uniform product.
However, they do require higher capital investment and unit fuel
costs than most vertical kilns. .. The Woodville Lime and Chemical plant' has two rotary kilns
each equipped with a Buell electrostatic precipitator. The kilns
are almost identical. The feed for both is a dolomitic stone,
quarried on the site and fed in sizes ranging from 1 inch to
2 1/4 inches at a rate of about 700 tons per day. There is no
9

I I 1
1 1
0 1 1 I 1 0 1 1 I I I I
i
m
p r e h e a t e r . Normally t h e k i l n i s f u e l e d w i t h a mix tu re o f
95 p e r c e n t Number 6 f u e l o i l and 5 p e r c e n t n a t u r a l gas . Both
k i l n s have two h e a t t r a n s f e r s e c t i o n s , each 20 f e e t long . The
p roduc t , about 350 t o n s p e r day, is cooled i n a N e i m s c o o l e r b e f o r e
s t o r a g e . There is no p roduc t c r u s h i n g , b u t u n d e r s i z e m a t e r i a l
i s s e p a r a t e d and r e t u r n e d t o t h e k i l n . The m a j o r i t y of t h e
product i s used i n t h e steel i n d u s t r y , most ly i n b a s i c oxygen
fu rnaces ; none of t h e p roduc t i s hydra t ed .
The e l e c t r o s t a t i c p r e c i p i t a t o r on k i l n Number 1 was p u t i n
o p e r a t i o n i n J u l y 1971. I n t h i s k i l n t h e main p rocess f an is
l o c a t e d b e f o r e t h e ESP, w i t h a cyc lone b e f o r e t h e f a n t o reduce
f an b l a d e e r o s i o n . The p r e c i p i t a t o r on k i l n N u m b e r 2 w a s p u t i n
o p e r a t i o n i n December 1973. The main p rocess f a n i s a f t e r t h e
ESP and t h e r e is no cyc lone .
I n bo th systems t h e i n l e t g a s t o t h e p r e c i p i t a t o r s is cooled
t o about 600°F w i t h a combinat ion of wa te r i n j e c t i o n and/or
tempering a i r . Each p r e c i p i t a t o r h a s 28 ,800 squa re f e e t of
c o l l e c t i n g s u r f a c e area, which i n c l u d e s one c e l l and two f i e l d s ;
des ign gas v e l o c i t y i s 1 . 5 f e e t p e r second and t r e a t m e n t t i m e ,
1 0 . 0 seconds.
A t p r e s e n t t h e d u s t c o l l e c t e d from t h e p r e c i p i t a t o r s is
d i sposed o f i n t h e q u a r r y . I t i s expec ted t h a t i n t h e f u t u r e t h e
d u s t w i l l be g r a n u l a t e d and used as a component o f d r y mix
f e r t i l i z e r s t h a t are b lended i n a n o t h e r p a r t of t h e complex.
1 0

I I I 1 B I P I 8
V. LOCATION OF SAMPLING POINTS
F igure 1 shows t h e sampling ports and sampling p o i n t s used
i n t h e No. 1 l i m e k i l n e x i t s t a c k . The sampling p o r t s w e r e
l o c a t e d i n a 63.5-inch in s ide -d iame te r v e r t i c a l s t a c k , 4 f e e t
(0.75 d iame te r ) from t h e s t a c k e x i t , and 1 2 f e e t ( 2 . 2 6 d i ame te r s )
from t h e n e a r e s t downstream d i s t u r b a n c e . I n o r d e r t o m e e t t h e
sampling requi rements o f Methods 1 and 5 of t h e F e d e r a l R e g i s t e r ,
Vol. 36, N o . 2 4 7 , it was necessa ry t o i n s t a l l a s tack ex tens ion
on t h e ESP e x h a u s t o u t l e t . F o r t y - e i g h t t r a v e r s e p o i n t s ( 2 4
a long each of two p e r p e n d i c u l a r d i a m e t e r s ) w e r e used as d e s c r i b e d
i n t h e F e d e r a l R e g i s t e r Method 1. A d d i t i o n a l sampling p o i n t s i n
t h e e x i s t i n g s t a c k a t a lower s i t e were used f o r some of t h e gas
sampling.
11

-'
-1- i 4 8 "
Edge of r o o f
63.5' I.D.
24 24 i ) . . .. .. .. .. . . ....
W k - 4 , 1 I
C R O S S SECTION
All Dimensions in F e c i A r c Approximate +. Srofloldillg
IS" I
ELEVATION .. 1. I 3' -
SIDE V I E W
Figure 1 . T e s t Site-No. 1 Kiln P r e c i p i t a t o r Outlet .
1 2
0

V I . PROCESS OPERATION
The EPA p r o j e c t e n g i n e e r a r r i v e d a t t h e p l
13
n t t 3 00 p.m.
on Monday, May 20. A t t h i s t i m e t h e p l a n t was running a t 5 t o
1 0 p e r c e n t over t h e normal p roduc t ion r a t e . Because t h e
P f i z e r Chemical Company l i m e p l a n t i n Pe r rysburg , Ohio, had
j u s t gone on s t r i k e , p roduc t ion a t t h e Woodville p l a n t had
been i n c r e a s e d t o t h e a b s o l u t e maximum i n a n t i c i p a t i o n of
i n c r e a s e d demand. N e i t h e r s tack w a s clear ( abou t 20% o p a c i t y ) ,
and t h e ESP v o l t a g e and amps were r e a d i n g l o w . It was assumed
t h a t t h e h i g h e r o p a c i t y was due to t h e i n c r e a s e d product ion ra te ,
which caused t h e p rocess t o e m i t g r e a t e r c o n c e n t r a t i o n s of d u s t .
The k i l n f e e d rate was c a l c u l a t e d by m u l t i p l y i n g t h e f a c t o r of
t i m e s t h e t o t a l i n d i c a t e d tonnage recorded from t h e
c o n t r o l room s t o n e t o t a l i z e r m e t e r (see r e f e r e n c e l e t t e r i n
Appendix D ) .
On t h e morning of May 21, k i l n N o . 1 was p r o c e s s i n g an
average o f Y 9 c 6 e t o n s of s t o n e p e r hour. The ESP v o l t a g e and
amp read ings were s t i l l low, and o p a c i t y r ead ings s t i l l h igh
(about 1 5 % , w i t h some a s h i g h as 3 0 % ) . A wate? sp ray w a s added
t o t h e f e e d end of t h e k i l n t o i n c r e a s e t h e c o n d u c t i v i t y of t h e
gas stream i n t h e ESP , b u t no e f f e c t on c o l l e c t i o n performance
w a s n o t i c e d . P l a n t o f f i c i a l s b e l i e v e d t h a t i n c r e a s i n g t h e

i I b I 1 I 1 P 1 I I I BI
1 I I I I
m
product ion c a p a c i t y may have r e s u l t e d i n "heavy combust ib les"
( o i l ) p a s s i n g i n t o t h e ESP. T h i s o i l p o s s i b l y combined w i t h
d u s t t o b u i l d up a c o a t i n g on t h e w i r e s and p l a t e s . T h i s
c o a t i n g would e v e n t u a l l y be removed by t h e r a p p e r s b u t t h i s
p rocess might r e q u i r e s e v e r a l weeks. F u r t h e r t e s t i n g w a s p o s t -
poned u n t i l t h e t i m e when t h e p l a n t and t h e ESP resumed normal
o p e r a t i o n . The o p e r a t i n g v a r i a b l e s are summarized i n Table 4 .
14

I I I I I t 1 I I I I' 1 I I I li I I I
Table 4. SUMMARY OF OPERATING VARIABLES
Test No.
Stone fe d rate, (t
Oil rate, (gal/hr)
Gas to oil ratio, (BTU Basis)
Mid kiln temp. , (OF) Feed end tenp.,(OF)
Before ESP temp.,('F)
Stack temp. , (OF) Electrostatic Precipitator Data
A Field
Primary current,(amps)
Primary voltage, (volts)
Precipitator current, (amps)
B Field
Primary current, (amps)
Primary voltage,(volts)
Precipitator current, (amps)
1 - 3aa
1490-1530
1040-1100
690-740
675-710
35-46
210-245
0.17-0.21
22-39
200-245
0.12-0.21
._ NOTE: No operational data were collected during the
preliminary run on May 20, 1974.
15

V I I . SAMPLING AND ANALYTICAL PROCEDURES
Sampling procedures were d e s i g n a t e d by EPA. Analyses of
c o l l e c t e d samples were performed by PEDCo. Appendix G p r e s e n t s
d e t a i l e d sampling and a n a l y t i c a l p rocedures .
Ve loc i ty and G a s Temperature
G a s v e l o c i t i e s were measured w i t h a c a l i b r a t e d t y p e S
p i t o t tube and i n c l i n e d d r a f t gage. Velocit ies w e r e measured
a t each sampling p o i n t across t h e s tack d iame te r t o de termine
an average v a l u e accord ing t o procedures d e s c r i b e d i n t h e
Fede ra l Regis te r ' - Method 2.
t h e use of a .thermocouple.
Molecular Weight
Temperatures w e r e measured w i t h
A 4-hour i n t e g r a t e d sample o f t h e s t a c k g a s e s w a s c o l l e c t e d
du r ing t e s t 1 by pumping t h e gas i n t o a T e d l a r p l a s t i c bag a t
t h e ra te of approximate ly 0.005 CFM. T h i s bag sample was then
analyzed w i t h an O r s a t a n a l y z e r f o r C 0 2 , 02, and CO as d e s c r i b e d
i n t h e F e d e r a l R e g i s t e r , Method 3.
P a r t i c u l a t e s
Method 5 as d e s c r i b e d i n F e d e r a l Register- ,2 was used t o
measure p a r t i c u l a t e matter. A r i g i d t r a i n c o n s i s t i n g of a hea ted
g l a s s - l i n e d p robe , a 3" glass f i b e r f i l t e r , and a series of Green-
burg-Smith impingers , as shown i n F igu re 2 , w a s employed i n a l l
p a r t i c u l a t e tests.
1) F e d e r a l R e g i s t e r , V o l . 36, N o . 2 4 7 , December 23 , 1971. 2) F e d e r a l R e g i s t e r , V o l . 36 , N o . 1 5 9 , August 1 7 , 1971.
1 6

I I I I
..
I
I I I
i I I
Y U 4 .+

I I I i f 1 E Y f c B li E c i li i i I
Sampling was conducted under isokinetic conditions
by monitoring the velocity with a pitot tube and adjusting
the sampling rate accordingly. Because of the heavy dust
loading during a 4-hour test, two filter changes were required
during Test 1. After 131 minutes of testing on Test 1 the
high temperature and high vacuum pulled a hole in the poly-
vinyl vacuum line in the meter box. The hole was detected
immediately because of the vacuum that was required to sample.
The test was terminated at this point.
Sample recovery consisted of triple-rinsing the nozzle,
probe, cyclone by-pass, and front half of the filter holder
with acetone into a glass container. The back half of the
filter holder, impingers, and connecting tubes were first
rinsed with distilled water, then placed in a glass container
along with the impinger contents. These components were then
triple-rinsed with acetone and the washings placed in another
glass container. The filter was placed in a separate con-
tainer. Blank samples of water and acetone were also taken.
NO -X
Nitrogen oxides were collected in evacuated 2-liter
flasks containing 25 ml of a dilute sulfuric acid/hydrogen
peroxide absorbing solution. The sampling and analytical ._ procedure was as described in Method 7 of the Federal Register 1
except that the final flask vacuum was read immediately after
sampling.
1) Federal Register, Vol. 36, No. 247, December 2 3 , 1971.
18

I I I 1 P It 1: I' I( c
1 I P I I e I I I
r
The samples were ana lyzed by t h e PDSA method. Two samples
were l o s t i n t h e l a b by breakage.
so -2
S u l f u r d i o x i d e w a s determined by p a s s i n g a measured volume
of f l u e gas through a set o f midget impingers a t a r a t e of
approximately 0.025 cubic f o o t p e r minute. The f i r s t impinger
con ta ined 15 m l of 80 p e r c e n t i s o p r o p a n o l ; t h e second and t h i r d
impingers con ta ined 1 5 m l each of hydrogen pe rox ide i n wa te r
s o l u t i o n . The hydrogen pe rox ide s o l u t i o n was t i t r a t e d w i t h
barium c h l o r i d e us ing a Thorin i n d i c a t o r t o de te rmine s u l f u r
d i o x i d e (SO2). Because t h e c o n c e n t r a t i o n w a s so low, less than
1 m l o f t i t r a n t w a s r e q u i r e d and an a c c u r a t e measurement was
n o t p o s s i b l e .
..
1 9

i I c II P I I. P B I I I I I R e I I
APPENDIX A
PARTICULATE RESULTS AND
EXAMPLE CALCULATIONS
._

I I I c 1 I li I 1 I E I
Summary of P a r t i c u l a t e R e s u l t s
A
5/20/74
-
S a m p l i n g 'rime, 2 4 l i o u r clock 1630 - S a m p l i n g L o c a t i o n kiln o u t l e t
On S a m p l i n g l i o z z l c D i a m e t e r , i n . 0 .375
Net 'I'ime of '?est, I-iin. 60
1 7 4 5
'r t Bnromcki-j:c P r e s s u r e , i n . I I C J
I U J s o l u t e pb
A\i(:racje O r i f i c e P r e s s u r e in
I' D r o p , i n . 1I2O
29.62
2 . 6
V o l u m e o f I ) > - y Gas Sampled a t 56 .690 111
V Meter C o n d i t i o n s , D C F
Average Gas Lleter T e m p e r a t u r e , 7 3 'I'm 0 l7
VcI1I.IIIl':! of u1:y t ias s,llllplccl a t 56 .155 ni V
std ~ t a n d a r d ~ o n d i t i o n s " , DSCF
v GI l ' 0 1 : a . L I l . > C ) ~ : o J . I . e c t e t l i n I m p i n - 1 6 4 . 2 g c r s hiid S i l i c a Gel, n i l
gas a t S t a n d a r d ~ o n c ~ i t i o n s b , S C F V o l u i i i c of W a t c r Vapor C o l l e c t e d 7 . 7 8 3 "w
a bl % ; l o i . s k u r e i n S t a c k G a s , by Volume
Nolc F r a c t i o n of Dry Gas d i.1 I 'b LO2 Volume % . ~ r y
V o l u i n e % Dry
5 CO Volume '2 D r y
VOlUlllC. : u1-y l, N2 -
E A . Percent Excess A i r
I'lWd M o l e c u l ~ i r W e i g h t of S t a c k G a s , Dry B a s i s I
I
1 2 . 1 7
.E783
27 .4
6.6
1
5/21 /74 .
-
1055 - 1 3 3 9
kiln o u t l e t
0 . 3 7 5
131
2 9 . 5 2
2 . 7 9
1 3 1 . 6 6 3
109
1 2 1 . 8 1 4
3 0 6 . 3
1 4 . 5 1 9
1 0 . 6 5
.E935
2 7 . 4
6.6
L 0 0
66.0 66.0 -
32 .65 32 .65

I.iW
c P
TS
N P
Pst
pS
vs
AS
O.5
Qa
% I
% ’ 0
Tc
mf
t m
I C
‘an
‘a0
k U I 1 1:o.
Nolecu la r I.!cicJht of S t a c k Gas, Wet B a s i s
P i t o t Tube C o e f f i c i e n t
A v e r a g e S t ack Tempera ture , O F
N e t Sampling P o i n t s
S t a t i c P r e s s u r e of S tack Gas, i n . Ily
S t ack Gas P r e s s u r e , i n . big Absolute
S t a c k Gas Veloc . i ty a t S t a c k C o n d i t i o n s , fpm
2 S t a c k A r e a , f t
Dry S t a c k Gas Volumetr ic Flow . Rate a t S tanda rd C o n d i t i o n s ,c DSCFI.1
S t a d : Gas V o l w w t r i c Flow K a t e a t S t ack Cond i t ions , ACFI4
Percent Is o k i n e t i c
P e r c e n t Opaci ty
Unit Product ion Rate - t o n s / h r . and F i l t e r , mg
P a r t i c u l a t c - Probe , C y c l o n e ,
P a r t i c u l a t e - T o t a l , mg
% Impinger Catch
P a r t i c u l a t e - Probe, Cyclone , and F i l t e r , yr/SCF
P a r t i c u l a t e - T o t a l , gr/SCF
A -
30.87
.83
6 75
40
.026
29.65
3017
21.992
26994
66504
99.3
- -
277.2
635.2
56
.076
.- .175
1 -
31.09
.83
686
44
.026
29.55
3014
21.992
27142
66504
98.2
14 - 1463.4
1586.8
8
-185
-201

ii1.111 ;io. I P a r L i c u l a t c - l'rol,c, Cyclone,
Ji lc i F i l t e r , gr/iiCF C a t I P a l - t i c u l a t c - T o t a l , gr/i\CF
Particulate - P r o l x , Cyclone',
aU C
C aw r i and Filter, l b j h r .
P a r t i c u l a t e - ' T o t a l , lb / l i r . ax C
P a r t i c u l a t e - Probe , Cyclone and F i l t e r , l b / t o n P t f
P a r t i . c u l a t c - T o t a l , l b / t o n Ptt
1 - A -
.031 .076
.071 .082
17.6 43.1
40.4 46.8
- --..13Lc1
._ Bl - a- u r y standard c u b i c f e e t at 7 0 ° P , 2 9 . 9 2 i n . l l y .
S t anda rd c o n d i t i o n s a t 7 0 ° F , 29.92 i n . Ilg.
Dry s t a n d a r d c u b i c fee t p e r m i n u t e 'at 7OoI?, 2 9 . 9 2 in. I I ~ . C
i I

EXAMPLE CALCULAIIONS USING TEST 1 DATA
1. Volume of dry3gas sampled a t s tandard c o n d i t i o n s - 7OoF, 29.92" H g . f t .
Vmstd
vm (% +&) ~
(Tm + 4 6 0 )
1 ( 1 7 . 7 1 ) ( 1 3 1 . 6 6 3 ) ( 2 9 . 5 2 + 13.6 2 .79
. . (109 + 460) ,121.8 1 4
3 2 . Volume of water vapor a t 7 0 ° F & 29 .92" H g , F t .
= 0.0474 X Vw gas
"W
3 . % mois-ture i n s t a c k
1 0 0 x vw %M = gas =
gas + vw s t d vnl
3 = F t . 3 = ( . 0 4 7 4 ) ( 3 0 6 . 3 ) = 1 4 . 5 1 9 S t d f t
(100 X 1 4 . 5 1 9 ) = 1 0 . 6 5 %
( 1 2 1 . 8 1 4 ) + ( 1 4 . 5 1 9 )
4. Mole f r a c t i o n of d r y gas
Md E 100 - %M - (100) - (10 .65) - 1 0 0 = 0 .8935
1 0 0
5. Average molecular w e i g h t of d r y s t a c k gas'.
M W = ( % C 0 2 X 44) + ( % 0 2 X 2) + ( % N 2 X - 2 8 ) 1 0 0 1 0 0 1 0 0
= (27 .4 X . 4 4 ) + (6 .6 X . 3 2 ) + (66 X . 2 8 ) = 32 .65

L I I I I I I I 1 1 P 1 I I I) I I I I
6. Molecular we igh t of s t a c k gas
M W = M W X Md + 18 (1 - Ma) d
= (32.65) (.8935) + (18) (.1065) = 31.09 7. S t a c k v e l o c i t y @ s t a c k c o n d i t i o n s , fprn
- -
1/2 = 3014 1
vs P s
55) (31.09) = (5128.8) (.E31 \1(.403) (686 + 460) 0. S t a c k g a s volume @ s t a n d a r d c o n d i t i o n s , (&%I
17.71 X Vs X As X Ma X Ps Qs = = s c m =
(T + 460) S
9. P e r c e n t i s o k i n e t i c
(17.71) (3014) (21.992) (.8935) (29.55)
(686 + 460) = 27116
1 0 3 2 X (Ts + 460) X V, s t d - (1032) (686 + 460) (121.813) - %I =
Vs X Tt X Ps X Ma X (D,) 2 (3014) (131) (29.55) (.8935) ( . 3 7 ~ ) ~
= 98%
1 0 . P a r t i c u l a t e - p r o b e , c y c l o n e , & f i l t e r , gr/SCF
._

I I c. c 4
c’ I i
11. P a r t i c u l a t e t o t a l , gr/SCF
(.01543) (1586.8) = .201 = 0.01543 X’’’t = - ‘ao .. (121.813) V
s t d m
12. P a r t i c u l a t e - p r o b e , cyc lone & f i l t e r , gr/CF a t s t a c k c o n d i t i o n s
17.71 X Can X P X Md S (17.71) ( .185) (29.55) ( .8935) - - - - ‘at
(686 + 460) (Ts + 460)
= .0755.
13 . P a r t i c u l a t e - t o t a l , gr/CF @ s t a c k c o n d i t i o n s
17.71 X Cao X Ps X Md - - E (17.71) ( .201) (29.55) ( .8935)
‘au (Ts + 460) (686 + 460)
= .082
1 4 . P a r t i c u l a t e - probe, c y c l o n e , & f i l t e r , l b / h r .
= 0.00857 X Can X Q, = ( .00857) (0.185) (27116) = 4.3.0 ‘aw ..
15 . P a r t i c u l a t e - t o t a l , Ib /h r .
= 0.00857 X Cao X Q, = (.00857) (0.201) (27116) = 46.7 ‘ax

r . _ . I__. __._ .. .. . . .. ,..
.. .: , I" c ,* r.
(9 *
4
(L W 9 L 3 z z 3 a
e W _I c 3 0
z J
Y
"1 r A I
z 0
4 u 0 J
13 z
... c
I
m E u.
W
* I-
0 w w r r z a m w c 3 x
c.- z w o o x z . T O X w - m o
n m w w w
W _ I Z J ( L m w 3 a w 0 N Y ) X C r c o - a w n p a n z
n
K
a j 3 r n I' -23
E I-
W
3 0 U Z - Z NVI C D .Dm ( L U J .. a - ~ - a n o N
m 4
I
i I i
O P O N N 1.
LL Y
0- Z P ..
0 : 0 - VIm . .. m : Q ,
- . - i 2 .
- I z- LL - Y n w
0 W " n - w m m z 3
Y C I C
U O 4 c
y
0
cj,
w n a o w
o r z
a m c w ~ o a u U ~ X E
e m W W
ILOK C X
111 m " c . r c w u w w c
I L W W
' I
I 1 W
c 3 z I r VI I. c(
IL w > 4 t 4
w
n n IL 0 u W
0 z P
? n U W E
" I . '
i
I I
7 o o l n m
N N N N N N N N
i l
~ O O ~ O O O O O ~ J d V I O m Q D I - I Q P ) m N m m m * ) m J * ,. ./. ./. _(. . . .
!
!
n 0 .
B , f


. . . . .., ... .
8 0 8 I
I I
I
I i
! i
i .I
!
i i I
! 1 i !
I i 1 I I I
: I I
! I, , I
I I I ! I
r a m K $1
A U 3h
A !- OI-
:E '5
.. 0 0

._..I,/ -. . . . . . -2. . . . . . . ..... . . . . . . . . . . . .i .- . . . . . I
i ' " 5
I I
I
i
1. i t:
i i I
I I
. i i i 1
e
f!
0 c I 0 W z J
VI v)
J w
- a
N L
y: m 3 I-
: 0 I 0 w I 3 10 10 4
0 0
c W v)
x 0 IU LllU z n w WLL c w W W a u r w
I
i i I
!
(u I- 3 z
i
1,
- i 0 :. *I
K W > w k
- . n -b. a
c 4
xb. o w rn 0 0
w u u o w
23 0 - e z
- w p v)m
Y i - P u o b at- a
z F i i
I / l i
0 0 e 0 0 0 0 0 0 0 0 0 0 0 0

. - ..... - . . . . . . . . . . ..-_.. ......... ...........__.I.. ._
b c 1 I I 1 1 I I I 1 I! I; m I ri I 1'
i
I
i I
0
r ?
2 w J
> 3 D 3 3 * 5
f
S J J 11
J
a a o a 0 0 0
B
! I
i
I I
i
i I I
i I
I I
i I
i i I I
I
i I
I I 0
Q
. . O
9
!
l
a a .

.. .... - .
Li
!
i N o m a m .. 4 ly
I I
j I
!
: 3 "
n L L
c U 4
* c
U 0 J w > UI 4 u Y U 4 I- @
* -
I. .c 'I - I. L
- q c
2 " " C 0 e
! >
. - N
s . .. N
L
I I
I I I I I I I I I I I I
I I
I
I
I- LL
3 U
. a I- @
C 1
- " 3
c 0
~
5
,
.L " 4 c YI
m .n 0 m
.
_I
5 u m 3 c II:
I
4 I- C I-
.. a
-
Y C (1 0 4 - c- m a I
o m
N
I .. 0 - Q J
j
W t 4 a
r 0,
2 W J
> 0 0 0 3
" L

APPENDIX B
GASEOUS RESULTS AND
EXAMPLE CALCULATIONS
._

i C i c: B I
NO2 CALCULATIONS
T e s t N o . 2
1. Sample Volume
Vs = (17.71) (Vo - 251111) - (:: - +,) where: Vs = Sample volume a t s t d . cond. , d r y
b a s i s , m l . = Volume of f l a s k and v a l v e , m l .
Pf = F i n a l a b s o l u t e pressure of f l a s k , in.Hg.
Pi = I n i t i a l a b s o l u t e pressure of f l a s k , i n . Hg. Tf = F i n a l a b s o l u t e t empera tu re of f l a s k , " R .
= I n i t i a l a b s o l u t e t empera tu re of f l a s k , " R . Ti
vO
f 27.22 - 11.52) V _ = (17.71) (2070 - 25rnl) ~~
544 /) . . 5 ' '\ .550
= 1025.5 m l . vS
2. PPM NO2
'S
where: C = Concen t ra t ion of N02,PPM.(dry b a s i s )
M = Mass of NO i n g a s sample, mg. V = G a s sample volume @ 7 0 C F and 29.92" Hg.
2 s
C = ( .5245) ( - 9 7 9 ) 106 .. 1025.5
C = 500.7PPM

3. LBS/HR NO^
M.W.
387 f t3/ lb-mole ER = (PPM) (0,) ( 60- m::)x ( w h e r e : ER = E m i s s i o n R a t e i n l b s / h r .
PPM= P a r t s per m i l l i o n NO2 ( d r y bas i s ) MW = M o l e c u l a r w e i g h t of N O 2 , 4 6 . 0 1
Q, = Dry s tandard cubic feet per m i n u t e
ER = ( 7 . 1 3 3 ) (PPM) (Q,) x
ER = (7 .133) ( 500.7) ( 27142 ) x
E R = 9 6 . 9 4 LBS/HR
a',;. .W'

N 'Sl
4 d
. N
L L J VI 3
cl 0
N f 4 IC N
. L + lJ J
.1( 0 L
.J . - L c 3 0
r r . . J 3 . t o
t s l sln
7 - J
.< $4
2 r- 3 U
+ P I
' 0 ul c
11 I 1 0' 3 3 .o f f + + .I-& L!l
.(I
4 .r <
L
3 J 3 >
3 1 I1
3 5 J LL
. L L a . . 3 3 * D .
. z -4
J 3 >
U W L
3.
3 0 3 IC nn) . . . 4 3 tu
11. J
0 N
3
- - J -4
o\ r- o\
0 . w w
Y L 2 3
L * L I)
I 1 :c L L
>z w CI "'1
0
d t
J . E 3 3 V 4 I>
I 0 4
c z d
N 3 2 - x
fi C J
c s 4 S L J
X
II 1
LL 3
l n 0 . n N 3 o\ 3 n
U. c) .-I .L
L .-.
i 5 . J LL c -.
i
LL 3
x 0 -4
!$ -. 3
J % 3 I
c 3 1 t- 3 J
L J J
E -4
VI d
- L L z -4
I1 I 1
z u w n II Y U .. LL

I I I I I I
1 I I I I 1 1 I I I I I
i
1w .n . m
3 00 4 Q51
4 3 5 1 4 4
. . ..
. L 3 3 U 4 > X il U J 'i
J 4 H
r ..4
z .+
L.i
si 0 W J
J
c 3 I-
I
a
'3 L ' I t ll. a.
5 o m r - 3 O
4 0 N . . .
4 N J 4
3 0 - w w 0 JJI-
sn -7
I.
3
I- 4 J 3 U J ;1 V
-
c
I ! I
j l I
f a m O 4 f
n :.u m f Q i O ?i f
. . . .-I
-l m

SO2 Symbols
Vmstd = Volume of gas sample th rough t h e d r y gas meter
Vm = Volume of gas sample th rough t h e d r y gas meter ( s t a n d a r d c o n d i t i o n s I , cu. e t .
(meter cond i t ions1 , cu. f t . Tstd = Absolute t empera tu re a t s t a n d a r d c o n d i t i o n s , 5 3 0 ° R.
= Barometr ic p r e s s u r e a t t h e o r i f i c e meter, i n c h e s H g . 'bar = Absolute p r e s s u r e a t s t a n d a r d c o n d i t i o n s , 29 .92 'std
Vt = Volume of B a r i u m p e r c h o l o r a t e t i t r a n t used f o r t h e
- Volume of barium p e r c h o l o r a t e titrant used f o r t h e
Tm = Average d r y g a s m e t e r t e m p e r a t u r e , OR.
i nches H g .
sample, m l .
'tb b l ank , m l .
N = Normality of barium p e r c h o l o r a t e t i t r a n t , 9 . -e t . / l . V s o l n = T o t a l s o l u t i o n volume o f s u l f u r d i o x i d e , 50 m l .
Va = V o l u m e o f sample a l i q u o t t i t r a t e d , m l . C s 0 2 = Concen t ra t ion o f s u l f u r d i o x i d e a t s t a n d a r d c o n d i t i o n s ,
d r y b a s i s , l b . / c u . f t .
7.C15xlO-~ = Conversion factor , i n c l u d i n g t h e number o f grams p e r gram
e q u i v a l e n t of s u l f u r d i o x i d e ( 3 2 g. /g . -eq . ) , 4 5 3 . 6 g . / lb . ,
and 1 , 0 0 0 m l . / l . , 1b.-l./g.-ml. = S t a c k g a s f l o w r a t e a t s t a n d a r d c o n d i t i o n s d r y cu . f t . /min . Qss td
F

I I i 0
ci c CI P I 1 C c I 8 I
I' i
Vmstd
Vmstd
PPMS02
PPMS02
PPMS02
cso2
cso2 Emission rate
Emission rate lb./hr.
..

I I i c B e c c: t f t 0 c c 5 @ c i I
APPENDIX D
OPERATIONAL RESULTS
._

I
l P 0
ljij Office of /he Vice Presiden/
Phone 849-4311 WOODVILLE. OHIO
c 1. ,-
I I I
August 23, 1 9 7 4 b
EPA Mutual P l a z a Room 926 Research T r i a n g l e P a r k , N . C.
At tn : M r . Gene R i l e y
Dear S i r :
27711
Herewith enc losed p l e a s e f l n d copi-es of your r e s e a r c h d a t a s h e e t s , with t h e s t o n e r a t e r e c a l c u l a t e d t o a more r e a s o n a b l e f i g u r e . T h i s i n f o r m a t i o n was p l a c e d i n your co lumn for Gas T o t a l i z e r , which I have r e l a b l e d a s
S t o n e R a t e T/hr.. The f a c t o r t h a t I used -was
r e a s o n a b l e f i g u r e t o c a l c u l a t e the amount of T h i s f a c t o r t imes t h e t o h l i n . 7 i c a t 4 tonnage
? l i m e produced.
AS I i n d i c a t e d o u r o i l t o t a l i z e r g i v e s us a v e r y good i n d i c a t i o n of t h e t o t a l amount o f .oil u s e d , b u t as a whole I t end t o d l s c o u n t t h e hour by hour f i g u r e s .
?
Yours v e r y t r u l y , *
George Judd Chief Chemist


I
APPENDIX E
FIELD DATA

TRAVERSE POINT LOCATION FOR CIRCULAR DUCTS
LANT c.d v-ALA'Q~ L A ATE >Y- 3 C 7 d / ,
LOCATION N s./ % . E s $ . e x .bc A'
6.3 % " NSlDE OF FAR WALL TO OUTSIDE OF NIPPLE, (DISTANCE A)
iZNSlOE OF NEAR WALL TO I )' OUTSIDE OF NIPPLE, (DISTANCE E)
TACK I.D., (DISTANCE A . DISTANCE 8) NEAREST UPSTREAM DISTURBANCE
EAREST DOWNSTREAM DISTURBANCE 4 8 ALCULATOR
3 L7;3 4 'L /2 '-2 ~ r l 146 '' s2c304G.
- n.76 ,a
PRODUCT OF COLUMNS 2 AN0 3
1 4 . 4 I 17.3
E . .
SCHEMATIC OF SAMPLING LOCATION
TRAVERSE POINT LOCATION FROM OUTSIDE OF NIPPLE ! DISTANCE B (SUM OF COLUMNS 4 E 5)

N m .
. .
i

I -~ . . .

I I
i: P P I li IC P R I I I ci E
i
i 1"
N
. .

. . . .. .. . - . . .. .. . . .

I
1 1
I li
FLASK VACUU!,l-in. Ilg . FLASK TEMP. O F BARO- METRIC ’ CLOCK
SURE
DSCFM TIME I N - F I N A L P R E S - I N I T I A L FIiinL LEG 1 LEG 2 LEG 1 LEG 2 I T I A L .
., ,.’ - JIG )l;i?/lC I/l.’?L’! I I?lL I 13 1 1‘8& I 1 I I / l / ] . x l I I I
NOX GAS SAMPL,ING-EVACUATED FLASK
COMPUTER INPUT DATA
I l l I I I (
Prepared By Lw
I I
t TEST REAGENT
I
3 0 R Z - y Projcch NO.
.

Project N O . 30,82- .I
..

R I' I I. I I: 1. I
1 Ipt I I I
i
Meter, ft3
9z/, / ZG-
PEDCO- ENVIRONMENTAL SUITE 1 3 - A T K I N S O N S O U A R E
C I N C I N N A T I , OHIO 45246 5 1 3 1 7 7 1 - 4 3 3 0
Flow Rate cfm
0 ff5
GAS SAMPLING FIELD DATA
Material Sampled For -T&% Date 5/2/f74 Plant L,.~&,.//fi L,;71P r G
Barometric Pressure " Mercury
Ambient Temperature,OF Stack Temperature,OF 744
.; 9, Location ~ , , ' , ~ . ~ p 16 /I
Test No. 5.852 - / Power-Stat Setting Filter Used: - Yes J NO
Operator 4IP
Time
I ' '
Impinger Contents
Meter Temp.,OF s

APPENDIX F
LABORATORY REPORT

1'.
2.
3 .
4 .
LABORATORY RESULTS 6 7 2 3 4 r, 1
Acetone r m s h of n o z z l e , pro,be, cyclone (b: .p3Ss) , flask, f r o n t h a l f of f i l t e r .
h o l d e r . .
C o n t a i n e r 2 . 6@,U 1 n q F i l t e r Nuiiiber
Wattc?~ wash' of n o z z l e , proile, c ) ~ c l o n e - C o n ta.i ncr
IJater 3 . tng O i y p a s s j , f l a s k , f1-011t: h a l f - o f f i l t e r
h o l d e r .
. .. ...~ . . ... ___ Con t a i ~ C I :
E X t r a c Lion l':tllcr-Cill..,l-o~ol.l,,
8 1 .

L A C O M T O R Y RESULTS 3 4 1 1 2
Acetone ?.:ash of no;!zlc, prohe, c;Jclone ( I > j ' ] ) a s s ) , f l a s k , f r o n t h a l f o f f i l t e r h o l d e r .
F i l t e r Nuiiiber
L\r;ltCP war;ll' of nozz1.e, prolle, c).clono ( h y p a s s j , f l a s k , f rol i t h a l f of f i l t e r h o l d e r .
Acetone wash of iinpii1r)cr:i, c o n n e c t o r s , and back h a l f of f i l t e r h o l d e r
. . . - .. . C o n (:a i. nc I' 1.: t l i r ! r -C l i I. oi-o for111 E x t r a c t i o n 4 . ing

I I
-. . . .
-- .
.
--+ I . -. .. -
I I
+-. .
0
a . .
. . -~ .
.
7- 5

I I i c P L i c c c r c 1 0 i[ 1 I
i i
APPENDIX G
SAMPLING AND ANALYTICAL METHODS

i i C 1 I I I I I! I 1 I P I I I I I I
DETERMINATION OF PARTICULATE EMISSIONS
The following method was used in this test program.
Sampling procedures followed those described in the Federal
Register. 1
SAMPLING APPARATUS
The particulate sampling train used in these tests met
design specifications established by the Federal EPA and was
assembled by PEDCo personnel. It consisted of:
Nozzle - Stainless steel (316) with sharp, tapered leading edge and accurately measured round opening.
Probe - Pyrex glass with a heating system capable of maintaining a minimum gas temperature of 250OF at the exit end during sampling.
Pitot Tube - Calibrated type S attached to probe to monitor stack gas velocity.
Filter Holder - Pryex glass with heating system capable of maintaining minimum temperature of 225'F.
Draft Gage - An inclined manometer made by Dwyer with a readability of 0.01 inches H20 in the 0-1 inch range was used.
Impingers - Four impingers connected in series with impingers were of the Greenburg-Smith design, modified by replacing the tip with a 1/2 inch I.D. glass tube extending to 1/2 inch from the bottom of the flask. The second impinger was of the Greenburg-Smith design with a standard tip.
Thermometer - Dial type with long stem.
Federal Register, Vol. 3 6 , No. 247, Part 11, December 23, 1971.
,glass ball joints. The first, third, and fourth

i I h ii e 1 c t t e IF 1 c c. B f 1 I I
Metering System - Vacuum gauge, leak-free pump, ther- mometers capable of measuring temperature to within S ° F , dry gas meter with 2% accuracy, and related equipment, to maintain an isokinetic sampling rate and to determine sample volume. The dry gas meter is made by Rockwell and the fiber vane pump is made by Gast.
Barometer - Bourden tube type to measure atmospheric pressures to + 0.1 inches Hg. -
SAMPLING PROCEDURE
After selecting the sampling site and the minimum
number of traverse points, the stack pressure, temperature,
moisture, and range of velocity head was measured according
to procedures described in Method 1 of the Federal Register
(December 23, 1971).
Approximately 200 grams of silica gel were weighed in a
sealed impinger prior to each test. Glass fiber filters*
(3" diameter) were desiccated for at least 24 hours and
weighed to the nearest 0.1 milligram on an analytical
balance. One-hundred ml of distilled water was placed in
each of the first two impingers; the third impinger was
initially empty: and the impinger containing the silica gel
was placed next in series. The train was set up without the
probe as shown in Figure A-1. The sampling train was leak
checked at the sampling site by plugging the inlet to the
filter holder and pulling a 15 inch Hg vacuum. Leakage
rates of less than 0.02 cfm at a vacuum of 1 5 in. Hg were
recorded in all cases. The probe assembly was then attached,
and crushed ice placed around the impingers. More ice was
added during the run to keep the temperature of the gases
leaving the last impinger at approximately 70°F.
*A 1106 BH

I' I il I I I II I I 6 f fi I 1 I P I I I
_I _I
< 3
Y V < ++
n
+ m m
sun.
w m w
-z 4 0
c .rl m L! CI
L! Id PI

During sampling, stack gas and sampling train data were
recorded at each sampling point and when significant changes
in stack flow conditions occurred. Isokinetic sampling
rates were set throughout the sampling period with the aid
of a nomograph.
After the completion of the sampling throught the west port
the filter was changed due to a particulate buildup on it.
The velocity pressure readings were erratic at times resulting
in the sample train being shut-off at one point to clean the
pitot tube.
After 131 minutes of sampling on Test 1 the velocity pressure
increased. The sample train was unable to pull enough flow to
maintain an isokinetic rate. The pump was immediately shut-off.
The filter was again changed. The leak check that always fol-
lows a sample train component change pulled a check in the
bypass vacuum line. Because of the time required to fix the
lime the test was concluded thirteen minutes short of a complete
test.
SAMPLE RECOVERY PROCEDURE
The sampling train was moved carefully from the test
site'to the cleanup area. Samples of the acetone and water
used in the sample recovery were taken for use as blanks.
The sample fractions were recovered as follows:
Container No. 1 - The filter was removed from its holder and placed in a petri dish and sealed.
Container No. 2 - Loose particulate and acetone wash- ings from all sample-exposed surfaces prior to the filter were placed in a glass jar and sealed. Par- ticulate was removed from the probe with the aid of a brush and acetone rinsing.

i i k c. e 0 h 1
S I t b i h P h I I
i
Container No. 3 - The condensate from the first three Greenburg-Smith impingers was measured within + 1 ml and placed into a glass jar. Water rinsings from the back half of the filter holder, all connectors, and the first three Greenburg-Smith impingers were placed in this container and the container sealed.
Container No. 4 - Acetone rinsings from the back half of the filter holder, support, all connectors, and the first three Greenburg-Smith impingers were placed in this container and sealed.
Container No. 5 - A minimum of 300 ml of acetone was taken for the blank analysis.
Container No. 6 - A minimum of 300 ml of distilled water was taken for a blank.
The silica gel from the fourth impinger was weighed and
recorded. The used silica gel was discarded.
ANALYTICAL PROCEDURES
The following procedures were used and follow the
methods described in the Federal Register of August 17, 1 1971.
Container No. 1 - The filter and any loose particulate matter from this sample container were placed into a tared glass weighing dish, desiccated to a constant weight and weighed to the nearest 0.1 mg.
Container No. 2 - The acetone washings were transferred to a tared beaker and evaporated to dryness at ambient temperature and pressure: desiccated to a constant weight; and weighed to the nearest 0.1 mg.
Container No. 3 - Organic matter from the impinger solution was extracted with three 25 ml. portions each of ethyl ether and chloroform. The extracts were . combined into a tared beaker, and evaporated until no solvent remained at about 70°F. The sample was then
Federal Register, Vol. 36, No. 159, Part 11, August 17, 1971.

t i
I I P
c
desiccated to a constant weight and weighed to the nearest 0.1 mg. The remaining water was evaporated by boiling in a tared beaker, and the residue weighed.
Container No. 4 - The acetone washings from the back half of the filter holder, connectors and first three Greenburg-Smith impingers were transferred to a tared beaker; evaporated to dryness at ambient temperature and pressure; desiccated to a constant weight: and weighed to the nearest 0.1 mg.
Container No. 5 - The acetone blank was transferred to a tared beaker, and evaporated to dryness at ambient temperature and pressure. The blank was then desic- cated to a constant weight and weighed to the nearest 0.1 mg.
Container No. 6 - The water blank was evaporated by boiling in a tared beaker, desiccated to a constant weight, and weighed to the nearest 0.1 mg. Blank corrections were made in proportion to the amount of reagent used.
F
c i I

I I 1 Iy I I r 1 I I I 1 I I I\ s I I I
DETERMINATION OF NITROGEN OXIDES IN. STACK GAS:
PHENOLDISULFONIC ACID METHOD
INTRODUCTION
The following method was used to determine total oxides
of nitrogen. Samples were collected in evacuated flasks con-
taining a dilute sulfuric acid-hydrogen peroxide absorbing solu-
tion, and the nitrogen oxides, except nitrous oxides were measured
spectrophotometrically at 410 nm.
REAGENTS
The following reagents were used in this sampling program:
(All chemicals were ACS analytical-reagent grade.)
Water - Distilled - deionized water. - Hydrogen Peroxide ( 3 % ) - 10 ml. of 30 percent H202 was
diluted to 100 ml in a 100 ml volumetric flask with water.
Absorbing Reagent - 2.8 ml of concentrated H2S04,was diluted to one liter with distilled water. After mixing well, 6 ml of 3 percent hydrogen peroxide were added. The solution is prepared fresh every two or three days.
Sodium Hydroxide (1 N) - 4 0 gm of NaOH were dissolved in distilled water and diluted to one liter.
Ammonium Hydroxide (concentrated)
Sulfuric Acid (fuming) - (15-18% SO3) Phenoldisulfonic Acid Solution - 25’ grams of pure white
Dhenol were dissolved in 150 ml of concentrated H,SO. on a -~ steam bath. After the solution cooled, 75 ml fumfng’sulfuric acid were added. It was then heated to 100°C for two hours. The reagent was stored in a dark stoppered reagent bottle.

Potassium Nitrate Solution (standard) - 0.5495 grams of KNO, were dissolved in one liter of water in a volumetric flaik. volumetric flask. One ml of the final solution was equivalent to 0.025 mg NO2.
100 ml of this solution was diluted to one liter in a
SAMPLING APPARATUS
Flasks - Two-liter, Pyrex, round-bottom flask were encased in a simple container with a sleeve and accompanying stopcock valve as shown in Figure A-2.
pump, capable of producing a vacuum of 3 inches Hg absolute pressure, connected to a 0-36" Hg u-tube manometer.
Vacuum System - The vacuum system consisted of a vacuum
' Thermometer - Dial thermometer, range 25 to 125'F. 5-inch stem.
Probe - Pyrex glass, heated, with a filter to remove par- ticulate matter.
Variable Transformer - Rated at 12 amps, 0 to 140 volts.
Spectrophotometer - A Bausch & Lomb Spectronic 70 , capable of measuring optical density at 410 nm in 0.5 inch absorbance cells was used.
SAMPLING PROCEDURES
25 ml of absorbing solution were pipetted into a sample
flask. The flask valve stopper was inserted into the flask
with the valve in the "closed" position. The sampling train
was assembled as shown in Figure A-2 with all valves closed.
The probe was placed at the sampling po'int. The probe valve
and the pump-manometer valve were turned to their "open"' positions
and the probe purged. The probe valve was then clos.ed and the . flask valve opened to its "evacuate" position,. The flask was
evacuated to at least 3 in. Hg absolute pressure. The manometer
reading was taken by turning the pump-manometer valve to the
"manometer" position. The pump was turned off and the system
was checked for leaks by observing any drop in the.mercury level.

I' I I
3

1 I I I I t 1 I I I I I I 1 I I I I I
The initial flask pressure, volume, temperature, and barometric
pressure were recorded on the data sheet. The probe valve was
slowly turned to the "sample" position until a slight drop in
the manometer mercury level was observed. The sample was allowed
to enter the flask for about 3 to 4 minutes. The probe valve - was then closed when there was approximately a one inch mercury
vacuum left in the flask. The final flask pressure and temperature
were then recorded. The flask valve was closed and the flask
contents were shaken for five minutes.
Sample Recovery
The samples were allowed to remain in the flasks
'least 24 hours. The sample was then transferred to a
beaker using a small amount of water.
Anal ys is
for, at
250 ml
The sample was evaporated to dryness in an oven and then
cooled. Two m l of phenoldisulfonic acid solution were added
to the dried residue and triturated thoroughly with a glass rod.
One ml of water and 4 drops of concentrated sulfuric acid were
then added. The solution was heated on a steam bath for three
minutes with occasional stirring. After cooling, 20 ml of water
were added and mixed well by stirring. Concentrated. ammonium
hydroxide was added dropwise with constant stirring unti1,alkaline
to litmus paper. The solution was transferred-to a 100 ml volu-'
metric flask and the beaker washed three times with 4 to 5 ml
portions of water.
mixed thoroughly.
at 410 nm using the blank solution as a zero. A half inch absor-
The solution was diluted to the mark and
The absorbance of each sample was measured

i bance cell was used.
CALIBRATION PROCEDURES I L Flask Volume - The flask and flask valve were assembled
and filled with water to the stopcock. The volume of water was
measured to 2 1 ml. P The flasks were numbered and the volume
recorded on each.
Spectrophotometer - Aliquots of 0.0 to 16.0 ml of potassium nitrate solution (standard) was added to a series of beakers,
and 25 ml of absorbing solution added to each. Sodium hydroxide
(1N) was added dropwise until alkaline to litmus paper (about
25 to 35 drops). These solutions were transferred to 100 ml
volumetric flasks and the absorbance read at 410 nm. The cali-
bration curve was checked prior to each set of samples.
B ] li P P 9 1 f c b B 1 i i
Lpp

DETERMINATION OF SULFUR DIOXIDE EMISSIONS IN STACK GASES This method was used to measure sulfur dioxide in stack
gases and follows Method 6 of the Federal Register', with modifications as noted below. SAMPLING APPARATUS
Nozzle - Stainless Steel (316) with sharp, tapered leading edge.
maintaining a minimum gas temperature of 225 F at the exit end during sampling and prevent condensation form occurring.
Pitot Tube - Type S , attached to probe to monitor stack
Probe - Pyrex glass with a heating system capable of
gas velocity. Filter Holder - Pyrex glass Impingers - Four as shown in Figure A-9. The first
and third are of the Greenburg-Smith design with standard tip. The second and fourth were modified by replacing the standard tip with a 1/2 - inch ID glass tube extending to within one-half inch of the bottom of the impinger flask.
Metering System - Vacuum gauge, leak-free pump, ther- mometers capable of measuring temperature to within 5'F, dry gas meter with 2% accuracy, and related equipment, to maintain an isokinetic sampling rate and to determine sample volume.
._ 1. Federal Register, Vol. 36, No. 247 - December 23, 1971.

Barometer - Bourden tube type to measure atmospheric pressure to - + 0.1 inches Hg. SAMPLING REAGENTS
Filters - Glass fiber, MSA type 1106 BH of a suitable size to fit in the filterholder.
Silica - Gel - Indicating type , 6-16 mesh. Water - Deionized, distilled. Isopropanol, 80% - Mix 800 ml. of isopropanol with 200
ml. of deionized, distilled water. Hydrogen Peroxide, 3% - Dilute 100 ml. of 30% hydrogen
peroxide to 1 liter with deionized, distilled water.
ANALYTICAL REAGENTS Water - Deionized, distilled. Isopropanol Thorin Indicator - 1 - (O-arsonophenylazo)-2-naphthol-3,
6-disulfonic acid, disodium salt. Dissolve 0.20 gram in 100 ml . distilled water.
Barium Chloride (0.0200N) - Dissolve 2.4431 grams of barium chloride [BaCl21 in 200 ml. distilled water and dilute to 1 liter with isopropanol. Standardize with sulfuric acid.
Sulfuric Acid Standard (0.02N)- Standardize to - + 0.0002 N against 0.01N NaOH which has previously been standardized against primary standard potassium acid phthalate.
SAMPLING PROCEDURE One sampling point of average velocity was chosen
which was more than 2 feet from the inner walls of the stack. The train was assembled as follows: 150 ml. of 80% isopropanol in the first impinger, 100 ml. of 3 %
hydrogen peroxide in both the second and third impingers,

I
In
W
0 PI
m
n
v, Ln 4 J W
0 W I- 4 W
6 W
J N N 0 z Ln Ln
1 / 1 1
J 4 3
x 3 u
4 I- v,
.- 7
a E m In
'p 4 W L 3 m .r L L
._

and about 200 grams of weighed silica gel in the fourth impinger. A portion of the reagents were retained for use as a blank. The train was assembled without the probe and was leak checked at the sampling site by plugging the inlet of the first impinger and pulling a 15-inch Hg vacuum. A leakage rate not in excess of 0 . 0 2 cfm at a vacuum of 15 inches Hg was recorded in all cases. The probe was then attached and the probe heating system turned on. The probe heater setting was adjusted during sampling to prevent any visible condensation. Crushed ice was placed around the impingers and more ice was added during the run to keep the temperature of the gases leaving the last impinger to 70°F or less.
For each run, the data were recorded at startup, on completion of the test and at 15 minute intervals. Sampling was begun by positioning the probe at the sample point. The pump was then started and sampling proceeded at a rate of approximately 0.8 cfm for a 2 4 0 minute period.
At the completion of the test, the probe was removed from the stack and the train was pruged for 20 minutes by drawing ambient air through the system.
SAMPLE RECOVERY The solutions from the second and third impingers
were transferred to a Wheaton bottle. These impingers and their connecting glassware were rinsed with deionized distilled water and other washings added to the same container. The 80% isopropanol form the first impinger and filter were discarded.
._

ANALYTICAL PROCEDURES
The volume of the sample was recorded. A 10 ml aliquot of sample was pippetted into a 100 ml Erlenmeyer flask. 4 0 ml of isopropanol and 2 to 4 drops of thorin indicator were added. The sample was then titrated with barium chloride to a pink end point. Each titration was repeated with a second aliquot of sample. The blanks were titrated in the same manner as the samples.
.

I
t ic
Ir c
APPENDIX n TEST LOG

- m m 0 rl -
r 0 Lo -
4J $4 0 PI c u 3 0 Lo
d I
< 0 v) -
+! v1 m E
d (I:
4- L rt 4- (I:

I 1 I ’ i I I I 1 I 1 I 1 I I I I I I I
L
APPENDIX I
RELATED REPORTS

I
I I I 1 E I 1 0 t I I I I I t P
RELATED REPORTS
Because of t h e process and c o n t r o l equipment problems
t h a t were encountered, two a d d i t i o n a l t e s t series were
performed a t t h e Woodville L i m e and Chemical Company. The
second tes t series began on J u l y 8 , 1974, and is d i scussed i n
EPA Report N o . 74-LIM-3B. The l a s t tes t series performed
s t a r t e d on August 5 , 1 9 7 4 , and i s p resen ted i n E P A ' s Report
No. 75-LIM-8.
I I I