background and data sources - surveillance, … · seer cancer statistics review 1973-19961...
TRANSCRIPT

SEER Cancer Statistics Review 1973-1996 1 National Cancer Institute SEER Cancer Statistics Review 1973-1996 National Cancer Institute
BACKGROUND AND DATA SOURCES
The primary measures associated with assessing the impact of cancer in the general population are thenumber of new cases per year per 100,000 persons (incidence rate), the number of deaths per 100,000persons (mortality rate), and a determination of the proportion of patients alive at some point subsequent tothe diagnosis of their cancer (survival rate). All three measures are included in this report using data fromthe Surveillance, Epidemiology, and End Results (SEER) Program based within the Cancer SurveillanceResearch Program at the National Cancer Institute (NCI) and cancer mortality data provided by theNational Center for Health Statistics (NCHS) for the entire United States (U.S.). All incidence and mortalityrates in this report are age-adjusted to the 1970 United States standard million (see Appendix) unlessotherwise specified. Age-adjustment minimizes the effect of a difference in age distributions whencomparing rates.
The SEER Cancer Statistics Review (CSR), containing the most recent cancer incidence, mortality andsurvival statistics, is made available by the Cancer Statistics Branch of the NCI annually. Since 1996, theCSR has been available electronically on the SEER Home Page, http://www-seer.ims.nci.nih.gov, under“Publications.” The Web page allows for the more timely distribution of the CSR. This CSR includesincidence, mortality, and survival data from 1973 through 1996, the most recent year for which data areavailable. Incidence data for 1996 appear to be 96 to 98 percent complete. Therefore, caution must beexercised when comparing rates for 1996 with those for previous years. Data are presented for a widespectrum of cancers. The scope and purpose of this review are consistent with a report to the SenateAppropriations Committee (Breslow, 1988) which recommended that a broad profile of cancer be presentedto the American public on a routine basis. Additional SEER data can be obtained via CANQUES, aninteractive system on the SEER Web page under Scientific Systems, which allows the user to access over10 million pre-calculated cancer statistics. The SEER public-use file with SEER*Stat is also available forordering through Scientific Systems’ part of the SEER Web page. SEER*Stat provides an easy to use PCdesktop system for the production of a myrad of cancer statistics, such as incidence rates and survival ratesby various demographic and tumor variables. The SEER public-use data file contains information on overtwo million tumors and contains no personal identifiers.
Incidence and survival data: The National Cancer Act of 1971 mandated the collection, analysis anddissemination of data useful in the prevention, diagnosis and treatment of cancer. This mandate led to theestablishment of the SEER Program. A continuing project of the NCI, the SEER Program collects cancerdata on a routine basis from designated population-based cancer registries in various areas of the country. Trends in cancer incidence, mortality and patient survival in the United States are derived from thisdatabase.
A sequel to two earlier NCI programs--the End Results Program and the Third National Cancer Survey--theSEER Program was initiated in several geographic areas of the United States and its territories, with caseascertainment beginning with January 1, 1973 diagnoses. The initial SEER reporting areas were the statesof Connecticut, Iowa, New Mexico, Utah, and Hawaii; the metropolitan areas of Detroit, Michigan and SanFrancisco-Oakland, California; and the Commonwealth of Puerto Rico.
In 1974-1975, the program was expanded to include the metropolitan area of New Orleans, Louisiana, thethirteen-county Seattle-Puget Sound area in the State of Washington and the metropolitan area of Atlanta,Georgia. New Orleans participated in the program only through the 1977 data collection year. In 1978 tenpredominantly black rural counties in Georgia were added. American Indian residents of Arizona wereadded in 1980. In 1983, four counties in New Jersey were added with coverage retrospective to 1979. NewJersey and Puerto Rico participated in the program only until the end of the 1989 reporting year. Two areasof California, Los Angeles County and the San Jose-Monterey area (Monterey, San Benito, Santa Clara andSanta Cruz Counties) began reporting with 1992 diagnoses. Both population-based cancer registriesbegan data collection earlier than 1992 and they have provided earlier data from 1988 through 1991 forinclusion in the CSR. The incidence trends and survival data for this report are from five States: Connecticut, Hawaii, Iowa, New Mexico, and Utah and four metropolitan areas: Detroit SMSA, AtlantaSMSA, San Francisco-Oakland SMSA, and Seattle-Puget Sound (Fig. I-1). Incidence rates by SEER areaincluding Los Angeles and San Jose-Monterey are shown for the most recent 5-year period along with

SEER Cancer Statistics Review 1973-1996 National Cancer Institute
area-specific mortality in each section.
Data from the nine or eleven SEER geographic areas used in this report represent an estimated 9.5 or13.9 percent of the United States population, respectively. By the end of 1996, the database containedinformation on over 2 million cases diagnosed since 1973; currently over 125,000 new cases areaccessioned yearly.
Areas were selected primarily for their ability to operate and maintain a population-based cancer reportingsystem and for their epidemiologically significant population subgroups. With respect to selecteddemographic and epidemiologic factors, they are reasonably representative subsets of the United Statespopulation.
The goals of the SEER Program are:
1. Assembling and reporting, on a periodic basis, estimates of cancer incidence and mortality in the UnitedStates.
2. Monitoring annual cancer incidence trends to identify unusual changes in specific forms of canceroccurring in population subgroups defined by geographic and demographic characteristics.
3. Providing continuing information on changes over time in the extent of disease at diagnosis, trends intherapy, and associated changes in patient survival.
4. Promoting studies designed to identify factors amenable to cancer control interventions, such as: a)environmental, occupational, socioeconomic, dietary, and health related exposures; b) screeningpractices, early detection and treatment; and c) determinants of the length and quality of patientsurvival.
The SEER Program is conducted under contract with nonprofit, medically oriented organizations havingstatutory responsibility for registering diagnoses of cancer among residents of their respective geographiccoverage areas. Each contractor:1. maintains a cancer information reporting system; 2. abstracts records for resident cancer patients seen in every hospital in and outside the coverage area;3. abstracts all death certificates on which cancer is listed as a cause of death for residents dying in and
outside the coverage area;4. searches records of private laboratories, radiotherapy units, nursing homes and other health services
units which provide diagnostic service to ensure complete ascertainment of cases; registers all in situand malignant neoplasms with the exception of certain histologies for cancer of the skin and in situ ofthe cervix uteri since 1996;
5. records data on all newly diagnosed cancers, including selected patient demographics, primary site,morphology, diagnostic confirmation, extent of disease, and first course of cancer-directed therapy;
6. provides active follow-up on all living patients except for those with in situ cancer of the cervix uteri;7. maintains confidentiality of patient records;8. submits data electronically to NCI twice each year containing data on all reportable diagnoses of cancer
which were made in residents of the coverage area.
In situ cancers of the cervix uteri are not reportable to SEER beginning with 1996 diagnoses. Since 1992,the SEER program has coded site and histology by the International Classification of Diseases forOncology, second edition (ICD-O-2) (Percy, Van Holten et al, 1990). All cases before 1992 were machineconverted to ICD-O-2. The primary site groupings used for incidence are found in the Appendix. Follow-uprates are also in the Appendix.
Mortality data: A public use file containing information on all deaths occurring in the United States bycalendar year is obtained annually from the National Center for Health Statistics (NCHS). Information oneach death includes age at death, sex, geographic area of residence, underlying and contributing causes ofdeath. Only the underlying cause of death was used in the calculation of mortality rates. Numbers and thenumerators for mortality rates for the SEER geographic areas, for each state and for the total U.S. areobtained from these tapes. A list of the mortality site groupings used in this publication is in the SR

SEER Cancer Statistics Review 1973-1996 2 National Cancer Institute SEER Cancer Statistics Review 1973-1996 National Cancer Institute
Appendix.
Number of estimated cancers and deaths in 1999: Projections of the number of cancer cases and numberof cancer deaths in the United States for 1999 have been obtained from the American Cancer Society(ACS). The ACS projected incidence to 1999 based on incidence rates from SEER for 1979-95 and appliedby the ACS to the 1999 estimated total U.S. population (American Cancer Society, 1999).
Population data: Population estimates are obtained each year from the U.S. Bureau of the Census. Currently, revised estimates of the populations of U.S. counties were obtained by five-year age group (0-4,5-9,..., 85 and over), sex, and race (including white and black) for July estimates for each year 1990- 1997. SEER makes county estimates for each state available on the SEER Home Page
(http://www-seer.ims.nci.nih.gov) for race (whites, blacks, non-white), 5-year age group, sex, and year of diagnosis (each year 1973 to 1996). Additional racial/ethnic (Asian/Pacific Islander, American Indian, and Hispanic) populations for 1990-1997by county can be obtained from the U.S. Census Bureau Web page,http://www.census.gov/population/www/estimates/countypop.html.
U.S. Bureau of the Census (BOC) population estimates for Hawaii were altered according to independentestimates developed from sample survey data collected by the Health Surveillance Program (HSP) of theHawaii Department of Health. For Hawaii, the all races and black populations are the same as those sentby the BOC. Proportions of the population by different racial groups from the HSP were used to generateestimates for whites, etc. Since the HSP survey was for all of Hawaii and not by county, populationestimates were not broken down by county. The white population estimates for Hawaii provided by theBOC are generally larger than those generated by the HSP. Since whites in Hawaii account for less thantwo percent of the total white population represented by the SEER reporting areas, white incidence ratesfor the entire SEER Program are not noticeably affected. Procedures for calculating rates by race forHawaii are currently under review.
DEFINITIONS
Several technical terms are used in presenting the data in this report. The following definitions arepresented here in an attempt to clarify their use to the reader.
Incidence rate: The cancer incidence rate is the number of new cancers of a specific site/type occurring in aspecified population during a year, expressed as the number of cancers per 100,000 people. It should benoted that the numerator of the rate can include multiple primary cancers occurring in one individual. Thisrate can be computed for each type of cancer as well as for all cancers combined. Except for five-year age-specific rates, all incidence rates are age-adjusted to the 1970 U.S. standard population or to the worldstandard (see below). Rates are for invasive cancer only, unless otherwise specified. For example, therates for cancer of the urinary bladder are comprised of in situ and invasive cancer.
Mortality rate: The cancer mortality rate is the number of deaths with cancer given as the underlying causeof death occurring in a specified population during a year, expressed as the number of deaths due tocancer per 100,000 people. This rate can be computed for each type of cancer as well as for all cancerscombined. Except for age-specific rates, all mortality rates are age-adjusted to the 1970 U.S. standardpopulation or to the world standard (see below).
Age-adjusted rate: An age-adjusted rate is a weighted average of the age-specific cancer incidence (ormortality) rates, where the weights are the proportions of persons in the corresponding age groups of astandard population. The potential confounding effect of age is reduced when comparing age-adjustedrates computed using the same standard population. For this report, the 1970 United States standardmillion and world standard million populations are used as the standards in computing age-adjusted ratesunless otherwise noted.
Percent Change: The percent change in rates over the entire time period covered by this report wasobtained by calculating the average of the 1973 and 1974 rates and the average of the rates for the mostrecent two years, subtracting the former from the latter, dividing the difference by the former, and then

SEER Cancer Statistics Review 1973-1996 National Cancer Institute
multiplying by 100 to convert the number to a percent. Percent changes are also provided for two five-yearperiods, 1975-79 and the most recent 5-year period.
Estimated Annual Percent Change: The Estimated Annual Percent Change (EAPC) was calculated byfitting a regression line to the natural logarithm of the rates (r) using calendar year as a regressor variable,i.e. y = mx + b where y = Ln r and x = calendar year. The EAPC = 100*(em - 1). Testing the hypothesis thatthe Annual Percent Change is equal to zero is equivalent to testing the hypothesis that the slope of the linein the above equation is equal to zero. The latter hypothesis is tested using the t distribution of m/SEm withthe number of degrees of freedom equal to the number of calendar years minus two. The standard error ofm, i.e. SEm, is obtained from the fit of the regression (Kleinbaum, 1988). This calculation assumes that therates increased/decreased at a constant rate over the entire calendar year interval. The validity of thisassumption was not assessed. In those few instances where at least one of the rates was equal to zero, thelinear regression was not calculated. Because the methods used in their calculation are not directly related,it is possible that the signs of the PC and the EAPC may disagree, and this occurs in a few instances in thetables presented. The differences between incidence and mortality trends for the time period 1975-79versus those for the most recent five-year period are tested for statistical significance using a t statistic withsix degrees of freedom defined as the difference in the regression coefficients divided by the standard errorof the difference (Kleinbaum, 1988).
Observed survival rate: The observed survival rate is obtained using standard life table procedures andrepresents the proportion of cancer patients surviving for a specified length of time after diagnosis.
Relative survival rate : The relative survival rate is calculated using a procedure described by Ederer, Axtell,and Cutler (1961) whereby the observed survival rate is adjusted for expected mortality. The relativesurvival rate represents the likelihood that a patient will not die from causes associated specifically with theircancer at some specified time after diagnosis. It is always larger than the observed survival rate for thesame group of patients.
Standard error: The standard error of a rate is a measure of the sampling variability of the rate.
Person Years of Life Lost: The Person Years of Life Lost (PYLL) was calculated as follows. For each of theindividuals who died of a particular cancer of interest, it was possible to obtain the number of additionalyears they were expected to survive, conditional on their survival to the age at which they died of theircancer. This conditional expectation was obtained from life tables for the United States population availablefrom the National Center for Health Statistics. The PYLL in the general population associated with aparticular cancer is simply the sum of this conditional expectation over all those individuals who died of thatcancer.
Average Years of Life Lost: The Average Years of Life Lost (AYLL) associated with a particular cancer isthe PYLL associated with that cancer in the general population divided by the number of deaths from thatcancer in the general population.
Stage of Disease at Diagnosis: Localized - an invasive neoplasm confined entirely to the organ of origin.Regional - a neoplasm that has extended beyond the limits of the organ of origin directly into surroundingorgans or tissues; into regional lymph nodes; or both direct extension and regional lymph node involvement. Distant - a neoplasm that has spread to parts of the body remote from the primary tumor either by directextension or by discontinuous metastasis. Unstaged - information is not sufficient to assign a stage.
SUMMARY TABLES
While there are detailed tables in separate sections for each of the major cancer sites, information on someof the more rare cancers can be found in the summary tables of section I. For a detailed list of primarysites, the summary tables provide incidence and mortality rates for the most recent 5-year period, trends(percent change and estimated annual percent change) from 1973 to the most recent year, median age atdiagnosis, median age at death, and survival rates. The information is provided by race (all races, whites,blacks) and by sex.

SEER Cancer Statistics Review 1973-1996 National Cancer Institute
LONG-TERM TRENDS, 1950-1996
Trends in cancer mortality from 1950 to 1996 are summarized by age for all cancers combined, excludingand including lung cancer (Table I-2). These mortality figures are based on the experience in the totalUnited States.
Summaries of long-term trends in cancer incidence, mortality and survival are outlined in Table I-3. Thetable shows the estimated number of cancer cases and the reported number of cancer deaths for 1996; thenext four columns show incidence and mortality changes from 1950 to 1996. Both the total percent changeand the estimated annual percent change for incidence were based on incidence data from the fivegeographic areas for which data are available for each of three time periods, around 1950, 1969-71 and1973-74 to 1996. Due to the limited availability of incidence data from the early time periods and thechange in the composition of the non-white population over time, the incidence trends are presented forwhites only. The estimates for children are for children of all races combined in Connecticut only. Mortalitydata are for the total United States and are for whites only for comparability to the incidence data. The lasttwo columns display five-year relative survival figures for patients diagnosed during two time periods, 1950-54 and 1989-95 and are based on information from the End Results program for 1950-54 and SEER for1989-95.
Caution should be exercised when interpreting these statistics. Evaluating trends over such a long period oftime may hide recent changes in the trends. In addition, the straight line model fit to the log of the incidenceand mortality rates and used to calculate the estimated annual percentage change may be inappropriate ifthe trend has changed directions or if the rate of change in rates has changed dramatically.
YEARS OF LIFE LOST DUE TO PREMATURE DEATH FROM VARIOUS CAUSES
Mortality rates alone give an incomplete picture of the burden deaths impose on the population. Anothermeasure which adds a different dimension is the years of life lost due to premature death from a particularcause of death. This provides some indication of the extent to which life is cut short by a particular cause ordisease.
This measure is estimated by linking sex-specific life table data to each death for a particular age. The lifetable permits a determination of the number of additional years a person would be expected to live at anygiven age. In this report, the ages used in the calculation were in five-year groups with the remaining yearsof life left averaged over the five ages within each age group. These years of life lost are summed over alldeaths due to a particular cause yielding the estimate of the number of person-years of life lost (PYLL). Also presented is the average years of life lost (AYLL), obtained by dividing the PYLL by the number ofdeaths. Both of these measures can be calculated for any cause of death.
CANCER PREVALENCE
There are different ways to define cancer prevalence. It could be the number of people who currently have cancer. It could also be the number of people who have ever had a particular cancer. Long-term incidenceand survival rates from the State of Connecticut back to 1940 were used to estimate age-specificprevalence rates for Connecticut for a recent year. The age-specific prevalence rates for Connecticut wereapplied to the total U.S. population to estimate the number of Americans who were (will be) alive at aspecific point in time who were ever diagnosed with invasive cancer (but including in situ bladder cancer). These prevalence estimates are an attempt to quantify the number of persons in the U.S. who have everhad a diagnosis of cancer (i.e., history of cancer). Prevalence estimates in this section were calculatedbased on Feldman (1986). There are several studies currently underway to evaluate different methods ofcalculating prevalence and the reliability of using data from 9 SEER areas back to 1973 or data only for theState of Connecticut back to 1940. Caution should be used in interpreting prevalence estimates.

SEER Cancer Statistics Review 1973-1996 National Cancer Institute
PROBABILITY OF BEING DIAGNOSED WITH OR DYING FROM CANCER
Each site-specific section of the book contains a table with, the probability (expressed as a percent) of anindividual of specified age being diagnosed with the specified cancer within ten, twenty or thirty years andwithin their total remaining lifetime. Lifetime risks of being diagnosed with cancer and lifetime risks of dyingfrom cancer also appear (as percents) in each table and there are summary tables of lifetime risk in theoverview.
Lifetime and interval risks of being diagnosed with cancer: The probability of being diagnosed with canceris computed by applying cross-sectional age-specific 1994-96 incidence and mortality rates from the SEERareas to a hypothetical cohort of individuals. This hypothetical cohort, consisting of an arbitrarily specifiednumber of live births (e.g., 10,000,000), is considered at risk for two mutually exclusive events: 1)developing the specified cancer; and 2) death due to other causes without the specified cancer. Thus astandard multiple decrement life table is derived (with five-year age intervals up to age 94 and a 95+interval) using these two types of events. In each age interval we start with the number alive and free of thespecified cancer at the beginning of the interval, and subtract out the number who develop the specifiedcancer and the number who die of other causes among the cancer free. The lifetime risk of beingdiagnosed with the specified cancer is derived by summing all cancer cases from age 0 through 95+ anddividing by 10,000,000. This calculation does not assume an individual lives to any particular age, rather itis the sum over all age intervals of the probability of living to the beginning of each age interval times theprobability of developing cancer in that interval. The probability of developing cancer during any time period(e.g., within 10 years of turning 50 years of age) is calculated by adding up all the cancers in the life tableover the specified age range and dividing by the number of individuals alive and free of the specified cancerat the beginning of the period.
For more details on this methodology see Feuer et. al (1992) and Feuer et al. (1993). One improvementover past calculations of the risk estimates was made in the population figures for people over age 85. Toimprove the precision of our calculations, populations for the age groups 85-89, 90-94, and 95+ wereobtained by partitioning the 85+ figure from the SEER areas by interpolation using figures from the 1980and 1990 decennial censuses. The BOC provided populations for these age groups for 1990 to 1997.
Lifetime risk of dying from cancer : The lifetime risk of dying from a specified cancer is derived using astandard multiple decrement life table (Elandt-Johnson, 1980) where a person is exposed to the risk ofdying from the specified cancer and all other causes based on mortality data from the SEER registry areas. Although the lifetime risk of dying from cancer could have been derived for the entire U.S., these estimateswere based only on data from SEER areas to allow comparison with the risk of diagnosis estimates.
U.S. CANCER MORTALITY RATES BY STATE
Each site-specific section of the book presents average annual mortality rates for the most recent 5-yearperiod for all races by sex for selected cancers for all 50 states and the District of Columbia. The rates areper 100,000 and age-adjusted to the United States (U.S.) 1970 standard million population. The five stateswith the highest rates and the five states with the lowest rates are identified. The states are also rankedfrom highest rate to lowest rate for each of the cancers for which rates are reported. The percent difference(PD) between the individual state rates and the rate for the total U.S. is given and is based on the followingformula:
PD = 100(State rate - Total U.S. rate)/Total U.S. rate
The standard error provided for each age-adjusted rate is calculated, based on the assumption that, foreach age-specific rate, the number of deaths is a Poisson random variable (Keyfitz, 1966) with the varianceof the age-adjusted rate being a linear combination of the variances of the age-specific rates (Snedecor,1980a). The difference between each age-adjusted state rate and the age-adjusted total U.S. rate is alsotested for statistical significance by calculating a Z statistic from the following formula:
Z = (State rate - Total U.S. rate)/SEd

SEER Cancer Statistics Review 1973-1996 National Cancer Institute
It is recognized that the two rates being compared are not independent because each state is part of theU.S.; however, this should not compromise the statistical test since each state represents a small proportionof the total U.S.
The standard error of the difference between two age-adjusted rates (SEd) is given by the following formula:SEd = [(SEs)2 + (SEu)2]1/2
where SEs and SEu are the standard errors of an individual state rate and the total U.S. rate respectively. The variance of each rate, i.e, the square of the standard error, is based on the Poisson assumption.
The standard error does not represent the total error which may be present in the age-adjusted rate but ismerely the variance associated with the rates. In addition to this variance, there also exist potential biasesand errors in the measurement of the rate which are extremely difficult to assess accurately and probablyhave a differential impact on the error for one state rate versus another.
Errors in the "measurement" of death rates can occur in either the numerator (the number of reporteddeaths) or the denominator (the population at risk). Sources of numerator error may include the underregistration of deaths. Although investigation by the National Center for Health Statistics indicates that over99% of all deaths in this country are registered, little is known concerning differentials by geographic area,age, sex, or race.
Numerator error also can occur due to misclassifications. These may include misclassification of race orethnicity and cause of death. Recent research indicates that, for infant mortality, misclassification is highestfor races other than white or black (Hahn, 1992). The extent of racial or ethnic misclassifications in deathcertificate coding, however, remains unknown.
In coding overall cancer mortality, misclassifications of cause of death would occur in those cases where thetrue cause of death was cancer, but a cause other than cancer was coded (and the reverse). Within thesubset of all cancer deaths, there is the additional problem of misclassification of the primary cancer. It isalready known, for example, that this is a problem with primary liver cancer (Percy, Ries, et al, 1990).
Denominator errors arise through census under- and over-enumeration in the decennial census (which isthe base for intercensal population estimates and population projections). To the extent that any over- orunder-count is substantial and variable among subgroups or geographic areas, it may have importantconsequences on death rates. The effect of an under-count is that it decreases the denominator leading toan over-estimation of the true rate. Conversely, an over-count would result in an under-estimation of thetrue rate.
In 1980, under-enumeration varied by age group with the greatest difference found for those 80 and older,who were under-counted by about five percent (U.S. Bureau of the Census, 1986). All other age groupswere either over- or under-counted by less than 3 percent. For age-sex-race groups, the coverage waslowest for black men aged 40-49 where the under-count was 19 percent. It is thought that no improvementwas achieved with the 1990 census, and in some instances, under-enumeration may be even worse than1980.
The impact of any of these errors is that they alter the counts in either the numerator or the denominator,which in turn affect the calculated rate. Since the types of error encountered may differ by type of cancer,age group, race, sex, or even state, their impact is difficult to ascertain. Caution is recommended whendealing with those areas where potential problems may be present.
In testing the differences between the total U.S. rate and the rate for each state (and the District ofColumbia) for a given cancer, it was necessary to consider the large number of statistical tests that wereperformed, because it would be expected that some tests are significant due to chance alone. To accountfor multiple comparisons, the overall significance level was chosen such that the probability that at least onecomparison would be significant is 0.01. Furthermore, based on one of Bonferroni's inequalities (Snedecor,1980b), the significance level for each individual comparison was set equal to 0.01/51, where 51 is thenumber of comparisons made for each type of cancer. Thus, any individual comparison with an associatedp value less than 0.0002 was considered to be statistically significant.

SEER Cancer Statistics Review 1973-1996 National Cancer Institute
Caution must be exercised in assessing statistically significant differences. Some states may have ratesthat are very close to the total U.S. rate, but because of their large population, the difference between theirrate and the total U.S. rate is found to be statistically significant. On the other hand, some smaller statesmay have rates that differ substantially from the total U.S. rate, but because of their relatively smallpopulation, the differences are found to be statistically nonsignificant.
If the percent difference between the two rates is small, there may be some question as to the importance ofthe difference. It is difficult to specify a percent difference below which there would be no concern becausethe relative difference observed will be a function of the magnitude of the rates involved. It may also be ofvalue to consider the size of the absolute difference between a state rate and the national rate in assessingthe importance of a statistically significant difference. To further assist in the interpretation of the data, thetables are footnoted to indicate absolute differences greater than 15 percent, depending on the magnitudeof the cancer rates.
It is important to note that comparing individual state rates with the total U.S. rate and assessing statisticalsignificance is not an appropriate procedure for assessing geographic clustering of state rates. Identification of states which may represent regional clusters of high or low rates would require additionalstatistical and graphical analyses.
For a number of cancers, the District of Columbia is found to have the highest mortality rates. It can beargued that it is inappropriate to compare cancer rates for the District of Columbia with those from the 50States because the District of Columbia is a predominantly urban area whereas states are comprised of acombination of urban, suburban, and rural areas. Mortality rates for many cancers are higher in urbanareas. Also, the District of Columbia has a higher percentage of blacks (about two-thirds) than any state,and their higher mortality rates for several types of cancer elevate the overall rate for the District ofColumbia.
INCIDENCE AND MORTALITY TIME TRENDS
Graphs depicting time trend lines are included for most of the individual cancers. Trend curves were fitusing polynomial regression of the form
Yx = B0 + B1x + ... + Bnxn,
where Yx is the rate in year x.
First order polynomials fit a linear trend representing either a constant yearly increase or decrease or atrend which is basically flat over the years involved. Second order polynomials may fit a trend whosefunction may increase or decrease to some maximum or minimum point in time before changing direction orwhose rate of increase or decrease may not be constant. Polynomials higher than second order fit trendfunctions which may reach several maximum or minimum points. The correct function is determined bywhether the addition of a higher order leads to a significant value for the coefficient, B, associated with thatparticular order (e.g., a trend is second order if and only if the term B2 is significantly different from zero). Trend lines were not fitted for some cancers when annual rates showed substantial variation due to smallnumbers of cases in the numerator. Most of the trends were fitted with either first or second orderpolynomial functions.

SEER Cancer Statistics Review 1973-1996 National Cancer Institute
INTERPRETATION OF CANCER STATISTICS
In reviewing the various cancer incidence, mortality, and survival statistics provided in this report, the readershould be aware that a number of factors may affect the interpretation of many of these statistics.
Survival rates for all cancers combined: The mix of cancers is changing over time as the incidence of somecancers increases and the incidence of others decreases. Thus, the relative contribution of a specificcancer to the survival rate for all cancers combined may not be constant over time. Because survival ratesdiffer by form of cancer, the overall cancer survival rate can fluctuate even when the survival rates forindividual cancers remain unchanged. It is possible to adjust the survival rates for all cancers combined fora calendar period based on the relative frequency of each cancer for some specified reference period;however, rates adjusted in this manner have been found to differ by only a small amount from unadjustedrates. In the future, such an adjustment may become more important if there are substantial changes in theincidence of various cancers.
Early detection/screening: A factor that may lead to an artifactual increase in patient survival as well asincidence for a specific cancer is the detection and diagnosis of cancers earlier than otherwise expected. These changes can occur subsequent to the introduction of a new procedure to screen subgroups of the population for a specific cancer and need not be related to whether or not use of the screening test resultsin a decrease in mortality from that cancer. As the proportion of cancers detected at screening increases,presumably as a result of increased screening of the population, patient survival will appear to increase. The additional survival associated with the time between a cancer being diagnosed by a screeningprocedure and the time at which the cancer would have been diagnosed in the absence of screening hasbeen termed "lead-time" (Zelen, 1976) and results in an artifactual increase in patient survival. Screeningfor breast cancer has been demonstrated to result in increased survival over and above that resulting from"lead-time" alone. Screening for breast cancer has been demonstrated to reduce breast cancer mortality.The benefit of screening is being studied for some other cancers. Screening may also result in a decreasein survival rates for invasive cancer if the screening procedure consistently detects a cancer in a preinvasivephase. In this case, length-biased sampling (Zelen, 1976) may be operating and, if so, will result in thosecancers that would have had a relatively good prognosis had they progressed to invasive disease beingpreferentially detected in a preinvasive phase. There is, therefore, the possibility of a systematic eliminationof invasive cancers that would have had a relatively good prognosis. If this occurs, the mix of cancers thatare not detected at screening and do progress to invasive becomes less prognostically favorable, resultingin a temporal decrease in survival for patients with invasive cancers. This latter effect of screening onpatient survival may at least partially explain survival trends for cervical cancer. Other possible cancersaffected include breast, colon, rectum and prostate.
Changes in diagnostic criteria: Early detection of cancer resulting from screening and/or earlier response tosymptoms may result in the increasing diagnosis of small (early) tumors prior to their becoming lifethreatening. This may have the effect of raising the incidence and survival rates with little or no change inmortality rates. Breast, colon, prostate, cervix uteri, bladder and skin (melanoma) are some of the cancersmost likely to be affected.
Technological advances in diagnostic procedures: Temporal trends in survival for patients with specificcancers by stage at diagnosis, as well as temporal trends in distributions of stage at diagnosis, are notpresented in this report. However, it is possible that the reader might compare survival by stage and stagedistributions given here with those for earlier time periods as provided in previous reports or available fromthe SEER public-use data file. Thus, it is necessary to comment on the effect of technological advances onthe diagnosis and staging of cancer. The probability that a patient's cancer will be assigned to a particularstage may change over time due to advances in diagnostic technology. Utilization of new technology cangive rise to a temporal phenomenon known as stage migration. Stage migration occurs when diagnosticprocedures change over time, resulting in an increase in the probability that a patient's cancer will bediagnosed in a more advanced stage. For example, certain distant metastases which would have beenundetectable a few years ago can now be diagnosed by a Computer Tomography (CAT) scan or byMagnetic Resonance Imaging (MRI). Therefore, some of the patients who would have been previouslydiagnosed as having cancer in a localized or regional stage would now be classified as having cancer in adistant stage. Thus, the likely result would be to remove the worst survivors, i.e,. those with previously

SEER Cancer Statistics Review 1973-1996 National Cancer Institute SEER Cancer Statistics Review 1973-1996 National Cancer Institute
undetected distant metastases, from the localized and regional categories and put them into the distantstage category. As a result, the stage distribution for a cancer may become less favorable over time, butthe survival rates for each stage category may improve. The latter occurs because those patients shiftedfrom early to advanced stage likely have poorer survival than early stage patients, as indicated previously,but better survival than advanced stage patients as identified in past time periods. However, overall survivalwould not change. This has been referred to as the "Will Rogers phenomenon" (Feinstein, 1985) and is animportant concept to understand when examining temporal changes in survival by stage as well as temporalchanges in stage distributions. This phenomenon could affect staging for virtually all solid tumors.
Evolution of stage classifications: The American Joint Committee on Cancer has produced a new stagingclassification for many cancers every few years. The evolution of such classifications reflects theidentification of new prognostic factors which may influence choice of treatment. Because the SEERProgram collects data on extent of disease rather than some determination of stage specified in the medicalrecord, changes in stage definitions can be more easily accommodated and trends in the new stage overtime can be calculated if the detailed extent of disease has enough information to collapse to the new stage. For those cancers for which new prognostic variables are introduced into staging, such that previouslycollected detailed data on extent of disease cannot be collapsed into stage categories, there can beproblems in assessing temporal trends in stage of disease. It is only possible to determine what effectchanges in staging have had on stage-specific survival and stage distributions by reviewing the evolution ofstaging for a given cancer. One also needs to take stage migration (mentioned above) and extent ofdisease migration into account. One reason for using the historical categories of localized, regional anddistant is that these categories have been fairly comparable over time.
Interpreting relative survival rates: The relative survival rate is the ratio of the observed survival rate to theexpected survival rate for a patient cohort. When the population used in calculating the expected survival issimilar to the cancer patients except for their cancer experience, the relative survival rate approximates theunderlying cancer cause-specific survival. The expected rate is based on mortality rates for the totalpopulation taking into account, as appropriate, the age, sex, race, and calendar year of diagnosis of thepatients. It is assumed that the presence of cancer is the only factor which distinguishes the cancer patientcohort from the general population, with the relative survival rate indicating the probability that patients willescape death due to causes associated with their diagnosed cancer. In some cases, there is a factorrelated to the risk of a cancer which is also related to the risk of dying from causes unrelated to the cancer. An example of such a factor is smoking. Smoking is a major risk factor for lung cancer, and therefore, acohort of lung cancer patients will consist of a much higher proportion of smokers than the generalpopulation. However, smoking is a risk factor for other diseases resulting in smokers having a shorter lifeexpectancy than non-smokers. Expected survival rates for lung cancer patients based on the generalpopulation will be unduly optimistic for this reason and will result in relative rates which are lower than theyshould be. The problem cannot be easily corrected because life-tables for smokers and non-smokers arenot readily available. The possibility that expected rates may not be appropriate for a given patient cohortshould also be considered when examining relative survival rates for patients with cancers of the cervix uterior breast, because the risk of these cancers has been associated with socioeconomic status (Baquet, 1991)which, in turn, may be related to life expectancy.
Previous to the CSR for 1973-1996, the expected rate tables used were for 1970 and 1980 and hadseparate tables for whites, blacks, American Indians, Chinese, Japanese, Filipinos, white Hispanic andHawaiians. In updating the tables for 1990, several problems emerged. The U.S. lifetables are based onage, race and sex information from death certificates. The information on race on the death certificate maynot be accurate since many times the funeral director will report race on the death certificate. Also, age atdeath, especially for those older than 85, may not be accurate because birth certificates were not issuedwith as much regularity in the early 1900s as they are today. Although race misclassification and age atdeath mis-reporting exist across all races, they may be more problematic for races other than white or blackbecause of their relatively smaller population sizes. Therefore, life tables were generated for 1970, 1980and 1990 for only white, black and other and these lifetables were used to produce the relative survivalrates in this book. Therefore, there may be small variations in survival rates calculated in this CSR to thosein CSRs prior to 1973-1996.
Comparison with other databases: The SEER data are obtained from population-based cancer registriescovering about 14 percent of the United States population. It is sometimes of interest to compare cancer
SEER Cancer Statistics Review 1973-1996 National Cancer Institute SEER Cancer Statistics Review 1973-1996 National Cancer Institute
statistics for SEER areas with those from other registries both in the United States and worldwide. Inmaking such comparisons, it is essential that the factors considered above be carefully considered for bothdata sources. In addition, completeness of case ascertainment, rules used to determine multiple primaries,follow-up, and rules used in assigning and coding cause of death should be assessed along with thesources and procedures used in obtaining population estimates. Depending on the rates being compared,there could be other confounding factors which should be adjusted for or otherwise considered. The samestandard million should be used for the age-adjustment of each group being compared.
It is sometimes interesting to compare survival data for cancer patients in SEER areas with that from clinicaltrials. This must be done with great caution. Survival data from clinical trials may have been obtained froma patient population that is different from patients diagnosed in SEER areas in regard to prognostic factorsfor the cancer in question. Any survival comparisons would have to adjust for such differences. Also, it isnecessary to verify that the methodology used in computing survival rates is the same for both datasources. Patients from clinical trials may differ from patients diagnosed in SEER areas in regard tocharacteristics that may be related to survival but are not recorded in either database. If this were true for agiven cancer, it would not be possible to make valid comparisons of the type discussed here.
Errors in data collection: In the process of registering cancer patients, errors in abstracting and coding thedata including demographic information, cancer site and/or histology, extent of disease, treatment, andpatient survival may be made. Quality control studies are periodically carried out to detect and correct thistype of error, but no attempt is made here to incorporate this source of error into the variance estimates ofcancer rates reported here.
Comparison of this report with previous reports: The cancer registries that participate in the SEER Programsubmit data on all cancers diagnosed in their coverage areas to the National Cancer Institute each year. Because of the dynamic nature of the registries' data bases, it is possible that the numbers of cancer casesin a particular race-sex-age-cancer category may change in a calendar year for which data have alreadybeen reported in a previous publication. One possible reason for this is that additional cancer cases thatwere previously overlooked for a given calendar year may be found and reported to the central registry. Asecond reason is follow-back of cancers diagnosed by death certificate only. Successful efforts to establishthe dates of diagnosis for such patients will change the number of patients reported in a given year. A thirdreason is possible code changes that may occur when a patient dies. For example, information on race isgenerally available on the death certificate and may be used to update a previously unknown value. Afourth reason is the elimination of duplicate records for the same patient, often due to name changes ormisspellings.
This discussion has addressed issues that may result in a recent report having a different number of casesfor a given time period than in an earlier report with its resulting effect on incidence and possibly survivalrates. Population estimates may also change from one report to another for some calendar years. Thisoccurs because the NCI receives population estimates which are regularly updated by the Bureau of theCensus. For example, previous population estimates for the nine years following the 1980 census werereplaced with improved, new estimates controlled to population counts available from the 1990 census. Such changes may result in some differences between incidence and mortality rates for a calendar periodas published in two different reports.
SEER Cancer Statistics Review 1973-1996 National Cancer Institute
STANDARD ERRORS OF RATES
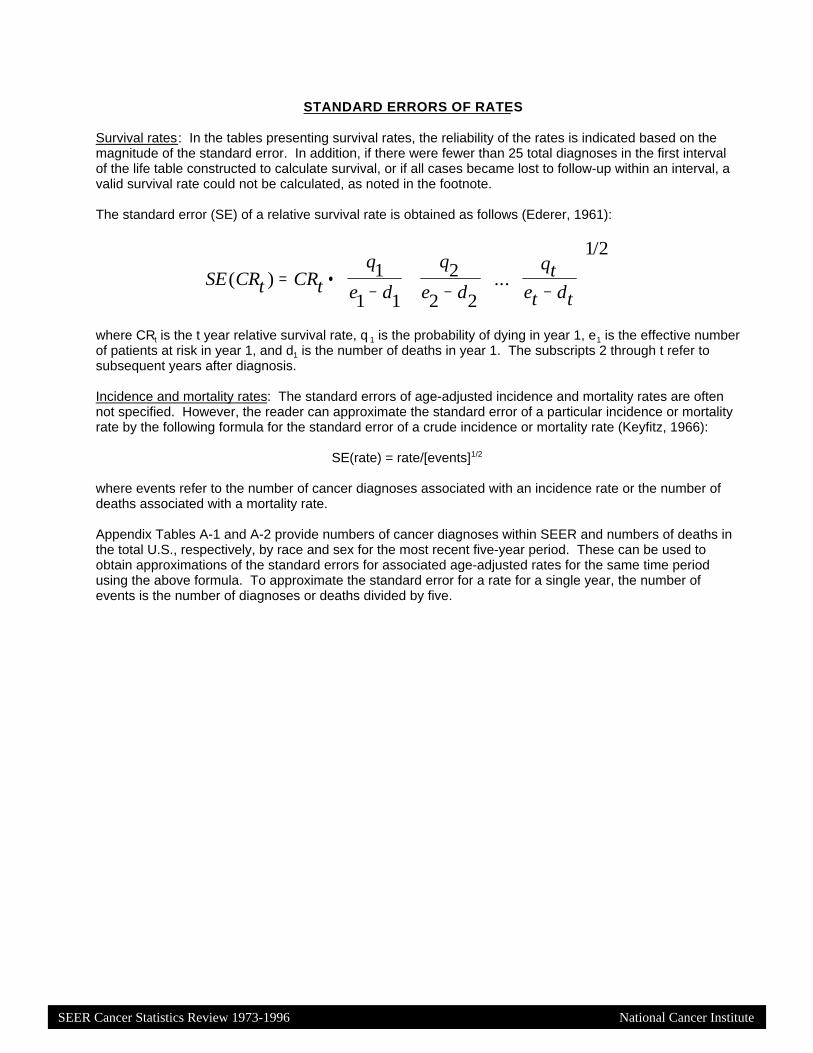
Survival rates: In the tables presenting survival rates, the reliability of the rates is indicated based on themagnitude of the standard error. In addition, if there were fewer than 25 total diagnoses in the first intervalof the life table constructed to calculate survival, or if all cases became lost to follow-up within an interval, avalid survival rate could not be calculated, as noted in the footnote.
The standard error (SE) of a relative survival rate is obtained as follows (Ederer, 1961):
SE CRt CRtq
e d
q
e dqt
et dt( ) ...
/
= • − + − + + −
1
1 1
2
2 2
1 2
where CRt is the t year relative survival rate, q 1 is the probability of dying in year 1, e1 is the effective numberof patients at risk in year 1, and d1 is the number of deaths in year 1. The subscripts 2 through t refer tosubsequent years after diagnosis.
Incidence and mortality rates: The standard errors of age-adjusted incidence and mortality rates are oftennot specified. However, the reader can approximate the standard error of a particular incidence or mortalityrate by the following formula for the standard error of a crude incidence or mortality rate (Keyfitz, 1966):
SE(rate) = rate/[events]1/2
where events refer to the number of cancer diagnoses associated with an incidence rate or the number ofdeaths associated with a mortality rate.
Appendix Tables A-1 and A-2 provide numbers of cancer diagnoses within SEER and numbers of deaths inthe total U.S., respectively, by race and sex for the most recent five-year period. These can be used toobtain approximations of the standard errors for associated age-adjusted rates for the same time periodusing the above formula. To approximate the standard error for a rate for a single year, the number ofevents is the number of diagnoses or deaths divided by five.

SEER Cancer Statistics Review 1973-1996 11 National Cancer Institute SEER Cancer Statistics Review 1973-1996 National Cancer Institute SEER Cancer Statistics Review 1973-1996 National Cancer Institute
REFERENCES
American Cancer Society, Cancer Facts & Figures - 1999, Pub. # 99-300M, No. 5008.99, Atlanta, Georgia,1999.
Baquet CR, Horm JW, Gibbs T, Greenwald P. Socioeconomic factors and cancer incidence among blacksand whites. J Natl Cancer Inst 1991; 83:551-557.
Breslow L (Chairman, Extramural Committee to Assess Measures of Progress Against Cancer).Measurement of progress against cancer. Final report to the Senate Appropriations Committee. Bethesda:National Cancer Institute, 1988.
Ederer F, Axtell LM, Cutler SJ. The relative survival rate: A statistical methodology. Natl Cancer InstMonogr 1961; 6:101-121.
Elandt-Johnson RC, Johnson NL. Survival Models and Data Analysis. New York: Wiley, 1980.
Feldman AR, Kessler L, Myers M, Naughton MD. The prevalence of cancer: estimates based on theConnecticut Tumor Registry, New England Journal of Medicine, 315:1394-1397 (November 27), 1986.
Feinstein AR, Sosin DM, Wells CK. The Will Rogers Phenomenon: Stage migration and new diagnostictechniques as a source of misleading statistics for survival of cancer. New Eng J Med 1985; 312:1604-1608.
Feuer EJ, Wun L-M, Boring CC, Flanders WD, Timmel MJ, Tong T. The lifetime risk of developing breastcancer. J Natl Cancer Inst 1993; 85:892-897.
Feuer EJ, Wun L-M, Boring CC. Probability of developing cancer. In: Miller BA, Ries LAG, Hankey BF,Kosary CL, Edwards BK, eds. Cancer Statistics Review: 1973-1989, National Cancer Institute, NIH Pub.No. 92-2789, 1992, XXX.1-8.
Hahn RA, Mulinare J, Teutsch SM. Inconsistencies in coding of race and ethnicity between birth and deathin U.S. infants. J Amer Med Assoc 1992; 267:259-263.
Keyfitz N. Sampling variance of standardized mortality rates. Hum Biol 38: 309-317, 1966.
Kleinbaum DG, Kupper LL, Muller KE. Applied Regression Analysis and Other Multivariable Methods.North Scituate, Massachusetts: Duxbury Press, 1988: 266-268.
Percy C, Van Holten V, Muir C. International classification of diseases for oncology, second edition, WorldHealth Organization, Geneva, 1990.
Percy C, Ries LAG, Van Holten VD. The accuracy of liver cancer as the underlying cause of death on deathcertificates. Public Health Reports 1990; 105:361-368.
Snedecor GW, Cochran WG. Statistical Methods, Seventh Edition, The Iowa State University Press,1980(a):188-189.
Snedecor GW, Cochran WG. Statistical Methods, Seventh Edition, The Iowa State University Press,1980(b):115-117.
U.S. Bureau of the Census. Current Population Reports; Series P-25 No. 985. Washington: U.S.Government Printing Office., 1986.
Zelen M. Theory of early detection of breast cancer in the general population. In Breast Cancer: Trends inResearch and Treatment. Heuson JC, Mattheiem WH, Rozencweig M, eds. New York, 1976: 287-299.

Source: Cancer Facts & Figures – 1999, American Cancer Society (ACS), Atlanta, Georgia, 1999. Excludes basal and squamous cell skin and in situ carcinomas except urinary bladder. Incidence projections are based on rates from the NCI SEER Program 1979-1995.
SEER Cancer Statistics Review 1973-1996 National Cancer Institute
Table I-1
ESTIMATED NEW CANCER CASES AND DEATHS FOR 1999
All Races, By Sex
Primary Site Estimated New Cases Estimated DeathsTotal Males Females Total Males Females
All Sites 1,221,800 623,800 598,000 563,100 291,100 272,000Oral Cavity and Pharynx 29,800 20,000 9,800 8,100 5,400 2,700 Tongue 6,600 4,300 2,300 1,800 1,200 600 Mouth 10,800 6,400 4,400 2,300 1,300 1,000 Pharynx 8,300 6,100 2,200 2,100 1,500 600 Other Oral Cavity 4,100 3,200 900 1,900 1,400 500Digestive System 226,300 117,200 109,100 131,000 69,900 61,100 Esophagus 12,500 9,400 3,100 12,200 9,400 2,800 Stomach 21,900 13,700 8,200 13,500 7,900 5,600 Small Intestine 4,800 2,500 2,300 1,200 600 600 Colon 94,700 43,000 51,700 47,900 23,000 24,900 Rectum 34,700 19,400 15,300 8,700 4,800 3,900 Anus, Anal Canal, and Anorectum
3,300 1,400 1,900 500 200 300
Liver and Intrahepatic Bile Duct
14,500 9,600 4,900 13,600 8,400 5,200
Gallbladder and Other Biliary
7,200 3,000 4,200 3,600 1,300 2,300
Pancreas 28,600 14,000 14,600 28,600 13,900 14,700 Other Digestive 4,100 1,200 2,900 1,200 400 800Respiratory System 187,600 106,800 80,800 164,200 94,900 69,300 Larynx 10,600 8,600 2,000 4,200 3,300 900 Lung and Bronchus 171,600 94,000 77,600 158,900 90,900 68,000 Other Respiratory 5,400 4,200 1,200 1,100 700 400Bones and Joints 2,600 1,400 1,200 1,400 800 600Soft Tissues 7,800 4,200 3,600 4,400 2,100 2,300Skin (excl. basal & squamous) 54,000 33,400 20,600 9,200 5,800 3,400 Melanomas of Skin 44,200 25,800 18,400 7,300 4,600 2,700 Other non-epithelial skin 9,800 7,600 2,200 1,900 1,200 700Breast 176,300 1,300 175,000 43,700 400 43,300Genital Organs 269,100 188,100 81,000 64,700 37,500 27,200 Cervix (uterus) 12,800 12,800 4,800 4,800 Endometrium (uterus) 37,400 37,400 6,400 6,400 Ovary 25,200 25,200 14,500 14,500 Vulva 3,300 3,300 900 900 Vagina and other genital organs, female
2,300 2,300 600 600
Prostate 179,300 179,300 37,000 37,000 Testis 7,400 7,400 300 300 Penis and other genital organs, male
1,400 1,400 200 200
Urinary System 86,500 58,400 28,100 24,500 15,600 8,900 Urinary Bladder 54,200 39,100 15,100 12,100 8,100 4,000 Kidney and Renal Pelvis 30,000 17,800 12,200 11,900 7,200 4,700 Ureter and other urinary organs
2,300 1,500 800 500 300 200
Eye and Orbit 2,200 1,200 1,000 200 100 100Brain and Other Nervous System
16,800 9,500 7,300 13,100 7,200 5,900
Endocrine System 19,800 5,400 14,400 2,000 900 1,100 Thyroid 18,100 4,600 13,500 1,200 500 700 Other Endocrine 1,700 800 900 800 400 400Lymphoma 64,000 36,400 27,600 27,000 14,100 12,900 Hodgkin’s Disease 7,200 3,800 3,400 1,300 700 600 Non-Hodgkin’s Lymphoma 56,800 32,600 24,200 25,700 13,400 12,300 Multiple Myeloma 13,700 7,300 6,400 11,400 5,800 5,600Leukemia 30,200 16,800 13,400 22,100 12,400 9,700 Lymphocytic Leukemias 10,900 6,300 4,600 6,500 3,800 2,700 Myeloid Leukemias 14,600 7,600 7,000 9,200 5,000 4,200 Other leukemia 4,700 2,900 1,800 6,400 3,600 2,800All Other Sites 35,100 16,400 18,700 36,100 18,200 17,900

Source: NCHS public use tape. * Rates are per 100,000 and are age-adjusted to the 1970 U.S. standard population.
Each rate has been age-adjusted by 5-year age groups. ¾ Due to coding changes throughout the years, Lung and Bronchus includes trachea and
pleura.
Table I-2
47-YEAR TRENDS IN U.S. CANCER MORTALITY RATES*
All Races, Males and Females
All Primary Cancer Sites Excluding Lung and Bronchus¾
TotalEstimated Annual PercentPercent Change Change
Age Group 1950 1975 1996 1950-75 1975-96 1950-96 0-4 11.0 5.1 2.6 -3.0 -2.9 -75.7 5-14 6.6 4.7 2.7 -0.9 -2.8 -58.4 15-24 8.4 6.5 4.4 -0.6 -1.8 -48.1 25-34 19.0 13.9 11.0 -1.3 -1.0 -42.5 35-44 59.6 43.1 33.9 -1.1 -0.9 -41.7 45-54 154.8 130.1 103.6 -0.6 -1.0 -32.1 55-64 344.8 299.7 267.0 -0.5 -0.5 -21.7 65-74 640.7 574.6 558.0 -0.5 -0.1 -11.9 75-84 1105.3 963.2 978.4 -0.5 0.1 -10.1 85+ 1408.4 1302.4 1516.1 -0.6 0.7 7.7 All Ages 145.0 125.3 117.9 -0.6 -0.2 -17.7
All Primary Cancer Sites Combined
TotalEstimated Annual PercentPercent Change Change
Age Group 1950 1975 1996 1950-75 1975-96 1950-96 0-4 11.1 5.2 2.6 -3.0 -2.9 -75.7 5-14 6.6 4.7 2.7 -1.0 -2.8 -58.5 15-24 8.5 6.6 4.5 -0.6 -1.8 -48.5 25-34 19.8 14.6 11.5 -1.2 -1.1 -41.6 35-44 64.2 53.9 40.3 -0.5 -1.3 -36.0 45-54 175.2 179.2 142.1 0.2 -1.1 -18.0 55-64 394.0 423.2 405.6 0.3 -0.1 4.0 65-74 700.0 769.8 852.5 0.4 0.6 22.6 75-84 1160.9 1156.0 1343.8 0.0 0.8 17.1 85+ 1450.7 1437.9 1798.0 -0.3 1.0 23.9 All Ages 158.1 162.3 166.9 0.1 0.2 6.5
SEER Cancer Statistics Review 1973-1996 National Cancer Institute

The EAPC is the Estimated Annual Percent Change over the time interval.¾ Wingo PA, Tong T, Bolden S. Cancer Statistics 1995. CA Cancer J Clin 1995;45:8-30. Excludes basal and squamous cell skin and in situ carcinomas excepturinary bladder. Incidence projections are based on rates from the NCI SEERProgram 1989-91.
* NCHS public use tape.' All Sites, All sites excluding Lung & Bronchus, Liver & Intrahep, Brain & Other
nervous and Childhood cancers are for all races as opposed to whites.§ Data prior to 1973 are from Devesa, Silverman, Young, et al. Cancer Incidence and
Mortality Trends Among Whites in the United States, 1947-84. JNCI 1987;79:701-770 with the exception of All Sites, All sites excluding Lung & Bronchus,Liver & Intrahep, Brain & Other nervous and Childhood cancers which come fromhistorical Connecticut data. Data for 1973-95 are from the same areas used inDevesa or the Connecticut registry of the SEER Program.
N NCHS public use tape. Due to coding changes throughout the years: Colon excludesother digestive tract; Rectum includes anal canal; Liver & Intrahep includesgallbladder & biliary tract, NOS; Lung & Bronchus includes trachea & pleura; Ovaryincludes fallopian tube; Urinary bladder includes other urinary organs; Kidney &Renal pelvis includes ureter; NHL and Multiple myeloma each include a small numberof leukemias; NHL includes a small number of ill-defined sites.
8 Rates for 1950-54 are from NCI Survival Report 5 with the exception of All Sites,All sites excluding Lung & Bronchus, Oral cavity & Pharynx, Colon & Rectum,Non-Hodgkin's lymphomas and Childhood cancers which come from historicalConnecticut data. Rates for 1989-95 are from the SEER Program with the exceptionof the sites just listed which come from the Connecticut registry of the SEERProgram.
Table I-3
SUMMARY OF CHANGES IN CANCER INCIDENCE AND MORTALITY, 1950-96 AND
5-YEAR RELATIVE SURVIVAL RATES, 1950-95
Males and Females, By Primary Cancer Site
All Races Whites
Percent Change 1950-96'5-Year Relative
Estimated Actual U.S. Survival RatesCancer Cancer Incidence§ MortalityN (Percent)8Cases Deaths
Primary Site in 1996¾ in 1996* Total EAPC Total EAPC 1950-54 1989-95
Oral cavity and Pharynx 29,490 7,853 -38.2 -0.7 -37.3 -0.9 46 55.5Esophagus 12,300 11,231 -8.2 0.2 21.7 0.4 4 13.3Stomach 22,800 13,335 -77.9 -2.7 -80.1 -3.6 12 19.3Colon and Rectum 133,500 56,754 -2.9 -0.1 -35.4 -0.9 37 61.8 Colon 94,500 48,587 11.5 0.2 -21.3 -0.4 41 62.4 Rectum 39,000 8,167 -26.7 -0.7 -67.1 -2.8 40 60.2Liver and Intrahep 19,900 11,584 139.9 1.7 33.6 0.5 1 6.0Pancreas 26,300 27,256 9.4 0.0 15.9 0.2 1 4.1Larynx 11,600 3,918 37.6 0.4 -14.4 -0.3 52 66.1Lung and Bronchus 177,000 151,902 249.1 2.4 259.0 3.0 6 14.2 Males 98,900 91,554 178.3 1.6 196.9 2.4 5 12.7 Females 78,100 60,348 577.9 4.5 611.9 5.3 9 16.4Melanomas of skin 38,300 7,279 453.0 4.1 160.6 2.2 49 87.9Breast(females) 184,300 43,090 55.1 1.3 -7.5 0.0 60 86.0Cervix uteri 15,700 4,540 -78.9 -3.0 -75.7 -3.6 59 71.4Corpus and Uterus, NOS 34,000 6,310 -0.3 -0.6 -67.4 -2.3 72 85.5Ovary 26,700 13,161 3.2 0.2 -2.3 -0.2 30 49.9Prostate 317,100 34,122 190.1 3.2 10.0 0.3 43 93.1Testis 7,400 345 105.8 2.0 -72.7 -3.2 57 95.7Urinary bladder 52,900 11,451 51.1 1.0 -35.3 -1.1 53 81.8Kidney and Renal pelvis 30,600 11,095 125.9 2.0 37.4 0.6 34 61.1Brain and Other nervous 17,900 12,375 68.2 1.2 44.9 0.7 21 29.6Thyroid 15,600 1,181 141.8 1.7 -48.2 -1.9 80 95.1Hodgkin's disease 7,500 1,408 16.3 0.2 -73.3 -3.4 30 82.9Non-Hodgkin's lymphomas 52,700 22,834 195.5 2.9 137.6 1.6 33 51.9Multiple myeloma 14,400 10,178 197.3 1.8 206.2 2.2 6 28.0Leukemias 27,600 20,494 9.5 0.2 -3.7 -0.3 10 44.4Childhood(0-14 yrs) 8,300 1,539 15.7 0.8 -67.2 -2.8 20 75.5All sites excluding 1,182,150 387,606 40.5 0.8 -17.7 -0.4 38 68.1 Lung and BronchusAll Sites 1,359,150 539,508 53.6 1.0 6.5 0.2 35 60.9
SEER Cancer Statistics Review 1973-1996 National Cancer Institute

Note: The EAPC is the Estimated Annual Percent Change over the time interval. ¾ EAPCs for sex specific sites are only for the proper sex. EAPCs for breast cancer
are for females only.§ SEER Program. Rates are per 100,000 and are age-adjusted to the 1970 U.S.
standard population.* NCHS public use tape. Rates are per 100,000 and are age-adjusted to the 1970 U.S.
standard population.
Table I-4
TRENDS IN SEER INCIDENCE§ AND U.S. MORTALITY* FOR SELECTED CANCER SITES, 1973-96
All Races, Males and Females¾
Mortality EAPC Incidence EAPC
Decreasing IncreasingIncidence Incidence
Mrt Inc Mrt Inc
Oral cavity & Pharynx -1.6 -0.5 Breast¾ -0.1 1.5 Stomach -2.3 -1.6 Ovary¾ -0.4 0.4 Colon & Rectum -1.2 -0.4 Testis¾ -5.3 1.8Decreasing Pancreas -0.2 -0.4 Urinary Bladder -1.4 0.5Mortality Larynx -0.5 -0.7 Thyroid -1.2 1.4 Cervix uteri¾ -2.6 -2.2 Corpus & Uterus, NOS¾ -1.5 -1.7 Hodgkin's disease -4.2 -0.3 Leukemias -0.3 -0.2
Mrt Inc All sites 0.2 1.1 Esophagus 0.8 0.5 Liver & Intrahep 2.1 2.9Increasing Lung & Bronchus 1.6 1.2Mortality Melanomas of skin 1.3 3.7 Prostate¾ 0.9 4.4 Kidney & Renal pelvis 0.9 2.0 Brain & Other nervous 0.5 0.8 Non-Hodgkin's lymphomas 1.9 3.0 Multiple myeloma 1.3 0.8
SEER Cancer Statistics Review 1973-1996 National Cancer Institute

Note: PC is the Percent Change over the time interval. ¾ PCs for sex specific sites are only for the proper sex. PCs for breast cancer are
for females only.§ SEER Program. Rates are per 100,000 and are age-adjusted to the 1970 U.S.
standard population.* NCHS public use tape. Rates are per 100,000 and are age-adjusted to the 1970 U.S.
standard population.
Table I-5
TRENDS IN SEER INCIDENCE§ AND U.S. MORTALITY* FOR SELECTED CANCER SITES, 1973-96
All Races, Males and Females¾
Mortality PC Incidence PC
Decreasing IncreasingIncidence Incidence
Mrt Inc Mrt Inc
Oral cavity & Pharynx -28.4 -11.0 Breast¾ -7.5 25.3 Stomach -41.0 -34.5 Testis¾ -70.0 41.5 Colon & Rectum -22.6 -9.1 Urinary Bladder -24.0 7.7Decreasing Pancreas -3.4 -11.5 Thyroid -21.6 42.1Mortality Larynx -10.4 -16.2 Cervix uteri¾ -47.3 -44.0 Corpus & Uterus, NOS¾ -26.7 -27.4 Ovary¾ -11.2 -0.7 Hodgkin's disease -64.3 -17.4 Leukemias -6.2 -5.3
Mrt Inc All sites 3.3 20.0 Esophagus 20.0 9.2 Liver & Intrahep 50.8 77.5Increasing Lung & Bronchus 38.6 27.8Mortality Melanomas of skin 35.8 134.6 Prostate¾ 13.0 111.9 Kidney & Renal pelvis 18.5 44.2 Brain & Other nervous 11.1 15.8 Non-Hodgkin's lymphomas 44.5 81.3 Multiple myeloma 36.0 13.7
SEER Cancer Statistics Review 1973-1996 National Cancer Institute

Note: Incidence and mortality rates are per 100,000 and are age-adjusted to the 1970U.S. standard population. Survival rates are expressed as percents.
§ SEER Program.* NCHS public use tape.- Statistic could not be calculated.
Table I-6AGE-ADJUSTED SEER INCIDENCE AND U.S. MORTALITY RATES AND 5-YEAR RELATIVE SURVIVAL RATES
By Primary Cancer Site, Sex and Time Period
All Races
Incidence§ US Mortality* Survival§(1992-96) (1992-96) (1989-95)
Site Total Males Females Total Males Females Total Males Females All Sites 404.8 489.1 345.8 170.1 213.1 140.9 59.4 57.5 61.4 Oral Cavity & Pharynx: 10.3 15.5 6.0 2.7 4.2 1.5 53.3 50.0 60.2 Lip 1.1 2.1 0.3 0.0 0.1 0.0 94.3 93.6 97.9 Tongue 2.2 3.2 1.4 0.6 0.9 0.4 49.9 45.7 58.0 Salivary gland 1.0 1.3 0.8 0.2 0.3 0.1 72.8 66.4 80.3 Floor of mouth 0.9 1.4 0.5 0.1 0.1 0.1 52.3 48.7 60.7 Gum & other 1.8 2.3 1.3 0.4 0.6 0.3 48.3 39.1 63.4 oral cavity Nasopharynx 0.6 0.9 0.4 0.2 0.4 0.1 53.3 52.9 54.4 Tonsil 1.1 1.7 0.5 0.2 0.3 0.1 48.1 47.7 48.8 Oropharynx 0.3 0.5 0.1 0.2 0.3 0.1 29.5 27.3 35.9 Hypopharynx 0.9 1.6 0.4 0.2 0.3 0.1 29.5 28.1 34.2 Other oral cavity 0.3 0.6 0.2 0.5 0.9 0.3 24.8 24.5 25.2 & pharynx Digestive System: 73.2 91.4 59.0 39.1 50.5 30.4 43.1 41.3 45.0 Esophagus 3.9 6.5 1.7 3.6 6.3 1.5 12.3 12.1 13.1 Stomach 7.0 10.4 4.4 4.2 6.1 2.8 21.1 18.6 25.2 Small intestine 1.3 1.6 1.1 0.3 0.4 0.3 49.0 47.5 50.8 Colon & Rectum: 44.3 53.0 37.6 17.5 21.5 14.6 61.0 61.2 60.8 Colon 31.9 36.9 28.1 - - - 61.6 62.2 61.0 Rectum 12.4 16.2 9.5 - - - 59.5 59.1 60.1 Anus, anal canal & 1.0 0.9 1.0 0.1 0.1 0.1 59.6 54.0 63.5 anorectum Liver & Intrahep: 3.7 5.7 2.1 3.4 4.9 2.2 5.3 4.3 7.2 Liver 3.1 4.9 1.6 2.8 4.2 1.7 5.7 4.4 8.5 Intrahep bile duct 0.6 0.8 0.5 0.6 0.8 0.5 2.8 2.8 2.6 Gallbladder 1.0 0.7 1.2 0.6 0.4 0.8 13.7 10.7 14.9 Other biliary 1.1 1.3 0.9 0.5 0.6 0.4 17.0 18.4 15.8 Pancreas 8.9 10.2 7.8 8.4 9.8 7.3 4.1 3.7 4.4 Retroperitoneum 0.4 0.4 0.4 0.1 0.1 0.1 47.0 49.7 44.0 Peritoneum, omentum & 0.4 0.2 0.5 0.1 0.1 0.1 28.3 19.2 32.8 mesentery Other digestive 0.3 0.3 0.2 0.1 0.2 0.1 2.6 2.3 3.8 system Respiratory System: 62.6 85.7 45.1 51.3 73.8 34.5 17.7 17.5 18.1 Nose, nasal cavity & 0.6 0.8 0.4 0.2 0.2 0.1 52.3 52.5 51.8 middle ear Larynx 4.0 7.1 1.5 1.3 2.4 0.5 64.6 66.2 58.6 Lung & bronchus 57.0 75.9 42.8 49.5 70.8 33.8 13.9 12.4 16.1 Pleura 0.8 1.5 0.3 0.1 0.3 0.1 6.0 3.3 17.4 Trachea & other 0.2 0.3 0.1 0.1 0.1 0.1 46.2 46.5 43.8 respiratory organs Bones & joints 0.9 1.1 0.7 0.4 0.5 0.3 66.4 64.0 69.7 Soft tissue (incl heart) 2.4 2.8 2.0 1.3 1.3 1.2 65.2 64.7 65.8 Skin (ex basal & squam): 16.6 22.2 11.9 2.9 4.3 1.8 68.7 56.6 90.6 Melanomas of skin 13.0 16.0 10.8 2.2 3.2 1.5 87.7 85.1 90.8 Other non-epithelial 3.6 6.2 1.2 0.7 1.1 0.3 25.0 17.5 88.3 skin Breast 60.2 0.9 110.6 14.2 0.3 25.4 84.7 81.8 84.7
SEER Cancer Statistics Review 1973-1996 National Cancer Institute

Note: Incidence and mortality rates are per 100,000 and are age-adjusted to the 1970U.S. standard population. Survival rates are expressed as percents.
§ SEER Program.* NCHS public use tape.- Statistic could not be calculated.
Table I-6 - continuedAGE-ADJUSTED SEER INCIDENCE AND U.S. MORTALITY RATES AND 5-YEAR RELATIVE SURVIVAL RATES
By Primary Cancer Site, Sex and Time Period
All Races
Incidence§ US Mortality* Survival§(1992-96) (1992-96) (1989-95)
Site Total Males Females Total Males Females Total Males Females Female Genital System: 25.3 - 46.9 8.1 - 14.5 69.6 - 69.6 Cervix uteri 4.1 - 7.9 1.5 - 2.8 69.7 - 69.7 Corpus uteri 11.5 - 21.1 1.0 - 1.7 84.4 - 84.4 Uterus, NOS 0.2 - 0.4 0.9 - 1.6 26.4 - 26.4 Ovary 7.9 - 14.6 4.3 - 7.6 50.0 - 50.0 Vagina 0.3 - 0.6 0.1 - 0.2 49.9 - 49.9 Vulva 0.9 - 1.7 0.2 - 0.3 75.2 - 75.2 Other female 0.4 - 0.7 0.1 - 0.2 62.9 - 62.9 genital system Male Genital System: 70.6 162.0 - 10.0 26.0 - 91.9 91.9 - Prostate 68.0 156.5 - 9.8 25.6 - 91.9 91.9 - Testis 2.3 4.5 - 0.1 0.2 - 95.4 95.4 - Penis 0.3 0.7 - 0.1 0.2 - 66.2 66.2 - Other male 0.1 0.3 - 0.0 0.0 - 78.8 78.8 - genital system Urinary System: 26.9 42.9 14.6 6.9 10.8 4.1 73.2 75.9 67.5 Urinary bladder 16.8 28.9 7.7 3.2 5.6 1.7 80.7 83.1 74.1 Kidney & renal pelvis 9.3 12.9 6.5 3.5 5.0 2.3 60.3 60.5 60.1 Ureter 0.4 0.7 0.3 0.1 0.1 0.1 58.2 57.5 59.1 Other urinary system 0.3 0.4 0.1 0.1 0.1 0.1 63.6 70.4 52.4 Eye & Orbit 0.7 0.8 0.6 0.1 0.1 0.1 78.6 77.8 79.6 Brain & Nervous System: 6.0 7.3 4.9 4.2 5.1 3.4 30.4 31.2 29.5 Brain 5.6 6.8 4.6 4.1 5.0 3.4 28.1 28.9 27.0 Cranial nerves & other 0.4 0.4 0.3 0.1 0.1 0.1 67.1 68.0 65.9 nervous system Endocrine System: 5.8 3.6 8.0 0.7 0.7 0.6 91.2 84.5 93.8 Thyroid 5.2 2.9 7.4 0.3 0.3 0.4 94.7 90.5 96.1 Other endocrine & 0.6 0.7 0.5 0.3 0.4 0.3 58.6 57.7 59.6 thymus Lymphomas: 18.5 22.7 14.9 7.2 9.0 5.9 56.4 52.3 61.7 Hodgkin's disease 2.7 3.0 2.4 0.5 0.6 0.4 82.1 79.2 85.5 Non-Hodgkin's 15.8 19.7 12.5 6.8 8.4 5.5 51.0 46.8 56.5 lymphomas Multiple myeloma 4.5 5.5 3.7 3.1 3.8 2.6 28.4 29.2 27.6Leukemias: 10.3 13.2 8.0 6.3 8.4 4.8 43.1 43.7 42.3 Lymphocytic: 4.6 6.0 3.4 1.9 2.6 1.3 65.8 65.2 66.7 Acute lymphocytic 1.5 1.7 1.2 0.5 0.6 0.4 58.8 56.6 61.8 Chronic lymphocytic 3.0 4.2 2.1 1.2 1.8 0.8 70.5 70.7 70.3 Other lymphocytic 0.1 0.2 0.1 0.1 0.1 0.1 41.6 42.5 39.9 Myeloid: 4.3 5.3 3.6 2.7 3.4 2.2 21.2 20.0 22.6 Acute myeloid 2.7 3.2 2.3 1.9 2.4 1.6 14.5 13.4 15.8 Chronic myeloid 1.4 1.8 1.1 0.7 1.0 0.6 31.9 30.1 34.3 Other myeloid 0.2 0.2 0.2 0.1 0.1 0.1 30.6 27.4 34.5 Monocytic: 0.2 0.3 0.2 0.1 0.1 0.1 17.3 19.4 14.7 Acute monocytic 0.2 0.2 0.2 0.1 0.1 0.0 18.6 21.8 14.5 Chronic monocytic 0.0 0.0 0.0 0.0 0.0 0.0 15.1 - - Other monocytic 0.0 0.0 0.0 0.0 0.0 0.0 - - - Other: 1.2 1.7 0.8 1.7 2.2 1.3 33.9 40.0 24.9 Other acute 0.4 0.6 0.3 0.9 1.2 0.7 10.7 10.5 10.9 Other chronic 0.0 0.0 0.0 0.0 0.1 0.0 42.2 - - Aleukemic, subleuk & 0.7 1.1 0.5 0.7 1.0 0.5 49.4 56.5 35.8 NOS Ill-defined & 10.0 11.5 8.8 11.7 14.5 9.6 12.1 12.6 11.6 unspecified
SEER Cancer Statistics Review 1973-1996 National Cancer Institute

Note: Incidence and mortality rates are per 100,000 and are age-adjusted to the 1970U.S. standard population. Survival rates are expressed as percents.
§ SEER Program.* NCHS public use tape.- Statistic could not be calculated.
Table I-7AGE-ADJUSTED SEER INCIDENCE AND U.S. MORTALITY RATES AND 5-YEAR RELATIVE SURVIVAL RATES
By Primary Cancer Site, Sex and Time Period
Whites
Incidence§ US Mortality* Survival§(1992-96) (1992-96) (1989-95)
Site Total Males Females Total Males Females Total Males Females All Sites 405.6 483.0 352.5 166.7 207.0 139.5 60.9 59.2 62.6
Oral Cavity & Pharynx: 10.0 14.9 5.9 2.5 3.7 1.4 55.5 52.7 61.3 Lip 1.2 2.3 0.4 0.0 0.1 0.0 94.0 93.4 97.2 Tongue 2.3 3.2 1.4 0.6 0.8 0.3 52.0 48.1 59.0 Salivary gland 1.0 1.3 0.8 0.2 0.3 0.1 73.6 66.9 81.9 Floor of mouth 0.9 1.4 0.5 0.1 0.1 0.1 54.8 51.5 62.1 Gum & other 1.7 2.2 1.3 0.4 0.6 0.3 50.2 41.2 64.4 oral cavity Nasopharynx 0.4 0.5 0.2 0.2 0.3 0.1 44.4 46.2 40.8 Tonsil 1.1 1.7 0.5 0.2 0.3 0.1 51.2 52.1 49.4 Oropharynx 0.3 0.4 0.1 0.2 0.2 0.1 33.8 30.2 44.1 Hypopharynx 0.8 1.4 0.4 0.1 0.2 0.1 30.0 28.0 36.1 Other oral cavity 0.3 0.5 0.2 0.5 0.8 0.3 25.5 24.8 26.4 & pharynx
Digestive System: 70.3 87.3 57.0 37.3 48.1 29.0 44.7 43.2 46.3 Esophagus 3.5 5.9 1.6 3.2 5.7 1.3 13.3 13.2 13.6 Stomach 6.0 9.0 3.7 3.7 5.4 2.5 19.3 16.7 23.6 Small intestine 1.3 1.5 1.1 0.3 0.4 0.3 50.2 47.5 53.3 Colon & Rectum: 43.9 52.8 37.1 17.1 21.1 14.2 61.8 62.0 61.5 Colon 31.5 36.7 27.6 - - - 62.4 63.0 61.9 Rectum 12.4 16.1 9.5 - - - 60.2 60.0 60.6 Anus, anal canal & 1.0 0.9 1.1 0.1 0.1 0.1 62.2 58.3 64.7 anorectum Liver & Intrahep: 3.0 4.5 1.7 3.1 4.4 2.1 6.0 4.9 8.0 Liver 2.4 3.7 1.3 2.5 3.7 1.5 6.6 5.0 9.8 Intrahep bile duct 0.6 0.8 0.5 0.6 0.7 0.5 3.0 3.3 2.5 Gallbladder 0.9 0.6 1.2 0.6 0.4 0.8 13.6 9.1 15.1 Other biliary 1.1 1.3 0.9 0.5 0.6 0.4 17.7 19.9 15.8 Pancreas 8.5 9.8 7.5 8.1 9.5 7.0 4.1 3.8 4.4 Retroperitoneum 0.4 0.4 0.4 0.1 0.1 0.1 49.5 50.6 48.4 Peritoneum, omentum & 0.4 0.2 0.6 0.1 0.1 0.1 27.1 17.6 31.4 mesentery Other digestive 0.3 0.3 0.2 0.1 0.2 0.1 1.9 1.4 3.2 system
Respiratory System: 62.5 83.9 46.4 50.8 71.9 35.1 18.1 17.9 18.4 Nose, nasal cavity & 0.6 0.7 0.4 0.1 0.2 0.1 53.6 52.4 54.7 middle ear Larynx 3.9 6.9 1.5 1.2 2.2 0.5 66.1 67.7 59.9 Lung & bronchus 56.9 74.3 44.1 49.2 69.1 34.4 14.2 12.7 16.4 Pleura 0.9 1.7 0.3 0.1 0.3 0.1 5.8 3.2 17.4 Trachea & other 0.2 0.3 0.1 0.1 0.1 0.1 46.9 48.8 40.8 respiratory organs
Bones & joints 0.9 1.1 0.7 0.4 0.5 0.3 66.2 64.2 68.9
Soft tissue (incl heart) 2.3 2.8 2.0 1.2 1.4 1.1 66.2 66.3 66.1
Skin (ex basal & squam): 18.5 24.4 13.6 3.2 4.7 2.0 70.5 58.8 90.9 Melanomas of skin 14.9 18.2 12.4 2.5 3.5 1.7 87.9 85.3 91.0 Other non-epithelial 3.6 6.2 1.1 0.7 1.1 0.3 24.4 17.3 89.2 skin
Breast 61.6 0.9 113.9 14.0 0.2 25.1 86.0 85.5 86.0
SEER Cancer Statistics Review 1973-1996 National Cancer Institute

Note: Incidence and mortality rates are per 100,000 and are age-adjusted to the 1970U.S. standard population. Survival rates are expressed as percents.
§ SEER Program.* NCHS public use tape.- Statistic could not be calculated.
Table I-7 - continuedAGE-ADJUSTED SEER INCIDENCE AND U.S. MORTALITY RATES AND 5-YEAR RELATIVE SURVIVAL RATES
By Primary Cancer Site, Sex and Time Period
Whites
Incidence§ US Mortality* Survival§(1992-96) (1992-96) (1989-95)
Site Total Males Females Total Males Females Total Males Females Female Genital System: 25.8 - 48.1 7.9 - 14.1 70.8 - 70.8 Cervix uteri 3.7 - 7.3 1.3 - 2.4 71.4 - 71.4 Corpus uteri 12.0 - 22.1 0.9 - 1.7 86.2 - 86.2 Uterus, NOS 0.2 - 0.3 0.8 - 1.5 24.3 - 24.3 Ovary 8.2 - 15.4 4.4 - 7.9 49.9 - 49.9 Vagina 0.3 - 0.5 0.1 - 0.2 52.1 - 52.1 Vulva 1.0 - 1.7 0.2 - 0.3 74.5 - 74.5 Other female 0.4 - 0.7 0.1 - 0.2 62.6 - 62.6 genital system
Male Genital System: 68.5 156.4 - 9.1 23.9 - 93.0 93.0 - Prostate 65.5 150.2 - 8.9 23.4 - 93.1 93.1 - Testis 2.6 5.3 - 0.1 0.3 - 95.7 95.7 - Penis 0.3 0.7 - 0.1 0.1 - 67.4 67.4 - Other male 0.1 0.3 - 0.0 0.0 - 75.6 75.6 - genital system Urinary System: 28.3 45.4 15.2 7.0 11.1 4.1 74.5 77.2 68.6 Urinary bladder 18.1 31.3 8.2 3.3 5.8 1.7 81.8 83.9 75.7 Kidney & renal pelvis 9.4 13.0 6.5 3.6 5.1 2.4 61.1 61.7 60.1 Ureter 0.5 0.7 0.3 0.1 0.1 0.1 58.7 58.3 59.3 Other urinary system 0.2 0.4 0.1 0.0 0.1 0.0 65.5 69.8 56.4
Eye & Orbit 0.8 0.9 0.7 0.1 0.1 0.1 78.7 78.3 79.3
Brain & Nervous System: 6.5 7.8 5.3 4.5 5.4 3.7 29.6 30.0 29.0 Brain 6.1 7.4 5.0 4.4 5.3 3.6 27.2 27.7 26.7 Cranial nerves & other 0.4 0.4 0.3 0.1 0.1 0.1 69.4 71.4 66.7 nervous system
Endocrine System: 5.9 3.7 8.0 0.7 0.7 0.6 91.9 85.7 94.4 Thyroid 5.3 3.0 7.6 0.3 0.3 0.4 95.1 91.0 96.6 Other endocrine & 0.6 0.6 0.5 0.3 0.4 0.3 57.7 58.0 57.3 thymus
Lymphomas: 19.2 23.4 15.6 7.5 9.3 6.2 57.4 53.3 62.4 Hodgkin's disease 2.9 3.2 2.6 0.5 0.6 0.4 82.9 80.4 85.9 Non-Hodgkin's 16.3 20.2 12.9 7.0 8.6 5.8 51.9 47.7 57.3 lymphomas
Multiple myeloma 4.1 5.1 3.3 2.8 3.5 2.4 28.0 28.7 27.2
Leukemias: 10.6 13.7 8.1 6.4 8.5 4.9 44.4 45.5 43.0 Lymphocytic: 4.8 6.3 3.6 1.9 2.7 1.3 67.4 67.2 67.7 Acute lymphocytic 1.5 1.8 1.3 0.5 0.7 0.4 59.0 57.7 60.9 Chronic lymphocytic 3.2 4.4 2.3 1.2 1.8 0.8 72.2 72.5 71.8 Other lymphocytic 0.1 0.2 0.1 0.1 0.1 0.1 45.7 46.0 44.9 Myeloid: 4.3 5.3 3.6 2.8 3.5 2.2 21.0 20.3 21.8 Acute myeloid 2.7 3.3 2.3 1.9 2.5 1.6 14.2 13.2 15.2 Chronic myeloid 1.4 1.8 1.1 0.7 1.0 0.6 31.9 31.2 32.6 Other myeloid 0.2 0.2 0.2 0.1 0.1 0.1 31.1 28.7 34.0 Monocytic: 0.2 0.3 0.2 0.1 0.1 0.1 17.2 18.1 16.0 Acute monocytic 0.2 0.2 0.2 0.1 0.1 0.0 18.1 20.4 15.2 Chronic monocytic 0.0 0.0 0.0 0.0 0.0 0.0 18.5 - - Other monocytic 0.0 0.0 0.0 0.0 0.0 0.0 - - - Other: 1.2 1.7 0.8 1.7 2.2 1.3 36.1 42.7 26.1 Other acute 0.4 0.6 0.3 0.9 1.2 0.7 10.9 10.7 11.1 Other chronic 0.0 0.0 0.0 0.0 0.1 0.0 47.3 - - Aleukemic, subleuk & 0.7 1.1 0.5 0.7 1.0 0.5 52.1 59.3 37.7 NOS
Ill-defined & 9.8 11.4 8.6 11.4 14.0 9.4 12.3 13.1 11.6 unspecified
SEER Cancer Statistics Review 1973-1996 National Cancer Institute

Note: Incidence and mortality rates are per 100,000 and are age-adjusted to the 1970U.S. standard population. Survival rates are expressed as percents.
§ SEER Program.* NCHS public use tape.- Statistic could not be calculated.
Table I-8AGE-ADJUSTED SEER INCIDENCE AND U.S. MORTALITY RATES AND 5-YEAR RELATIVE SURVIVAL RATES
By Primary Cancer Site, Sex and Time Period
Blacks
Incidence§ US Mortality* Survival§(1992-96) (1992-96) (1989-95)
Site Total Males Females Total Males Females Total Males Females All Sites 455.8 621.9 338.7 221.6 304.9 167.7 47.7 46.5 49.1
Oral Cavity & Pharynx: 13.5 22.5 6.5 4.7 8.4 2.0 33.8 28.4 48.4 Lip 0.1 0.1 0.1 0.0 0.0 0.0 - - - Tongue 2.7 4.5 1.3 1.0 1.7 0.5 29.9 26.8 40.0 Salivary gland 0.9 1.2 0.7 0.2 0.3 0.1 68.2 57.2 77.7 Floor of mouth 1.4 2.4 0.6 0.2 0.3 0.1 36.4 32.5 49.1 Gum & other 2.5 3.9 1.4 0.7 1.2 0.4 37.6 26.9 62.9 oral cavity Nasopharynx 0.7 1.1 0.4 0.3 0.5 0.1 43.0 38.2 52.4 Tonsil 2.0 3.4 0.8 0.4 0.8 0.2 26.4 23.1 34.2 Oropharynx 0.6 1.1 0.2 0.4 0.8 0.2 12.1 16.6 - Hypopharynx 2.0 3.5 0.8 0.3 0.6 0.1 27.0 26.0 31.3 Other oral cavity 0.7 1.2 0.3 1.2 2.2 0.5 18.3 18.3 - & pharynx
Digestive System: 94.8 120.1 76.2 57.2 75.9 44.2 33.4 30.7 36.4 Esophagus 8.4 14.1 4.2 7.4 13.0 3.4 8.9 8.0 10.7 Stomach 11.3 17.2 7.0 8.1 12.1 5.4 21.6 20.6 23.2 Small intestine 2.3 2.8 1.9 0.5 0.6 0.4 46.6 50.3 42.5 Colon & Rectum: 49.9 57.6 44.5 22.9 27.6 19.8 51.7 51.7 51.7 Colon 38.5 43.0 35.5 - - - 51.8 51.5 52.1 Rectum 11.4 14.5 9.0 - - - 51.2 52.0 50.3 Anus, anal canal & 1.2 1.4 1.0 0.2 0.2 0.2 42.6 32.0 54.8 anorectum Liver & Intrahep: 5.0 8.1 2.6 4.8 7.3 2.9 2.8 1.4 7.3 Liver 4.7 7.6 2.4 4.2 6.6 2.5 2.7 1.5 7.4 Intrahep bile duct 0.3 0.5 0.2 0.5 0.7 0.4 2.4 0.0 - Gallbladder 1.0 0.8 1.1 0.7 0.5 0.9 9.6 12.8 7.3 Other biliary 0.9 1.1 0.8 0.4 0.4 0.4 14.7 15.5 14.3 Pancreas 13.8 16.2 12.0 11.8 13.8 10.5 3.6 3.3 3.9 Retroperitoneum 0.5 0.3 0.6 0.1 0.1 0.1 31.8 - 18.3 Peritoneum, omentum & 0.2 0.1 0.3 0.1 0.1 0.1 41.6 - - mesentery Other digestive 0.3 0.4 0.2 0.2 0.3 0.2 0.0 0.0 - system
Respiratory System: 83.0 128.7 49.8 63.2 105.1 34.4 15.2 14.7 16.3 Nose, nasal cavity & 0.7 1.0 0.5 0.2 0.3 0.1 40.4 47.6 33.2 middle ear Larynx 6.6 12.2 2.4 2.8 5.5 0.9 53.3 54.2 50.5 Lung & bronchus 75.0 114.2 46.6 60.0 99.0 33.2 11.3 9.9 14.0 Pleura 0.5 1.0 0.2 0.1 0.1 0.0 7.2 6.1 - Trachea & other 0.2 0.3 0.1 0.2 0.2 0.1 38.7 - - respiratory organs
Bones & joints 0.7 0.9 0.6 0.5 0.6 0.4 70.2 65.9 73.9
Soft tissue (incl heart) 2.5 2.9 2.2 1.6 1.4 1.8 60.0 57.2 63.2
Skin (ex basal & squam): 4.6 8.0 1.7 1.1 1.6 0.7 31.1 20.7 80.6 Melanomas of skin 0.8 1.1 0.6 0.4 0.4 0.3 67.6 58.9 75.2 Other non-epithelial 3.7 6.8 1.1 0.7 1.2 0.3 26.9 18.1 82.4 skin
Breast 58.0 1.4 101.5 18.3 0.5 31.3 70.9 56.3 71.0
SEER Cancer Statistics Review 1973-1996 National Cancer Institute

Note: Incidence and mortality rates are per 100,000 and are age-adjusted to the 1970U.S. standard population. Survival rates are expressed as percents.
§ SEER Program.* NCHS public use tape.- Statistic could not be calculated.
Table I-8 - continuedAGE-ADJUSTED SEER INCIDENCE AND U.S. MORTALITY RATES AND 5-YEAR RELATIVE SURVIVAL RATES
By Primary Cancer Site, Sex and Time Period
Blacks
Incidence§ US Mortality* Survival§(1992-96) (1992-96) (1989-95)
Site Total Males Females Total Males Females Total Males Females Female Genital System: 22.8 - 40.1 11.1 - 18.8 55.5 - 55.5 Cervix uteri 6.3 - 11.2 3.4 - 5.9 58.8 - 58.8 Corpus uteri 8.3 - 14.5 1.7 - 2.8 58.0 - 58.0 Uterus, NOS 0.4 - 0.8 1.8 - 3.0 22.2 - 22.2 Ovary 5.9 - 10.5 3.8 - 6.3 47.2 - 47.2 Vagina 0.6 - 1.0 0.2 - 0.3 42.2 - 42.2 Vulva 0.9 - 1.5 0.2 - 0.3 81.2 - 81.2 Other female 0.4 - 0.7 0.1 - 0.2 59.2 - 59.2 genital system
Male Genital System: 100.7 242.4 - 20.5 55.2 - 83.5 83.5 - Prostate 99.9 240.4 - 20.4 54.8 - 83.6 83.6 - Testis 0.4 0.9 - 0.0 0.1 - 88.1 88.1 - Penis 0.3 0.8 - 0.1 0.2 - 63.5 63.5 - Other male 0.1 0.2 - 0.0 0.0 - - - - genital system
Urinary System: 21.6 32.1 14.0 6.7 9.7 4.8 59.2 60.1 57.8 Urinary bladder 9.8 15.7 5.7 3.1 4.4 2.3 62.2 66.6 54.6 Kidney & renal pelvis 11.0 15.4 7.7 3.5 5.0 2.3 57.7 54.7 62.0 Ureter 0.2 0.2 0.1 0.0 0.1 0.0 - - - Other urinary system 0.6 0.8 0.5 0.1 0.1 0.1 51.0 59.3 41.8
Eye & Orbit 0.2 0.2 0.2 0.0 0.0 0.0 81.6 - -
Brain & Nervous System: 3.7 4.2 3.3 2.4 3.0 2.0 38.6 42.3 34.8 Brain 3.3 3.8 3.0 2.4 2.9 2.0 36.7 41.0 32.0 Cranial nerves & other 0.3 0.3 0.3 0.1 0.1 0.1 55.1 49.0 62.5 nervous system
Endocrine System: 3.8 2.5 4.9 0.7 0.6 0.7 84.8 78.0 87.3 Thyroid 3.1 1.7 4.2 0.3 0.2 0.4 88.7 86.0 89.6 Other endocrine & 0.7 0.8 0.7 0.4 0.4 0.3 68.6 61.5 72.5 thymus
Lymphomas: 14.5 19.4 10.5 5.2 6.8 4.0 48.8 43.5 57.0 Hodgkin's disease 2.4 2.8 2.0 0.5 0.6 0.4 76.2 68.6 84.3 Non-Hodgkin's 12.1 16.6 8.5 4.7 6.1 3.7 41.3 37.6 47.6 lymphomas
Multiple myeloma 9.5 11.2 8.4 6.2 7.4 5.3 30.6 32.9 28.4
Leukemias: 8.3 10.7 6.6 5.9 7.8 4.6 33.5 29.7 37.5 Lymphocytic: 3.4 4.8 2.4 1.8 2.6 1.2 48.5 45.1 52.2 Acute lymphocytic 0.9 1.0 0.8 0.4 0.5 0.4 51.5 48.5 54.6 Chronic lymphocytic 2.4 3.7 1.5 1.3 2.0 0.8 48.4 43.6 53.7 Other lymphocytic 0.1 0.2 0.1 0.1 0.1 0.1 - - - Myeloid: 3.8 4.4 3.4 2.5 3.0 2.1 22.7 16.7 29.0 Acute myeloid 2.2 2.3 2.2 1.6 1.9 1.4 13.3 10.9 15.6 Chronic myeloid 1.4 1.9 1.1 0.8 1.0 0.7 33.1 21.4 47.6 Other myeloid 0.2 0.2 0.2 0.1 0.1 0.0 35.6 - - Monocytic: 0.1 0.1 0.1 0.0 0.1 0.0 - - - Acute monocytic 0.1 0.1 0.1 0.0 0.1 0.0 - - - Chronic monocytic 0.0 0.0 0.0 0.0 0.0 0.0 - - - Other monocytic 0.0 0.0 0.0 0.0 0.0 0.0 - - - Other: 1.0 1.4 0.7 1.6 2.1 1.3 18.3 16.6 18.9 Other acute 0.4 0.6 0.3 0.7 0.9 0.6 11.1 9.0 - Other chronic 0.0 0.0 0.0 0.1 0.1 0.0 - - - Aleukemic, subleuk & 0.5 0.8 0.4 0.9 1.2 0.6 24.1 24.3 22.1 NOS
Ill-defined & 13.4 14.9 12.2 16.1 21.0 12.6 11.2 9.5 12.8 unspecified
SEER Cancer Statistics Review 1973-1996 National Cancer Institute

§ SEER Program. Rates are per 100,000 and are age-adjusted to the 1970 U.S. standard population.
Table I-9
MESOTHELIOMAS (Invasive)
AGE-ADJUSTED CANCER SEER INCIDENCE RATES§, 1975-96
By Race, Sex and Year of Diagnosis
Year of Diagnosis Race/Sex 1975 1976 1977 1978 1979 1980 1981 1982 1983 1984 1985 1986 1987 1988 1989 1990 1991 1992 1993 1994 1995 1996 All Races Males & Females 0.5 0.6 0.5 0.6 0.7 0.8 0.6 0.7 0.9 0.9 0.8 0.8 0.8 0.8 1.0 0.9 0.9 1.0 0.9 0.9 0.9 0.9 Males 0.9 0.9 0.9 1.2 1.2 1.5 1.2 1.2 1.5 1.7 1.4 1.3 1.4 1.5 1.8 1.7 1.7 1.9 1.6 1.7 1.7 1.6 0-54 0.3 0.2 0.3 0.3 0.2 0.3 0.2 0.3 0.2 0.3 0.2 0.1 0.2 0.2 0.2 0.2 0.1 0.2 0.2 0.3 0.1 0.2 55-64 2.7 2.8 1.7 3.9 2.6 4.1 3.5 3.6 3.6 4.2 4.8 3.9 3.1 2.9 3.4 4.4 4.4 4.7 2.7 3.8 2.7 4.3 65-74 3.7 4.2 4.8 6.0 7.9 9.5 6.5 5.7 8.6 8.6 8.4 7.2 8.9 9.3 14.2 8.6 10.1 9.6 11.5 8.7 11.7 7.7 75-84 4.9 6.1 5.5 7.1 9.4 10.4 9.8 7.6 15.6 15.0 9.2 13.5 11.4 14.4 10.9 17.4 16.8 17.8 14.1 18.7 16.4 16.8 85+ 0.0 7.2 1.7 5.0 9.7 6.3 3.1 6.1 6.0 11.8 5.8 7.1 8.3 9.5 14.6 12.9 11.1 25.0 16.0 8.7 13.5 13.0 Females 0.3 0.3 0.3 0.2 0.3 0.3 0.2 0.3 0.4 0.3 0.3 0.4 0.3 0.3 0.3 0.4 0.3 0.3 0.3 0.4 0.4 0.4 0-54 0.1 0.1 0.2 0.1 0.0 0.1 0.1 0.1 0.1 0.0 0.1 0.1 0.2 0.1 0.1 0.1 0.1 0.1 0.0 0.1 0.1 0.1 55-64 0.9 1.2 0.8 0.6 0.9 1.3 0.6 0.8 1.1 0.7 0.8 1.5 0.6 0.4 1.1 1.2 0.8 1.0 0.9 1.5 0.6 1.4 65-74 0.8 0.9 0.9 0.8 1.9 1.3 0.5 2.3 1.9 1.2 1.7 2.0 0.7 1.5 1.9 1.6 1.2 1.4 1.2 1.5 1.6 1.5 75-84 1.5 1.3 0.8 1.8 0.9 1.0 2.5 1.3 2.6 3.3 2.7 1.8 2.7 2.0 1.5 2.6 3.4 2.3 3.7 2.2 3.1 2.3 85+ 1.7 0.0 0.0 0.0 0.0 2.0 0.0 1.3 1.2 1.2 0.6 0.6 3.2 2.1 1.5 1.0 1.9 2.3 1.8 1.3 2.9 2.5 Whites Males & Females 0.5 0.6 0.6 0.7 0.7 0.9 0.7 0.8 0.9 1.0 0.8 0.8 0.8 0.9 1.0 1.0 1.0 1.1 0.9 1.0 1.0 1.0 Males 0.9 1.0 0.9 1.3 1.3 1.7 1.3 1.3 1.6 1.8 1.5 1.5 1.5 1.6 1.9 1.9 1.8 2.1 1.8 1.9 1.8 1.8 Females 0.3 0.3 0.3 0.2 0.2 0.4 0.2 0.4 0.4 0.3 0.3 0.4 0.4 0.3 0.4 0.4 0.4 0.4 0.3 0.4 0.4 0.4 Blacks Males & Females 0.4 0.3 0.2 0.2 0.6 0.3 0.2 0.2 0.8 0.3 0.7 0.4 0.6 0.5 0.6 0.6 0.5 0.6 0.5 0.9 0.6 0.3 Males 0.7 0.3 0.3 0.2 0.8 0.7 0.5 0.6 1.3 0.7 1.4 0.7 0.9 0.9 0.9 1.1 1.1 1.2 1.0 1.4 1.2 0.6 Females 0.2 0.4 0.1 0.3 0.4 0.0 0.0 0.0 0.4 0.0 0.2 0.2 0.3 0.3 0.4 0.3 0.2 0.1 0.3 0.4 0.2 0.1
SEER C
ancer Statistics Review
1973-1996N
ational Cancer Institute

The PC is the Percent Change over the time interval.The EAPC is the Estimated Annual Percent Change over the time interval.
§ SEER Program. Rates are per 100,000 and are age-adjusted to the 1970 U.S.standard population.
* NCHS public use tape. Rates are per 100,000 and are age-adjusted to the 1970 U.S.standard population.
’ The EAPC is significantly different from zero (p<.05).- Statistic could not be calculated.
Table I-10SEER INCIDENCE AND U.S. MORTALITY TRENDS BY PRIMARY CANCER SITE AND SEX
All Races, 1973-96
Incidence§ US Mortality*
Total Males Females Total Males FemalesSite PC EAPC PC EAPC PC EAPC PC EAPC PC EAPC PC EAPC All Sites 20.0 1.1’ 24.6 1.4’ 13.7 0.8’ 3.3 0.2’ 1.1 0.1’ 6.4 0.4’ Oral Cavity & Pharynx: -11.0 -0.5’ -15.5 -0.7’ -3.6 -0.3’ -28.4 -1.6’ -32.2 -1.8’ -21.8 -1.2’ Lip -53.8 -3.4’ -58.6 -3.9’ -8.8 -0.2 -67.8 -5.2’ -71.2 -5.8’ -39.2 -2.1’ Tongue 5.9 0.5’ 6.4 0.4’ 1.0 0.3 -31.4 -1.7’ -35.8 -2.0’ -23.4 -1.2’ Salivary gland 26.6 0.6’ 35.9 1.1’ 18.7 0.1 -30.2 -1.5’ -24.9 -1.2’ -37.0 -1.8’ Floor of mouth -29.4 -1.8’ -29.7 -1.8’ -30.3 -2.0’ -66.9 -5.0’ -70.1 -5.5’ -57.9 -3.8’ Gum & other -6.0 0.0 -8.6 0.0 -4.1 -0.3 -23.7 -1.6’ -28.7 -2.0’ -18.0 -1.1’ oral cavity Nasopharynx 10.3 0.3 5.3 0.2 19.1 0.3 -18.1 -0.9’ -20.5 -1.1’ -14.1 -0.7’ Tonsil -4.6 -0.1 10.8 0.4’ -36.3 -1.5’ -40.6 -2.6’ -42.3 -2.7’ -40.8 -2.8’ Oropharynx 8.8 0.2 -1.9 0.1 35.2 0.4 44.7 1.4’ 30.4 1.2’ 79.1 1.9’ Hypopharynx -3.0 -0.3 -11.3 -0.4 23.4 -0.3 -45.6 -3.0’ -46.7 -3.1’ -44.8 -2.6’ Other oral cavity 40.9 0.8 57.8 1.0 11.3 0.5 -14.0 -0.5’ -18.0 -0.6’ -6.1 -0.3 & pharynx Digestive System: -8.3 -0.3’ -7.2 -0.2 -10.7 -0.5’ -15.9 -0.8’ -13.6 -0.7’ -19.6 -1.0’ Esophagus 9.2 0.5’ 12.1 0.7’ -2.7 -0.1 20.0 0.8’ 24.4 0.9’ 3.8 0.1 Stomach -34.5 -1.6’ -33.5 -1.5’ -36.8 -1.8’ -41.0 -2.3’ -41.2 -2.2’ -41.3 -2.4’ Small intestine 57.8 2.6’ 68.8 2.9’ 46.5 2.1’ 10.8 0.6’ 16.4 0.8’ 4.1 0.3’ Colon & Rectum: -9.1 -0.4’ -7.1 -0.2 -12.0 -0.7’ -22.6 -1.2’ -17.9 -0.9’ -27.6 -1.5’ Colon -5.1 -0.2 -1.5 0.1 -9.5 -0.5’ - - - - - - Rectum -17.6 -0.9’ -17.5 -0.8’ -18.6 -1.1’ - - - - - - Anus, anal canal & 71.1 2.1’ 107.9 2.7’ 46.1 1.7’ 419.7 8.5’ 402.2 8.4’ 414.7 8.6’ anorectum Liver & Intrahep: 77.5 2.9’ 86.2 3.1’ 57.4 2.4’ 50.8 2.1’ 59.5 2.3’ 36.6 1.6’ Liver 59.8 2.2’ 72.9 2.5’ 31.3 1.4’ 26.7 1.2’ 38.6 1.7’ 6.8 0.4 Intrahep bile duct 339.4 9.1’ 309.4 9.6’ 368.9 8.9’ 712.7 9.7’ 734.0 9.7’ 698.6 9.8’ Gallbladder -37.7 -2.0’ -23.6 -1.9’ -43.5 -2.1’ -45.4 -2.7’ -41.4 -2.4’ -46.1 -2.8’ Other biliary -17.5 -0.8’ -4.2 -0.7’ -26.6 -0.8’ -41.1 -2.5’ -39.4 -2.4’ -42.0 -2.6’ Pancreas -11.5 -0.4’ -18.6 -0.9’ -4.2 0.1 -3.4 -0.2’ -12.8 -0.6’ 7.1 0.3’ Retroperitoneum -21.6 -0.6 -27.2 -1.0 -13.0 -0.3 -60.9 -4.7’ -63.1 -5.0’ -57.7 -4.3’ Peritoneum, omentum & 161.9 5.0’ 4.7 1.4’ 310.3 7.1’ -1.3 -0.3 -41.6 -2.2’ 25.4 0.7 mesentery Other digestive 5.7 -0.6 14.2 -0.1 2.4 -1.2’ -55.7 -4.2’ -53.8 -4.0’ -58.4 -4.5’ system Respiratory System: 23.4 1.0’ -3.5 -0.1 110.4 3.5’ 35.2 1.5’ 6.9 0.4’ 139.9 4.1’ Nose, nasal cavity & -15.8 -0.2 -18.1 -0.4 -15.5 0.1 -46.6 -2.7’ -49.2 -3.0’ -42.7 -2.1’ middle ear Larynx -16.2 -0.7’ -20.3 -1.0’ 4.0 0.6 -10.4 -0.5’ -18.3 -0.9’ 37.3 1.3’ Lung & bronchus 27.8 1.2’ -2.5 -0.1 123.0 3.7’ 38.6 1.6’ 8.9 0.5’ 148.3 4.3’ Pleura 80.8 3.0’ 105.6 3.4’ 40.1 2.1’ 4.7 0.3 23.3 1.0’ -29.0 -1.4’ Trachea & other -14.3 -0.8’ -17.8 -1.0 -14.7 -0.7 -67.0 -4.7’ -70.5 -5.3’ -60.5 -3.9’ respiratory organs Bones & joints 7.6 0.4 8.6 0.4 6.0 0.3 -49.4 -3.1’ -51.0 -3.3’ -48.4 -2.9’ Soft tissue (incl heart) 20.8 0.8’ 17.0 0.7’ 24.3 0.9’ 63.5 2.4’ 53.1 2.1’ 75.1 2.6’ Skin (ex basal & squam): 163.1 4.8’ 221.2 6.1’ 107.2 3.1’ 25.4 1.1’ 37.4 1.7’ 8.4 0.2’ Melanomas of skin 134.6 3.7’ 170.6 4.4’ 103.7 2.9’ 35.8 1.3’ 50.1 1.8’ 18.6 0.6’ Other non-epithelial 473.5 11.3’ 728.6 13.7’ 146.7 4.5’ -1.8 0.5 8.6 1.2’ -22.5 -1.1’ skin Breast 24.8 1.5’ 3.5 0.8’ 25.3 1.5’ -7.3 -0.1 -15.0 -0.6’ -7.5 -0.1
SEER Cancer Statistics Review 1973-1996 National Cancer Institute

The PC is the Percent Change over the time interval.The EAPC is the Estimated Annual Percent Change over the time interval.
§ SEER Program. Rates are per 100,000 and are age-adjusted to the 1970 U.S.standard population.
* NCHS public use tape. Rates are per 100,000 and are age-adjusted to the 1970 U.S.standard population.
’ The EAPC is significantly different from zero (p<.05).- Statistic could not be calculated.
Table I-10 - continuedSEER INCIDENCE AND U.S. MORTALITY TRENDS BY PRIMARY CANCER SITE AND SEX
All Races, 1973-96
Incidence§ US Mortality*
Total Males Females Total Males FemalesSite PC EAPC PC EAPC PC EAPC PC EAPC PC EAPC PC EAPC Female Genital System: -22.9 -1.1’ - - -23.3 -1.1’ -24.7 -1.2’ - - -25.2 -1.2’ Cervix uteri -44.8 -2.3’ - - -44.0 -2.2’ -48.1 -2.7’ - - -47.3 -2.6’ Corpus uteri -26.4 -1.6’ - - -27.4 -1.7’ -5.4 -0.6’ - - -5.8 -0.6’ Uterus, NOS -27.8 -2.2’ - - -26.4 -2.1’ -40.1 -2.2’ - - -40.5 -2.3’ Ovary -0.7 0.4’ - - -0.7 0.4’ -9.9 -0.4’ - - -11.2 -0.4’ Vagina -15.6 -1.0’ - - -15.6 -0.9’ -30.4 -1.6’ - - -30.9 -1.7’ Vulva 10.5 0.3 - - 11.9 0.4 -17.3 -0.9’ - - -18.3 -0.9’ Other female -3.7 -0.4 - - -5.3 -0.4 -22.5 -0.8’ - - -24.1 -1.0’ genital system Male Genital System: 119.6 4.5’ 106.7 4.2’ - - 6.4 0.6’ 9.7 0.7’ - - Prostate 126.4 4.7’ 111.9 4.4’ - - 10.1 0.8’ 13.0 0.9’ - - Testis 43.6 1.9’ 41.5 1.8’ - - -69.5 -5.2’ -70.0 -5.3’ - - Penis -40.0 -1.8’ -39.9 -1.8’ - - -33.1 -2.1’ -34.7 -2.2’ - - Other male 48.5 1.5’ 48.3 1.5’ - - -61.3 -3.9’ -61.2 -4.0’ - - genital system Urinary System: 17.7 0.9’ 14.4 0.8’ 25.1 1.1’ -6.7 -0.3’ -8.7 -0.5’ -1.7 -0.1 Urinary bladder 7.7 0.5’ 6.1 0.4’ 12.6 0.4’ -24.0 -1.4’ -23.7 -1.4’ -21.7 -1.2’ Kidney & renal pelvis 44.2 2.0’ 39.8 1.8’ 50.8 2.3’ 18.5 0.9’ 16.8 0.8’ 22.0 1.0’ Ureter -18.6 -1.2’ -10.6 -1.1’ -33.1 -1.3’ -8.2 -0.6’ -4.5 -0.5 -12.8 -0.7’ Other urinary system 18.9 -0.4 31.9 0.0 -0.1 -1.1 -41.0 -2.4’ -38.6 -2.5’ -41.5 -2.2’ Eye & Orbit -16.9 -0.8’ -17.4 -0.6’ -14.5 -1.0’ -43.3 -2.8’ -42.9 -2.6’ -43.7 -2.9’ Brain & Nervous System: 15.8 0.8’ 18.9 0.8’ 12.5 0.7’ 11.1 0.5’ 10.4 0.5’ 12.2 0.5’ Brain 16.3 0.7’ 18.3 0.8’ 14.6 0.7’ 35.8 1.5’ 35.7 1.5’ 36.2 1.5’ Cranial nerves & other 8.0 0.9’ 28.9 1.0’ -13.4 1.0 -87.6 -9.7’ -88.5 -10.0’ -86.4 -9.5’ nervous system Endocrine System: 42.2 1.4’ 25.6 0.9’ 51.2 1.6’ -14.2 -0.7’ -2.5 -0.3’ -22.0 -1.0’ Thyroid 42.1 1.4’ 27.1 0.9’ 49.8 1.6’ -21.6 -1.2’ 0.5 -0.4 -32.3 -1.8’ Other endocrine & 42.9 1.6’ 19.5 1.1’ 73.1 2.1’ -4.1 -0.1 -5.2 -0.1 -3.0 0.1 thymus Lymphomas: 54.9 2.4’ 62.1 2.6’ 45.1 2.0’ 21.5 1.2’ 21.3 1.2’ 22.4 1.2’ Hodgkin's disease -17.4 -0.3 -23.0 -0.8’ -9.3 0.3 -64.3 -4.2’ -66.7 -4.4’ -60.7 -4.0’ Non-Hodgkin's 81.3 3.0’ 94.9 3.5’ 63.2 2.4’ 44.5 1.9’ 46.2 2.0’ 42.7 1.8’ lymphomas Multiple myeloma 13.7 0.8’ 19.4 0.9’ 6.9 0.6’ 36.0 1.3’ 35.8 1.3’ 37.4 1.4’ Leukemias: -5.3 -0.2 -7.6 -0.2 -3.5 -0.1 -6.2 -0.3’ -5.1 -0.3’ -7.1 -0.3’ Lymphocytic: -8.7 -0.1 -13.6 -0.2 -3.8 -0.1 -13.8 -0.5’ -13.1 -0.5’ -14.2 -0.6’ Acute lymphocytic 23.9 1.3’ 13.5 1.2’ 37.6 1.5’ -31.6 -1.5’ -35.7 -1.6’ -25.8 -1.3’ Chronic lymphocytic -17.7 -0.5’ -19.1 -0.6’ -17.6 -0.6’ 15.1 0.7’ 17.2 0.7’ 12.0 0.6’ Other lymphocytic -49.9 -3.2’ -58.6 -2.8’ -41.1 -4.3’ -69.7 -5.2’ -69.2 -5.2’ -70.9 -5.4’ Myeloid: -0.9 -0.2 -1.0 -0.3’ -1.3 -0.2 -6.9 -0.7’ -6.0 -0.6’ -7.9 -0.7’ Acute myeloid 10.3 0.2 9.9 0.1 12.1 0.2 3.1 -0.4’ 4.1 -0.3 2.4 -0.5’ Chronic myeloid -12.2 -0.2 -6.5 -0.2 -21.1 -0.4 -12.2 -0.5’ -11.3 -0.5’ -13.8 -0.4’ Other myeloid -30.2 -3.5’ -45.7 -4.3’ -13.6 -2.8’ -69.3 -5.5’ -66.5 -5.4’ -71.8 -5.7’ Monocytic: -24.6 -1.3’ -18.3 -1.5’ -34.6 -1.2 -72.2 -5.5’ -71.8 -5.6’ -72.8 -5.3’ Acute monocytic 6.2 0.3 18.3 0.1 -10.8 0.3 -68.7 -4.7’ -67.2 -4.7’ -70.5 -4.9’ Chronic monocytic -68.3 -3.4 -67.8 - -75.1 - -40.7 -1.7’ -41.1 -2.0’ -35.7 -1.0 Other monocytic -93.3 - -89.8 - -97.1 - -87.9 -9.9’ -88.7 -10.7’ -87.6 -8.9’ Other: -2.9 0.1 -2.0 0.1 -2.7 0.1 17.6 1.0’ 20.7 1.0’ 14.8 1.1’ Other acute -25.9 -0.1 -29.6 0.0 -15.1 0.1 7.6 0.8’ 9.1 0.8’ 7.4 1.0’ Other chronic -57.0 -2.7’ -60.3 -3.1 -46.2 -2.7 -22.4 -0.8’ -13.6 -0.4 -30.5 -1.1’ Aleukemic, subleuk & 19.0 0.3 22.8 0.2 9.9 0.3 38.1 1.4’ 41.6 1.4’ 32.5 1.5’ NOS Ill-defined & -9.8 -0.4’ -10.9 -0.4’ -8.1 -0.4’ 14.9 0.7’ 21.9 1.0’ 7.6 0.4’ unspecified
SEER Cancer Statistics Review 1973-1996 National Cancer Institute

The PC is the Percent Change over the time interval.The EAPC is the Estimated Annual Percent Change over the time interval.
§ SEER Program. Rates are per 100,000 and are age-adjusted to the 1970 U.S.standard population.
* NCHS public use tape. Rates are per 100,000 and are age-adjusted to the 1970 U.S.standard population.
’ The EAPC is significantly different from zero (p<.05).- Statistic could not be calculated.
Table I-11SEER INCIDENCE AND U.S. MORTALITY TRENDS BY PRIMARY CANCER SITE AND SEX
Whites, 1973-96
Incidence§ US Mortality*
Total Males Females Total Males FemalesSite PC EAPC PC EAPC PC EAPC PC EAPC PC EAPC PC EAPC All Sites 19.9 1.1’ 22.5 1.3’ 15.1 0.8’ 3.1 0.2’ 0.2 0.1 6.6 0.4’ Oral Cavity & Pharynx: -13.4 -0.6’ -19.6 -0.9’ -3.3 -0.3 -31.9 -1.8’ -36.7 -2.1’ -23.5 -1.3’ Lip -51.4 -3.2’ -56.7 -3.7’ -6.4 -0.2 -67.6 -5.1’ -71.5 -5.8’ -29.7 -1.8’ Tongue 7.4 0.5’ 7.9 0.4’ 0.8 0.5 -32.7 -1.8’ -37.6 -2.2’ -24.7 -1.4’ Salivary gland 33.3 0.7’ 43.5 1.2’ 25.0 0.3 -30.0 -1.4’ -24.0 -1.1’ -38.2 -1.8’ Floor of mouth -28.9 -1.8’ -27.7 -1.8’ -33.9 -2.0’ -67.8 -5.0’ -71.6 -5.6’ -57.7 -3.6’ Gum & other -7.0 0.0 -15.1 -0.2 2.4 -0.1 -25.1 -1.6’ -31.6 -2.1’ -17.8 -1.1’ oral cavity Nasopharynx -20.0 -1.1’ -28.1 -1.3’ -5.1 -0.7 -27.8 -1.6’ -32.7 -1.9’ -17.7 -0.9’ Tonsil -8.6 -0.1 1.2 0.2 -33.1 -1.3’ -43.6 -2.9’ -46.5 -3.1’ -41.5 -2.8’ Oropharynx 0.8 -0.1 -10.8 0.0 26.6 -0.1 27.2 1.0’ 11.6 0.6’ 64.2 1.7’ Hypopharynx -12.0 -0.7 -22.5 -0.9’ 15.8 -0.4 -47.8 -3.1’ -50.1 -3.3’ -42.1 -2.6’ Other oral cavity 45.5 0.8 54.6 0.7 29.4 0.7 -21.0 -0.9’ -25.9 -1.1’ -11.4 -0.6’ & pharynx Digestive System: -10.7 -0.4’ -10.0 -0.3’ -12.9 -0.6’ -17.7 -0.9’ -15.0 -0.7’ -21.9 -1.2’ Esophagus 16.5 0.9’ 19.7 1.2’ -0.2 0.0 32.2 1.2’ 37.3 1.4’ 9.8 0.2’ Stomach -38.7 -2.0’ -36.8 -1.8’ -43.3 -2.3’ -44.0 -2.5’ -43.7 -2.4’ -45.5 -2.7’ Small intestine 50.1 2.4’ 55.2 2.6’ 44.2 2.0’ 10.3 0.4’ 15.0 0.7’ 4.3 0.2 Colon & Rectum: -11.1 -0.5’ -9.8 -0.3 -13.7 -0.8’ -24.9 -1.3’ -20.4 -1.0’ -30.0 -1.7’ Colon -7.3 -0.3 -3.9 0.0 -11.9 -0.7’ - - - - - - Rectum -19.3 -1.0’ -20.8 -0.9’ -18.4 -1.1’ - - - - - - Anus, anal canal & 70.6 2.2’ 104.5 2.5’ 48.1 1.9’ 427.1 8.5’ 363.8 8.2’ 461.6 8.7’ anorectum Liver & Intrahep: 59.7 2.5’ 72.0 2.8’ 36.8 1.9’ 48.2 2.0’ 57.8 2.3’ 32.3 1.4’ Liver 37.8 1.6’ 55.3 2.0’ 6.7 0.6’ 22.0 1.1’ 35.0 1.6’ 0.9 0.1 Intrahep bile duct 363.9 9.2’ 315.7 9.6’ 406.6 9.0’ 731.2 9.8’ 768.6 9.8’ 697.3 9.8’ Gallbladder -41.8 -2.3’ -32.7 -2.4’ -45.5 -2.2’ -47.9 -2.9’ -44.2 -2.6’ -48.3 -3.0’ Other biliary -17.9 -0.9’ -3.7 -0.8’ -27.9 -0.9’ -41.9 -2.6’ -39.9 -2.4’ -43.0 -2.7’ Pancreas -12.6 -0.5’ -20.4 -1.0’ -4.8 0.0 -4.4 -0.2’ -13.7 -0.7’ 5.9 0.3’ Retroperitoneum -20.6 -0.6 -18.1 -0.8 -19.3 -0.4 -60.8 -4.7’ -62.9 -5.0’ -57.8 -4.4’ Peritoneum, omentum & 175.4 5.1’ 12.9 1.5’ 321.5 7.3’ 1.4 -0.1 -41.1 -2.0’ 30.3 1.0 mesentery Other digestive 8.3 -0.5 18.8 0.0 2.6 -1.1 -53.4 -4.1’ -50.9 -3.9’ -57.0 -4.4’ system Respiratory System: 25.6 1.1’ -4.9 -0.2 121.1 3.7’ 36.2 1.5’ 5.9 0.3’ 144.4 4.2’ Nose, nasal cavity & -15.6 -0.3 -17.1 -0.6 -16.6 -0.1 -46.2 -2.7’ -48.4 -3.2’ -43.2 -2.1’ middle ear Larynx -15.8 -0.7’ -21.3 -1.0’ 7.1 0.6 -14.9 -0.7’ -23.4 -1.2’ 34.3 1.2’ Lung & bronchus 30.1 1.3’ -4.0 -0.1 134.5 3.9’ 39.8 1.6’ 8.0 0.4’ 152.9 4.4’ Pleura 87.3 3.2’ 106.3 3.6’ 53.8 2.2’ 10.7 0.4’ 27.7 1.1’ -23.2 -1.2’ Trachea & other -17.8 -0.9’ -19.9 -1.2’ -19.7 -0.7 -67.7 -4.9’ -71.4 -5.4’ -60.8 -4.0’ respiratory organs Bones & joints 11.2 0.4’ 13.3 0.4 7.8 0.4 -49.8 -3.1’ -51.4 -3.3’ -49.0 -2.9’ Soft tissue (incl heart) 19.0 0.8’ 16.4 0.6’ 20.6 0.8’ 61.0 2.3’ 52.8 2.1’ 70.3 2.5’ Skin (ex basal & squam): 170.7 4.9’ 223.4 6.2’ 119.4 3.3’ 29.0 1.2’ 40.1 1.7’ 12.1 0.3’ Melanomas of skin 145.7 3.9’ 179.5 4.6’ 116.4 3.2’ 40.2 1.4’ 54.3 2.0’ 22.5 0.7’ Other non-epithelial 476.4 11.9’ 706.5 14.1’ 158.1 4.8’ -2.4 0.4 6.4 1.0’ -21.6 -1.2’ skin Breast 24.4 1.5’ 1.9 0.8’ 26.2 1.6’ -9.7 -0.3’ -18.4 -0.8’ -9.5 -0.2’
SEER Cancer Statistics Review 1973-1996 National Cancer Institute

The PC is the Percent Change over the time interval.The EAPC is the Estimated Annual Percent Change over the time interval.
§ SEER Program. Rates are per 100,000 and are age-adjusted to the 1970 U.S.standard population.
* NCHS public use tape. Rates are per 100,000 and are age-adjusted to the 1970 U.S.standard population.
’ The EAPC is significantly different from zero (p<.05).- Statistic could not be calculated.
Table I-11 - continuedSEER INCIDENCE AND U.S. MORTALITY TRENDS BY PRIMARY CANCER SITE AND SEX
Whites, 1973-96
Incidence§ US Mortality*
Total Males Females Total Males FemalesSite PC EAPC PC EAPC PC EAPC PC EAPC PC EAPC PC EAPC Female Genital System: -22.6 -1.1’ - - -22.2 -1.1’ -23.1 -1.1’ - - -23.1 -1.1’ Cervix uteri -46.1 -2.2’ - - -44.5 -2.1’ -47.1 -2.7’ - - -45.7 -2.5’ Corpus uteri -27.6 -1.7’ - - -27.7 -1.7’ -6.2 -0.7’ - - -6.0 -0.7’ Uterus, NOS -37.8 -3.0’ - - -36.1 -2.9’ -41.0 -2.3’ - - -40.9 -2.3’ Ovary 1.1 0.4’ - - 2.2 0.5’ -9.3 -0.4’ - - -10.0 -0.4’ Vagina -10.5 -1.0’ - - -9.3 -0.9’ -32.7 -1.7’ - - -32.6 -1.7’ Vulva 15.6 0.5 - - 18.7 0.6 -13.3 -0.8’ - - -13.4 -0.8’ Other female -0.3 -0.1 - - -1.4 -0.1 -18.2 -0.6’ - - -19.4 -0.6’ genital system Male Genital System: 116.5 4.5’ 99.4 4.1’ - - 4.5 0.6’ 7.1 0.7’ - - Prostate 123.1 4.7’ 104.2 4.3’ - - 8.5 0.7’ 10.6 0.8’ - - Testis 54.5 2.2’ 51.2 2.1’ - - -69.0 -5.1’ -69.6 -5.2’ - - Penis -39.8 -1.6’ -40.9 -1.7’ - - -23.2 -1.5’ -26.2 -1.6’ - - Other male 24.6 1.1’ 23.4 1.0’ - - -55.1 -3.6’ -54.9 -3.7’ - - genital system Urinary System: 19.2 1.0’ 15.0 0.8’ 26.7 1.2’ -6.2 -0.3’ -8.6 -0.5’ -1.2 -0.1 Urinary bladder 10.9 0.6’ 8.0 0.5’ 16.8 0.6’ -22.6 -1.3’ -22.7 -1.3’ -20.4 -1.1’ Kidney & renal pelvis 43.0 2.0’ 38.3 1.7’ 48.3 2.3’ 17.3 0.8’ 15.2 0.7’ 20.6 0.9’ Ureter -15.4 -1.1’ -10.5 -1.1’ -25.9 -1.1’ -8.2 -0.6’ -6.2 -0.5’ -11.0 -0.6’ Other urinary system 4.9 -0.8 12.5 -0.4 -8.1 -1.5 -42.0 -2.5’ -31.2 -2.1’ -48.9 -2.8’ Eye & Orbit -16.0 -0.8’ -15.4 -0.5 -15.2 -1.0’ -42.0 -2.6’ -40.7 -2.5’ -43.5 -2.9’ Brain & Nervous System: 17.2 0.8’ 19.3 0.8’ 14.4 0.8’ 13.2 0.6’ 12.2 0.6’ 14.3 0.6’ Brain 17.8 0.8’ 18.6 0.8’ 16.8 0.8’ 38.3 1.6’ 37.8 1.6’ 38.8 1.6’ Cranial nerves & other 8.5 0.8 31.5 0.8 -16.4 0.8 -88.2 -9.9’ -89.3 -10.2’ -86.6 -9.5’ nervous system Endocrine System: 50.1 1.6’ 35.2 1.3’ 59.0 1.8’ -14.2 -0.8’ -1.6 -0.3’ -22.3 -1.1’ Thyroid 51.7 1.7’ 40.6 1.4’ 58.7 1.8’ -20.0 -1.3’ 5.6 -0.3 -32.4 -1.9’ Other endocrine & 36.2 1.3’ 13.6 0.8 64.6 1.8’ -6.5 -0.2 -8.0 -0.2 -4.6 -0.1 thymus Lymphomas: 54.7 2.4’ 60.5 2.7’ 45.9 2.0’ 21.9 1.2’ 21.6 1.2’ 22.6 1.2’ Hodgkin's disease -15.3 -0.2 -22.1 -0.6’ -5.7 0.3 -65.0 -4.3’ -67.6 -4.5’ -61.3 -4.0’ Non-Hodgkin's 80.8 3.0’ 92.9 3.5’ 63.4 2.4’ 45.3 2.0’ 46.9 2.1’ 43.3 1.9’ lymphomas Multiple myeloma 14.3 0.7’ 23.0 1.0’ 3.5 0.4’ 34.2 1.3’ 36.0 1.3’ 33.2 1.3’ Leukemias: -4.9 -0.1 -8.7 -0.3 -1.4 -0.1 -6.7 -0.3’ -5.6 -0.3’ -8.1 -0.3’ Lymphocytic: -8.3 -0.1 -14.7 -0.2 -1.5 0.0 -15.1 -0.6’ -14.2 -0.5’ -16.0 -0.6’ Acute lymphocytic 26.6 1.4’ 13.8 1.2’ 43.4 1.5’ -33.9 -1.6’ -36.8 -1.7’ -30.5 -1.4’ Chronic lymphocytic -18.2 -0.5’ -20.9 -0.6’ -16.5 -0.6’ 15.2 0.7’ 16.5 0.7’ 13.0 0.7’ Other lymphocytic -49.0 -3.2’ -57.7 -2.9’ -40.7 -4.1’ -69.6 -5.2’ -69.4 -5.2’ -70.6 -5.4’ Myeloid: -1.0 -0.2 -1.7 -0.3’ -1.3 -0.2 -7.2 -0.7’ -6.2 -0.7’ -8.7 -0.7’ Acute myeloid 10.8 0.1 7.7 0.1 15.3 0.2 2.9 -0.4’ 4.3 -0.4 1.1 -0.5’ Chronic myeloid -13.2 -0.3 -5.6 -0.1 -26.1 -0.5 -13.1 -0.5’ -12.8 -0.6’ -14.1 -0.4’ Other myeloid -29.8 -3.7’ -44.9 -4.6’ -14.3 -2.9’ -68.8 -5.5’ -65.7 -5.4’ -71.8 -5.7’ Monocytic: -20.0 -1.2’ -12.0 -1.5’ -32.7 -1.0 -71.6 -5.4’ -70.9 -5.5’ -72.6 -5.2’ Acute monocytic 17.5 0.5 31.2 0.3 -3.6 0.6 -67.9 -4.6’ -66.4 -4.6’ -69.9 -4.7’ Chronic monocytic -73.7 -3.8’ -75.8 - -74.5 - -34.7 -1.6’ -34.1 -1.7’ -30.7 -1.0 Other monocytic -92.7 - -88.5 - -97.0 - -87.4 -9.8’ -87.8 -10.5’ -88.1 -9.0’ Other: -1.8 0.0 -5.6 -0.1 7.1 0.2 18.0 1.0’ 21.0 1.0’ 14.5 1.1’ Other acute -24.1 -0.1 -32.7 -0.1 -2.9 0.2 8.5 0.9’ 9.4 0.8’ 8.6 1.0’ Other chronic -64.1 -3.1’ -67.1 -3.2 -54.4 -3.7’ -25.1 -0.8’ -14.4 -0.5 -35.7 -1.1 Aleukemic, subleuk & 20.0 0.2 19.4 0.1 18.7 0.3 38.5 1.4’ 42.8 1.4’ 30.8 1.5’ NOS Ill-defined & -11.2 -0.4’ -10.4 -0.4’ -11.7 -0.5’ 17.1 0.8’ 23.6 1.0’ 10.1 0.5’ unspecified
SEER Cancer Statistics Review 1973-1996 National Cancer Institute

The PC is the Percent Change over the time interval.The EAPC is the Estimated Annual Percent Change over the time interval.
§ SEER Program. Rates are per 100,000 and are age-adjusted to the 1970 U.S.standard population.
* NCHS public use tape. Rates are per 100,000 and are age-adjusted to the 1970 U.S.standard population.
’ The EAPC is significantly different from zero (p<.05).- Statistic could not be calculated.
Table I-12SEER INCIDENCE AND U.S. MORTALITY TRENDS BY PRIMARY CANCER SITE AND SEX
Blacks, 1973-96
Incidence§ US Mortality*
Total Males Females Total Males FemalesSite PC EAPC PC EAPC PC EAPC PC EAPC PC EAPC PC EAPC All Sites 24.3 1.3’ 33.3 1.6’ 16.8 0.9’ 10.8 0.6’ 14.8 0.8’ 11.2 0.7’ Oral Cavity & Pharynx: 18.3 0.5 29.1 0.9’ 3.2 -0.4 -6.4 -0.5 -1.7 -0.3 -10.9 -0.6’ Lip -53.2 - -53.6 - -43.5 - -65.8 - -45.1 - -80.6 - Tongue 0.6 0.3 -5.3 0.6 18.7 -0.5 -21.5 -0.8’ -19.8 -0.8’ -19.0 -0.4 Salivary gland -16.0 0.6 -11.5 1.7 -20.1 0.1 -31.4 -2.0’ -35.1 -1.8’ -20.5 -1.6’ Floor of mouth 1.2 -0.6 -13.9 -0.6 79.0 -0.2 -59.6 -4.5’ -60.9 -4.6’ -49.3 -4.0’ Gum & other 1.5 0.0 18.1 0.8 -20.1 -0.8 -13.6 -0.9’ -9.2 -0.8 -18.9 -0.7 oral cavity Nasopharynx 107.5 0.8 126.9 2.1’ 97.0 -0.9 -3.0 -0.5 11.1 0.0 -25.0 -1.2 Tonsil 44.4 0.7 102.8 1.8’ -33.1 -1.8 -23.4 -1.5’ -17.0 -1.2’ -35.1 -2.3’ Oropharynx 164.5 3.1’ 130.3 2.1 - - 171.3 3.6’ 182.7 3.8’ 176.1 3.9’ Hypopharynx 66.9 1.5 67.6 1.9’ 94.1 -0.1 -27.6 -2.1’ -16.2 -1.7’ -55.7 -3.2’ Other oral cavity 62.1 2.7’ 147.2 3.3’ -58.5 - 37.9 1.5’ 41.2 1.7’ 46.5 1.3’ & pharynx Digestive System: 1.8 0.2 0.8 0.3 4.6 0.2 -3.6 -0.1 -2.2 0.0 -2.7 0.0 Esophagus -21.7 -1.0’ -18.2 -0.9’ -21.8 -0.4 -15.5 -0.8’ -12.1 -0.7’ -16.0 -0.5’ Stomach -30.8 -1.3’ -32.0 -1.2’ -25.8 -1.3’ -33.6 -1.6’ -33.2 -1.6’ -30.6 -1.5’ Small intestine 127.5 4.9’ 107.8 5.4’ 148.0 4.5’ 18.9 1.7’ 38.6 2.3’ 1.4 1.4’ Colon & Rectum: 12.5 0.6’ 17.7 0.9’ 8.6 0.3 8.1 0.4’ 20.3 0.9’ -0.9 0.0 Colon 19.3 0.8’ 18.1 1.0’ 21.0 0.6’ - - - - - - Rectum -5.3 0.0 16.4 0.6 -22.6 -0.6 - - - - - - Anus, anal canal & 84.7 2.8’ 151.2 4.3’ 45.1 1.6 384.4 9.3’ 1219.8 - 203.0 - anorectum Liver & Intrahep: 55.4 2.1’ 43.0 2.3’ 87.3 1.7’ 30.5 1.2’ 33.2 1.2’ 32.4 1.4’ Liver 53.2 1.9’ 42.3 2.2’ 78.5 1.4 18.5 0.7’ 24.3 0.8’ 14.5 0.7’ Intrahep bile duct 96.5 - 55.3 - 284.4 - 478.9 8.2’ 384.1 7.5’ 678.3 9.8’ Gallbladder -3.4 -0.3 18.4 -0.6 -9.1 0.1 -11.6 -0.5’ -2.6 -0.5 -16.5 -0.6 Other biliary 64.1 1.2 32.7 0.5 202.3 - -35.2 -2.0’ -37.7 -2.3’ -33.6 -1.8’ Pancreas -4.3 -0.1 -7.0 -0.4 -1.8 0.2 9.8 0.6’ -0.4 0.1 22.2 1.1’ Retroperitoneum -36.2 -1.2 -71.2 -1.8 12.8 -0.7 -57.5 -4.1’ -62.0 -4.6’ -50.3 -3.7’ Peritoneum, omentum & 85.6 - -32.1 - 222.1 - -10.6 -1.8’ -26.9 -3.7’ -5.7 -1.2 mesentery Other digestive -10.6 -1.2 -11.4 - -1.6 - -67.1 -4.7’ -63.9 -4.3’ -69.6 -5.1’ system Respiratory System: 18.0 1.1’ 3.6 0.3 96.1 3.6’ 38.6 1.6’ 23.2 1.1’ 131.8 4.1’ Nose, nasal cavity & -21.0 -0.2 -22.2 -1.1 -7.6 - -47.6 -2.1’ -56.3 -2.2’ -22.4 -1.6’ middle ear Larynx -7.8 0.2 -5.8 0.2 1.3 1.3 21.9 1.1’ 20.5 1.0’ 69.3 2.3’ Lung & bronchus 21.5 1.2’ 4.8 0.4 110.6 3.8’ 41.3 1.7’ 24.6 1.1’ 140.4 4.2’ Pleura -4.4 2.6 65.0 4.4’ -56.2 - -41.4 -1.8’ -14.2 -0.2 -68.0 -4.4’ Trachea & other 15.8 -0.8 -14.6 -1.2 158.4 - -57.7 -3.3’ -59.0 -3.5’ -54.4 -3.0’ respiratory organs Bones & joints 5.7 0.6 22.2 1.3 -13.7 -0.1 -43.4 -2.8’ -44.2 -2.9’ -41.9 -2.5’ Soft tissue (incl heart) 49.5 1.4’ 66.4 1.8’ 37.7 1.1 90.7 3.1’ 56.0 2.3’ 119.6 3.6’ Skin (ex basal & squam): 325.9 6.8’ 769.0 10.3’ 32.5 1.0 8.4 1.5’ 27.3 2.6’ -12.8 -0.1 Melanomas of skin 97.8 0.6 424.5 2.6 -18.0 -1.1 -10.6 -0.5 -14.7 -1.0’ -6.0 0.0 Other non-epithelial 569.8 10.0’ 973.7 13.2’ 99.1 2.6’ 23.7 2.8’ 58.1 4.4’ -19.1 -0.3 skin Breast 41.1 2.0’ -20.5 1.1 36.7 1.8’ 22.9 1.2’ 19.1 0.5 18.4 1.1’
SEER Cancer Statistics Review 1973-1996 National Cancer Institute

The PC is the Percent Change over the time interval.The EAPC is the Estimated Annual Percent Change over the time interval.
§ SEER Program. Rates are per 100,000 and are age-adjusted to the 1970 U.S.standard population.
* NCHS public use tape. Rates are per 100,000 and are age-adjusted to the 1970 U.S.standard population.
’ The EAPC is significantly different from zero (p<.05).- Statistic could not be calculated.
Table I-12 - continuedSEER INCIDENCE AND U.S. MORTALITY TRENDS BY PRIMARY CANCER SITE AND SEX
Blacks, 1973-96
Incidence§ US Mortality*
Total Males Females Total Males FemalesSite PC EAPC PC EAPC PC EAPC PC EAPC PC EAPC PC EAPC Female Genital System: -28.2 -1.5’ - - -31.2 -1.6’ -32.9 -1.5’ - - -36.2 -1.7’ Cervix uteri -58.7 -4.1’ - - -60.2 -4.2’ -54.5 -3.2’ - - -55.9 -3.3’ Corpus uteri 19.3 0.3 - - 14.2 0.1 4.6 0.3’ - - -1.2 0.1 Uterus, NOS -17.6 -1.2 - - -20.7 -1.3 -35.2 -1.6’ - - -38.9 -1.9’ Ovary -8.0 0.4 - - -11.4 0.2 -7.4 0.1 - - -12.7 -0.2 Vagina -43.7 -2.2’ - - -47.3 -2.3’ -13.3 -1.1’ - - -19.0 -1.4’ Vulva -9.8 -0.6 - - -12.2 -0.8 -43.3 -1.5’ - - -46.5 -1.7’ Other female -47.5 -1.2 - - -49.9 -1.6 -40.3 -2.2’ - - -43.4 -2.5’ genital system Male Genital System: 97.6 3.7’ 105.4 3.9’ - - 18.8 1.0’ 33.0 1.6’ - - Prostate 99.9 3.8’ 107.6 3.9’ - - 21.0 1.1’ 35.3 1.6’ - - Testis 17.1 0.6 17.3 0.6 - - -63.4 -3.9’ -64.5 -4.0’ - - Penis -45.4 -2.0 -37.1 -1.5 - - -65.1 -4.8’ -62.2 -4.4’ - - Other male 99.8 - 122.7 - - - -81.3 -6.2’ -81.8 -6.2’ - - genital system Urinary System: 43.4 1.6’ 54.0 1.8’ 35.6 1.5’ 2.1 0.1 2.9 0.2 5.7 0.2’ Urinary bladder 18.6 0.5 25.4 0.7 15.6 0.5 -26.8 -1.4’ -26.2 -1.3’ -23.3 -1.2’ Kidney & renal pelvis 73.2 3.0’ 81.4 3.2’ 69.6 2.9’ 57.8 2.1’ 58.6 2.2’ 63.9 2.2’ Ureter -52.6 - - - -63.0 - 25.2 0.6 20.7 0.4 28.1 0.9 Other urinary system 77.5 1.6 1416.1 - -19.8 -0.3 -34.1 -1.9’ -53.5 -3.8’ -9.5 -0.4 Eye & Orbit -30.6 -1.4 -54.0 - 58.4 - -55.0 -3.6’ -63.1 -4.4’ -38.9 -2.6 Brain & Nervous System: 15.7 0.8 27.8 0.5 7.1 1.3 7.3 0.4’ 6.7 0.2 10.1 0.6’ Brain 15.9 0.7 29.4 0.3 6.1 1.4 32.7 1.5’ 35.0 1.4’ 32.6 1.6’ Cranial nerves & other 13.3 1.8 10.5 - 16.6 - -79.1 -8.0’ -80.6 -8.3’ -77.8 -8.2’ nervous system Endocrine System: 19.0 0.8 4.4 0.5 24.0 0.8 -10.9 -0.2 -7.9 -0.2 -15.4 -0.2 Thyroid 5.1 0.4 -16.7 0.3 11.1 0.4 -33.1 -1.4’ -34.7 -1.4’ -35.2 -1.6’ Other endocrine & 116.2 2.3’ 59.8 0.6 211.9 - 28.4 1.4’ 21.6 0.9 35.4 2.1’ thymus Lymphomas: 69.1 3.2’ 74.2 3.2’ 64.2 3.2’ 30.1 1.5’ 25.6 1.4’ 40.0 1.7’ Hodgkin's disease -8.5 0.6 -13.8 -0.4 2.2 2.5’ -48.9 -2.8’ -52.9 -3.1’ -40.6 -2.3’ Non-Hodgkin's 98.6 3.9’ 110.1 4.3’ 84.8 3.4’ 51.6 2.2’ 48.8 2.2’ 58.7 2.4’ lymphomas Multiple myeloma 0.0 0.7’ -7.4 0.5 10.2 0.9’ 48.4 1.7’ 42.1 1.7’ 58.7 1.9’ Leukemias: -20.2 -0.5 -19.4 -0.5 -20.4 -0.5 6.1 0.3’ 7.5 0.5’ 8.7 0.2 Lymphocytic: -25.3 -0.7 -23.7 -0.8 -27.9 -0.7 6.7 0.4 10.7 0.7’ 6.7 0.1 Acute lymphocytic 29.3 2.6’ 61.2 3.1’ 3.8 2.7 -5.7 -0.5 -19.9 -0.8’ 19.3 -0.1 Chronic lymphocytic -29.9 -1.2’ -27.4 -1.1 -33.9 -1.4’ 30.1 1.4’ 41.1 1.8’ 20.0 0.9’ Other lymphocytic -72.7 - -85.4 - -57.1 - -68.4 -5.0’ -64.2 -4.8’ -73.4 -5.3’ Myeloid: -6.1 -0.1 -10.6 -0.1 3.2 0.0 4.6 -0.1 3.1 0.0 9.0 -0.1 Acute myeloid 10.4 0.7 3.0 0.6 19.8 0.7 15.4 0.1 8.5 0.0 27.4 0.3 Chronic myeloid -15.2 -0.5 -4.3 -0.2 -18.8 -0.7 3.7 0.3 12.1 0.7 -3.1 0.0 Other myeloid -52.1 -3.8’ -82.0 -5.0’ 16.3 - -71.3 -5.3’ -77.1 -5.3’ -67.1 -5.7’ Monocytic: -60.8 -3.3 -82.8 -5.2’ -40.6 - -76.0 -6.3’ -78.2 -6.7’ -70.4 -5.6’ Acute monocytic -51.8 - -74.2 - -31.7 - -74.2 -6.0’ -75.2 - -72.0 -5.8’ Chronic monocytic -49.0 - - - -61.5 - -66.4 - -56.8 - -73.8 - Other monocytic - - - - - - -87.9 - -92.8 - -35.3 - Other: -36.1 -0.4 -13.5 0.5 -60.5 -2.0 19.4 1.1’ 24.6 1.2’ 19.2 1.1’ Other acute -26.8 0.5 8.2 - -52.6 -1.5 4.4 0.8’ 15.5 1.0’ -1.5 0.7 Other chronic - - - - - - -2.7 0.2 -11.9 1.3 16.5 -0.9 Aleukemic, subleuk & -44.6 -0.8 -30.9 -1.4 -65.7 -1.7 37.1 1.5’ 36.4 1.5’ 46.1 1.8’ NOS Ill-defined & 1.4 0.1 -13.8 -0.3 21.3 0.5 4.6 0.1 15.4 0.6’ -4.7 -0.3 unspecified
SEER Cancer Statistics Review 1973-1996 National Cancer Institute

Source: SEER Program.
Table I-13
AGE DISTRIBUTION (%) OF INCIDENCE CASES BY SITE, 1992-96
All Races, Both Sexes
AllSite <20 20-34 35-44 45-54 55-64 65-74 75-84 85+ Ages Cases All Sites 1.0 3.3 6.3 11.3 18.6 30.4 22.2 6.9 100.0% 557,508Oral cavity & Pharynx 0.7 3.5 7.6 16.5 23.4 26.6 16.5 5.2 100.0% 13,799Esophagus 0.0 0.5 3.1 11.2 23.1 33.4 21.8 6.7 100.0% 5,213Stomach 0.1 1.2 4.2 8.3 16.4 29.3 28.3 12.1 100.0% 10,007Colon & Rectum 0.0 0.9 3.1 7.8 16.7 30.5 29.4 11.5 100.0% 63,068 Males 0.0 1.0 3.3 8.7 18.7 33.2 27.5 7.6 100.0% 31,737 Females 0.0 0.8 2.9 6.9 14.6 27.9 31.4 15.5 100.0% 31,331Colon 0.0 0.8 2.7 6.9 15.6 30.2 31.1 12.7 100.0% 45,899Rectum 0.0 1.3 4.0 10.3 19.6 31.4 25.0 8.3 100.0% 17,169Liver & Intrahep 1.4 1.4 5.7 11.0 19.1 30.4 23.8 7.3 100.0% 5,156Pancreas 0.0 0.5 2.3 8.1 16.4 31.9 28.8 12.0 100.0% 12,607Larynx 0.0 0.6 4.0 14.1 26.7 34.7 17.2 2.7 100.0% 5,176Lung & Bronchus 0.0 0.4 2.3 9.2 21.5 37.2 24.3 5.1 100.0% 76,859 Males 0.0 0.3 2.2 8.9 21.8 38.0 24.1 4.7 100.0% 44,852 Females 0.0 0.4 2.4 9.7 21.1 36.1 24.6 5.7 100.0% 32,007Melanomas of skin 0.9 11.1 17.4 18.4 16.8 18.9 12.4 4.0 100.0% 18,179Breast(females) 0.0 2.1 11.1 20.0 19.7 24.1 17.3 5.7 100.0% 81,769Cervix uteri 0.2 18.3 25.7 20.0 13.3 12.0 7.8 2.7 100.0% 5,971Corpus & Uterus, NOS 0.0 1.1 5.9 15.6 23.6 29.2 19.4 5.0 100.0% 15,582Ovary 1.3 6.7 10.8 17.1 18.2 22.9 16.9 6.2 100.0% 10,822Prostate 0.0 0.0 0.2 4.4 20.6 43.7 25.6 5.4 100.0% 92,128Testis 4.9 50.9 30.2 9.5 2.5 1.5 0.6 0.0 100.0% 3,392Urinary bladder 0.1 0.7 2.6 7.9 17.0 33.9 28.3 9.4 100.0% 23,609Kidney & Renal pelvis 2.2 1.4 5.9 14.4 21.2 29.7 20.0 5.4 100.0% 12,530Brain & Other nervous 13.5 10.4 11.5 12.9 15.4 20.5 12.7 3.1 100.0% 7,813Thyroid 2.5 23.7 24.0 18.9 12.4 11.2 5.6 1.6 100.0% 7,336Hodgkin's disease 11.8 38.5 16.3 10.7 7.5 7.6 6.2 1.4 100.0% 3,569Non-Hodgkin's lymphomas 1.7 6.9 10.8 13.5 15.5 24.3 20.8 6.5 100.0% 22,144Multiple myeloma 0.0 0.5 3.1 9.7 18.1 31.9 27.2 9.4 100.0% 6,246Leukemias 9.5 5.2 6.0 9.2 13.6 24.5 22.2 9.7 100.0% 14,061Acute lymphocytic 60.5 10.9 6.3 4.6 4.9 6.2 4.3 2.3 100.0% 1,618Chronic lymphocytic 0.0 0.4 2.3 9.1 17.1 31.8 27.5 11.8 100.0% 4,259Acute myeloid 5.6 6.9 7.0 9.9 13.9 25.6 22.9 8.3 100.0% 3,692Chronic myeloid 2.1 7.9 10.3 11.2 14.2 22.8 21.8 9.7 100.0% 2,005All other leukemias 4.5 5.1 7.0 9.9 12.5 23.6 24.2 13.1 100.0% 2,487
SEER C
ancer Statistics Review
1973-1996N
ational Cancer Institute

§ SEER Program.- Statistic could not be calculated.
Table I-14MEDIAN AGE OF CANCER PATIENTS AT DIAGNOSIS§, 1992-96
By Primary Cancer Site, Race and Sex
All Races Whites BlacksSite Total Males Females Total Males Females Total Males Females All Sites 68.0 68.0 67.0 68.0 69.0 68.0 65.0 66.0 63.0 Oral Cavity & Pharynx: 64.0 63.0 67.0 65.0 64.0 68.0 57.0 56.0 58.0 Lip 69.0 68.0 72.0 69.0 68.5 73.0 67.5 68.0 66.5 Tongue 63.0 62.0 66.0 64.0 62.0 67.0 57.0 57.0 58.0 Salivary gland 65.0 66.0 63.0 66.0 66.5 65.0 58.0 60.0 53.0 Floor of mouth 64.0 62.0 68.0 64.0 63.0 68.0 55.0 54.5 57.0 Gum & other 66.0 62.0 70.0 67.0 63.0 71.0 57.0 57.0 59.0 oral cavity Nasopharynx 55.0 55.0 57.0 61.0 59.0 64.0 50.0 49.0 58.0 Tonsil 59.0 58.0 63.0 60.0 58.5 64.0 55.0 54.0 57.5 Oropharynx 63.0 62.0 66.5 64.5 64.0 66.0 57.0 56.0 63.0 Hypopharynx 65.0 64.0 65.0 66.0 65.0 68.0 59.0 58.5 59.0 Other oral cavity 67.0 66.0 70.0 68.0 66.0 70.0 60.5 60.5 61.0 & pharynx Digestive System: 71.0 70.0 73.0 72.0 70.0 74.0 67.0 66.0 69.0 Esophagus 68.0 67.0 72.0 69.0 68.0 73.0 63.0 63.0 64.0 Stomach 72.0 70.0 74.0 72.0 71.0 75.0 69.0 68.0 73.0 Small intestine 67.0 66.0 69.0 68.0 67.0 70.0 61.0 60.0 65.0 Colon & Rectum: 72.0 70.0 74.0 72.0 71.0 74.0 68.0 67.0 69.0 Colon 73.0 71.0 74.0 73.0 72.0 75.0 69.0 68.0 70.0 Rectum 69.0 68.0 71.0 70.0 69.0 72.0 66.0 64.5 67.0 Anus, anal canal & 65.0 60.5 68.0 67.0 63.0 68.0 53.0 47.0 61.0 anorectum Liver & Intrahep: 68.0 67.0 72.0 70.0 69.0 73.0 63.0 60.0 69.0 Liver 68.0 66.0 71.0 70.0 69.0 72.0 63.0 60.0 68.5 Intrahep bile duct 73.0 70.5 76.0 73.0 70.0 76.0 73.0 69.5 76.0 Gallbladder 73.0 71.0 74.0 74.0 72.0 74.0 68.0 67.5 68.0 Other biliary 73.0 72.0 73.0 73.0 72.0 74.0 67.5 64.0 70.5 Pancreas 72.0 70.0 74.0 73.0 70.0 75.0 69.0 66.0 71.0 Retroperitoneum 59.5 58.5 60.0 61.5 62.0 61.0 43.0 22.0 51.0 Peritoneum, omentum & 67.0 64.0 68.0 67.0 64.0 68.5 63.0 55.0 63.0 mesentery Other digestive 76.0 72.0 78.0 76.0 73.5 78.0 67.0 65.5 67.0 system Respiratory System: 69.0 69.0 69.0 69.0 69.0 69.0 65.0 65.0 65.0 Nose, nasal cavity & 65.0 64.0 67.0 66.0 65.0 68.0 61.0 59.5 64.0 middle ear Larynx 66.0 66.0 65.0 66.0 66.0 66.0 62.0 62.0 61.0 Lung & bronchus 69.0 69.0 69.0 70.0 69.0 70.0 65.0 65.0 65.0 Pleura 72.0 72.0 71.0 72.0 72.0 71.0 66.0 65.0 70.5 Trachea & other 47.0 39.0 59.0 49.0 39.0 61.0 47.0 45.0 60.5 respiratory organs Bones & joints 37.0 35.0 38.0 38.0 37.0 40.0 31.0 30.0 31.0 Soft tissue (incl heart) 56.0 55.0 58.0 58.0 56.0 61.0 46.0 45.0 47.0 Skin (ex basal & squam): 52.0 52.0 52.0 53.0 53.0 52.0 38.0 37.0 45.5 Melanomas of skin 56.0 59.0 51.0 56.0 59.0 52.0 63.0 61.0 65.5 Other non-epithelial 41.0 40.0 63.0 42.0 40.0 66.0 37.0 36.0 42.0 skin Breast 63.0 68.0 63.0 64.0 69.0 64.0 57.0 66.0 57.0
SEER Cancer Statistics Review 1973-1996 National Cancer Institute

§ SEER Program.- Statistic could not be calculated.
Table I-14 - continuedMEDIAN AGE OF CANCER PATIENTS AT DIAGNOSIS§, 1992-96
By Primary Cancer Site, Race and Sex
All Races Whites BlacksSite Total Males Females Total Males Females Total Males Females Female Genital System: 63.0 - 63.0 64.0 - 64.0 60.0 - 60.0 Cervix uteri 47.0 - 47.0 46.0 - 46.0 48.0 - 48.0 Corpus uteri 66.0 - 66.0 66.0 - 66.0 65.0 - 65.0 Uterus, NOS 68.5 - 68.5 71.5 - 71.5 65.5 - 65.5 Ovary 62.0 - 62.0 63.0 - 63.0 60.0 - 60.0 Vagina 70.0 - 70.0 70.0 - 70.0 67.0 - 67.0 Vulva 72.0 - 72.0 73.0 - 73.0 61.0 - 61.0 Other female 63.0 - 63.0 63.0 - 63.0 64.0 - 64.0 genital system Male Genital System: 70.0 70.0 - 70.0 70.0 - 68.0 68.0 - Prostate 70.0 70.0 - 70.0 70.0 - 68.0 68.0 - Testis 33.0 33.0 - 33.0 33.0 - 31.0 31.0 - Penis 68.0 68.0 - 68.0 68.0 - 64.0 64.0 - Other male 67.0 67.0 - 67.0 67.0 - 66.0 66.0 - genital system Urinary System: 70.0 69.0 71.0 70.0 70.0 71.0 66.0 65.0 68.0 Urinary bladder 71.0 71.0 73.0 71.0 71.0 73.0 70.0 69.0 73.0 Kidney & renal pelvis 66.0 65.0 68.0 67.0 66.0 69.0 61.0 61.0 63.0 Ureter 73.0 72.0 74.0 73.0 72.0 74.0 73.0 70.0 74.0 Other urinary system 72.0 71.0 74.0 74.0 73.0 77.0 66.0 65.5 66.0 Eye & Orbit 60.0 60.0 61.0 63.0 61.5 63.0 2.0 1.0 2.0 Brain & Nervous System: 56.0 54.0 58.0 57.0 55.0 59.0 45.0 43.5 47.0 Brain 56.0 55.0 58.0 57.0 56.0 60.0 44.5 44.0 45.0 Cranial nerves & other 49.0 44.0 52.0 48.0 44.0 51.5 55.5 35.0 58.0 nervous system Endocrine System: 45.0 49.0 43.0 44.0 49.0 43.0 46.0 50.0 45.0 Thyroid 44.0 50.0 43.0 44.0 49.0 42.0 46.0 51.0 44.5 Other endocrine & 48.0 44.0 51.0 48.0 44.0 53.0 46.0 46.0 47.0 thymus Lymphomas: 62.0 58.0 67.0 64.0 60.0 68.0 46.0 44.0 50.0 Hodgkin's disease 34.0 36.0 33.0 35.0 36.0 34.0 31.0 33.0 29.0 Non-Hodgkin's 65.0 61.0 69.0 66.0 62.0 70.0 49.0 46.0 57.0 lymphomas Multiple myeloma 70.0 69.0 72.0 71.0 70.0 73.0 68.0 67.0 69.0 Leukemias: 68.0 67.0 69.0 69.0 67.0 70.0 62.0 61.0 64.0 Lymphocytic: 67.0 66.0 69.0 68.0 66.0 70.0 63.0 61.0 65.0 Acute lymphocytic 12.0 12.0 11.0 12.0 13.0 11.0 11.0 9.0 12.0 Chronic lymphocytic 71.0 70.0 73.0 72.0 70.0 74.0 69.0 67.0 73.0 Other lymphocytic 70.0 68.0 74.0 71.0 69.0 75.0 68.0 66.5 68.0 Myeloid: 67.0 67.0 68.0 68.0 68.0 69.0 60.0 58.0 60.0 Acute myeloid 68.0 68.0 68.0 69.0 68.0 69.0 61.0 62.0 59.5 Chronic myeloid 67.0 65.0 69.0 68.0 67.0 70.5 58.0 54.5 64.0 Other myeloid 61.0 61.0 60.5 63.0 64.0 61.0 47.5 39.0 56.0 Monocytic: 68.5 69.0 67.0 70.0 70.0 69.5 47.0 41.5 66.0 Acute monocytic 68.0 68.5 66.5 69.0 69.5 69.0 45.5 40.0 65.0 Chronic monocytic 69.0 69.0 66.0 69.0 69.0 65.0 66.5 48.0 85.0 Other monocytic 80.0 78.0 84.0 80.0 78.0 88.0 - - - Other: 71.0 69.0 75.0 72.0 70.0 75.0 65.0 65.0 67.0 Other acute 74.0 73.0 76.0 75.0 73.0 76.0 65.0 65.5 65.0 Other chronic 79.0 79.0 78.0 80.0 80.0 81.0 71.5 71.5 - Aleukemic, subleuk & 68.0 66.0 72.0 69.0 66.0 73.0 64.5 62.5 70.0 NOS Ill-defined & 72.0 70.0 74.0 73.0 71.0 75.0 67.0 64.0 70.0 unspecified
SEER Cancer Statistics Review 1973-1996 National Cancer Institute

Source: NCHS public use tape.
Table I-15
AGE DISTRIBUTION (%) OF DEATHS BY SITE, 1992-96
All Races, Both Sexes
AllSite <20 20-34 35-44 45-54 55-64 65-74 75-84 85+ Ages Cases All Sites 0.4 1.1 3.2 8.1 16.8 30.5 28.0 11.9 100.0% 2,662,664Oral cavity & Pharynx 0.2 0.9 4.0 12.6 22.7 29.5 21.0 9.1 100.0% 40,175Esophagus 0.0 0.3 2.4 10.1 22.2 33.8 23.6 7.6 100.0% 53,703Stomach 0.0 1.1 3.4 7.6 14.9 28.0 29.6 15.5 100.0% 68,029Colon & Rectum 0.0 0.6 2.1 6.0 14.0 28.1 31.3 17.8 100.0% 286,192 Males 0.0 0.7 2.3 6.9 16.4 31.6 30.0 12.2 100.0% 141,340 Females 0.0 0.5 2.0 5.2 11.7 24.7 32.6 23.3 100.0% 144,852Colon 0.0 0.5 2.0 5.8 13.6 27.9 31.9 18.2 100.0% 246,436Rectum 0.0 0.8 2.9 7.5 16.3 29.2 27.8 15.5 100.0% 39,756Liver & Intrahep 0.5 1.0 3.7 8.6 17.5 30.9 27.3 10.5 100.0% 52,816Pancreas 0.0 0.3 1.9 6.7 16.0 31.2 30.7 13.2 100.0% 133,368Larynx 0.0 0.2 2.1 10.5 24.3 34.8 22.1 6.1 100.0% 19,683Lung & Bronchus 0.0 0.2 1.7 7.9 20.8 36.9 26.1 6.4 100.0% 746,876 Males 0.0 0.2 1.7 7.9 21.4 37.6 25.6 5.7 100.0% 458,978 Females 0.0 0.2 1.8 7.9 19.8 35.7 26.9 7.6 100.0% 287,898Melanomas of skin 0.2 4.4 10.8 14.5 17.3 24.0 20.4 8.4 100.0% 34,142Breast(females) 0.0 1.3 7.3 14.5 18.0 25.0 22.2 11.8 100.0% 217,194Cervix uteri 0.0 7.1 17.0 19.2 16.7 18.6 14.6 6.8 100.0% 22,868Corpus & Uterus, NOS 0.0 0.4 2.0 5.9 14.8 31.5 30.5 14.9 100.0% 30,871Ovary 0.1 0.9 3.6 10.3 18.1 29.7 26.7 10.6 100.0% 66,053Prostate 0.0 0.0 0.1 1.0 6.8 27.2 41.8 23.1 100.0% 172,601Testis 3.2 40.8 26.8 10.8 6.5 6.3 4.0 1.6 100.0% 1,737Urinary bladder 0.0 0.2 0.9 3.3 9.9 27.0 36.7 22.1 100.0% 55,371Kidney & Renal pelvis 0.5 0.7 3.1 10.2 19.2 30.2 26.2 10.0 100.0% 53,676Brain & Other nervous 4.6 5.2 8.4 13.7 19.1 27.0 17.9 4.3 100.0% 60,684Thyroid 0.1 1.0 2.7 7.5 15.3 27.8 29.8 15.8 100.0% 5,606Hodgkin's disease 2.3 20.4 14.1 11.9 11.2 18.0 16.5 5.6 100.0% 7,492Non-Hodgkin's lymphomas 0.6 2.9 5.0 8.0 14.1 27.7 29.7 12.1 100.0% 107,577Multiple myeloma 0.0 0.2 1.6 6.1 15.4 31.8 32.6 12.3 100.0% 49,449Leukemias 4.0 4.3 4.3 6.7 12.3 25.3 28.7 14.5 100.0% 99,773Acute lymphocytic 25.4 15.3 8.3 7.8 9.7 13.7 13.2 6.5 100.0% 6,998Chronic lymphocytic 0.0 0.1 0.6 3.6 11.1 26.9 34.8 23.0 100.0% 20,845Acute myeloid 3.4 5.1 5.6 8.1 14.2 27.8 26.7 9.1 100.0% 29,260Chronic myeloid 1.6 6.1 7.8 11.0 14.9 24.0 23.8 10.7 100.0% 11,417All other leukemias 3.3 3.1 3.3 5.5 10.9 25.1 31.8 16.9 100.0% 31,253
SEER C
ancer Statistics Review
1973-1996N
ational Cancer Institute

* U.S. Mortality, NCHS public use tape.- Statistic could not be calculated.
Table I-16MEDIAN AGE OF CANCER PATIENTS AT DEATH*, 1992-96
By Primary Cancer Site, Race and Sex
All Races Whites BlacksSite Total Males Females Total Males Females Total Males Females All Sites 71.0 71.0 72.0 72.0 71.0 72.0 68.0 68.0 68.0
Oral Cavity & Pharynx: 68.0 66.0 72.0 69.0 67.0 73.0 60.0 60.0 63.0 Lip 76.0 74.0 82.0 76.0 74.5 82.0 76.0 78.0 70.0 Tongue 67.0 65.0 71.0 68.0 66.5 72.0 60.0 59.0 62.5 Salivary gland 72.0 71.0 74.0 73.0 72.0 75.0 66.0 65.0 68.0 Floor of mouth 66.0 64.0 70.0 67.0 65.0 71.0 60.0 59.0 65.0 Gum & other 71.0 67.0 76.0 72.0 69.0 77.0 62.0 60.0 68.0 oral cavity Nasopharynx 63.0 61.0 67.0 65.0 64.0 68.0 58.0 57.0 60.5 Tonsil 64.0 63.0 68.0 66.0 64.0 69.0 58.0 58.0 59.5 Oropharynx 67.0 65.0 71.0 69.0 67.0 73.0 60.0 59.0 63.0 Hypopharynx 67.0 66.0 69.0 68.0 67.0 69.0 61.0 61.0 64.0 Other oral cavity 68.0 67.0 70.0 69.0 68.0 72.0 61.0 60.0 62.0 & pharynx
Digestive System: 73.0 71.0 75.0 74.0 71.0 76.0 69.0 67.0 72.0 Esophagus 69.0 68.0 73.0 70.0 69.0 75.0 64.0 63.0 66.0 Stomach 73.0 71.0 76.0 74.0 72.0 77.0 71.0 69.0 74.0 Small intestine 71.0 70.0 72.0 72.0 70.0 73.0 68.0 66.0 69.0 Colon & Rectum 74.0 72.0 76.0 75.0 73.0 77.0 71.0 69.0 72.0 Anus, anal canal & 68.0 64.0 70.0 69.0 65.0 71.0 62.0 56.0 64.5 anorectum Liver & Intrahep: 71.0 69.0 74.0 72.0 70.0 74.0 67.0 64.0 71.0 Liver 70.0 69.0 74.0 72.0 70.0 75.0 66.0 64.0 71.0 Intrahep bile duct 72.0 71.0 74.0 73.0 71.5 74.0 69.0 68.0 70.0 Gallbladder 74.0 73.0 75.0 75.0 74.0 75.0 71.0 71.0 71.0 Other biliary 76.0 74.0 78.0 76.0 74.0 78.0 73.0 69.5 75.5 Pancreas 73.0 71.0 75.0 73.0 71.0 75.0 70.0 68.0 72.0 Retroperitoneum 71.0 69.0 72.0 71.0 70.0 73.0 67.0 65.0 70.0 Peritoneum, omentum & 70.0 67.0 71.0 70.0 68.0 71.0 69.0 62.0 71.0 mesentery Other digestive 79.0 74.0 82.0 79.0 75.0 83.0 74.0 71.0 78.0 system
Respiratory System: 70.0 70.0 70.0 70.0 70.0 71.0 67.0 67.0 67.0 Nose, nasal cavity & 70.0 67.0 73.0 70.0 68.0 73.0 65.5 65.0 72.0 middle ear Larynx 68.0 68.0 69.0 69.0 69.0 70.0 63.0 63.0 63.0 Lung & bronchus 70.0 70.0 70.0 70.0 70.0 71.0 67.0 67.0 67.0 Pleura 72.0 72.0 73.0 72.0 72.0 73.0 68.0 67.5 68.0 Trachea & other 68.0 66.0 71.0 69.0 67.0 71.0 63.0 59.0 68.0 respiratory organs
Bones & joints 62.0 59.0 66.0 64.0 60.0 68.0 56.0 56.0 56.0
Soft tissue (incl heart) 66.0 64.0 67.0 67.0 65.0 68.0 58.0 50.0 61.0
Skin (ex basal & squam): 67.0 66.0 70.0 68.0 67.0 70.0 63.0 60.0 70.0 Melanomas of skin 66.0 65.0 67.0 66.0 65.0 67.0 70.0 66.0 73.0 Other non-epithelial 72.0 70.0 78.0 74.0 72.0 79.0 60.0 58.0 66.0 skin
Breast 68.0 71.0 68.0 69.0 71.0 69.0 62.0 70.0 61.0
SEER Cancer Statistics Review 1973-1996 National Cancer Institute

* U.S. Mortality, NCHS public use tape.- Statistic could not be calculated.
Table I-16 - continuedMEDIAN AGE OF CANCER PATIENTS AT DEATH*, 1992-96
By Primary Cancer Site, Race and Sex
All Races Whites BlacksSite Total Males Females Total Males Females Total Males Females Female Genital System: 70.0 - 70.0 71.0 - 71.0 67.0 - 67.0 Cervix uteri 58.0 - 58.0 59.0 - 59.0 58.0 - 58.0 Corpus uteri 73.0 - 73.0 73.0 - 73.0 70.0 - 70.0 Uterus, NOS 74.0 - 74.0 74.0 - 74.0 71.0 - 71.0 Ovary 71.0 - 71.0 71.0 - 71.0 69.0 - 69.0 Vagina 76.0 - 76.0 76.0 - 76.0 72.0 - 72.0 Vulva 79.0 - 79.0 79.0 - 79.0 71.0 - 71.0 Other female 70.0 - 70.0 70.0 - 70.0 65.0 - 65.0 genital system
Male Genital System: 78.0 78.0 - 78.0 78.0 - 76.0 76.0 - Prostate 78.0 78.0 - 78.0 78.0 - 76.0 76.0 - Testis 37.0 37.0 - 37.0 37.0 - 37.0 37.0 - Penis 70.0 70.0 - 70.0 70.0 - 70.5 70.5 - Other male 72.0 72.0 - 72.0 72.0 - 55.5 55.5 - genital system
Urinary System: 74.0 73.0 76.0 74.0 73.0 76.0 71.0 69.0 73.0 Urinary bladder 77.0 76.0 79.0 77.0 76.0 79.0 75.0 74.0 76.0 Kidney & renal pelvis 70.0 69.0 73.0 71.0 69.0 73.0 67.0 65.0 69.0 Ureter 75.0 74.0 77.0 75.0 74.0 77.0 75.0 77.0 75.0 Other urinary system 74.0 74.0 74.0 76.0 75.0 77.0 69.0 70.5 68.0
Eye & Orbit 70.0 68.0 72.0 71.0 68.0 72.0 55.0 55.5 50.0
Brain & Nervous System: 64.0 62.0 66.0 65.0 63.0 67.0 58.0 56.0 60.0 Brain 64.0 62.0 66.0 64.0 63.0 67.0 58.0 56.0 60.0 Cranial nerves & other 65.0 62.0 68.0 66.0 63.0 69.0 53.0 49.0 63.0 nervous system
Endocrine System: 68.0 64.0 71.0 69.0 65.0 72.0 63.0 54.0 67.0 Thyroid 73.0 69.0 76.0 74.0 69.0 76.0 71.0 67.0 73.0 Other endocrine & 56.0 54.0 58.0 57.0 56.0 58.0 50.0 44.0 55.0 thymus
Lymphomas: 71.0 69.0 74.0 72.0 70.0 74.0 62.0 58.0 66.0 Hodgkin's disease 56.0 53.0 61.0 58.0 54.0 64.0 41.0 41.0 41.0 Non-Hodgkin's 72.0 70.0 74.0 72.0 70.0 75.0 63.0 59.0 67.0 lymphomas
Multiple myeloma 73.0 72.0 74.0 74.0 72.0 75.0 70.0 69.0 71.0
Leukemias: 72.0 71.0 74.0 73.0 71.0 75.0 66.0 65.0 68.0 Lymphocytic: 74.0 72.0 77.0 75.0 72.0 78.0 69.0 67.0 71.0 Acute lymphocytic 46.0 39.0 55.0 48.0 41.0 57.0 34.0 31.0 40.0 Chronic lymphocytic 77.0 75.0 80.0 77.0 75.0 80.0 72.0 70.0 75.0 Other lymphocytic 77.0 74.0 80.0 77.0 74.0 80.0 72.0 70.0 77.0 Myeloid: 70.0 69.0 71.0 70.0 70.0 72.0 62.0 62.0 63.0 Acute myeloid 70.0 69.0 71.0 70.0 70.0 71.0 64.0 65.0 64.0 Chronic myeloid 68.0 67.0 70.0 70.0 68.0 71.0 60.0 57.0 62.0 Other myeloid 76.0 75.0 78.0 76.0 75.0 78.0 73.5 68.0 76.0 Monocytic: 74.0 73.0 75.0 74.0 73.0 76.0 64.0 64.0 62.0 Acute monocytic 73.0 72.0 74.0 73.0 72.0 74.0 62.0 62.0 61.0 Chronic monocytic 79.0 77.5 80.0 79.0 77.5 80.0 73.0 78.5 72.5 Other monocytic 78.0 76.5 80.0 78.0 77.0 80.0 73.5 76.0 43.5 Other: 74.0 73.0 76.0 74.0 73.0 76.0 69.0 67.0 70.0 Other acute 73.0 72.0 74.0 73.0 72.0 74.0 69.0 68.0 70.0 Other chronic 79.0 77.0 80.0 79.0 78.0 81.0 72.0 71.0 75.0 Aleukemic, subleuk & 75.0 73.0 77.0 75.0 74.0 78.0 68.0 65.0 70.0 NOS
Ill-defined & 72.0 71.0 74.0 73.0 71.0 75.0 68.0 66.0 70.0 unspecified
SEER Cancer Statistics Review 1973-1996 National Cancer Institute

Note: Invasive cancer only unless specified otherwise.
Table I-17
Lifetime Risk (Percent) of Being Diagnosed With Cancer By Site, Race and Sex
SEER Areas, 1994-96
All Races Whites BlacksSite Males Females Males Females Males Females All Sites 43.56 38.11 43.60 39.01 39.67 32.30 Invasive and In Situ 44.67 43.65 44.76 44.51 40.06 36.41Oral cavity and Pharynx 1.47 0.73 1.45 0.74 1.56 0.60Esophagus 0.71 0.26 0.67 0.25 0.99 0.43Stomach 1.20 0.70 1.07 0.59 1.39 0.97Colon and Rectum 5.64 5.55 5.75 5.59 4.13 5.04 Invasive and In Situ 5.96 5.80 6.07 5.85 4.32 5.25Liver and Intrahepatic bile duct 0.65 0.33 0.54 0.28 0.62 0.33Pancreas 1.18 1.25 1.15 1.22 1.31 1.53Larynx 0.72 0.18 0.73 0.18 0.86 0.25 Invasive and In Situ 0.78 0.19 0.80 0.19 0.93 0.26Lung and Bronchus 8.11 5.69 8.17 5.94 8.33 4.94Melanomas of skin 1.60 1.17 1.84 1.34 0.13 0.07 Invasive and In Situ 2.33 1.71 2.66 1.95 0.16 0.12Breast 0.11 12.56 0.11 13.10 0.13 9.74 Invasive and In Situ 0.12 14.41 0.12 14.97 0.13 11.21Cervix uteri - 0.78 - 0.70 - 1.15 Invasive and In Situ - 3.91 - 3.73 - 3.81Corpus and Uterus, NOS - 2.69 - 2.83 - 1.71 Invasive and In Situ - 2.75 - 2.90 - 1.74Ovary - 1.72 - 1.84 - 1.08Prostate 15.91 - 15.44 - 17.26 -Testis 0.35 - 0.40 - 0.08 -Urinary bladder(Invasive and In Situ) 3.35 1.17 3.70 1.26 1.17 0.77Kidney and Renal pelvis 1.36 0.85 1.41 0.87 1.17 0.85Brain and Other nervous system 0.65 0.51 0.71 0.55 0.31 0.30Thyroid 0.26 0.72 0.28 0.73 0.10 0.39Hodgkin's disease 0.24 0.20 0.27 0.22 0.18 0.13Non-Hodgkin's lymphomas 2.08 1.71 2.18 1.80 1.29 0.89Multiple myeloma 0.62 0.54 0.59 0.50 0.86 1.00Leukemias 1.38 1.06 1.46 1.10 0.77 0.68
SEER C
ancer Statistics Review
1973-1996N
ational Cancer Institute
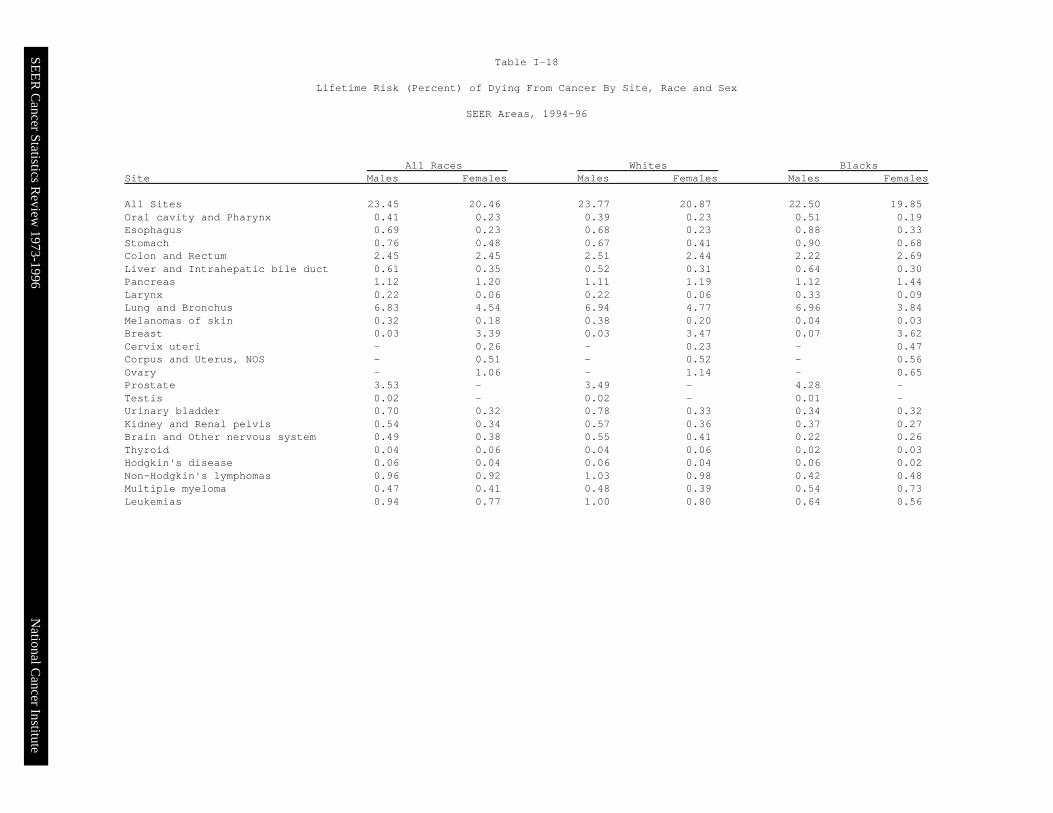
Table I-18
Lifetime Risk (Percent) of Dying From Cancer By Site, Race and Sex
SEER Areas, 1994-96
All Races Whites BlacksSite Males Females Males Females Males Females All Sites 23.45 20.46 23.77 20.87 22.50 19.85Oral cavity and Pharynx 0.41 0.23 0.39 0.23 0.51 0.19Esophagus 0.69 0.23 0.68 0.23 0.88 0.33Stomach 0.76 0.48 0.67 0.41 0.90 0.68Colon and Rectum 2.45 2.45 2.51 2.44 2.22 2.69Liver and Intrahepatic bile duct 0.61 0.35 0.52 0.31 0.64 0.30Pancreas 1.12 1.20 1.11 1.19 1.12 1.44Larynx 0.22 0.06 0.22 0.06 0.33 0.09Lung and Bronchus 6.83 4.54 6.94 4.77 6.96 3.84Melanomas of skin 0.32 0.18 0.38 0.20 0.04 0.03Breast 0.03 3.39 0.03 3.47 0.07 3.62Cervix uteri - 0.26 - 0.23 - 0.47Corpus and Uterus, NOS - 0.51 - 0.52 - 0.56Ovary - 1.06 - 1.14 - 0.65Prostate 3.53 - 3.49 - 4.28 -Testis 0.02 - 0.02 - 0.01 -Urinary bladder 0.70 0.32 0.78 0.33 0.34 0.32Kidney and Renal pelvis 0.54 0.34 0.57 0.36 0.37 0.27Brain and Other nervous system 0.49 0.38 0.55 0.41 0.22 0.26Thyroid 0.04 0.06 0.04 0.06 0.02 0.03Hodgkin's disease 0.06 0.04 0.06 0.04 0.06 0.02Non-Hodgkin's lymphomas 0.96 0.92 1.03 0.98 0.42 0.48Multiple myeloma 0.47 0.41 0.48 0.39 0.54 0.73Leukemias 0.94 0.77 1.00 0.80 0.64 0.56
SEER C
ancer Statistics Review
1973-1996N
ational Cancer Institute

Source: U.S. 1999 cancer prevalence rates are based on 1994 cancerprevalence rates from the Connecticut registry of the SEER programand 1999 population estimates from the U.S. Bureau of the Census. Connecticut prevalence rates are based on 1940-1993 cancerincidence and survival rates.
SEER Cancer Statistics Review 1973-1996 National Cancer Institute
Table I-19
ESTIMATED UNITED STATES CANCER PREVALENCE,1999
All Races, By Sex
Primary SiteEstimated Prevalence
Total Males FemalesAll Sites 8,368,000 3,465,000 4,903,000Brain and Other Nervous System 91,000 49,000 42,000Breast 2,057,000 13,000 2,044,000Cervix Uteri 211,000 0 211,000Colon 877,000 408,000 469,000Corpus Uteri 550,000 0 550,000Hodgkin’s Disease 158,000 84,000 74,000Kidney and Renal Pelvis 204,000 123,000 81,000Larynx 132,000 106,000 26,000Leukemias 144,000 80,000 64,000Lung and Bronchus 397,000 212,000 185,000Melanomas of Skin 484,000 234,000 250,000Non-Hodgkin’s Lymphoma 300,000 150,000 150,000Oral Cavity and Pharynx 214,000 134,000 80,000Ovary 191,000 0 191,000Pancreas 25,000 12,000 13,000Prostate 1,017,000 1,017,000 0Rectum 379,000 202,000 177,000Stomach 77,000 42,000 35,000Testis 130,000 130,000 0Thyroid 214,000 53,000 161,000Urinary Bladder 601,000 443,000 158,000Childhood (0-14 yrs) 154,000 78,000 76,000

Hawaii
San Francisco/Oakland
San Jose/Monterey
LosAngeles
Seattle/Puget Sound
Detroit
Connecticut
Iowa
Utah
NewMexico Atlanta
Surveillance, Epidemiology, and End Results Program, 1999National Cancer Institute
U.S.A.
SEER C
ancer Statistics Review
1973-1996N
ational Cancer Institute
Figure I-1

SEER C
ancer Statistics Review
1973-1996
Leading Causes of Death in U.S.Percent of All Causes of Death
1973 vs. 1996
Cancer 17.7%
Cerebrovascular 10.9%
Heart Disease 38.4%
Accidents 5.9%
Other Causes 22.5%
Chronic Lung Disease 1.5%
Pneumonia & Influ. 3.2%
1973 1996
Cancer 23.3%
Cerebrovascular 6.9%
Heart Disease 31.7%
Accidents 4.1%Other Causes 25.8%
Chronic Lung Disease 4.6%
Pneumonia & Influ. 3.6%
National C
ancer Institute

SEER C
ancer Statistics Review
1973-1996
U.S. Mortality Rates1973 - 1996
Ages Less Than 65 Ages 65 and Over
197419761978198019821984198619881990199219941996
Year of Death
50
60
70
80
90
100
Rate per 100,000
1974 1976 1978 1980 1982 1984 1986 1988 1990 1992 1994 1996
Year of Death
500
1000
1500
2000
2500
3000Rate per 100,000
27% of deathsin 1973
Heart Disease
21% of deathsin 1973
Neoplasms
26% of deathsin 1996
20% of deathsin 1996
45% of deathsin 1973
Heart Disease
36% of deathsin 1996
16% of deathsin 1973
Neoplasms22% of deaths
in 1996
National C
ancer Institute

SEER C
ancer Statistics Review
1973-1996
Trends in SEER Incidence & U.S. Mortality Ratesby Primary Cancer Site
1973-1996
Trends in SEER Incidence Rates
134.6
123.0111.9
81.3
77.5
44.2
42.141.5
25.3
20.0
18.9
15.813.7
9.2
7.7-0.7
-2.5
-5.3
-9.1
-11.0-11.5
-16.2
-17.4
-27.4
-34.5-44.0
Melanomas of SkinLung (Females)
ProstateNon-Hodgkin's
Liver & IntrahepKidney/Renal
ThyroidTestis
Breast (Females)All Cancers
All Except LungBrain & ONS
Multiple MyelomaEsophagus
Urinary BladderOvary
Lung (Males)Leukemias
Colon/RectumOral Cav & Phynx
PancreasLarynx
Hodgkin'sCorpus & Uterus, NOS
StomachCervix Uteri
0 50 100 150 200-50-100-150-200
Percent Change, 1973-1996
Trends in U.S. Cancer Mortality Rates
148.3
50.844.5
36.0
35.8
20.0
18.513.0
11.1
8.9
3.3
-3.4-6.2
-6.5
-7.5-10.4
-11.2
-21.6
-22.6
-24.0-26.7
-28.4
-41.0
-47.3
-64.3-70.0
Lung (Females)Liver & IntrahepNon-Hodgkin's
Multiple MyelomaMelanomas of Skin
EsophagusKidney/Renal
ProstateBrain & ONSLung (Males)
All CancersPancreas
LeukemiasAll Except Lung
Breast (Females)LarynxOvary
ThyroidColon/Rectum
Urinary BladderCorpus & Uterus, NOS
Oral Cav & PhynxStomach
Cervix UteriHodgkin's
Testis
0 50 100 150 200-50-100-150-200
Percent Change, 1973-1996
National C
ancer Institute
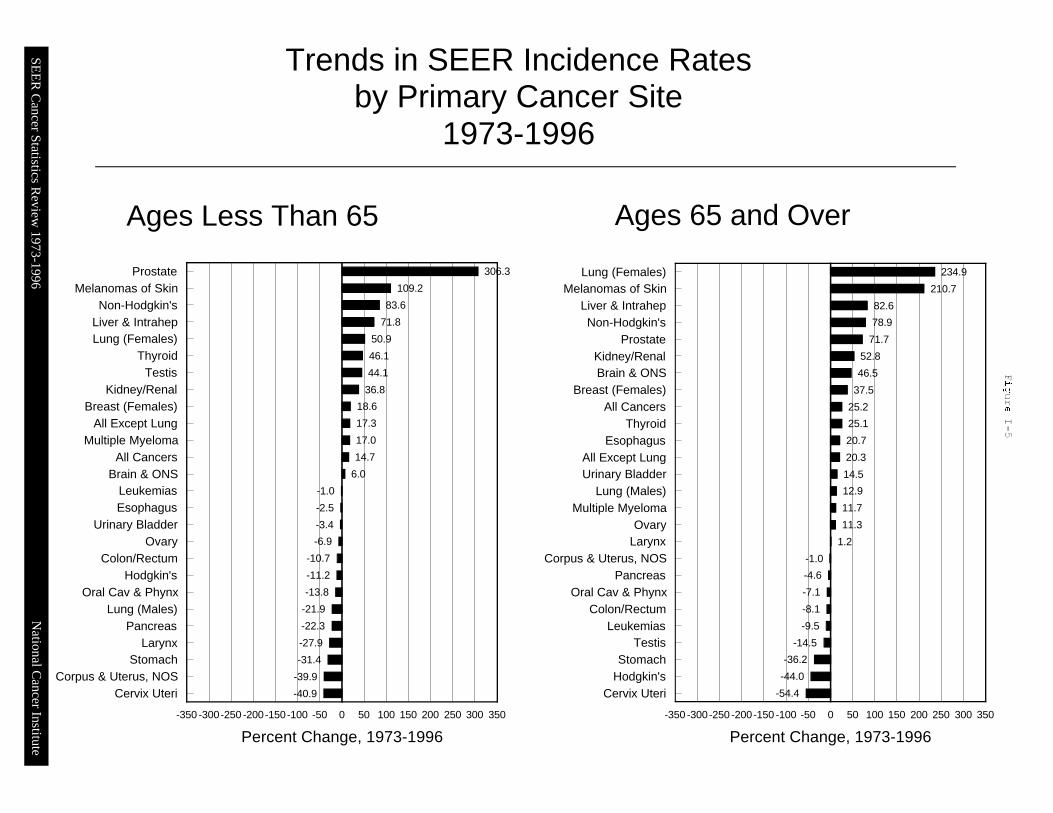
SEER C
ancer Statistics Review
1973-1996
Trends in SEER Incidence Ratesby Primary Cancer Site
1973-1996
Ages Less Than 65
306.3
109.2
83.6
71.8
50.9
46.1
44.1
36.818.6
17.3
17.0
14.7
6.0
-1.0
-2.5
-3.4-6.9
-10.7
-11.2
-13.8
-21.9
-22.3
-27.9
-31.4
-39.9
-40.9
ProstateMelanomas of Skin
Non-Hodgkin'sLiver & IntrahepLung (Females)
ThyroidTestis
Kidney/RenalBreast (Females)
All Except LungMultiple Myeloma
All CancersBrain & ONS
LeukemiasEsophagus
Urinary BladderOvary
Colon/RectumHodgkin's
Oral Cav & PhynxLung (Males)
PancreasLarynx
StomachCorpus & Uterus, NOS
Cervix Uteri
0 50 100 150 200 250 300 350-50-100-150-200-250-300-350
Percent Change, 1973-1996
Ages 65 and Over
234.9
210.7
82.678.9
71.7
52.8
46.5
37.5
25.225.1
20.7
20.3
14.512.9
11.7
11.3
1.2
-1.0-4.6
-7.1
-8.1
-9.5
-14.5-36.2
-44.0
-54.4
Lung (Females)Melanomas of Skin
Liver & IntrahepNon-Hodgkin's
ProstateKidney/RenalBrain & ONS
Breast (Females)All Cancers
ThyroidEsophagus
All Except LungUrinary Bladder
Lung (Males)Multiple Myeloma
OvaryLarynx
Corpus & Uterus, NOSPancreas
Oral Cav & PhynxColon/Rectum
LeukemiasTestis
StomachHodgkin's
Cervix Uteri
0 50 100 150 200 250 300 350-50-100-150-200-250-300-350
Percent Change, 1973-1996
National C
ancer Institute

SEER C
ancer Statistics Review
1973-1996
Trends in U.S. Mortality Ratesby Primary Cancer Site
1973-1996
Ages Less Than 65
64.7
47.718.7
15.2
9.2
4.8
3.2
-4.7
-11.1
-12.8-15.7
-17.6
-17.9
-18.1
-20.8
-23.6
-26.9
-28.9-33.0
-33.3
-34.1
-39.0
-39.1
-45.0
-66.1
-69.7
Lung (Females)Liver & Intrahep
Multiple MyelomaNon-Hodgkin's
Melanomas of SkinKidney/Renal
EsophagusProstate
Brain & ONSAll Cancers
PancreasLung (Males)
All Except LungBreast (Females)
LarynxLeukemias
Colon/RectumThyroid
Urinary BladderOvary
Oral Cav & PhynxCorpus & Uterus, NOS
StomachCervix Uteri
Hodgkin'sTestis
0 50 100 150 200 250 300 350-50-100-150-200-250-300-350
Percent Change, 1973-1996
Ages 65 and Over
265.5
85.5
70.0
67.252.8
45.3
36.0
30.6
30.3
19.115.6
15.3
9.37.7
3.7
1.6
0.4
-17.6
-18.4-20.6
-21.4
-22.2
-42.0
-51.5-60.5
-71.9
Lung (Females)Melanomas of Skin
Non-Hodgkin'sBrain & ONS
Liver & IntrahepMultiple Myeloma
EsophagusKidney/RenalLung (Males)
OvaryAll Cancers
ProstateLeukemias
Breast (Females)Pancreas
All Except LungLarynx
ThyroidCorpus & Uterus, NOS
Colon/RectumUrinary Bladder
Oral Cav & PhynxStomach
Cervix UteriHodgkin's
Testis
0 50 100 150 200 250 300 350-50-100-150-200-250-300-350
Percent Change, 1973-1996
National C
ancer Institute

SEER C
ancer Statistics Review
1973-1996
Trends in SEER Incidence Ratesby Primary Cancer Site
1973-1996
All Races, Males
170.6
111.9
94.9
86.2
41.5
39.8
31.4
27.1
24.6
19.4
18.9
12.1
6.1
-2.5
-7.1
-7.6
-15.5
-18.6
-20.3
-23.0
-33.5
Melanomas of Skin
Prostate
Non-Hodgkin's
Liver & Intrahep
Testis
Kidney/Renal
All Except Lung
Thyroid
All Cancers
Multiple Myeloma
Brain & CNS
Esophagus
Urinary Bladder
Lung (Males)
Colon/Rectum
Leukemias
Oral Cav & Phynx
Pancreas
Larynx
Hodgkin's
Stomach
0 50 100 150 200 250-50-100-150-200-250
Percent Change, 1973-1996
All Races, Females
123.0
103.7
63.2
57.4
50.8
49.8
25.3
13.7
12.6
12.5
6.9
6.4
4.0
-0.7
-2.7
-3.5
-3.6
-4.2
-9.3
-12.0
-27.4
-36.8
-44.0
Lung (Females)Melanomas of Skin
Non-Hodgkin'sLiver & Intrahep
Kidney/RenalThyroid
Breast (Females)All Cancers
Urinary BladderBrain & CNS
Multiple MyelomaAll Except Lung
LarynxOvary
EsophagusLeukemias
Oral Cav & PhynxPancreasHodgkin's
Colon/RectumCorpus & Uterus, NOS
StomachCervix Uteri
0 50 100 150 200 250-50-100-150-200-250
Percent Change, 1973-1996
National C
ancer Institute

SEER C
ancer Statistics Review
1973-1996
Trends in U.S. Mortality Ratesby Primary Cancer Site
1973-1996
All Races, Males
59.5
50.1
46.2
35.8
24.4
16.8
13.0
10.4
8.9
1.1
0.5
-2.3
-5.1
-12.8
-17.9
-18.3
-23.7
-32.2
-41.2
-66.7
-70.0
Liver & Intrahep
Melanomas of Skin
Non-Hodgkin's
Multiple Myeloma
Esophagus
Kidney/Renal
Prostate
Brain & CNS
Lung (Males)
All Cancers
Thyroid
All Except Lung
Leukemias
Pancreas
Colon/Rectum
Larynx
Urinary Bladder
Oral Cav & Phynx
Stomach
Hodgkin's
Testis
0 50 100 150 200-50-100-150-200
Percent Change, 1973-1996
All Races, Females
148.3
42.7
37.4
37.3
36.6
22.0
18.6
12.2
7.1
6.4
3.8
-7.1
-7.5
-10.2
-11.2
-21.7
-21.8
-26.7
-27.6
-32.3
-41.3
-47.3
-60.7
Lung (Females)Non-Hodgkin's
Multiple MyelomaLarynx
Liver & IntrahepKidney/Renal
Melanomas of SkinBrain & CNS
PancreasAll CancersEsophagusLeukemias
Breast (Females)All Except Lung
OvaryUrinary Bladder
Oral Cav & PhynxCorpus & Uterus, NOS
Colon/RectumThyroid
StomachCervix Uteri
Hodgkin's
0 50 100 150 200-50-100-150-200
Percent Change, 1973-1996
National C
ancer Institute

SEER C
ancer Statistics Review
1973-1996
SEER Incidence and U.S. Mortality Rates (1992-1996)5-Year Relative Survival Rates (1989-1995)
All Cancers Combined, by Race and Sex
SEER Incidence U.S. Mortality 0
50
100
150
200
250
300
350
400
450
500
550
600
650Rate per 100,000
Blacks Whites
Males
SEER Incidence U.S. Mortality 0
50
100
150
200
250
300
350
400
450
500
550
600
650Rate per 100,000
Blacks Whites
Females
Rates are per 100,000 persons and age-adjusted to 1970Relative survival rates are expressed as percents
Black White 0
10
20
30
40
50
60
Percent (%)
Black White 0
10
20
30
40
50
60
Percent (%)
Survival, 1989-1995 Survival, 1989-1995
National C
ancer Institute
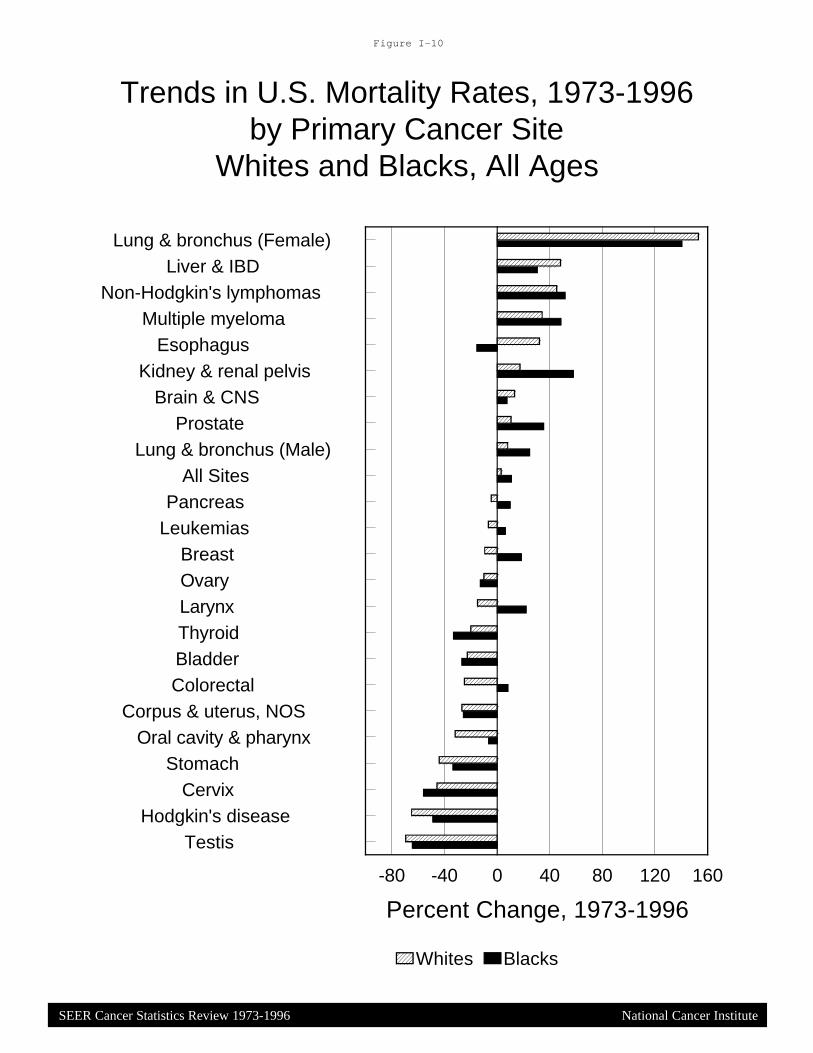
SEER Cancer Statistics Review 1973-1996
Figure I-10
Trends in U.S. Mortality Rates, 1973-1996by Primary Cancer Site
Whites and Blacks, All Ages
Lung & bronchus (Female) Liver & IBD
Non-Hodgkin's lymphomas Multiple myeloma
Esophagus Kidney & renal pelvis
Brain & CNS Prostate
Lung & bronchus (Male) All Sites
Pancreas Leukemias
Breast Ovary Larynx Thyroid Bladder Colorectal
Corpus & uterus, NOS Oral cavity & pharynx
Stomach Cervix
Hodgkin's disease Testis
0 40 80 120 160-40-80
Percent Change, 1973-1996
Whites Blacks
National Cancer Institute

SEER Cancer Statistics Review 1973-1996
SEER Cancer Incidence and U.S. Mortality Rates, 1992-1996Ratio of Black Rate to White Rate
All Ages
Figure I-11
1.51.6
1.72.42.3
1.91.4
0.71.71.61.5
1.11.1
0.90.6
0.81.21.1
0.50.80.70.70.6
0.20.1
2.52.32.32.3
2.22.2
1.91.9
1.51.5
1.41.31.3
1.21.01.01.01.0
0.90.9
0.80.7
0.50.3
0.2
Incidence Cancer Site Mortality
Ratio: (Black Rate)/(White Rate)Rates are Age-adjusted to 1970 Standard.
National Cancer Institute
LarynxProstate
Multiple MyelomaStomach
Oral Cav & PhynxCorpus & Uterus,NOS
Liver & IntrahepPancreas
Lung (Males)All Cancers
Colon/RectumBreast (Females)
Kidney/Renal
ThyroidHodgkin's
Lung (Females)Urinary Bladder
LeukemiasOvary
Non-Hodgkin'sBrain & ONS
TestisMelanomas of Skin
EsophagusCervix Uteri

SEER Cancer Statistics Review 1973-1996
Figure I-12
5-Year Relative Survival RatesSEER Program, 1989-1995
Males and Females
National Cancer Institute
White Patients Cancer Site Black Patients9695938886858382
7166626160565250
443028
191413
64
Larynx
Prostate
Multiple MyelomaStomach
Oral Cav & Phynx
Corpus & Uterus,NOS
Liver & IntrahepPancreas
Rectum
Colon
Breast (Females)
Kidney/Renal
Testis
Hodgkin's
Lung & Bronchus
Urinary Bladder
LeukemiasOvary
Non-Hodgkin's
Brain & ONS
Thyroid
Melanomas of Skin
Esophagus
Cervix Uteri
8889
846871
5676
6259
5352
5851
3441
4733
3931
22119
34

SEER C
ancer Statistics Review
1973-1996
' ''' '
''
# ## # # # #))
) ) ) ) )
,,
, ,,
,,
""
" " " " "
1990 1992 1994 1996Year of Diagnosis
0
50
100
150
200
250
300Rate per 100,000
Prostate Lung Colon & Rectum
^^^ Hispanic is not mutually exclusive from whites, blacks, Asian/Pacific Islanders, and American Indians/Native Alaskans.*** Asian/Pacific Islander populations are unadjusted Census Bureau estimates. Data Source: SEER 11
SEER Incidence 1990-1996Males by Race/Ethnicity
National C
ancer Institute
''
' '' '
'
# ##
# # # #) ))
) ))
)
,
,,
,,
,
,
" "
"
"
"
""
1990 1992 1994 1996Year of Diagnosis
0
50
100
150
200
250
300Rate per 100,000
''' '
' ' '
# ## # # # #) )) ) ) ) )
, ,, , , , ,"
"" " " " "
1990 1992 1994 1996Year of Diagnosis
0
50
100
150
200
250
300Rate per 100,000
Black, Hispanic ^^^) # Asian/Pacific Islander*** American Indian/Alaskan Native'" White

SEER C
ancer Statistics Review
1973-1996
''
' ''
' '
# ## # # # #))
) ) )) )
, ,, , , ,," "" " " " "
1990 1992 1994 1996Year of Diagnosis
0
20
40
60
80
100
120Rate per 100,000
Breast Lung Colon & Rectum
SEER Incidence 1990-1996Females by Race/Ethnicity
National C
ancer Institute
'
'
'
''
''
##
## # #
#)
)) )
)) )
,,,
, , , ,
" "" " " " "
1990 1992 1994 1996Year of Diagnosis
0
20
40
60
80
100
120Rate per 100,000
' ''
' ' '
# ## # # # #)
)) ) ) ) )
,,, , , , ,
""
" " " " "
1990 1992 1994 1996Year of Diagnosis
0
20
40
60
80
100
120Rate per 100,000
^^^ Hispanic is not mutually exclusive from whites, blacks, Asian/Pacific Islanders, and American Indians/Native Alaskans.*** Asian/Pacific Islander populations are unadjusted Census Bureau estimates. Data Source: SEER 11
Black, Hispanic ^^^) # Asian/Pacific Islander*** American Indian/Alaskan Native'" White
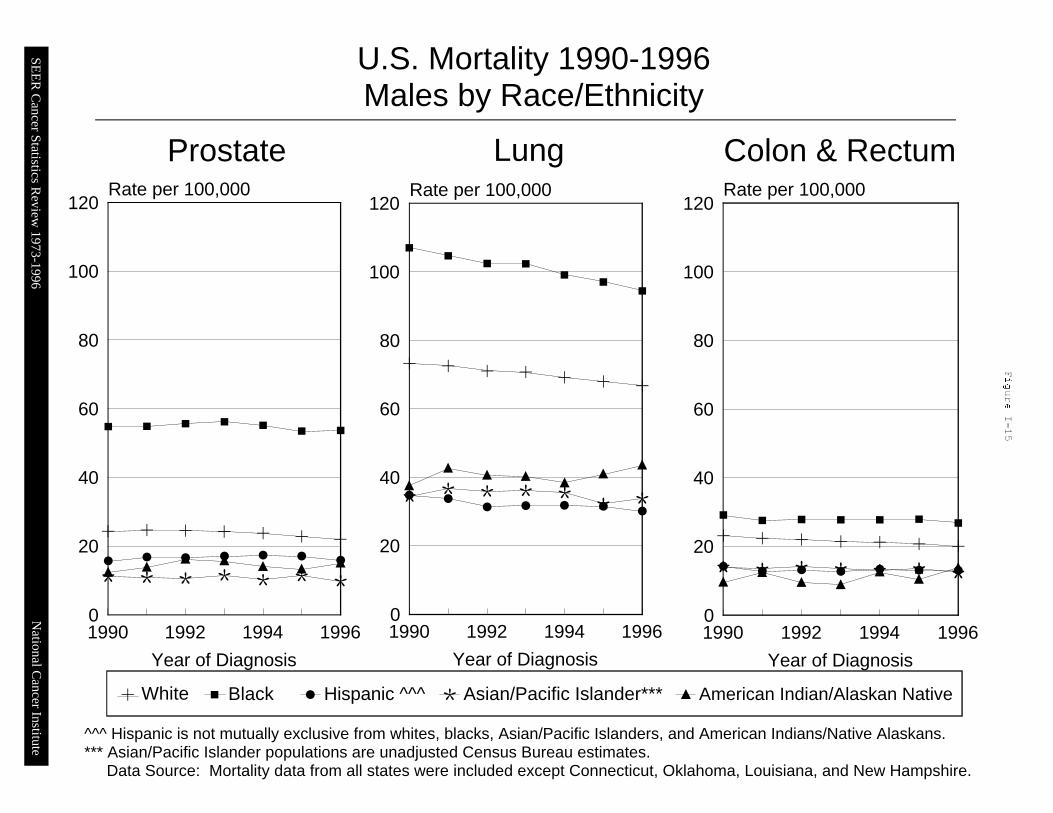
SEER C
ancer Statistics Review
1973-1996
''' ' ' ' '
# ## # # ##)
)) ) ) ) )
,
,
, , ,, ,
""
" " " " "
1990 1992 1994 1996Year of Diagnosis
0
20
40
60
80
100
120Rate per 100,000
Prostate Lung Colon & Rectum
U.S. Mortality 1990-1996Males by Race/Ethnicity
National C
ancer Institute
' '' ' ' ' '# ## # # # #) )) ) ) ) )
, ,, , , , ,
" "" " " " "
1990 1992 1994 1996Year of Diagnosis
0
20
40
60
80
100
120Rate per 100,000
'''
' '' '
# ## # # # #) )) ) ) ) )
, ,, , , , ,"
"" " " " "
1990 1992 1994 1996Year of Diagnosis
0
20
40
60
80
100
120Rate per 100,000
^^^ Hispanic is not mutually exclusive from whites, blacks, Asian/Pacific Islanders, and American Indians/Native Alaskans.*** Asian/Pacific Islander populations are unadjusted Census Bureau estimates. Data Source: Mortality data from all states were included except Connecticut, Oklahoma, Louisiana, and New Hampshire.
Black, Hispanic ^^^) # Asian/Pacific Islander*** American Indian/Alaskan Native'" White

SEER C
ancer Statistics Review
1973-1996
'
'
''
''
'
# ## # # #
#
) )) ) ) ) )
,,
,,
, , ,"
"
" " " " "
1990 1992 1994 1996Year of Diagnosis
0
10
20
30
40Rate per 100,000
Breast Lung Colon & Rectum
U.S. Mortality 1990-1996Females by Race/Ethnicity
National C
ancer Institute
'
'
'
''
' '# #
## #
# #
))) ) ) ) )
, ,, , , , ,
"
"
" " " " "
1990 1992 1994 1996Year of Diagnosis
0
10
20
30
40Rate per 100,000
'''
''
''
# ## # # ##)
)) ) ) ) )
,,
, , , , ,
""
" " " " "
1990 1992 1994 1996Year of Diagnosis
0
10
20
30
40Rate per 100,000
Black, Hispanic ^^^) # Asian/Pacific Islander*** American Indian/Alaskan Native'" White
^^^ Hispanic is not mutually exclusive from whites, blacks, Asian/Pacific Islanders, and American Indians/Native Alaskans.*** Asian/Pacific Islander populations are unadjusted Census Bureau estimates. Data Source: Mortality data from all states were included except Connecticut, Oklahoma, Louisiana, and New Hampshire.

SEER C
ancer Statistics Review
1973-1996
Melanomas of skin Prostate
Non-Hodgkin's lymphomas Liver & IBD
Kidney & renal pelvis Thyroid Testis
Lung & bronchus Breast All Sites
All Sites ex Lung & bronchus Brain & CNS
Multiple myeloma Esophagus
Bladder Ovary
Leukemias Colorectal
Oral cavity & pharynx Pancreas
Larynx Hodgkin's disease
Corpus & uterus, NOS Stomach
Cervix
0 25 50 75 100 125 150 175 200 225 250 275 300 325 350-25-50
Percent change (%)
BURDEN RISKU.S. Incidence estimates based on SEERage-specific rates applied to U.S. population
Incidence Percent Change, 1973 to 1996Numbers (burden) vs. Rates (risk)
All Ages
National C
ancer Institute

SEER C
ancer Statistics Review
1973-1996
2236826
756377358350311275
22718817216813813812912611710695
3812
Lung & Bronchus Breast
Colon/Rectum Pancreas
Non-Hodgkin'sLeukemias
Prostate Brain & ONS
Ovary Stomach
Kidney/Renal Esophagus
Melanomas of Skin Multiple Myeloma Oral Cav & Phynx
Urinary Bladder Cervix Uteri
ChildhoodCorpus & Uterus, NOS
Hodgkin'sTestis
0 500 1000 1500 2000 2500 3000
Years in Thousands
Person-Years of Life LostDue to Cancer, All Races
Both Sexes, 1996
Estimates produced using 1992 Life Tables
69.035.2
26.925.7
22.219.219.0
17.217.116.515.715.515.115.014.914.714.113.813.513.3
11.09.1
ChildhoodTestis
Hodgkin'sCervix Uteri
Brain & ONSBreast
Melanomas of SkinOvary
LeukemiasOral Cav & Phynx
Non-Hodgkin'sKidney/Renal
All CancersCorpus & Uterus, NOS
EsophagusLung & Bronchus
StomachPancreas
Multiple MyelomaColon/Rectum
Urinary BladderProstate
0 10 20 30 40 50 60 70 80
Years
Average Years of Life LostPer Person Dying of CancerAll Races, Both Sexes, 1996
National C
ancer Institute

SEER C
ancer Statistics Review
1973-1996 12.0
8.5
8.2
3.1
1.7
1.3
0.9
All Other Causes
Heart Disease
Cancer
Accidents
Cerebrovascular
Pneumonia & Influenza
Bronchitis, Emphysema,
0 2 4 6 8 10 12 14 16
Years in Millions
Person-Years of Life LostDue to Major Causes of Death in U.S.
All Races, Both Sexes, 1996
Estimates produced using 1992 Life Tables
32.2
20.1
15.4
15.1
11.8
11.6
10.8
10.5
Accidents
All Other Causes
Total Mortality
Cancer
Bronchitis, Emphysema,
Heart Disease
Cerebrovascular
Pneumonia & Influenza
0 10 20 30 40
Years
Average Years of Life LostPer Person Due to Major Causes of Death in U.S.
All Races, Both Sexes, 1996
and Asthma
and Asthma
National C
ancer Institute