b&a%20consumer%20confidence%20tracker%20feb%2014
DESCRIPTION
http://banda.ie/assets/files/pdf/B&A%20Consumer%20Confidence%20Tracker%20Feb%2014.pdfTRANSCRIPT

Consumer Confidence Tracker February 2014 PREPARED BY: Luke Reaper and Ciara McCarthy Behaviour & Attitudes J.5268

2
Introduction
This report presents the findings of the latest phase of the Behaviour &
Attitudes’ Consumer Confidence Tracker.
Survey results for this phase are based on a sample of 1,006 adults aged
16+, quota controlled in terms of age, gender, socio-economic class and
region to reflect the profile of the adult population of the Republic of
Ireland.
All interviewing on the survey is conducted on our fortnightly face-to-face
Barometer by trained members of the B&A field force working under
ESOMAR guidelines.
Fieldwork on the latest wave was carried out between 27th January - 5th
February 2014.

3
About Behaviour & Attitudes
Behaviour and Attitudes is Ireland’s largest and most experienced
independently owned research company.
We pride ourselves on having the most experienced director team
in Ireland. All projects have a director involved.
Established over 25 years ago, Behaviour and Attitudes provides a full
range of market research services, ranging from CAPI, CATI, online and of
course qualitative.
Specialist sectors include: Retail & Shopper, Technology & Telecoms, Media,
Financial, Political & Social, Polling, Automotive, Healthcare and Public
Sector & Utilities.
For more information please visit our website at: www.banda.ie or contact
us on +353 1 2057500.

Findings

5
Summary
The momentum for recovery appears to have accelerated in this wave, with almost 1 in 3 agreeing that the country is better off now than it was a year ago. Consumers are as confident about the future of the Irish Economy as they were in pre recessionary times.
The gap between Dublin and outside Dublin in terms of positive sentiment towards the economy still exists, with Dublin still registering more positive scores. Both regions registered an increase in confidence this wave.
A large proportion of this increase in consumer confidence can be attributed to greater stability in personal finances. Overall, it appears that 18-34, middle class consumers are the most positive about the economy.
In terms of savings, stablisation in ability to save in the forthcoming year is evident. In line with the last wave more positivity in terms of saving and ability to save in Dublin is evident, with the gap widening versus outside Dublin.

6
Summary
While there is clear evidence of buoyancy in the Irish economy, this does not appear to have translated across to the spending habits of Dubliners.
Dubliners are much more cautious in terms of their propensity to purchase goods throughout the oncoming year in comparison to those residing outside Dublin.
This may be attributed to the higher costs associated with living in the city and the recent evidence of increasing house and rent prices.
In addition, those who live in Dublin appear to be less confident about their personal finances for the oncoming year than those residing outside Dublin. This shows that Dubliners are particularly cautious irrespective of the fact that consumers appear more confident than ever about the future of the Irish economy.

7
Summary
The table below summarises the net scores for each element of the February
survey, alongside those from previous waves since 2011.
Pre 2008 Historic Low
2011 2012 2013 2014
Date Net
Score Net Scores Net Scores Net Scores
Net Scores
Date Score Jan April July Nov Mar May Sept Nov Feb Apr July Sept Dec Feb
% % % % % % % % % % % % % % % %
Economy - looking back a year
Nov '02 -62 -86 -72 -59 -69 -64 -56 -57 -62 -51 -53 -46 -27 -31 -7
Economy - looking forward one year
Nov '02 -63 -70 -58 -45 -64 -52 -44 -50 -60 -39 -44 -36 -18 -25 -4
Personal income - looking back a year
Nov '02 -40 -72 -64 -50 -59 -61 -56 -52 -60 -52 -55 -47 -38 -44 -36
Personal income - looking forward a year
Nov '02 -20 -69 -55 -43 -57 -50 -49 -52 -52 -48 -54 -47 -34 -35 -37
Personal assets - looking forward one year
Jan'02 -2 -50 -44 -31 -41 -39 -28 -31 -33 -21 -29 -20 -10 -9 -8
Purchasing intentions - the year ahead
Nov '02 -24 -67 -55 -37 -51 -46 -40 -44 -48 -43 -43 -40 -29 -29 -30
Savings - the year ahead
Nov '02 -35 -60 -54 -39 -50 -51 -42 -45 -52 -44 -48 -44 -31 -34 -33
Consumer confidence in the return of the economy has improved to 2005 levels. Contrastingly, personal income, purchasing and savings intentions scores for the
oncoming year remain more or less unchanged since December 2013 and in negative territory.

8 Q.1 Thinking about the economy as a whole, do you think that the country is better off, worse off, or about the same as last year?
Economy – Looking Back
Better off Same Worse off
COUNTRY IS NOW …
53%
66%
35% 26% 23%
28%
70%
91%
76% 76% 66%
54%
70% 62% 64% 67%
60% 62% 55%
45% 47%
34%
34%
27%
42%
45% 46%
50%
23%
7%
18% 19%
27%
34%
24% 29% 28%
28%
31% 28% 35%
38% 37%
39%
13% 7%
23% 29% 31%
22%
6% 2% 5% 5% 7%
12% 6% 8% 8% 5%
9% 9% 10% 18% 16%
27%
LONG TERM 2012
Gap -40 -59 -13 +3 +8 -6 -64 -89 -71 -71 -59 -42 -64 -56 -57 -62 -51 -53 -46 -27 -31 -7
2013
2002 2003 2004 2005 2006 2007 2008 2009 2010 2011 2012 2013 Mar May Sept Nov Feb April July Sept Dec Feb
The momentum for recovery appears to have accelerated in this wave, with almost 1 in 3 agreeing that the country is better off now than it was a year ago. Consumers are as confident as they were in pre recessionary times.
2014

9
-88 -93 -91
-86 -81
-50
-82
-86
-72 -59
-69 -64
-56 -57 -62
-51 -53
-46
-27 -31
-7
-74 -76
-65
-58 -54
-20
-74 -70
-58
-45
-64
-52
-44 -50
-60
-39 -44
-36
-18
-25
-4
-100
-90
-80
-70
-60
-50
-40
-30
-20
-10
0
10
Mar May Sept Nov Mar July Nov Jan Apr July Nov Mar May Sept Nov Feb Apr July Sept Dec Feb
Looking Back
Looking Forward
The Future: Psychologically, we are clearly ready to move on in 2014
Balance +/-
2009 2010 2011 2012
Initial shock!
But widespread belief that:
This was a ‘speedbump’
Things would return to ‘normal’
Spending reined in – but not in any planned or strategic manner
Despair! (IMF Bailout)
Spending habits and behaviour changing for good
Value sought everywhere
Readjustment
People adjusting to ‘new reality’
Less focus on (or interest in) doom and gloom
Source: B&A Consumer Confidence Report
2013
Movement towards positivity
A significant uplift in the consumer mood vs last year.
Gap between Dublin vs outside Dublin still remains.
Q.1 Thinking about the economy as a whole, do you think that the country is better off, worse off, or about the same as last year?
Q.2 And what about the coming year, do you think that the country will be better off, worse off or about the same as this year?
Dublin +7 Outside -9
Dublin +6 Outside -12
2014

10
Economy – Looking Forward
Better off
Same
Worse off
Country will be …
Q.2 And what about the coming year, do you think that the country will be better off, worse off or about the same as this year?
49%
59%
37%
27% 26% 34%
67% 74%
61% 67%
61%
48%
61% 55%
61% 66%
53% 55% 50%
37% 42%
32%
38%
32%
43%
48% 48%
47%
25%
20%
27%
24% 30%
37%
30% 33%
28%
28%
32% 33%
36%
43% 40%
41%
13% 9% 20%
25% 26% 19%
8% 6% 12% 9% 9%
15% 9% 11% 11%
6% 14% 12% 14%
20% 18%
27%
Gap -36 -50 -17 -2 = -15 -59 -68 -49 -58 -52 -32 -52 -44 -50 -60 -39 -44 -36 -18 -25 -4
While still in the negative, belief in the future of the Irish economy has vastly improved throughout this wave. Interestingly, the last time Irish consumers
felt this way was in 2005 (pre recession).
LONG TERM 2012 2013
2002 2003 2004 2005 2006 2007 2008 2009 2010 2011 2012 2013 Mar May Sept Nov Feb April July Sept Dec Feb
2014

11
-40
-59
-13
3 8
-6
-64
-89
-71 -71
-59
-42
-64
-56 -57 -62
-51 -55
-46
-27 -31
-7
-36
-50
-17
-2 0
-15
-59
-68
-49
-58 -52
-32
-52
-44 -50
-60
-39 -44
-36
-18 -25
-4
-100
-90
-80
-70
-60
-50
-40
-30
-20
-10
0
10
2002 2003 2004 2005 2006 2007 2008 2009 2010 2011 2012 2013 Mar May Sept Nov Feb Apr July Sept Dec Feb
Looking Back
Looking Forward
Balance Of Opinion - Economy
Balance +/-
YEARLY AVERAGES 2012
Long Term Short Term
2013
When viewed longitudinally a pattern of consistent improvement has been noted over the past three years.
2014

12
Economy – Looking Forward x Demographics Country will be …
Q.2 And what about the coming year, do you think that the country will be better off, worse off or about the same as this year?
Better off Same Worse off
27 30 24
33 23 26
33 24 22
38
26 27
12
23
41 39 43
41
40 41
42
38
53 30
40
50
45
45
32 31 32 26
37 33 25
38
25 32 34
23
42
32
gap -4 -1 -8 8 -14 -7 8 -15 -2 7 -8 4 -30 -9
Total Age Social Class Region
Male Female 18-34 35-54 55+ ABC1 C2DE F Dublin Lein-ster
Mun-ster
Conn/Ulster
Any Outside Dublin
Base: 1006 489 517 340 368 298 455 483 68 304 239 286 177 702
% % % % % % % % % % % % % %
Gender
February 2014
A socio-economic and regional divide in terms of recovery still exists.

13
Economy – Looking Forward Trended x Region Base: All adults 18+
-44
-61
-42
-32 -30
-4
-20
7
-52
-60
-38
-48
-39
-23
-36
-9
-70
-65
-60
-55
-50
-45
-40
-35
-30
-25
-20
-15
-10
-5
0
5
10
Sep 12 Nov 12 Feb-13 Apr-13 Jul-13 Sep-13 Nov-13 Feb-14
Dublin
Outside Dublin
Q.1 Thinking about the economy as a whole, do you think that the country is better off, worse off, or about the same as last year?
Balance +/-
2012 2013
The gap between Dublin and outside still exists, however both registered
a dramatic increase in
confidence this wave. Dublin
has finally left negative territory.
2014

14 Q.3 Do you feel better off financially, worse off financially or about the same compared to last year?
Personal Finances – Looking Back
Better off Same
Worse off
Now feel …
38% 44%
32%
24% 22% 20%
44%
65% 62% 66% 62%
54%
66% 61% 59%
64% 58% 61%
53% 47%
51% 47%
47%
45%
47%
51% 52% 56%
46%
32% 33% 30%
33%
39%
29% 34%
35%
32%
36% 33%
40%
45% 42%
42%
15% 11%
21% 25% 26% 24%
9% 2% 4% 5% 5% 7% 5% 5% 7% 4% 6% 6% 7% 9% 7% 11%
Gap -23 -34 -11 +1 +4 +4 -35 -63 -58 -61 -57 -47 -61 -56 -52 -60 -52 -55 -47 -38 -44 -36
LONG TERM 2012 2013
2002 2003 2004 2005 2006 2007 2008 2009 2010 2011 2012 2013 Mar May Sept Nov Feb April July Sept Dec Feb
2014

15 Q.3 Do you feel better off financially, worse off financially or about the same compared to last year?
Personal Finances – Looking Back x demographics
Better off Same
Worse off
Now feel …
11 13 9 18
8 6 13 10 9
14 7
12 8 9
47 45 49 40
52 50
41 54
37
52
47 41 49 45
42 43 42 42 40 44 47 37
54
34
45 47 43 45
Gap -36 -32 -40 -22 -44 -44 -28 -44 -29 -38 -40 -28 -41 -36
Total Age Social Class Region
Male Female 18-34 35-54 55+ ABC1 C2DE F Dublin Lein-ster
Mun-ster
Conn/Ulster
Any Outside Dublin
Base: 1006 489 517 340 368 298 455 483 68 304 239 286 177 702
% % % % % % % % % % % % % %
Gender
February 2014

16
Personal Finances - Looking Back x Region Base: All adults 18+
-42
-55
-56
-50
-49
-36
-45
-38
-56 -61
-50
-57
-46 -39 -44
-36
-70
-65
-60
-55
-50
-45
-40
-35
-30
-25
-20
-15
-10
-5
0
5
10
Sep 12 Nov 12 Feb-13 Apr-13 Jul-13 Sep-13 Dec-13 Feb-14
Dublin
Outside Dublin
Q.3 Do you feel better off financially, worse off financially or about the same compared to last year?
Balance +/-
Those living outside Dublin
feel slightly more positive about their personal finances this
wave in comparison to
last.
Balance +/-
2012 2013 2014

17
Q.5 Do you expect your income in the next year, after inflation and taxes,
to be higher, lower or the same as in the last twelve months?
Personal Finances – Looking Forward
Higher The same Lower
Expect it to be …
24% 27%
17% 13% 12% 13%
34%
64% 57%
63% 59%
51% 58% 56% 59% 59%
55% 60%
53%
44% 44% 45%
54% 54%
58% 58%
58% 59%
52%
30%
35% 31%
34%
41% 35% 37% 34% 34%
38% 34%
41%
46% 47% 46%
22% 22% 25% 25%
30% 28%
13% 5% 7% 7% 7% 8% 8% 7% 7% 7% 7% 6% 6%
10% 9% 9%
Gap -2 -8 +8 +16 +18 +15 -21 -59 -50 -56 -51 -44 -50 -49 -52 -52 -48 -54 -47 -34 -35 -37
For the last 3 waves, perceptions of personal finances have remained stable, which bodes well for the remainder of the year.
LONG TERM 2012 2013
2002 2003 2004 2005 2006 2007 2008 2009 2010 2011 2012 2013 Mar May Sept Nov Feb April July Sept Dec Feb
2014

18 Q.5 Do you expect your income in the next year, after inflation and taxes,
to be higher, lower or the same as in the last twelve months?
Personal Finances – Looking Forward x Demographics
Higher The same Lower
Expect it to be …
9 10 8 14
6 6 12
7 6 11 7 10 8 8
46 48 44
48
46 43
46 45 51 39 46
54
45 49
45 42 48
38 48 52
42 48
43 51 47
37 47 43
GAP -37 -33 -40 -24 -42 -46 -30 -41 -37 -40 -40 -27 -39 -35
Total Age Social Class Region Gender
February 2014
18-34s, the middle classes and Dubliners are more positive about their finances as they move forward.
Male Female 18-34 35-54 55+ ABC1 C2DE F Dublin Lein-ster
Mun-ster
Conn/Ulster
Any Outside Dublin
Base: 1006 489 517 340 368 298 455 483 68 304 239 286 177 702
% % % % % % % % % % % % % %

19
Personal Finances - Looking Forward x Region Base: All adults 18+
-43
-54 -54
-48
-53
-39
-27
-40
-55 -55
-45
-56
-44
-33
-39
-35
-70
-65
-60
-55
-50
-45
-40
-35
-30
-25
-20
-15
-10
-5
0
5
10
Sep 12 Nov 12 Feb-13 Apr-13 Jul-13 Sep-13 Dec-13 Feb-14
Dublin
Outside Dublin
Q.5 Do you expect your income in the next year, after inflation and taxes,
to be higher, lower or the same as in the last twelve months?
Balance +/-
Those living outside Dublin feel marginally more positive
about their personal
finances for the year ahead.
2012 2013 2014

20
Balance Of Opinion - Personal Finances
Balance +/-
-23
-34
-11
1 4 4
-35
-63 -58
-61 -57
-47
-61 -56
-52
-59
-52 -55
-47
-38 -44
-36
-2 -8
8
16 18 15
-21
-59
-50 -56
-51
-44 -50 -49
-52 -52 -48
-54
-47
-34 -35
-37
-75
-65
-55
-45
-35
-25
-15
-5
5
15
2002 2003 2004 2005 2006 2007 2008 2009 2010 2011 2012 2013 Mar May Sept Nov Feb Apr July Sept Dec Feb
Looking Back
Looking Forward
Long Term Short Term
Gains being made over time. However we are still in negative territory.
YEARLY AVERAGES 2012 2013 2014

21 Q.8 Do you expect to save more, less or the same amount in the year ahead compared with
the last twelve months?
Savings – Looking Forward
More The same Less
Expect to save …
36% 39%
25% 23% 19%
23%
44%
62% 55% 57%
54% 48%
57% 51% 51%
57% 51%
55% 50%
41% 42% 42%
51% 50%
58% 59% 63%
59%
46%
32% 37% 35%
39% 45%
36%
40% 43% 38%
42% 38% 45%
49% 50% 49%
13% 11% 17% 18% 18% 18%
10% 6% 7% 7% 7% 7% 6% 9% 6% 5% 7% 7% 5%
10% 8% 9%
Gap -23 -28 -8 -5 -1 -5 -34 -56 -48 -50 -48 -40 -51 -42 -45 -52 -44 -48 -44 -31 -34 -33
A stabilisation in the ability to save is evident.
LONG TERM 2012 2013
2002 2003 2004 2005 2006 2007 2008 2009 2010 2011 2012 2013 Mar May Sept Nov Feb April July Sept Dec Feb
2014

22 Q.8 Do you expect to save more, less or the same amount in the year ahead compared with the last twelve months?
Savings – Looking Forward
More The same Less
Expect to save …
9 9 8 16
5 5 10 9
4 13 9 8 4 7
49 52 46
49
46 51
52 45 57
49 50 50
45 49
42 39 46
35
49 44
38 46
40 38 42 42 51
44
GAP -33 -30 -37 -19 -44 -38 -28 -37 -36 -25 -33 -34 -47 -37
Total Age Social Class Region Gender
February 2014
Male Female 18-34 35-54 55+ ABC1 C2DE F Dublin Lein-ster
Mun-ster
Conn/Ulster
Any Outside Dublin
Base: 1006 489 517 340 368 298 455 483 68 304 239 286 177 702
% % % % % % % % % % % % % %

23 Q.8 Do you expect to save more, less or the same amount in the year ahead compared with
the last twelve months?
Savings – Looking Forward x Region
-29
-46
-47
-34 -35
-24 -20
-25
-50 -54
-43
-53
-48
-33
-40 -37
-70
-65
-60
-55
-50
-45
-40
-35
-30
-25
-20
-15
-10
-5
0
5
10
Sep 12 Nov 12 Feb-13 Apr-13 Jul-13 Sep-13 Nov-13 Feb-14
Dublin
Outside Dublin
Balance +/-
In terms of savings for the
year ahead, Dublin has
dipped slightly since Dec 2013.
2012 2013 2014
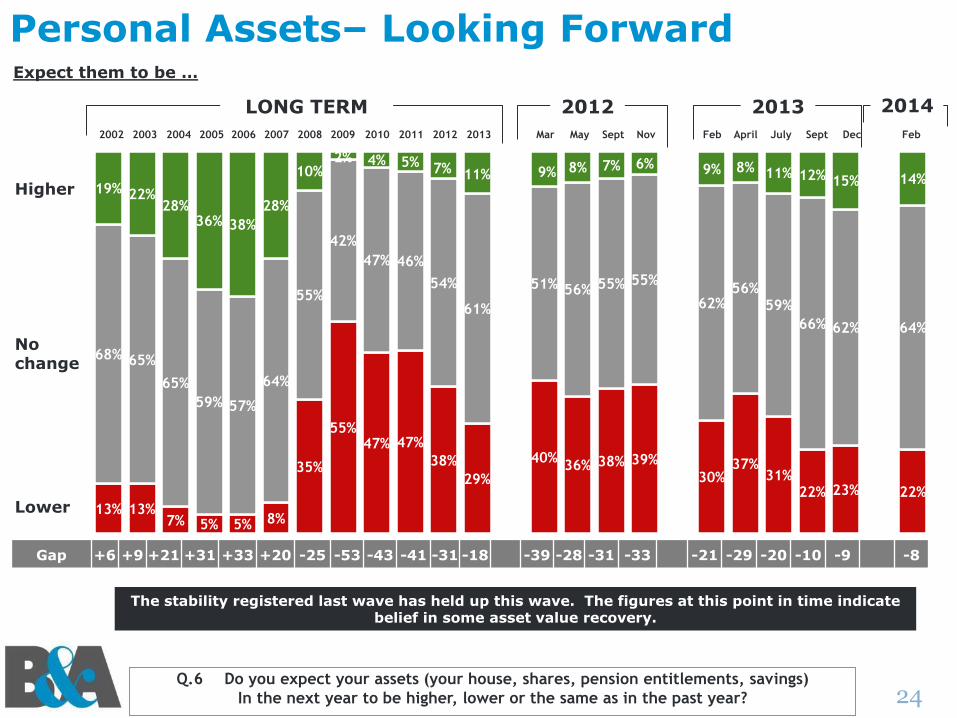
24 Q.6 Do you expect your assets (your house, shares, pension entitlements, savings)
In the next year to be higher, lower or the same as in the past year?
Personal Assets– Looking Forward
Higher
No change Lower
Expect them to be …
13% 13% 7% 5% 5% 8%
35%
55% 47% 47%
38%
29%
40% 36% 38% 39%
30% 37%
31% 22% 23% 22%
68% 65%
65%
59% 57%
64%
55%
42%
47% 46%
54%
61%
51% 56% 55% 55%
62% 56%
59%
66% 62% 64%
19% 22% 28%
36% 38%
28%
10% 2% 4% 5% 7% 11% 9% 8% 7% 6% 9% 8% 11% 12% 15% 14%
Gap +6 +9 +21 +31 +33 +20 -25 -53 -43 -41 -31 -18 -39 -28 -31 -33 -21 -29 -20 -10 -9 -8
The stability registered last wave has held up this wave. The figures at this point in time indicate belief in some asset value recovery.
LONG TERM 2012 2013
2002 2003 2004 2005 2006 2007 2008 2009 2010 2011 2012 2013 Mar May Sept Nov Feb April July Sept Dec Feb
2014

25 Q.6 Do you expect your assets (your house, shares, pension entitlements, savings)
In the next year to be higher, lower or the same as in the past year?
Personal Assets– Looking Forward
Higher
No change Lower
Expect them to be …
14 16 12 16 13 13 18
11 10 20
9 14 10 11
64 64 64
67 64 61
63
65 65
60
70 71
51
66
22 20 24 18
23 26 19
24 26 20 20
15
39
23
NET Diff -8 -4 -12 -2 -11 -14 -1 -13 -16 0 -11 -1 -29 -11
Total Age Social Class Region Gender
February 2014
Male Female 18-34 35-54 55+ ABC1 C2DE F Dublin Lein-ster
Mun-ster
Conn/Ulster
Any Outside Dublin
Base: 1006 489 517 340 368 298 455 483 68 304 239 286 177 702
% % % % % % % % % % % % % %

26 Q.6 Do you expect your assets (your house, shares, pension entitlements, savings)
In the next year to be higher, lower or the same as in the past year?
Personal Assets– Looking Forward x Region Expect them to be …
-25 -29
-18 -21
-12 -9
+2 0
-34 -33
-22
-32
-23
-11 -13 -11
-70
-65
-60
-55
-50
-45
-40
-35
-30
-25
-20
-15
-10
-5
0
5
10
Sep 12 Nov 12 Feb-13 Apr-13 Jul-13 Sep-13 Dec-13 Feb-14
Dublin
Outside Dublin
Balance +/-
Dublin has dipped slightly since the
last wave, however it still resists negative
territory.
2012 2013 2014

27 Q.7 In the year ahead, do you expect to purchase more, less or the same amount of goods and services
as in the past year?
Purchasing Goods And Services – Looking Forward
More The same Less
Expect to purchase …
26% 27%
18% 16% 14% 15%
39%
66%
52% 56%
50% 43%
51% 45%
49% 53%
49% 49% 45%
37% 37% 37%
58% 58%
64% 64% 65% 65%
50%
31%
42% 39%
45%
50%
44% 50%
46% 42%
46% 44% 49%
55% 55% 55%
16% 15% 18% 20% 21% 20%
10% 3% 5% 4% 5% 7% 5% 5% 5% 5% 6% 7% 6% 8% 8% 8%
Gap -10 -12 = +4 +7 +5 -29 -63 -47 -52 -45 -37 -46 -40 -44 -48 -43 -43 -40 -29 -29 -30
A stablisation in perceptions of purchasing next year (2008 levels) evident, despite a slight dent in economic perceptions. Note we are still in negative
territory.
LONG TERM 2012 2013
2002 2003 2004 2005 2006 2007 2008 2009 2010 2011 2012 2013 Mar May Sept Nov Feb April July Sept Dec Feb
2014

28
Balance Of Opinion – The Year Ahead Expectations in regard to assets value, purchases, and savings
Balance +/-
6 9
21
31 33
20
-25
-53
-43 -41
-31
-18
-39
-28 -31 -33
-21
-29
-20
-10 -9 -8 -10 -12 -12
4 7 5
-29
-63
-47 -52
-45
-37
-46 -40
-44 -48
-43 -43 -40
-29 -29 -30
-23 -28
-8 -5
-1 -5
-34
-56
-48 -50 -48
-40
-51
-42 -45
-52
-44 -48
-44
-31 -34 -33
-70
-60
-50
-40
-30
-20
-10
0
10
20
30
40
2002 2003 2004 2005 2006 2007 2008 2009 2010 2011 2012 2013 Mar May Sept Nov Feb Apr July Sept Dec Feb
Assets Value
Purchase
Savings
Long Term Short Term
Improvements are noted and momentum is slowly improving. However, any further imposition that directly affects real incomes of consumers will impact this area negatively.
Growth in personal financial situations continues to be finely balanced.
YEARLY AVERAGES 2012 2013 2014

29 Q.7 In the year ahead, do you expect to purchase more, less or the same amount of goods and services as in the past year?
Purchasing Goods And Services – Looking Forward
More The same Less
Expect to purchase …
8 8 8 14
4 4 10 7 6 9 7 10
3 7
55 56 54
54
55 55
55 53
66 49 55
62
53
57
37 36 39 32
41 40 35
41
29
42 38 28
44 36
GAP -30 -28 -31 -18 -36 -36 -25 -34 -23 -33 -31 -18 -41 -28
Total Age Social Class Region Gender
February 2014
Male Female 18-34 35-54 55+ ABC1 C2DE F Dublin Lein-ster
Mun-ster
Conn/Ulster
Any Outside Dublin
Base: 1006 489 517 340 368 298 455 483 68 304 239 286 177 702
% % % % % % % % % % % % % %

30 Q.7 In the year ahead, do you expect to purchase more, less or the same amount of goods and services as in the past year?
Purchasing Goods And Services – Looking Forward x Region Expect to purchase …
-41
-46
-48
-31 -34
-21 -24
-33
-45
-50
-42
-47
-42
-32 -31
-28
-70
-65
-60
-55
-50
-45
-40
-35
-30
-25
-20
-15
-10
-5
0
5
10
Sep 12 Nov 12 Feb-13 Apr-13 Jul-13 Sep-13 Dec-13 Feb-14
Dublin
Outside Dublin
Balance +/-
For the first time in 4
waves, outside Dublin is
showing more positive
indications of recovery
compared to Dublin.
2012 2013 2014

31
The New Reality of Recession: Discretionary Income Has Halved in 5 Years but decline appears to have largely abated (albeit a dent this wave) Base: All adults 18+
50.94
54.62 55.17
61.29
66.70
71.38
77.30
83.97
75.07
62.32
50.05
46.68 45.90 43.57
47.08 47.23
51.06
43.66 42.97
€0
€10
€20
€30
€40
€50
€60
€70
€80
€90
'01 '02 '03 '04 '05 '06 '07 '08 '09 '10 Apr'11
Jul'12
13 Feb'13
Apr'13
Jul'13
Sept'13
Dec'13
Feb-14
Q. About how much would you say you spend each week on things you buy for yourself including money spent on clothes, eating out, going for a drink, going to the cinema, gambling, sporting activities and so on?
Pre Xmas, Property Tax, etc.?
Long Term Short Term
Dublin ABC1F+ €55.98 Dublin C2DEF- €44.83 Outside Dublin AB1F+ €40.98 Outside Dublin C2DEF- €39.59
