b739: structure, conduct, and performance of the
TRANSCRIPT

The University of MaineDigitalCommons@UMaine
Bulletins Maine Agricultural and Forest Experiment Station
1977
B739: Structure, Conduct, and Performance of theCommercial Campground Industry in Maine PartI: Industry StructureLouis W. Pompi
George J. Seel
Follow this and additional works at: https://digitalcommons.library.umaine.edu/aes_bulletin
Part of the Economics Commons, and the Recreation Business Commons
This Report is brought to you for free and open access by DigitalCommons@UMaine. It has been accepted for inclusion in Bulletins by an authorizedadministrator of DigitalCommons@UMaine. For more information, please contact [email protected].
Recommended CitationPompi, Louis W. and Seel, George J.. 1977. B739: Structure, Conduct, and Performance of the Commercial Campground Industry inMaine Part I: Industry Structure. Maine Agricultural and Forest Experiment Station Bulletins .https://digitalcommons.library.umaine.edu/aes_bulletin/95

STRUCTURE, CONDUCT, AND PERFORMANCE OF THE
COMMERCIAL CAMPGROUND INDUSTRY IN MAINE
Part I: Industry Structure Louis W. Pompi and George J. Seel
LIFE SCIENCES AND AGRICULTURE EXPERIMENT STATION
UNIVERSITY OF MAINE AT ORONO
BULLETIN 739 MARCH 1977

ACKNOWLEDGMENTS
This research project was supported by funds provided through the Maine Life Sciences and Agriculture Experiment Station by the Hatch Act. The project was planned by Professor Donald Tobey, formerly Assistant Professor of Agricultural and Resource Economics, University of Maine.
The authors gratefully acknowledge the assistance of those campground owners who took the time to complete and return the questionnaires used to assemble data. Special thanks are due the Maine Campground Owners Association (MECOA) for their cooperation.
The assistance provided throughout the project, and in reviewing earlier drafts of this report , by Dr. Johannes Delphendahl, Professor; and Mr. Francis Montville, Extension Economist ; and the helpful comments on the manuscript by Dr. Wallace Dunham, Professor , all of the Department of Agricultural and Resource Economics, was greatly appreciated .
************** Part II of this study was published as Bulletin 741 in June, 1977. Copies may be obtained by writing to the Mail Room, PICS Building,
University of Maine, Orono, Maine 04473.

TABLE OF CONTENTS Page
INTRODUCTION . . . . . . . . . . . . . . . . . . . . . . . . . . . . . . . . . . . . . . 3 Objectives . . . . . . . . . . . . . . . . . . . . . . . . . . . . . . . . . . . . . . . . . 4 Structure, Conduct, and Performance: A Framework . . . . . . . . 5 Research Procedures . . . . . . . . . . . . . . . . . . . . . . . . . . . . . . . . . 6
STRUCTURE OF MAINE'S COMMERCIAL CAMPGROUND INDUSTRY ..... ... ... . .... ....... . .............. . 7 Industry Growth and Firm Size . . . . . . . . . . . . . . . . . . . . . . . . . 7 Campground Location . . . . . . . . . . . . . . . . . . . . . . . . . . . . . . . 8 Land , Capital, and Labor Inputs . . . . . . . . . . . . . . . . . . . . . . . . 11
Land Inputs . . . . . . . . . . . . . . . . . . . . . . . . . . . . . . . . . . . 11 Capital Inputs . . . . . . . . . . . . . . . . . . . . . . . . . . . . . . . . . . 17 Labor and Mangement Input . . . . . . . . . . . . . . . . . . . . . . . 25
Barriers to Market Entry . . . . . . . . . . . . . . . . . . . . . . . . . . . . . . 31 Minimum Capital Investment . . . . . . . . . . . . . . . . . . . . . . 32 Institutional Barriers . . . . . . . . . . . . . . . . . . . . . . . . . . . . . 33 Land Availability . . . . . . . . . . . . . . . . . . . . . . . . . . . . . . . . 33 Start-Up Period . . . . . . . . . . . . . . . . . . . . . . . . . . . . . . . . . 34
Facilities and Services . . . . . . . . . . . . . . . . . . . . . . . . . . . . . . . . 34 Camper Use . . . . . . . . . . . . . . . . . . . . . . . . . . . . . . . . . . . . . . . 37
Occupancy Rates .............. .. ....... .' . . . . . . . . 37 Seasonal Distribution of Camper Use . . . . . . . . . . . . . . . . . 39 Distribution of Camper Use by Days of the Week . . . . . . . . 39 Length of Stay of Campers . . . . . . . . . . . . . . . . . . . . . . . . . 39 Residence of Campers . . . . . . . . . . . . . . . . . . . . . . . . . . . . 40 Season Length . . . . . . . . . . . . . . . . . . . . . . . . . . . . . . . . . . 40
Market Concentration . . . . . . . . . . . . . . . . . . . . . . . . . . . . . . . 41 Firm Ownership Patterns .... . . ..... ................... 42
SUMMARY AND CONCLUSIONS . . . . . . . . . . . . . . . . . . . . . . . . 42 Industry Structure ...... .... ... ..... . ... . .. .... .... .
Growth and Size .......... ... ..... .... ... ...... . 42 43
Location . . . . . . . . . . . . . . . . . . . . . . . . . . . . . . . . . . . . . . 43 Land Inputs . . . . . . . . . . . . . . . . . . . . . . . . . . . . . . . . . . . 43 Capital Inputs . . . . . . . . . . . . . . . . . . . . . . . . . . . . . . . . . . 44 Labor and Management Inputs . . . . . . . . . . . . . . . . . . . . . 45 Barriers to Entry . . . . . . . . . . . . . . . . . . . . . . . . . . . . . . . . 45 Facilities and Services . . . . . . . . . . . . . . . . . . . . . . . . . . . . 46 Camper Use . . . . . . . . . . . . . . . . . . . . . . . . . . . . . . . . . . . 46 Market Concentration . . . . . . . . . . . . . . . . . . . . . . . . . . . . 46 Ownership ....... .......... . ............... . ... 47
REFERENCES .. .... , ........... . ... . . ................ 47

STRUCTURE, CONDUCT, AND PERFORMANCE OF THE
COMMERCIAL CAMPGROUND INDUSTRY IN MAINE
Part I- Industry Structure Louis W. Pompi and George J. Seel'
INTRODUCTION
Tourism and recreation constitute a growing and important part of Maine's economy. During 1973, Maine's tourist industry accounted for nearly $259 million of direct expenditures by tourists who spent an estimated 22.5 million tourist days in the State (6, p. 2). This business activity provided 6.5 percent of 1973 total employment for all industries in Maine and generated state government tax revenues of nearly $30 million or approximately 6 percent of all state revenues for that year (6, p. 3).
A recent study of tourism in Maine indicates that total business activity generated by that industry can be estimated using a business activity multiplier of 1. 76 (10, p. 76). When this multiplier is used , estimated total business activity for the tourism sector is equal to approximately $455.8 million, which accounts for just over 20 percent of Maine's total 1973 business activity.
The State's private campground industry is an important component of the tourism sector. In 1973, campgrounds accounted for 2,326,000 tourist days (597,000 resident and 1,729,000 non-resident) which represents nearly 10 percent of total tourist days for that year (6, p. 2). Visitors to Maine's campgrounds accounted for approximately $21 million in direct expenditures, nearly $8 million in wages and salaries, and $854,000 in net st!te tax revenues (6, p. 2).
Proximity of Maine's attractive recreation resources to major urban centers suggests a rather substantial future growth potential for the State's commercial campground industry. In recognition of its economic significance and to help existing and prospective new firms in the industry realize this potential, it is important that development and implementation of public policy .having impacts on the campground industry proceed on a sound information base. Detailed, quantitative information on the
'Assistant Professor and Graduate Research Assistant, Department of Agricultural and Resource Economics respectively.

4 LSA STATION BULLETIN 739
structure, conduct, and performance of the industry is a necessary input to the policy process. Such information can also be helpful to existing and potential future entrepreneurs in the industry as they try to offer a more attractive product and improve their individual financial circumstances.
While theoretical literature on the development and management of commercial campgrounds is quite extensive, there is little in the way of current empirical findings with policy and management implications relevant to Maine. As competition within the industry becomes more intense, this information gap could make it increasingly difficult for the State's commercial campgrounds to maintain an adequate share of the market.
Objectives
This study deals specifically with the privately owned and operated commercial campground industry in Maine.2 The general goals of the research are:
1. To assemble basic, quantitative date for Maine's commercial campground industry.
2. To analyze these data for the purpose of providing detailed information, having implications for both public policy formulation and the management of new and existing campground firms , on the structure, conduct and performance of the industry.
These goals are further defined in terms of the following specific study objectives:
1. To describe the geographic location, size, and growth characteristics of the industry.
2. To describe the land, labor, and capital inputs used by existing firms in the industry.
3. To describe other structural characteristics of the industry including facilities and services provided, camper use, and industry concentration.
4. To describe the industry's conduct with respect to such factors as fee structure, pricing behavior, length of season, advertising, reservations, expansion, and perceived management problems.
5. To evaluate the industry's performance in terms of financial success.
' Research results presented here are derived from a project which also involved an investigation of the socioeconomic characteristics, camping preferences, vacation travel patterns, and expenditures of campers in Maine. The results of this research are summarized in an earlier report (5).
l

LSA STATION 8UI.LETIN 73.9 s
6. To identify factors which might have a significant impact on a campground firm's performance as a business venture.
7. To ascertain the direction and strength of relationships existing between these factors and the financial success of campground firms.
Part I of the study reports the results of the industry structural analysis while Part II concentrates on industry conduct and performance.
Structure, Conduct, and Performance: A Framework
The term "industry performance" refers to the way firms in an industry adjust to changing conditions in their factor and product markets. The performance of individual firms is often evaluated in terms of some measure of financial success. Firm performance is the end result of a complex set of interactions among many variables. Identification and analysis of the major factors influencing performance levels of firms is as important to the formulation of rational public policy and successful management strategy as is the measurement of performance itself. Bain has suggested two sets of primary determinants of firm performance: 1) industry structure; essentially the organizational character of the industry, and 2) industry conduct, practices firms employ to adjust to changes in the markets in which they participate (1, p. 3).
Industry structure can be defined as involving those characteristics which determine the relationships existing among sellers, between sellers and buyers, and between established sellers and potential new t1rms in a given market. The important dimensions of industry structure are the degree of seller concentration, the degree of product differentiation, and the condition of entry into the market for the industry's output.
The term " industry conduct" refers to the way firms in an industry behave when confronted with changes (both quantitative and qualitative) in the demand for their output. Industry conduct essentially includes the price, product, and sales promotion activities of firms in an industry.
Industry structure and conduct are closely related to each other as well as to performance. In theory, the structure of an industry defines the framework within which the individual firm operates; constraining the firm 's activities (or conduct) and thus having an impact on its performance. This suggests a pattern of causal relationships running from structure, through conduct, to performance. Empirical verification of this hypothesis, however, is often difficult since patterns of firm behavior can seldom be measured sufficiently to establish meaningful associations between conduct and performance or between structure and conduct. Linkages with industry conduct generally remain implied while associations of industry structure to performance can be more readily identified

6 LSA STATION BULLETIN 739
empirically. The theoretical relationships of structure to conduct to performance, form the conceptual framework for this analysis of the private campground industry in Maine.
Research Procedures
For the purposes of this study, a private campground was defined as a privately owned and/or operated recreation business offering camping facilities to the general public as a primary source ofrevenue. On the basis of this definition, a list of all private, commercial campgrounds operating in Maine in 1974 was compiled for sampling purposes. Each of the 345 firms in the industry was surveyed by mail questionnaire. The two-page questionnaire was designed to assemble data on campground location and size, selected owner/operator characteristics, itemized capital investment, labor usage, pricing behavior, occupancy rates, itemized cash receipts and expenses, and major management problems. In all, 62 variables were measured. Of the 345 firms surveyed, 92 usable _questionnaires were returned. This represents a sample of approximately 27 percent. Firms in the sample were grouped according to geographical location, (i.e., coastal vs. inland}1 and size (i.e., number of campsites in use)" and the sample was tested for representativeness on these criteria using chi-square. The sample proved to be representative with respect to location but small firms were underrepresented.
The survey design also included a schedule of personal interviews with campground operators, complementary to the mail questionnaire, for perspective and greater detail. The personal interview was used to obtain data on market entry, camper use, facilities available, fee structure and pricing behavior, impacts of public policies, land inputs, recent capital expansion, depreciation on investments, cash expenses, problems with clientele, and perceived future demands of campers. A stratified random sampling procedure (based on geographic location and firm size) was used to select 27 firms for personal interviews.
Data from the mail surveys and personal interviews were coded and tabulated. Analysis of data was primarily descriptive with some industry associations investigated using correlation techniques. Comparisons of paired mean values utilizing t-tests were performed at the 10 percent level of probability while multiple mean comparisons were made at the five percent level using the Student-Newman -Keuls test.
Factors related to the financial success of private campgrounds were
3 Campgrounds located in towns on coastal water, or towns east of or on the major coastal tourist route (U.S. Route 1) were included in the coastal sub-group. All other firms were considered as having inland locations.
•firms were grouped into four size categories on the basis of number of campsites. The categories are: 1-49, 50-99, 100-199, and 200 and more sites.

LSA STATION BUU.ETIN 739 7
identified from the literature. The relationships between these factors and the performance of Maine's private campgrounds were analyzed using the mail survey data and multiple regression techniques.
STRUCTURE OF MAINE'S PRIVATE CAMPGROUND INDUSTRY
Industry Growth and Firm Size
In recent years, the commercial campground industry in Maine has experienced steady growth. In 1964, 148 commercial campgrounds were operating in the State (11, p. 90). By 1974, this number had increased to 345 firms. This represents a total increase of 133 percent for the 10-year period or an average annual growth rate of 13.3 percent. At present, there are no indications that growth in the industry will slow down or cease altogether. Competiton among the State's private campgrounds can be expected to intensify as growth continues.
Data on firm size were available for 311 of Maine's campgrounds. The size distribution by number of campsites in use in 1974 is shown in Table 1. Campgrounds in the sample ranged in size from six to 500 campsites.
TABLEl
Size Distribution by Number of Campsites for Private Campgrounds in Maine, 1974°
Firm Size Category Number of Percent of (Number of campsites) Firms Total
1- 49 151 49 SO- 99 91 29
100-199 53 17 200 and more 16 5·
Total 311 100
·Based on 311 firms. Thirty-four firms are of unknown size.
Cumulative Percent
49 78 95
100
In evaluating the growth characteristics of an industry, it is often the case that increases in the number of firms in the industry do not account for the total growth in productive capacity. In 1964, the average firm had approximately 59 campsites available for use (11, p. 91), while the average 1974 firm had 68 available sites. Thus, accounting for increases in both the number and capacity of firms over the 10-year period 1964 to 1974, growth in total capacity of the industry amounted to approximately 169 percent.
8 LSA STATION BULLETIN 739
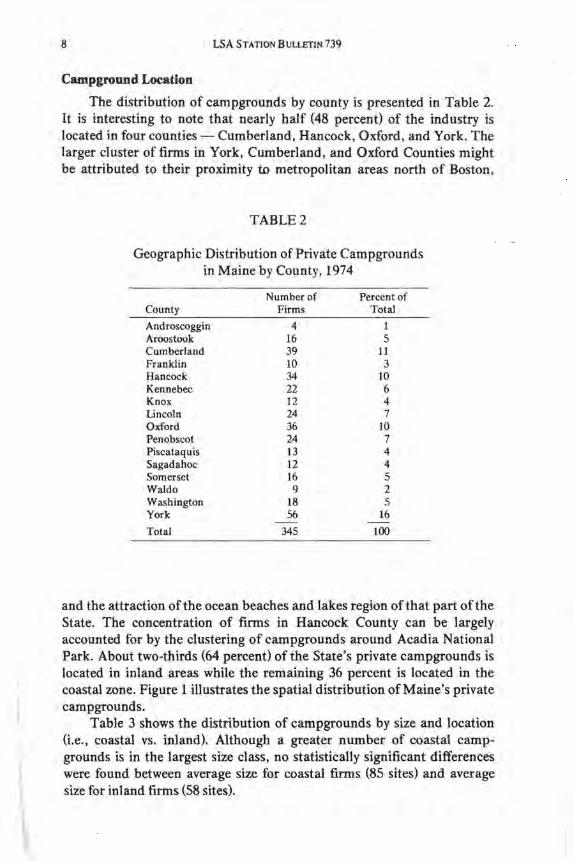
Campground Location
The distribution of campgrounds by county is presented in Table 2. It is interesting to note that nearly half (48 percent) of the industry is located in four counties- Cumberland, Hancock, Oxford, and York. The larger cluster of firms in York, Cumberland, and Oxford Counties might be attributed to their proximity to metropolitan areas north of Boston,
TABLE2
Geographic Distribution of Private Campgrounds in Maine by County, 1974
Number of Percent of County Finns Total
Androscoggin 4 1 Aroostook 16 5 Cumberland 39 11 Franklin 10 3 Hancock 34 10 Kennebec 22 6 Knox 12 4 Lincoln 24 7 Oxford 36 10 Penobscot 24 7 Piscataquis 13 4 Sagadahoc 12 4 Somerset 16 5 Waldo 9 2 Washington 18 5 York 56 16
Total 345 100
and the attraction of the ocean beaches and lakes region of that part of the State. The concentration of firms in Hancock County can be largely accounted for by the clustering of campgrounds around Acadia National Park. About two-thirds (64 percent) of the State's private campgrounds is located in inland areas while the remaining 36 percent is located in the coastal zone. Figure 1 illustrates the spatial distribution of Maine's private campgrounds.
Table 3 shows the distribution of campgrounds by size and location (i.e., coastal vs. inland). Although a greater number of coastal campgrounds is in the largest size class, no statisticaUy significant differences were found between average size for coastal firms (85 sites) and average size for inland firms (58 sites).

LSA STATION BULLETIN 739
TABLE3
Size Distribution of Private Campgrounds in Maine in 1974 by Number of Campsites and Geographic Location"
Coastal Firms Inland Firms
9
Firm Size Category Number Column Percent Number Column Percent (Number of campsites) Firms Percent of Total Firms Percent of Total
1 - 49 46 41 15 105 53 34 50- 99 32 28 10 59 30 19
100-199 24 21 8 29 15 9 200 and more 11 10 3 5 2 2
Total or percent 113 100 36 198 100 64
•Based on 311 firms , not included were 12 coastal and 22 inland firms of unknown sizes .
For firms in the mail survey sample, location with respect to water resources , tourist flows, and sources of demand were determined. For each sample firm, location was measured as the shortest highway distance from the nearest lake or coastal water, from the nearest major tourist center,5 from the nearest Maine population center,6 from the nearest primary highway, and from Kittery (the State's major entry point for non-resident, automobile tourists).' Table 4 shows the location of sample firms with respect to these key distance variables.
TABLE4
Location of Mail Survey Sample of Private Campgrounds in Maine with Respect to Key Distance Variables, 1974"
Mean Maximum Firms Within One Distance Distance Hour's Drive•
Distance Variables (Miles) (Miles) Number Percent
Distance from Lake 4.5 31.0 92 100 Distance from Coastal Water 34.0 215.0 75 82 Distance from Primary Highway 4.5 47.0 92 100 Distance from Kittery , Maine 132.5 382.0 19 21 Distance from Major Tourist
Center 56.0 239.0 52 56 Distance from Maine
Population Center 17.0 90.0 89 97
• Based on 92 firms. • Assumes 55 m.p.h. speed limit.
'Major tourist ctmters were defined on the basis of tourist destination data. The centers used were the Old Orchard Beach area, the Sebago-Long Lakes Region, and Acadia National Park.
'For rural counties (i.e., those population densities of less than 100 people per square mile), population centers were defined as cities and towns with a 1970 population of 5,000 or more. In urban counties the minimum population was 10,000.
'It has been noted (10, p. 17) that in 1973-74, 72.3 percent of all non-resident tourists entered Maine at the Interstate 95 entrance near Kittery.

10 LSA STATION BULLETIN 739
• •
•• ••
• •• • •
Figure l
Geographic Location of Private Campgrounds in Maine
• Inland Campgrounds A Coastal Campgrounds

LSA STATION B ULLETIN 739 11
Fifty percent of the firms in the sample was located directly on a lake. The average distance for all 92 firms from a lake was 4.5 miles with no campgrounds being located more than 31 miles from a lake. Another 20 percent of the sample firms was located directly on coastal water. Average distance for the sample from Maine's coast was 34 miles and the maximum driving distance was 215 miles. The low average distance from a primary highway (4.5 miles) and from a Maine population center (17.0 miles), suggests accessibility along with proximity to water bodies as important location factors.
A large number of the sample firms (56 percent) was within a one hour's drive of one of the three major tourist centers. However, only eight percent was located within 10 miles , possibly due to limited space and the high commercial value of land at these locations.
A relatively small number of firms (21 percent) was located within an hour's drive of Kittery. However, nearly half (49 percent) was located within 110 miles, an approximate two hour drive from Kittery. The relative importance of this location factor is difficult to access without more detailed analysis.
Land, Capital, and Labor Inputs
The private campground firm, like any other basic productive unit, employs a variety of inputs in various combinations to produce its output. All productive inputs can be classified as one of three primary factors of production - land, labor, or capital. Quantitative information on the campground industry's factor requirements and factor mix is essential to an understanding of its structure.
LAND INPUTS
Total land area associated with Maine's private campgrounds varies considerably. Individual campgrounds in the mail survey sample ranged in size from a minimum of one acre to a maximum of 1,000 acres. Over SO percent of the sample firms was smaller than 40 acres in size, while only 17 percent (13 firms), was larger than 200 acres (Table 5). The average firm size for the mail sample was 98 acres . This represents an increase over the 1964 figure of 78 acres (11, p. 91 ). Expansion of existing firms and the generally larger size of newer campgrounds account for this increase.
Total land input was compared for private campgrounds at coastal and inland locations (Tables 6 and 7). In the sample, coastal campgrounds were, on average, smaller than inland firms by a statistically significant amount. Only two coastal firms (seven percent) owned or controlled 200 or more acres while 11 inland campgrounds (23 percent) were in this category. Coastal campgrounds averaged 54 acres and ranged from two to 350

12 LSA STATION BULLETIN 739
TABLES
Frequency Distribution of Mail Survey Respondents By Total Land Area, 1973
Total Land Area Number of Percent of Accumulative (Acres) Firms Total Percent
1 - 19 23 30 30 20- 39 18 23 53 40- 59 8 10 63 60- 79 6 8 71 80- 99 2 2 73
100 - 199 8 10 83 200 and more 13 17 100
Total 78 100
acres in size. Inland campgrounds averaged 126 acres and ranged from one to 1,000 acres in size.
Land inputs were analyzed in greater depth for the sample of firms personally interviewed (Table 8). Of the 27 private campgrounds in this sample, 24 (88 percent) owned all lands under their control while two (seven percent) leased all lands. One firm owned part and leased part of its land holdings . The average land area owned by campgrounds was 109 acres while the three that leased all or part of their land averaged only 56 acres in size.
TABLE6
Frequency Distribution of Coastal Campgrounds Responding to Mail Survey by Total Land Area, 1973
Total Land Area Percent of Accumulative (Acres) Number Total Percent
0- 19 11 37 37 20 - 39 8 27 64 40- 59 4 13 77 60 - 79 1 3 80 80 - 99 1 3 83
100-199 3 10 93 200 and more 2 7 100
-Total 30 100

LSA STATION BULLETIN 739
TABLE7
Frequency Distribution oflnland Campgrounds Responding to Mail Survey by Total Land Area, 1973
Total Land Area Number Percent of Accumulative (Acres) Firms Totaf Percent
0 - 19 12 26 26 20- 39 10 21 47 40- 59 4 8 55 60 - 79 5 10 65 80- 99 1 2 67
100-199 5 10 77 200 and more 11 23 100
Total 48 100
13
When total land area is considered, the size distribution of the interviewed sample approximates that of the mail sample. Average total land area for the interviewed sample was 107 acres compared with an average of 98 acres for tbe mail sample. As with the mail sample, a large number of the interviewed firms (41 percent) was smaller than 40 acres with the largest portion (22 percent) being in the smallest size category of one to 19 acres.
Land Use Intensity. In some cases, firms in the interviewed sample were actually using less than the total land area available for campground development and related recreational activities. Comparisons of total land available to land presently in use give an indication of the intensity of land use and the amount of land still available for future expansion; both of which are important structural characteristics. A convenient way to express this relationship is through the use of a ratio of the total land area to the land area presently in use. Land-use ratios were calculated for each of the 27 firms in the interviewed sample and for the entire sample as a whole. Table 9 shows the frequency distribution of interviewed firms with respect to land-use ratio. Seventeen (63 percent) of the 27 campgrounds had a land-use ratio of 1.0, that is, firms that utilized all their land holdings. Four firms had ratios of 5.0 or greater, committing only a small portion of their land resource to campground development.
Most of the firms using all land ava_ilable (1 S of.17) fell into the two smallest size categories. Two of the firms making intensive use of their land resources were large with sizable areas being utilized for camper recreation facilities including hiking and riding trails, golf courses, and a ski slope. Most larger firms, however, made relatively less intensive use of their land holdings. For the interviewed sample as a whole, the average

-.I>,
TA
BL
ES
Fre
quen
cy D
istr
ibut
ion
of L
and
Inpu
ts f
rom
27
Per
sona
l In
terv
iew
s o
f P
riva
te C
ampg
roun
ds in
Mai
ne,
1973
Tot
al L
and
Are
a I'"
' T
otal
Lan
d A
rea•
T
otal
Lan
d O
wne
d T
otal
Lan
d L
ease
d in
Use
° V
, >
Lan
d A
rea
Num
ber
Num
ber
Num
ber
Num
ber
V, .,
(Acr
es)
Fir
ms
Per
cent
F
irm
s P
erce
nt
Fin
ns
Per
cent
F
inns
P
erce
nt
>
:::!
0 -
-2
7 24
88
-
-0 z
1 -
19
6 21
6
22
1 4
9 33
0:
, C
: 20
-39
5
19
5 19
0
0 6
22
r-<
r-<
40
-59
5
19
5 19
0
0 7
26
~ 6
0-
79
3 11
2
7 1
4 0
0 z
80-
99
1 4
1 4
0 0
1 4
---1 w ~
100-
199
5 19
4
15
1 4
3 11
20
0 an
d m
ore
2 7
2 7
0 0
1 4
--
--
--
--
Tot
al
27
100
27
100
27
100
27
100
•Sum
ofl
and
area
ow
ned
and
land
are
a le
ased
. • A
cres
in u
se f
or c
ampg
roun
d in
197
4.

LSA STATION BULLETIN 739
TABLE9
Frequency Distribution of Interviewed Sample by Land-Use Ratio, 1973
Number of Percent of Land-Use Ratio- Firms Total
1.0 17 63 1.1. 1.9 2 7 2.0- 2.9 3 11 3.0 - 3.9 0 0 4.0-4.9 1 4 5.0 and greater 4 15 -- -Total 27 100
·Total land area to total land area in use for campground in 1974.
15
land-use ratio was 2.37 acres available to one acre in use, indicating only moderate intensity of use. However, most of the currently unused land is concentrated in relatively few firms (five having ratios of 4.0 or greater). A weighted average land-use ratio, calculated as the average total land area for the 27 firms together (107 acres) divided by the average land area in use by these firms (74 acres) partially accounts for this concentration by putting less emphasis on the larger firms in the sample. This ratio has the value of 1.45 acres available for each acre in use, indicating a more intensive use of land by firms in the interviewed sample. This has important implications for future expansion of Maine's campground industry. In general , the data suggest that most future growth will have to come through the entry of new firms into the industry, rather than from expansion of existing firms .
Total land area, land area in use, and the land-use ratio were analyzed by geographic location for firms in the interviewed sample (Table 10). On average, coastal firms in the sample were smaller than inland firms by a statistically significant amount. Average land area in use and average land-use ratios for coastal and inland firms were different, but the differences were not statistically significant. Thus , on the basis of the land -use ratio, the data indicate that land use intensity was virtually the same at both coastal and inland locations.
Perhaps a more useful measure of land use intensity for the campground firm is the amount of land in use per campsite. For the interviewed sample, land area in use for the campground and related activities was calculated on a per campsite basis. An average of 0.8 acres of developed land per campsite was in use by the 27 firms in the sample. Coastal firms averaged 0.5 developed acres per site while an average of 1.0 acre of land

16 LSA STATION BULLETIN 739
TABLElO
Average Total Land Area, Average Land Area in Use, and Average Land-Use Ratio for Coastal and Inland Firms in the Interviewed
Sample, 1973
Average Average Total Land Land Area Average
·campground Number of Area in Use Land -Use Location Firms (Acres) (Acres) Ratio•
Coastal 13 44 28 2.06 Inland 14 166 116 2.66
-Total &Av. 27 107 74 2.37
• Average land-use ratio calculated as the simple average of the ratios for firms in each group.
was in use per site by inland firms. Though inland firms used, on average, twice as much land per campsite as coastal firms (indicating a more intensive use of land by coastal campgrounds), this difference was not statistically significant.
Table 11 shows the average land usage per site for campgrounds in each of the four size categories. No statistically significant differences were found among these means. Bevins, et. al., in a study of a sample of campgrounds in the Northeast region of the country found an average 0.2 acres of land in use per campsite with no significant differences in per site land usage among three size categories (2, pp. 2-3). In a detailed study of the Sebago-Long Lakes cluster of private campgrounds in Maine, Connors
TABLE 11
Land Usage Per Campsite by Size Category for the Interviewed
Sample, 1973a
Size Category (No. of campsites)
1 · 49 50. 99
100 -199 200ormore
•Based on 27 firms.
Land Used Per Campsite
(acres)
1.0 0.9 0.4 1.0

LSA STATION BULLETIN 739 17
and Whittaker also observed an average of 0.2 acres in use per site (3, p. 6). Thus, it can be concluded that land use in physical terms was more intensive for firms in the regional industry and in the Sebago-Long Lakes campground cluster than for firms in our interviewed sample.
Data on developed land per campsite were not available for the campgrounds in the mail survey sample. However, total land area per campsite was calculated for the entire mail survey sample and for inland and coastal firms in the sample. The frequency distributions of total land area per campsite for all mail survey respondents, for inland respondents, and for coastal respondents are shown in Table 12. Average total land area per campsite for the mail survey sample was 1.69 acres with coastal and inland firms averaging 1.63 and l. 75 acres per campsite respectively. This was not a statistically significant difference.
Water Resource Inputs. Included in land inputs utilized by Maine's private campgrounds are inputs of natural surface-water resources. Inputs include consumptive, recreational and aesthetic uses. Location on a water body and length of shoreline frontage were used as measures of water resource inputs. Only 10 firms (37 percent of the interviewed sample) did not have any water frontage, while 17 campgrounds (63 percent) were located directly on either a freshwater or saltwater body (Table 13). Nearly thirty percent of the sample campgrounds had 2,000 feet or more of frontage.
CAPITAL INPUTS
In this study, investments made in land , land improvements, buildings and facilities, and operating equipment are considered the capital inputs of a private campground firm .
Total Capital Investment. Total capital investments among private campgrounds in the mail survey sample ranged from a minimum of $1,500 to over $1 million. The frequency· distribution of total capital investment for the mail survey sample is shown in Table 14. Average total capital investment for the sample was $159,859.
Average total capital investment was calculated for mail survey firms in each size category and at coastal and inland locations (Table 15). Average total investment for coastal firms ($197,469) was larger than average total investment for inland firms ($137,293) though not by a statistically significant amount. This observation is more striking, however, when it is noted that, in terms of average total land area, coastal firms were significantly smaller than inland firms, suggesting that differences in average investment are the result oflocational attributes rather than differences in land area per firm.

-00
TA
BL
E12
Fre
quen
cy D
istr
ibut
ion
of T
otal
Lan
d A
rea
Per
Cam
psit
e fo
r F
irm
s in
th
e M
ail
Surv
ey S
ampl
e, 1
973
t'"'
V,
Tot
al L
and
C
amp
gro
un
d L
ocat
ion
To
tal
>
V,
Are
a P
er
Coa
stal
In
lan
d
.., >
Cam
psi
te
Nu
mb
er
Per
cent
A
ccu
mu
-N
um
ber
P
erce
nt
Acc
um
u-
Nu
mb
er
Per
cent
A
ccu
mu
-.., 0
(Acr
es)
of
of
lati
ve
of
of
lati
ve
of
of
lati
ve
z F
irm
s T
ota
l P
erce
nt
Fir
ms
To
tal
Per
cen
t F
irm
s T
ota
l P
erce
nt
ti)
C
t""
0.05
-0.
49
18
60
60
14
30
30
32
42
42
t"" ~
0.50
-0
.99
5 17
77
9
19
49
14
18
60
z 1.
00 -
1.49
2
7 84
6
13
62
8 10
70
-.
..)
w
1.50
-I.
99
3 10
94
5
11
73
8 10
80
'I:
>
2.00
-2.
49
0 0
94
2 4
77
2 3
83
2.50
-2.
99
1 3
97
4 8
85
5 7
90
3.00
an
d g
reat
er
I 3
100
7 15
10
0 8
10
100
To
tal
30
100
47
100
77
100

LSA STATION BULLETIN 739
TABLE13
Frequency Distribution of Linear Length of Water Frontage for Interviewed
Sample of Campgrounds, 1973
Water Frontage Campgrounds (Feet) Number Percent
0 10 37 1 . 499 1 4
50(). 999 1 4 1,000 · 1,499 4 15 1,500 · 1,999 3 11
2,000 and greater 8 29
Total 27 100
TABLE14
Frequency Distribution of Mail Survey Respondents by Total Capital Investment, 1973
Capital Investment Number Percent (Dollars) Firms Frequency
Less than 20,000 5 6 20,000 - 29,999 5 6 30,000 · 39,999 2 2 40,000 · 59,999 12 14 60,000 - 79,999 10 12 80,000 · 99,999 9 11
100,000 · 199,999 22 26 200,000 · 299,999 9 11 300,000 · 399,999 4 4
400,000 and greater 7 8
Total 85 100
19
Cumulative Percent
6 12 14 28 40 51 77 88 92
100
As might be expected, average total investments for campgrounds in each size category differed by statistically significant amounts. However, within coastal and inland groupings (controlling for the influence of firm size) the differences in average capital investment between coastal and inland campgrounds were not statistically significant. Indeed, these differences were not even consistent, with coastal campgrounds in the 1 · 49 and

TA
BL
ElS
Ave
rage
Tot
al C
apit
al I
nves
tmen
t by
Fir
m S
ize
Cat
egor
y an
d G
eogr
aphi
c L
ocat
ion
for
Fir
ms
in t
he M
ail
Surv
ey S
am p
ie,
1973
Cam
pg
rou
nd
Loc
atio
n
Fir
m S
ize
Coa
stal
In
lan
d
Cat
egor
y N
um
ber
A
vera
ge T
ota
l N
um
ber
A
vera
ge T
ota
l N
um
ber
N
um
ber
of
of
Cap
ital
Inv
estm
ent
of
Cap
ital
Inv
estm
ent
of
Cam
psit
es
Fir
ms
(Dol
lars
) F
irm
s (D
olla
rs)
Fir
ms
1 -
49
8 61
,328
16
65
,471
24
SO
-99
8
151
,432
21
98
,608
29
10
0 -1
99
9
205
,287
4
231
,100
13
20
0 an
d m
ore
2
891,
000
4 53
3,8
75
6
To
tal
or a
vera
ge
27
197,
469
45
137,
293
72
.....
Tot
al
Ave
rage
T
otal
Cap
ital
In
vest
men
t
64,0
90
113,
180
213,
229
652,
917
159,
859
N
0 r Vl >
Vl .., > .., ~ td
C ;: ~ z .._,
w "'
LSA STATION BULLETIN 739 21
100 - 199 campsite categories having lower average total investments than inland firms in these categories and coastal firms in the SO - 99 and 200+ campsite categories having higher average investment levels than comparable inland firms. Though none of these variations was statistically significant, the findings do suggest that the generally higher average total investment level associated with the 27 coastal firms in the sample is primarily the result of differences in firm size between coastal and inland locations and not, in fact, due to locational characteristics such as higher land costs for coastal property.
Additional analysis provided further evidence in support of this conclusion. A strong positive correlation8 between firm size and total capital investment existed for campgrounds in the mail survey. Thus, total capital investment increased as campground size (in terms of number of campsites) increased.
Total capital investment levels are sometimes strongly influenced by firm age , the period of time over which the firm accumulates capital. Average total capital investments for mail sample campgrounds one to five years old, six to 10 years old, and 11 or more years old were: $85,671, $152,593, and $219,108, respectively. Only the difference in investment between firms in the newest (one to five years) and oldest (11 or more years) groupings was significant. The apparently unimportant role of firm age in determining capital investment levels for sample campgrounds is largely due to the reporting of land investments as estimated present values . Clearly, this has the effect of discounting increases in land values in Maine. The significant difference in investment between the newest and oldest campgrounds can be partially explained as the result of the generally larger size of the newer firms .
Itemized Capital Investments. When capital investments of campgrounds in the mail survey sample were itemized, the importance of land resources investment was revealed (Table 16).9 Land investment value for the sample as a whole averaged $68,482 per campground, 40 percent of average total investment. Investments in land, buildings, and land improvements accounted for 76 percent of total investment.
Itemized investments were analyzed for coastal and inland firms in the mail sample (Table 17). As was true for average total investment, no significant differences in average itemized investments existed between coastal and inland campgrounds. Large (but not statistically significant)
'Significant at the 0.10 level of probability: r=0.74.
'The distinction between land and capital inputs in resource-oriented industries like the private campground industry is often difficult to make. Although the land input was already analyzed and discussed in physical terms, it is considered here as a capital input.

22 LSA STATION BULLETIN 739
TABLE16
Itemized Capital Investment for Firms in the Mail Survey Sample, 1973·
Average Capital Investment
Percent·of Maximum Investment Total Capital Investment Item Dollars> Investment (dollars)
Land' 68,482 40 500,000 Buildings 36,765 22 509,000 Land improvements" 24,070 14 300,000 Operating equipment 15,654 9 579,000 Sewage facilities 6,583 4 15,000 Moveable fixtures 4,120 2 30,000 Pool or pond 2,753 2 50,000 Water well 2,049 1 20,000 Boating equipment 1,209 1 25,000 Docks, floats , wharves 581 *' 5,000 Other' 8,578 5 200,000
Totals 170,844 100 2,233,000
·Based on 76 valid responses. •Total does not equal average of total capital investments from Table 15 due to differences in number of valid responses.
' Estimated by operator as 1974 value. •1nc1udes investments in campsite and road development, clearing, grading, and drainage. ·Less than one percent. 'Includes rental camping equipment, franchise purchase, prepaid insurance, horses , and miscellaneous.
TABLE17
Itemized Capital Investments by Geographic Location For Firms In the Mail Survey Sample, 1973
Coastal firms Inland firms
Average Average Investment Investment Number Itivestment Number
Item (dollars) of Firms (dollars) of Firms
Land• 97,862 28 50,979 47 Buildings 37,604 29 36,247 47 Land improvements 24,936 29 23,546 48 Operating equipment 27,504 29 8,342 47 Sewage facilities 6,%6 28 6 ,344 45 Moveable fixtures 3,812 29 4,305 48 Pool or pond 1,159 29 3,736 47 Water well 1,717 29 2,258 46 Boating equipment. 527 30 1,645 47 Docks, floats , wharves 432 30 678 46 Other 6,650 29 9,768 47
• Estimated by operators as 1974 value.

LSA STATION 8UILETIN 739 23
differences between coastal and inland firms existed for average investments in land and operating equipment, with coastal campgrounds making larger investments in both items.
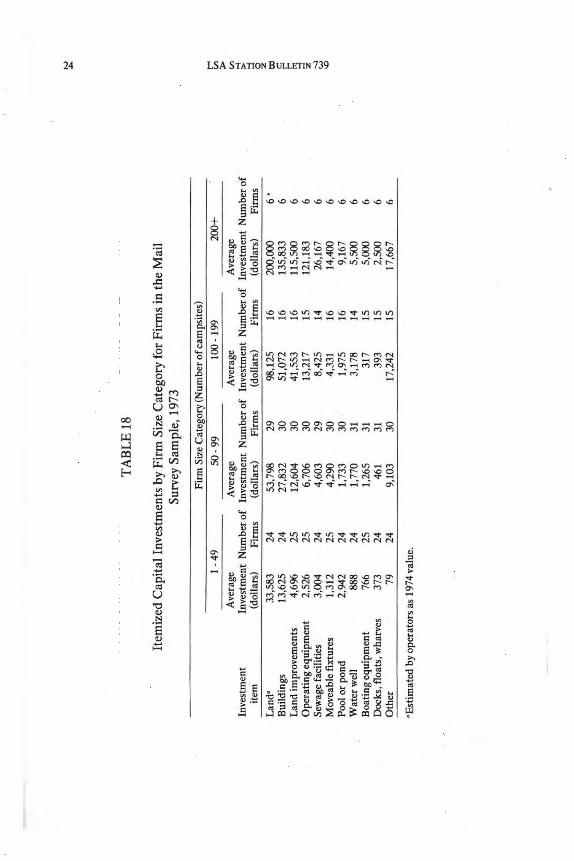
Average itemized investments were calculated for mail survey firms in each size category (Table 18). Average investment in land was significantly different among all categories except between the two smallest. There were also large variations in average investments in land improvements, buildings, moveable fixtures, operating equipment, and sewage facilities. Significant differences for these items, however, were found only between each of the three smaller size categories and the largest category.
For campgrounds in the sample,_ significant positive correlations existed between firm size and investments in land (r = 0.58), buildings (r = 0.49), moveable fixtures (r = 0.48), operating equipment (r = 0.37), and sewage facilities (r = 0.52).'0 These six investment items account for 91 percent of average total itemized investment. Relationships between firm size and investments in pools or ponds; water wells; boating equipment; docks , floats, and wharves; and the miscellaneous item - other -were not significant. However, these five items account for only nine percent of average total investment and are considered relatively unimportant. These findings suggest that investment levels in major itemized categories are, as in the case of average total investment, largely a function of campground size.
Scale Economies. One method of accounting for variations in campground size is to calculate average investment values on a per campsite basis. The ·values can then be examined to identify scale economies, with respect to capital investment, that exist in the industry.
Average total capital investment per campsite was calculated for firms in the mail survey sample. Table 19 shows these values by geographic location and firm size. For the sample ·as a whole, average total investment per site was $2,115. Average total investment per site for all firms in the sample declines with increasing firm size for the first three size categories suggesting that economie~ of scale are present. However, average total investment per site for firms in the largest size category is greater than investment for each of the three smaller categories. Also, differences in average total investment per site among size categories were not statistically significant. Thus, sample data indicate that, with respect to total capital investment, there are no significant scale economies in Maine's private campground industry, though firms in the 100-199 campsite category appear to make the most efficient use of capital inputs.
Comparing all inland and coastal firms, average total investment per campsite for coastal firms {$2,297) is greater than average per site invest-
10 All correlations significant at the 0.10 probability_ level.
~
TA
BL
E18
Item
ized
Cap
ital
Inv
estm
ents
by
Fir
m S
ize
Cat
egor
y fo
r F
irm
s in
the
Mai
l Su
rvey
Sam
ple,
197
3
Fir
m S
ize
Cat
egor
y (N
umbe
r o
f cam
psit
es)
1-4
9
50
-99
1
00
-19
9
200+
t""
V
, >
Ave
rage
A
vera
ge
Ave
rage
A
vera
ge
V,
Inve
stm
ent
Inve
stm
ent
Num
ber
of
Inve
stm
ent
Num
ber o
f In
vest
men
t N
umbe
r of
In
vest
men
t N
umbe
r of
-l
>
ite
rri
(dol
lars
) F
irm
s (d
olla
rs)
Fir
ms
(dol
lars
) F
irm
s (d
olla
rs)
Fir
ms
::l 0
Lan
d·
33,5
83
24
53,7
98
29
98,1
25
16
200,
000
6.
z ti,
Bui
ldin
gs
13,6
25
24
27,8
32
30
51,0
72
16
135,
833
6 C
:
Lan
d im
prov
emen
ts
4,69
6 25
12
,604
30
41
,553
16
11
5,50
0 6
§ O
pera
ting
equ
ipm
ent
2,52
6 25
6,
706
30
13,2
17
15
121,
183
6 z
Sew
age
faci
litie
s 3,
004
24
4,60
3 29
8,
425
14
26,1
67
6 -l
w
Mov
eabl
e fi
xtur
es
1,31
2 25
4,
290
30
4,3
31
16
14,4
00
6 'J:
>
Pool
or
pond
2,
942
24
1,73
3 30
1,
975
16
9,16
7 6
Wat
er w
ell
888
24
1,77
0 31
3,
178
14
5,50
0 6
Boa
ting
equ
ipm
ent
766
25
1,26
5 31
31
7 15
5,
000
6 D
ocks
, flo
ats,
wha
rves
37
3 24
46
1 31
39
3 15
2,
500
6 O
ther
79
24
9,
103
30
17,2
42
15
17,6
67
6
·Est
imat
ed b
y op
erat
ors
as 1
974
valu
e.

LSA STATION BULLETIN 739 25
ment for inland firms '($2,003), though not by a statistically significant amount. Within each size category, comparisons of average per site investment between coastal and inland firms revealed that only the difference between coastal ($2,496) and inland ($1,551) firms in the 50-99 campsite category was statistically significant.
Average total investment per campsite does not decrease regularly with increasing firm size within either the coastal or inland subgroups. The lack of such a pattern indicates that, as in the case of the sample as a whole, there are no significant scale economies in total capital investment for coastal or inland subgroups.
Average itemized capital investment per campsite was also analyzed by firm size category (Table 20). Average investments per site in land; buildings; operating equipment; sewage facilities; pool or pond; water well; boating equipment; and docks, floats, and wharves, decrease with increasing firm size over the first three size categories. Average per-site investments in land improvements increase with increasing firm size from a low of $178.82 for the smallest size category to a high of $561.24 for the largest firms. Per site investments in moveable fixtures and the "other" category exhibit no regular pattern. The data suggest the existence of scale economies for certain investment items over the first three size categories. However, only the difference in per site .investment in operating equipment between the largest size category and each of the three smaller categories was statistically significant.
Recent Capital Expansion. Recent capital investments for expansion and improvements were analyzed for campgrounds in the personal interview sample (Table 21). An average total of $45,294 per campground was invested during the period 1969 to 1973. Of this total, $38,762 (85.6 percent) was used for expansion and $6,532 (14.4 percent) was invested in improvements and renovations.
Twenty-two of the 27 campgrounds in the interviewed sample (82 percent) made investments for expansion and/or improvements during the five-year period. Thirteen firms (59 percent of those investing) had to borrow all or part of invested capital in loans ranging from $5,000 to $184,564. The average amount borrowed was $41,300 at interest rates ranging from 5 percent to 14.5 percent (average rate was 8.8 percent). Eleven campgrounds acquired bank loans, one obtained a loan from the Maine Recreation Authority, and the other received its loan from a credit union.
LABOR AND MANAGEMENT INPUTS
Labor, considered as a factor of production, involves two types of inputs. The first type, referred to as labor inputs, includes any combina-

TA
BL
E19
Ave
rage
Tot
al C
apit
al I
nves
tmen
t per
Cam
psit
e by
Geo
grap
hic
Loc
atio
n an
d F
irm
Siz
e C
ateg
ory
for
Fir
ms
in th
e M
ail
Surv
ey S
ampl
e, 1
973
Coa
stal
fir
ms
Inla
nd f
irm
s T
otal
Fir
m S
ize
Ave
rage
Tot
al
Ave
rage
Tot
al
Ave
rage
Tot
al
Cat
e~O
Q'.
Cap
ital
Inv
estm
ent
Cap
ital
Inv
estm
ent
Cap
ital
Inv
estm
ent
Num
er
of
Per
Sit
e N
umbe
r o
f P
er S
ite
Num
ber
of
Per
Site
N
umbe
r o
f C
amps
ites
(d
olla
rs)
Fir
ms
(dol
lars
) F
irm
s (d
olla
rs)
Fir
ms
1-4
9 2,
417
8 2,
564
14
2,51
1 22
50
- 99
2,49
6 8
1,55
1 21
1,
812
29
100
-199
1,
520
9 1,
855
4 1,
623
13
200a
nd m
ore
4,45
5 2
2,56
0 4
3,19
2 6
--
-A
vera
ge o
r to
tal
2,29
7 27
2,
003
43
2,11
5 70
~
t"<
Vl >
Vl ~ i ai ~ ~ ij
\Q

· TA
BL
E20
Item
ized
Cap
ital
Inv
estm
ent P
er C
amps
ite
By
Fir
m S
ize
Cat
egor
y F
or F
irm
s In
the
Mai
l Su
rvey
Sam
ple,
197
3
Fir
m s
ize
cate
gory
(nu
mbe
r o
f cam
psit
es)
1-
49
50
-99
10
0 -
199
20
0+
T
otal
Ave
rage
A
vera
ge
Ave
rage
A
vera
ge
Ave
rage
t""
V
>
Inve
stm
ent
Inve
stm
ent
Inve
stm
ent
Inve
stm
ent
Inve
stm
ent
>
Inve
stm
ent
Per
Sit
e N
o.o
f P
er S
ite
No
.of
Per
Sit
e N
o.o
f P
er S
ite
No
.of
Per
Sit
e N
o. o
f V
> >'l
item
(d
olla
rs)
Fir
ms
(dol
lars
) F
irm
s (d
olla
rs)
Fir
ms
(dol
lars
) F
irm
s (d
olla
rs)
Fir
ms
~ 0 L
and•
1,
253.
75
22
874.
07
29
750.
24
16
986.
46
6 97
0.59
73
2
Bui
ldin
gs
523.
15
22
441.
16
30
413
.06
16
651.
37
6 47
6.50
74
tl
l
Lan
d im
prov
emen
ts•
178.
82
23
204.
05
30
302.
48
16
561.
24
6 24
5.73
75
~
Ope
rati
ng e
quip
men
t 10
9.00
23
10
6.13
30
95
.18
15
604.
34
6 14
5.20
74
S
ewag
e fa
cili
ties
12
5.58
22
74
.75
29
63.5
7 14
12
7.50
6
92.7
5 71
2 -.
J
Mov
eabl
e fi
xtur
es
45.1
9 23
65
.47
30
34.1
8 16
70
.24
6 52
.96
75
w
\&)
Pool
or
pond
18
5.90
22
26
.02
30
15.2
9 16
43
.94
6 72
.68
74
Wat
er w
ell
37.3
5 22
27
.66
31
27.5
9 14
26
.63
6 30
.48
73
Boa
ting
equ
ipm
ent
28.5
2 23
21
.41
31
2.42
15
23
.76
6 19
.98
75
Doc
ks, f
loat
s, w
harv
es
13.4
0 22
7.
69
31
2.93
15
11
.90
6 8.
76
74
Oth
er<
3.88
22
14
8.29
30
12
8.54
15
84
.29
6 95
.53
73
•Est
imat
ed b
y op
erat
ors
as 1
974
valu
e.
'Inc
lude
s in
vest
men
ts in
cam
psit
e an
d ro
ad d
evel
opm
ent,
cle
arin
g, g
radi
ng, a
nd d
rain
age.
<I
nclu
des
rent
al c
ampi
ng e
quip
men
t, f
ranc
hise
pur
chas
e, p
repa
id in
sura
nce,
hor
ses,
and
mis
cell
aneo
us.
N
-.J

28 LSA STATION BULLETIN 739
tion of paid or unpaid help utilized for maintenance of grounds and facilities and the operation of related services. Entrepreneurial, or management, inputs involve the functions of organizing, directing, and managing the firm's productive factors. Paid management can include a consulting accountant, a business manager, or a campground operator who supervises the functional and financial operation of the firm. Most often, campground management is provided by the owner/operator.
TABLE21
Itemized Average Capital Investments for Expansion and Improvements by 27 Firms in the Interviewed Sample, 1969 to 1973
Expansion Improvement
Investment Mean Percent Mean Percent Mean Percent Item Dollars of Total Dollars of Total Dollars ofTotal
Land 6,657 14.7 1,127 2.5 7,784 17.2 Campsite 5,143 11.4 1,637 3.6 6,780 15.0 Road 1,278 2.8 727 1.6 2,005 4.4 Campstore 1,905 4.2 1,420 3.1 3,325 7.3 Bathhouse 3,020 6.7 354 0.8 3,374 7.5 Other buildings 1,593 3.5 303 0.7 1,896 4.2 Pool 1,136 2.5 0.0 1,136 2.5 Pond 174 0.3 0.0 174 0.3 Moveable fixtures 1,187 2.6 0.0 1,187 2.6 Vehicles 3,418 7.6 0.0 3,418 7.6 Other op. equip. 2,112 4.7 0.0 2,112 4.7 Sewage facilities 4,952 10.9 0.0 4,952 10.9 Pumping station 826 1.8 0.0 826 1.8 Electric lines 814 1.8 859 1.9 1,673 3.7 Water well 556 1.2 89 0.2 645 1.4 Water lines & faucets 476 1.1 16 492 1.1 Other' 3,515 7.8 0.0 3,515 7.8
Totals 38,762 85.6 6,532 14.4 45,294 100.0
· Includes floats and docks , boats, signs, store inventory, prepaid interest and taxes, and organizational fees, etc. '
•considered maintenance expense rather than improvement investment. ' Less than 0.1 percent.
Labor Inputs. The average total number of employees utilized by firms in the mail sunrey sample was 4.8 per campground (Table 22). On average, family labor provided 2.8 employees while 2.0 employees were non-family. Total paid labor averaged 3.0 employees per campground (1. 9 part-time, 1.1 full-time) while unpaid labor averaged 1.8 employees of which 0.9 was part-time and 0. 9 was full-time. For firms in the sample, average total labor used per campsite was 0.08 employees.

Type of
Labor
Family Non-family
Total
LSA STATION BULLETIN 739
TABLE22
Average Number of Employees for Firms in the Mail Survey Sample, 1973·
Average Number of Employees
Paid Labor Unpaid Labor
part-time full-time part-time full-time
0.6 0.6 0.8 0.8 1.3 0.5 0.1 0.1
- -1.9 1.1 0.9 0.9
·Based on 89 valid responses.
Total
2.8 2.0
4.8
29
Labor inputs were analyzed for coastal and inland campgrounds in the mail sample (Table 23). Coastal firms used, on average, more employees (5.8) than inland firms (4.2 employees). However, this difference was not statistically significant. Similarly, no significant differences between coastal and inland firms in average number of full-time, parttime, paid, or unpaid employees used, were found.
TABLE23
Average Total Full-time, Part-time, Paid, and Unpaid Employees by Geographic Location for Firms in the Mail Survey Sample, 1973
Number of Average Number of Employees
Location Firms Full-Time Part-Time Paid Unpaid Total
Coastal firms 34 2.2 3.6 4.0 1.7 5.8 in! and firms 55 1.8 2.4 2.4 1.8 4.2
Total or average 89 2.0 2.8 3.1 1.7 4.8
The impact of firm size on labor usage by firms in the mail sample is more noticeable (Table 24).
Differences in average total number of employees among firm size categories were .significant except between the middle two categories. Differences in average total number offull-time employees among all but the first {1-49) and second (50-99) and second and third (100-199) size categories were statistically significant. For average number of part-time employees, only the differences between the first and fourth, second 'and fourth, and third and fourth size categories were significant. Differences

30 LSA STATION 8 ULLETIN 739
TABLE24
Average Total Full-time, Part-time, Paid, and Unpaid Employees by Firm Size Category for Firms in the Mail Survey Sample, 1973
Finn Size Category Number of Average Number of Employees
Number of Campsites Firms Full-Time Part-Time Paid Unpaid Total
I -49 30 1.1 1.7 1.2 1.5 2.7 SO- 99 32 1.8 2.6 2.1 2.3 4.4 100 - 199 20 2.6 2.6 3.5 1.7 5.2 200 and more 7 5.1 9.3 13.8 0.6 14.4
- - - -- --Total or average 89 2.0 2.8 3.1 1.7 4.8
in average number of paid employees among firm size categories were all statistically significant except between the first and second and second and third categories. None of the differences in average number of unpaid employees among size categories was significant.
The impact of firm size on labor usage was further substantiated by the results of correlation analysis. Total labor (r = 0.61), total full-time (r = 0.56) and part-time (r = 0.43) labor, and total paid labor (r = 0.67) were all significantly related to firm size in terms of number of campsites for campgrounds in the mail sample."
Average total number of employees per campsite decreased with increasing firm size over the first three size categories. Firms in the smallest size category (1 - 49 campsites) employed an average 0.12 laborers per campsite with the other size categories using 0.07, 0.04, and 0.07 employees per campsite. Differences in per-campsite labor usage among all size categories were significant. It can thus be concluded that economies of scale with respect to labor inputs are present in Maine's private campground industry for firms ranging from one to 199 campsites in size_ The data also indicate that the most efficient firm size in terms of labor usage is something between 100 and 199 campsites with increases beyond the 199 site level resulting in increased labor costs per site.
Management Inputs. Management inputs were analyzed for campgrounds in the mail sample. The management input was estimated as the average number of hours per week of the campground operator's time spent during and out of season. In the mail sample, the operator represented the major (and in most cases the only) management input used. During the camping season, the average weekly hour input by the operator was approximately 68 hours (Table 25). In the off-season, the average
"All correlations significant at the 0.10 probability level.

32 LSA STATION BULLETIN 739
TABLE26
Estimated Average Total Number ofln-Season and Off-Season Hours Per Week of Operator Input by Operators of Campgrounds
In the Mail Survey Sample by Firm Size Category, 1973
Firm Size Category Number of Average Total No. ofHrs:/Week
No. of Campsites Firms In-Season Out-of-Season
1 - 49 31 48.3 5.4 50 - 99 34 77.3 18.3 100-199 20 86.8 20.S 200 and more 7 60.3 21.4
Total or average 92 68.3 14.6
theory, the extent of this advantage is measured as the percent difference between the highest selling price e.stablished firms can charge for their output without attracting new firms (i.e., the maximum entry-forestalling price) and the minimum average production costs of established firms. Actual measurement of this variable is, in practice, extremely difficult. An acceptable surrogate measure of the "height" of barriers to entry is an estimate of the minimum capital investment necessary for a new firm to enter the market. Other barriers also exist for entry into Maine's private campground industry. These include institutional barriers, availability of land as a factor of production, and the length of time required to establish a profitable campground.
MINIMUM CAPITAL INVESTMENT
Though one campground in the mail survey sample reported a total capital investment of $1,500, perhaps a more accurate measure of the investment barrier to entry for Maine's campground industry is the average total investment required to enter the campground market in the smallest size category. Historically, the trend has been for new firms to enter the market on a small scale and expand as consumer demand and available capital allowed. Based on analysis of firms in the mail sample, the minimum average investment required to enter Maine's campground market in the smallest (i.e., l-49 campsite) category is $64,000. Market entry in one of the three larger size categories would require average capital investments of $113,000; $213,000; and $653,000 for SO to 99, 100 to 199, and 200 and more campsites, respectively. In Maine, the height of the investment barrier prospective new firms face in entering the campground market is essentially dependent upon firm size regardless of geographic location.

LSA STATION BULLETIN 739 33
Many campgrounds are developed on land already owned by the developer. For prospective new firms in this situation, a more useful measure of the investment barrier might be the level of development costs (i.e., total capital investment less land investment value). Minimum average costs for development of a campground having less than SO campsite's totaled $31,843. Entering Maine's private campground market in one of the three larger size categories entailed average development costs equal to $59,382; $118,229; and $452,917 for a campground having 200 or more campsites. Thus, even if development costs represent the only capital investment necessary to competitively enter the campground market in Maine, these costs still represent a substa~tial barrier to overcome.
INSTITUTIONAL BARRIERS
Campgrounds in Maine must meet minimum state health regulations and specifications as outlined by the Division of Health Engineering, Maine Department of Human Services(7). All campgrounds must also comply with standards established in the State of Maine Plumbing Code(9). Regulations pertaining to eating places and swimming pools also apply to private campgrounds where these facilities are provided(8). Since all campgrounds in Maine must meet regulations, specifications, and standards established by State government, these do not necessarily represent advantages older firms have over potential new firms. However, compliance with the various codes does translate into monetary cost which must be met by entering firms and therefore is a barrier to entry. In specific cases where major changes in State Codes make compliance for entering firms substantially more expensive than similar costs incurred by established firms, these institutional barriers then become more significant.
Campgrounds must also comply with State and local zoning laws and ordinances. A campground developed in an unorganized township must meet application requirements of the Land Use Regulation Commission. If the proposed development is in an organized township and involves 20 or more acres, application must be made to the Maine Department of Environmental Protection under the Site Selection Act. To the exterit that these State and local laws, ordinances, and requirements Yary from place to place, new firms attempting to enter the market at different locations around the State may find institutional barriers more or less difficult to overcome.
LAND AVAILABILITY
Another potential barrier to market entry in Maine is the availability of land suitable for campground development. It is likely that the height of this barrier will also vary from one location to another, being more

34 LSA STATION BULLETIN 739
significant in areas heavily developed for tourism and areas where the land is already devoted to a specific use (e.g., pulpwood production). It seems certain that land will become an increasingly scarce and expensive resource in the future. Leasing of land may be an important alternative means of acquiring necessary land inputs under conditions of limited availability of this important factor of production.
START-UP PERIOD
Operators of campgrounds personally interviewed reported start-up periods, i.e., the length of time required for the campground to reach the break-even point, ranging from zero to 14 years in duration. The average time period required for firms in the interviewed sample to reach the break-even point (i.e., the point at which receipts equal expenses) was 4.5 years. This represents a barrier to entry in Maine's private campground market because new entrants must have financial resources adequate for covering deficits incurred before the break-even point is reached.
Facilities and Services
Facilities and services offered by Maine's private campgrounds constitute an extremely important structural component of the industry. Private campgrounds distinguish themselves from public campgrounds primarily by the facilities and services they offer -the camper. Perhaps more importantly, they provide the basis for product differentiation within the industry.
A general classification of facilities and services developed by Connors and Whittaker (3, p. 9) was used as a guide to describe the facilities and services offered by firms in the personally interviewed sample. The Connors-Whittaker classification employs three categories - basic, convenience, or luxury - to group facilities and services offered by private campgrounds. With the exception of boating facilities and pit toilets, basic facilities and services were available at a majority of campgrounds in the interviewed sample (Table 27). Boating facilities are limited to those campgrounds located directly on a lake and pit toilets are restricted to primitive campsites and are not permitted for general use by campgrounds under State health standards. Hot water and showers were the most frequently offered of the convenience facilities (% percent of the firms interviewed) and electricity at campsites, offered by 93 percent of the firms, the most popular from the luxury group.
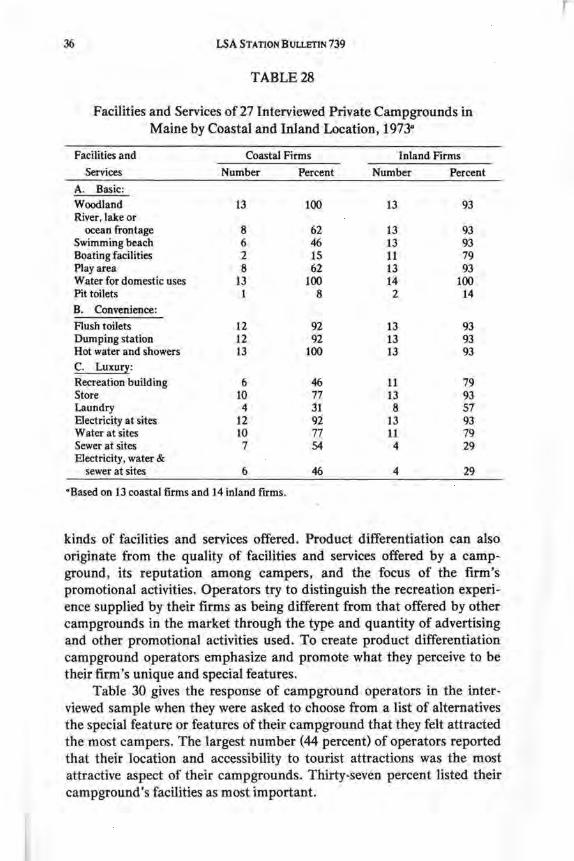
Facilities and services were anlayzed by location (Table 28) and firm size (Table 29), for the interviewed sample of private campgrounds. In general, smaller percentages of coastal firms offered the basic facilities and services listed, both groups were similar in their offerings from the

LSA STATION BULLETIN 739 35
convenience category, and slightly higher percentages of inland firms reported facilities and services offered from the luxury category. It is not possible to determine whether differences between coastal and inland firms were statistically significant. However, the data do suggest that inland firms offer a broader range of facilities and services than coastal campgrounds.
TABLE27
Facilities and Services at 27 Interviewed Private Campgrounds in Maine, 1973
Facilities Number and Services Firms Percent
Basic:
Woodland 26 96 River , lake or ocean frontage 21 78 Swimming beach 19 70 Boating facilities 13 48 Play area 21 78 Water for domestic uses 27 100 Pit toilets 3 11
Convenience" :
Flush toilets 25 93 Dumping Station 25 93 Hot water and showers 26 96
Luxury: Recreation building 17 63 Store 23 85 Laundry 12 44 Electricity at sites 25 93 Water at sites 21 78 Sewer at sites 11 41 Electricity, water and
sewer at sites 10 37 Planned activities 10 37
·In Maine, flush toilets, dumping station, and hot water and showers are required by law.
When analyzed by firm size, the data indicated that slightly higher percentages of firms in the smaller two categories offered basic facilities and services. In general, frequency distributions for all size categories for the convenience and luxury facilities and services were similar.
It is apparent that private campgrounds in the interviewed sample offer a heterogeneous product ranging from a primitive to a luxury camping experience. Campground location and size have little impact on the
36 LSA STATION BULLETIN 739
TABLE28
Facilities and Services of 27 Interviewed Private Campgrounds in Maine by Coastal and Inland Location, 1973°
Facilities and Coastal Firms Inland Firms
Services Number Percent Number Percent
A. Basic:
Woodland 13 100 13 93 River, lake or
ocean frontage 8 62 13 93 Swimming beach 6 46 13 93 Boating facilities 2 15 11 79 Play area 8 62 13 93 Water for domestic uses 13 100 14 100 Pit toilets 1 8 2 14
B. Convenience:
Flush toilets 12 92 13 93 Dumping station 12 92 13 93 Hot water and showers 13 100 13 93 C. Luxury:
Recreation building 6 46 11 79 Store 10 77 13 93 Laundry 4 31 8 57 Electricity at sites 12 92 13 93 Water at sites 10 77 11 79 Sewer at sites 7 54 4 29 Electricity, water &
sewer at sites 6 46 4 29
•Based on 13 coastal firms and 14 inland firms.
kinds of facilities and services offered. Product differentiation can also originate from the quality of facilities and services offered by a campground, its reputation among campers, and the focus of the firm's promotional activities. Operators try to distinguish the recreation experience supplied by their firms as being different from that offered by other campgrounds in the market through the type and quantity of advertising and other promotional activities used. To create product differentiation campground operators emphasize and promote what they perceive to be their firm's unique and special features.
Table 30 gives the response of campground operators in the interviewed sample when they were asked to choose from a list of alternatives the special feature or features of their campground that they felt attracted the most campers. The largest number (44 percent) of operators reported that their location and accessibility to tourist attractions was the most attractive aspect of their campgrounds. Thirty-seven percent listed their campground 's facilities as most important.
r

LSA STATION BULLETIN 739
TABLE 29
Facilities and Services of 27 Interviewed Private Campgrounds in Maine by Firm Size Category, 1973
Facilities and Firm Size Class (No. of Campsites)
Services 1- 49" 50 - 99' 100 · 199' 200' -percent-
Basic:
Woodland 86 100 100 100 River, lake or ocean
frontage 86 100 62 67 Swimming beach 86 100 38 67 Boating facilities 5.7 67 38 33 Play area 71 83 75 83 Water for domestic uses 100 100 100 100 Pit toilets 14 33 0 0
Convenience:
Flush toilets 86 83 100 100 Dumping station 86 100 88 100 Hot water and showers 100 83 100 100 Luxury:
Recreation building 29 83 50 100 Store 86 100 75 83 Laundry 14 so so 67 Electricity at sites 86 83 100 100 Water at sites 57 67 88 100 Sewer at sites 43 so 12" 67 Electricity, water
& sewer at sites 43 33 12 67
·Based on valid responses from seven firms. •Based on valid responses from six firms . 0 Based on valid responses from eight firms. •Based on valid responses from six firms .
Camper Use
37
Relationships existing between the individual firm and its customers (campers) are important structural components of the private campground industry. These relationships can be described using a variety of measures of camper use.
OCCUPANCY RATES
The occupancy rate of a private campground is defined as the average percent of campsites occupied during a specified time period . Occupancy rates measure a firm 's physical sales relative to its overall productive capacity (i.e., total number of campsites available). In general , high occupancy rates are necessary for financial success.

38 LSA STATION BULLETIN 739
TABLE30
Campground Features Identified By Interviewed Operators As Attracting The Most Campers0
Number Item Firms
Location and accessibility to tourist attractions 12
Accessibility to major highway S Campground's facilities 10 Natural beauty of campground site 8 Natural beauty of surrounding area 7 Other S
·Based on valid responses from 27 firms.
Percent"
44 18 37 30 26 18
•Does not total to 100 percent since there was more than one response per firm.
<Includes enforcement of regulations (quiet hours, no drinking, etc.), cleanliness, family atmosphere (quiet), and good management.
The frequency distribution of average seasonal occupancy rates for campgrounds in the mail survey sample is shown in Table 31. Nearly half had rates of SO percent or less. Only 13 percent of the sample had seasonal occupancy rates greater than 80 percent. Rates ranged from a minimum of 10 percent to a maximum of 95 percent averaging 53 percent for all firms in the sample. The difference in average seasonal occupancy rates between inland (SO percent) and coastal (58 percent) firms was not statistically significant.
TABLE31
Frequency Distribution of Mail Survey Respondents by Average Seasonal Occupancy Rates, 1973
Occupancy Rates (percent)
1- 10 11-20 21- 30 31-40 41 - SO 51 - 60 61-70 71- 80 81 - 90 91 · 100
Total
Number of Firms
2 9 8
12 11 16
9 8 9 2
86
Percent of Total
2 11
9 14 13 18 11 9
11 2
100
Cumulative Percent
2 13 22 36 49 67
· 78 87 98
100

LSA STATION BULLETIN 739 39
Average seasonal occupancy rates were analyzed by firm size category (Table 32). Average rates ranged from SO percent for firms in the smallest size category to 75 percent for the largest campgrounds in the sample. Differences in average seasonal rates among the four size categories were not statistically significant.
TABLE32
Average Seasonal Occupancy Rates by Firm Size Category for Firms in the Mail Survey Sample, 1973°
Firm Size Category (number of campsites)
1 - 49 50-99 100 - 199 200and more
•Based on 82 valid responses .
Number of Firms
27 32 17 6
SEASONAL DISTRIBUTION OF CAMPER USE
Average Seasonal Occupancy Rates
(percent)
so 51 70 75
The seasonal distribution of camper use (measured as average proportion of total business during 1973) as estimated by 27 personally interviewed operators is illustrated in Table 33. The seasonal peak occurs during July and the first two weeks in August where an average of 65 pe~cent of use occurred.
DISTRIBUTION OF CAMPER USE BY DAYS OF THE WEEK
For firms in the interviewed sample, occupancy rates on weekdays, non-holiday weekends, and holiday weekends (Memorial Day, Fourth of July, and Labor Day weekends) in 1973 averaged 63, 77, and 85 percent, respectively. On weekdays, half the . firms in the sample reported occupancy rates of less than 65 percent while on non-holiday weekends reported occupancy rates were greater than 79 percent for half of the firms. During the three holiday weekends, half of the interviewed firms had rates in excess of 95 percent.
LENGTH OF ST A Y OF CAMPERS
Firms in the interviewed sample reported that, on average, 27 percent of all campers stayed only overnight, 24 percent stayed for a weekend, 21 percent stayed for one week, and 16 percent for two weeks. Campers who

40 LSA STATION BULLETIN 739
stayed two to three weekdays or for periods of a month or longer comprised the smallest proportions of the average campground 's clientele accounting for seven and five percent, respectively.
TABLE33
Estimated Seasonal Distribution Of Average Camper Use At 27 Interviewed Campgrounds During 1973
Time Period
April and May June 1 - 15 June 16 - 30 July 1 - 15 July 16 - 31 August 1 - 15 August 16 - 31 Sept. - Nov. Dec. - March
Total
RESIDENCE OF CAMPERS
Average Percent Use
2.0 4.5 7.8
21.8 22.5 20.3 15.2 5.4 0.5
100.0
Accumulative Percent
2.0 6.5
14.3 36.1 58.6 78.9 94.1 99.5
100.0
In 1973, firms in the interviewed sample reported that an average of 68 percent of all campers were not residents of Maine. A sampling of campers at member campgrounds of the Maine Co-operative Camping Areas Association (MECCA)12 during the summer of 1974 showed that 80 percent were nonresidents (5, p. 3). Average percentage of nonresident campers at firms in the interviewed sample was not significantly different between coastal and inland locations or among firm size categories.
SEASON LENGTH
Table 34 shows the frequency distribution of private campgrounds in the mail survey sample by length of season. Season length ranged from 73 to 356 days per year with an average length for the sample of 175 days. Average season length did not significantly differ between coastal and inland campgrounds. There were also no significant differences in average season length among firm size categories.
"This organization has recently changed its name to Maine Campground Owners Association (MECOA).

LSA STATION BULLE.TIN 739
TABLE34
Frequency Distribution ofMail Survey Respondents by Length of Season, 1973°
Season Length Number of Percent of Cumulative (days) Firms Total Percent
1 • 93 8 10 10 94 -124 14 15 25
125 · 155 30 36 61 156 · 186 11 13 74 187 · 217 10 12 86 356 12 14 100
·Based on 85 valid responses.
Market Concentration
41
Market concentration or the degree of seller concentration refers to the number or size distribution of firms in an industry. Market concentration was measured as the percentage of aggregate sales accounted for by a given number of campgrounds. Aggregate sales were measured i'n terms of number of site-days sold. A total of 598,080 site-days was sold by firms in the mail sample in 1973.
Market concentration among firms in the sample is shown in Table 35. There was a significant degree of seller concentration in Maine's private campground industry. Twelve firms, representing only 16 percent of the sample accounted for SO percent of aggregate sales. Individual firm shares of aggregate sales ranged from 0.1 to 10.7 percent, averaging 1.3 percent per campground.
TABLE35
Market Concentration Among Firms in the Mail Survey Sample Based on Percentage of Total Site-Days Sold in 1973
Percent of Aggregate Sales•
1-25 26-50 51 - 75 76 -100
Totals
Number of Firms
48 17 9 3
77
Percent of Firms
62 22 12 4
100
·Percent of total site-days sold in 1973 by firms in the mail survey sample.
Cumulative Percent
62 84 96
100

42 LSA STATION BULLETIN 739
.Average shares of aggregate sales for individual firms in the coastal (1.22 percent) and inland (1.34 percent) subgroups were not significantly different. Table 36 shows the average shares for individual firms by firm size category. Significant differences in average shares existed among all size categories except between the two smallest classes.
The degree of seller concentration in a market area influences the nature of competiton among firms in the industry. A high level of concentration and intense competition indicate that success for some firms is at the expense of others in the industry. Information about seller concentration may be important for individual firms in developing an effective marketing strategy.
TABLE36
Average Percentages Of Total Site-Days Sold By Geographic Location For Firms In The Mail Survey Sample, 1973
Firm Size Category (number of campsites)
1- 49 SO - 99
100-199 200and more
Total
Firm Ownership Pattern
Number of Firms
23 29 18
7
77
Average Percentage of Aggregate Sales Per Campground
0.37 0.94 1.71 4.78
1.30
Most private campgrounds in the mail survey sample were owned by individuals. Fifty-eight (63 percent) of the 92 sample firms were proprietorships. Twenty-five firms (27 percent) were incorporated and the remaining nine campgrounds (10 percent) were owned in partnership.
SUMMARY AND CONCLUSIONS
The major objective of this research was to assemble basic, quantitative data for Maine's commercial campground industry and to analyze these data for the purpose of providing a detailed description of the
r
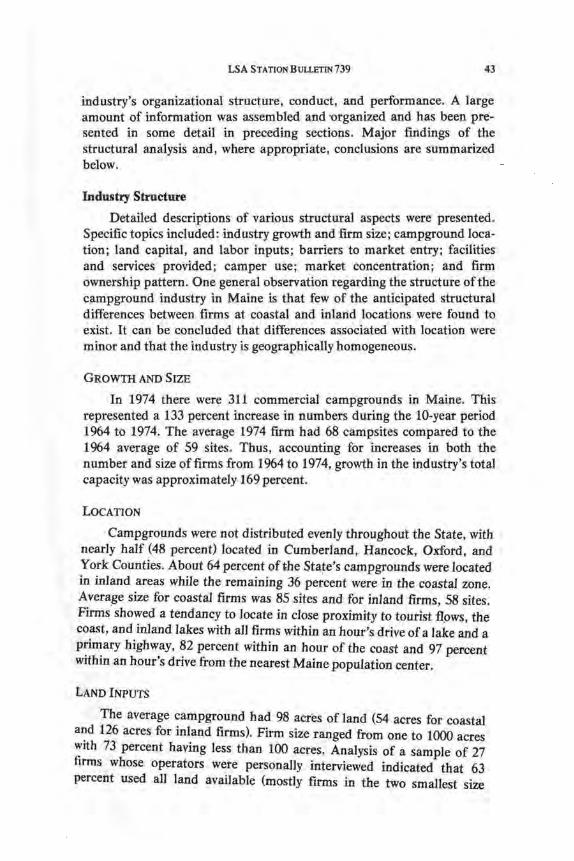
LSA STATION BULLETIN 739 43
industry's organizational structure, conduct, and performance. A large amount of information was assembled and ·organized and has been presented in some detail in preceding sections. Major findings of the structural analysis and, where appropriate, conclusions are summarized below.
Industry Structure
Detailed descriptions of various structural aspects were presented. Specific topics included: industry growth and firm size; campground location; land capital, and labor inputs; barriers to market entry; facilities and services provided; camper use; market concentration; and firm ownership pattern. One general observation regarding the structure of the campground industry in Maine is that few of the anticipated structural differences between firms at coastal and inland locations were found to exist. It can be concluded that differences associated with location were minor and that the industry is geographically homogeneous.
GROWTH AND SIZE
In 1974 there were 311 commercial campgrounds in Maine. This represented a 133 percent increase in numbers during the 10-year period 1964 to 1974. The average 1974 firm had 68 campsites compared to the 1964 average of 59 sites. Thus, accounting for increases in both the number and size of firms from 1964 to 1974, growth in the industry's total capacity was approximately 169 percent.
LOCATION
Campgrounds were not distributed evenly throughout the State, with nearly half (48 percent) located in Cumberland, Hancock, Oxford, and York Counties. About 64 percent of the State's campgrounds were located in inland areas while the remaining 36 percent were in the coastal zone. Avera_ge size for coastal firms was 85 sites and for inland firms, 58 sites. Firms showed a tendancy to locate in close proximity to tourist fl9ws, the coast, and inland lakes with all firms within an hour's drive of a lake and a primary highway, 82 percent within an hour of the coast and 97 percent within an hour's drive from the nearest Maine population center.
LAND INPUTS
The average campground had 98 acres of land (54 acres for coastal and 126 acres for inland firms). Firm size ranged from one to 1000 acres with 73 percent having less than 100 acres. Analysis of a sample of 27 firms whose operators were personally interviewed indicated that 63 percent used all land available (mostly firms in the two smallest size

44 LSA STATION BULLETIN 739
· categories). A weighted average land-use ratio (total land available divided by total land in use) for the 27 firms was 1.45 suggesting relatively intensive utilization of land inputs. This indicates that there is only moderate potential for the expansion of existing campgrounds. An average of 0.8 acres of developed land per campsite was in use by the 27 sample firms.
CAPITAL INPUTS
Average total capital investment for campgrounds in 1973 was $159,859, ranging from a minimum of $1,500 to over $1 million. The difference in average investment between coastal ($197,469) and inland ($137,293) campgrounds was not statistically significant. Differences in average investment among campground size categories were significant. Firms in the one to 49 campsite category averaged $64,090 of total capital investment, while values for the 50-99, 100-199, and 200+ size categories were $113,180, $213,229, and $652,917, respectively. A significant positive correlation between total capital investment and firm size emphasized this relationship.
Average investment in land was $68,482 per campground, accounting for 40 percent of total average capital investment. A large, but not statistically significant, difference in land investment existed between coastal ($97,862) and inland ($50,979) campgrounds. It is interesting to note that this difference existed despite the fact that coastal firms were on average significantly smaller in terms of total land area than inland firms . Average investments in land, land improvements ($24,070), and buildings ($36,765) accounted for 76 percent of average total investment. No significant differences in average itemized investments existed between coastal and inland campgrounds for any of the 11 investment items analyzed. Average investment in land was significantly different among all size categories except the two smallest.
Average total and itemized capital investments were calculated and analyzed on a per-campsite basis to identify scale economies. Average total per-site investment was $2,115 with coastal campgrounds averaging $2,297 and inland firms $2,003 per campsite. For the sample as a whole, average per-site investment decreased with increasing firm size for the first three size categories , while firms in the largest size group had higher average investment values. None of these differences was statistically significant, however, suggesting that there is no significant increase in economic efficiency, with respect to capital inputs, with increasing firm size for Maine's private campgrounds. The same result was noted within coastal and inland subgroups. Analysis of per-site itemized investments showed no significant scale economies with respect to any specific investment category.

LSA STATION BULLETIN 739 45
LABOR AND MANAGEMENT INP_UTS
Campgrounds in the sample utilized an average of 4.8 employees per campground, with an average 2.8 family and 2.0 non-family workers. Paid labor averaged 3.0 employees (1.9 part-time and 1.1 full-time) and unpaid labor 1.8 employees (.9 part-time and .9 full-time) per campground.' Coastal firms had more employees (5.8) than inland firms (4.2), but the difference was not statistically significant. Labor inputs for firms in the one to 49, SO to 99, 100 to 199, and 200+ campsite categories averaged 2.7, 4.4, 5.2, and 14.4 employees, respectively. All differences in !abor inputs among size categories, except between the middle two, were significant. Correlation analysis was used to further investigate the effect of firm size on labor usage. A significant positive correlation existed between total number of employees and campground size. Labor inputs per-campsite were analyzed by firm size category. Per-site labor use declined significantly with increasing size for the first three categories and .increased significantly from the third to the largest. This indicates the presence of scale economies with respect to labor inputs for Maine's private campgrounds. In addition, the data suggest that firms in the 100 to 199 campsite category make the most efficient use oflabor inputs.
The management input of a campground was defined and estimated as the average number of hours per week spent by the campground operator in activities rel3:ting to operation of the campground. During the camping season the average weekly hour input was ab~ut 68 hours with operators of coastal firms and inland firms averaging 78 and 63 hours respectively. In the off-season, the average time input was approximately 15 hours per week with operators of coastal and inland firms averaging 17 and 13 hours respectively. No significant differences existed between coastal and inland locations. Campground size had few significant impacts on the amount of operator input required. Operators of mail survey sample campgrounds had been in their current position an average of 7.1 years. Thirty-three percent reported campground operation as their principle employment.
BARRIERS TO ENTRY
Four specific barriers to entry into Maine's commercial campground industry were identified. They were: (1) minimum capital investment required, (2) institutional barriers, (3) land availability, and (4) the length of time required for the campground to reach the break-even point. Minimum capital investment was measured as development costs since in many cases the entrepreneur already owns the land. Institutional barriers include state and local laws and regulations applying to campgrounds. The large initial investment necessary to enter the industry is regarded as

46 LSA STATION BULLETIN 739
the most significant barrier though interviewed operators indicated that the most critical problem they face is the increasing number of State regulations.
FACILITIES AND SERVICES
Campgrounds in the interviewed sample offered a variety of facilities and services providing camping experiences ranging from primitive to luxurious. Facilities and services were grouped into three categories: (1) basic, (2) convenience, (3) luxury. In general, smaller percentages of coastal campgrounds offered facilities and services from the basic group while both were similar in their offerings from the convenience category. Slightly higher percentages of inland firms provided facilities and services classified as luxury. In general, frequency distributions of facilities and services provided by campgrounds in each size category were similar though higher percentages of firms in the smaller two categories provided facilities and services from the basic group.
CAMPER USE
Seasonal occupancy rates averaged 53 percent with no significant difference between coastal (58 percent) and inland (SO percent) campgrounds. Average rates ranged from SO percent for firms in the smallest size category to 75 percent for the largest campgrounds. Differences among size groups were not significant. Camper use reached a peak during the month of July and first two weeks of August when an average of 65 percent of use occurred.
Campground operators reported that an average of 27 percent of all campers stayed only overnight, while 24 percent stayed for a weekend, 21 percent stayed for one week and 16 percent for two weeks.
The length of the camping season ranged from 73 to 356 days per year with an average length of 175 days. Season length was not significantly different between coastal and inland campgrounds or among size categories.
MARKET CONCENTRATION
Market concentration was measured as the share of aggregate sales accounted for by a given number of campgrounds. Twelve campgrounds (16 percent of sample) accounted for SO percent of the 598,080 site-days sold in 1973. Individual firm shares ranged from 0.1 to 10.7 percent averaging 1.3 percent per campground. Average shares for coastal (1.2 percent) and inland (1.3 percent) firms were not significantly different. Significant differences in average shares of aggregate sales existed among all size categories except between the two smallest. The data indicate a

LSA STATION BULLETIN 739 47
relatively high degree of seller concentration in Maine's commercial campground industry. This could act as a barrier to entry especially for those wishing to enter on a small scale.
OWNERSHIP
Sixty-three percent of the campgrounds in the sample were proprietorships, 10 percent were owned in partnership, and 27 percent were incorporated.
REFERENCES
1. Bain, J. S. Industrial Organization, New York: John Wiley and Sons, Inc. , 1968.
2. Bevins, M. J., et. al., Analysis of the Campground Market in the Northeast: Report II -Privately Owned Areas. Bui. 679. Vermont Agricultural Experiment Station, University of Vermont, Burlington, Vermont, May 1974.
3. Connors, J. F. and J.C. Whittaker. Maine's Sebago-Long Lakes Campgrounds. Bui. 698. Life Sciences and Agriculture Experiment Station, University of Maine at Orono, September 1972.
4. Kottke, M. , Operations Analysis of Commercial Campgrounds in Connecticut. Bui. 432. Storrs .(\gricultural Experiment Station, University of Connecticut, Storrs, Connecticut, November 1974.
5. Krofta, R. N. and G. J. Seel. Camper Characteristics and Expenditures at Private Campgrounds in Maine. ARE 257. Department of Agricultural and Resource Economics, Life Sciences and Agriculture Experiment Station, University of Maine at Orono, February 1975.
6. "Maine and Tourism", Maine Business Indicators. XIX, No. 5. Portland, Maine: Maine National Bank, September 1974.
7. Maine Department of Human. Services. Rules and Regulations of the Department of Health and Welfare Relating to Mobile Parks and Camping Areas. Division of Health Engineering, Augusta, Maine, 1972.
8. . Rules and Regulations Relating to Catering Establishments, Establishments Preparing Food for Vending Machines or Dispensing Foods Other Than .in Original Sealed Packages, Eating and Lodging Places, Recreation and Overnight Camps. Division of Health Engineering, Augusta, Maine, 1972.
9. . State of Maine Plumbing Code. Division of Sanitary Engineering, Augusta, Maine, 1973.
10. Northeast Markets, Inc., Arthur D. Little, Inc., and William R. Fothergill. Tourism in Maine: Analysis and Recommendatio!ls . Report to Maine Vacation Travel Analysis Committee, 1974.
11. Outdoor Recreation Study Team of the University of Maine. Outdoor Recreation in Maine: A Study of the Supply of and the Demand for Outdoor Recreation , Maine Agricultural Experiment Station, University of Maine at Orono, 1965.