b02 chapter 02 - fxstreetcdn.fxstreet.com/images/learning_center/pdf/lc_unit_2_chapter_2.pdf ·...
TRANSCRIPT

Brought to you by
1. Basic Theories of Fundamental Analysis
2. Economical Indicators Related
3. Interest Rates
4. Sentiment Indicators
Topics covered in this chapter:
• The major theories in fundamental analysis, their detailed advantages and limitations.
• Different methods to make sure you trade sufficiently often during your windows of opportunity to make trading worthwhile.
• Different forms of short-term fundamental analysis using the most important indicators in the US economy.
• The main characteristics of interest rates: time value, opportunity cost, inflation and deflation expectations, and risk.
• How to assess the random walk theory and the market efficiency hypothesis in order to understand the value of behavioral finance today, one of the basis of contrarian investing.
• Sentiment indicators, with which to measure traders positions and more importantly, their expectations and intentions for the future.
© Learning Center – Unit B – Chapter 2 – p.1/49
B02 Chapter 02Fundamental Analysis

Brought to you by
In a free market , all price movement comes down to a supply and demand equation. As mentioned in Unit A, the same principle is valid for currencies: more demand indicates scarcity and leads to higher prices, while weaker demand means lower prices. At the same time, more supply and abundance leads to lower prices and less supply makes prices increase.
In this context, it is usually said that fundamentals are what drives prices up and down defining supply and demand. Fundamentals are excellent for developing an overall picture of the markets, sure, but still it's just a complementary perspective, and by no means the only one.
Conventional wisdom tells us that a wide gulf separates the theories forwarded by academic economists and the day-to-day of those who trade the markets. When approaching fundamental analysis from a practical perspective, as we shall do in this chapter, the wide gulf emerges as an unbridgeable gap.
If the principle mentioned at the start is true, then why do we periodically witness an increase in demand while prices escalate higher? According to the theory, it should be the other way round. In this chapter we examine whether or not traders can work around this apparent contradiction.
Many researchers agree that the disjunction actually exists: exchange rates exhibit volatility and persistent misalignments which seem largely unconnected to macroeconomic fundamentals. In this sense, we will examine how this comes to be and display a series of guidelines to make fundamental analysis operational for traders.
As a starting point, a basic understanding of the different models used in fundamental analysis will be conveyed. Then, we will guide you through explanations on how to use this type of analysis to get a long-term view of where prices are heading, as well as some hints on how to use it for near term forecasting. And finally, a totally different perspective on fundamentals will be disclosed.We deliver the know-how and you only have to decide if the resources provided are useful or not for you. Do we have a deal? Great, let's proceed!
© Learning Center – Unit B – Chapter 2 – p.2/49

Brought to you by
1. Basic Theories of Fundamental Analysis
One of the dominant debates among financial analysts is the relative validity of the two primary approaches of analyzing markets: fundamental and technical analysis. There are several points of distinction between fundamentals and technicals but it's true that both study the causes of market movements and both attempt to predict price action and market trends. Fundamentals, our main subject in this chapter, focus on financial and economic theories, as well as political developments to determine forces of supply and demand.
In general, the exchange rate of a currency versus other currencies is a reflection of the condition of that country's economy, compared to the other countries' economies. This assumption is based on the belief that the exchange is determined by the underlying health of the two nations involved in the pair.
When evaluating one nation's currency relative to another, fundamental analysis relies upon a broad understanding of multi-national macroeconomic statistics and events. Usually it examines core underlying elements that influence the economy of a particular currency. These might include, on the one hand, economic indicators such as interest rates, inflation, unemployment, money supply and growth rates. On the other hand, it also examines socio-political conditions which could impact on the level of confidence in a nation's government and affect the climate of stability.
Several experts agree on the fact that fundamental analysis is more effective in predicting trends for the long-term (one year or more), while technical analysis is more appropriate for shorter time scales and intraday trading. Nonetheless, empirical evidence from the previous chapter reveals that technical analysis is also capable of identifying long-term trends. Moreover, in this chapter we will prove that fundamental factors do trigger short-term developments on which you can capitalize.Our aim is to leave you with an understanding of both types of analysis even if you prefer one or the other as your primary tool to make your trading decisions.
Our Fundamental Market View section is constantly updated and an ideal place to get an overview of the macro-economical arena.
Fundamental analysts use different models to examine currency values and forecast future movements. Herewith we describe the major models for forecasting currency
© Learning Center – Unit B – Chapter 2 – p.3/49

Brought to you by
prices, their principles and limitations.
Purchasing Power Parity
The purchasing power parity model is based on the theory that exchange rates between currencies are in equilibrium when their purchasing power is the same in each of the two countries. An increase in a country's domestic price level means a change in its inflation rate. When this happens, the inflation rate is expected to be offset by an equivalent but opposite change in the exchange rate. According to the purchasing power parity model, if the value of a hamburger, for instance, is 2USD in the US and 1GBP in the UK, then the GBP/USD exchange rate must be 2USD per 1GBP (GBP/USD 2.0000). What if the actual interbank exchange rate displays GBP/USD 1.5000? In this case the Pound Sterling would be considered undervalued and the US Dollar overvalued.
Therefore, according to this model the two currencies should move towards the 2:1 ratio which is the price difference that same goods in both countries have. This also means that when a country's inflation is rising, the exchange rate for its currency should depreciate in relation to other currencies, in order to return to parity.
© Learning Center – Unit B – Chapter 2 – p.4/49

Brought to you by
When reading about the purchasing power parity, you'll notice many authors compare prices of hamburgers. There is a reason why hamburgers are a popular example: the weekly news and international affairs publication “The Economist” publishes the Big Mac Index which is an informal way to measure the purchasing power of two countries comparing the price of a Big Mac hamburger sold by McDonald's.A more formal measurement is published by the Organization for Economic Cooperation and Development (OCDE) using a basket of consumer goods and provides information as to whether the different currencies are under- or over valued against the USD.You can use the below links to compare both indicators:Big Mac IndexOECD PPP Index (click on “OECD statistics on Purchasing Power Parities (PPP)”)
In the absence of transportation and other transaction costs such as tariffs or taxes, competitive markets should theoretically equalize the price of an identical good in two countries (with prices expressed in the same currency). But in reality such costs exist and influence the cost of goods and services, and therefore should be considered when weighing prices. Unfortunately the purchasing power parity model does not reflect those costs when determining the exchange rates, being this its major weakness. Another weakness is the fact that the model only applies for goods and ignores services. Furthermore, other factors such as inflation and interest rate differentials impacting exchange rates, are not taken into account in this model.
Does the purchasing power parity model serves to determine exchange rates in the short-term?
No. This model is a measure to anticipate the long run behavior of exchange rates but not to trigger trades in the short-term. The idea behind this model is that economic forces will eventually equalize the purchasing power of currencies in different countries, a phenomenon which typically takes several years as the empirical evidence of the model shows.
© Learning Center – Unit B – Chapter 2 – p.5/49
Brought to you by
Interest Rate Parity
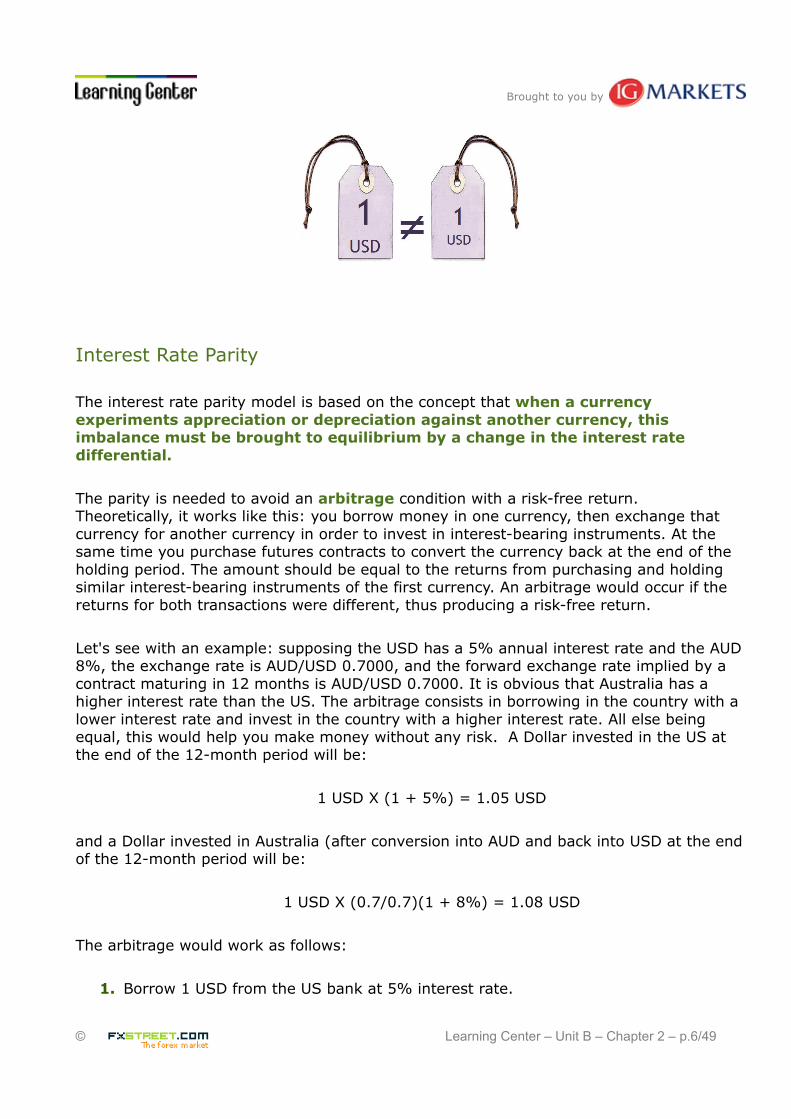
The interest rate parity model is based on the concept that when a currency experiments appreciation or depreciation against another currency, this imbalance must be brought to equilibrium by a change in the interest rate differential.
The parity is needed to avoid an arbitrage condition with a risk-free return. Theoretically, it works like this: you borrow money in one currency, then exchange that currency for another currency in order to invest in interest-bearing instruments. At the same time you purchase futures contracts to convert the currency back at the end of the holding period. The amount should be equal to the returns from purchasing and holding similar interest-bearing instruments of the first currency. An arbitrage would occur if the returns for both transactions were different, thus producing a risk-free return.
Let's see with an example: supposing the USD has a 5% annual interest rate and the AUD 8%, the exchange rate is AUD/USD 0.7000, and the forward exchange rate implied by a contract maturing in 12 months is AUD/USD 0.7000. It is obvious that Australia has a higher interest rate than the US. The arbitrage consists in borrowing in the country with a lower interest rate and invest in the country with a higher interest rate. All else being equal, this would help you make money without any risk. A Dollar invested in the US at the end of the 12-month period will be:
1 USD X (1 + 5%) = 1.05 USD
and a Dollar invested in Australia (after conversion into AUD and back into USD at the end of the 12-month period will be:
1 USD X (0.7/0.7)(1 + 8%) = 1.08 USD
The arbitrage would work as follows:
1. Borrow 1 USD from the US bank at 5% interest rate.
© Learning Center – Unit B – Chapter 2 – p.6/49

Brought to you by
2. Convert USD into AUD at current spot rate of 0.7000 AUD/USD giving 1.4285 AUD.3. Invest the 1.4285 AUD in Australia for the 12 month period.4. Purchase a forward contract on the 0.7000 AUD/USD (that is, covering your position
against exchange rate fluctuations).
And at the end of the 12-month period:
1. 1.4285 AUD becomes 1.4285 AUD (1 + 8%) = 1.5427 AUD2. Convert the 1.5427 AUD back to USD at 0.7000 AUD/USD, giving 1.0798 USD3. Pay off the initially borrowed amount of 1 USD to the US bank with 5% interest,
that is, 1.05 USD
The resulting arbitrage profit is 1.0798 USD − 1.0500 USD = 0.0298 USD, which is almost 3 cents of profit per each USD.The basic idea behind the arbitrage pricing theory is the law of one price, which states that 2 identical items will be sold for the same price and for if they do not, then a riskless profit could be made by arbitrage: buying the item in the cheaper market then selling it in the more expensive market. But contrary to the theory, arbitrage opportunities of this magnitude vanish very quickly because a combination of some of the following events occurs and reestablishes the parity: the US interest rates can go up, the forward exchange rates can go down, the spot exchange rates can go up or the Australian interest rates can go down. As we have seen in recent years during the Carry Trade, currencies with higher interest rates have characteristically appreciated rather than depreciated on the reward of future containment of inflation and of a higher yielding currency. This is the reason why this model alone is not useful either.
International Balance of Payments Model
Until the 90's the balance of payments theory focused primarily on the balance of trade, a sub account of the current account. This was due to the fact that capital flows were not as significant as nowadays and the trade balance made up the major part of the balance of payments for most world economies.
Under this model, a nation with a trade deficit will experience a reduction of its foreign exchange reserves it used to pay for the imported goods, as we have seen when we explained the trade balance in the video of Chapter A02. A country has to change its own currency for the exporters currency to pay for the goods - this makes its own currency depreciate.In turn a cheaper currency makes the nation's exported goods and services less expensive in the global market place while making imports more expensive. The simplified balance of
© Learning Center – Unit B – Chapter 2 – p.7/49

Brought to you by
payments model states that after an intermediate period, imports are forced down and exports rise, thus stabilizing the trade balance and the currency towards equilibrium.
Based on this model, many analysts forecast that the USD would fall in value against other major currencies, specially the Euro, due to the expanding US trade deficit. But in reality, international capital flows in the last decade have been characterized by global investors acquiring billions of assets in the US, yielding a net capital account surplus. This surplus, despite of statistical discrepancies and currency fluctuations, balanced the current account deficit.
Since the balance of payments is not only made up of the trade balance - it is largely made up of the current account balance - this model failed to accurately forecast exchange rate moves. The balance of payments model focuses largely on trade, while ignoring the increasing role of international capital flows such as foreign direct investment, bank loans and, more importantly, portfolio investments. These capital flows go into the capital account item of the balance of payments, and in some occasions a positive capital flow balances a deficit in the current account.
The explosion of capital flows and the trading of financial assets have given rise to the asset market model. The new reality has reshaped the way analysts and traders look at currencies as flows of funds into financial assets increase the demand for the currency they are denominated in. Conversely, a flow out of a countries' financial assets, such as equities and bonds, produces a decrease in the demand for its currency.
Asset Market Model
This model is similar to the balance of payments model, but instead of taking into account the balance of payments it focuses primarily on the current account. In order to understand both models, let's lay out some basic definitions:
The international balance of payments accounts for all the international economic transactions between individuals, businesses and government agencies in the domestic economy with the rest of the world. Every international transaction involving different currencies results in a credit and a debit in the balance of payments. Credits are transactions that increase the amount of money to domestic residents from foreigners, and debits are transactions that increase the money paid to foreigners. For instance, if a company in Brazil buys Spanish machinery, the purchase is a debit to the Brazilian account and a credit to the Spanish account.
The balance of payments account is divided in two main accounts: the current account and the capital account. The current account consists of international trade in goods and services and earnings on investments. In other words, it is the sum of the balance of trade
© Learning Center – Unit B – Chapter 2 – p.8/49

Brought to you by
(exports minus imports of goods and services), net income receipts (such as interest and dividends derived from the ownership of assets) and net unilateral transfer payments (such as direct foreign aid, worker remittances from abroad, etc.).The capital account consists of capital transfers (including debt forgiveness and migrant's transfers, among others) and the acquisition and disposal of non-produced and non-financial assets (representing the sales and purchases of non-produced assets such as franchises, copyrights, etc.).
A subdivision of the capital account, the financial account, records transfers which involve financial capital. It is the net result of public and private international investment flowing in and out of a country. This includes foreign-owned investment in the domestic economy (government and corporate securities, direct investment, domestic currency, etc.), and domestic-owned assets abroad (official reserve assets, government assets, and private assets). The official reserves account, which is a part of the financial account, is the foreign currency held by central banks, and it is used to compensate deficits in the balance of payment. When there is a trade surplus, the official reserves increase. Conversely, it decreases when there is a deficit.
This model strives to attain the equilibrium - a condition where the sum of debits and credits of the current account and the capital and financial accounts equal to zero. Under a balanced condition, the value of the domestic currency should also be at its equilibrium level. However, practical evidence shows that it deviates from equilibrium.
Let's take the example of the US and its trade deficit. We know that a country with a persistent current account deficit is importing more goods and services than selling. In the balance of payments, this appears as an inflow of foreign capital. Therefore, under this model, the US should finance the difference by borrowing or selling more capital assets, that is, creating a capital account surplus to compensate the current account deficit. In fact both accounts do not exactly offset each other because of statistical discrepancies in the model and exchange rate movements that modify the value of the recorded international transactions. But the main limitation to the model is that no direct correlation has been proved between the value of a nation's currency and the imbalance between the nation's capital account and current account.
The asset model approach considers currencies as being asset prices traded in an efficient financial market and consequently demonstrating a strong correlation with other markets, particularly equities. This is not always the case as many empirical studies evidence. Over the long run, it seems there is no relationship between a nation's equity markets and its currency value.
© Learning Center – Unit B – Chapter 2 – p.9/49

Brought to you by
Monetary Model of Exchange Rate Determination
This model aims to provide an explanation for the dynamic adjustment process that occurs as exchange rate moves towards a new equilibrium by considering monetary fundamentals such as money supply, income levels, or other variables. The concept behind it is that an increase in money supply leads to high interest rates as a result of a growing inflation. This is then followed by a depreciating currency as a means of correction towards a new equilibrium.
Followers of this model therefore see the growth of a nation's money supply in relation with inflation and inflation expectations. They sustain that a currency increases in value if there is a stable monetary policy and decreases if the monetary policy is erratic or unstable. In a later section, we shall see the relationship between money supply, inflation and interest rates.
In her book, “Day Trading and Swing Trading the Currency Market”, Kathy Lien explains about the Monetary Model:
One of the few ways a country can keep its currency from sharp devaluing is by pursuing a tight monetary policy. For example, during the Asian currency crisis, the Hong Kong dollar came under attack from speculators. Hong Kong officials raised interest rates to 300 percent to halt the Hong Kong dollar from being dislodged from its peg to the U.S. dollar. The tactic worked perfectly as speculators were cleared out by such sky-high interest rates. The downside was the danger that the Hong Kong economy would slide into recession. But in the end the peg held and the monetary model worked.”
Source: Kathy Lien, Day Trading and Swing Trading the Currency Market, Wiley Trading, Second Edition, 2009, pag.52
“Day Trading and Swing Trading the Currency Market” by Kathy Lien is a must read we recommend to all Forex traders.
The problem with this model is that it doesn't take into account the variables of the
© Learning Center – Unit B – Chapter 2 – p.10/49

Brought to you by
balance of payments described in the above model, specially the capital inflows that would take place as a result of higher interest rates in the domestic currency or a booming equity market. In any case its theoretical approach can be used to complement the big picture.
Real Interest Rate Differential Model
The real interest rate differential model is a variant of the above monetary model with a stronger focus on capital flows. It stipulates that the spot exchange rate tends to its equilibrium depending on the real interest rate differential. In recent years we have witnessed very high interest rates across the major economies. For many investors, currencies with high interest rates were attractive assets to buy, resulting in even higher exchanges rates for these appreciated currencies.
As with other models, the concept has its supporters and its detractors. Critics of the model argue that it focuses too much on capital flows and omits the nation's current account balance and other factors such as inflation, growth, etc. In any case, this model can be employed together with other models to determine the direction of the exchange rate move since its basic premises are quite logical.
Currency Substitution Model
By currency substitution it is meant the holding of a foreign currency at the expense of the domestic currency. Individuals usually adopt these measures as a protection against expected depreciation of the domestic currency or to take advantage of an increasing value of the foreign currency.
This theoretical model of exchange rate determination has assumed growing importance in recent years. Currency substitution, it has been argued, is a critical factor in the volatile behavior of exchange rates. It also has radical implications on monetary policy, although the model shows more convincing results when applied in underdeveloped countries where the impact of smart money rushing in and out has a deeper effect on the domestic economy.
Analysts following this model are looking for shifts in expectations of a nation's money supply as these can have an impact on the exchange rates - the same premise as in the monetary model. In anticipation of the reaction, investors position themselves accordingly in the market, triggering the self-fulfilling prophecy of the monetary model.
Following the monetary model, if a country increases money supply it is expected that
© Learning Center – Unit B – Chapter 2 – p.11/49
Brought to you by
inflation rises (there is more money to purchase the same goods). The investor following the currency substitution model would take advantage of the cause-effect described in the monetary model and sell the currency which is expected to lose value. This is the basic assumption of the model which theoretically brings prices towards parity.
This model tries to anticipate changes in the money supply and consequently gives more emphasis on interventions in the foreign exchange market. One of its limitation, though, is that domestic inflation depends not only on domestic but also on foreign financial policy because of the linkages between countries. Even in the long run, flexible exchange rates do not permit monetary interdependence.
As with the previous mentioned models, this one also fails to comprehend the whole picture as it is difficult to take in consideration all the factors affecting the relative value of currencies. For instance, a country with a strong current account surplus (resulting from a strong balance of trade surplus) has demonstrated that despite increasing its money supply (to buy stocks and bonds in the market place, for instance), it is unable to make its currency lose value. The money flowing into the country to pay for exported goods and services compensates the amount of new money injected into the economy.
Using fundamental models to forecast trends in the exchange rates can be quite difficult. The analyst shall examine several economic reports as many times the figures from one model alone are not sufficient. It is also important to go behind the figures, read the reports closely, and analyze their meaning in the global picture. In other words, you must read more than the headlines and see what is said between the lines!If you feel interest in using these approaches, make sure you are not seduced by the theory which represents a very common phenomenon. They can be intellectually quite stimulating but on the other side they can also overload you and make you succumb to the “paralysis of analysis.” Remember our first lesson in Unit A and the importance of building the big picture, but do not confound it with the practical decision making process.
© Learning Center – Unit B – Chapter 2 – p.12/49

Brought to you by
2. Economical Indicators Related
An economic indicator is a statistical or informative data collected and published on a regular basis by a government or private entity. The indicator records the activity in a particular economic sector or in an entire economy.
Economic indicators are important to Forex traders, because they represent vital data to understand the macro picture of a currency’s economy. They also help to anticipate future market activity and to determine whether a particular currency is over- or under valued. Macroeconomic indicators include figures such as growth rates, interest rates, inflation, employment, money supply and productivity.
Since any foreign currency transaction involves the exchange of one currency for another, fundamental analysis is also related to the supply and demand of each currency. Remember that in a free floating market it's supply and demand what ultimately determines the exchange rate. Hence, fundamental analysts try to ascertain the supply and demand balance by studying various economic indicators.
From the fundamental models covered in the previous section, we can understand that some economic indicators will affect the supply and demand of the domestic currency, while other indicators will be affected by it. As with technical indicators, fundamentals can also be classified as leading or lagging. The difference lies in whether an indicator tracks economic factors that will affect the future of the general economy or records an economical activity that has already taken place. Central banks, for instance, rely on economic indicators to formulate their monetary policy which, in turn, can have a significant effect on foreign exchange rates.
Some indicators work thus as leading indicators for other economical data. In this section, we will see how economic indicators are interrelated. The information herewith disclosed will help you design a plan of action, perfectly suitable to be combined with a technical approach.
A subsequent approach
Many analysts and traders agree that fundamental analysis can be very effective to see the big picture. But trading fundamentally in the long-term might not produce enough actual trades during your window of opportunity to make it worthwhile. Besides, many analysts also sustain that fundamental analysis has its limitations when used in the short-term, arguing that it can be very subjective. The following section is meant to deal with these limitations, and show you there is a way to trade fundamentally.
© Learning Center – Unit B – Chapter 2 – p.13/49
Brought to you by
There is no doubt exchange rate movements in the short-term can be news-driven. Announcements about interest rate changes or changes in the growth path of economies are some of the factors that impact exchange rates also in the short run. Nonetheless, when a report is to be released, the trader can have the analysis absolutely nailed but he could see no market reaction or even the exchange rate going in the opposite direction of what was expected.
This is because every economical data is somehow related to other data. The announcements have to be seen in their actual context, and there is a lot of information to keep track of. Moreover, it is more about the traders' perception of the announcement than the published figure itself.
Therefore, by means of the trading approach you are about to learn, you shall have the chance to focus on specific reports and how they relate to other reports in the context of certain economies. Sure it takes time to do it properly, especially when you are just starting, but it can be a very powerful tool. If you have the time and inclination, it's something worth exploring.
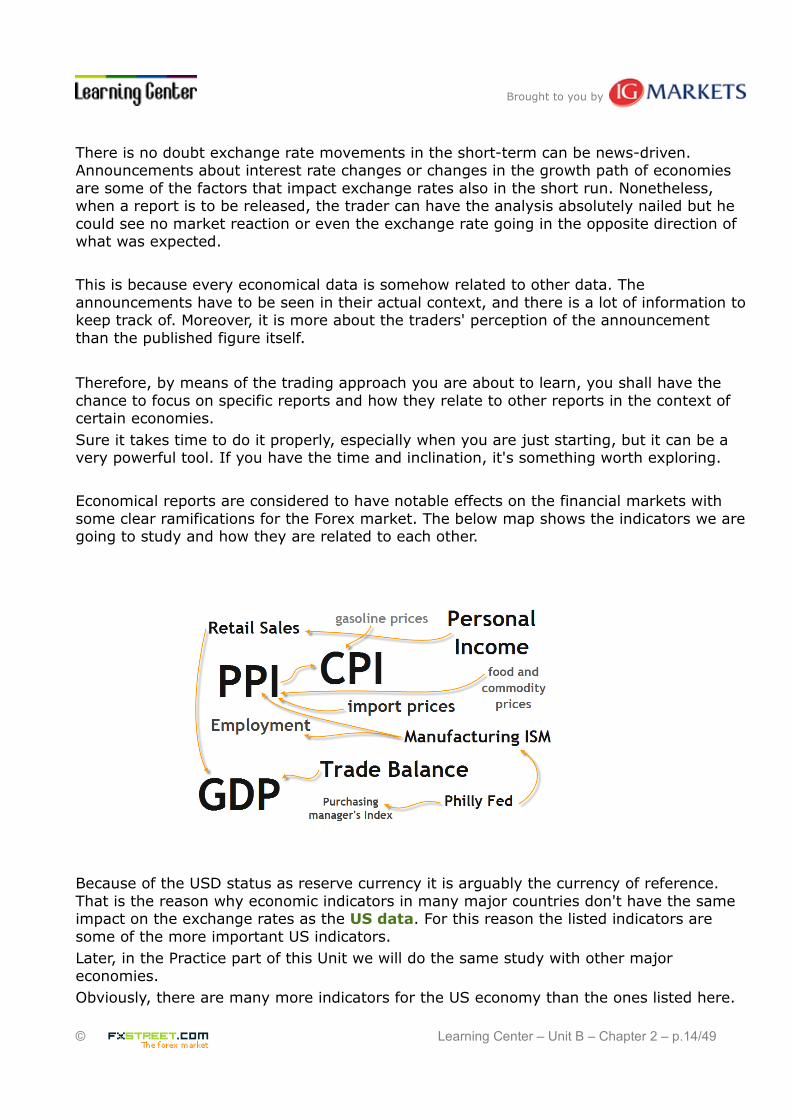
Economical reports are considered to have notable effects on the financial markets with some clear ramifications for the Forex market. The below map shows the indicators we are going to study and how they are related to each other.
Because of the USD status as reserve currency it is arguably the currency of reference. That is the reason why economic indicators in many major countries don't have the same impact on the exchange rates as the US data. For this reason the listed indicators are some of the more important US indicators. Later, in the Practice part of this Unit we will do the same study with other major economies.Obviously, there are many more indicators for the US economy than the ones listed here.
© Learning Center – Unit B – Chapter 2 – p.14/49

Brought to you by
But instead of listing the huge amount of figures that exist, we will pick only the ones that are being followed by the vast majority of traders worldwide, and relate them to each other. We will study here:
• Consumer Price Index (CPI)
• Producer Price Index (PPI)
• Gross Domestic Product (GDP)
• Retail Sales
• Personal Income
• Trade Balance
• Institute for Supply Management Manufacturing Index (ISM)
• Philadelphia Fed Index
• Goods and Services Imports
Take into account that economical indicators fade in importance depending on the economical circumstances. They come in and out of vogue and there are times traders pay much attention to a particular announcement and then it is replaced by another indicator which becomes more popular. The trader has to be flexible enough to watch an indicator with a completely different set of criteria from time to time.
Consumer Price Index (CPI)
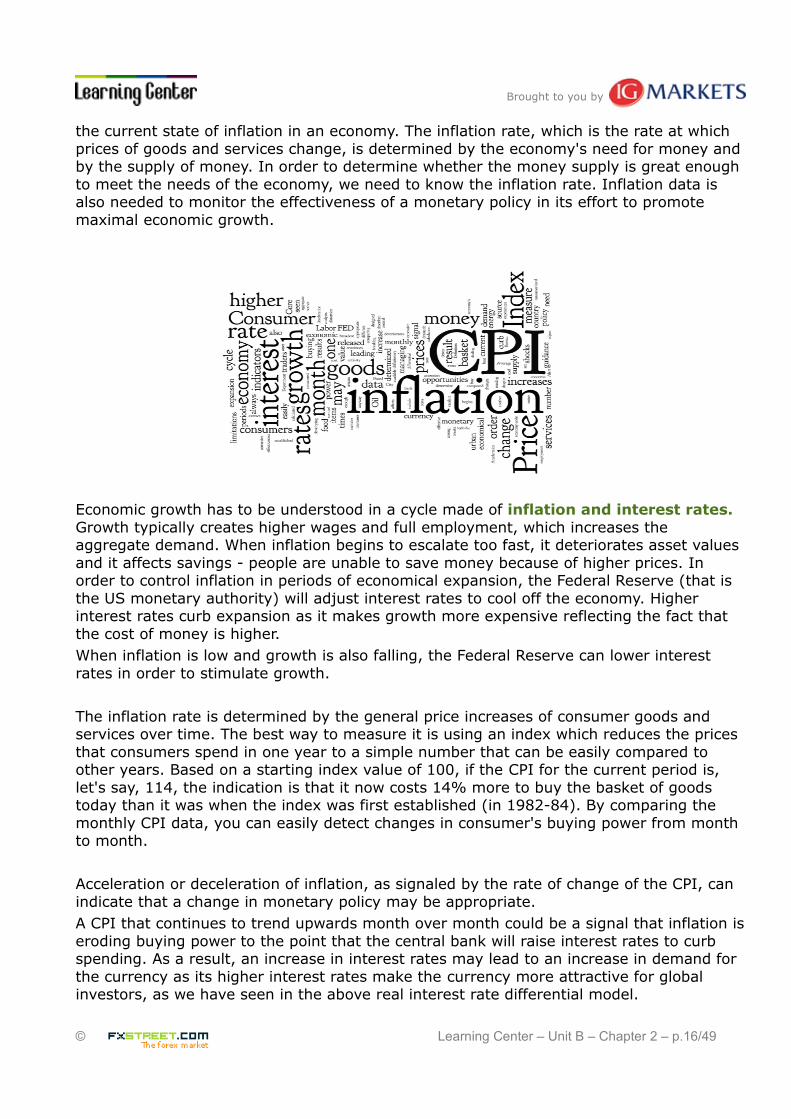
Definition: The CPI is a consumer-level index designed to measure pure price change of a fixed market basket of goods and services, representative of the purchases of a typical urban consumer. CPI is classified among the economy-wide indicators which are the broadest measures of productive activity and record the result for an entire economy.
The Core CPI is calculated in the same manner as the CPI but it excludes items with high volatility such as energy and food which are vulnerable to price shocks, leading to a distortion in the CPI calculation. Why does it matter? It is considered to be one of the most effective indicators revealing
© Learning Center – Unit B – Chapter 2 – p.15/49
Brought to you by
the current state of inflation in an economy. The inflation rate, which is the rate at which prices of goods and services change, is determined by the economy's need for money and by the supply of money. In order to determine whether the money supply is great enough to meet the needs of the economy, we need to know the inflation rate. Inflation data is also needed to monitor the effectiveness of a monetary policy in its effort to promote maximal economic growth.
Economic growth has to be understood in a cycle made of inflation and interest rates. Growth typically creates higher wages and full employment, which increases the aggregate demand. When inflation begins to escalate too fast, it deteriorates asset values and it affects savings - people are unable to save money because of higher prices. In order to control inflation in periods of economical expansion, the Federal Reserve (that is the US monetary authority) will adjust interest rates to cool off the economy. Higher interest rates curb expansion as it makes growth more expensive reflecting the fact that the cost of money is higher. When inflation is low and growth is also falling, the Federal Reserve can lower interest rates in order to stimulate growth.
The inflation rate is determined by the general price increases of consumer goods and services over time. The best way to measure it is using an index which reduces the prices that consumers spend in one year to a simple number that can be easily compared to other years. Based on a starting index value of 100, if the CPI for the current period is, let's say, 114, the indication is that it now costs 14% more to buy the basket of goods today than it was when the index was first established (in 1982-84). By comparing the monthly CPI data, you can easily detect changes in consumer's buying power from month to month.
Acceleration or deceleration of inflation, as signaled by the rate of change of the CPI, can indicate that a change in monetary policy may be appropriate.A CPI that continues to trend upwards month over month could be a signal that inflation is eroding buying power to the point that the central bank will raise interest rates to curb spending. As a result, an increase in interest rates may lead to an increase in demand for the currency as its higher interest rates make the currency more attractive for global investors, as we have seen in the above real interest rate differential model.
© Learning Center – Unit B – Chapter 2 – p.16/49

Brought to you by
This is the normal cycle, but is it always like this? Unfortunately not. There are several limitations when dealing with CPI. One is the basket of goods being highly subjective and different from country to country. Another one is the fact that core CPI number exclude goods that consumers have to purchase anyway such as energy and food. This means that inflation may not be really a result of economical growth.The cycle we described above breaks down when the economy experiences dramatic price increases or decreases. Oil, for instance, is many times related to those price shocks as seen in the past. For this reason, oil prices act as a leading indicator for CPI.
In any case, in times when there are concerns about inflation, the CPI gains in importance despite its limitations. As with other indicators - even technical ones - don't worry too much about its handicaps and try to extract the valuable information it contains. Understanding CPI can be translated in trade opportunities and guidance in managing their overall risk. It is not because of its inherent value but because of the attention that traders pay to it that CPI is relevant. Specially important for traders and analysts are the developing trends in CPI results and the breaking points between inflationary and deflationary periods.
Released by: US Department of Labor; Bureau of Labor Statistics. Look for “Consumer Price Index Summary”, as it is the most popular measure of inflation.
Frequency: CPI results are published on a monthly basis. Generally available the second week of the month immediately following the month for which data is being released. It's always released after the Producer Price Index. Note also that in the USA most indicators are published on certain weekdays, rather than on a monthly date.
Producer Price Index (PPI)
© Learning Center – Unit B – Chapter 2 – p.17/49

Brought to you by
Definition: The PPI is not as widely used as the CPI, but it is still considered to be a good indicator of inflation. Generally, the PPI is also collected by governments and it's considered to be among the most authoritative statistics.
This indicator measures and reflects the change of manufacturers’ cost of raw materials and semi-finished goods retrieving data from production and manufacturing firms across several sectors (manufacturing, agriculture, mining and utilities ). The PPI is also a basket of various indexes covering a wide range of areas affecting domestic producers. Like the Consumer Price Index, the PPI compares the current price index to a base value of 100 – this means that a PPI value of 115 is 15% higher than the original base.
In order to avoid distortions on the PPI figures, the Core PPI excludes volatile items such as energy and food. A sudden spike or fall in oil prices or other unexpected event is not reflected in the data released.
Why does it matter? The PPI, while not as strong as the CPI in detecting inflation - because PPI includes goods being produced -, can be used as a leading indicator to forecast future CPI releases.
© Learning Center – Unit B – Chapter 2 – p.18/49

Brought to you by
The PPI index printing higher figures suggests an expanding economy with reasonable assurances of continued employment for those working in the manufacturing sector. An increasing PPI value could also indicate an interest rate hike intended to fight inflation. For Forex traders and followers of the real interest differential model, a rise in interest rates means an increase in the demand for the currency as investors can expect increased returns. But concerns over increasing inflation, specially in the US, may outweigh benefits of a high interest rate (see the monetary model of exchange rate determination in the previous section). So overall, the effect of PPI on the USD is moderate in comparison to other markets.
You should also note that the PPI report is the first of the inflation-based reports available each month. It will usually receive close scrutiny as traders look for signs of inflation or deflation that could impact on the CPI released shortly after. For the long-term trader the PPI and CPI numbers are used to track price pressures that can help to anticipate inflationary consequences in the near future.The short-term trader, in turn, will not be so much interested in forecasting interest rate changes, but rather use the PPI as leading indicator to estimate the CPI result since this indicator has ultimately more impact on the market. If you follow this approach, don't forget to spot for oil prices as they also will impact on the CPI index.
Released by: US Department of Labor; Bureau of Labor Statistics.
Frequency: It is released in the second full week of every month, covering the previous month's data.
© Learning Center – Unit B – Chapter 2 – p.19/49
Brought to you by
Gross Domestic Product (GDP)
Definition: In the US, the Federal Reserve's primary goal is to keep a sustained growth of the economy with full employment and stable prices. The information provided by the GDP index is a gross measure of the big economical picture. Representing the monetary value of all the goods and to signalservices produced by an economy over a specified period, the real GDP is the most comprehensive measure of the country's production and it is indicative of inflation pressures.
To determine the GDP results, purchases of domestically-produced goods and services by individuals, businesses, foreigners and government entities and the trade balance are routinely captured. In short, everything that is produced within the country’s borders is counted as part of the GDP. For this reason it's perhaps the broadest indicator of the well-being of an economy. The published output is available in nominal or in real terms (also called index form), meaning increases in the the results due to inflation have been removed. Analysts and traders usually monitor the real growth rates generated by the GDP quantity index or the real dollar value.
The nominal, current dollar, GDP corresponds to the market value of goods and services produced and it's calculated using today's Dollars. This makes comparisons between time periods difficult because of the effects of inflation. The real GDP, the index form, in turn, solves this problem by converting the current information into some standard era Dollar.
The GDP is typically lower than the consumer price index because investment goods (which are in the GDP price index but not the CPI) tend to have lower rates of inflation than consumer goods and services.
Why does it matter? GDP indicates the pace at which a country's economy is growing (or shrinking). By monitoring trends in the overall growth rate as well as the rate of inflation and the unemployment rate, policy makers are able to assess whether the current stance of monetary policy is consistent with the goal of sustained growth.
© Learning Center – Unit B – Chapter 2 – p.20/49

Brought to you by
Fundamental analysts and traders track important trends within the big picture using the GDP. Stronger GDP results in the current year compared to the previous year is seen as a positive indicator. Logically, if the value of a country’s production has raised, then a corresponding increase in employment and higher incomes will follow. This scenario, in turn, suggests that the domestic currency may increase in value compared to foreign currencies from countries with weaker economies. A higher value for a currency paves the way to an increase in its demand, right?Conversely, an increase in inventories indicates that growth is slowing or consumer demand is weaker, and usually translates into a decrease in demand for the domestic currency.
The GDP can also be seen in a wider context. In many economies, borrowed money makes up a large percentage of spending. This means that GDP results will depend on how easy and cheap the general population can borrow money. Under this perspective, when interest rates are expected to go higher, people will be expected to save and therefore spend less money, and economic growth will be expected to slow as a result. Conversely, when low interest rates make cheaper for people and businesses to borrow and spend money, economic growth will be expected to rise.
The trade balance, being one of the major components of the GDP, can be used as a leading indicator for GDP forecast. Traders also monitor retail sales because it provides them an hint on personal consumption expenditures, another component of the GDP. When retail sales are growing faster than production inventories, production in the months ahead is likely to increase. Conversely, when retail sales are growing more slowly than inventories, they represent a slowdown in production and a possibly lower GDP figure. Here you have two leading indicators for GDP estimation.
The major components of the GDP can be monitored separately as they all reveal important information about the economy.For instance, it is useful to distinguish between private demand versus growth in government expenditures. Typically, analysts and traders discount growth in the government sector because it depends on fiscal policy rather than on economic conditions.Increased expenditures on investment are viewed favorably because they expand the productive capacity of the country. This means that the country can produce more without inciting inflationary pressures.Particularly in the US, with imports typically exceeding exports, traders observe if the deficit becomes less negative, meaning a smaller amount is subtracted from the GDP, translating into more economic growth. In turn, when the deficit widens, it subtracts even more from the GDP.
© Learning Center – Unit B – Chapter 2 – p.21/49

Brought to you by
Released by: US Department of Commerce; Bureau of Economic Analysis (BEA). Look for “News Release: Gross Domestic Product”.
Frequency: It is usually measured annually, but quarterly statistics are also released in the last week of January, April, July and October. The US Commerce department revises the GDP twice before the final figure is settled upon: an advance report is followed by a preliminary report and later a final report is published, covering the previous quarter's data. Quarterly results are subject to some volatility, so it is appropriate to follow year-over-year percent changes in order to smooth out this variation. The first or “advance estimate” is released during the final week of the month immediately following the end of a calendar quarter. Within a month it is followed by the "preliminary report" and then the "final report" is released another month later. Significant revisions to the advance number can move the markets. Annually, benchmark data and new seasonal adjustment factors are introduced in the second half of the year, usually in July. This revision affects at least three years of data. The magnitude of the revision is generally moderate and makes the short-term use of the report rather difficult. Nonetheless, it has an impact on the immediate currency value.
Retail Sales
Definition: Retail Sales belongs to the industry and sector-based statistics. This type of indicator is collected by both government agencies and private sector groups. The activity they track is more limited, and can have a close correlation to the broader indexes, generating considerable trading interest.
This indicator measures the total sales of goods by all retail establishments in the US, excluding sales of services such as health care and education. Sales are categorized by type of establishment, not by type of good.
The Census Bureau surveys hundreds of various sized firms and business offering some type of retail trade. Every month the data is released providing feedback on the percent change from the previous month data. A negative number indicates that sales decreased from the previous months' sales.
The report is published without adjusting for inflation, that is, in nominal Dollars. So to get a true measure of changes in retails sales spending, you must adjust accordingly. However, the results are adjusted for seasonal, holiday, and trading-day differences between the months of the year.
© Learning Center – Unit B – Chapter 2 – p.22/49
Brought to you by
Why does it matter? This indicator can be a big market mover because retail revenues are a key driving force in the US economy. It tracks the merchandise sold by companies within the retail trade providing feedback on consumers' activity and confidence. Higher sales figures correspond to an increased economic activity and vice versa.
The Personal consumption expenditures (PCE) represent roughly 2/3 of the GDP. By monitoring retail sales, policy makers are able to make an assessment of the likely growth of the PCE for the current and future quarters. The retails sales report can be seen as not particularly related to the currency market, however, it might indicate an overall growth or slowdown of the economy, making the currency more or less attractive to investors. The key point is that retail sales can be used as a leading indicator to forecast GDP figures.Remember, trade balance and retail sales pointing in the same direction can give you an edge to position yourself in the market in anticipation of the GDP release.
Compiling accurate and complete retail sales totals can be very difficult and the "quality" of the published data may differ over time. For this reason, it is not uncommon for the retail sales report to undergo significant revisions after the release. There have been instances where the published figures significantly differed from expectations.
© Learning Center – Unit B – Chapter 2 – p.23/49

Brought to you by
Generally speaking, if economical indicators can induce a burst of activity when the results come out as expected, any economic indicator that releases unexpected results causes a much greater reaction in the markets. As a general rule, watch not only for the numerical value of an indicator, but also for its forecast value. If your leading indicators are pointing in a different direction than the anticipated results, expect a greater impact on the market.The value of the indicator is considered important if it presents new information. For example, if the trade balance and retail sales point to a slowdown in the economical growth, but the expected GDP does not, you should expect a surprise reaction in the market because the final GDP release will be instrumental to drawing new conclusions which couldn't be drawn with the previous release.The fastest moves usually occur when an unexpected information is released. This is key to the short-term fundamental traders, also called news-traders, because what drives the currency market in many cases is the anticipation of an economic condition rather than the condition itself.To put you ahead of this situation, you can watch the personal income data, which is a leading indicator to retail sales.
Released by: US Department of Commerce, Census Bureau.
Frequency: The data is very timely because the retail sales advance estimate is released during the second week of the month for the immediately preceding month. It's also one of the first reports available each month that tracks retail spending patterns.
Here are other industry and sector-based statistics which are somehow related to the above mentioned:
© Learning Center – Unit B – Chapter 2 – p.24/49

Brought to you by
Personal Income
Definition: Personal income points to the change in the dollar value of the income collected from all sources by consumers and serves to measure future consumer demand. The largest component of personal income is wages and salaries. Other categories include rental income, government subsidy payments, interest income and dividend income. A component of this figure, comprised of durable goods, non-durable goods and services, covers personal consumption expenditures or PCE. PCE is even more directly tied to the economy.
Why does it matter? Income is correlated with spending – it gives households the power to spend and/or save. The more disposable income consumers have, the more likely they are to increase spending and saving. Spendings accelerate the economy and keep it growing. Savings are often invested in the financial markets and can drive up the prices of financial assets. Even those funds saved in banks can be used for credits and thus contribute to the overall economic activity.
Needless to say, if the actual figure is bigger than its forecast, you should expect a rise in the USD. But more important under our subsequent approach is to use personal income as a leading indicator for the retail sales.
Released by: US Department of Commerce; Bureau of Economic Analysis (BEA). Look for
© Learning Center – Unit B – Chapter 2 – p.25/49
Brought to you by
“News Release: Personal Income and Outlays”.Frequency: The Commerce Department releases the personal income and consumption figures the fourth week of each month, the day after GDP figures are published, using data from the previous month. The released data is for the previous month.
Trade Balance
Definition: Trade balance, the largest component of a country's balance of payments, is the difference in the value of its imports and exports for the reporting period.
Export data can give an important reflection of US growth. Imports provide an indication of domestic demand, but this figure is published later than other consumption indicators. A country has a trade deficit if it imports more than it exports, and the opposite scenario, signaled by a positive trade balance, is a trade surplus.
Why does it matter? Despite not being the only indicator offering insight into a country’s trade activities, the trade balance is considered to be the most useful. If an economy is exporting more than it is importing, the global demand for that economy's currency will likely increase, which will also increase that currency's value. If the balance of trade shows a surplus or even a declining deficit from the previous month, then there may be an increased demand for the national currency. It naturally happens because countries importing goods must convert their currency to the domestic currency of the exporting country. The opposite scenario, when the report shows a growing deficit or a trend towards a decreasing trade surplus, then the increased supply of the currency could lead to a devaluation against other currencies.
© Learning Center – Unit B – Chapter 2 – p.26/49
Brought to you by
The Trade Balance report influences GDP forecasts. This happens because net exports are a relatively volatile component of the GDP. Trade balance gives an early indication of the net export performance for each quarter and can thus be used together with retail sales, as a leading indicator for the GDP.
Released by: The Census Bureau and the Bureau of Economic Analysis of the Department of Commerce.
Frequency: This indicator is usually released on the second week of each month, covering the previous month's data.
Institute for Supply Management Manufacturing Index (ISM)
Definition: The ISM report is based on data compiled from a national monthly survey made among purchasing executives at several hundred industrial companies. In response to these questions the executives can give only one of three answers which are: “better”, “the same” or “worse”. It provides an accurate assessment of manufacturing totals and is a highly relevant assessment of industrial growth.
It reflects a composite of several indexes covering areas such as industrial production orders, industrial prices, new costumer's orders, employment, supplier deliveries, to name just the most important. This report uses a base scale of 50 to show changes in growth for the manufacturing industry. A reading above 50 indicates an expansion over the previous month in the component index or in overall manufacturing. If main number and data are under 50 points it shows a contraction. Results are adjusted to take into account seasonal changes in the industry. The ISM also sets the standards by which regional industrial indexes are measured.
© Learning Center – Unit B – Chapter 2 – p.27/49

Brought to you by
Unlike many of the other releases covered in this section, the ISM manufacturing number is quite easy to read. Nonetheless, it is important to follow the release for several months to get a feel of what the market reactions are, before incorporating this indicator into your trading.Remember, the market reacts not so much to the reports being good or bad but rather if they are better or worse then expected. Moreover, each indicator has its times of glory: contextual circumstances give to one indicator or another more predictive powers as to where the economy is heading. In this sense, the long-term outlook the report gives is equally important.
Why does it matter? The information on new orders included in the ISM result is especially insightful as it highlights manufacturing activity for the upcoming time period. While not as useful for detecting inflation as the CPI, the ISM is still considered to be one of the anticipatory indicators of inflation pressure. An ISM trending upwards can suggest a growing economy which makes the currency attractive to Forex traders.
Although the US economy is not primarily an industry-based economy, the ISM is still one of the most important fundamental indicators. Manufacturing still plays a large role in the US economy. Besides, the prices paid and the employment subcomponents of the indicator give a read on what is happening with inflation and the labor market, two very important components of the economy.
© Learning Center – Unit B – Chapter 2 – p.28/49

Brought to you by
Another aspect, and perhaps the most important, is the fact that the manufacturing sector exhibits the first signs of strength or weakness in the economy, since before being sold, products have to be manufactured. For this reason the ISM is considered a leading economic indicator for PPI together with import prices and food and commodity prices.
Released by: Institute for Supply Management. Look for the “Latest manufacturing ROB”.
Frequency: This manufacturing-focused survey is the first report of the month on the economy. It's published on the first business day of the month, covering previous month data. It has no further revisions.
Philadelphia Fed Index
Definition: The Philadelphia Fed Index, also known as the business outlook survey, is a regional Federal Reserve Bank index based on a monthly survey of manufacturers located around the states of Pennsylvania, New Jersey and Delaware.
Participants from companies which are voluntarily surveyed indicate the direction of change in their overall business activity. When the index is above 0 it indicates a factory-sector expansion, and when below 0, it indicates contraction.
Why does it matter? This index is considered to be a good indicator of changes in everything from costs, employment, and conditions within the manufacturing industry. Since manufacturing is a major sector in the US economy, this report has a big influence on the market's behavior. Like some of the other indexes explained above, the Philladelphia Fed index also provides insight on purchasing costs and therefore on inflation.
This survey is widely followed as an indicator of manufacturing sector trends since it is correlated with the ISM survey and the PPI. The results found in the
© Learning Center – Unit B – Chapter 2 – p.29/49

Brought to you by
survey can also indicate what to expect from the purchasing managers' index which comes out a few days later and covers the entire US.There are several regional manufacturing activity indicators around the US, so why is the Philadelphia Fed Index, also called “Philly Fed”, the most important for traders? The reason lies in the correlation of all these regional indexes to the ISM indicator: the Philly Fed is the one with the highest forecasting ability. Philly Fed's performance and forecast potential is due to the fact that it measures its results using the ISM methodology. The many questions that compound the survey often give detailed view on specifics such as new orders and production trends, which often point in a different direction than the general question "are business conditions better or worse than last month?".Another criteria why this indicator is a candidate to forecast the national index is based on one simple reason: unlike many other regional indicators, the Philly Fed is released before the ISM.
Released by: Federal Reserve Bank of Philadelphia. View recent releases of the Business Outlook Survey.
Frequency: This index is published on the third Thursday of the month covering the previous month's data.
© Learning Center – Unit B – Chapter 2 – p.30/49

Brought to you by
Goods and Services Imports
Definition: This index is created by compiling the prices of goods ans services purchased in the US but produced out of country. The figure is reported in headlines in billions of Dollars.
Why does it matter? Although it rarely affects the Forex market directly, the goods and services imports index is used to help measure inflation pressures in products that are traded globally. Inflation can be created by changes in foreign exchange rates. For instance, when the USD is strong, import prices tend to be under downward pressure. Inflation also leads to higher interest rates, and by keeping an eye on this menace, traders following the previously explained monetary model can monitor their investment portfolio.Along with food and commodity prices and the ISM results, this index can be used to forecast the PPI, resulting in a leading indicator for that index.
Released by: The Census Bureau and the Bureau of Economic Analysis of the Department of Commerce. Raw data available at the Census Bureau.
Frequency: It's typically released in the second week of the month for the prior month.
In the Practice Part of this Unit, leading indicators for other economies will be disclosed and you will learn how to trade on less known indicators. For example: employment data in New Zealand has a leading indicator which can be used to forecast it, while the Non Farm Payroll Report in the US doesn't have.
The link between different reports can not always be established as a linear cause-effect relationship. It would be relatively easy to make money in the markets if we could reach logical conclusions about the impact that a specific report should have on the exchange rates and then trade accordingly. In reality, the real factors pushing a currency can be quite tricky to identify.
© Learning Center – Unit B – Chapter 2 – p.31/49

Brought to you by
Why does the USD sometimes react in the opposite direction to the reported economical news? Sometimes there is no downward reaction on the USD after a bad economical report for the US has been released... In order to get an explanation as to why markets reacted in an unexpected way, we should read beyond the report and see if there are currently more important factors then the report we were watching. Ultimately, exchange rates are a reflexion of supply and demand for a certain currency and each component of the news landscape should be used to gain insight on this imbalance. When the current market theme is not related to an indicator or if it is not offering new information to the market participants, the reaction can be relatively neutral even if it is considered as a market moving indicator. Price only adjusts to new information. Therefore it's always useful to know what is the current market theme or discussion, and ask yourself if the report is changing anything in all the previous available information.It may happen that scheduled economic announcements that are complete surprises render meaningless short-term support and resistance levels. The same can happen with unscheduled or unexpected news, such as statements by government officials, political and social disturbances: the market will react depending upon the severity of what was said or implied.
Keep updated about what the market theme is by following our Fundamental Market View section.
Can I trade before important news?
Keep in mind that fundamental analysis is an effective resource to forecast supply and demand for a certain currency, but not to forecast exact exchange
© Learning Center – Unit B – Chapter 2 – p.32/49

Brought to you by
rates. So the answer is yes, you can enter the market when a report is about to be released, but you better make a combined use of fundamentals with other analytical resources, as the ones you are taught here in the Learning Center.For example, you might get a clear understanding of the direction of the US economy by studying the relationship between the trade balance and the gross domestic product, but how do you translate that in entry and exit points? A great starting point is undoubtedly by studying the fundamentals and identifying those edges that you want to trade upon - the herewith disclosed studies are meant as edges on which you can develop your trading model. But in order to find entry and exit points, a combination of those edges with technical strategies is needed. This combination is what you will finally use to translate the raw market data into usable entry and exit points.
In a video titled "Trading Economic Numbers (News Trading)", Adam Rosen explains how to enter positions after the release of economic reports with the use of support and resistance analysis.
The article "How to Trade a News Breakout", written by Chris Capre and published in The Forex Journal, details a simple strategy to trade the release of economic reports with the use of technical analysis.
Here are a few links to key sections on fundamentals:
• Real-time economic calendar
• Reports on economic indicators
© Learning Center – Unit B – Chapter 2 – p.33/49

Brought to you by
• Reports on Interest rates and a table with the world interest rates
• Economic time series
© Learning Center – Unit B – Chapter 2 – p.34/49

Brought to you by
3.Interest rates
Interest rates is one of the key components of monetary policy and it is strongly related to supply and demand for currencies. While the importance of individual fundamental indicators shifts over time, interest rates always appear to be relevant. They are important to economic growth, to the markets and ultimately to your own trading, and you soon shall understand why. In the previous Unit A you have learned that profits and losses are also affected by the rollover, comprised of the different interest rates of the currency pair, the settlement date, and the duration of the position. In this section we will approach the subject from a deeper fundamental perspective.
The government’s role in the economy is to influence the business cycle by keeping prices stable and working towards sustained growth. The first means to accomplish this is through fiscal policy, and the second - and perhaps the most important for us as traders - is the monetary policy, which means exerting control over the money supply. This has a direct relationship with interest rates.
In a society, some individuals have more money than their immediate needs require, while others have needs that require more money than what they have. An economy can grow faster if the people who have money lend a part of it to the ones who need it to accomplish their goals. Here lies the concept behind interest: lenders won't lend money for nothing; to entice people to lend money, the borrowers pay them interest.
Interest rates are basically the payment that a previous requires in return for lending money to a previous. Normally, this payment is expressed as a percentage of the amount of the borrowed money. For example, if a borrower receives a loan of 1,000 USD for 1 year at a nominal interest rate of 5%, then the cost of that loan for the borrower, the so-called “interest payment”, is 50 USD. The interest is the value or “price” of the money. Like the price of virtually everything else, it is determined by supply and demand.
In most developed countries, the government has a major influence on the quantity of money which is created or destroyed and on its value as a medium of exchange. In technical terms that is defined by the money supply and the interest rate. The government can increase the money supply by injecting money into the economy, or through monetary policies, encouraging the population to save or to spend money. However, there is a limit to how much money a government can put in circulation before the economy gets hurt. Money shall have always a relatively stable value, otherwise people lose faith in it as a medium of exchange with dire consequences for the economy.
Each economy has a central bank which manages the monetary policy. In the US the central bank is the Federal Reserve, or “Fed” as it is often called. When any central bank injects money into the economy through the banking system, banks begin to lend that money. Note that this is not the only way a government can inject money in the economy. It can also be directly injected in the real economy by promoting the public sector, creating infrastructures for example (schools, hospitals and so forth).
© Learning Center – Unit B – Chapter 2 – p.35/49

Brought to you by
The fact is that a big part of the demand for money is for loans by individuals and businesses as people have virtually unlimited wants. And the more money there is available in an economy, the more there is to lend. Banks, in this case, make money by deploying that cash and charging interest and fees.
For this reason, governments are much concerned with keeping the value of money stable. By adjusting interest rates higher and lower, the economical growth can be slowed down or stimulated. The level of interest rates or, in other words, the value of money has a large effect on practically everything in the economy from consumption and employment to inflation.
A higher Federal Funds rate, in the case of the US economy, makes borrowed money more costly, meaning that people will also be less likely to start or expand a business. This can result in a rise in unemployment, less personal income, weaker consumption and on and on down the line. The opposite is of course also true when interest rates fall and business owners take advantage and access cheaper borrowed money. The impact is seen on financial markets as well with market participants borrowing money to leverage their accounts. This growing momentum can be sustained in time as long as individuals maintain their hope that rates will be kept low in the long run.
On our homepage and with the participation of experts, we at FXstreet.com cover live interest rates decisions, as well as US GDP and Non-Farm Payrolls data. You can see the archives of our previous live coverages .
In order to effectively understand the concept of interest let's study its main characteristics:
Time Value
Under normal circumstances most people would prefer to receive one Dollar today rather than that same Dollar in one year. This is because a Dollar earned today can be put to work and potentially increase its value over time, and therefore its buying power in the future. buying power can raise in the future. For this reason a lender, being an individual or an institution, expects to be compensated for not being able to use the money during a certain period of time. Put it inversely, a Dollar received in the future has less value than a
© Learning Center – Unit B – Chapter 2 – p.36/49

Brought to you by
Dollar received today. This fact is what gives money time value. By definition, interest rates are the rate of growth of money per unit of time. Time determines the present and future value of money. Since so many financial assets depend on time value, interest gains are one of the most fundamental factors in financial investments. Currencies, like many other assets, pay interest or can be paid off, and this payoff will depend on the interest rate. Hence the interest rate serves to allocate economic resources more efficiently because it provides information to market participants as to what is the best use of the money at any time. It tells them if it is best to hold or to spend it, and where to spend it.
Opportunity Cost
The present and future value of money allows an individual or business to quantify and minimize their opportunity costs in the use of money. Opportunity cost, in this context, is the benefit forfeited by using the money in a particular way. An investor, for instance, can put 1,000 USD to work on the financial markets instead of depositing it in a bank savings account that pays a certain annual interest. By doing this, the investor is renouncing to the interest payed by the bank and favoring the potential benefit of investing it in the markets. However, the future value of a speculative investment is really unpredictable. In the case of financial investments, it can only be estimated by comparing specific investments with an interest rate that is either known or can be reasonably estimated by using the formulas for the present value and future value of money.
Therefore one of the major objectives of a financial system is to minimize the opportunity cost to lenders and borrowers by facilitating their interaction. When interacting, lenders can lend money at the highest possible rate and borrowers can borrow money at the lowest rate. Obviously the agreement will depend not only on time value and opportunity cost but also on the associated risk.
Inflation and Deflation Expectations
If the value of money is expected to be lower one year from now than it is today, because of prices going higher, then a lender wants to be compensated for that loss in value over the time period. He lender will then ask for higher interests in compensation for that loss.
Individuals and businesses invest to earn more purchasing power in the future. They will only invest or lend money that pays more than the expected inflation rate because inflation lowers the value of money. Therefore, the growth of purchasing power will depend not only on the stated rate of interest but also on inflation.
© Learning Center – Unit B – Chapter 2 – p.37/49
Brought to you by
One of the most important economic factors analyzed to forecast exchange rates is the inflation rate. Inflation is an essential aspect to understand interest rates because it influences the opportunity cost associated with a currency. Inflation is the result of an increase in the supply of money, when there is more money to purchase the same goods. When comparing two currencies, it is the rate of growth of supply of one currency over the rate of growth of the supply of another currency that will determine the exchange rate between both currencies.
By comparing interest rates using the real interest rate differential model explained at the beginning of this chapter, investors can estimate the return on investments among several currencies. If a country raises its interest rates, its currency will strengthen because investors will shift their assets to countries with higher interest rates in order to gain a higher return. One example is the so-called carry trade, which involves borrowing currency from a country with low interest rates to invest it in a country with higher rates.
Technical Carry Trade Articles by James Chen.
Nonetheless, the model behind the carry trade does not take into account inflation. Here is where the currency substitution and monetary models enter in action, taking monetary policies in consideration. Since economies do usually grow, the money supply has to grow with it to prevent the economy from entering in deflation. Monetary authorities will supply money a little bit faster than the economy is growing.
In theory, when the economy grows faster than the money supply, then deflation occurs because there is less money for the same amount of goods and services and consequently prices drop. At first it seems like an advantage, especially for the consumer, but it isn't, because of the same principles of time value of money. As prices fall, people hold onto their money since it will be more valuable in the future than it is now. With reduced spending, all the economical cycle is deteriorated as much as under a severe inflation.
Another serious economic problem with deflation is that it makes borrowing prohibitive. The loan payments remain the same, but they require a larger proportion of income to pay the debt. Because what it produced has now lower prices, individuals and businesses see their income dropping and are forced to curtail spending and investing, which accelerates even more the downward deflationary spiral.
© Learning Center – Unit B – Chapter 2 – p.38/49

Brought to you by
Risk
In a growing economical environment, however, the opportunity cost and the time value of money, translated in higher returns on investment, are not the only characteristics guiding investors in their decisions as to where allocate their money. There is also the risk associated with the use of money, and investor's sentiment will continually oscillate between risk appetite and risk aversion. Lenders will not always easily determine who pays the most interest at the lowest risk because there is always a risk that a loan will not be paid back.
The Direction of the USD is the ITC presentation of Joseph Trevisani in 2007. Among several fundamental topics, Joseph talked about the purchasing power parity, interest rates, and many other subjects covered in this chapter. If you haven't been to our first ITC, then watch the complete presentation here.
You should now have a good understanding of what interest rates are and also the important role that money supply plays in the economy. But like in the previous sections, we can not draw linear conclusions on which to base an analytical model to forecast exchange rate moves. There are some variables which hinder us from that possibility, namely: the fear of risk, the hope for a return and ultimately the faith in the medium of exchange. Words like “fear”, “hope” and “faith” don't really sound like economic variables, but they are! This brings us to the next section where we will expand on sentiment indicators and leave the hard macro-economical data behind. Let's go!
© Learning Center – Unit B – Chapter 2 – p.39/49
Brought to you by
4. Sentiment Indicators
Random Walk and Efficient Market Hypothesis
If fundamental analysis would, by itself, determine the intrinsic value of money and therefore of financial assets, then there would be no bubbles, no depressions and no financial crises. While fundamental factors do contribute to the confidence and pessimism of market participants about the economy, why does price action often diverge so much from what a rational fundamental model is forecasting? The answer is in the emotions and feelings of the market participants, in one word: sentiment.
Price action can be seen as the expression of collective psychology oscillating between optimism and pessimism. As with any oscillator, there will be peaks of both emotional extremes driving prices up and down. These extremes explain the many inconsistencies in economical reports being favorable to a certain currency and the market reacting in the opposite direction.
Market sentiment is often presented as a characteristic of crowd behavior. Humans behave under the influence of other humans and show a tendency to conform to the crowd - even if the crowd is wrong. Crowds typically think and act differently than individuals act when uninfluenced by others. In financial markets, this results in market participants not taking objective trading decisions based on rational conclusions, but rather emotional decisions based on feelings.
With subjectivity and uncertainty gaining so much importance in price action, models such as random walk hypothesis has evolved around the idea that markets are absolutely unpredictable and impossible to outperform in the long run. This is also the basic premise of its close relative, the efficient market hypothesis model, which states that markets consist of many rational participants who are constantly reacting to new information and reflecting the new information in the price. The information includes not only what is currently known about the market but also any future expectation. It is surely true that information in financial markets 150 years ago was not so rapidly digested as it is today, but does the speed of information processing and the participant's rationality make the market really efficient?
There is an old joke about an economist strolling down the street with a trader when they come upon a 100 Dollar bill lying on the ground. As the trader reaches down to pick it up, the economist says "Don't bother - if it
© Learning Center – Unit B – Chapter 2 – p.40/49
Brought to you by
were a real 100 Dollar bill, someone would have already picked it up." The joke humorously shows the idea behind the efficient market hypothesis: if the exchange rates were predictable, then opportunities would be exploited so fast that such opportunities would disappear in a competitive and efficient market.
But if markets are efficient, then why do we witness deviations of exchange rates from their fundamentals? Why do market participants express more demand and finally buy after a substantial rise in price? This reality runs contrary to the conventional supply and demand equations we have learned so far, namely, that investors buy low and sell high. The market efficiency model attributes this fact to the excessive speculation in the markets, although it views speculation positively as it enhances market efficiency and liquidity, even if exacerbating volatility.
Let's have a look back to price action for a moment. If we simplify the mechanics of a common retail shop transaction we could say that in a retail environment, the seller sets the price and the purchaser measures his need for the item against the price asked and makes a decision to buy or not. In a market transaction, it gets a bit more dynamic because both the seller and the buyer continually adjust their price expectations depending on the available information. Note that information can be anything coming from the market and/or from external sources. A potential seller who believes that the price may be higher in the future may choose to stay out of the market hoping to get a higher rate. If enough sellers do the same, the deal price will rise to the next available supply level. Conversely, if traders think the price may fall from now on, then they may lower their own offers until they find a buyer, in effect driving the market price lower.
We can derive from the example that price movements are the combined reactions from market participants to changing information. You will often hear that “the market reacted this or that way to news”, but in reality what moved price was a mass decision, being price its representation. The common use of this market personification tends to obscure what is the most important psychological aspect in market behavior: the “market” is a conglomerate of the minds of its participants.
What produces market movement is the difference between what most of the participants expect or believe to happen and a newly arrived information that changes that general expectation or belief. When we hear that a certain economical report is already 'priced into the market', it means that the new released economic report is at or close to the general opinion of what the result would be. This general opinion does not correspond to any rational fundamental model, because it is largely made of beliefs. It seems to dominate exchange rate moves above analytical models.
© Learning Center – Unit B – Chapter 2 – p.41/49

Brought to you by
The efficient market hypothesis states that market participants have rational expectations and it also states that the participants, on average, are correct. It also sustains that all new relevant information makes the participants update their expectations appropriately. In this sense, the model accepts that investors' reactions will be random but the overall effect from all the participants reactions, that is, the “market”, will be always right.
Arguing that future prices cannot be predicted by analyzing historical prices or other historical data, it sustains that it is not possible to profit from the market in the long run. This implies that neither fundamental analysis nor technical analysis techniques are able to reliably produce profits.
But even after several decades of empirical and theoretical disputes, economists have not yet reached a consensus about whether financial markets are efficient or not. One of the reasons for this state of affairs is the fact that the efficient markets hypothesis, by itself, is not a well-defined and empirically refutable hypothesis. In order to make it operational, too many variables and auxiliary hypotheses would have to be taken into account such as investors’ goals, their level of information, their risk preferences, their capitalization levels, all of these aspects influencing their beliefs.
Behavioral Finance
Here is where a multidisciplinary ramification of economical studies emerged: behavioral finance. Behavioral finance is an area of financial research that explores the psychological factors affecting investment decisions. Behavioral economists attribute what they call “anomalies” in financial marketsto psychological factors, or behavioral biases, which affect investors and limit and distort their information resulting in incorrect conclusions- even if the information is correct.
A market extreme such as a speculative bubble is an obvious anomaly: in that market participants seem to be trading on irrational exuberance, overlooking the underlying value of the assets traded. Few investors profit from such irrational bubbles because, as John Maynard Keynes commented, "Markets can remain irrational longer than you can remain solvent." A long-term trend, for instance, is also seen as an anomaly. For us though, what matters is that market trends are not a logical result of the macro-economical circumstances, but rather a collective reaction of market participants to those circumstances as reported in the news.
In order to understand market behavior and price action, behavioral researchers look at several human and social cognitive and emotional biases such as:
• overconfidence in the own abilities as trader or investor• overreaction to newly arrived information• a biased market view (meaning the persistence of one's trading strategy even
© Learning Center – Unit B – Chapter 2 – p.42/49
Brought to you by
when such strategy is failing or ignoring new information that may contradict one's trading decisions)
• loss aversion (it's empirically proved that people prefer to avoid losses than acquire gains)
• money illusion (refers to the fact that people do not think of currency in real terms but in nominal terms)
• fear of regret (which causes investors to hold losing positions too long in the hope that they will become profitable, or liquidate winners too soon to lock in profits before they turn into losses)
• marginal utility of money (where the seed capital is more valuable than additional gains)
• nability to use complex rather than linear reasoning (meaning a rational attribution of market reaction to specific causes)
• and various other predictable human errors in reasoning and information processing.
A good example of the rational attribution to specific causes is seen in the daily reporting of news. The mainstream financial media tends to explain what happened rather then what is about to happen. In any case, price action is always reported as being due to some sound and reasonable cause. If the market is up, reasons as to why it is up are selected, and if it is down, then different reasons are also found to explain it. The media tells the crowd what they want to hear, because it is made by reporters, not traders. So the obsessions of the reporters are mirroring those of the crowd.
The main limitation in behavioral finance research is the same as with the more rational models, that is, linking cause to effect. But apart from its limitations, we can use its fundamentals to treat the price action as a crowd behavior, and use it as a contrarian indicator to make money in the markets.
Among other interesting topics, in a webinar called Power Trading in Globalization 3.0, John W. O'Donnell brings true perspective to an apparently chaotic market introducing subjects as crowd mood analysis vs. conventional analysis, and causes of economic boom/bust bubbles.
© Learning Center – Unit B – Chapter 2 – p.43/49

Brought to you by
Contrarian Approaches with Sentiment Indicators
It is the study of crowd behavior that forms the basis of contrarian investing: selling when optimism has peaked or buying when pessimism has peaked and the market has bottomed out. Such an approach could not really exist if the efficient market hypothesis were true, since price action would constantly be determined by the logical of fundamentals. A contrarian approach can only exist because prices are mostly determined by market sentiment.
Crowd behavior is a composite of many types of biased thinking and therefore it is virtually impossible to quantify. But yet, there are some tools that fall under the category of market sentiment indicators which we will use to determine bullish sentiment and bearish market sentiment. There are many sentiment indicators, and an almost infinite variety of ways of interpreting them. In any case they should be used with other indicators and even with the fundamental analysis as we have described it so far.
There is a general perception that a sentiment indicator is like a technical indicator based on past price data over a period of time. It is somehow displayed like a technical indicator, but with some differences. First of all it is not based on price action in the way a technical indicator is. Moreover they don't lag as technical indicators do. Sentiment indicators are most often used together with technical indicators in order to generate buy and sell signals. But perhaps the most important is their usefulness as risk control indicators assessing if markets are reaching a sentiment extreme and therefore a change of bias is possible, or if there is still room for a trend extreme to develop.
There are many attempts to accurately measure market sentiment and so there are several different kinds of sentiment indicators—only a few are presented here. One good thing about sentiment indicators is the fact that they are transparent and in many cases freely accessible. Let's look at some of these indicators which can be extremely helpful to spot market turns.
Commitment of Traders Report (COT)
The COT provides up-to-date information about the trend and the strength of the commitment traders have towards that trend by detailing the positioning of speculative and commercial traders in the various futures markets. Remember that the spot Forex is an over-the-counter market, therefore the futures market is used here as a proxy for the spot market. The Commodity Futures Trading Commission (CFTC) releases a new COT report each Friday.
© Learning Center – Unit B – Chapter 2 – p.44/49
Brought to you by
The COT report can be downloaded for free at the CFTC.
The COT report contains a lot of information, but the meat of the report is the data which shows the net long or short positions for each available futures contract for commercials and non-commercial traders. There are COT reports for equity traders (stock futures), commodity traders (including oil and gold) and currency traders (currency futures).
Commercial traders represent companies and institutions that use the futures market to hedge risk in the cash or spot market. For example, a firm like Coca-Cola, as a big consumer of sugar for its production lines, may sell sugar futures contracts to protect against eventual increases in sugar prices in the near term. So if sugar prices go up, the firm has to pay for the losing position in the futures market, and if prices of sugar go down, the firm compensates it from the gains in the short sugar contracts.These market participants have very deep pockets, in the sense that they can endure positions against market trends for a long time. The COT report gives us an idea about the trend for a particular asset class and tells us what the big money is doing. In order to spot for market turns we shall pay attention to this category because commercials are typically most bullish at market bottoms and most bearish at market tops. They don't do this because of a contrarian approach but rather because they are hedging. The more the sugar price goes up, the more Coca-Cola will sell sugar futures contracts in order to maintain a higher average sell price.
Non-commercial traders are considered speculators. It includes large institutional investors, hedge funds and other entities that are trading in the futures market for capital gains. These participants are usually trend followers, buying when prices increase and selling when prices decrease.
Knowing what the commercial and non-commercial traders are doing through the COT report gives us some idea about the market extremes for a particular currency. Jamie Saettele, in his book “Sentiment in the Forex Market” resumes the idea by explaining:
You have probably noticed that speculative positioning and commercial positioning move inversely to one another. If a statement is made about the relationship between speculative positioning and price, then the opposite is true about commercial positioning and price. For example:
Speculators are extremely long when commercials are extremely short (and
© Learning Center – Unit B – Chapter 2 – p.45/49

Brought to you by
vice versa).A top in price occurs when speculators are extremely long and commercials are extremely short (and vice versa).Speculative positioning is on the correct side of the market for the meat of the move but is wrong at the turn.Commercial positioning is on the wrong side of the market for the meat of the move but is correct at the turn.”
Source: “Sentiment in the Forex Market” by Jaemie Saettele, John Weiley & Sons, Inc., 2008
Gaining an Edge with Sentiment Indicators was the ITC 2008 study presented by Jamie Saettele.
The author dwells much deeper in the combined used of the COT data and offers the trader community an analytical tool to understand what actually affects price action and what is just temporary noise. As he says: ”every market top is accompanied by a sentiment extreme, but not every sentiment extreme leads to a market top.”
Expert Wade Hansen, explain how to use the COT indicator in your trading.
VIX
The VIX (Volatility Index) has a fair amount of popularity and usefulness for Forex traders as a market sentiment indicator to measure implied volatility. Remember, volatility is the magnitude of movement that a price deviates from the mean price over a specified time period. Specifically, the VIX measures the implied volatility, rather than the historical volatility, of the options bough and sold on the S&P 500 index. If we consider options as a protective measure against a corrective price move against a major trend, then we
© Learning Center – Unit B – Chapter 2 – p.46/49

Brought to you by
understand that the greater the implied volatility is, the greater is the fear among the trend following traders that the market is reaching an extreme (a bottom or a top).
There are some currencies which are sensitive to equity markets and that is the reason why this indicator also serves to build a Forex trading methodology.As with other sentiment indicators, traders look at extremes in the VIX. If the VIX shows a downtrend this means that traders are buying fewer options, which in turn means they are complacent with the underlying prices. When the VIX hits an extreme bottom, then traders prepare for a reversal in the VIX which implies a higher risk trading environment coming soon. Pairs such as the USD/JPY or EUR/JPY are sensitive to equity prices and can thus find a reliable tool in this indicator. A bottom in the VIX can be seen as a reversal from a top extreme in those pairs as traders have reached a top of confidence and optimism towards the trend.
At the CBOE website you can access the Volatility Index chart (Symbol: VIX), which measures the implied volatility of the S&P 500 index.
In order to properly use sentiment indicators and specially the VIX, the trader shall first of all find out what is the current theme in the market. Secondly, if the VIX is reversing from a bottom showing increased risk aversion, the trader has to find out what markets are currently showing more optimism, in order to enter on a contrarian move.
It can take a while until all this new information sinks in. A good starting point is sharing your ideas on the forum with other fellow traders.
© Learning Center – Unit B – Chapter 2 – p.47/49

Brought to you by
What you have learned from this chapter:
• To assess the strengths or weaknesses of an economy, to judge central bank policy, and to provide insight into the many economic variables that make up a modern industrial economy.• Exchange rates not always reflect relative underlying economic conditions, as they can deviate from the most important forecasting models.• What is considered fundamental, namely economic indicators, is many times not fundamental at all to price action. It seems like when prices go up, any indicator pointing in the opposite direction will be ignored.• Sentiment indicators are a very specific tool to apply a technically inclined analysis to market variables which are difficult to measure, namely: fear and greed.
FXstreet.com contents:
• The Direction of the USD , by Joseph Trevisani at the ITC in 2007.• Commitments of Traders (COT) Report and Forex , by James Chen• Commitment of Traders (COT) Indicator , webinar by Wade Hansen• The Velocity Factor , by John Mauldin • The Relationship between Commodities and the Foreign Exchange Market , by Dan Blystone • Commodity Seasonal Patterns , by Don Dawson• Main Economic Indicators of the World , by AKForex • Common Sense Fundamentals and Technicals for Real Traders , by Mark Whistler • Advanced Methods for Finding Dominant Trends in FX Markets: Understanding Oil and Forex Markets, by Mark Whistler • Black Swans - Taking advantage of the unexpected , by John Jagerson• Mapping The News , by John Jagerson • Combining Fundamental and Technical Analysis , by S. Wade Hansen • Intermarket Relationships , by Wade Hansen• Equity Markets and the Forex Market , by Wade Hansen
© Learning Center – Unit B – Chapter 2 – p.48/49
Brought to you by
• Commitment of Traders (COT) Indicator , by Wade hansen • Forex Trading Correlations , by Dan Blystone• Forex Trading Correlations (2) , by Dan Blystone • Forex Trading Correlation Strategies , by Dan Blystone • Profiles of the major currency pairs and the factors that influence them the most, by Dan Blystone
External links:
• Understanding the Economy , by CNNMoney.com• The United States Economy , by Countrystudies.es• Market Economy , by Wikipedia.org• Purchasing Power Parity , by Wikipedia.org• Economy , by Investopedia.com• Inflation , by Investopedia.com• Current Account , by Wikipedia.org • Capital Account , by Wikipedia.org • Balance of Payments , by Wikipedia.org • Efficient Market Hypothesis , by Wikipedia.org • Macroeconomic Implications Of The Beliefs And Behavior Of Forex Traders, by Yin-Wong Cheung and Menzie D. Chinn • The Future of Money and of Monetary Policy , by Governor Laurence H. Meyer, The Federal Reserve Board
© Learning Center – Unit B – Chapter 2 – p.49/49