azinphos-methyl (guthion) risk ... for blood che inhibition was also established in a 28-day...
TRANSCRIPT

AZINPHOS-METHYL (GUTHION)
RISK CHARACTERIZATION DOCUMENT (Revision No. 1)
Medical Toxicology and Worker Health and Safety Branches
DEPARTMENT OF PESTICIDE REGULATION
CALIFORNIA ENVIRONMENTAL PROTECTION AGENCY
February 26, 2004

ii
Contributors and Acknowledgments Principal Author: Carolyn M. Lewis, MS, DABT Associate Toxicologist Health Assessment Section Medical Toxicology Branch Dietary Exposure Assessment: Carolyn M. Lewis, MS, DABT Associate Toxicologist Health Assessment Section Medical Toxicology Branch Occupational and Air Exposure Assessment: Tareq A. Formoli, MS Associate Environmental Research Scientist Worker Health and Safety Branch Peer Reviewed By: Keith F. Pfeifer, PhD, DABT Senior Toxicologist Health Assessment Section Medical Toxicology Branch Jay P. Schreider, PhD Primary State Toxicologist Medical Toxicology Branch Gary Patterson, PhD Supervising Toxicologist Medical Toxicology Branch DPR acknowledges the review of this document by the Pesticide and Environmental Toxicology Section, Office of Environmental Health Hazard Assessment, as part of the Adverse Effects Advisory Panel evaluation.

iii
TABLE OF CONTENTS
PAGE Contributions and Acknowledgments............................................................................................ ii I. Summary........................................................................................................................... 1 II. Introduction ....................................................................................................................... 4 A. Regulatory Background......................................................................................... 4 B. Chemical Identification .......................................................................................... 5 C. Technical and Product Formulations..................................................................... 7 D. Usage .................................................................................................................... 7 E. Illness Reports....................................................................................................... 7 F. Physical Chemical Properties................................................................................ 8 G. Environmental Fate ............................................................................................... 9 III. Toxicology Profile............................................................................................................ 14 A. Pharmacokinetics ................................................................................................ 14 B. Acute Toxicity ...................................................................................................... 16 C. Subchronic Toxicity ............................................................................................. 27 D. Chronic Toxicity/Oncogenicity ............................................................................. 30 E. Genotoxicity......................................................................................................... 37 F. Reproductive Toxicity .......................................................................................... 44 G. Developmental Toxicity ....................................................................................... 46 H. Neurotoxicity........................................................................................................ 48 IV. Risk Assessment............................................................................................................. 53 A. Hazard Identification............................................................................................ 53 B. Exposure Assessment......................................................................................... 62 C. Risk Characterization .......................................................................................... 73 V. Risk Appraisal ................................................................................................................. 78 VI. Tolerance Assessment.................................................................................................... 90 VII. Reference Concentrations .............................................................................................. 94 VIII. Conclusions..................................................................................................................... 96 VIII. References...................................................................................................................... 97 Appendix A. Acute Dietary Exposure Analysis Printouts ....................................................... 120 Appendix B Chronic Dietary Exposure Analysis Printouts .................................................... 146

1
I. SUMMARY
Toxicology The acute effects of azinphos-methyl are due primarily to its inhibition of acetylcholinesterase (AChE) which is an enzyme in the nervous system responsible for terminating transmission of impulses across certain nerve synapses. Cholinergic signs (piloerection, ocular and nasal discharge, salivation, breathing difficulties, staggering gait, tremors, twitching, and/or convulsions) were the primary effects observed in laboratory animals with acutely toxic exposures to azinphos-methyl. An acute NOEL of 0.75 mg/kg was established for blood ChE inhibition in an acceptable single oral dose study in human volunteers. This NOEL was similar to the NOELs in animals studies which were between 0.3 mg/kg (RBC ChE inhibition, rats, oral) and 4.1 mg/kg (unspecified toxic signs, rats, inhalation) and suggest that humans are not more sensitive than animals. A subchronic NOEL of 0.25 mg/kg for blood ChE inhibition was also established in a 28-day repeated dose study in male human volunteers. This NOEL was supported by a similar NOEL of 0.29 was observed in another 30-day human study. The NOELs in the subchronic animal studies ranged from 0.09 mg/kg/day (plasma, RBC and brain ChE inhibition, rats, oral) to 3.75 mg/kg/day (mortality and decreased survival of offspring, mice, oral) and also suggest that humans are not more sensitive than animals. No acceptable chronic toxicity study in human volunteers was available. The effects observed in animals with subchronic or chronic exposure to azinphos-methyl included cholinergic signs, reduced body weights and food consumption, microscopic pathological changes in the uterus, reduced sperm production, decreased survival of pups following birth, and ChE inhibition. The lowest NOEL established in a chronic study was 0.15 mg/kg/day based on diarrhea and RBC ChE inhibition in dogs.
Exposure Analysis Azinphos-methyl has been used on a variety of crops; however, its major use has been on tree crops, including pome and stone fruit and nut crops. U.S. EPA has proposed canceling many uses of azinphos-methyl; however, its use on many tree crops should continue for at least 4-years. The estimated potential acute exposure for handlers (mixer/loaders, applicators, mixer/loader/applicators, and pilots) for tree crop application ranged from 0.5 μg/kg/day for airblast mixer/loaders to 49.3 µg/kg/day for airblast mixer/loader/applicators. For field workers, the acute exposure estimates ranged from 2.4 to 85.6 µg/kg/day with proppers (workers who prop up heavy, fruit laden branches) having significantly lower exposure than thinners and harvesters of tree crops. Assuming some accumulation in the body with repeated, short-term exposure, the daily body burdens for handlers ranged from 1.0 to 98.6 μg/kg/day. The estimated daily body burdens for field workers ranged from 2.6 to 96.5 μg/kg/day. It was estimated that aerial handlers, ground handlers, and field workers are exposed approximately 10, 20 and 90 days, respectively, during a 7-month use season. The estimated seasonal exposure for handlers ranged from 0.05 to 4.70 μg/kg/day. Due to significantly more exposure days during a season, the seasonal exposure estimates for field workers were much higher, ranging from 1.03 and 34.46 μg/kg/day. Chronic occupational exposure was estimated by amortizing the seasonal exposure over 365 days instead of 210 days. The estimated chronic exposure for handlers ranged from 0.03 to 2.70 µg/kg/day. As with seasonal exposure, the estimated chronic exposure for field workers was much higher, ranging from 0.5 to 20.4 µg/kg/day.
Although U.S. EPA has proposed revoking the tolerances for azinphos-methyl on many commodities this year, this proposal has not been finalized. Therefore, the dietary exposure
2
estimates included residues on these commodities. Acute dietary exposure estimates ranged from 0.64 μg/kg for non-pregnant, non-nursing females ages 13-19 years old to 3.94 μg/kg for nursing infants. Chronic dietary exposure estimates were between 0.05 μg/kg/day for males and females (non-pregnant, non-nursing) 20 years and older including seniors to 0.25 μg/kg/day for non-nursing infants. When dietary exposure was combined with occupational exposure, the exposure estimates only increased noticeably when occupational exposure was low as with airblast mixer/loaders. For these workers, the dietary contribution represented 41-70% of the total exposure.
The absorbed daily dosages (ADDs) for offsite (application site) air were based on air monitoring following an application to a walnut orchard in Glenn County. The ADDs for offsite air were 80 and 170 ng/kg for adults and children, respectively. The ADDs for ambient air were based on air monitoring conducted in five rural locations in Kern County during one month. The ADDs were initially calculated for the Pond site which had the highest average and 95th percentile air concentrations of azinphos-methyl. The ADDs for ambient air at the Pond site ranged from 23.1 ng/kg for adult females to 61.3 ng/kg for children based on the 95th percentile air concentration. The seasonal average daily dosages (SADDs) for ambient air at the Pond site ranged from 4.7 ng/kg/day for adult females to 11.4 ng/kg/day for children based on the average air concentration during the monitoring period. The annual average daily dosages (AADDs) for ambient air at the Pond site ranged from 1.9 ng/kg/day for adult females to 4.7 ng/kg/day for children, assuming potential exposure of 180 days per year. Due to their higher respiratory rate relative to their body weight, children consistently had the highest exposure.
Risk Evaluation The risk for acute and non-oncogenic chronic health effects in humans is expressed as a margin of exposure (MOE). The MOE is the ratio of the NOEL to the potential human exposure dosage. The MOEs for acute occupational exposure were between 15 and 1500 for handlers. The acute MOEs ranged from 9 to 310 for field workers. The MOEs for short-term occupational exposure were between 8 and 750 for handlers. The short-term MOEs ranged from 8 to 260 for field workers. The MOEs for seasonal occupational exposure ranged from 53 to 5000 for handlers. The seasonal MOEs for field workers were much lower due to more days of exposure, ranging from 7 to 240. The MOEs for chronic occupational exposure similar to seasonal MOEs, ranging from 56 to 5000 for handlers and from 8 to 250 for field workers. The addition of dietary exposure did not drastically reduce the MOEs for most pesticide workers whose occupational exposure was relatively high. For job categories where the occupational exposure was low, the MOEs for combined dietary and occupational exposure were still greater than 100. The MOEs for acute dietary exposure ranged from approximately 190 to 1,200 among the various population subgroups. Non-nursing infants less than one year old had the lowest MOE for acute dietary exposure. The MOEs for chronic dietary exposure ranged from approximately 600 to 3,100. The chronic MOEs were also lowest for non-nursing infants less than one year old.
The MOEs for acute exposure to azinphos-methyl in offsite and ambient air ranged from 1,800 to 64,000 depending on the NOEL used and the population subgroup. The MOEs for seasonal exposure to azinphos-methyl in ambient air ranged from 7,900 to 53,000. The MOEs for chronic exposure azinphos-methyl in ambient air were between 32,000 and 79,000.
3
Tolerance Assessment A tolerance assessment for azinphos-methyl was conducted assuming commodities were consumed at their tolerance level for acute exposure. Only those food uses that U.S. EPA proposed a 4-year phase-out (almonds, tart-cherries, cottonseed, cranberries, peaches, pistachios and walnuts) or 4-year time-limited tolerances (apples, blueberries, Brussels sprouts, caneberries, sweet cherries and pears) were included. The MOEs for potential acute exposure were greater than 10 for all commodities in all population subgroups. Based on these estimates, the tolerances for these remaining commodities appear to be adequately health protective.
Reference Concentrations
Air concentrations of azinphos-methyl that are below the reference concentrations (RfCs) are considered sufficiently low to protect human health. The acute RfCs for azinphos-methyl was 101 μg/m3 (7.8 ppb) based on the NOEL from the single dose human study. The seasonal RfCs range from 11 μg/m3 (0.87 ppb) based on the 28-day human study. The chronic RfC is 6.8 μg/m3 (0.52 ppb) based on the NOEL from the chronic dog study.
Conclusions Generally, a margin of exposure greater than 100 is desirable when the NOEL is based on animal data. When the NOEL is based on human data, then an MOE of at least 10 is usually desirable. Since the subchronic NOEL is based on a human study in which only male volunteers were tested, an MOE of at least 30 is recommended for seasonal exposure assuming females are slightly more sensitive than males. An MOE of 30 is also recommended for chronic exposure even though the NOEL is based on an animal study because the 28-day human study indicates that humans are not more sensitive than animals. The MOEs for acute occupational exposure to azinphos-methyl were greater than 10 for all agricultural workers, except peach harvesters. The MOEs for short-term occupational exposure were less than 10 for airblast applicators, and peach harvesters and thinners. The seasonal and chronic MOEs were greater than 30 for all agricultural workers, except tree crop harvesters and thinners. The MOEs for acute and chronic dietary exposure were greater than 100 for all population subgroups. The acute, seasonal and chronic MOEs for offsite and ambient air exposure were all greater than 1,000.
4
II. INTRODUCTION
A. REGULATORY BACKGROUND
Azinphos-methyl (O,O-dimethyl-S-([4-oxo-1,2,3-benzotriazin-3(4H)-yl]methyl) phosphorodithioate) was first registered in 1959 by Mobay Chemical Corporation in the United States (U.S. EPA, 1986a). In 1986, the U.S. EPA issued a reregistration standard for azinphos-methyl. The Department of Pesticide Regulation (DPR) in the California Environmental Protection Agency placed azinphos-methyl on the high-priority list for risk assessment in 1988 based on possible adverse effects identified in chromosomal aberrations and oncogenicity studies submitted under the Birth Defect Prevention Act (SB 950) and due to its low no-observed-effect level (NOEL) for acute toxicity. DPR classified azinphos-methyl as a restricted-use pesticide based on its acute toxicity (Category I) which limits its sale and use to licensed pesticide control applicators or people under their supervision. DPR also requires closed systems be used for mixing and loading of all Category I liquid formulations. Closed system loading is required for all liquid mixes derived from Category I dry formulations. In 1989, the California Assembly passed AB2161 which requires DPR to conduct dietary risk assessments for all pesticides with food crop uses. In 1993, the U.S. EPA issued an acute data call-in for illness reports from poison control centers because of concerns regarding acute risks to human health. Azinphos-methyl is also a high-priority pesticide for risk assessment under the California Toxic Air Contaminant Act (AB 1807).
In 1998, DPR completed a Risk Characterization Document (RCD) for azinphos-methyl that addressed the potential adverse health effects from occupational and dietary exposure using the best available data at that time (Lewis et al., 1998). Based on the 1998 RCD, emergency regulations were put into effect in June 1998 due to concerns about excessive exposure for tree crop applicators and harvesters. The maximum application rate was reduced from 2.0 to 1.0 lb a.i./acre/application for all crops. Enclosed cabs or chemical resistant suits with hoods, boots and respirators were required for applicators using airblast ground equipment. The re-entry intervals (REIs) for thinning and harvesting activities were increased from 14 days to 50 days for pome and stone fruit crops. In August 1999, the emergency regulations were extended, but the REIs were returned to 14 days based on a new human study which indicated the acute MOEs were adequate. The maximum application rate was also returned to 2.0 lb a.i./acre. These emergency regulations became permanent in October 2000.
In 1999, U.S. EPA completed their risk assessment addressing occupational and dietary
exposure to azinphos-methyl. U.S. EPA reached a memorandum of agreement with the registrants that adopted all of the mitigation measures enacted by DPR as permanent label changes, including use of enclosed cabs for applicators, closed systems for mixing and loading and 14-day REIs for pome, stone and nut tree crops. In addition, they reduced the maximum application rate for pome fruit from 2.0 to 1.5 lb a.i./acre. In 2000, U.S. EPA reduced the tolerances for a number of commodities due to dietary concerns. These included the tolerances for almonds, apples, crabapples, cranberries, grapes, pears, potatoes, and quinces. They also revoked tolerances for a number of commodities (apricots, artichokes, barley, clover, dry beans, gooseberries, pasture grass, kiwi fruit, oats, black-eyed peas, pomegranates, rye, soybeans, and wheat) that no longer had registered uses. In addition, they revoked all 13 meat, milk, poultry and egg tolerances based on no reasonable expectation of finite residues in these commodities. Because of surface water concerns, U.S. EPA also cancelled the use on
5
sugarcane and on cotton east of the Mississippi River. They also cancelled use on ornamental, Christmas, forest and shade trees to reduce exposure to affected ecosystems.
In 2001, U.S. EPA published its Interim Reregistration Eligibility Document (IRED) for azinphos-methyl. The IRED included updated toxicological and exposure data and a risk-benefits analysis. They concluded all uses of azinphos-methyl were ineligible for reregistration based on their currently approved labeling. They proposed the immediate cancellation of 28 uses (alfalfa, beans - succulent or snap, birdsfoot trefoil, broccoli, cabbage including Chinese, caneberries - foliar application only, cauliflower, citrus, celery, clover, cucumbers, eggplants, filberts, grapes, melons, nectarines, nursery stock other than quarantine use, onions - green, onions - dry bulb, parsley, pecans, peppers, plums and dried plums, potatoes, quince, spinach, strawberries and tomatoes) which had little use and/or low benefits. Another 7 uses (almonds, cherries - tart, cotton, cranberries, peaches, pistachios, and walnuts) were allowed to continue with a 4-year phase out since these uses were considered to have moderately high economic benefits, but the risks outweigh the benefits. The 8 remaining uses (apples including crabapples, blueberries, Brussels sprouts - application to soil at transplant only, caneberries - application to canes and soil only, sweet cherries, quarantine use on nursery stock, pears, and southern pine seed orchards) were considered to have significant economic benefits and there is no adequate substitute. These uses were considered eligible for reregistration with 4-year time-limited tolerances. At the time of this report, these proposed changes have not been finalized.
DPR decided to revise their 1998 RCD for azinphos-methyl primarily due to new human studies, new occupational exposure scenarios for repeated short-term and seasonal exposure and the addition of an exposure assessment for azinphos-methyl in ambient air. However, other less significant changes were made to the RCD including a change of the NOEL used to evaluate chronic exposure, an elaboration of the discussion of several endpoints (e.g., blood ChE inhibition and oncogenicity) and an update of the dietary consumption and residue data. Consequently, there were changes throughout the RCD, including the Summary, Introduction, Toxicology Profile, Hazard Identification, Exposure Assessment, Risk Characterization, Risk Appraisal, Tolerance Assessment and Conclusion. B. CHEMICAL IDENTIFICATION
Azinphos-methyl is a broad spectrum organophosphate insecticide, acaricide, and molluscacide (U.S. EPA, 1986a). Azinphos-methyl and its oxygen analog produce their toxic reaction primarily through their inhibition of cholinesterase (ChE) enzymes. ChEs are a family of enzymes found throughout the body that hydrolyze choline esters. Acetylcholinesterase (AChE; also called specific or true cholinesterase) is found near cholinergic synapses, in some organs (e.g. lung, spleen, gray matter) and in red blood cells (Lefkowitz et al., 1990). Normally, AChE metabolizes acetylcholine to acetate and choline, which results in the termination of stimulation to dendritic nerve endings and motor endplates. Acetylcholine is the neurochemical transmitter at endings of postganglionic parasympathetic nerve fibers, somatic motor nerves to skeletal muscle, preganglionic fibers of both parasympathetic and sympathetic nerves, and certain synapses in the central nervous system (CNS) (Murphy, 1986).
The inhibition of AChE results in the accumulation of endogenous acetylcholine in nerve tissue and effector organs. In acutely toxic episodes, muscarinic, nicotinic and CNS receptors are stimulated with characteristic signs and symptoms occurring throughout the peripheral and central nervous systems (Ellenhorn and Barceloux, 1997; Murphy, 1986). Muscarinic effects can

6
include increased intestinal motility, bronchial constriction and increased bronchial secretions, bladder contraction, miosis, secretory gland stimulation and bradycardia. Nicotinic effects include muscle weakness, twitching, cramps and general fasciculations. Accumulation of acetylcholine in the CNS can cause headache, restlessness, insomnia, anxiety and other non-specific symptoms. Severe poisoning results in slurred speech, tremors, ataxia, convulsions, depression of respiratory and circulatory centers and, eventually, coma.
Butyrylcholinesterase (BuChE), sometimes referred to as plasma ChE, pseudo-cholinesterase, or serum esterase, is also inhibited by azinphos-methyl. Any reference in this document to "cholinesterase", without specifically indicating that the enzyme is serum or plasma ChE, should be interpreted as AChE. BuChE only occurs to a limited extent in neuronal elements of the central and peripheral nervous systems in adults, but it appears to be important in the developing nervous system of birds and mammals where it is the predominant form of cholinesterase (Brimijoin and Koenigsberger, 1999). As neuroblasts switch from cell proliferation to neural differentiation, there is concomitant switch from BuChE to AChE. Li et al. (2000) speculated that BuChE functions in the adult nervous system as a replacement for AChE based primarily on the survival of AChE-/- knockout mice for several weeks after birth. Unlike AChE, BuChE occurs primarily in non-neuronal or non-synaptic sites in adults like the liver, lung, and plasma and its function has not been clearly established (Lefkowitz et al., 1990; Brimijoin, 1992; U.S. EPA, 1993; Pantuck, 1993). BuChE may protect the nervous system by acting as a scavenger or a detoxification enzyme in these non-neuronal sites. Administration of exogenous BuChE has been demonstrated to provide significant protection against several organophosphate compounds in rats, mice, guinea pigs and non-human primates (Raveh et al., 1993 & 1997; Allon et al., 1998). However, rats that were depleted of plasma AChE by injecting them intravenously with antibodies specific to this enzyme were not more susceptible to paraoxon toxicity than untreated controls based on their performance in a functional observational battery and AChE activity in the brain and diaphragm (Padilla et al., 1992). Jbilo et al. (1994) noted that BuChE has characteristics similar to other detoxification enzymes. It concentrates in major organs of entry such as the liver, and lung and it has a broad substrate specificity relative to AChE due to its larger active site. Naturally occurring ChE inhibitors include esters (cocaine), carbamates (physostigmine), peptides (fasciculin) and alkaloids (solanine).
An atypical genetic variant of plasma cholinesterase has been associated with an
increased susceptibility to various drugs, such as succinylcholine and cocaine (Lockridge, 1990; Pantuck, 1993; Lockridge and Masson, 2000). The atypical BuChE has a single amino acid substitution in which aspartic acid 70 is replaced by glycine 70, resulting in a decreased affinity for positively charged ChE inhibitors compared to neutral compounds. This evidence suggests that individuals with atypical BuChE would only more be susceptible to OPs and carbamates if they were positively charged. Other genetic variants of BuChE have been identified including some that have normal catalytic activity, but a reduced number of molecules. Some silent genetic variants have essentially no BuChE activity. Individuals with these genetic variants are probably more susceptible to most ChE inhibitors. Sparks et al. (1999) found that BuChE inhibited by OPs or carbamates potentiated the toxicity of succinylcholine in mice. The potentiation was greatest with the most potent BuChE inhibitors (not necessarily the most potent AChE inhibitors). These investigators also noted that increased sensitivity to succinylcholine was reported in two cases where patients were poisoned by OPs.
At 0.1 mM, azinphos-methyl also inhibits the active transport of glucose in isolated mouse intestine (Guthrie et al., 1974). The mechanism by which it inhibits glucose transport is

7
unknown. It is also unknown if this in vitro biochemical effect has any relationship to clinical or pathological effects observed in vivo. C. TECHNICAL AND PRODUCT FORMULATION
Currently there are 6 products containing azinphos-methyl as an active ingredient registered in California. Four formulations are wettable powders (50% azinphos-methyl) and 2 are emulsifiable concentrates (22% azinphos-methyl). Miles Inc. is the registrant for 2 of these formulations (1 wettable powder and 1 emulsifiable concentrates). Gowan Company is the registrant for 3 formulations (2 wettable powders and 1 emulsifiable concentrate). Micro-Flo Company is the registrant for the other wettable powder formulation. D. USAGE
The azinphos-methyl formulations registered in California are all considered restricted use pesticides based on their acute toxicity. Azinphos-methyl may be applied by ground or aerial equipment by certified applicators or persons under their supervision. The maximum rate of application is 2 lbs of active ingredient/acre. The major uses for azinphos-methyl are on seven fruit tree crops (almonds, walnuts, apples, pistachios, pears, plums and peaches in descending order of use) which constituted 96% of its use in 1999 (DPR, 2000a). In 1999, 217,834 pounds of azinphos-methyl were used on 32 different commodities.
Current labels require airblast applicators to wear the following personal protective equipment (PPE) if a fully enclosed cab is not used during application: a chemical-resistant suit over long-sleeved shirt and long-legged pants, chemical resistant hood, chemical resistant shoes plus sock, and a full-faced respirator or a half-faced respirator with ad shield (Formoli and Fong, 2001). Human flaggers are prohibited. Applicators other than airblast must wear coveralls with long-sleeved shirt and long-legged pants, waterproof gloves, chemical-resistant shoes with socks, chemical-resistant headgear for overhead exposure, protective eyewear, and dust/mist filtering respirator. Mixer/loaders must wear also wear the same protective clothing plus a chemical-resistant apron when mixing and loading. In California, a closed system is required for mixing Category I liquid formulations. If a closed system is used, no respirator is required, and a long sleeved shirt and long pants may be substituted for the protective suit.
The reentry intervals (REIs) are 30 days for citrus, 21 days for grapes, 14 days for other tree crops such as apples, peaches, and nectarines (Formoli and Fong, 2001). The REI for other activities involving minimal contact with treated foliage is 3 days with less than 25 inches of rainfall. The REIs for all other crops are 5 days with less than 25 inches of rainfall. E. ILLNESS REPORTS
In California, there were 197 cases of work related illnesses/injuries between 1982 and 1997 associated with exposure azinphos-methyl either alone or in combination with other pesticides (Mehler, 2004). In approximately 80% of the cases, the symptoms were systemic. Of these 197 cases, 160 cases were associated with occupational exposure. A few incidents resulted in cluster illnesses among field workers including an incident in 1987 involving 36 peach harvesters and another incident in 1993 involving 14 almond pruners. The other occupational exposures primarily involved mixer/loaders and applicators. Of the 36 non-

8
occupational illnesses, 34 cases were associated with drift incidents into residential areas in 1987 and 1993. In the both drift incidents, pesticide odor was reported by affected individuals along with headache, dizziness, vomiting, and nausea. Since the emergency regulations went into effect in 1998, which required more protective clothing and/or equipment, there have been only 3 illnesses reported that were probably or possibly associated with exposure to azinphos-methyl. Accidental or intentional protective equipment removal appears to be involved in both cases. In one possible case, an applicator felt a spray mist containing azinphos-methyl hit his face after tree branches pulled his respirator out of place. Several hours later he developed nausea, vomiting and headache. In another incidence, an applicator removed his gloves to unplug the nozzle on his airblast sprayer and some of a pesticide mixture containing azinphos-methyl, propargite and adjuvant ran down his sleeves. He wiped his arms with a towel and then continued spraying for another 30 minutes before washing his arms with soap and water. He developed a blistered rash on both arms, but no systemic signs. In this case, it is important to note that azinphos-methyl is only a mild dermal irritant whereas propargite is a severe dermal irritant (Lewis, 2004). The third case involved a mixer/loader who got eye irritation and tearing after sweat ran into his eye when he briefly removed his goggles to wipe the sweat from his forehead. He had just connected the transfer hose from a closed system containing a pesticide mixture including azinphos-methyl to the application rig. F. PHYSICAL AND CHEMICAL PROPERTIES (U.S. EPA, 1986a) 1. Common Name: Azinphos-methyl 2. Chemical Name: O,O-dimethyl-S- ([4-oxo-1,2,3-benzotriazin-3(4H)-
yl] methyl) phosphorodithioate 3. Trade Names: Guthion, Gusathion, Gusathion-M, Crysthyron,
Cotnion, Cotnion-methyl, Metriltrizotion, Carfene, Bay 9027, Bay 17147, R-1852
4. CAS Registry No.: 86-50-0 5. Molecular weight: 317.3 (Bayer AG, 1981) 6. Structural Formula:
7. Empirical Formula: C10H12N3O3PS2 8. Specific Gravity: 1.44 at 20oC (Baird, 1987)
CN
NN
O
CH2SP
SCH3O
CH3O

9
9. Solubility: Water - 28 mg/L at 20oC (Krohn, 1987) Solvents (20oC): (Bayer AG, 1981) n-Hexane - <1 g/L Dichloromethane - >1000 g/L 2-Propanol - 1 to 10 g/L Toluene - 100 to 1000 g/L 10. Vapor pressure: 1.6 x 10⁻⁶ mmHg at 20oC. (Talbott and Mosier,
1987) 11. Octanol/water partition coefficient: 360 at 20oC (Sandie, 1983) 12. Henry's law constant: 2.55 x 10⁻⁸ atm-m3/mol at 20oC (Talbott, 1987) G. ENVIRONMENTAL FATE
Hydrolysis
Liang and Lichtenstein (1972) reported that azinphos-methyl was hydrolyzed in aqueous solutions at pH values from 6 to 11. The hydrolysis increased as the pH increased. At pH 11, 97% of the applied azinphos-methyl was converted to water soluble products. The hydrolytic products were identified as methyl benzazimide sulfide, anthranilic acid, benzazimide, and azinphos-methyl oxygen analog. Wilkes et al. (1979a) also studied the hydrolysis of azinphos-methyl at pH 4, 7, and 9, at 30 and 40oC, and at 1 and 10 ppm. The half-lives ranged from 1 to 42 days. The half-lives decreased as the pH and temperature increased. The azinphos-methyl was slightly more stable at 10 ppm than at 1 ppm at all pH values. The major metabolites were identified as benzazimide and/or hydroxymethyl benzazimide. Anthranilic acid, mercaptomethyl benzazimide and bis-(benzazimide-N-methyl) sulfide were identified as minor metabolites. No losses could be attributed to volatilization.
Photolysis
Rapid and extensive photodegradation of azinphos-methyl was observed when exposed to artificial UV light (254 nm), whereas no or little decomposition occurred in the dark (Liang and Lichtenstein, 1972). The photodegradation products identified were benzazimide, N-methyl benzazimide, anthranilic acid, methyl-benzazimide sulfide. Wilkes et al. (1979b) also reported rapid photodegradation of azinphos-methyl in a non-sterile, pH 4 aqueous solution under a high intensity mercury lamp. The half-life was 9.4 hrs. The photodegradation products identified were benzazimide and/or hydroxymethyl benzazimide, anthranilic acid, and methyl benzazimide. No volatile products were detected. Rapid photodegradation was also seen when azinphos-methyl was irradiated with natural sunlight in a sterile, pH 4 aqueous solution (Morgan, 1987a). The estimated half-life was 76.7 hrs. The photodegradation products identified were benzazimide, anthranilic acid, and methyl anthranilate.
Azinphos-methyl undergoes photodegradation more slowly when applied to soil. When azinphos-methyl was irradiated with a mercury lamp after application to sandy loam soil, the half-life was 220 hrs (Wilkes et al., 1979c). The major photodegradation products were benzazimide and/or hydroxymethyl benzazimide, azinphos-methyl oxygen analog, methyl benzazimide, and bis-(benzazimide-N-methyl) sulfide. No volatile products were formed. The photodegradation of azinphos-methyl, applied to sandy loam soil (pH 5), was slower with

10
exposure to natural sunlight (Morgan, 1987b). The estimated half-life was 99 days. In a subsequent study, the estimated half-life was 66 days when azinphos-methyl was applied to sterile sandy loam soil (pH 7) and exposed to natural sunlight (Gronberg, 1989). After correcting for non-photolytic degradation, the estimated half-life was 241 days. No degradation products were identified in either of these two experiments.
Soil Metabolism
The metabolism of azinphos-methyl in soils under laboratory and field conditions were studied by Schulz and coworkers (1970). In the laboratory study, azinphos-methyl was applied to silt loam and quartz sand soil and incubated at 30oC over a 10 week period. Approximately 95% of technical grade azinphos-methyl and emulsifiable concentrate (2 lb/gal) had degraded after 6 and 22 days, respectively. The metabolites detected were benzazimide, methyl benzazimide, and three other unknown compounds. In the field study, azinphos-methyl was applied to silt loam soil and its degradation followed for 4 years. The estimated half-life was 12 and 28 days for the emulsifiable concentrate and granular formulation, respectively. The major metabolites identified were mercaptomethyl benzazimide, N-methyl benzazimide, N-methyl benzazimide sulfide (disulfide), and benzazimide.
In a subsequent soil metabolism study, the estimated half-life of azinphos-methyl in a non-sterile soil was 21 days under aerobic conditions and 68 days under anaerobic conditions (Gronberg et al., 1979). The degradation products included benzazimide, anthranilic acid, hydroxy-methylbenzazimide, methyl benzazimide sulfide, N-methyl benzazimide, and traces of mercaptomethyl benzazimide and the oxygen analogue of azinphos-methyl. Azinphos-methyl is stable in sterile soil conditions with a half-life of 355 days.
Field Dissipation
Azinphos-methyl was applied once or twice at 3 lb. a.i./acre (the highest single application rate) at two different locations in California, Fresno and Chualar (Grace and Cain, 1990). The first order dissipation constants from the single application plots were 0.063 at Chualar and 0.130 at Fresno with respective half-lives 10.9 and 5.3 days. In only one sample were residues of azinphos-methyl or its oxygen analog (0.09 ppm) detected at depths below 6". This was found in the soil layer 6-12" below the surface 28 days post-application.
Persistence and degradation of azinphos-methyl in soil are affected by formulation and mode of applications (Schulz et al., 1970). The half-life of azinphos-methyl residues ranged from 6.5 to 168 days (average 67 days) using various formulations incorporated 6 inches into the soil. Azinphos-methyl applied as an emulsion on the soil surface had a half-life of 12 days, while azinphos-methyl applied in granular form, as well as rototilling into the soil to a depth of 4-5 inches, increased the half-life to 28 days. Degradation of azinphos-methyl was also affected by pH and temperature (Heuer et al., 1974; Liang and Lichtenstein, 1976). At a pH of <9, the half-life of azinphos-methyl in water is approximately one month at a temperature of 6o or 25oC. Increasing the pH to greater than 9.5 caused the half-life to fall to less than one week. Moisture content and temperature also significantly affect the persistence of azinphos-methyl in soil (Yaron et al., 1974). Half-lives of 484, 88, and 32 days was observed in dry natural soil at temperatures of 6o, 25o, and 40oC ,respectively. In wet soil at identical temperatures, the half-lives were 64, 13, and 5 days, respectively.

11
Soil Adsorption
Available data indicate that azinphos-methyl has a relatively low affinity for various types of soil. Ziegler and Hallenbeck (1987) reported adsorption coefficients (Kd) of 12.7, 4.0, 6.8, and 8.4 for silt loam, sandy loam, sand, and clay loam, respectively. The adsorption coefficients based on soil organic carbon (Koc) were 829, 693, 1282, and 723 for silt loam, sandy loam, sand, and clay loam, respectively. Similar Kd values (3.3, 11.0, and 28.5 ml/g) were reported by Flint et al. (1970) for sandy loam, silt loam, and high organic silt loam, respectively.
Mobility
In a column leaching study, azinphos-methyl was incubated in silt loam soil for 28 days and then placed on top of a 30.5 x 1.5 cm silt loam soil column (Atwell and Close, 1976). Water was passed through the column at a rate of 0.5 inch/day for 45 days. Ninety percent of the azinphos-methyl remained in the upper 2 inches of soil, with only 4% reaching the leachate. In another column leaching study, azinphos-methyl was applied directly the top of 45 x 1.6 cm soil columns without a pre-incubation period (Flint et al., 1970). An estimated 62, 195 and 186 inches of rainfall were required to leach azinphos-methyl one foot into sandy loam, silt loam, and high organic silt loam, respectively. Minimal leaching characteristics of aged residues of azinphos-methyl were also observed in field studies (Schulz et. al., 1970; Staiff et al., 1975; Kuhr et al., undated). The majority of the residual azinphos-methyl was detected in the upper 2 to 6 inches of the soil in fields treated with the chemical.
Groundwater Monitoring
Pursuant to the Pesticide Contamination Prevention Act (AB 2021), DPR has identified azinphos-methyl as a potential groundwater contaminant based on its high water solubility (> 3 ppm), low soil adsorption (Koc < 1900 cm3/g), long hydrolysis half-life (t1/2 > 14 days) and long anaerobic soil metabolism half-life (t1/2 > 9 days) (DPR, 2000b). However, azinphos-methyl was not detected in the water from 1,291 wells sampled in 43 counties in California between 1983 and 1997 (DPR, 1992a, 1993a, 1994, 1995, 1997 & 1998). No additional groundwater monitoring has been conducted by DPR after 1997 since there were no residues detected in the previous years (DPR, 1999 & 2000c&d). U.S. EPA estimated drinking water exposure to azinphos-methyl through groundwater using the SCI-GROW model assuming 3 applications at a maximum application rate of 2.0 lbs/ acre/application to walnut trees (U.S. EPA, 2001a). The maximum groundwater concentration was estimated to be 0.40 ppb. The lowest acute Drinking Water Level of Concern (DWLOC) was 5 ppb for infants. The maximum mean annual ground water concentration was also 0.40 ppb. The lowest chronic DWLOC was 7 ppb for non-nursing infants. This model suggests that potential exposure to azinphos-methyl in drinking water derived from ground water is not of concern for any population subgroup.
Surface Water Monitoring
Azinphos-methyl has been detected in surface water. Azinphos-methyl residues were detected in 23 of 1918 surface water samples collected in 16 counties in California between 1991 and 2003; however, the LOQ was 1 ppb in approximately 440 samples and all the detectable residues were less than 1 ppb (Starner, 2004). The highest residue detected was 0.826 ppb. These detections were found in the San Joaquin River, Merced River, Orestimba and Del Puerto Creeks (tributaries of the San Joaquin River), and Colusa Basin Drain. The

12
average residue detected, including the samples with no detectable residues (assuming the LOQ for these samples), was 0.270 ppb. If ½ of the LOQ was used for the samples with no detectable residues, the average residue dropped to 0.136 ppb.
The highest residue detected in DPR’s surface water monitoring was considerably lower
than the maximum surface water residue of 16 ppb that U.S. EPA estimated using the PRZM-EXAMS model, assuming 3 aerial applications at the typical application rate of 0.6 lbs/acre/ application to peach trees on a 10-hectare field which was next to a 1-hectare pond with no outlet (U.S. EPA, 2001a). This residue was 3 times their estimated DWLOC for acute exposure of 5 ppb for infants. However, in this same document U.S. EPA determined the use of azinphos-methyl on peaches to be ineligible for reregistration due to worker and ecological risks. Modeling for cherries and apples, resulted in maximum residues just slightly higher than the DWLOC. With the additional mitigation that U.S. EPA has proposed for these crops, including the elimination of aerial application, they anticipate that the surface water residues to fall below the DWLOC. U.S. EPA estimated the maximum mean annual surface water residues to be 7 ppb. The lowest chronic DWLOC was 7 ppb for non-nursing infants. Although the model estimates suggest that surface water exposure to azinphos-methyl may be of concern for non-nursing infants, U.S. EPA did not expect residues of azinphos-methyl to persist in surface water due to its physical/chemical properties and, therefore, these residues were not a concern as far as chronic exposure.
Plant Metabolism
Azinphos-methyl is found primarily as a surface residue with slight to moderate absorption into plants. In lettuce, oranges, potatoes, apples, and cotton, 59-99% of the total residues remained on the surface 14-119 days after application (Magill and Everett, 1966; Gronberg et al., 1975; Drager, 1987; Krolski, 1988a&b; Chopade and Bosnak, 1988). The absorption was slightly greater in kidney bean plants where 36-74% of the residues remained on the leaf surface 28 days after application of azinphos-methyl (Steffens and Wieneke, 1976). Azinphos-methyl has high affinity for the cuticle waxes and oils which may partially account for its poor absorption into plants (Anderson et al., 1974).
The uptake and translocation of azinphos-methyl from a nutrient solution in young bean and barley plants was examined (Al-Adil et al., 1973). The assimilation of azinphos-methyl by the roots and the translocation of the radiocarbon into the aerial parts of both plant species were most rapid during the first 24 hours period. On day 8, the majority of the residues (98%) was identified as the parent compound. Topical application to the stem and seed injection with azinphos-methyl also showed translocation of the residues throughout the plant system. After penetration into cotton, azinphos-methyl appears to translocate throughout the plant especially into the new growth and bolls (Chopade and Bosnak, 1988).
The major component of the residues in plants was the parent compound. In lettuce, kidney beans, potatoes, apples, and cotton, the parent compound was 56-99% of the total residues (Magill and Everett, 1966; Weineke and Steffens, 1976; Drager, 1987; Krolski, 1988a&b; Chopade and Bosnak, 1988). In sorghum and oranges, azinphos-methyl was also the predominant residue 28-30 days after treatment, but it represented only 12-25% of the total residues (Gronberg et al., 1974 & 1975). Several metabolites common to sorghum, kidney bean plants, apples, and cotton were azinphos-methyl oxygen analog and benzazimide (Gronberg et al., 1974; Weineke and Steffens, 1976; Krolski, 1988b; Chopade and Bosnak, 1988). Anthranilic acid was also identified in sorghum, oranges, potatoes, apples, and cotton (Gronberg et al., 1974 & 1975; Krolski, 1988a&b; Chopade and Bosnak, 1988). Other minor
13
metabolites included benzazimide (sorghum, oranges), methyl benzazimide (sorghum, kidney bean plant), bis-methyl benzazimide sulfide or disulfide (kidney bean plant), mercaptomethyl benzazimide (potatoes, cotton), cysteinylmethyl benzazimide, desmethyl isoazinphos-methyl, desmethyl azinphos-methyl oxygen analog, and desmethyl azinphos-methyl oxygen analog glucoside (cotton) (Gronberg et al., 1974 & 1975; Weineke and Steffens, 1976; Krolski, 1988a; Chopade and Bosnak, 1988). The metabolic pathway appears to be similar in the various plant species, with the initial oxidation of azinphos-methyl to the oxygen analog, followed by hydrolysis and ultimately conjugation. The relative toxicity of these various plant metabolites is unknown except for benzazimide and methyl benzazimide which are discussed under the Acute Toxicity section of the Toxicology Profile in this document.
Increasing relative humidity and rain increased the uptake and metabolism of azinphos-methyl from bean plants, although the rain often removed residues on the surface of leaves depending on the intensity and time of rainfall (Steffens and Wieneke, 1975). Residues in food products decreased with washing, heating, and other processes. There was a 63-96% reduction of the azinphos-methyl in lemon and orange rind by normal washing procedures (Gunther et al., 1963). When citrus rind was converted into dried citrus pulp cattle feed, more than 80% of the residue was removed in the process. Juice pressed from grapes subjected to heating removed about 65% of the azinphos-methyl residues (Anderson et al., 1974).
Accumulation of Residues in Fish
Catfish exposed to azinphos-methyl had a relatively low magnitude of accumulation with a rapid rate of uptake and excretion (Lamb and Roney, 1976). The accumulation factor was approximately 60 during the last 21 days of the 28-day exposure. Azinphos-methyl and the des-methyl oxygen analog were found. Approximately 67% and 85% of the residues were excreted within 5 hours and four days, respectively, after exposure was discontinued.

14
III. TOXICOLOGY PROFILE A. PHARMACOKINETICS
Oral Absorption Azinphos-methyl, administered to rats, cattle and chickens by the oral route, was rapidly absorbed (Anderson et al., 1974; Patzschke et al., 1976; Kao, 1988; Everett et al., 1966; Scheele et al., 1977). Oral absorption appears to be nearly complete 2-6 hours post-dosing in these three species at which time the maximal blood concentrations are reached. The oral absorption rate was estimated to be 90-100%.
Dermal Absorption
The dermal absorption of azinphos-methyl in humans was approximately 16% based on a study with 6 male volunteers/treatment group (Feldman and Maibach, 1974). 14C-Azinphos-methyl was applied at 4 μg/cm2 in a 0.25% acetone solution to the forearms of one group, while another group was given the compound intravenously. The application sites were unprotected and the volunteers were asked not to wash the area for 24 hours. Approximately 70% of the dose was excreted in the urine within 5 days after intravenous administration of azinphos-methyl. Only 16% was excreted in the urine when applied topically after correcting for the incomplete urinary excretion when administered intravenously.
In a recent dermal absorption study, 14C-azinphos-methyl was applied topically to the
forearms of 6 human volunteers/treatment group in isopropyl alcohol at 2.6 and 9.2 μg/cm2 or in an aqueous suspension of Guthion 25 WP at 4.7 μg/cm2 (Selim, 1999). The application site was covered with an aluminum dome that had air holes. The exposure duration was 8 hours. Blood samples were collected up to 5 days after application while the urine and feces were collected for 13 days after application. The total recovery for all three groups ranged from 102 to 105%. The dermal absorption was measured as the sum of the radioactivity in the urine, feces and tape stripping. The dermal absorption ranged from 21.5% for aqueous suspension of the wettable powder to 27.8% for the technical material applied in isopropyl alcohol at the lower concentration. Since the isopropyl alcohol appeared to enhance dermal absorption and it is not normally used as a carrier in pesticide application, the dermal absorption with the aqueous suspension of the wettable powder was selected.
An average dermal absorption value of 19% was used to calculate absorbed dermal
dosages in humans based on the results from both human dermal absorption studies.
Distribution Forty-eight to 72 hours after oral administration of azinphos-methyl, less than 5% of the total dose remained in the tissues of rats (Patzschke et al., 1976; Kao, 1988). The highest residue levels were in liver and kidneys of rats, cattle, goats, and chickens (Patzschke et al., 1976; Kao, 1988; Everett et al., 1966; Gronberg et al. 1988; Ridlen and Pfankuche, 1988). The residue levels in these highly perfused tissues may be related to the apparent binding of azinphos-methyl to hemoglobin (Patzschke et al., 1976). With the exception of erythrocytes, there was a 10-fold decrease in tissue levels of rats from 6 to 48 hrs after application. There was no difference in the disposition and metabolism of azinphos-methyl between sexes of rats (Kao, 1988).

15
Biotransformation The first evidence to suggest that azinphos-methyl required metabolic activation to produce its cholinergic effects was the marked differences in its anticholinesterase activity in vitro and in vivo (DuBois et al., 1957a; Murphy and DuBois, 1957; March et al., 1957; Dahm et al., 1962). These studies indicated that its activation is rapid and occurs primarily in the microsomal fraction of liver. The active metabolite was identified as the oxygen analog of azinphos-methyl. The concentration of the oxygen analog required to inhibit 50% of rat brain cholinesterase in vitro was several orders of magnitude lower than of the parent compound (Dahm et al., 1962). Subsequently, in vitro and in vivo experiments with mice and rats have shown that the metabolism of azinphos-methyl is primarily due to mixed function oxidases (MFOs) and glutathione (GSH)-transferases in the liver (Motoyama and Dauterman, 1972; Lin et al., 1980; Kao, 1988). Kao (1988) proposed a metabolic pathway for azinphos-methyl (Figure 1) which involved oxidation by cytochrome P-450 resulting in the formation of azinphos-methyl oxygen analog, benzazimide, and a possible intermediate metabolite, mercaptomethylbenzazimide. Further methylation and oxidation of mercapto-methylbenzazimide generated methylthiomethylbenzazimide and its corresponding sulfoxide and sulfone. Metabolism of azinphos-methyl by GSH transferases resulted in the formation of desmethyl isoazinphos-methyl and glutathionyl methylbenzazimide. Further hydrolysis and oxidation led to the formation of cysteinylmethylbenzazimide and its corresponding sulfoxide and sulfone. Piperonyl butoxide administered 1 hr prior to azinphos-methyl inhibited its oxidative desulfuration and oxidative cleavage (Levine and Murphy, 1976). Detoxification of azinphos-methyl by glutathione conjugation increased with the inhibition of oxidative metabolism; however, no significant detoxification of the oxygen analog occurred by glutathione conjugation. The metabolism in cattle, goats, and chickens appear to be similar to rats (Everett et al., 1966; Gronberg et al., 1988; Ridlen and Pfankuche, 1988). The toxicity of the various metabolites is unknown except for benzazimide and methyl benzazimide whose LD50 values are at least an order of magnitude larger than the parent compound (see Acute Toxicity section). The major metabolites in tissues of goats and chickens were identified. In goats, the major metabolites identified in liver, kidney, muscle, fat and milk were (in decreasing order of prevalence) methylthiomethylbenzazimide sulfone, methylbenzazimide-type protein conjugates and methylthiomethylbenzazimide sulfoxide (Gronberg et al., 1988). In chickens, the major metabolites in liver, kidney, muscle, fat, and eggs were (in decreasing order of prevalence) benzazimide, methylthiomethylbenzazimide and its sulfoxide and/or sulfone, azinphos-methyl, and mercaptomethylbenzazimide protein or glucuronide conjugate (Ridlen and Pfankuche, 1988). The difference in metabolite patterns between these two species may be partly due to the difference in the time between the last dose and their sacrifice. The chickens were sacrificed only 2 hrs after their last dose whereas the goats were sacrificed 17-18 hrs after their last dose. One would expect that within a few hours of dosing some of the parent compound would not have been metabolized and many of the metabolites would not have been conjugated. Metabolites found in the urine after oral administration in rats were cysteinylmethyl-benzazimide sulfoxide and sulfone, methylsulfonylmethylbenzazimide, methylsulfinylmethyl-benzazimide, glutathionyl methylbenzazimide, desmethyl isoazinphos-methyl, benzazimide, and cysteinylmethylbenzazimide (Ecker, 1976; Kao, 1988). The metabolites identified in feces were desmethyl isoazinphos-methyl, azinphos-methyl oxygen analog, methylsulfonylmethyl- benzazimide, cysteinylmethylbenzazimide sulfoxide, and methylthiomethylbenzazimide. No parent compound or its glucuronic or sulfate conjugates were found in urine or feces.

16
Figure 1. Proposed metabolic pathway for azinphos-methyl in rats (Kao, 1988)
CN
NN
O
CH2SP
SCH3O
CH3O
azinphos-methyl
CN
NN
O
CH2SP
OCH3O
CH3O
azinphos-methyl oxygen analog P-450
CN
NN
O
CH2SP
OHS
CH3O
desmethyl isoazinphos-methyl
GSH transferase
mercaptomethylbenzazimide
CN
NN
O
H
benzazimide
hydrolysis
CN
NN
O
CH2HS
CN
NN
O
CH2SH3C
methylthiomethylbenzazimide
methylation
CN
NN
O
CH2S
O
H3C
methylsulfinylmethylbenzazimide
P-450
CN
NN
O
CH2S
O
H3C
methylsulfonylmethylbenzazimide
O
P-450
glutathionyl methylbenzazimide
GSH transferase
CN
NN
O
CH2SCH2C
O
NHCH2C
O
HO CH
NH
C
O
CH2CH2CH
NH2
C
O
HO
CN
NN
O
CH2SCH2C
O
CH
NH
HO
gamma-glutamyl transpeptidasecysteinyl glycinase
cysteinylmethylbenzazimide
CN
NN
O
CH2SCH2C
O
CH
NH
HO
O
cysteinylmethylbenzazimide sulfoxide
P-450
CN
NN
O
CH2SCH2C
O
CH
NH
HO
O
O
cysteinylmethylbenzazimide sulfone
P-450
P-450

17
Excretion Within 48 hours after rats and chickens were administered azinphos-methyl by the oral route, more than 90% of the total dose was eliminated in the excreta (Ecker, 1976; Patzschke et al., 1976; Kao, 1988; Scheele et al., 1977). The excretion in cattle was slower with only 52% of the applied dose excreted by 48 hrs, 40% in urine and 12% in feces (Everett et al., 1966). In rats, 60-80% and 15-35% of the total dose was excreted in urine and feces, respectively, irrespective of the route of administration (Ecker, 1976; Kao, 1988). Less than 0.1% was eliminated from the lungs. In lactating cows and goats, less than 1% of the applied dose was excreted in milk (Everett et al., 1977; Gronberg et al., 1988). The excretion of azinphos-methyl appears to fit a two compartment model based on its disappearance from tissues in rats (Patzschke et al., 1976). The elimination half-life was approximately 10 hrs for the alpha-phase and 10 days for the beta-phase. The slower elimination phase may be due to the apparent binding of azinphos-methyl and/or its metabolites to hemoglobin. Benzazimide Metabolite Weber et al. (1980) studied the pharmacokinetic behavior of the plant and animal metabolite, benzazimide, in rats. Greater than 95% of benzazimide administered orally was absorbed. More than 99% of the amount administered was excreted in the urine (54-66%) and feces (33-45%) within 48 hours. The elimination half-life for all tissues was approximately 4 days with the slowest elimination in blood and erythrocytes (t1/2 = 11 days). The identification of metabolites, if any, was not attempted. B. ACUTE TOXICITY Human Studies
Male human volunteers were administered azinphos-methyl orally in capsules at 0
(lactose), 0.25, 0.5, 0.75 and 1.0 mg/kg and followed for 14 days after dosing (McFarlane and Freestone, 1998). Dose levels were administered to volunteers (7 treated, 3 controls) in an ascending stepwise manner to minimize causing any toxic effects. In addition, 7 females were administered azinphos-methyl at 0.75 mg/kg along with 3 female control subjects. Female subjects were not pregnant and used “adequate contraceptive precautions.” The average age, weight and height of male subjects were 32.7 years, 75.52 kg, and 175.7 cm, respectively. The average age, weight and height of female subjects were 31.0 years, 63.83 kg, and 165.0 cm, respectively.
The objective of the study was to establish NOELs for plasma and red blood cell (RBC) ChE inhibition. In general, DPR considers brain ChE inhibition to be indicative of overt toxicity since it is one of the primary target sites. The toxicological significance of plasma and RBC ChE inhibition is less certain because the physiological functions of ChEs in blood have not been clearly established, but several possible functions have been proposed including drug metabolism, neural development and hematopoiesis (Lockridge and Masson, 2000; Brimijoin and Koenigsberger, 1999; Grisaru et al., 1999). In human studies, where brain ChE activity cannot be measured, plasma and/or RBC ChE inhibition are used as a default regulatory endpoint. In this study, baseline values for plasma and RBC ChE activity from 6 time points (days –10, -8, -4, -2, -1 and –30 min) were averaged for each individual to estimate the

18
percentage change from baseline. The percentage change from baseline was compared between treatment and control groups for 10 post-exposure time points (1, 2, 4, 8, 12, 24, 48, and 72 hours, 7 and 10 days) using a repeated measures analysis of variance. A test for linear trend was also performed on the male data. At 8 and 24 hours after dosing, there was a significant trend for increased plasma ChE activity relative to baseline in male subjects; however, pairwise comparisons with control subjects was not statistically significant at either of these time points at any dose level. The toxicological significance of an increase in ChE activity is uncertain and seems unlikely to be treatment-related. Females also had a significant increase in mean plasma ChE activity relative to baseline at 72 hours when compared to controls. A significant reduction in the mean RBC ChE activity (12% relative to baseline) was seen in males at 0.25 mg/kg 12 hours after dosing. However, the toxicological significance of this reduction is uncertain since the mean RBC ChE activity was significantly higher relative to baseline in males at 0.5 and 0.75 mg/kg/day at this time point. There was a significant trend for increased RBC ChE activity in males relative to baseline at 72 hours, but only the increase in the mean RBC ChE activity at 0.25 mg/kg was statistically significant when compared to controls. A significant increase in the mean RBC ChE activity relative to baseline was seen in females at 0.75 mg/kg 2 hours after dosing. Based on these data, the NOELs for plasma and RBC ChE inhibition were 1.0 and 0.75 mg/kg for males and females, respectively, the highest dose levels tested.
In addition to blood ChE activity, other parameters were measured at various time points during the study. These parameters included vital signs, electrocardiograms, hematology, clinical chemistry and urinalysis. Physical examinations were given prior to dosing and at 72 hours and 14 days after dosing. Besides vital signs, the physical examinations included assessments for respiratory effects, neurological and neuromuscular activity (pupils, ophthalmoscopy, cranial nerves, strength, sensation, reflexes, cerebellar function) cardiac functioning, and any other “events.” None of the measured parameters, physical signs or clinical observations gave any indication of clinically significant or compound-related effects. There was no clear dose-response relationship in the incidence of adverse events in males. There were 4, 4, 8, 0, and 6 adverse events in males at 0, 0.25, 0.5, 0.75 and 1.0 mg/kg, respectively. The adverse events included runny nose, disturbed vision, headache, dizziness, diarrhea, neck and back pain. Many of these were observed in the placebo group as well as the treatment groups. Although some of these adverse events could be related to ChE inhibition, only a few were considered possibly related (when the study was blinded) and no ChE inhibition was observed in these cases, except in one male at 0.5 mg/kg who had diarrhea at 30 hours after dosing when his RBC activity was reduced by 5-12% from his baseline. Even in this case, it is not clearly related to treatment given that the reduction in activity was well within the intra-individual variation for the male control subjects (coefficient of variation ranged from 5.4% to 14.1% with an average of 8.0%) and no similar events were observed at higher dose levels. In females there were more adverse events in the treated subjects (9 events in 5 of 7 subjects) than control subjects (1 event in 3 subjects). The adverse events in treated females included dizziness, headache, sore throat, respiratory tract infection and back pain. Most of these were considered not related or unlikely related by physicians when the study was blinded. Only dizziness in one subject and headache in another subject were considered possibly related to treatment at the time the study was blinded, but the reduction in RBC ChE activity in these subjects (0 and 8%, respectively) at the time of the events was within the intra-individual variation observed in the female control subjects (coefficient of variation ranged from 5.1 to 8.9% with an average of 6.7%). All adverse events in both male and female subjects were of grade 1 or 2 severity (4 being the highest severity).

19
Volunteers were not subjected to any neurobehavioral or neurophysiological testing to evaluate for more subtle neurological effects such as impaired cognition or nerve conduction. However, given no significant plasma or RBC ChE inhibition was seen, no neurological effects would be anticipated based on the acute neurotoxicity study for azinphos-methyl in rats (Sheets, 1994). DPR has no requirement for human testing of pesticides and there are no FIFRA (Federal Insecticide, Fungicide, and Rodenticide Act) guidelines for this type of study. However, the study was conducted in a double-blind manner following “Good Clinical Practices” guidelines and had an extensive informed consent form. The protocol and volunteer information was approved by an institutional review board (Independent Research Ethics Committee of Inveresk Research) and the study was conducted in accordance with the guidelines set out in the Declaration of Helsinki, 1964. Subjects were free to leave the study at any time and were paid in full if they left for health reasons. An epidemiology study in which a cohort of 90 male apple orchard applicators from New York State were evaluated to determine if short-term exposure to azinphos-methyl produced acute health effects (Stokes et al., 1995). The applicators were first questioned off season and then again during the spraying season for the presence of several acute signs and symptoms. Short-term exposure was validated by measuring dimethylthiophosphate in the urine. Chronic signs of peripheral nerve damage were determined by vibration sensitivity thresholds in both hands and feet during the off season. Long-term exposure to pesticides was determined by questionnaire. Seventy-eight applicators (86%) had used azinphos-methyl during the previous two growing seasons. The mean number of years azinphos-methyl had been used by the applicators was 14 years. The average number of applications per season was 5 times. Of the acute signs and symptoms related to organophosphate poisoning, only headaches were more frequent during the spraying season than off. The mean vibration threshold scores for the hands were significantly higher for applicators when compared with scores for the population based controls matched on age, sex, and county of residence. Several studies were available in the literature in which plasma and/or RBC ChE activities were monitored in orchard applicators or harvest workers exposed to azinphos-methyl. Sixteen thinners, 3 foremen, and 2 irrigators were evaluated over a 5-day period for whole blood ChE activity and urinary dialkylphosphate levels after working in peach orchards treated 14 days prior with azinphos-methyl at 2 lb a.i./acre (Kraus et al., 1977). Workers were also given pre- and post-exposure physical examinations in which they were evaluated for symptoms of organophosphate poisoning, with particular emphasis on reflex activity. A significant reduction in whole blood ChE activity to 85.2% of baseline was observed in the thinners from the first to fifth day of exposure. Dimethylthiophosphate was detected in the urine of all the thinners during exposure, while the foremen and irrigators contained only very small quantities of this metabolite. It was more difficult to obtain reflex action in the upper extremities of 13 of the 21 workers during post-exposure examination compared to the pre-exposure examination. No effect on lower extremity reflexes was seen. The one thinner with the greatest reduction in whole ChE activity (-29.8% on Day 5), lost 2.5 kg. The same group of investigators monitored plasma and RBC ChE activity and urinary dialkylphosphate levels in another 15 male peach thinners a year later (Richards et al., 1978). Eight males were assigned to a plot treated with azinphos-methyl at 2.5 lb a.i./acre and the other 7 were assigned to a plot treated with the pesticide, Galecron which does not inhibit ChE. The peaches were treated with azinphos-methyl 14 days prior to the 5-day exposure period. A significant decrease of less than 10% was seen in both groups of men relative to their baseline activity. When compared to each other only the RBC ChE activity was significantly reduced in azinphos-methyl exposed workers compared to controls on Day 5 (!8.3% vs. !3.8% of

20
baseline). The plasma ChE activity in azinphos-methyl exposed workers was not significantly different from the control workers at any time point. The mean urinary dimethylphosphate and dimethylthiophosphate levels correlated with the mean percent decline in RBC ChE activity from baseline (r = !0.663 and !0.874, respectively). No symptoms related to organophosphate toxicity were reported by the workers during or after exposure. Franklin et al. (1981) measured urinary alkyl phosphates and blood ChE activity in 14 mixer/loader/applicators exposed to azinphos-methyl during its application to orchards. The orchards were sprayed using ultra-low volume procedures with airblast sprayers at 1.25 lb of a 50% azinphos-methyl wettable powder formulation per acre. Workers sprayed for only 1 day. Reductions in serum and RBC ChE activity were less than 5% on the day of exposure. Urinary alkyl phosphates were detected during the 48 hours following spraying. The level of urinary metabolites showed a weak to moderate correlation (r = 0.48, 24-h; r = 0.77, 48-h) with the amount applied, but only a weak correlation with the time sprayed (r = 0.43, 24-h & 48-h). No attempt was made to correlate urinary alkyl phosphate levels with serum or RBC ChE activity. Ninety-seven agricultural workers (71 men, 26 women) exposed to methidathion, vamidothion, and azinphos-methyl sprayed in orchards over two growing seasons were monitored for urinary dialkylphoshates and serum ChE activity (Drevenkar et al., 1991). Paraoxonase and arylesterase activities in the serum were also measured. The workers consisted of 20 mixers, 42 sprayers, 23 field workers (cutters), and 12 people with no direct contact with the pesticides (managers, mechanics, a technologist and a housekeeper). Methidathion and vamidothion were applied during the first growing season and azinphos-methyl during the second growing season. Blood and urine samples were collected one month before the beginning of the first spraying season and about three months later for the first growing season. For the second growing season, blood and urine sample were collected only after a 2-day spraying session. More than one dialkylphosphorus metabolite was detected in the urine of most after-exposure urine samples. The highest concentrations were found after exposure to azinphos-methyl. The after-exposure serum ChE activities were reduced from 11 to 30% from baseline in 26 workers and 31-48% from baseline in 12 workers (6 sprayers, 3 field workers, 2 mixers and 1 mechanic). However, 4 of the 12 workers with ChE inhibition greater than 30% had no urinary dialkylphosphates. No correlation between the ChE activities and urinary metabolites was observed. None of these 12 workers had any complaints that were attributed to organophosphate poisoning. Paraoxonase and arylesterase activities were unaffected. Urinary alkylphosphate and blood ChE activities were monitored in 33 peach harvest workers (pickers and sorters) in California (Schneider et al., 1994). The pickers served as the exposed group and the sorters as the control or minimally exposed group. The orchard had been sprayed with azinphos-methyl once at 1.5 lb a.i./acre 51 days before harvesting began. Baseline ChE measurements were taken one week prior to the initial exposure. No significant difference in the plasma ChE activity between the exposed and control groups was seen on either day 14 or 23 of exposure. However, the RBC ChE was significantly reduced (77-87% of control activity) on both days 14 and 23 of exposure. There was a significant inverse correlation (r = !58 to !65) of the RBC ChE activity and the urinary alkylphosphate levels. Although there was also an inverse correlation (r = !21 to !37) between the plasma ChE activity and urinary alkylphosphate levels, the correlation was not significant In a study conducted by McCurdy et al. (1994) the urinary alkylphosphate metabolites, plasma and RBC ChE activities and their reactivation after incubation with 2-aldoxime methochloride (2-PAM) were evaluated in 20 peach harvest workers in California. The workers
21
performed harvesting, thinning and propping for 21 days over a 6-week period in an orchard that had been sprayed with azinphos-methyl (1.5 lb a.i./acre) 30 days previously. The median RBC ChE activity for all workers decreased 7% from baseline during an initial 3-day period and 19% from baseline over the 6-week period. The median plasma ChE activity decreased 9% during the initial 3-day and 12% over the 6-week period. However, no subjects had a positive oxime reactivation test. The workers had urinary azinphos-methyl metabolites (dimethylphosphate, dimethylthio-phosphate, and dimethyldithiophosphate) which increased steadily during the 6-week exposure period. There was a poor correlation between plasma ChE activity and the urinary metabolites (r = 0.09 and !0.39 on days 3 and 44, respectively), but there was a better correlation with RBC ChE activity and exposure (r = !0.77 and !0.51 on days 3 and 44, respectively). The only evaluation for other health effects was a questionnaire that addressed general health. Carrier and Brunet (1999) applied a toxicokinetic model to the urinary alkylphosphate data from the study conducted by McCurdy et al. (1994) to estimate a No-Observed-Adverse-Effect Level (NOAEL). They considered the RBC ChE inhibition observed in this study to not be adverse since no symptoms or signs were observed; therefore, the exposure level in these workers was considered a NOAEL. They assumed the dermal absorption of azinphos-methyl in humans was 16.1% based on the study by Feldman and Maibach (1974). They also used urinary metabolite data after intravenous injection from the Feldman and Maibach (1974) study to estimate a half-life for azinphos-methyl of 32.6 hrs. They estimated the absorbed NOAEL for a single exposure to be 0.3 mg/kg. This would be equivalent to an external dose of 1.9 mg/kg. They estimated the absorbed NOAEL for repeated exposure to be 0.1 mg/kg/day. This is equivalent to an external dose of 0.62 mg/kg/day.
Illnesses or injuries associated with exposure to azinphos-methyl alone or in combination with other pesticides are described in exposure assessment document (Formoli and Fong, 2001) and are only briefly described here. In California, DPR has records for 156 illnesses/injuries associated with azinphos-methyl between 1984 and 1996. At least 75% of these cases involved occupational exposure and more than 80% of the illnesses were systemic. Most of the illnesses were due to a few incidents where a number of workers were exposed, including one incident in 1987 involving 37 peach harvesters and another in 1993 involving 14 almond pruners. Most of the non-occupational illnesses also occurred in clusters, one in 1987 involving 26 cases and another in 1993 involving 8 cases. In both cases azinphos-methyl drifted into nearby residential areas.
Animal Studies
Acute toxicity of azinphos-methyl varies depending on species, sex, route, and formulation (Tables 1-3). In rats, females tended to be more sensitive than males for all routes of exposure. It is less clear if there were sex differences for other species. The acute inhalation toxicity of azinphos-methyl is summarized in Table 1. The 1-hour LC50 values for the technical grade material were within an order magnitude (38 to 385 mg/m3) except in one study which reported an LC50 greater than 17,560 mg/m3 after a 1-hour, whole body exposure (Harris, 1976a). In a 4-hour inhalation study (head-only), all of the female rats at the lowest dose tested (80 mg/m3 or 14.4 mg/kg)1 exhibited several cholinergic signs (ocular and nasal discharge,salivation, hypoactivity, tremors, and/or twitching) (Shiotsuka, 1987). No mortalities 1 Assuming a female Sprague-Dawley rat weighs 204 kg and breathes 0.037 m3 in 4 hours (U.S. EPA, 1988).

22
Table 1. Summary of Acute Inhalation Toxicity for Azinphos-methyl Species Sex LC50 (mg/m3) Referencesa
Technical Grade (86 - 90%) Rat M 385 (1-hr, whole body) 1 F 107 (1-hr, whole body) 2 M/F >17,560 (1-hr, whole body) 3 M 152 (4-hr, whole body) 1 M 155 (4 hr, head only) 4 F 132 (4-hr, head only) Mouse F 38 (1-hr, whole body) 2
Wettable Powders (25-62.5%) Rat M 200 - >5,000 (1-hr, whole body) 5-7 F 169 - 4,000 (1-hr, whole body) 5-8 M/F >17,560 (1-hr, whole body) 9 M 198 - 596 (4-hr, head or nose only) 7,10 F 170 - 422 (4-hr, head or nose only) 7,10
Liquid Concentrates (12.1-24%) Rat F 475 (30-min, whole body) 11 M 820 - 3,000 (1-hr, whole body) 12-16 F 590 - >2,600 (1-hr, whole body) 12-16 Mouse F 190 (1-hr, whole body) 11 M <2,000 (1-hr, whole body) 12
Dust (2%) Rat F >20,000 (1-hr, whole body) 17 Mouse F >20,000 (1-hr, whole body) a References: 1. Kimmerle, 1966; 2. Doull and DuBois, 1956; 3. Harris, 1976a; 4. Shiotsuka, 1987; 5. Crawford and
Anderson, 1970; 6. Cannon and Taylor, 1978; 7. Shiotsuka, 1986; 8. Nelson and Doull, 1967; 9. Harris, 1976b; 10. Warren, 1990; 11. DuBois, 1967; 12. DuBois and Kleeburg, 1970; DuBois and Kinoshita, 1970; 14. DuBois, 1970b; 15. Nelson, 1978c; 16. Cannon and Taylor, 1979; 17. Crawford and Nelson, 1970b.
occurred at this dosage. Red turbinates and lungs were observed at necropsy in several high-dose animals that died. An acute inhalation NOEL of 23 mg/m3 (4.1 mg/kg)2 was established in male rats exposed (whole body) for 4 hours to azinphos-methyl (Kimmerle, 1966). All of the males at the LOEL (59 mg/m3) exhibited unspecified signs of toxicity. The one-hour LC50 values for formulations varied from 245 mg/m3 in female rats exposed (head only) to a 50% wettable powder (Shiotsuka, 1986) to greater than 20,000 mg/m3 in female rats and mice exposed (whole body) to a 2% dust (Crawford and Nelson, 1970b).
By the oral route, rats and dogs appear to be more susceptible to the acute toxicity of azinphos-methyl than guinea pigs (Table 2). The oral LD50 values for technical grade azinphos-methyl ranged from 4.4 mg/kg to 26 mg/kg for rats. The clinical signs observed with the technical grade material included tremors, twitching, convulsions, staggering gait, prostration, salivation, breathing difficulties, lethargy, and piloerection, all typical of ChE inhibition. The onset of signs was 5 to 20 minutes after dosing and usually lasted 1-2 days. There were no
2 Assuming a male Wistar rat weighs 215 g and breathes 0.0383 m3 in 4 hours (U.S. EPA, 1988).

23
Table 2. Summary of Acute Oral Toxicity for Azinphos-methyl Species Sex LD50 (mg/kg) Referencesa
Technical Grade (88.9 - 99.0%) Rat M 4.6 - 26 1-7 F 4.4 - 24 2-9 Guinea pig M 80 8 Dog M 10 6
Wettable Powders (35-62.5%) Rat M 23.6 - 58 10-13 F 14.8 - 58 10-14
Liquid Concentrates (12.1-24%) Rat M 37 - 101 15-19 F 21 - 85 18-23 M/F 37 24 Mouse NRb 825
Dusts (2%) Rat F >50 26 a References: 1. Hecht, 1955; 2. Gaines, 1960; 3. Crawford and Anderson, 1974; 4. Lamb and Anderson, 1974; 5.
Pasquet et al., 1976; 6. Mihail, 1978; 7. Heimann, 1982; 8. DuBois et al., 1957a; 9. Nelson, 1968; 10. DuBois, 1970a; 11. Cooper et al., 1978; 12. Nelson, 1979b; 13. Sheets, 1990a; 14. Bauman and Nelson, 1969; 15. DuBois, 1962a; 16. DuBois and Kinoshita, 1965c; 17. DuBois and Kinoshita, 1970; 18. Nelson, 1978a; 19. Nelson, 1979a; 20. DuBois, 1963; 21. Nelson and Bauman, 1968; 22. Nelson and Bauman, 1969; 23. DuBois, 1970b; 24. Lightowler and Gardner, 1978a; 25. Sato, 1959; 26. Crawford and Nelson, 1970a.
b NR = Not Reported compound-related abnormalities observed in the one study that reported necropsy findings (Mihail, 1978). A NOEL could not be established in most studies either due to the dose levels being too high or insufficient information, but in one study a NOEL was established for rats at 1 mg/kg/day (Mihail, 1978). All of the animals (males and females) at the LOEL (2.5 mg/kg) exhibited unspecified cholinergic signs. The oral LD50's for formulations ranged from 14.8-101 mg/kg depending on the percent active ingredient and species. In addition to the clinical signs observed with the technical grade material, lacrimation, exophthalmos, clear and red nasal discharge, anorexia, vomiting, diarrhea, perianal stains, and alopecia were also observed. These signs are typical of ChE inhibitors and are probably due to the active ingredient.
The acute dermal toxicity of technical grade azinphos-methyl and various formulations is summarized in Table 3. The LD50 values for the technical grade material were fairly similar (72-250 mg/kg) except for one study which reported an LD50 of 2,500 to 5,000 (Mihail, 1978). The clinical signs observed were similar to those observed with the oral route, except that erythema was noted at the site of application. A NOEL was not established for the technical grade material in any of the studies. A LOEL of 63 mg/kg in female rats was reported (Heimann, 1982). There were no mortalities at the LOEL, but all females at the LOEL exhibited unspecified cholinergic signs. Possible compound-related gross lesions observed at necropsy in these studies were pulmonary emphysema, enlarged adrenal glands, dark liver, pale spleen, reddened renal medulla, and ulcers (Mihail, 1978; Heimann, 1982). The LD50 values for the formulations varied from 65 mg/kg in mice exposed to a 20% emulsifiable concentrate (Sato, 1959) to greater than 2,000 mg/kg in rats exposed to a 2% dust (Crawford and Nelson, 1970a) or a 35% wettable powder (Sheets, 1990b).

24
Table 3. Summary of Acute Dermal Toxicity for Azinphos-methyl Species Sex LD50 (mg/kg) Referencesa
Technical Grade (88.9 - 99.0%) Rat M 200 - 5,000 1-4 F 72 - 5,000 1,3-5
Wettable Powders (35-62.5%) Rat M 816 - >2,000 6-8 F 300 - >2,000 7-9 Rabbit M 1,137 10 F 1,147 M/F 1,780 11
Liquid Concentrates (12.1-25%) Rat M 322 - 475 12-13 F 150 - >1,500 14-17 M/F 325 18 Mouse NRb 65 19 Rabbit M 504 - >1,500 14,20 F 568 20
Dusts (2%) Rat F >2,000 mg/kg 21 a References: 1. Gaines, 1960; 2. Pasquet et al., 1976; 3. Mihail, 1978; 4. Heimann, 1982; 5. Nelson, 1968; 6. DuBois
and Kinoshita, 1970; 7. Sheets, 1990b; 8. DuBois, 1970a; 9. Nelson, 1967a; 10. Nelson, 1979c; 11. Seaman and Imlay, 1978; 12. DuBois and Murphy, 1956; 13. DuBois and Kinoshita, 1965c; 14. DuBois, 1963; 15. Nelson, 1967b; 16. Nelson and Bauman, 1968.; 17. Nelson and Bauman, 1969; 18. Lightowler and Gardner, 1978b; 19. Sato, 1959; 20. Nelson, 1978b; 21. Crawford and Nelson, 1970a.
b NR = Not Reported
There are several reports of biochemical/histochemical changes in the liver after a single dose of azinphos-methyl. The effect of azinphos-methyl on liver glycogen is unclear. Murphy and Porter (1966) reported that liver glycogen levels increased 8 to 15-fold in rats after an intraperitoneal injection of azinphos-methyl at 3 mg/kg. El-Banhawy and El-Ganzuri (1986) reported marked depletion of liver glycogen in rats administered a single dose of azinphos-methyl orally at 6.5 mg/kg. The glycogen depletion in this study was based on the loss of glycogen inclusions in liver cells examined histologically. One explanation for the different findings may be the difference in the time at which the animals were sacrificed. El-Banhawy and El-Ganzuri sacrificed their animals 24 hrs after dosing whereas Murphy and Porter sacrificed their animals 5 hrs after dosing. El-Banhawy and El-Ganzuri (1986) also reported a disintegration and subsequent loss of lipoid inclusions in liver cells of rats given a single dose of azinphos-methyl at 6.5 mg/kg. Murphy and Porter (1966) reported an increase in liver alkaline phosphatase and tyrosine transaminase activities in the rats given a single dose of azinphos-methyl at 3 mg/kg. The toxicological significance of these findings is uncertain.
Technical grade azinphos-methyl caused only slight conjunctival redness in rabbits which cleared by 48 hrs (Table 4). The various formulations were more severe ocular irritants causing slight to severe conjunctival redness, very slight to moderate chemosis, slight to severe ocular discharge, slight to moderate corneal opacity, and slight iritis which cleared by day 7.

25
Table 4. Summary of Eye Irritation Potential of Azinphos-methyl Species Sex Results Referencesa
Technical Grade (~92%) Rabbit M/F Slight Irritation 1-2
Wettable Powders (25-50%) Rabbit M/F Slight-Moderate Irritation 3-6
Liquid Concentrates (22%) Rabbit M/F Slight-Moderate Irritation 7-8 a References: 1. Thyssen, 1981; 2. Harris, 1976a; 3. Hixson, 1979; 4. Sheets, 1990c; 5. Seaman, 1978a; 6. Harris,
1976b; 7. Nelson, 1978d; 8. Knapp and Doyle, 1979a.
No dermal irritation was observed in rabbits exposed to technical grade azinphos-methyl; however, slight erythema was observed in humans after a 24 hour exposure (Table 5). The inert ingredients appear to be responsible for the dermal irritation (slight to moderate erythema and very slight to slight edema) observed with several formulations. Table 5. Summary of Dermal Irritation Potential of Azinphos-methyl Species Sex Results Referencesa
Technical Grade (~92%) Rabbits M/F No irritation 1-2 Humans NRb Slight Irritation 3
Wettable Powder (25-50%) Rabbits M/F No to Slight Irritation 4-7
Liquid Concentrates (22%) Rabbits M/F Slight Irritation 8-9 a References: 1. Thyssen, 1981; 2. Harris, 1976a; 3. Hecht, 1955; 4. Hixson, 1979; 5. Sheets, 1990d; 6. Seaman,
1978b; 7. Harris, 1976b; 8. Nelson, 1978d; 9. Knapp and Doyle, 1979b. b NR = Not Reported
Technical grade azinphos-methyl appears to be a weak to moderate dermal sensitizer using the Buehler patch test (Table 6). The sensitization response was variable with the formulations being the same or weaker than the technical grade material. In a modified Buehler's patch test, a 12.5% solution of azinphos-methyl was applied topically to male guinea pigs once a week for 3 weeks during the induction phase (Heiman, 1987). Two weeks later, they were challenged with a 6% solution. Six of 12 animals tested reacted positively to the challenge. Two weeks following the first challenge, the same animals were challenged a second time with a 0.6% solution. None of the animals reacted to the second challenge. This finding suggests that there may be a threshold for this response. The time between exposures may be another factor.
Metabolites - Benzazimide and Methyl Benzazimide
The acute toxicity of two metabolites of azinphos-methyl, benzazimide and methyl
benzazimide, was evaluated (Crawford and Anderson, 1974; Lamb and Anderson, 1974). These metabolites are common in both plants and animals. The oral LD50 values for benzazimide ranged from 269 to 576 mg/kg in rats with females being slightly more susceptible
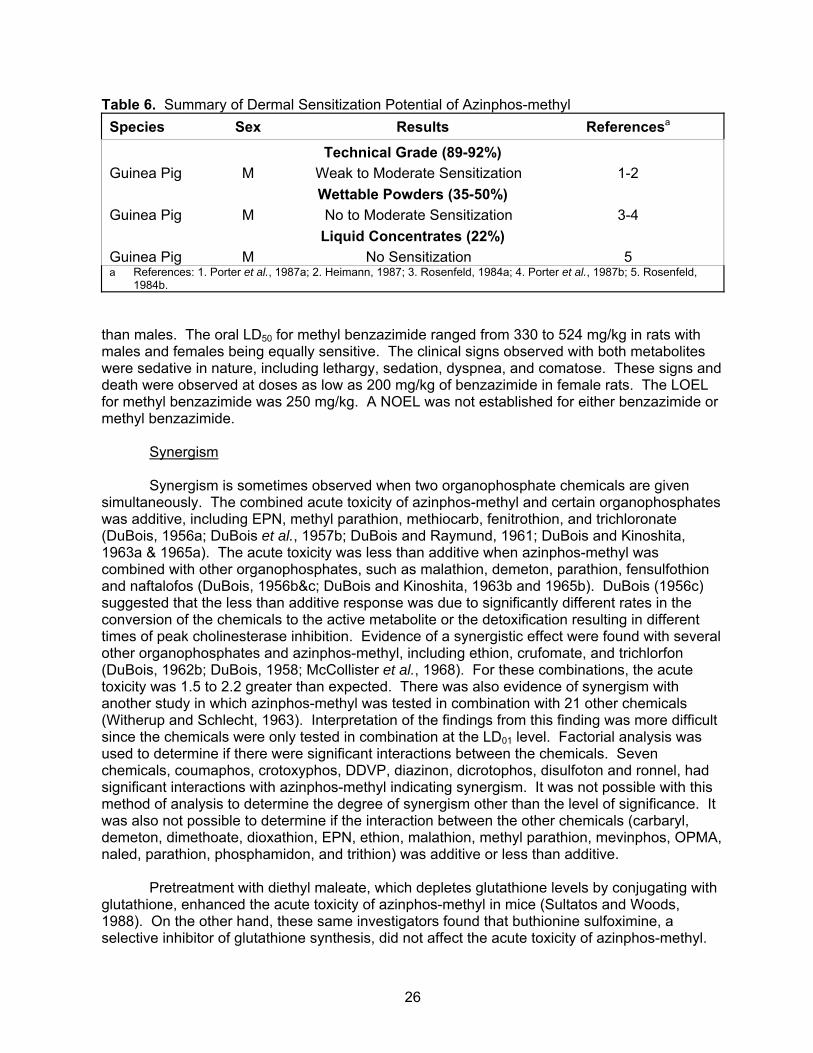
26
Table 6. Summary of Dermal Sensitization Potential of Azinphos-methyl Species Sex Results Referencesa
Technical Grade (89-92%) Guinea Pig M Weak to Moderate Sensitization 1-2
Wettable Powders (35-50%) Guinea Pig M No to Moderate Sensitization 3-4
Liquid Concentrates (22%) Guinea Pig M No Sensitization 5 a References: 1. Porter et al., 1987a; 2. Heimann, 1987; 3. Rosenfeld, 1984a; 4. Porter et al., 1987b; 5. Rosenfeld,
1984b. than males. The oral LD50 for methyl benzazimide ranged from 330 to 524 mg/kg in rats with males and females being equally sensitive. The clinical signs observed with both metabolites were sedative in nature, including lethargy, sedation, dyspnea, and comatose. These signs and death were observed at doses as low as 200 mg/kg of benzazimide in female rats. The LOEL for methyl benzazimide was 250 mg/kg. A NOEL was not established for either benzazimide or methyl benzazimide.
Synergism
Synergism is sometimes observed when two organophosphate chemicals are given
simultaneously. The combined acute toxicity of azinphos-methyl and certain organophosphates was additive, including EPN, methyl parathion, methiocarb, fenitrothion, and trichloronate (DuBois, 1956a; DuBois et al., 1957b; DuBois and Raymund, 1961; DuBois and Kinoshita, 1963a & 1965a). The acute toxicity was less than additive when azinphos-methyl was combined with other organophosphates, such as malathion, demeton, parathion, fensulfothion and naftalofos (DuBois, 1956b&c; DuBois and Kinoshita, 1963b and 1965b). DuBois (1956c) suggested that the less than additive response was due to significantly different rates in the conversion of the chemicals to the active metabolite or the detoxification resulting in different times of peak cholinesterase inhibition. Evidence of a synergistic effect were found with several other organophosphates and azinphos-methyl, including ethion, crufomate, and trichlorfon (DuBois, 1962b; DuBois, 1958; McCollister et al., 1968). For these combinations, the acute toxicity was 1.5 to 2.2 greater than expected. There was also evidence of synergism with another study in which azinphos-methyl was tested in combination with 21 other chemicals (Witherup and Schlecht, 1963). Interpretation of the findings from this finding was more difficult since the chemicals were only tested in combination at the LD01 level. Factorial analysis was used to determine if there were significant interactions between the chemicals. Seven chemicals, coumaphos, crotoxyphos, DDVP, diazinon, dicrotophos, disulfoton and ronnel, had significant interactions with azinphos-methyl indicating synergism. It was not possible with this method of analysis to determine the degree of synergism other than the level of significance. It was also not possible to determine if the interaction between the other chemicals (carbaryl, demeton, dimethoate, dioxathion, EPN, ethion, malathion, methyl parathion, mevinphos, OPMA, naled, parathion, phosphamidon, and trithion) was additive or less than additive.
Pretreatment with diethyl maleate, which depletes glutathione levels by conjugating with glutathione, enhanced the acute toxicity of azinphos-methyl in mice (Sultatos and Woods, 1988). On the other hand, these same investigators found that buthionine sulfoximine, a selective inhibitor of glutathione synthesis, did not affect the acute toxicity of azinphos-methyl.

27
They concluded that glutathione conjugation is of minor importance in the detoxification of azinphos-methyl because these two chemicals had different effects on the acute toxicity. The investigators suggested that diethyl maleate may be enhancing the acute toxicity of azinphos-methyl through some other metabolic pathway. C. SUBCHRONIC TOXICITY
Inhalation-Rat
Bayer AG, 1976: Ten SPF Wistar rats/sex/dose were exposed (whole body) to technical grade azinphos-methyl (purity not reported) at 0, 0.195, 1.24 or 4.72 mg/m3 (0, 0.05, 0.32 or 1.26 mg/kg/day)3 for 6 hrs/day, 5 days/wk for 12 weeks (Kimmerle, 1976). There was no effect on appearance, behavior, clinical chemistry, hematology, organ weights, gross pathological or histological findings. The mean body weights were reduced slightly (~8%) in males at 4.72 mg/m3. At the study termination, the mean plasma ChE was reduced at 4.72 mg/m3 (M: 84%; F: 85% of controls activity). The RBC ChE activity was also reduced at 4.72 mg/m3 (M: 56%; F: 63% of control activity) at the study termination. There was no effect on brain ChE activity in either sex. In general, DPR considers brain ChE inhibition to be indicative of overt toxicity since it is one of the primary target sites and more subtle neurological signs, such as memory and learning losses, may not be easily detected in animals unless they are specifically tested for these effects. The toxicological significance of plasma and RBC ChE inhibition is less certain because the physiological functions of ChEs in blood have not been clearly established, but several possible physiological functions have been proposed including drug metabolism, neural development and hematopoiesis (Lockridge and Masson, 2000; Brimijoin and Koenigsberger, 1999, and Grisaru et al., 1999). Based on the lack of significant findings, the NOEL for overt toxicity was greater than or equal to 4.72 mg/m3 (1.26 mg/kg/day), the highest dose tested. The NOEL for plasma and RBC ChE inhibition was 1.24 mg/m3 (0.32 mg/kg/day). This study was unacceptable based on FIFRA (Federal Insecticide, Fungicide, and Rodenticide Act) guidelines due to several major deficiencies including incomplete clinical chemistry and histopathological examination and no individual data.
Dietary-Rat
University of Chicago, 1956: Thirteen Sprague-Dawley rats/sex/dose were fed azinphos-methyl (25% wettable powder) in the diet at 0, 2, 5, or 20 ppm active ingredient (0, 0.2, 0.5 or 1.9 mg/kg/day)4 for 16 weeks (Doull and Rehfuss, 1956). There was no effect on food consumption or gross and microscopic lesions. Male rats receiving 20 ppm had up to 20% reduction in weight gain. After 16 weeks of treatment at 20 ppm, there was a reduction in the mean ChE activity in the brain (M: 91%, F: 86% of controls), serum (M: 64%, F: 76% of controls), and RBCs (M: 60%, F: 62% of controls). No ChE inhibition was observed in the 2 ppm or 5 ppm groups. Recovery of the ChE activity was observed in serum, brain and RBCs by 4, 10, and 20 days after the treatment was discontinued. The NOEL was determined to be 5 ppm (0.5 mg/kg/day) based on serum, RBC, and brain ChE inhibition and reduced weight gain. 3 Using the average body weight from the study and assuming a Wistar rat breathes 0.05
m3 in 6 hours (U.S. EPA, 1988).
4 Estimated assuming a 235 g Sprague Dawley rat consumes 22 g of feed per day (U.S. EPA, 1988).

28
This study had major deficiencies including no analysis of the test article or diet, no hematology, no individual data and incomplete clinical chemistry and histopathology.
University of Chicago, 1957: In a subsequent study, 18 male Sprague-Dawley rats/dose were fed azinphos-methyl (25% wettable powder) in the diet at 0, 50 or 100 ppm active ingredient (0, 4.7 or 9.4 mg/kg/day)4 for 16 weeks (Doull and Anido, 1957b). Marked symptoms of cholinergic stimulation including diarrhea, salivation, lacrimation, and muscular fasciculations were observed at both 50 and 100 ppm during the first 4 weeks of exposure (time of onset not reported). There were 8 and 10 deaths at 50 and 100 ppm, respectively. The first death occurred during week 4 at 100 ppm and week 6 at 50 ppm. A decrease in the mean weight gain (10-18%) was observed in both treatment groups. At 50 and 100 ppm, there was a reduction in the mean ChE activity in the plasma (61% and 37% of controls, respectively), RBCs (29 and-27% of controls, respectively) and brain (52 and 25% of controls, respectively). There were no treatment-related changes in the macroscopic and microscopic findings. The LOEL for this study was 50 ppm (4.7 mg/kg/day) based on the cholinergic signs, reduced weight gain, and plasma, RBC and brain ChE inhibition. A NOEL was not established for this study. This study was also unacceptable due to major deficiencies (no females, no analysis of the test article or diet, no hematology, no individual data, and incomplete clinical chemistry and histopathology).
Capsule-Human
Franklin Hospital Foundation, 1972: Five male human volunteers/dose were given azinphos-methyl in capsules (corn oil vehicle) at doses between 1 and 20 mg/day (14 to 286 μg/kg/day for 70 kg person) for 30 days (Rider et al., 1972). ChE activity was measured twice weekly during the exposure period. No plasma ChE inhibition was observed at doses up to 20 mg/day. No erythrocyte ChE inhibition was seen at doses up to 18 mg/day, but erratic inhibition was seen at 20 mg/day. However, the investigators did not consider the erythrocyte ChE inhibition at 20 mg/day sufficient to be an adverse effect. There was also no effect on clinical signs, hematology, prothrombin time, and urinalysis. Therefore, the NOEL was determined to be greater than or equal to 20 mg/day (286 μg/kg/day) based on plasma and erythrocyte ChE inhibition. Although there are no FIFRA guidelines for conducting human studies, this study had several obvious deficiencies (insufficient information including no summary tables or individual data).
Inveresk Research, 1999: MacFarlane and Freestone (1999) conducted another human study in which 12 healthy males (ages 18-50 yrs, non-smokers) were administered either a placebo (lactose, 4 males) or azinphos-methyl (8 males) at 0.25 mg/kg/day in a gelatin capsule for 28 days. The objective of the study was to establish NOELs for plasma and red blood cell (RBC) ChE inhibition with repeated exposure to azinphos-methyl and to obtain information for possible biological monitoring. The subjects resided in the clinic during the entire study under constant medical supervision and received a standardized diet. The average age, weight and height of the placebo group were 35.3 years, 77.7 kg, and 178.3 cm, respectively. The average age, weight and height of the treatment group were 29.3 years, 69.33 kg, and 174.5 cm, respectively. Subjects had their blood pressure and heart rate monitored daily. EKG’s and blood and urine samples were obtained before dosing on days 1, 7, 14, 21 and 28. All observed or reported adverse events were recorded including duration and severity. An assessment of underlying cause and treatment were recorded. Baseline values for plasma and RBC ChE activity from 8 time points (days –14, -12, -10, -8, -6, -4, -2, and -1) were averaged for each individual to estimate the percentage change from baseline. The percentage change from baseline was compared between the treatment and control groups for 40 treatment
29
time points (pre-dose on days 1-28 and +4h post-dose on days 1, 2, 3, 4, 5, 7, 10, 14, 17, 21, 24, and 28 days) using a repeated measures analysis of variance.
The mean plasma ChE activity varied from –9.09% (day 18) to 1.21% (day 15) relative to baseline in the placebo group and from –8.43% (day 18) to 14.47% (day 26) relative to baseline in the 0.25 mg/kg/day group. The mean RBC ChE activity varied from –12.68% (day 14) to 7.80% (day 12) relative to baseline in the placebo group and from –15.49% (day 14) to 5.80% (day 1) relative to baseline in the 0.25 mg/kg/day. The change in plasma and RBC ChE activity from baseline were only statistically significant in the treated group when compared to the controls on a few occasions when the increase in mean ChE activity from baseline was higher in the treated group than in the placebo group. In no instance were the reductions in either the mean plasma or RBC ChE activity relative to baseline statistically significant when compared to controls. While the size of the control group in this study is small, it is less of concern because the ChE activity in treated subjects was compared to their baseline values as well as to the activity in control subjects. The lowest RBC ChE activity relative to baseline (-15.49%) in the treated group was observed 4 hours after dosing on day 14 of treatment; however, the mean activity in the placebo group was also reduced at this time (-8.47%). Furthermore, the mean RBC ChE activity in the treated group was only slightly reduced prior to dosing on day 14 (-6.67%) and day 15 (-3.51%). Since RBCs cannot synthesize AChE, the increase in RBC ChE activity from 4 hours after dosing on day 14 to prior to dosing on day 15 is most likely due to methodological variation rather than biological variation or reactivation. Based on these data, the NOEL for plasma and RBC ChE inhibition is 0.25 mg/kg/day.
More adverse events were observed in the treatment group (53 events in all 8 subjects) than the controls (17 events in 2 of 4 subjects), but there were more subjects in the treatment group. On average there were fewer events per subject in the treatment group (6.7) than in the control group (8.5). The adverse events included headache, rhinitis, coughing, dry mouth, chest pain, abdominal pain, flatulence, indigestion, dyspepsia, constipation, backache, elevated liver enzyme (alanine aminotransferase, aspartate aminotransferase or γ-glutamyl transferase) activity in serum, dysuria, chest pain, rash, pruritis, facial pain, dental abscess, lymphadenopathy, and mouth ulcer. The most common events were headache and rhinitis that were observed in both placebo (2/4 subjects) and treated groups (5/8 subjects). Viral infections occurred in both groups and were probably responsible for some of the symptoms including the rhinitis, coughing, dry mouth, and chest pain. Even some incidents of headaches may have been related to the viral infections. Some other incidents of headaches were attributed to ward conditions. Other than headache and rhinitis, the adverse events occurred in only one or two subjects per dose group and were often observed in both treated and control groups. None of these events had a severity grade greater than 2 out of 4. All of the events were considered unrelated or unlikely to be related to the test compound by the physicians when the study was blinded and there was no clinically relevant reduction in plasma or RBC ChE activity from baseline (i.e., > 20%) at the time of these events in these individuals.
There was also no clinically significant or compound-related changes in hematology,
clinical chemistry, urinalysis, vital signs or EKGs. Volunteers were not subjected to any neurobehavioral or neurophysiological testing to evaluate for more subtle neurological effects such as cognition or nerve conduction. However, given no significant plasma or RBC ChE inhibition was seen, no neurological effects would be anticipated based on the subchronic neurotoxicity study in rats (Sheets and Hamilton, 1995). DPR has no requirement for human testing of pesticides and there are no FIFRA guidelines for this type of study. However, the study was conducted in a double-blind manner following “Good Clinical Practices” guidelines. The protocol and volunteer information was approved by an institutional review board

30
(Independent Research Ethics Committee of Inveresk Research) and the study was conducted in accordance with the guidelines set out in the Declaration of Helsinki, 1964. Subjects were free to leave the study at any time and were paid in full if they left for health reasons. This study had a few deficiencies including the small number of control subjects and no female subjects.
Dermal-Rabbit
Bayer AG, 1980: Azinphos-methyl (94.1% purity) was applied with a Cremophor EL and water vehicle to the shaved backs and flanks of 6 New Zealand rabbits/sex/dose at 0, 2 or 20 mg/kg and left uncovered in place for 6 hrs/day, 5 days/wk for 3 weeks (Flucke and Schilde, 1980). An additional 3 rabbits/sex/dose had their skin abraded before being exposed. No significant differences in clinical signs, body weights, clinical chemistry, hematology, urinalysis, organ weights, gross pathological or histological findings (including local effects) were found. A slight to moderate reduction in the mean RBC ChE activity (M - abraded: 62%, M – intact: 77%, F – abraded: 74%, F – intact: 68% of control activity) was seen at 20 mg/kg/day at study termination. There was no effect on plasma or brain ChE activity. The NOEL for overt toxicity was greater than or equal to 20 mg/kg, the highest dose tested. The NOEL for RBC ChE inhibition was 2 mg/kg. This study had several major deficiencies, including too few dose levels and no overt toxicity at the highest dose, and incomplete individual data. D. CHRONIC TOXICITY/ONCOGENICITY
Dietary-Mouse
Gulf South Research Institute, 1978: Azinphos-methyl (90%) was administered to 50 male B6C3F1 mice/dose at 31.3 or 62.5 ppm (5.4 and 10.8 mg/kg/day)5 and to 50 female B6C3F1 mice/dose at 62.5 and 125 ppm (10.8 and 21.5 mg/kg/day) for 80 weeks (NCI, 1978). Ten mice/sex were used as controls. Because there were so few animals in the concurrent control group, the investigators "pooled" control mice of the same strain from several other bioassays from this laboratory to perform their statistical analysis of the tumor incidence (i.e., the “pooled” controls are the concurrent controls plus control animals from 11 other studies conducted by this laboratory that were started no more than 3 months earlier or later than the azinphos-methyl study). The animals were observed for another 12-13 weeks after dosing stopped, then sacrificed. The body weights were reduced in females at 125 ppm. Several treatment-related clinical signs were observed intermittently during the second year of the study including rough hair coat (males at 31.3 and 62.5 ppm), hyperactivity (females at 62.5 and 125 ppm), and convulsions (one male at 62.5 ppm and one female 125 ppm). The only apparent dose-related increase in non-neoplastic lesions was in the incidence of cystic endometrial hyperplasia in females (2/7, 32/48, 32/48 or 29%, 67%, 67%, respectively). There was an increase in the combined incidence of hepatocellular adenomas and carcinomas in male mice at 62.5 ppm (Table 7). Only the combined increase was significant by Fisher’s exact test when compared with pooled controls. It also exhibited a significant trend by the Cochran-Armitage trend test. The investigators did not consider this increase treatment- related because similar high incidences of this tumor had been observed in male mice in this same laboratory; however, no historical control range or mean were reported for these tumors. The NOEL was less than 31.3 ppm (5.4 mg/kg/day) based on the clinical signs in both sexes and cystic endometrial 5 Estimated assuming a 36 g B6C3F1 mouse consumes 6.2 g feed per day (U.S. EPA,
1988).

31
Table 7. Incidence of Neoplastic Lesions in the Liver of Male Mice Fed Azinphos-Methyl for 80 Weeksa
Dose Level (ppm)b Lesion
Pooled Controls
Concurrent Controls
31.3
62.5
Hepatocellular adenoma NR 2/8 8/49 7/50 (25%) (16%) (14%) Hepatocellular carcinoma 27/128 0/8 3/49 12/50 (21%) (0%) (6%) (24%) Combined 30/128+ 2/8 11/49 19/50* (23%) (25%) (22%) (38%) a The denominator is the number of animals examined; the number in parentheses represents the incidence in
percentage. b The test compound intake was estimated to be 5.4 and 10.8 mg/kg/day for 31.3 and 62.5 ppm, respectively,
assuming a 36 g B6C3F1 mouse consumes 6.2 g feed per day (U.S. EPA, 1988). NR Not reported + Significant trend based on the Cochran-Armitage trend test at p < 0.05 (Gart et al., 1986). * Significantly different from the pooled control group based on the Fisher's exact test at p < 0.05.
hyperplasia in females. This study was unacceptable to DPR toxicologists due to major deficiencies (inadequate number of concurrent control animals, too few dose levels and no individual data).
Mobay Chemical Corp., 1985: An oncogenicity study was conducted in which 50 CD1 mice/sex/dose were fed azinphos-methyl (86.7%) in the diet at 0 (corn oil), 5, 20, or 40 ppm (M: 0, 0.79, 3.49 or 11.33 mg/kg/day; F: 0, 0.98, 4.12 or 14.30 mg/kg/day) for 104 weeks (Hayes, 1985). No significant compound-related effects were seen in feed consumption, body weight, organ weight, clinical signs, mortality, hematology, and incidence of gross and histopathological lesions. At the study termination, the mean plasma ChE activity was reduced in the 5 ppm (M: 91% of controls), 20 ppm (M: 69%; F: 78% of controls) and 40 ppm (M: 44%; F: 33% of controls) animals. A reduction in the mean RBC ChE activity was also seen at 5 ppm (M: 84%: F: 78% of controls), 20 ppm (M: 56%; F: 51% of controls), and 40 ppm (M: 37%; F: 41% of controls). In addition, the mean brain ChE activity was depressed at 5 ppm (M: 88%; F: 94% of controls), 20 ppm (M: 84%; F: 74% of controls) and 40 ppm (M: 37%; F: 33% of controls). The NOEL appears to be less than 5 ppm (M: 0.79 mg/kg/day; F: 0.98 mg/kg/day) based on the plasma, RBC and brain ChE inhibition. DPR toxicologists considered this study acceptable based on FIFRA guidelines. Dietary-Rat
Huntington Research Centre, 1966: In a study conducted by Lorke (1966a) azinphos-methyl (purity not reported) was administered to 40 Wistar derived rats/sex/dose at 0, 5, 20, or 50 ppm (increased to 100 ppm at 45 weeks) (M: 0, 0.21, 0.78 or 3.01 mg/kg/day; F: 0, 0.26, 1.07 or 4.14 mg/kg/day) in the diet for 97 weeks. A low dose of 2.5 ppm (M: 0.10 mg/kg/day; F: 0.12 mg/kg/day) was started 6 months into the study with its own controls. At 506100 ppm convulsions were observed in several females 7 weeks after the dose level was increased to 100 ppm. There was no effect on growth, food consumption, food utilization, hematology, urinalysis, macroscopic or microscopic findings at any dose level. At the end of the study, the mean plasma ChE activities was significantly depressed (82-90% of control activity) in the 20 ppm group. In the 506100 ppm animals, the mean ChE activity were reduced in the plasma (M: 70%; F: 76% of controls), RBCs (M & F: 67% of controls), and brain (M: 81%; F: 51% of
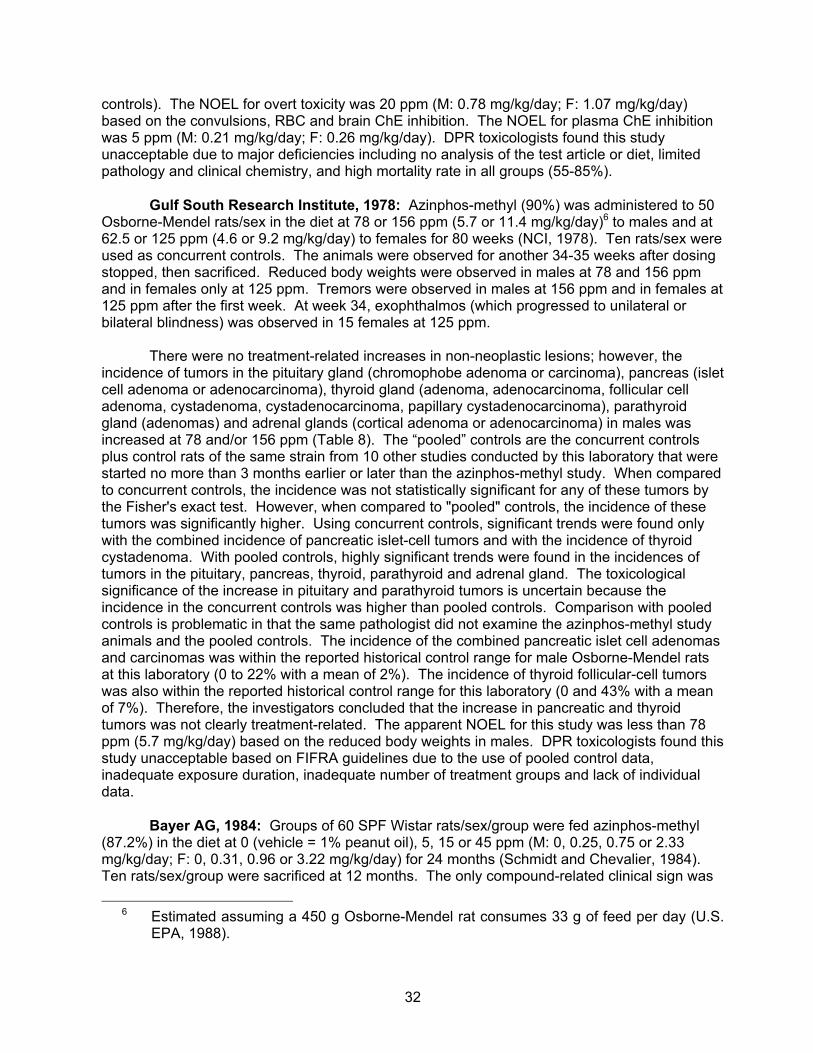
32
controls). The NOEL for overt toxicity was 20 ppm (M: 0.78 mg/kg/day; F: 1.07 mg/kg/day) based on the convulsions, RBC and brain ChE inhibition. The NOEL for plasma ChE inhibition was 5 ppm (M: 0.21 mg/kg/day; F: 0.26 mg/kg/day). DPR toxicologists found this study unacceptable due to major deficiencies including no analysis of the test article or diet, limited pathology and clinical chemistry, and high mortality rate in all groups (55-85%).
Gulf South Research Institute, 1978: Azinphos-methyl (90%) was administered to 50 Osborne-Mendel rats/sex in the diet at 78 or 156 ppm (5.7 or 11.4 mg/kg/day)6 to males and at 62.5 or 125 ppm (4.6 or 9.2 mg/kg/day) to females for 80 weeks (NCI, 1978). Ten rats/sex were used as concurrent controls. The animals were observed for another 34-35 weeks after dosing stopped, then sacrificed. Reduced body weights were observed in males at 78 and 156 ppm and in females only at 125 ppm. Tremors were observed in males at 156 ppm and in females at 125 ppm after the first week. At week 34, exophthalmos (which progressed to unilateral or bilateral blindness) was observed in 15 females at 125 ppm.
There were no treatment-related increases in non-neoplastic lesions; however, the incidence of tumors in the pituitary gland (chromophobe adenoma or carcinoma), pancreas (islet cell adenoma or adenocarcinoma), thyroid gland (adenoma, adenocarcinoma, follicular cell adenoma, cystadenoma, cystadenocarcinoma, papillary cystadenocarcinoma), parathyroid gland (adenomas) and adrenal glands (cortical adenoma or adenocarcinoma) in males was increased at 78 and/or 156 ppm (Table 8). The “pooled” controls are the concurrent controls plus control rats of the same strain from 10 other studies conducted by this laboratory that were started no more than 3 months earlier or later than the azinphos-methyl study. When compared to concurrent controls, the incidence was not statistically significant for any of these tumors by the Fisher's exact test. However, when compared to "pooled" controls, the incidence of these tumors was significantly higher. Using concurrent controls, significant trends were found only with the combined incidence of pancreatic islet-cell tumors and with the incidence of thyroid cystadenoma. With pooled controls, highly significant trends were found in the incidences of tumors in the pituitary, pancreas, thyroid, parathyroid and adrenal gland. The toxicological significance of the increase in pituitary and parathyroid tumors is uncertain because the incidence in the concurrent controls was higher than pooled controls. Comparison with pooled controls is problematic in that the same pathologist did not examine the azinphos-methyl study animals and the pooled controls. The incidence of the combined pancreatic islet cell adenomas and carcinomas was within the reported historical control range for male Osborne-Mendel rats at this laboratory (0 to 22% with a mean of 2%). The incidence of thyroid follicular-cell tumors was also within the reported historical control range for this laboratory (0 and 43% with a mean of 7%). Therefore, the investigators concluded that the increase in pancreatic and thyroid tumors was not clearly treatment-related. The apparent NOEL for this study was less than 78 ppm (5.7 mg/kg/day) based on the reduced body weights in males. DPR toxicologists found this study unacceptable based on FIFRA guidelines due to the use of pooled control data, inadequate exposure duration, inadequate number of treatment groups and lack of individual data.
Bayer AG, 1984: Groups of 60 SPF Wistar rats/sex/group were fed azinphos-methyl (87.2%) in the diet at 0 (vehicle = 1% peanut oil), 5, 15 or 45 ppm (M: 0, 0.25, 0.75 or 2.33 mg/kg/day; F: 0, 0.31, 0.96 or 3.22 mg/kg/day) for 24 months (Schmidt and Chevalier, 1984). Ten rats/sex/group were sacrificed at 12 months. The only compound-related clinical sign was 6 Estimated assuming a 450 g Osborne-Mendel rat consumes 33 g of feed per day (U.S.
EPA, 1988).

33
Table 8. Incidence of Neoplastic Lesions in Male Rats Fed Azinphos-Methyl for 80 Weeksa Dose Level (ppm)b
Pooled Controls
Concurrent Controls
78
156
Pituitary Chromophobe adenoma 13/85+ 4/9 21/46** 13/43** (15%) (44%) (46%) (30%)
13/85++ 4/9 21/46** 15/43** Combined - chromophobe adenoma or carcinoma (15%) (44%) (46%) (35%)
Pancreas 2/92+ 0/9 1/47 4/45 Islet-cell adenoma
(2%) (0%) (2%) (9%) NR 0/9 0/47 2/45 Islet-cell carcinoma
(0%) (0%) (4%) 2/92++ 0/9+ 1/47 6/45* Combined - islet cell adenoma
or carcinoma (2%) (0%) (2%) (13%) Thyroid
NR 0/9+ 7/44 10/43 Cystadenoma (0%) (16%) (23%)
7/86++ 1/9 10/44* 12/43** Combined - cystadenoma, follicular-cell adenoma or adenoma
(8%) (11%) (23%) (28%)
NR 0/9 3/44 3/43 Adenocarcinoma (0%) (7%) (7%)
0/86++ 0/9 4/44* 4/43* Combined - adenocarcinoma, cystadenocarcinoma or papillary cystadenocarcinoma
(0%) (0%) (9%) (9%)
7/86+++ 1/9 14/44*** 14/43*** Combined - all follicular-cell tumors (8%) (11%) (32%) (33%) Parathyroid
1/81++ 1/5 0/26 4/24** Adenoma (1%) (20%) (0%) (17%)
Adrenal Gland Adenocarcinoma 0/95++ 0/9 1/45 3/46* (0%) (0%) (2%) (7%) Cortical adenoma NR 1/9 3/45 7/46 (11%) (7%) (15%)
3/95+++ 1/9 4/45 10/46*** Combined – adenocarcinoma or cortical adenoma (3%) (11%) (9%) (22%)
a The denominator is the number of animals examined; the number in parentheses represents the incidence in percentage.
b The test compound intake was estimated to be 5.7 and 11.4 mg/kg/day for 78 and 156 ppm, respectively, assuming a 450 g Osborne-Mendel rat consumes 33 g of feed per day (U.S. EPA, 1988).
NR Not reported +, ++, +++ Significant trend based on the Cochran-Armitage trend test at p < 0.05, 0.01 and 0.001, respectively (Gart et
al., 1986). *, **, *** Significantly different from the pooled control group based on the Fisher's exact test at p < 0.05, 0.01, 0.001,
respectively.

34
an increased incidence of alopecia at 45 ppm after 4 weeks (M: 8, 4, 5, 15; F: 18, 22, 26, 49). The mean body weights of males at 45 ppm were significantly reduced (up to 10%). Feed consumption was slightly increased in the females at 45 ppm (~10%). There were no treatment-related effects on survival rate, clinical chemistry, hematology, urinalysis, gross pathology, and histopathology. At 24 months, the mean plasma, RBC and brain ChE activities were reduced at 15 and 45 ppm (Table 9). The NOEL was 5 ppm (M: 0.25 mg/kg/day; F: 0.31 mg/kg/day) based on the plasma and RBC ChE inhibition in both sexes and the brain ChE inhibition in females. This study was acceptable to DPR toxicologists based on FIFRA guidelines.
Dietary-Dog
Huntington Research Centre, 1966: Four cocker spaniel dogs/sex/dose were fed azinphos-methyl (purity not reported) in the diet at 0, 5, 20, 50 ppm for two years (Lorke, common bile duct were grossly distended, but not obstructed. The liver was congested, but otherwise normal in appearance. Although the death of this dog was attributed to cholangitis, investigators did not consider the cholangitis treatment-related since the only other hepatic abnormalities in the other dogs were an occasional focus of cellular infiltration. There was a slight reduction in the mean body weights (~5-15%) at 300 ppm and in the mean food consumption (6-10%) at 1506300 ppm. The mean plasma and RBC ChE activities were significantly reduced at 20650 ppm (84% and 71% of controls, respectively) and 506300 ppm (52% and 17% of controls, respectively). Brain ChE activity was not measured. There were no treatment-related changes in the hematology, clinical chemistry, urinalysis, macroscopic or microscopic lesions. The apparent NOEL for overt toxicity was 20650 ppm (M & F: 1.27 mg/kg/day) based on the death, clinical signs, and reduced body weight and food consumption. The NOEL for plasma and RBC ChE inhibition was 5 ppm (M: 0.17 mg/kg/day; F: 19 mg/kg/day). DPR toxicologists found this study unacceptable due to major deficiencies including incomplete reporting of data, no analysis of test article and diet, and frequent dose level changes.
Research and Consulting Company AG, 1990: In another chronic study, 4 beagle dogs/sex/group were fed azinphos-methyl (91.9%) in the diet at 0, 5, 25 or 125 ppm (M: 0, 0.15, 0.69 or 3.84 mg/kg/day; F: 0, 0.16, 0.78 or 4.33 mg/kg/day) for 52 weeks (Allen, 1990). There was no dose-related difference in the number of dogs exhibiting clinical signs during the study. Although the number of dogs with diarrhea and mucus in feces did not exhibit a clear dose-relationship, the frequency of these signs appeared to be dose-related (Table 10). The frequency of diarrhea increased noticeably after the first month, especially in the females at 125 ppm, and remained fairly constant through the remainder of the study with some periodic decreases. The frequency of diarrhea in males at 25ppm and in both sexes at 125 ppm was highly significant by pair-wise comparison with controls; however, the trend in males was only slightly significant because the frequency decreased from 25 to 125 ppm. Some occurrences of diarrhea in this study do not appear to be treatment-related because some dogs had diarrhea during the pretreatment period. The male dog at 25 ppm with the highest frequency of diarrhea (41 of 71 occurrences) during treatment also had diarrhea during the pretreatment period. Even if this animal is ignored, the frequency at this dose level (30 occurrences) is still higher than the occurrences in the control group (8 occurrences). The interpretation of the increase in frequency of diarrhea in males is also confounded by the fact the frequency of diarrhea in males at 25 and 125 ppm was similar to the frequency of diarrhea in control females. It is possible there is a gender-related difference in the normal frequency of diarrhea or it could be the control and low dose males had an unusually low frequency. Closer examination of the frequency of diarrhea in control females revealed that most occurred in one female (43 of 58 occurrences). This control female also had diarrhea during the week before treatment began. If this control

35
Table 9. Cholinesterase Activity in Plasma, Red Blood Cells and Brain of Rats Fed Azinphos-methyl in the Diet for 24 Monthsa
Dose Level (ppm) Tissue 5 15 45
MALES
Month 6 Plasma 88%b* 95% 57%** RBCc 97% 90% 80%** Month 12 Plasma 84%* 87% 54%** RBC 102% 82%* 73%** Brain 130%** 137%** 109% Month 18 Plasma 87% 90% 55%** RBC 96% 83%** 73%** Month 24 Plasma 113% 88% 51%** RBC 88%** 78%** 63%** Brain 117% 112% 68%**
FEMALES
Month 6 Plasma 92% 71%* 34%** RBC 109%* 86%** 77%** Month 12 Plasma 90% 65%** 33%** RBC 101% 81%** 69%** Brain 112% 90% 50%** Month 18 Plasma 100% 74%* 46%** RBC 94%* 78%** 63%** Month 24 Plasma 102% 81% 38%** RBC 98% 84%** 71%** Brain 102% 79%** 45%** a Schmidt and Chevalier, 1984. b Percent of control activity. Ten animals per sex per dose level tested. c RBC = red blood cell *,** Significantly different from controls by the Mann-Whitney U-test and the Wilcoxon rank sum test at p < 0.05 and
0.01, respectively female is eliminated, the frequency in the female controls (15 occurrences) is more similar to male controls (8 occurrences). On the other hand, if this control female is ignored, the frequency of diarrhea in females at 5 and 25 ppm now appears to be elevated. The apparent increase in frequency in diarrhea in these two groups could not be attributed to any one dog and no female dogs in these groups had diarrhea during the pretreatment period. Furthermore, no plasma or RBC ChE inhibition was observed at the lowest dose level. This would suggest that many of the occurrences of diarrhea at these lower dose levels are unrelated to ChE inhibition. The increase in frequency of diarrhea in females at 125 ppm seems more likely to be treatment-

36
Table 10. Frequency of Diarrhea and Mucus in the Feces in Dogs Fed Azinphos-Methyl for 52 Weeksa
Dose Level (ppm)b 0 5 25 125 MALES
Diarrhea 8c+ 5 71*** 30*** (4/4)d (3/4) (4/4) (3/4) Mucus in Feces 1+++ 0 22*** 32*** (1/4) (0/4) (4/4) (3/4)
FEMALES Diarrhea 58+++ 40 44 275*** (3/4) (4/4) (4/4) (4/4) Mucus in Feces 75+ 9 18 58 (4/4) (4/4) (2/4) (4/4) a Allen, 1990 b Actual test compound intake at 5, 25 and 125 ppm was 0.15, 0.69 or 3.84 mg/kg/day, respectively, in males
and 0.16, 0.78 or 4.33 mg/kg/day, respectively, in females. c Total number occurrences of this sign during a total possible 1460 observations (4 dogs x 365 days). d Number of dogs exhibiting this sign at any time during the study. +,+++ Significant trend based on a dose-weighted chi-square test at p < 0.05 and 0.001, respectively. *** Significantly difference from the control group based on the Fisher's exact test at p < 0.001.
related. Then again, one female dog had the vast majority of occurrences of diarrhea (190 of 275 occurrences) at 125 ppm. This dog did not have diarrhea during pretreatment, but it did have mucus in the feces. Elimination of this dog would decrease the frequency in this group to 85 occurrences, which still appears to be higher than the approximately 40 occurrences per group in the two lower dose groups. Since diarrhea is a known cholinergic sign and it was not possible to state with absolute certainty that all occurrences of diarrhea were unrelated to treatment, a health protective assumption was made that the diarrhea was cholinergic in origin and, thus, treatment-related. The toxicological significance of the diarrhea is supported by a range-finding study where more overt cholinergic signs (muscle spasms and tremors) were seen in dogs fed azinphos-methyl at 100 ppm for 19 weeks (Löser and Lorke, 1967).
At week 52, the mean ChE activity were significantly reduced in the plasma (M & F: 47% of controls), RBCs (M & F: 14% of controls), and brain (M: 73%; F: 80% of control activity) at 125 ppm. The mean RBC ChE activity was also lower (M: 73%; F: 65% of controls) at 25 ppm, although the reduction was only statistically significant for females. The mean activity of liver cytochrome P-450 was significantly higher (39%) at 125 ppm in the males. The mean activities of N-demethylase were also higher (30-34%) in both sexes at 125 ppm, but the differences were not statistically significant. Males at 125 ppm had slightly lower mean plasma albumin levels (7-13%). The mean liver and spleen weights were lower in males at all dose levels (14-21% and 30-65%, respectively). The mean kidney weights were lower in males at 125 ppm (17%). The toxicological significance of the changes in enzyme activities and organ weights is uncertain given there were no accompanying histological changes. Furthermore, the liver and kidney weights were not significantly different from the controls when compared relative to their body weights. There was no compound-related effect on mortality, body weight, food consumption, hearing, ophthalmology, hematology, urinalysis, macroscopic or microscopic observations. The NOEL was 5 ppm (M: 0.15 mg/kg/day; F: 16 mg/kg/day) based on the RBC ChE inhibition and diarrhea. This study was considered acceptable by DPR toxicologists.

37
E. GENOTOXICITY
Gene Mutation
The results from only one in vivo gene mutation assay for azinphos-methyl was available for evaluation (Table 11). This study, a sex-linked recessive lethal assay with Drosophila melanogaster, was conducted for the U.S. EPA under contract (Valencia, 1981). There was no evidence of a mutagenic effect based on the percentage of cultures in the F2 generation without wild-type males.
Numerous in vitro gene mutation assays have been conducted for azinphos-methyl including both forward and reverse mutation assays (Table 11). No significant increase in the mutation frequency was observed in a reverse mutation assay (Ames assay) in which Salmonella typhimurium strains TA98, TA100, TA1535, TA1537, and TA1538 were exposed to azinphos-methyl (92.3%) at concentrations up to 2,500 μg/plate (Herbold, 1978). This assay was unacceptable to DPR toxicologists due to several deficiencies, including no individual data, no positive controls that did not require metabolic activation, and no justification of dose levels. Similar results were obtained when this same investigator repeated this assay with the same strains exposed to azinphos-methyl (92.5%) up to 9,600 μg/plate with and without metabolic activation (Herbold, 1988). This assay was considered acceptable by DPR toxicologists. In another acceptable Ames assay, azinphos-methyl (88.8%) was tested at concentrations up to 4,000 μg/plate using TA98, TA100, TA1535, TA1537, and TA1538 strains with and without metabolic activation (Lawlor, 1987). No mutagenic response was clearly identified, although an equivocal response was observed for TA100. This study was acceptable to DPR toxicologists based on FIFRA guidelines. The results were also negative in three published reports of Ames assays for azinphos-methyl (Simmon et al., 1976: TA100, TA1535, TA1537, TA1538; Garrett et al., 1986: TA1537, TA98, TA100; Carere et al., 1978: TA1535, TA1536, TA1537, TA1538). There was one published report of a weak mutagenic response using TA98 with activation (Zeiger et al., 1987). However, the increase in mutation frequency was only observed at 3,333 μg/plate and above where precipitation occurred, confounding the results. A registrant also submitted a reverse mutation assay using Saccharomyces cerevisiae strains S128 and S211a (Hoorn, 1983). The results from this assay were negative, but this study was unacceptable to DPR toxicologists based on an inadequate description of methods and materials.
There are also several published reports of forward mutation assays for azinphos-
methyl. The results from the L5178Y TK+/- mouse lymphoma forward mutation assay were positive without metabolic activation (Garrett et al., 1986). Azinphos-methyl was not tested in this system with metabolic activation. A forward mutation assay with Streptomyces coelicolor was negative (Carere et al., 1978). The findings in two reports from the same laboratory using a forward mutation assay with Schizosaccharomyces pombe ade6 were inconsistent. Degraeve and coworkers (1980) reported negative results; however, Gilot-Delhalle and coworkers (1983) reported positive results without metabolic activation. The differences in the findings are difficult to interpret since few details were given in the earlier report. Both appear to have tested azinphos-methyl with and without metabolic activation. The concentrations tested were not reported in the earlier study.
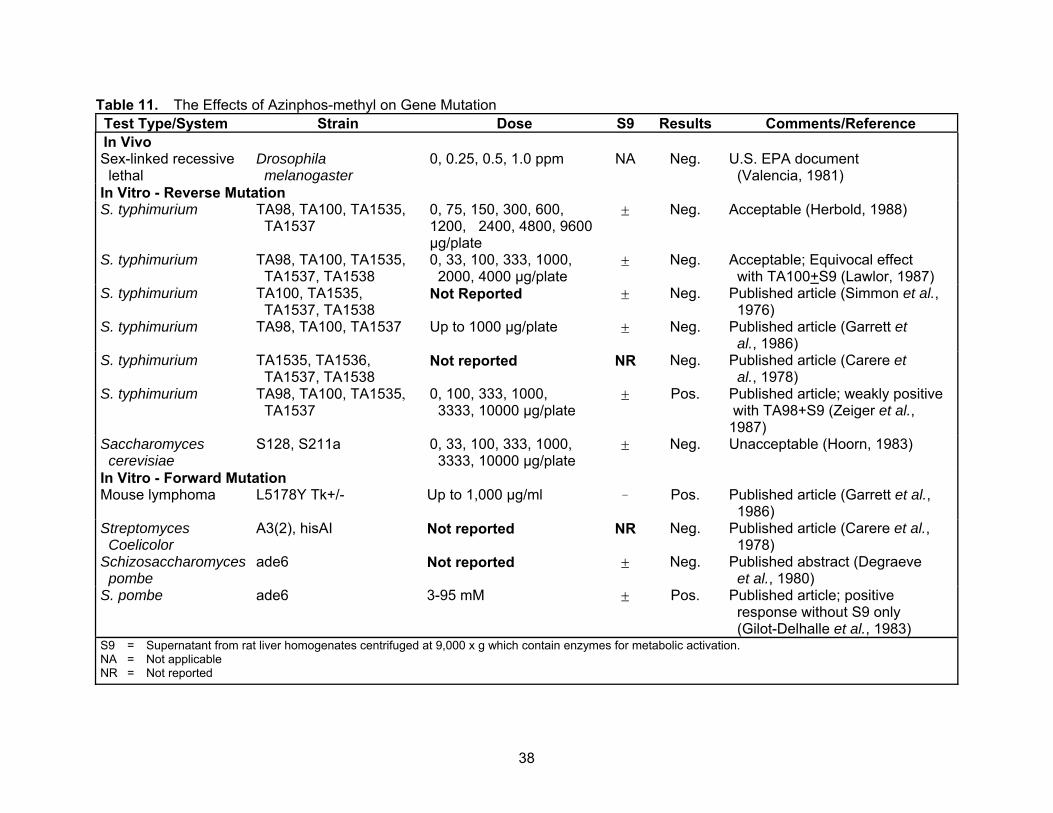
38
Table 11. The Effects of Azinphos-methyl on Gene Mutation Test Type/System Strain Dose S9 Results Comments/Reference In Vivo Sex-linked recessive lethal
Drosophila melanogaster
0, 0.25, 0.5, 1.0 ppm NA Neg. U.S. EPA document (Valencia, 1981)
In Vitro - Reverse Mutation S. typhimurium TA98, TA100, TA1535,
TA1537 0, 75, 150, 300, 600, 1200, 2400, 4800, 9600 μg/plate
± Neg. Acceptable (Herbold, 1988)
S. typhimurium TA98, TA100, TA1535, TA1537, TA1538
0, 33, 100, 333, 1000, 2000, 4000 μg/plate
± Neg. Acceptable; Equivocal effect with TA100+S9 (Lawlor, 1987)
S. typhimurium TA100, TA1535, TA1537, TA1538
Not Reported ± Neg. Published article (Simmon et al., 1976)
S. typhimurium TA98, TA100, TA1537 Up to 1000 μg/plate ± Neg. Published article (Garrett et al., 1986)
S. typhimurium TA1535, TA1536, TA1537, TA1538
Not reported NR Neg. Published article (Carere et al., 1978)
S. typhimurium TA98, TA100, TA1535, TA1537
0, 100, 333, 1000, 3333, 10000 μg/plate
± Pos. Published article; weakly positive with TA98+S9 (Zeiger et al., 1987)
Saccharomyces cerevisiae
S128, S211a 0, 33, 100, 333, 1000, 3333, 10000 μg/plate
± Neg. Unacceptable (Hoorn, 1983)
In Vitro - Forward Mutation Mouse lymphoma L5178Y Tk+/- Up to 1,000 μg/ml ! Pos. Published article (Garrett et al.,
1986) Streptomyces Coelicolor
A3(2), hisAI Not reported NR Neg. Published article (Carere et al., 1978)
Schizosaccharomyces pombe
ade6 Not reported ± Neg. Published abstract (Degraeve et al., 1980)
S. pombe ade6 3-95 mM ± Pos. Published article; positive response without S9 only (Gilot-Delhalle et al., 1983)
S9 = Supernatant from rat liver homogenates centrifuged at 9,000 x g which contain enzymes for metabolic activation. NA = Not applicable NR = Not reported

39
Structural Chromosome Aberrations
All the in vivo tests for structural chromosome aberrations were negative (Table 12a). In one of two dominant lethal assays submitted by registrants, 12 male albino mice/dose were administered azinphos-methyl (purity not reported) intraperitoneally at 0, 125 or 250 μg/kg (Arnold, 1971). This study was considered invalid by the registrant and unacceptable to DPR toxicologists due to insufficient information. In the second dominant lethal assay, 50 male NMRI mice were administered azinphos-methyl (92.3%) by oral gavage at 0 and 4 mg/kg (Herbold, 1979a). DPR toxicologists also found this study unacceptable due to insufficient information, only one dose level tested, and no positive control tested. Published reports of two dominant lethal assays for azinphos-methyl in mice were also negative (Degraeve et al., 1986; Garrett et al., 1986). In a micronucleus assay, 5 NMRI mice/sex/dose were administered azinphos-methyl (92.3%) by gavage at 0, 1.25, 2.5 or 5 mg/kg in 2 doses 24 hrs apart and sacrificed 6 hours later (Herbold, 1979b). This study was unacceptable to DPR toxicologists due to major deficiencies (no pilot study data, no clinical observations or pathology on the animal that died, no signs of toxicity at the high dose). A published report of a micronucleus assay in mouse bone marrow was also negative (Garrett et al., 1986). Inaddition, two other published in vivo tests for structural chromosome aberrations were negative, including a cytogenetics test using mice (Q strain) spermatocytes and bone marrow cells (Degraeve et al., 1986) and a sister chromatid exchange assay using central mudminnows, Umbra limi (Vigfusson et al., 1983). There are several reports of positive results for structural chromosome aberrations in vitro (Table 12b). In a study submitted by a registrant, an increase in chromosome aberrations (except gaps) was observed in human lymphocytes exposed to azinphos-methyl (91.9%) at 500 μg/ml with activation (Herbold, 1986). There was no increase in aberrations at any concentration without activation. This study was acceptable to DPR toxicologists based on FIFRA guidelines. There are three published reports of cytogenetic tests which were also positive. In one study conducted by Alam and coworkers (1974), Chinese hamster cells (CHO-Kl) were exposed to azinphos-methyl (90%) at concentrations of 60 to 120 μg/ml. In another study from the same laboratory, two human cell lines (WI-38 and HEp-2) were exposed to azinphos-methyl (90%) at 120 to 160 μg/ml (Alam and Kasatiya, 1976). Trépanier and coworkers (1977) exposed cells from a human lymphoblastoid cell line (L-MOORE) at 60 μg/ml. In all three studies, the most common chromosome aberrations were chromatid breaks and exchanges. Azinphos-methyl induced a statistically significant increase in micronucleus frequency in human lymphocytes in vitro without metabolic activation (not tested with activation) at all dose levels tested, but the increase was not dose-related (Bianchi-Santamaria, 1997). The lowest concentration tested was reported to approximate the concentrations found in food. The four published reports of in vitro sister chromatid exchange assays were all negative including one using Chinese hamster ovary cells (Garrett et al., 1986) and three using in Chinese hamster V79 cells (Chen et al., 1982a&b; Nicholas and Van Den Berghe, 1982). Degraeve and coworkers (1985) investigated the synergism of chromosomal damage by azinphos-methyl when given in combination with trichlorfon. Twenty-five male mice (Q strain) were given two consecutive intraperitoneal injections of trichlorfon at 50 mg/kg and azinphos-methyl at 0.5 mg/kg. No increase in chromosomal damage was observed in bone marrow cells, spermatogonia or primary spermatocytes. The frequency of post-implantation losses was also not increased in a dominant lethal assay using 5 of the 25 treated male mice; however, there was an increase in pre-implantation losses during the fourth week of mating which the investigators attributed to the toxic effects of the compounds on the male germ cells.
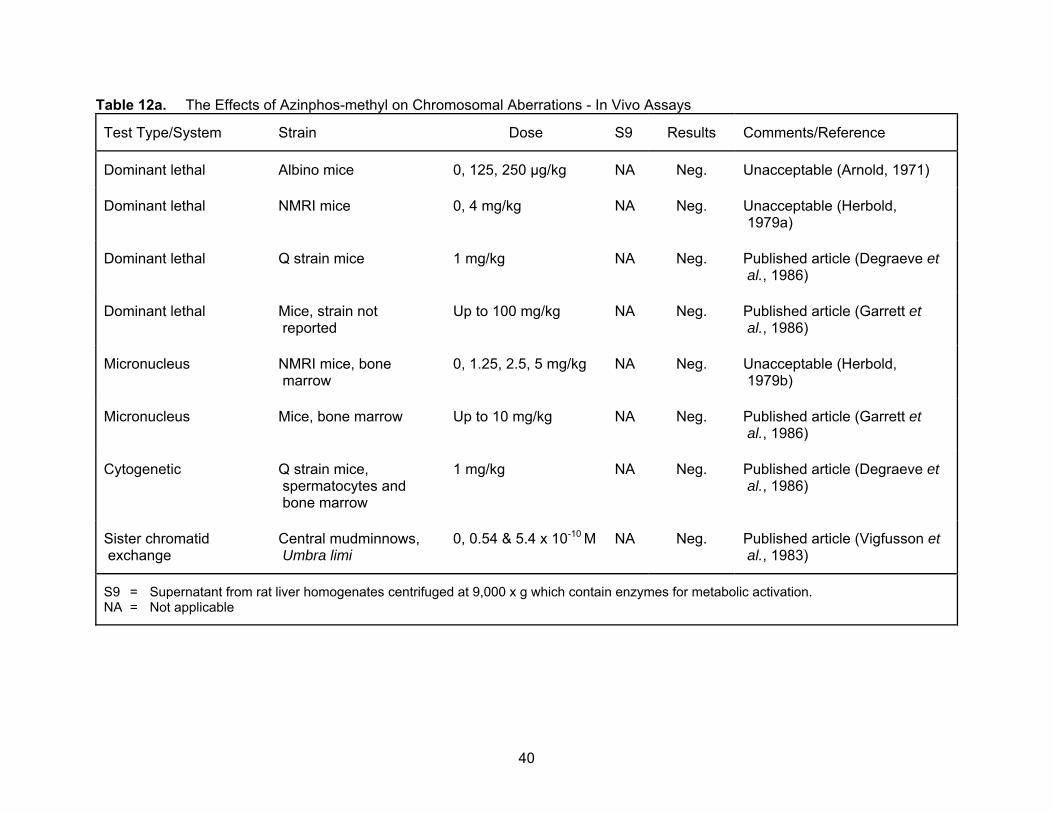
40
Table 12a. The Effects of Azinphos-methyl on Chromosomal Aberrations - In Vivo Assays Test Type/System
Strain
Dose
S9
Results
Comments/Reference
Dominant lethal
Albino mice
0, 125, 250 μg/kg
NA
Neg.
Unacceptable (Arnold, 1971)
Dominant lethal
NMRI mice
0, 4 mg/kg
NA
Neg.
Unacceptable (Herbold, 1979a)
Dominant lethal
Q strain mice
1 mg/kg
NA
Neg.
Published article (Degraeve et al., 1986)
Dominant lethal
Mice, strain not reported
Up to 100 mg/kg
NA
Neg.
Published article (Garrett et al., 1986)
Micronucleus
NMRI mice, bone marrow
0, 1.25, 2.5, 5 mg/kg
NA
Neg.
Unacceptable (Herbold, 1979b)
Micronucleus
Mice, bone marrow
Up to 10 mg/kg
NA
Neg.
Published article (Garrett et al., 1986)
Cytogenetic
Q strain mice, spermatocytes and bone marrow
1 mg/kg
NA
Neg.
Published article (Degraeve et al., 1986)
Sister chromatid exchange
Central mudminnows, Umbra limi
0, 0.54 & 5.4 x 10⁻¹⁰ M
NA
Neg.
Published article (Vigfusson et al., 1983)
S9 = Supernatant from rat liver homogenates centrifuged at 9,000 x g which contain enzymes for metabolic activation. NA = Not applicable

41
Table 12b. The Effects of Azinphos-methyl on Chromosomal Aberrations - In Vitro Assays Test Type/System
Strain
Dose
S9
Results
Comments/Reference
Cytogenetic
Human lymphocytes
500 μg/ml
±
Pos.
Acceptable; positive with S9 only (Herbold, 1986)
Cytogenetic
CHO-K1 cell line
60, 80, 100, 120 μg/ml
NR
Pos.
Published article (Alam et al., 1974)
Cytogenetic
Human WI-38 & HEp-2 cell lines
120, 140, 160 μg/ml
NR
Pos.
Published article (Alam & Kasatiya, 1976)
Cytogenetic
Human lymphoblastoid cell line (L-MOORE)
60 μg/ml
NR
Pos.
Published abstract (Trépanier et al., 1977)
Micronucleus
Human lymphocytes
0.06, 0.6, 6.0 μg/ml
!
Pos.
Published article (Bianchi- Santamaria et al., 1997)
Sister chromatid exchange
Chinese hamster ovary cells
Up to 100 μg/ml
±
Neg.
Published article (Garrett et al., 1986)
Sister chromatid exchange
Chinese hamster V79 cell line
0, 2.5, 5, 10, 20 μg/ml
!
Neg.
Published article (Chen et al., 1982a)
Sister chromatid exchange
Chinese hamster V79 cell line
0, 5, 10, 20, 25 μg/ml
+
Neg.
Published article (Chen et al., 1982b)
Sister chromatid exchange
Chinese hamster V79 cell line
Up to 60 μM
NR
Neg.
Published article (Nicholas & Van Den Berghe, 1982)
S9 = Supernatant from rat liver homogenates centrifuged at 9,000 x g which contain enzymes for metabolic activation. NR = Not reported

42
Several studies evaluated the formation of sister chromatid exchanges in agricultural workers exposed to azinphos-methyl among other pesticides (De Ferrari et al., 1991; G\mez-Arroyo et al., 1992, Lander and Rrnne, 1995). Increases in sister chromatid exchanges were reported in two of these studies; however, since exposure was not limited to azinphos-methyl, its unclear what, if any, contribution azinphos-methyl may have had to this increase.
Other Genotoxic Effects
Numerous tests for other genotoxic effects were also conducted for azinphos-methyl (Table 13). In a study submitted by a registrant, primary rat hepatocytes did not show an increase in the unscheduled DNA synthesis (UDS) when incubated with technical azinphos-methyl (91.1%) at up to 10.1 μg/ml (Myhr and Brusick, 1983). DPR toxicologists found this study acceptable. Garret and coworkers (1986) also reported negative results from a UDS assay with human lung fibroblasts (WI-38).
There was no evidence of DNA damage in two differential toxicity tests. In a study submitted by the registrant, two E. coli pol strains, (K12)p 3478 (repair deficient) and W 3110were exposed to azinphos-methyl (91.1%) at concentrations up to 10,000 μg/plate (Herbold, 1984). However, this study was unacceptable to DPR toxicologists due to several deficiencies (no individual plate counts, inadequate description of protocol). In a published report by Garret and coworkers (1986), a differential toxicity test with S. typhimurium uvrB, rec was also negative.
Summary Azinphos-methyl appears to be genotoxic based on positive results in a mouse lymphoma assay, four in vitro cytogenetic assays with human cells or cell lines (primary lymphocytes, WI-38, HEp-2, and L-MOORE cell lines) or Chinese hamster cell line (CHO-K1), and a micronucleus assay with human lymphocytes. However, all of the in vivo cytogenetic assays (2 micronucleus assays and 1 cytogenetic assay in mice) were negative. All other tests for chromosomal aberrations, including sister chromatid exchange assays and dominant lethal assays, were negative. Furthermore, most of the reverse mutation assays with Salmonella typhimurium were negative except for an equivocal response with TA100 in one assay and a weak positive response in another assay with TA98. The weak positive response was only observed at concentrations (3,333 μg/plate and higher) where precipitation occurred, confounding the results. Negative results were reported for all of the other gene mutation tests and miscellaneous genotoxicity tests, except for a forward mutation assay with Schizosaccharomyces pombe ade6, a mitotic recombination assay in Saccharomyces cerevisiae D3, a reverse mutation/gene conversion assay with S. cerevisiae D7, an assay for gene conversion/crossing-over/non-disjunction in Aspergillus nidulans D7, and a 32P-postlabeling assay of adducts in calf thymus DNA. F. REPRODUCTIVE TOXICITY
Dietary-Mouse
University of Chicago, 1965: In a 3-generation, 2-litter study, 24 female and 6 male CF1 mice/group were given azinphos-methyl (80%) in the diet at 0, 5, 10, 25 or 50 ppm (0,

43
Table 13. Other Genotoxic Effects of Azinphos-methyl
Test Type/System Strain Dose S9 Results Comments/Reference
Unscheduled DNA synthesis (UDS)
Rat hepatocytes 0, 0.25, 0.5, 1, 2.5, 5, 10, 25, 50, 100 μg/ml
NA Neg. Acceptable (Myhr and Brusick, 1983)
UDS Human lung fibroblasts WI-38
Up to 100 μg/ml ± Neg. Published article (Garrett et al., 1986)
Differential toxicity (Pol A test) E. coli W 3110 & (K12)p3478
0, 625, 1250, 2500, 5000, 10000 μg/plate
Neg. Unacceptable (Herbold, 1984)
Differential toxicity S. typhimurium uvrB, rec
Up to 1000 μg/ml ! Neg. Published article (Garrett et al., 1986)
Mitotic recombination S. cerevisiae D3 Up to 10 μg/ml ! Pos. Published article (Garrett et al., 1986)
Gene conversion and crossing-over
S. cerevisiae D7 Up to 10,000 μg/ml ± Neg. Published article (Garrett et al., 1986)
Mitotic recombination, gene conversion, crossing-over, and reverse mutation
S. cerevisiae D3 & D7
Not reported ± Neg. Published abstract (Riccio et al., 1981)
Gene conversion and reverse mutation
S. cerevisiae D7 0, 500, 1000, 5000, 10000, 25000 μg/ml
± Pos. Published article, weakly positive without S9 (Bianchi et al., 1994)
Gene conversion, crossing- over, and non-disjunction
Aspergillus nidulans D7
0, 30, 60 mM ± Pos. Published article; positive for crossing-over and non- disjunction at 30 mM only (Vallini et al., 1983)
Point mutations, crossing- over, and non-disjunction
A. nidulans Not reported NR Neg. Published article (Morpurgo et al., 1977)
32P-Postlabeling of DNA adducts
Calf thymus 1 mM + Pos. Published article (Shah et al., 1997)
S9 = Supernatant from rat liver homogenates centrifuged at 9,000 x g which contain enzymes for metabolic activation. NA = Not applicable NR = Not reported
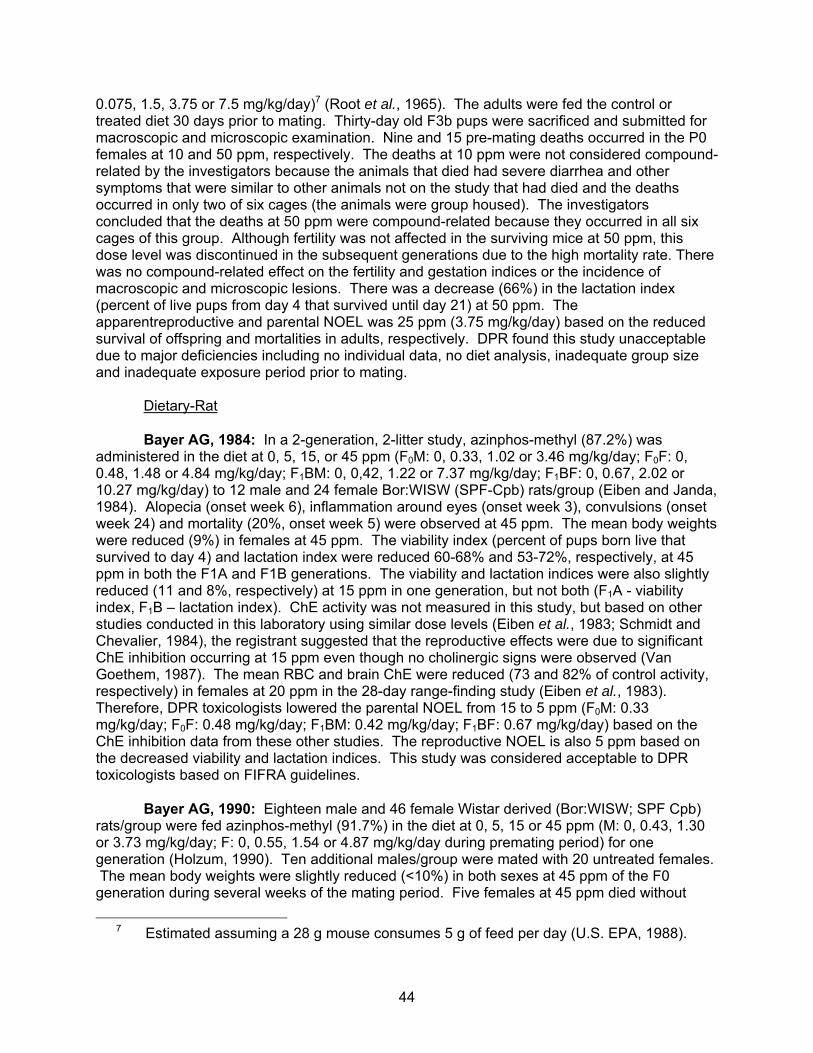
44
0.075, 1.5, 3.75 or 7.5 mg/kg/day)7 (Root et al., 1965). The adults were fed the control or treated diet 30 days prior to mating. Thirty-day old F3b pups were sacrificed and submitted for macroscopic and microscopic examination. Nine and 15 pre-mating deaths occurred in the P0 females at 10 and 50 ppm, respectively. The deaths at 10 ppm were not considered compound-related by the investigators because the animals that died had severe diarrhea and other symptoms that were similar to other animals not on the study that had died and the deaths occurred in only two of six cages (the animals were group housed). The investigators concluded that the deaths at 50 ppm were compound-related because they occurred in all six cages of this group. Although fertility was not affected in the surviving mice at 50 ppm, this dose level was discontinued in the subsequent generations due to the high mortality rate. There was no compound-related effect on the fertility and gestation indices or the incidence of macroscopic and microscopic lesions. There was a decrease (66%) in the lactation index (percent of live pups from day 4 that survived until day 21) at 50 ppm. The apparentreproductive and parental NOEL was 25 ppm (3.75 mg/kg/day) based on the reduced survival of offspring and mortalities in adults, respectively. DPR found this study unacceptable due to major deficiencies including no individual data, no diet analysis, inadequate group size and inadequate exposure period prior to mating.
Dietary-Rat
Bayer AG, 1984: In a 2-generation, 2-litter study, azinphos-methyl (87.2%) was administered in the diet at 0, 5, 15, or 45 ppm (F0M: 0, 0.33, 1.02 or 3.46 mg/kg/day; F0F: 0, 0.48, 1.48 or 4.84 mg/kg/day; F1BM: 0, 0,42, 1.22 or 7.37 mg/kg/day; F1BF: 0, 0.67, 2.02 or 10.27 mg/kg/day) to 12 male and 24 female Bor:WISW (SPF-Cpb) rats/group (Eiben and Janda, 1984). Alopecia (onset week 6), inflammation around eyes (onset week 3), convulsions (onset week 24) and mortality (20%, onset week 5) were observed at 45 ppm. The mean body weights were reduced (9%) in females at 45 ppm. The viability index (percent of pups born live that survived to day 4) and lactation index were reduced 60-68% and 53-72%, respectively, at 45 ppm in both the F1A and F1B generations. The viability and lactation indices were also slightly reduced (11 and 8%, respectively) at 15 ppm in one generation, but not both (F1A - viability index, F1B – lactation index). ChE activity was not measured in this study, but based on other studies conducted in this laboratory using similar dose levels (Eiben et al., 1983; Schmidt and Chevalier, 1984), the registrant suggested that the reproductive effects were due to significant ChE inhibition occurring at 15 ppm even though no cholinergic signs were observed (Van Goethem, 1987). The mean RBC and brain ChE were reduced (73 and 82% of control activity, respectively) in females at 20 ppm in the 28-day range-finding study (Eiben et al., 1983). Therefore, DPR toxicologists lowered the parental NOEL from 15 to 5 ppm (F0M: 0.33 mg/kg/day; F0F: 0.48 mg/kg/day; F1BM: 0.42 mg/kg/day; F1BF: 0.67 mg/kg/day) based on the ChE inhibition data from these other studies. The reproductive NOEL is also 5 ppm based on the decreased viability and lactation indices. This study was considered acceptable to DPR toxicologists based on FIFRA guidelines.
Bayer AG, 1990: Eighteen male and 46 female Wistar derived (Bor:WISW; SPF Cpb) rats/group were fed azinphos-methyl (91.7%) in the diet at 0, 5, 15 or 45 ppm (M: 0, 0.43, 1.30 or 3.73 mg/kg/day; F: 0, 0.55, 1.54 or 4.87 mg/kg/day during premating period) for one generation (Holzum, 1990). Ten additional males/group were mated with 20 untreated females. The mean body weights were slightly reduced (<10%) in both sexes at 45 ppm of the F0 generation during several weeks of the mating period. Five females at 45 ppm died without 7 Estimated assuming a 28 g mouse consumes 5 g of feed per day (U.S. EPA, 1988).

45
clinical signs during the weeks 3 and 6 of mating. Two other 45 ppm females were sacrificed in a moribund condition in week 3 and 10 after exhibiting poor general condition, inertia, nasal discharge, and stumbling gait. Hyperemia and edema of the lungs and centrilobular hyperemia of the liver were observed histologically in the animals that died or were moribund. The investigators attributed these deaths to nonhomogeneous mixing of the diets which occurred weeks 3, 4 and 6 of mating. There was no effect on food consumption, insemination index, fertility index, gestation index, gestation period, lactation index, or clinical signs of pups. The viability index and pup body weights during the lactation period were significantly reduced (8-48% and 14-23%) at 15 and 45 ppm, respectively. At the end of the mating period, the mean plasma ChE activity was significantly reduced at 15 ppm (M: 86%; F: 61% of controls) and 45 ppm (M: 57%; F: 37% of controls) of the F0 generation. The mean RBC ChE activity was significantly depressed at 5 ppm (M: 81%; F: 53% of controls), 15 ppm (M: 31%; F: 16% of controls), and 45 ppm (M: 6%; F: 11% of controls) in the F0 generation. The mean parental brain ChE activity was also significantly reduced at 15 ppm (F: 52% of controls) and 45 ppm (M: 81%; F: 32% of controls). The mean brain ChE activity in pups was only significantly reduced at 45 ppm (54% of controls). The parental NOEL for overt toxicity was 5 ppm (F: 0.55 mg/kg/day) based on the brain ChE inhibition (52% of controls) in females. The parental NOEL for RBC ChE inhibition appears to be was less than 5 ppm. The reproductive NOEL was also 5 ppm based on the decreased viability index and pup weight. This study was considered supplemental by DPR toxicologists, supporting the conclusions in the previous study that reduction in certain reproductive parameters occurs at the same dose level that significant ChE inhibition occurs. However, it does not establish a definitive link between the reproductive effects and the maternal toxicity.
Gavage-Rabbit
Alexandria and Mansoura Universities, Egypt, 1981: Spermatogenesis was examined in a study where 20 sexually mature male Buscat rabbits were administered azinphos-methyl orally by gavage at 1.5 mg/kg/day for 12 weeks (Soliman and El-Zalabani, 1981). An additional 10 male rabbits of comparable age served as controls. There was no effect on semen volume, but there was a significant decrease (42%) in mean sperm count and a significant increase (169%) in mean percent of abnormal spermatozoa. The testes in all treated rabbits exhibited varying degrees of impaired spermatogenesis when examined histologically. The histological changes included reduced size of seminiferous tubules with "a consequent increase in intertubular fibrous tissue stroma", a decrease in the number of all germ cells, degeneration and necrosis in the seminiferous tubules. Spermatogenesis was arrested primarily at the spermatid level. The Leydig and Sertoli cells appeared normal. Due to the limited endpoints examination, and only one dose level tested, a NOEL could not be established for this supplemental study. G. DEVELOPMENTAL TOXICITY
Gavage-Mouse
Midwest Research Institute, 1978: Groups of 22-23 pregnant CD-1 mice were administered technical grade azinphos-methyl (purity not stated) in corn oil by gavage at 0, 1.25, 2.5, and 5 mg/kg/day from gestation day 6 to 15 and sacrificed on day 18 (Short et al., 1978). Cholinergic signs (salivation, urination, tremors) and death were observed in the dams at 5 mg/kg/day. The time of onset of these signs was not reported. There was no effect on litter size, incidence of resorptions, fetal body weights, external or soft tissue anomalies at any dose

46
level. A significant increase in the incidence of malaligned sternebrae was observed at 5 mg/kg/day. The average percent of fetuses per litter with malaligned sternebrae were 6.4 and 24.3 at 0 and 5 mg/kg/day, respectively. The apparent maternal and developmental NOEL was 2.5 mg/kg/day based on cholinergic signs and malaligned sternebrae, respectively. However, DPR found this study unacceptable due to major deficiencies including no individual data, purity information or analyses of dosing solutions.
U.S. EPA, 1985: Azinphos-methyl (purity not reported) was administered to 15, 20 and 40 CD-1 pregnant female mice at 0, 16 and 20 mg/kg, respectively, by gavage in corn oil on day 8 of gestation (Kavlock et al., 1985). One dam at 16 mg/kg and 21 dams at 20 mg/kg died. The mean maternal weight gain was reduced by 6 and 20% at 16 and 20 mg/kg, respectively, but was not statistically significant at either dose level. A reduction in the mean fetal weight (11%) was observed at 20 mg/kg. A significant increase in supernumerary ribs (extra ribs) was observed at both dose levels. The investigators suggested that the increase in extra ribs was not treatment-related, but rather due to a reduced maternal weight gain based on a significant inverse relationship (p < 0.001) between maternal weight gain and extra ribs when they combined data for 10 unrelated chemicals (cacodylic acid, caffeine, deltamethrin, dinoseb, ethylene bisisothiocyanate sulfide, endrin, azinphos-methyl, kepone, sodium salicylate, and toxaphene). DPR did not concur with the investigators and assumed that the extra ribs were treatment-related. Therefore, the developmental NOEL was assumed to be less than 16 mg/kg based on the extra ribs. The maternal NOEL also was less than 16 mg/kg based on one mortality and slightly reduced weight gain. This study had major deficiencies including only one day exposure and no maternal clinical signs or gross pathology data.
Gavage-Rat
Midwest Research Institute, 1978: Charles River CD rats (21 pregnant rats/dose) were administered azinphos-methyl (purity not reported) in corn oil by gavage at 0, 1.25, 2.5 or 5 mg/kg/day during gestation days 6-15 (Short et al., 1978). An additional 14-15 pregnant rats/dose were administered azinphos-methyl at the same dose levels from day 6 of gestation until the pups were weaned on day 21. Pups were sacrificed at 30 to 40 days of age. Cholinergic signs (tremors, salivation, urination) and death were observed in the dams at 5 mg/kg/day. The time of onset of these signs was not reported. A reduction in the mean maternal body weight gain and food consumption was also noted (52% and 24%, respectively, during the exposure period). There was no effect on litter size, incidence of resorptions, fetal body weight or external, visceral or skeletal anomalies. The developmental NOEL was equal to or greater than 5 mg/kg/day, the highest dose tested. The maternal NOEL was 2.5 mg/kg/day based on the cholinergic signs, reduced maternal weight gain, and reduced food consumption. This study was unacceptable to DPR due to major deficiencies including no individual data, purity information or analyses of dosing solutions.
Miles Inc., 1987: Azinphos-methyl (87.7%) was given in a 6% Emulphor emulsion by gavage to 33 pregnant Charles River Crl:CD BR rats/dose at 0, 0.5, 1.0, or 2.0 mg/kg on days 6-15 of gestation (Kowalski et al., 1987). Five rats/dose were sacrificed on day 16 of gestation and 28 on day 20. The dams exhibited no clinical signs at any dose level, although the mean plasma, erythrocyte and brain ChE activity were significantly reduced in the 2.0 mg/kg/day dams on day 16 (63%, 77%, and 61% of control activity, respectively). By day 20, only the mean brain ChE activity was still significantly reduced (73% of control activity). The brain ChE activity in the fetuses were not reduced even at 2.0 mg/kg/day. There was also no evidence for developmental toxicity at any dose. Therefore, the developmental NOEL was greater than or
47
equal to 2.0 mg/kg/day, the highest dose tested. The maternal NOEL was 1.0 mg/kg/day based on the brain ChE inhibition. DPR found this study acceptable.
Gavage-Rabbit
University of Chicago, 1966: Ten pregnant New Zealand white female rabbits/group were administered azinphos-methyl (92.7%) in the diet at 0, 5 or 25 ppm (0, 0.15 or 0.75 mg/kg/day) on days 8-16 of gestation (Doull et al., 1966). Five females/group were sacrificed on gestation day 29 and the fetuses removed, weighed, and examined for skeletal and visceral anomalies. The other 5 females in each group were allowed to deliver and nurse their pups until lactation day 30. The pups were then examined for gross pathological effects. There was no effect on the fertility index, litter size, survival of offspring, and gross pathological findings in the fetuses. The maternal and developmental NOELs appear to be equal to or greater than 25 ppm (0.75 mg/kg/day), the highest dose tested. DPR considered this study unacceptable due to numerous deficiencies including no diet analysis, inadequate group size, inadequate exposure period, body weight or food consumption data, and no individual data.
Bayer AG, 1975: Azinphos-methyl (92.4%) was administered in a 0.5% Cremophor emulsion by gavage to 9-11 pregnant female Himalayan rabbits/dose at 0, 0.3, 1 or 3 mg/kg/day on gestation days 6-18 (Machemer, 1975). There was no evidence of maternal toxicity (mortality, clinical signs, weight gain) or developmental toxicity (increased resorption, abortion, litter size, fetal weight, sex ratio, external, brain or skeletal malformations). The maternal and developmental NOEL were equal to or greater than 3 mg/kg/day, the highest dose tested. DPR found this study unacceptable due to major deficiencies including lack of maternal toxicity at the highest dose, and missing data on uterine weights, corpora lutea and resorptions. Miles Inc., 1988: A teratology study was also performed in 20 artificially inseminated female rabbits given azinphos-methyl in a 7% Emulphor emulsion by gavage at 0, 1, 2.5 or 6 mg/kg/day on days 6-18 of gestation (Clemens et al., 1988). Ataxia and tremors (onset day 16) were observed in 4 does at 6 mg/kg/day. The mean maternal plasma and red blood cell ChE activities on day 19 were significantly lower at 1.0 mg/kg/day (erythrocyte - 86% of control activity), 2.5 mg/kg/day (plasma - 87%; erythrocyte - 80% of control activity) and 6 mg/kg/day (plasma - 78%; erythrocyte - 50% of control activity). The mean maternal erythrocyte and brain ChE activity was also reduced at 6 mg/kg/day on day 28 (87% and 88% of control activity, respectively). There was a significant decrease in litter size at 6 ppm apparently due to pre- and post-implantation loss (Table 14). The median pre-implantation loss was significantly higher at 1, 2.5, and 6 mg/kg/day. However, the investigators indicated that the pre-implantation loss was within the historical control range (0-13.3%) at 1 and 2.5 mg/kg/day. There was also a slight increase in the mean post-implantation loss, but the difference was not statistically significant. The median weight of live fetuses and placentas were also significantly higher at 6 ppm, possibly due to the smaller litter size. The maternal NOEL was 2.5 based on the clinical signs and brain ChE inhibition. The developmental NOEL was also 2.5 mg/kg/day based on the increased pre- and post-implantation losses. This study was acceptable to DPR.

48
Table 14. Developmental Effects in Rabbits Exposed to Azinphos-methyla Dose Level (mg/kg/day)
0 1 2.5 6 Litter size mean 7.4 6.2 7.0 5.5 median 7.0 7.0 7.0 6.0* (range) (4-10) (1-9) (3-11) (2-8) % Pre-implantation loss mean 1.5 23.0 14.8 28.0 median 0.0 11.3** 12.5* 30.3** (range) (0-13) (0-78) (0-50) (0-60) % Post-implantation loss mean 2.4 3.0 4.3 7.2 median 0.0 0.0 0.0 0.0 (range) (0-20) (0-25) (0-29) (0-33) Median weight of live fetuses male 36.7 37.9 35.2 40.1** (grams) female 35.9 36.2 35.7 38.2 (combined) 37.1 38.2 36.1 39.4** Median weight of placentas (grams) 5.4 5.4 5.1 6.0* a Does exposed from days 6-18 of gestation *,** Significantly different from controls at p < 0.05 and 0.01, respectively, by the Kruskal Wallis test.
H. NEUROTOXICITY
ACUTE
Gavage-Hen
Bayer AG, 1974: White leghorn hens were administered a single dose of azinphos-methyl (purity not reported) at 1-250 mg/kg without delayed neurotoxic effects (Kimmerle and Löser, 1974). The NOEL for delayed neuropathy was equal to or greater than 250 mg/kg, the highest dose tested. This published report was not submitted to DPR for review.
Hazleton Laboratories, 1988: Thirty white leghorn hens were administered azinphos-methyl (85%) by gavage at 330 mg/kg with atropine (15 mg/kg) administered intramuscularly 15 minutes prior to dosing (Glaza, 1988). This treatment was repeated 21 days later. No clear evidence of delayed neuropathy was observed during the 44 day observation period. DPR found this study acceptable.
Gavage-Rat
Miles Inc., 1994: Groups of 18 Fischer 344 rats/sex/dose were evaluated for neurotoxic
effects after receiving a single dose of azinphos-methyl (92.2-92.8% purity) by oral gavage at 0, 2, 6 or 13 mg/kg for males and 0, 1, 3 or 6 mg/kg for females (Sheets, 1994). Twelve rats/sex/dose were assigned to the main study and 6 rats/sex/dose were assigned to a satellite group for ChE determination. Five males at 13 mg/kg and 15 females at 6 mg/kg died on the day of dosing. Most of these animals died before clinical observations were done. One surviving female at 6 mg/kg had oral and urine stains. Surviving males at 13 mg/kg had muscle fasciculations, tremors, gait incoordination, and oral/nasal/urine stains. No compound-related signs were observed in females at 3 mg/kg; however, males at 2 mg/kg had muscle fasciculations and oral stains. The onset of these signs was on day 0, and they were resolved by day 3. The functional observational battery (FOB) was conducted 30 minutes to 1 hour after dosing. Due to the early deaths, only 11 males and 3 females at the high-dose level were

49
available for the FOB. In the FOB on Day 0, animals of both sexes exhibited various neurobehavioral changes at the mid- and high-dose levels (Table 15). The effects in females at 3 mg/kg were not statistically significant; however, given that the majority (15/18) of females at 6 mg/kg died before the FOB could be conducted these effects were considered biologically significant. Reductions of 43% and 77% in session motor and locomotor activity, respectively, were seen in males at 13 mg/kg. Females at 6 mg/kg showed similar reductions (45% and 63%) in motor and locomotor activity. The reductions in motor and locomotor activity were not statistically significant in either sex at any dose level, due in part to the high mortality of females at 6 mg/kg and the variability in males at 6 or 13 mg/kg. The investigators suggested these reductions were biologically significant based on a general standard of 20% difference from control.
Blood and brain samples were collected for ChE measurements approximately 90 minutes after dosing. Due to the early death of all of the females in the satellite group at 6 mg/kg, no samples were collected from this group. The mean plasma and RBC ChE activity was reduced in males at all dose levels (Table 16). The mean brain ChE activity was only reduced at 6 and 13 mg/kg. In females, only the mean RBC ChE activity was reduced at all dose levels. The mean plasma and brain ChE activity were only reduced at 3 mg/kg. No dose-related macroscopic, microscopic or organ weight changes were found. The NOEL for overt neurotoxic effects was 1 mg/kg based on the effects observed in the FOB (sitting or lying in open field, reduced approach response and uncoordinated righting response) and brain ChE inhibition (49% of controls) in females. The NOEL for RBC ChE inhibition was less than 1 mg/kg in females. This study was acceptable to DPR toxicologists based on FIFRA guidelines.
SUBCHRONIC
Dietary-Rat
Miles Inc., 1995: Azinphos-methyl (92.2% purity) was fed to 18 Fischer 344 rats/sex/dose in the diet at 0, 15, 45 or 120 ppm for males (0, 0.91, 2.81 or 7.87 mg/kg/day) and at 0, 15, 45 or 90 ppm for females (0, 1.05, 3.23 or 6.99 mg/kg/day) for 13 weeks (Sheets and Hamilton, 1995). Twelve rats/sex/dose were used for neurobehavioral observation with half also undergoing neuropathological examination. The remaining 6 rats/sex/dose were used for ChE determinations only. Increased reactivity, perianal stain, red lacrimation, and oral stain were observed in males at 120 ppm and in females at 45 and 90 ppm. In addition, females at 90 ppm had uncoordinated gait and tremors. These clinical signs were observed within the first few weeks of exposure and persisted with continued exposure. The body weights and food consumption were reduced in males at 120 ppm (9-10%) and in females at 90 ppm (15-45%). The food consumption was reduced only during the first few weeks. In the FOB, perianal/urine stain was the only sign observed in males at 120 ppm and in females at 45 ppm from weeks 4 through 13 (Table 17). Urine stain, increased reactivity, decreased forelimb grip strength, impaired righting reflex, and tremors were observed in the females at 90 ppm at week 4. Only the increased reactivity, urine stain and reduced forelimb grip strength were still present at week 13. Motor and locomotor activity were significantly reduced (33-60%) in males at 120 ppm at weeks 4, 8 and 12 and in females at 90 ppm at week 4. ChE activity was significantly reduced at all dose levels for both sexes in plasma, RBC, and brain (Table 18). There was no treatment-related effect on mortalities, ophthalmic findings, macroscopic or microscopic lesions, or brain weights. The NOEL was less than 15 ppm (M: 0.91 mg/kg/day; F: 1.05 mg/kg/day) based on the plasma, RBC and brain ChE inhibition in both sexes. DPR toxicologists found this study acceptable.

50
Table 15. Neurobehavioral Changes in Rats on Day 0 After a Single Oral Dose of Azinphos-methyl by Oral Gavagea
Parameter Dose Level (mg/kg) Males 0 2 6 13 Functional Observational Battery Lacrimation 0 (0%)b 0 (0%) 3 (25%) 1 (8%) Salivation 0 (0%) 0 (0%) 4 (33%) 4 (33%) Repetitive Chewing 0 (0%) 0 (0%) 8 (67%)* 10 (83%)* Muscle Fasciculations 0 (0%) 0 (0%) 12 (100%)* 9 (75%)* Tremors 0 (0%) 0 (0%) 6 (50%)* 9 (75%)* Uncoordinated Gait 0 (0%) 0 (0%) 6 (50%)* 7 (58%)* Sitting or Lying 0 (0%) 0 (0%) 3 (25%)* 6 (50%)* Reduced Approach Response 6 (50%) 6 (50%) 11 (92%) 10 (83%) Reduced Touch Response 1 (8%) 1 (8%) 5 (42%)* 6 (50%)* Uncoordinated Righting Reflex 2 (17%) 1 (8%) 8 (67%)* 9 (75%)* Body Temperature 37.8±0.3c 37.9±0.3 36.5±0.9* 36.3±0.9* Grip Strength, Forelimb 0.83±0.07 0.82±0.08 0.71±0.18 0.57±0.31* Grip Strength, Hindlimb 0.50±0.06 0.47±0.06 0.41±0.07* 0.35±0.12*Activity Motor 176±42 208±75 112±81 100±107 Locomotor 61±13 68±26 32±21 14±13 Females 0 1 3 6 Functional Observational Battery Lacrimation 0 (0%) 0 (0%) 0 (0%) 1 (33%)* Salivation 0 (0%) 0 (0%) 0 (0%) 1 (33%)* Repetitive Chewing 0 (0%) 0 (0%) 0 (0%) 1 (33%)* Muscle Fasciculations 0 (0%) 0 (0%) 0 (0%) 1 (33%)* Tremors 0 (0%) 0 (0%) 0 (0%) 1 (33%)* Uncoordinated Gait 0 (0%) 0 (0%) 0 (0%) 1 (33%)* Sitting or Lying 0 (0%) 0 (0%) 1 (8%) 1 (33%)* Reduced Approach Response 1 (8%) 2 (17%) 5 (42%) 2 (67%) Reduced Touch Response 0 (0%) 0 (0%) 0 (0%) 1 (33%) Uncoordinated Righting Reflex 1 (8%) 1 (8%) 3 (25%) 2 (33%) Body Temperature 38.1±0.2 38.1±0.3 37.9±0.6 37.0±1.7 Grip Strength, Forelimb 0.73±0.06 0.74±0.09 0.73±0.09 0.53±0.33* Grip Strength, Hindlimb 0.36±0.06 0.34±0.05 0.37±0.08 0.32±0.06*Activity Motor 245±136 198±104 196±106 135±101 Locomotor 79±40 58±20 67±41 29±18 a Sheets, 1994 b Incidence per 12 animals, except in females at 6 mg/kg where only 3 survivors were tested; number in parentheses
represents the incidence in percentage. c Mean ± standard deviation * Significantly different from control group (p < 0.05) by analysis of contrasts for categorical data and by Dunnett’s test
for continuous data.

51
Table 16. Cholinesterase Activity in Plasma, Red Blood Cells and Brain of Rats 90 Minutes After a Single Dose of Azinphos-methyl by Oral Gavagea
Tissue Dose Level (mg/kg) Males 2 6 13 Plasma 68%b* 43%* 50%* RBCsc 67%* 33%* 37%* Brain 85% 26%* 12%* Females 1 3 6 Plasma 89% 64%* --- RBCs 83%* 35%* --- Brain 95% 49%* --- a Sheets, 1994. b Percent relative to control activity. Six animals examined per sex per dose level. c RBCs = red blood cells * Significantly different from controls (P < 0.05) by the Dunnett’s test.
Table 17. Neurobehavioral Changes in Rats at Week 4 in a Subchronic Oral Neurotoxicity
Studya
Parameter Dose Level (ppm) Males 0 15 45 120 Functional Observational Battery Stains, Perianal 0 (0%)b 0 (0%) 0 (0%) 4 (33%) Activity Motor 482±119 c 415±146 449±155 241± 81* Locomotor 178± 54 165± 63 167± 57 77± 21* Females 0 15 45 90 Functional Observational Battery Increased Reactivity 0 (0%) 0 (0%) 0 (0%) 6 (50%)* Stains, Urine 1 (8%) 1 (8%) 3 (25%) 11 (92%)* Tremors 0 (0%) 0 (0%) 0 (0%) 5 (42%)* Uncoordinated Righting Reflex 3 (25%) 1 (8%) 2 (17%) 8 (67%)* Grip Strength, Forelimb 0.63±0.09 0.63±0.07 0.65±0.08 0.47±0.06* Activity Motor 1038±410 996±332 816±256 460±170* Locomotor 384±172 375±125 335±112 154± 63* a Sheets and Hamilton, 1995 b Incidence per 12 animals; percentage affected in parentheses. c Mean ± standard deviation * Significantly different from control group (p < 0.05) by analysis of contrasts for categorical data and by Dunnett’s test
for continuous data.

52
Table 18. Cholinesterase Activity in Plasma, Red Blood Cells and Brain of Rats Fed Azinphos-methyl for 13 Weeksa
Tissue Dose Level (ppm) Males 15 45 120 Week 4 Plasma 93%b 58%* 25%* RBCsc 63%* 12%* 2%* Week 13 Plasma 85%* 56%* 31%* RBCs 63%* 16%* 5%* Brain 92%* 54%* 18%* Females 15 45 90 Week 4 Plasma 86%* 41%* 17%* RBCs 59%* 22%* 9%* Week 13 Plasma 87% 40%* 19%* RBCs 62%* 22%* 5%* Brain 84%* 28%* 15%* a Sheets and Hamilton, 1995. b Percent relative to control activity. Six animals examined per sex per dose level. c RBCs = red blood cells * Significantly different from controls (P < 0.05) by the Dunnett’s test.

53
IV. RISK ASSESSMENT A. HAZARD IDENTIFICATION Acute and Short-Term Toxicity
The adverse effects observed with the acute and short-term studies are summarized in Table 19. In general, the effects that are considered adverse include clinical signs, reductions in body weight and food consumption greater than 10%, and increases in gross and histopathological lesions. Changes in clinical chemistry and hematology values and organ weights without accompanying functional or structural changes are generally not considered adverse. In general, DPR considers brain ChE inhibition to be indicative of overt toxicity since it is one of the primary functional target sites and more subtle central neurological signs, such as memory and learning losses, may not be easily detected in animals unless they are specifically tested for these effects. The toxicological significance of plasma and RBC ChE inhibition is less certain because the physiological function of ChEs in blood have not been clearly established, although several possible physiological functions have been proposed. As mentioned in the Introduction, plasma ChE, or more specifically butyrylcholinesterase (BuChE), may be involved in the binding/metabolism of certain drugs, such as succinylcholine, which suggests that its inhibition may compromise an organism’s ability to defend against subsequent toxic insults (Lockridge and Masson, 2000). BuChE is also the predominant form of ChE in the developing nervous system of birds and mammals (Brimijoin and Koenigsberger, 1999). Due to the expression of AChE in several types of hematopoietic cell lines, it has been proposed that that circulating AChE may be important in erythropoiesis (Grisaru et al. 1999). ACh analogs and AChE inhibitors have been reported to increase platelet production in mice. U.S. EPA does not consider plasma or RBC ChE inhibition an adverse effect in itself, but does use it as a surrogate for peripheral ChE inhibition (U.S. EPA, 2000a). However, it is unclear how representative plasma or RBC ChE activity is of peripheral ChE activity. Plasma ChE is primarily BuChE which is a different enzyme than acetylcholinesterase (AChE) that is involved in neurotransmission. As a result, ChE inhibitors can have different affinities for the active sites of BuChE and AChE. The ChE in RBCs is AChE, but RBCs lack the ability to synthesize new AChE (Brimijoin, 1992). The recovery of RBC ChE activity is dependent on the replacement of RBCs, and, consequently, is much slower than in neurological and neuromuscular tissue. The Joint Meeting on Pesticide Residues of the FAO/WHO concluded only RBC ChE activity at the time of peak effect with acute exposure should be used as a surrogate for peripheral ChE activity (JMPR, 1999). In humans, where brain ChE activity is not available, statistically significant plasma or RBC ChE inhibition can be used as a regulatory endpoint.
For acute and short-term exposure, some effects observed in the developmental toxicity
studies were also included. These include maternal effects observed within the first few days of exposure and fetal effects that could be the result of one or two days of exposure, such as pre- and post-implantation losses, and skeletal and visceral malformations. Fetal effects were observed in several developmental toxicity studies for azinphos-methyl including extra ribs in fetal mice at 16 mg/kg, malaligned sternebrae in fetal rats at 5 mg/kg and embryotoxicity (increased pre- and post-implantation losses) in rabbits at 6 mg/kg (Kavlock et al., 1985; Short et al., 1978; Clemens et al., 1988). These effects were seen at doses that produced maternal toxicity, although sometimes the maternal effects were not considered acute effects based on their onset. Among the developmental toxicity studies, only one rat and one rabbit study did not have major deficiencies.
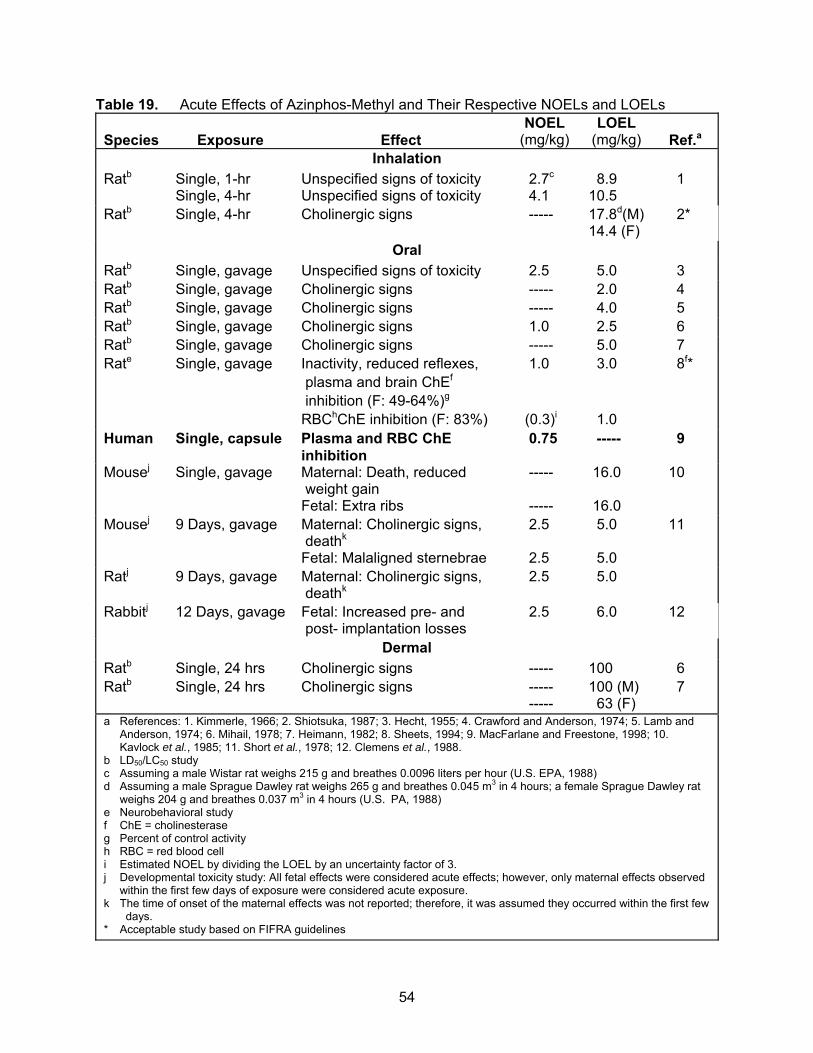
54
Table 19. Acute Effects of Azinphos-Methyl and Their Respective NOELs and LOELs Species
Exposure
Effect
NOEL (mg/kg)
LOEL (mg/kg)
Ref.a
Inhalation Ratb Single, 1-hr
Single, 4-hr Unspecified signs of toxicity Unspecified signs of toxicity
2.7c 4.1
8.9 10.5
1
Ratb Single, 4-hr Cholinergic signs ----- 17.8d(M) 14.4 (F)
2*
Oral Ratb Single, gavage Unspecified signs of toxicity 2.5 5.0 3 Ratb Single, gavage Cholinergic signs ----- 2.0 4 Ratb Single, gavage Cholinergic signs ----- 4.0 5 Ratb Single, gavage Cholinergic signs 1.0 2.5 6 Ratb Single, gavage Cholinergic signs ----- 5.0 7 Rate Single, gavage Inactivity, reduced reflexes,
plasma and brain ChEf
inhibition (F: 49-64%)g
RBChChE inhibition (F: 83%)
1.0 (0.3)i
3.0 1.0
8f*
Human Single, capsule Plasma and RBC ChE inhibition
0.75 ----- 9
Mousej Single, gavage Maternal: Death, reduced weight gain Fetal: Extra ribs
----- -----
16.0 16.0
10
Mousej 9 Days, gavage Maternal: Cholinergic signs, deathk Fetal: Malaligned sternebrae
2.5 2.5
5.0 5.0
11
Ratj 9 Days, gavage Maternal: Cholinergic signs, deathk
2.5 5.0
Rabbitj 12 Days, gavage Fetal: Increased pre- and post- implantation losses
2.5 6.0 12
Dermal Ratb Single, 24 hrs Cholinergic signs ----- 100 6 Ratb Single, 24 hrs Cholinergic signs -----
----- 100 (M) 63 (F)
7
a References: 1. Kimmerle, 1966; 2. Shiotsuka, 1987; 3. Hecht, 1955; 4. Crawford and Anderson, 1974; 5. Lamb and Anderson, 1974; 6. Mihail, 1978; 7. Heimann, 1982; 8. Sheets, 1994; 9. MacFarlane and Freestone, 1998; 10. Kavlock et al., 1985; 11. Short et al., 1978; 12. Clemens et al., 1988.
b LD50/LC50 study c Assuming a male Wistar rat weighs 215 g and breathes 0.0096 liters per hour (U.S. EPA, 1988) d Assuming a male Sprague Dawley rat weighs 265 g and breathes 0.045 m3 in 4 hours; a female Sprague Dawley rat
weighs 204 g and breathes 0.037 m3 in 4 hours (U.S. PA, 1988) e Neurobehavioral study f ChE = cholinesterase g Percent of control activity h RBC = red blood cell i Estimated NOEL by dividing the LOEL by an uncertainty factor of 3. j Developmental toxicity study: All fetal effects were considered acute effects; however, only maternal effects observed
within the first few days of exposure were considered acute exposure. k The time of onset of the maternal effects was not reported; therefore, it was assumed they occurred within the first few
days. * Acceptable study based on FIFRA guidelines

55
Cholinergic signs were the primary effects observed in adult animals in the acute studies for azinphos-methyl with the LOELs generally between 2-6 mg/kg. The lowest acute LOELs, 2.0 and 2.5 mg/kg, were observed in oral LD50 studies (Crawford and Anderson, 1974; Mihail, 1978). However, these studies, like most of the acute LD50/LC50 studies, had major deficiencies such as an inadequate description of clinical signs observed at each dose level and no individual data. A NOEL of 1 mg/kg was established for overt toxicity in an acceptable acute neurotoxicity study in rats based on effects observed in females in the functional observational battery (sitting/lying in open field, reduced approach response and uncoordinated righting response) and brain ChE inhibition (49% of controls) (Sheets, 1994). The NOEL for blood ChE inhibition in this study was less than 1 mg/kg/day, the lowest dose level tested, based on the RBC ChE inhibition (83% of controls) in females. Since the ChE inhibition at the LOEL was only 17%, the NOEL was estimated by dividing the LOEL by an uncertainty factor of 3 instead of the default uncertainty factor of 10. Therefore, the estimated NOEL for RBC ChE inhibition in this study was 0.3 mg/kg.
No statistically significant plasma or RBC ChE inhibition was observed in human volunteers given a single capsule containing azinphos-methyl at the highest dose levels tested, 0.75 and 1.0 mg/kg in females and males, respectively (MacFarlane and Freestone, 1998). No treatment-related clinical signs or symptoms were seen at any dose level. Volunteers were not subjected to any neurobehavioral or neurophysiological testing to evaluate for more subtle neurological effects in cognition or nerve conduction. However, neurological effects were only observed in the acute neurotoxicity study in rats at dose levels that resulted in significant ChE inhibition in the plasma (>30%), RBCs (>60%), and brain (>50%) (Sheets, 1994), so it seems unlikely that effects would be seen at dose levels below that which caused significant blood ChE inhibition in humans. DPR has no requirement for human testing of pesticides and there are no FIFRA guidelines for this type of study. However, the study was conducted in a double-blind manner following “Good Clinical Practices” guidelines and had an extensive informed consent form. The protocol and volunteer information was approved by an institutional review board and the study was conducted in accordance with the guidelines set out in the Declaration of Helsinki, 1964. Subjects were free to leave the study at any time and were paid in full if they left for health reasons.
Another possible deficiency with the acute human study is that they used the
Boehringer-Mannheim kit to measure ChE activity in the blood. Wilson et al. (1997) reported that this kit underestimates ChE activity because of the high substrate concentration and low pH used in this kit. However, if comparisons are made with baseline or concurrent control values using the same kit, this deficiency becomes less important since they found that the results from this kit correlated well (r=0.99) with the recommended Ellman assay conditions. Since all the ChE measurements in the MacFarlane and Freestone study were measured with the Boehringer-Mannheim kit by the same laboratory, the impact of using this kit should be minimal. Furthermore, the relative sensitivity of the ChE method used in the rat acute neurotoxicity study is uncertain since few details of the procedures were included in the study report except that it was a modification of the Ellman assay using dithionicotinic acid (DTNA) as the chromogen instead of dithiobisnitrobenzoate (DTNB) to avoid interference from hemoglobin. Wilson et al. (1996) reported comparable results in assays with DTNA (340 nm, 37°C) and DTNB (410 nm, 37°C), but they had only one run with DTNA for comparison with 7 runs with DTNB. Furthermore, it is unknown if the assay conditions in the acute neurotoxicity study were the same as those used by Wilson et al. (1996).
Another criticism of many human studies has been the small number of subjects per
treatment group. In the MacFarlane and Freestone (1998) study, there were 7

56
subjects/sex/group. In the acute neurotoxicity study, 12 rats/sex were assigned to each treatment group for behavioral observations, but the ChE activity was only measured in satellite groups containing 6 rats/sex/group. Therefore, DPR selected the single oral dose study in humans as the definitive study for evaluating acute dietary, occupational and ambient air exposure to azinphos-methyl. The critical NOEL was 0.75 mg/kg, the highest dose level tested in both sexes in which no blood ChE inhibition was observed. This human NOEL was similar to NOELs observed in the animal studies which ranged from 1 to 2.5 mg/kg and was actually higher than to the estimated NOEL of 0.3 mg/kg for RBC ChE inhibition in the acute neurotoxicity study in rats (Sheets, 1994). Taken together these data suggest that humans are not more sensitive than animals with acute exposure. The short-term occupational exposure to azinphos-methyl was expressed as a daily body burden rather than an average daily absorbed dosage. Since the body burden represents the single highest daily internal dose with repeated exposure, it was considered more appropriate to compare this exposure to an acute NOEL rather than a NOEL based on an average short-term external dose which does not reflect the accumulation or body burden of the chemical. Therefore, the critical NOEL for acute toxicity was also used to evaluate short-term occupational exposure for azinphos-methyl.
Subchronic Toxicity The effects observed in laboratory animals after subchronic exposure to azinphos-methyl are summarized in Table 20. Included in this table are four standard subchronic toxicity studies: one inhalation study with rats, two oral studies with rats and one dermal study with rabbits. Clinical signs (diarrhea, salivation, lacrimation, and muscular fasciculations) and death were observed in only one oral study at 4.7 and 9.4 mg/kg/day (Doull and Anido, 1957b). Reductions in body weights were seen in several studies (Kimmerle, 1976; Doull and Rehfuss, 1956; Doull and Anido, 1957b). The only other effect observed in these studies was a reduction in plasma, RBC and brain ChE activity. The lowest NOEL was 1.24 mg/m3 (0.32 mg/kg/day) based on the reduction in plasma and RBC ChE activity (56-85 % of control) in the inhalation study (Kimmerle, 1976). However, this study had several deficiencies including no analysis of test article, incomplete clinical chemistry and histopathology.
In addition to the standard subchronic toxicity studies, Table 20 includes several developmental toxicity studies where maternal effects were observed after repeated, daily exposure to azinphos-methyl for 1 to 2 weeks. Ataxia and tremors were observed in rabbits at 6 mg/kg/day on gestation day 16 (day 10 of exposure). Reduced body weight gains were seen in one rat study (Short et al., 1978). Plasma, RBC and brain ChE activity were reduced in a few studies where it was measured (Kowalski et al., 1987; Clemens et al., 1988). The lowest NOEL for overt toxicity in the developmental toxicity studies was 1 mg/kg/day based on reduced brain ChE activity (61% of controls) in rats (Kowalski et al., 1987). The lowest NOEL for blood ChE inhibition was less than 1 mg/kg/day based on reduced RBC ChE activity (86% of controls) in rabbits (Clemens, 1988).
Any effects observed in reproductive toxicity studies were also included in Table 20. The effects observed in the parental generations of the reproductive toxicity studies for azinphos-methyl included death, convulsions, inertia, stumbling gait, nasal discharge, inflammation around eyes, alopecia, impaired spermatogenesis, reduced body weights, reduced ChE activity in plasma, RBC and brain, and hyperemia and edema of the lungs and liver. The effects observed in pups included reduced body weights and survival. The lowest NOEL for overt toxicity in these studies was 5 ppm (F0M: 0.33 mg/kg/day; F0F: 0.48 mg/kg/day; F1BM: 0.42 mg/kg/day; F1BF: 0.67 mg/kg/day) based on reduced survival of pups (Eiben and Janda, 1984). The lowest NOEL for blood ChE inhibition was less than was 5 ppm (M: 0.43 mg/kg/day;

57
Table 20. Subchronic Effects of Azinphos-Methyl and Their Respective NOELs and LOELs NOEL LOEL
Species
Exposure
Effect (mg/kg/day)
Ref.a
Inhalation Rat 6 hrs/day, 5
days/wk, 12 wks Plasma and RBCb ChEc inhibition (56-85 %d)
0.32e 1.26 1
Oral Ratf 9 days, gavage Reduced weight gain and food
consumption 2.5 5.0 2
Ratf 9 days, gavage Plasma, RBC, and brain ChE inhibition (61-77%)
1.0 2.0 3*
Rabbitf 12 days, gavage Cholinergic signs, brain ChE inhibition (88%) Plasma ChE inhibition (87%) RBC ChE inhibition (86%)
2.5
1.0 -----
6.0
2.5 1.0
4*
Mouseg 3-gen., 4-10 wks premating, diet
Mortality and decreased lactation index
3.75 7.5 5
Ratg 2-gen., 14 wks premating, diet
Decreased viability and lactation indices
0.33 1.02 6*
Ratg 1-gen., 14 wks premating, diet
Plasma and brain ChE inhibition (52-86%), decreased viability index RBC ChE inhibition (53-81%)
0.43
-----
1.30
0.43
7
Rabbit 12 weeks, gavage Impaired spermatogenesis ----- 1.5 8 Rat 16 weeks, diet Plasma, RBC, and brain ChE
inhibition (60-91%) and decreased weight gain
0.5 1.9 9
Rat 16 weeks, diet Cholinergic signs, reduced weight gain, plasma, RBC and brain ChE inhibition (25-52%)
----- 4.7 10
Rat 13 weeks, diet Plasma, RBC and brain ChE inhibition (59-92%)
(0.09)h 0.91 11*
Human 30 days, capsule Plasma and RBC ChE inhibition 0.29 ----- 12 Human 28-days, capsule Plasma and RBC ChE inhibition 0.25 ----- 13
Dermal Rabbit 6 hrs/day, 5
days/wk, 3 wks RBC ChE inhibition (60-77%) 2 20 14
a References: 1. Kimmerle, 1976; 2. Short et al., 1978; 3. Kowalski et al., 1987; 4. Clemens, 1988; 5. Root et al., 1965; 6. Eiben and Janda, 1984; 7. Holzum, 1990; 8. Soliman and El-Zalabani, 1981; 9. Doull and Rehfuss, 1956; 10. Doull and Anido, 1957b; 11. Sheets and Hamilton, 1995; 12. Rider et al., 1972; 13. MacFarlane and Freestone, 1999; 14. Flucke and Schilde, 1980.
b RBC = red blood cell c ChE = cholinesterase d Percent of control activity e Estimated assuming a Wistar rat weighs 235 g and breathes 0.05 m3 in 6 hours (U.S. EPA, 1988). f Developmental toxicity study: Only maternal effects observed after the first few days were included. g Reproductive toxicity study h Estimated NOEL by dividing the LOEL by a default uncertainty factor of 10. * Acceptable study based on FIFRA guidelines
58
F: 0.55 mg/kg/day) based on reduced RBC ChE activity (53-81% of controls) in adult rats (Holzum, 1990).
One 90-day subchronic neurotoxicity study in rats was available for azinphos-methyl (Sheets and Hamilton, 1995). Tremors, uncoordinated gait, increased reactivity, perianal stain, red lacrimation and oral stain were observed in both sexes at 2.81 mg/kg/day or higher. Reductions in body weight and food consumption were seen in both sexes at 6.99 mg/kg/day or higher. In the FOB, perianal stain, increased reactivity, decreased forelimb grip strength, impaired righting reflex, and tremor were seen primarily in females at 2.81 mg/kg/day or higher. Motor and locomotor activities were significantly reduced in both sexes at 6.99 mg/kg/day or higher. Reduced plasma, RBC and brain ChE activities (62-92% of controls) were the most sensitive endpoints with a LOEL of 15 ppm (M: 0.91 mg/kg/day;1.05 mg/kg/day in females) in both sexes. The NOEL was estimated to be 0.09 mg/kg/day for the this study by dividing the LOEL by the default uncertainty factor of 10.
Two subchronic toxicity studies were available in which human volunteers were administered azinphos-methyl in capsules for 28-30 days. In a study conducted by Rider et al. (1972), no effect on clinical signs, hematology, prothrombin time, and urinalysis were observed. No plasma ChE inhibition was observed at doses up to 20 mg/day (~0.29 mg/kg/day). Erratic RBC ChE inhibition was seen at 20 mg/day, but the investigators did not feel this was sufficient to be considered an adverse effect. This study was not considered very useful for risk assessment purposes since only limited information was available with no summary tables or individual data.
In a more recent study conducted by MacFarlane and Freestone (1999), no treatment-related changes in vital signs, EKG, hematology, clinical chemistry or adverse reactions were seen. There was also no significant decrease in the mean relative (to baseline) plasma or RBC ChE activity in the treatment group (0.25 mg/kg/day) when compared to the relative (to baseline) activity in the placebo group. DPR has no requirement for human testing of pesticides and there are no FIFRA guidelines for this type of study. However, the study was conducted in a double-blind manner following “Good Clinical Practices” guidelines. The protocol and volunteer information was approved by an institutional review board and the study was conducted in accordance with the guidelines set out in the Declaration of Helsinki, 1964. Subjects were free to leave the study at any time and were paid in full if they left for health reasons. This study only evaluated a limited number of parameters: plasma and RBC ChE inhibition, adverse reactions, vital signs, EKG, hematology and clinical chemistry. The subchronic neurotoxicity studies in rats indicate that neurological effects were only observed at dose levels that resulted in significant ChE inhibition in the plasma (>55%), RBCs (>75%), and brain (>70%) (Sheets and Hamilton, 1995), so it seems unlikely that effects would be seen at dose levels below that which caused significant blood ChE inhibition in humans.
Since the same investigators conducted the single dose and the 28-day human studies, some of the minor concerns mentioned in the discussion of the acute study also apply to the 28-day study, including ChE methodology and the group size. The Boehringer-Mannheim kit was used to measure ChE activity in the human studies; however, the limitations of this methodology are minor when comparisons are made with ChE activity measured by the same method. The acute and subchronic neurotoxicity studies in rats were also conducted by the same investigators, so the uncertainties about the sensitivity of ChE methodology used in the acute neurotoxicity study also apply to the subchronic neurotoxicity study. Only 8 subjects were used in the treatment group in the 28-day human study. In the 90-day neurotoxicity study, 12 rats/sex were assigned to each group for behavioral observations, but the ChE activity was only

59
measured in satellite groups containing 6 rats/sex. There are several additional concerns with regard to the 28-day human study. One concern was the small number of control subjects. This was not considered a major deficiency since the preferable comparisons for ChE activity in adults would be with their baseline value, rather than control subject values. Another concern was whether this exposure period was adequate to evaluate seasonal exposure that occurs over several months. Data presented in the Exposure Assessment section indicate that azinphos-methyl reaches a steady state in humans after about two weeks with repeated exposure. Therefore, the level of ChE inhibition would not be expected to change significantly after two weeks. The ChE inhibition data from the subchronic neurotoxicity study in rats supports this conclusion since the level of plasma and RBC ChE inhibition were similar at week 4 and 13. The main concern with the 28-day human study conducted by MacFarlane and Freestone (1999) was the lack of female subjects. Since the acute and subchronic neurotoxicity studies for azinphos-methyl indicate that female rats are slightly more sensitive based on both ChE inhibition and neurological signs, it is possible that female humans might also be more sensitive. The lack of female subjects can be addressed in the risk appraisal section in terms of recommending a larger uncertainty factor for intraspecies variation. Therefore, the 28-day study in humans was selected as the definitive study for evaluating seasonal occupational and ambient air exposure to azinphos-methyl with a critical NOEL of 0.25 mg/kg/day. The NOEL is this study is similar to the NOEL of 0.29 mg/kg/day for the 30-day human study conducted by Rider et al. (1972). It is also higher than the estimated NOEL of 0.09 mg/kg/day for plasma, RBC and brain ChE inhibition in the subchronic neurotoxicity study in rats (Sheets and Hamilton, 1995). As with the acute studies, the subchronic studies suggest that humans are not more sensitive than animals to azinphos-methyl with repeated exposure.
Chronic Toxicity
The effects observed in laboratory animals with chronic exposure to azinphos-methyl are summarized in Table 21. Clinical signs were observed at the higher dose levels in many of the chronic studies including rough hair coat, hyperactivity, convulsions, tremors, exophthalmos (which progressed to unilateral or bilateral blindness), muscular weakness, inactivity, abnormal sitting posterior, diarrhea, mucus in feces, alopecia, and jaundice (1 dog) (NCI, 1978; Schmidt and Chevalier, 1984; Lorke, 1966b; Allen, 1990). Reduced body weights were seen in several studies (NCI, 1978; Schmidt and Chevalier, 1984, Lorke, 1966b). Only a few histopathological lesions were seen including cystic endometrial hyperplasia in one mouse study and cholangitis in one dog (NCI, 1978; Lorke, 1966b). The cholangitis was not considered treatment-related by the investigator because no other hepatic abnormalities, except occasional focus of cellular infiltration, were observed in the other dogs in that study. Plasma, RBC and brain ChE inhibition were the most sensitive endpoints in the chronic studies when they were measured. The lowest established NOEL for overt toxicity in a chronic study was 0.15g/kg/day based on diarrhea in male dogs fed azinphos-methyl in the diet for 1 years (Allen, 1990). The NOEL for RBC ChE inhibition in this study was also 0.15 mg/kg/day. Therefore, the 1-year dog study conducted by Allen (1990) was selected as the definitive study for evaluating chronic dietary, occupational and ambient air exposure to azinphos-methyl with a critical NOEL of 0.15 mg/kg/day for diarrhea and RBC ChE inhibition.
Oncogenicity - Weight of Evidence
There was evidence suggesting that azinphos-methyl is oncogenic in two of five oncogenicity studies. There was an increase (19/50 or 38%) in the combined incidence of hepatocellular adenomas and carcinomas in males at the highest dose tested in a mouse study conducted by NCI (NCI, 1978). Interpretation of the findings from the NCI study is difficult

60
Table 21. Chronic Effects of Azinphos-Methyl and Their Respective NOELs and LOELs NOEL LOEL
Species
Exposure
Effect (mg/kg/day) Ref.a
Mouse 80 weeks, diet Hyperactivity, rough hair coat, cystic endometrial hyperplasia
----- 5.4 1
Mouse 104 weeks, diet Plasma, RBCb, and brain ChEc inhibition (78-94%d)
----- 0.79 2*
Rat 97 weeks, diet Convulsions, RBC and brain ChE inhibition (51-81%) Plasma ChE inhibition (82-90%)
0.78
0.21
3.01
0.78
3
Rat 80 weeks, diet Reduced body weights ----- 5.7 1 Rat 104 weeks, diet Plasma, RBC and brain ChE
inhibition (65-86%) 0.25
0.75 4*
Dog 2 years, diet Mortality, cholinergic signs, reduced body weight and food consumption Plasma and RBC ChE inhibition (71-84%)
1.27
0.17
4.25
1.27
5
Dog 52 weeks, diet Diarrhea, RBC ChE inhibition (65-73%)
0.15 0.69 6*
a References: 1. NCI, 1978; 2. Hayes, 1985; 3. Lorke, 1966a; 4. Schmidt and Chevalier, 1984; 5. Lorke, 1966b; 6. Allen, 1990.
b RBC = red blood cell c ChE = cholinesterase d Percent of control activity * Acceptable study based on FIFRA guidelines
because of an inadequate number of concurrent controls (ten mice/sex). The size of the concurrent control group severely reduced the statistical power to detect an increase in tumors. Due to the inadequate number of concurrent controls, the investigators pooled together the control animals from a number of other mouse oncogenicity studies that were currently being conducted at this laboratory for statistical analysis. The increase in liver tumors was statistically significant when compared with pooled controls (30/128 or 23%); however, the investigators did not consider the increase treatment-related since similar high incidences had been observed in other male mice control groups for this same laboratory. No historical control data for these tumors was provided by the investigators, but Ward et al. (1979) reported the percent of hepatocellular adenomas and carcinomas to be 7.9 and 13.7%, respectively, in untreated B6C3F1 control mice in NCI studies conducted between 1972 and 1977. Nevertheless, there is no scientific consensus on the use of historical control data in evaluating the toxicological significance of tumor increases in treated animals. No increase in liver tumors or any other tumors was seen in another oncogenicity study with CD1 mice which met FIFRA guidelines (Hayes, 1985). The highest dose level in the Hayes study was approximately two-fold lower than the NCI study, but was sufficient to produce a marked reduction in brain ChE activity to approximately 35% of controls. The dose levels in the NCI study may have exceeded criteria for a maximum tolerated dose (MTD) since convulsions were observed at the high dose level during the second year of the study.
In a rat oncogenicity study conducted by NCI, there were increases in tumors of the pituitary, pancreas, thyroid, parathyroid and adrenal glands in males, but the increases were only significant when compared to pooled controls (NCI, 1978). Like the NCI mouse study, the NCI rat study also had an inadequate number of concurrent controls (10 rats/sex) which made

61
interpretation of the findings difficult. Comparison with pooled controls is problematic because the same pathologist did not review the pooled controls and the azinphos-methyl study animals. Furthermore, the toxicological significance of the increase in the pituitary and parathyroid tumors is uncertain since the incidence in the concurrent controls was greater than the pooled controls. The investigators also concluded that the increase in pancreatic and thyroid tumors was not clearly treatment-related because they fell within the historical control range for this laboratory. These data suggest that azinphos-methyl may be oncogenic through some sort of endocrine disruption; however, a mechanism is not known and no increase in endocrine tumors was seen in two other chronic rat studies, one of which was acceptable based on FIFRA guidelines (Lorke, 1966a; Schmidt and Chevalier, 1984). Several factors may have contributed to the different response in the NCI study compared to the other rat studies including higher dose levels and a different strain of rat. The high dose level in the NCI study was approximately 3-fold higher than the high dose level in the other two rats studies. However, the high dose level in the other two rat studies was high enough to produce significant brain ChE inhibition (45-81% of controls) and, therefore, satisfy the criteria for a MTD. On the other hand, the high dose level in the NCI study may have been exceeded the MTD since cholinergic signs were observed, including tremors and exophthalmos which progressed to unilateral or bilateral blindness. Perhaps the excessive cholinergic stimulation in the NCI study was sufficient to cause endocrine disruption.
Azinphos-methyl appears to be genotoxic based on positive results in several in vitro assays including a mouse lymphoma assay, four cytogenetic assays using human cells or cell lines or a hamster cell line, and a micronucleus assay with human lymphocytes (Garret et al., 1986; Herbold, 1989; Alam et al., 1974; Alam and Kasatiya, 1976; Trépanier et al., 1977; Bianchi-Santamaria et al., 1997). However, all the in vivo assays were negative including a Drosophila sex-linked recessive lethal assay, a cytogenetic assay in mice, two micronucleus assays in mice, a sister chromatid exchange assay in mudminnows, and four dominant lethal assays in mice. Most of the reverse mutation assays with Salmonella typhimurium were also negative except for an equivocal response with the TA100 strain in one study and a weak positive response with the TA98 strain in another study (Lawlor, 1987; Zeiger et al., 1987). The weak positive response was only observed at concentrations where precipitation occurred, confounding the results. All of the other gene mutation assays and miscellaneous genotoxicity tests were negative, except for positive results in a forward mutation assay with Schizosaccharomyces pombe ade6 (Gilot-Delhalle et al., 1983), a mitotic recombination assay with Saccharomyces cerevisiae D3 (Riccio et al., 1981), a reverse mutation/gene conversion assay with S. cerevisiae D7 (Bianchi et al., 1994), a gene conversion/cross-over/non-disjunction assay with Aspergillus nidulans D7 (Vallini et al., 1983), and a 32P-postlabeling assay of adducts in calf thymus DNA (Shah et al., 1997).
In analyzing the structural activity relationship of 301 chemicals tested under the U.S. NTP program, Ashby and Tennant (1991) considered chemicals containing an alkyl phosphate ester, such as azinphos-methyl, to be potential alkylating agents. However, they recognized the potential problem alkyl phosphate esters pose in predicting carcinogenicity since 6 of 15 alkyl phosphate esters examined were non-carcinogens and 3 were equivocal carcinogens. Furthermore, 3 alkyl phosphate esters that were considered carcinogens were negative for the Salmonella assay. Ashby and Tennant (1991) classified azinphos-methyl as an equivocal carcinogen based on the carcinogenicity study from NCI (1978). They also classified azinphos-methyl as positive for the Salmonella assay based on data reported by Zeiger et al. (1987) despite the confounding of the results due to the presence of precipitation. They did recommend confirming the mutagenic potential of these alkyl phosphate esters with a chemical
62
alkylating test. The metabolite, benzazimide, did not contain any structural alerts identified by Ashby and Tennant (1991).
The available genotoxicity data for the structurally similar pesticide, azinphos-ethyl, also suggests that it is genotoxic. Azinphos-ethyl was mutagenic in a reverse mutation assay with Salmonella typhimurium TA100 strain without metabolic activation, but only weakly mutagenic with activation (Diril et al., 1990). It was not mutagenic with the TA98 strain. Azinphos-ethyl was positive in an in vitro micronucleus assay with Chinese hamster lung cells, but negative in an in vivo micronucleus assay in mice (Ni et al., 1993). Azinphos-ethyl was also negative for cytogenetic effects in bone marrow cells and spermatogonia from mice exposed in vivo and in a dominant lethal assay in mice (Degraeve et al., 1986). Degraeve et al. (1986) noted that the high toxicity of azinphos-methyl and azinphos-ethyl may be a limiting factor in demonstrating a cytogenetic effect in vivo. Another explanation for the lack of concordance in response between the in vivo and in vitro cytogenetic assays may be that azinphos-methyl and azinphos-ethyl are quickly metabolized in vivo before they can exert any genotoxic effect. No genotoxicity data was available for the metabolite, benzazimide.
In summary, the weight of evidence for oncogenicity is limited for azinphos-methyl. There was an increase in endocrine tumors in several sites in one sex and one strain of rats. There was also an increase in a common tumor (hepatocellular adenomas and carcinomas) in one sex (males) of one strain of mice. However, the findings in both of these studies were compromised by an inadequate number of concurrent controls. The increases in these tumors were only statistically significant when compared with pooled controls. Similar increases in these tumors were not seen in other rat and mouse oncogenicity studies which met FIFRA guidelines. Azinphos-methyl was genotoxic in a number of in vitro assays, but not in any in vivo assays. Therefore, DPR toxicologists concluded that this limited evidence was insufficient to warrant further evaluation of the oncogenic potential of azinphos-methyl. The U.S. EPA has classified azinphos-methyl as a Group E carcinogen (i.e., no evidence of carcinogenicity in at least two adequate animal tests in different species or in both adequate epidemiological and animal studies) (Eiden, 1999). In their toxicological evaluation of azinphos-methyl, the Joint Meeting on Pesticide Residues of WHO/FAO concluded that azinphos-methyl had no carcinogenic potential in either rats or mice based on the studies conducted by Hayes (1985) and Schmidt and Chevalier (1984) (JMPR, 1991). In their judgement, these newer studies clarified equivocal evidence in rats in the NCI study. Furthermore, they concluded it was unlikely that azinphos-methyl is genotoxic to humans. B. EXPOSURE ASSESSMENT Occupational Exposure Assessment
The estimated potential daily exposure to azinphos-methyl for handlers is summarized in Table 22. A more detailed discussion of worker exposure is presented in the revised exposure assessment by Formoli and Fong (2001). The exposure estimates for mixer/loader/applicators are based on two studies in which different types of applicators were compared and different types of personal protective equipment (PPE) were compared (Franklin et al., 1981; Schneider et al., 1987). In both studies, the applicators also did mixing and loading. A closed system was used for mixing in the study conducted by Schneider et al. (1987). It was assumed that a closed system was also used in the study conducted by Franklin et al. (1981), although it is not certain. Normalizing exposure for the maximum application rate, the estimated absorbed daily dosages (ADDs) for mixer/loader/applicators ranged from 22.6 to 44.0 µg/kg/day. There was no
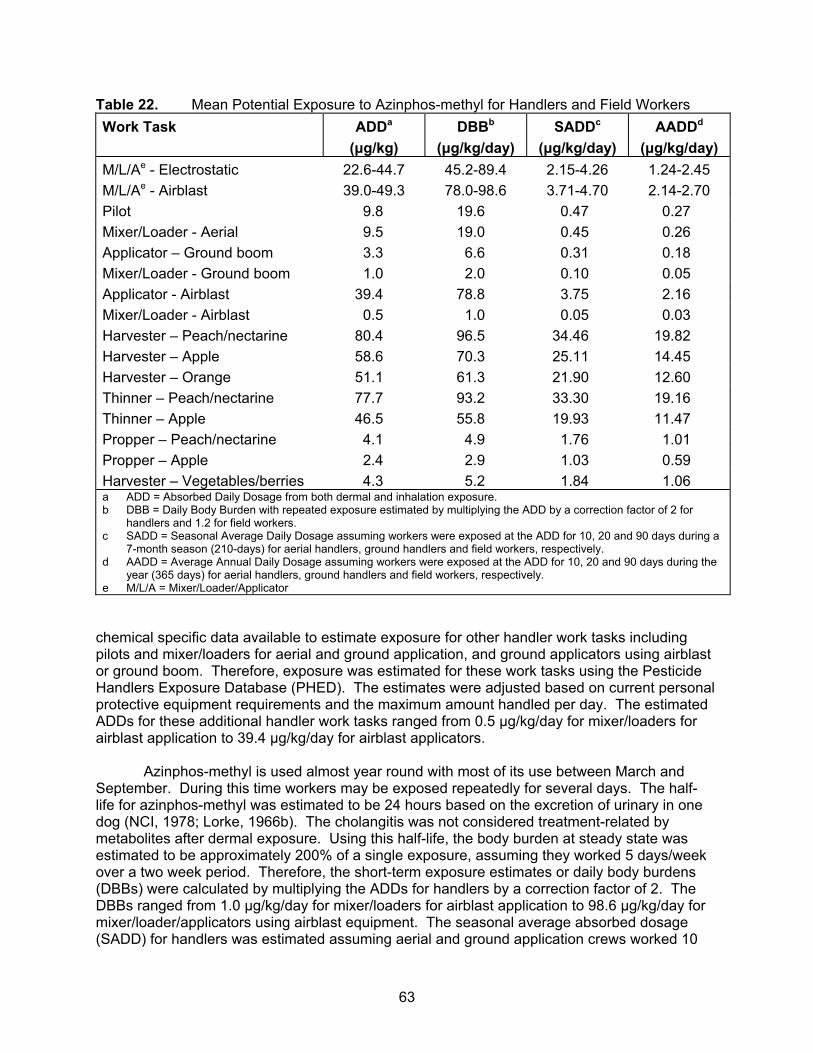
63
Table 22. Mean Potential Exposure to Azinphos-methyl for Handlers and Field Workers Work Task ADDa
(μg/kg) DBBb
(μg/kg/day) SADDc
(μg/kg/day) AADDd
(μg/kg/day) M/L/Ae - Electrostatic 22.6-44.7 45.2-89.4 2.15-4.26 1.24-2.45 M/L/Ae - Airblast 39.0-49.3 78.0-98.6 3.71-4.70 2.14-2.70 Pilot 9.8 19.6 0.47 0.27 Mixer/Loader - Aerial 9.5 19.0 0.45 0.26 Applicator – Ground boom 3.3 6.6 0.31 0.18 Mixer/Loader - Ground boom 1.0 2.0 0.10 0.05 Applicator - Airblast 39.4 78.8 3.75 2.16 Mixer/Loader - Airblast 0.5 1.0 0.05 0.03 Harvester – Peach/nectarine 80.4 96.5 34.46 19.82 Harvester – Apple 58.6 70.3 25.11 14.45 Harvester – Orange 51.1 61.3 21.90 12.60 Thinner – Peach/nectarine 77.7 93.2 33.30 19.16 Thinner – Apple 46.5 55.8 19.93 11.47 Propper – Peach/nectarine 4.1 4.9 1.76 1.01 Propper – Apple 2.4 2.9 1.03 0.59 Harvester – Vegetables/berries 4.3 5.2 1.84 1.06 a ADD = Absorbed Daily Dosage from both dermal and inhalation exposure. b DBB = Daily Body Burden with repeated exposure estimated by multiplying the ADD by a correction factor of 2 for
handlers and 1.2 for field workers. c SADD = Seasonal Average Daily Dosage assuming workers were exposed at the ADD for 10, 20 and 90 days during a
7-month season (210-days) for aerial handlers, ground handlers and field workers, respectively. d AADD = Average Annual Daily Dosage assuming workers were exposed at the ADD for 10, 20 and 90 days during the
year (365 days) for aerial handlers, ground handlers and field workers, respectively. e M/L/A = Mixer/Loader/Applicator
chemical specific data available to estimate exposure for other handler work tasks including pilots and mixer/loaders for aerial and ground application, and ground applicators using airblast or ground boom. Therefore, exposure was estimated for these work tasks using the Pesticide Handlers Exposure Database (PHED). The estimates were adjusted based on current personal protective equipment requirements and the maximum amount handled per day. The estimated ADDs for these additional handler work tasks ranged from 0.5 μg/kg/day for mixer/loaders for airblast application to 39.4 μg/kg/day for airblast applicators.
Azinphos-methyl is used almost year round with most of its use between March and
September. During this time workers may be exposed repeatedly for several days. The half- life for azinphos-methyl was estimated to be 24 hours based on the excretion of urinary in one dog (NCI, 1978; Lorke, 1966b). The cholangitis was not considered treatment-related by metabolites after dermal exposure. Using this half-life, the body burden at steady state was estimated to be approximately 200% of a single exposure, assuming they worked 5 days/week over a two week period. Therefore, the short-term exposure estimates or daily body burdens (DBBs) were calculated by multiplying the ADDs for handlers by a correction factor of 2. The DBBs ranged from 1.0 μg/kg/day for mixer/loaders for airblast application to 98.6 μg/kg/day for mixer/loader/applicators using airblast equipment. The seasonal average absorbed dosage (SADD) for handlers was estimated assuming aerial and ground application crews worked 10

64
and 20 days, respectively, during a 7-month use season. The SADDs for handlers ranged from 0.05 μg/kg/day for mixer/loaders for airblast application to 4.70 μg/kg/day for mixer/loader/-applicators using airblast equipment. The annual average daily dosages (AADDs) were estimated assuming aerial and ground application crews worked 10 and 20 days, respectively, during a year (365 days). The AADDs ranged from 0.03 µg/kg/day for mixer/loaders for airblast application to 2.70 μg/kg/day for mixer/loader/applicators using airblast equipment.
The estimated daily exposure for field workers is also summarized in Table 22. Exposure estimates were limited to a few tree, vegetable and berry crops for which dislodgeable foliar residue (DFR) data and transfer factors were available. DFRs are obtained by rinsing leaf discs taken from the fields when workers are performing various tasks. Transfer factors are estimated by dividing residues on skin and clothing by the DFRs. The DFRs came from studies conducted by the Worker Health and Safety Branch of DPR and studies submitted by the registrants. The arithmetic mean of the DFRs from all the sources was used to estimate exposure. The transfer factors were obtained from published reports and studies conducted by the Worker Health and Safety Branch. The ADDs were lowest for proppers (workers who prop up heavy, fruit laden branches) and vegetable and berry harvesters, ranging from 2.4 to 4.3 µg/kg/day. The ADDs for thinners and harvesters of tree crops were much higher ranging from 46.5 to 80.4 µg/kg/day. Exposure was highest for thinners and harvesters of peaches and nectarines. The transfer factors used for field workers were based on biological monitoring after several days of exposure where the body burden was theoretically 83% of the maximum body burden at steady state. Consequently, the DBBs for field workers were estimated by multiplying the ADDs by a correction factor of only 1.2. The DBBs for field workers ranged from 2.9 μg/kg/day for apple proppers to 96.5 μg/kg/day for peach and nectarine harvesters. Assuming field workers are exposed 90 days during a 7-month season, the SADDs for field workers ranged from 1.03 μg/kg/day for apple proppers to 34.46 μg/kg/day for peach and nectarine harvesters. The AADDs ranged from 0.59 to 1.06 μg/kg/day for proppers and vegetable and berry harvesters and from 11.47 to 19.28 µg/kg/day for thinners and harvesters of tree crops.
Dietary Exposure Assessment
DPR evaluates the risk of human exposure to an active ingredient in the diet using two processes: (1) use of residue levels detected in foods to evaluate the risk from total exposure, and (2) use of tolerance levels to evaluate the risk from exposure to individual commodities (see Section VI. Tolerance Assessment of this document). For evaluation of risk to detected residue levels, the total exposure in the diet is determined for all label-approved raw agricultural commodities, processed forms, and animal products (meat and milk) that have established U.S. EPA tolerances. The potential exposure from residues in the water and certain commodities without tolerances are also assessed in some cases. Tolerances may be established for the parent compound and associated metabolites. DPR considers these metabolites and other degradation products that may be of toxicological concern in the dietary assessment.
Residue Data
The sources of residue data for dietary exposure assessment include DPR and federal monitoring programs, field trials, and survey studies. In absence of data, surrogate data from the same crop group as defined by U.S. EPA or theoretical residues equal to U.S. EPA tolerances are used. Residue levels that exceed established tolerances are not utilized in the dietary exposure assessment because over-tolerance incidents are investigated by DPR Pesticide Enforcement Branch and are relatively infrequent. DPR evaluates the potential risk

65
from consuming commodities with residues over tolerance levels using an expedited acute risk assessment process.
DPR had two major sampling programs: priority pesticide and marketplace surveillance.
The priority pesticide program focuses on pesticides of health concern as determined by DPR Enforcement and Medical Toxicology branches. Samples are collected from fields known to have been treated with the specific pesticides. For the marketplace surveillance program, samples are collected at the wholesale and retail outlets, and at the point of entry for imported foods. The sampling strategies for both priority pesticide and marketplace surveillance are similar and are weighted toward such factors as pattern of pesticide use; relative number and volume of pesticides typically used to produce a commodity; relative dietary importance of the commodity; past monitoring results; and extent of local pesticide use.
The U.S. Food and Drug Administration (FDA) has three programs for examining residues in food: (1) regulatory monitoring, (2) total diet study, and (3) incidence/level monitoring. For regulatory monitoring, surveillance samples are collected from individual lots of domestic and imported foods at the source of production or at the wholesale level. In contrast to the regulatory monitoring program, the total diet study monitors residue levels in the form that a commodity is commonly eaten or found in prepared meal. The incidence/level monitoring program is designed to address specific concerns about pesticide residues in particular foods.
The U.S. Department of Agriculture (USDA) is responsible for the Pesticide Data Program (PDP), a nationwide cooperative monitoring program. The PDP is designed to collect objective, comprehensive pesticide residue data for risk assessments. Several states, including California, collect samples at produce markets and chain store distribution centers close to the consumer level. The pesticide and produce combinations are selected based on the toxicity of the pesticide as well as the need for residue data to determine exposure. In addition, USDA is responsible for the National Residue Program that provides data for potential pesticide residues in meat and poultry. These residues in farm animals can occur from direct application, or consumption of commodities or by-products in their feed.
Primary Residues
Most of the residue values for RACs came from DPR's marketplace surveillance program from 1996-1999 (DPR, 2001). When available, USDA PDP California residue data from 1995-98 was used instead since the limit of detection (LOD) was usually lower, the RACs were peeled or trimmed as normally consumed and single serving samples were analyzed for a few RACs. The LODs for the DPR marketplace surveillance data ranged from 0.02 to 0.1 ppm, depending on the commodity and variation between runs. The default LOD value for DPR residue data when not reported was 0.05 ppm based on the average reported LOD values for azinphos-methyl. The LODs for the PDP residue data ranged from 0.008 to 0.020 ppm, depending on the commodity. The residue values used from the DPR and PDP data are summarized in Table 23. For most RACs, the acute value was either the highest measured residue level at or below the tolerance for a commodity or the 95th percentile, if there were 99 or more samples for a commodity. Certain processed foods were considered blended foods because they are mixed before being consumed. Processed foods that were considered blended include juice, seeds, grains, oil, dried potatoes, catsup, tomato paste, and tomato puree. For blended foods, the average residue level was used for the acute residue value, assuming the samples with non-detectable residues had residues equal to the LOD. The chronic residue value was the average residue level, assuming that the residue in the non-detectable samples was ½ the LOD. Other assumptions that were used in estimating both the

66
Table 23. Residues in Raw Agricultural Commodities from DPR and USDA PDP Monitoring Programsa
Raw Agricultural Commodity
Monitoring Program
Program Years
No. of Samples
Acute Valuea
Chronic Valueb
Almonds DPR 96-99 314 0.050c 0.025c Applesd PDP 95-96 279 0.148* 0.046 Apple Juice PDP 97-98 349 0.014* 0.005 Beans, Succulent PDP 97-98 285 0.008c 0.004c Blueberries DPR 96-99 33 0.470 0.045 Broccoli DPR 96-99 503 0.050c 0.025c Brussel Sprouts DPR 96-99 166 0.050c 0.025c Cabbage, Green or Red DPR 96-99 445 0.050c 0.025c Caneberriese DPR 96-99 86 0.080 0.032 Cantaloupes PDP 98 110 0.008 0.004 Cauliflower DPR 96-99 229 0.131* 0.051 Celery DPR 96-99 302 0.151* 0.052 Cherriesd DPR 96-99 99 0.211* 0.049 Cucumbers DPR 96-99 624 0.049* 0.011 Eggplant DPR 96-99 318 0.091* 0.038 Grapefruit DPR 96-99 290 0.171* 0.052 Grapes PDP 95-96 311 0.027* 0.0095 Grape Juice PDP 98 115 0.008c 0.004c Lemons DPR 96-99 192 0.257* 0.019 Limes DPR 96-99 184 0.072* 0.026 Onions, Dry DPR 96-99 286 0.050c 0.025c Onions, Green DPR 96-99 502 0.072* 0.011 Oranges PDP 96 119 0.020c 0.010c Orange Juice PDP 97 182 0.008c 0.004c Peachesd PDP 96-97 273 0.607* 0.089 Pearsd,f PDP 98 197 0.297* 0.054 Peppers, Chili DPR 96-99 782 0.187* 0.037 Peppers, Sweet DPR 96-99 1229 0.169* 0.034 Plumsd DPR 96-99 307 0.050c 0.025c Pomegranates DPR 96-99 46 0.050c 0.025c Potatoes PDP 95 216 0.020c 0.010c Spinach, Fresh PDP 96-97 254 0.023* 0.006 Spinach, Canned PDP 98 175 0.008c 0.004c Strawberries PDP 98 610 0.020c 0.010c Tomatoesd PDP 98 197 0.013* 0.0045 a The high value is the highest residue level detected in any sample, except when there were 99 or more samples. In
these cases (which are indicated by *), the high value is the 95th percentile of all the residues, assuming limit of detection (LOD) for the samples with no detectable residues. The LODs for DPR monitoring data ranged from 0.02 to 0.1 ppm (default is 0.05 ppm). The LODs for PDP monitoring data varied from 0.008 to 0.02 ppm
b The chronic value is the mean where the samples with non-detectable residues are set at ½ of the LOD. c There were no-detectable residues, so the acute value was set at the LOD and the chronic value at ½ the LOD. d The acute mean value was used for juice, grains, dried potatoes, catsup, tomato puree, tomato paste, oil, and
seeds. The acute mean was 0.046, 0.101, 0.076, 0.015, 0.055, and 0.0083 ppm for apples, celery, cherries, peaches, pears, and tomatoes, respectively. When there were no detectable residues, the LOD was used for the acute mean.
e Caneberries = blackberries, boysenberries, dewberries, loganberries, and raspberries. f PDP measured residues in both composite (197) and single serving samples (91) of pears in 1998. Since the
composite values for both 95th percentile and average were higher in the composite, these values were used.

67
acute and chronic dietary exposure include: a) the residue level does not change over time, b) residue concentrations are not decreased when the RAC is washed, and c) processing of raw agricultural commodity residue level that may be multiplied by an adjustment factor.
For some commodities that had only a few samples analyzed during this time period,
residues from a surrogate crop were used instead. DPR residue data for all caneberries was used for blackberries, boysenberries, dewberries, loganberries, and raspberries. PDP residues from apples were substituted for crabapples and quinces. PDP residue data for peaches was used as a surrogate for nectarines. PDP whole orange data was substituted for citrus citron, kumquats, tangelos and tangerines. PDP orange juice data was used as a surrogate for grapefruit, lemon, lime, and tangerine juice. DPR green onion data was substituted for shallots and leeks. DPR chili pepper data was used for paprika and other pepper residues. PDP grape juice data was a surrogate for grape wine and sherry. For a few commodities (cottonseed oil and meal, cranberries, filberts, cane sugar and molasses) where no residue monitoring data were available, residue data from field trials conducted by the registrant were used instead (Chemagro Corp., 1963 & 1967; Grace, 1990; Loeffler, 1964; U.S. EPA, 1999). In general, azinphos-methyl had been applied at or above the maximum application rate in these studies and the commodity was harvested at or before the specified pre-harvest interval. However, in the residue study for processed cottonseed commodities the application rate was 5 times greater than the maximum seasonal rate (Graces, 1990). The assumption was made that the residues in cottonseed were directly proportional to the amount and number of applications; therefore, the residues found in cottonseed oil and meal were divided by 5 for the dietary exposure assessment. Only one sample was analyzed for some of these commodities, including cottonseed oil and meal, so the same residue levels (0.10 and 0.05 ppm, respectively) were used for both acute and chronic exposure. In the other field trials for filberts and processed cane sugar commodities, no residues were detected, so the LOD (0.10 ppm) was used for acute value and ½ the LOD was used for chronic value. Field trial data for filberts were also used as a surrogate for pecans, walnuts (including oil), and pistachio nuts. For one commodity, parsley, there was no reasonable surrogate, so the U.S. EPA tolerance was used for the acute value and ½ the tolerance level was used for the chronic value.
Residue data were often not available for dried commodities or fruit juices. When no
residue data were available, the residues in the dried commodities or juice were estimated from the fresh commodity by multiplying by the default adjustment factors for processed commodities that account for the loss of water. If the adjusted residue level in the dried commodity was higher than the tolerance for the RAC, the residue level was set at the tolerance level otherwise it would be considered illegal. This only occurred with dried pears; therefore, the residue level for the dried pears was set at the tolerance level for acute exposure. This was not a problem with chronic exposure because the average residue value for pears was not greater than the tolerance after multiplying by the adjustment factor for dried pears.
In 2000, U.S. EPA revoked the tolerances for a number of commodities for which there
were no registered uses (U.S. EPA, 2000b). These commodities included apricots, artichokes, barley (grain and straw), beans (dry), gooseberries, pasture grass (green and hay), kiwi fruit, oats (grain and straw), black-eyed peas, rye (grain and straw), soybeans (including oil), wheat (grain and straw), and pomegranates. The tolerance for nectarines was also revoked because it is covered by the tolerance for peaches. The tolerance for sugarcane bagasse was revoked because it was not considered a significant livestock feed item. The tolerance for dried citrus pulp was revoked because processing studies indicate that residues do not concentrate in dried citrus pulp. They also revoked 13 meat and milk tolerances since there was no reasonable expectation of finite residues of azinphos-methyl in these commodities. These meat and milk
68
tolerances include cattle (fat, meat byproducts, meat), goat (fat, meat byproducts, meat), horse (fat, meat byproducts, meat), sheep (fat, meat byproducts, meat), and milk. At the same time, U.S. EPA lowered the following tolerances for several other commodities: apples, crabapples, pears and quinces (2.0 → 1.5 ppm), cranberries (2.0 → 0.5 ppm), grapes (5.0 → 4.0 ppm), almonds (meats) and potatoes (0.3 → 0.2 ppm) and almond hulls (10.3 → 5.0 ppm).
In its Interim Reregistration Eligibility Document (IRED), U.S. EPA announced that it is canceling immediately 28 uses of azinphos-methyl because of minimal economic benefits, use on only a small percentage of the crop and/or alternative pesticides readily available (U.S. EPA, 2001a). These uses include alfalfa, beans, birdsfoot trefoil, broccoli, cabbage, caneberries (foliar application only), cauliflower, citrus, celery, clover, cucumbers, eggplant, filberts, grapes, melons, nectarines, nursery stock (other than quarantine use), green onions, dry onions, parsley, pecans, peppers, plums (including dried plums), potatoes, quince, spinach, strawberries, tomatoes. U.S. EPA identified seven other uses for which the economic benefits were considered moderately high, but they did not outweigh the risks. U.S. EPA also cancelled these uses with a four-year phase out period. These uses include almonds, cherries (tart), cotton, cranberries, peaches, pistachios, and walnuts. The eight remaining uses were considered to have significant economic benefit, there are no adequate substitutes and the benefits outweigh the risks provided mitigation measures and other provisions specified in the IRED are adopted. These uses were given a 4-year time-limited registration. Commodities with the 4-year phase-out and the 4-year time-limited tolerance were included in this dietary exposure assessment since residues can be anticipated in these commodities for at least the next four years.
Consumption Database and Dietary Exposure Software
The United States Department of Agriculture (USDA) directs the Continuing Survey of Food Intakes by Individuals (CSFII). The purpose of the CSFII is to analyze food intake every few years to provide up-to-date information on the adequacy of the diets of various population groups and early indications of dietary changes. Individual intake data are collected using both a 1-day recall and a 2-day record protocol. The most recent CSFII survey data, collected from January 1994 to February 1997 (referred to as 1994-96) and from December 1997 to December 1998 (referred to as 1998), were used in this dietary exposure assessment. The surveys were conducted in all months of the year. In each year, approximately 5,500 participants in 62 geographical areas were surveyed. The 1994-96 data included all population subgroups, including 4,253 children, ages 0 to 9 years old. The 1998 CSFII data included an additional 5,559 children of the same age to increase the database for dietary patterns of infants and children in response to the Food Quality Protection Act of 1996.
The acute and chronic dietary exposure analyses were conducted using the Dietary Exposure Evaluation Model (DEEM™, version 7.74) software program developed by Novigen Sciences, Inc. DEEM calculates acute and chronic exposure estimates for 18 different population subgroups, including nursing or non-nursing infants less than 1 year old, children ages 1-6 years old or 7-12 years old, pregnant or nursing women, and seniors 55 years and older. The Acute Analysis program also allows for calculation of exposure for custom populations, such as workers, ages 16 years and older. The Acute Analysis program estimates the distribution of exposure per user-day (i.e., the percentile exposure for only individuals that consume at least one commodity on which the pesticide of concern is used on that survey day). The Acute Analysis estimates exposure either using a deterministic approach (i.e., a single residue value or point estimate for each commodity) or a probabilistic approach (i.e., Monte Carlo method where residue and consumption values are randomly selected from different

69
distribution curves for each commodity). Since the probabilistic approach is more time consuming, it is only used if the margins of exposure are inadequate using the deterministic approach and/or there is sufficient residue data to describe the distributions. The Chronic Analysis estimates the annual average exposure per capita using the average residue values. The residue values for both acute and chronic exposure can be adjusted by percent crop treated; however, DPR generally only adjusts the acute values if the Monte Carlo method is used. DPR did adjust the chronic residue values for percent crop treated in this dietary exposure assessment based on the values used by U.S. EPA in their most recent dietary exposure assessment (U.S. EPA, 1999). Critical commodity contributions were calculated for both the acute and chronic exposure analysis to determine which commodities were contributing the most to exposure.
Exposure Estimates
Based on point estimates and the 95th percentile of user-day exposure for all specific population subgroups, the potential acute (daily) dietary exposure of azinphos-methyl from all labeled uses ranged from 0.64 to 3.94 μg/kg/day (Table 24, Appendix A). Nursing infants less than one year old had the highest potential acute dietary exposure. The commodities contributing to more than 5% of the total acute exposure in this population subgroup were apples (41%), pears (30%), and peaches (19%) (Appendix A). Since the margins of exposure were adequate for all population subgroups, no further refinement with probabilistic modeling was done. The mean potential chronic (annual) dietary exposure for all population subgroups ranged from 0.05 to 0.25 μg/kg/day (Table 24, Appendix B). The population subgroup with the highest potential chronic exposure was non-nursing infants less than one year old. The commodities contributing to more than 5% of the total chronic exposure in this population subgroup were apples (30%), pears (24%), sugar cane (19%), peaches (9%), and parsley (6%) (Appendix B). Ambient and Offsite Air Exposure Assessment Offsite Air Exposure Acute exposure to azinphos-methyl in offsite (application site) air was estimated from air monitoring conducted by the Air Resources Board (ARB) for 5 days following an application to a walnut orchard in Glenn county in July 1994 (Formoli, 2003). Acute exposure was estimated based on the highest residue detected in air samples during one hour of application and approximately 1.5 hours immediately after application (2.2 μg/m3 after correction for recovery). Air samples collected after this time were all below the detection limit (0.08 μg/m3). The ADDs were 170, 80 and 80 ng/kg for children, adult males and adult females, respectively, assuming a 2.5 hour exposure period and 100% respiratory uptake (Table 25). The air concentration during the rest of the 24-hour period was assumed to be same as the ambient air at the site with the highest air concentration. Ambient Air Exposure
Ambient air monitoring data was collected by Seiber et al. (1988) at five rural sites (Pond, two sites in McFarland, Wasco, and Shafter) and one urban site (Bakersfield) in Kern county during June and July of 1987 (Formoli, 2003). The Pond Site represents a worst case exposure scenario because the air sampler was located less than 100 meters from almond orchards to the east, south and west. The distance from orchards at other sites was less than 400 meters. Twenty-four hour air samples were collected 4 days per week for approximately

70
Table 24. Potential Acute (Daily) and Chronic (Annual) Dietary Exposures to Azinphos-methyl
Exposure Dosage (μg/kg/day)
Population Subgroup
Acutea Chronicb U.S. Population - All Seasons 1.00 0.07 Western Region 1.13 0.08 Nursing Infants (< 1 yr) 3.94 0.12 Non-nursing Infants (< 1 yr) 3.75 0.25 Children (1-6 yrs) 2.36 0.20 Children (7-12 yrs) 1.28 0.11 Females (13+ yrs/pregnant/not nursing) 0.76 0.07 Females (13+ yrs/nursing) 0.69 0.06 Females (13-19 yrs/not pregnant or nursing) 0.64 0.06 Females (20+ yrs/not pregnant or nursing) 0.71 0.05 Males (13-19 yrs) 0.73 0.06 Males (20+ yrs) 0.67 0.05 Seniors (55+ yrs) 0.78 0.05 Workers (16+ yrs) 0.68 NA a Based on 95th exposure percentile for each user-day population subgroups. b Based on the annual average daily dosage for each population subgroups. NA Not available. The DEEM program does not calculate an exposure estimate for customized population subgroups,
such as, workers 16 years and older. Table 25. Estimated Exposure for the General Public to Azinphos-methyl in Offsite and
Ambient Air Population Subgroup Child Adult male Adult female
Offsitea
ADDb (ng/kg) 170 80 80 Ambientc
ADD (ng/kg) 61.3 23.1 15.7 SADDd (ng/kg/day) 11.4 5.1 4.7 AADDe (ng/kg/day) 4.7 2.1 1.9 a Offsite exposure dosages based on air concentrations in study by ARB (1995) in Glenn County. b ADD = Absorbed Daily Dosage using the 95th percentile of the air concentrations. Respiratory uptake
and absorption was assumed to be 100%. For more explanation of the calculations, see Part B, Exposure Assessment, in Evaluation of Azinphos-methyl as a Toxic Air Contaminant.
c Ambient exposure dosages based on air concentrations at the Pond site in a study in Kern County by Seiber et al. (1988).
d SADD = Seasonal Average Daily Dosage using on the mean air concentration at the Pond site during the monitoring period.
e AADD = Annual Average Daily Dosage assuming the season of potential exposure is 5 months of the year.
71
one month. The minimum detection limit ranged from 15 to 43 ng/m3 depending on the airflow. As expected, the Pond site had the highest average and 95th percentile air concentrations for azinphos-methyl during this monitoring time (26 and 83 ng/m3, respectively). Therefore, the risk estimates were initially calculated using the exposure estimates from the Pond site, assuming that if they were acceptable at this location, they would be acceptable at the other five locations in Kern County where the air concentrations were lower. The ADDs for the Pond site were 61.3, 23.1, and 15.7 ng/kg/day for a 6-year-old child, an adult male and, an adult female, respectively, using the 95th percentile and 100% respiratory uptake and absorption. The SADDs were estimated to be 11.4, 5.1. and 4.7 ng/kg/day for children, adult males and adult females, respectively, using the mean ambient air concentration at the Pond site during the one month monitoring period. The AADD is the average air concentration for a year assuming the season of potential exposure is 5 months per year for azinphos-methyl. The AADDs for the Pond site were 4.7, 2.1 and 1.9 ng/kg/day for children, adult males and adult females, respectively. Aggregate Exposure Assessment
Agricultural Workers
The aggregate exposure to azinphos-methyl through occupation, diet and residential air (offsite and ambient air) was considered in the potential exposure for pesticide handlers and field workers. The potential acute dietary exposure to azinphos-methyl for agricultural workers was estimated to be 0.68 µg/kg based on the 95th percentile of user-day exposure for males and females 16 years and older. The short-term dietary exposure was assumed to be the same as the acute dietary exposure. For acute and short-term residential air exposure, the exposure estimate for adults in offsite air (80 ng/kg) was selected for aggregate exposure because it was higher than for ambient air (25.7-23.1 ng/kg). The offsite air exposure estimate was adjusted to 53 ng/kg, assuming a maximum exposure of 16 hours per day to residential air for agricultural workers. The contribution of the residential air exposure to the aggregate exposure was less than 1% for most agricultural workers due to their high occupational (mostly dermal) exposure. The highest contribution from residential air was 4% for airblast mixer/loaders who had the lowest occupational exposure. Consequently, its addition will not quantitatively impact the aggregate exposure. Therefore, only the occupational and dietary exposure were considered in the aggregate exposure for agricultural workers. The aggregate occupational and dietary exposures are summarized in Tables 26. The acute aggregate exposure for handlers ranged from 1.2 μg/kg/day for mixer/loaders for airblast application to 50.0 μg/kg/day for mixer/loader/applicators using airblast equipment. For field workers, the acute aggregate exposure estimates ranged from 3.1 μg/kg/day for apple proppers to 81.1 µg/kg/day for peach and nectarine harvesters. The short-term aggregate exposure for handlers ranged from 1.7 μg/kg/day for mixer/loaders for airblast application to 99.3 μg/kg/day for mixer/loader/-applicators using airblast equipment. For field workers, the short-term aggregate exposure estimates ranged from 3.6 μg/kg/day for apple proppers to 97.2 μg/kg/day for peach and nectarine harvesters.
The potential chronic dietary exposure to azinphos-methyl for agricultural workers was estimated to be 0.07 µg/kg/day using the average annual consumption for the U.S. population. The potential seasonal dietary exposure was assumed to be the same as the chronic dietary exposure since there was only minor seasonal variation (0.067 to 0.077 mg/kg/day) for the U.S. population according to the DEEM chronic analysis for azinphos-methyl. The seasonal aggregate exposure for handlers ranged from 0.12 μg/kg/day for mixer/loaders for airblast application to 4.77 μg/kg/day for mixer/loader/applicators using airblast equipment. For field workers, the seasonal aggregate exposure was between 1.10 μg/kg/day for apple proppers

72
Table 26. Aggregate Exposure to Azinphos-methyl for Agricultural Workers Work Task Acutea
(µg/kg) Short-termb
(μg/kg/day) Seasonalc
(μg/kg/day) Chronicd
(μg/kg/day) M/L/Ae - Electrostatic 23.3-45.4 45.9-90.1 2.22-4.33 1.31-2.52 M/L/Ae - Airblast 39.7-50.0 78.7-99.3 3.78-4.77 2.21-2.77 Pilot 10.5 20.3 0.54 0.34 Mixer/Loader - Aerial 10.2 19.7 0.52 0.33 Applicator – Ground boom 4.0 7.3 0.38 0.25 Mixer/Loader - Ground boom 1.7 2.7 0.17 0.12 Applicator - Airblast 40.1 79.5 3.82 2.23 Mixer/Loader - Airblast 1.2 1.7 0.12 0.10 Harvester – Peach/nectarine 81.1 97.2 34.53 19.89 Harvester – Apple 59.3 71.0 25.18 14.52 Harvester – Orange 51.8 62.0 21.97 12.67 Thinner – Peach/nectarine 78.4 93.9 33.37 19.23 Thinner – Apple 47.2 56.5 20.00 11.54 Propper – Peach/nectarine 4.8 5.6 1.83 1.08 Propper – Apple 3.1 3.6 1.10 0.66 Harvester – Vegetables/berries 5.0 5.9 1.91 1.13 a Estimated using the ADDs from Table 22 and an acute dietary exposure of 0.68 μg/kg/day. b Estimated using the DBBs from Table 22 and assuming that the short-term dietary exposure is same as the acute
dietary exposure, 0.68 μg/kg/day. c Estimated using the SADDs from Table 22 and assuming that the seasonal dietary exposure is the same as chronic
dietary exposure, 0.07 μg/kg/day. d Estimated using the AADDs from Table 22 and a chronic dietary exposure of 0.07 μg/kg/day. e M/L/A = Mixer/Loader/Applicator
to 34.53 μg/kg/day for peach and nectarine harvesters. The chronic aggregate exposure for handlers ranged from 0.10 to 2.77 µg/kg/day. The chronic aggregate exposure for field workers ranged from 0.66 µg/kg/day for apple proppers to 19.89 μg/kg/day for peach and nectarine harvesters. The potential dietary contribution to the total exposure for workers was variable depending on the magnitude of their potential occupational exposure. The dietary contribution was greatest among airblast mixer/loaders whose occupational exposure was lowest (41-70% of total exposure). The potential dietary contribution was lowest (0.2-2.5% of total exposure) among agricultural workers whose occupational exposure was high, such as mixer/loader/applicators using either airblast or electrostatic equipment, airblast applicators, and tree crop thinners and harvesters. General Public
The aggregate exposure to azinphos-methyl through the diet and residential air was considered in the potential exposure for the general public. The estimated acute dietary exposure to azinphos-methyl was assumed to be 3.94, 0.73 and 0.76 μg/kg/day for children (nursing infants < 1 year old – infant/child population with highest dietary exposure), adult males (13 –19 years old – adult male population with highest dietary exposure), and females adults (nursing, 13 years and older – adult female population with the highest dietary exposure), respectively (Table 24). The estimated chronic dietary exposure was assumed to be 0.25, 0.06

73
and 0.07 μg/kg/day for children, adult males and adult females, respectively (Table 24). The offsite air exposure from Table 25 was used for the residential air exposure in the acute aggregate exposure for children, adult males and adult females. The ambient air exposure from Table 25 was used for the residential air exposure in the seasonal and chronic aggregate exposure estimates. Unlike with workers, the residential air exposure for the general public was assumed to be 24 hours, so there was no adjustment in the offsite and ambient air exposure estimates. The contribution of residential air exposure to the acute aggregate exposure for the general public was considered minor since it represented only 4 to 10% of the total exposure. The residential air exposure represented only 2 to 8% of seasonal or chronic aggregate exposure for the general public. Consequently, there was no further analysis of the aggregate exposure for the general public. C. RISK CHARACTERIZATION The risk for non-oncogenic human health effects is expressed as a margin of exposure (MOE). The MOE is the ratio of the NOEL from human or animal studies to the human exposure dosage.
Occupational Exposure
The MOEs for acute occupational exposure were calculated using the ADDs from Table
22 for the exposure dosage and the acute NOEL from the human study (0.75 mg/kg). The MOEs for occupational exposure for handlers and field workers are summarized in Table 27. Among handlers, mixer/loader/applicators had the lowest MOEs for acute, short-term, seasonal and chronic exposure. Mixer/loaders for airblast application consistently had the highest MOEs among handlers for all exposure durations. The acute MOEs for handlers ranged from 15 for using airblast equipment to 1500 for mixer/loaders for airblast application. Among field workers, proppers and vegetable and berry harvesters consistently had the highest MOEs for acute, short-term, seasonal and chronic exposure. On the other hand, peach and nectarine harvesters and thinners had the lowest MOEs regardless of the exposure duration. The acute MOEs ranged from 9 for peach and nectarine harvesters to 310 for apples proppers.
The MOEs for short-term, repeated exposure were calculated using the acute NOEL
from the human study and the DBBs from Table 22 for the exposure dosage. The short-term MOEs were slightly lower than the acute MOEs ranging from 8 to 750 for handlers and fieldworkers.
The MOEs for seasonal exposure were calculated using the SADDs in Table 22 and the subchronic NOEL from the 28-day repeated oral dosing study in male humans (0.25 mg/kg/day). The seasonal MOEs for handlers were similar in magnitude to their acute MOEs ranging from 59 to 5000. Field workers had lower seasonal MOEs (7 to 240) due the greater number of days of exposure per season (90 days versus 10 or 20 days).
The MOEs for chronic exposure were calculated using the chronic NOEL from the 1-year
dog study (0.15 mg/kg/day) and the AADDs from Table 22. The chronic MOEs were nearly three-fold larger than the seasonal MOEs, ranging from 56 to 5000 for handlers and from 8 to 250 for field workers.
Dosage ExposureNOEL
Exposure of Margin =

74
Table 27. Estimated Margins of Exposure for Potential Occupational Exposure to Azinphos-methyl for Handlers and Field Workersa
Work Task Acute Short-term Seasonal Chronic M/L/Ab - Electrostatic 17-33 8-17 59-120 60-120 M/L/Ab - Airblast 15-19 8-10 53-67 56-70 Pilot 77 38 530 560 Mixer/Loader - Aerial 79 39 560 580 Applicator – Ground boom 230 110 810 830 Mixer/Loader - Ground boom 750 370 2500 3000 Applicator - Airblast 19 10 67 69 Mixer/Loader - Airblast 1500 750 5000 5000 Harvester – Peach/nectarine 9 8 7 8 Harvester – Apple 13 11 10 10 Harvester – Orange 15 12 11 12 Thinner – Peach/nectarine 10 8 8 8 Thinner – Apple 16 13 13 13 Propper – Peach/nectarine 180 150 140 150 Propper – Apple 310 260 240 250 Harvester – Vegetables/berries 170 140 140 140 a Margin of Exposure = NOEL / Exposure Dosage. Acute and short-term NOEL = 0.75 mg/kg (humans, plasma and
RBC ChE inhibition). Seasonal NOEL = 0.25 mg/kg/day (humans, plasma and RBC ChE inhibition). Chronic NOEL = 0.15 mg/kg/day (dogs, diarrhea and RBC ChE inhibition). Exposure dosages from Table 22. Values rounded to two significant figures.
b M/L/A = Mixer/Loader/Applicator
Dietary Exposure
For dietary exposure alone, the MOEs were calculated for the various population subgroups using the acute NOEL from the human study (0.75 mg/kg/day) and the acute (daily) dietary exposure dosages from Table 24. The MOEs for acute toxicity ranged from 190 for nursing infants less than one year old to 1200 for non-pregnant or nursing females, 13-19 years old (Table 28). The MOEs for chronic dietary exposure to azinphos-methyl were calculated for the various population subgroups using the chronic NOEL from the 1-year dog study (0.15 mg/kg/day) and the chronic (annual) dietary exposure dosages (Table 24). The MOEs ranged from 600 for non-nursing infants less than one year old to 3,100 for females, 20 years and older (Table 28).
Ambient and Offsite Air Exposure
The MOEs for acute exposure to azinphos-methyl were calculated using the acute NOEL from the human acute toxicity study (0.75 mg/kg/day for plasma and RBC ChE inhibition) and the ADDs for offsite and ambient air in Table 25. The MOEs for offsite air ranged from 4,400 for children to 9,400 for both male and female adults (Table 29). The acute MOEs for ambient air ranged from 12,000 for children to 48,000 in adult females. The MOEs for seasonal exposure to azinphos-methyl were calculated using the NOEL from the 28-day repeated dose human study (0.25 mg/kg/day for plasma and RBC ChE inhibition) and the SADDs for ambient air at the Pond site from Table 25. The seasonal MOEs ranged from 22,000 for children to

75
Table 28. Estimated Margins of Exposure for Potential Dietary Exposure to Azinphos-methyl for Selected Population Subgroupsa
Margin of Exposure Population Subgroup Acute Chronic U.S. Population 750 2,000 Western Region 660 1,900 Nursing Infants (<1 yr old) 190 1,200 Non-Nursing Infants (<1 yr old) 200 600 Children (1-6 yrs) 320 730 Children (7-12) 580 1,400 Females (13+ yrs/pregnant/not nursing) 990 2,200 Females (13+ yrs/nursing) 1,100 2,700 Females (13-19 yrs/not pregnant/not nursing) 1,200 2,600 Females (20+ yrs/not pregnant/not nursing) 1,100 3,100 Males (13-19 yrs) 1,000 2,400 Males (20+ yrs) 1,100 2,900 Seniors (55+ yrs) 960 2,900 Workers (16+ yrs) 1,100 NA a Margin of Exposure = NOEL / Exposure Dosage. Acute NOEL = 0.75 mg/kg (humans, blood ChE inhibition).
Chronic NOEL = 0.15 mg/kg/day (dogs, diarrhea and RBC ChE inhibition). Exposure dosages from Table 24. Values rounded to two significant figures.
NA Not available. The TAS Exposure-1TM does not calculate an exposure estimated for customized population subgroups, such as, workers 16 years and older.
53,000 for adult females (Table 29). The MOEs for chronic exposure to azinphos-methyl were calculated using the chronic NOEL of 0.15 mg/kg/day in dogs based on diarrhea and RBC ChE inhibition and the AADDs for ambient air at the Pond site from Table 25. The MOEs for chronic exposure to azinphos-methyl in ambient air ranged from 32,000 for children to 79,000 for adult females (Table 29).
Aggregate Exposure Since the MOEs for offsite and ambient air (residential air) were all greater than 1,000 and it’s contribution to the aggregate exposure for agricultural workers was less than 10%, it was not included in the aggregate exposure. Residential air exposure also contributed 10% or less to the aggregate exposure for the general public; consequently, no aggregate MOEs were calculated for the general public since the only other exposure was dietary. The acute aggregate MOEs for agricultural workers were calculated using the acute exposure dosages in Table 26 and the acute NOEL from the human study (0.75 mg/kg). The acute aggregate MOEs were only slightly lower than the occupational MOEs, ranging from 9 to 620 (Table 30). The reductions in MOEs were most dramatic in workers whose occupational exposure were the lowest (e.g., mixer/loaders, proppers). The MOEs for short-term aggregate exposure was calculated using the short-term exposure dosages from Table 26 and the acute NOEL from the human study. The short-term aggregate MOEs for agricultural workers were also slightly lower, ranging from 8 to 440 (Table 30). The MOEs for seasonal aggregate exposure were calculated using the seasonal exposure dosages in Table 26 and the subchronic NOEL from the 28-day repeated oral dosing study in humans (0.25 mg/kg/day). The seasonal

76
Table 29. Estimated Margins of Exposure for Potential Offsite and Ambient Air Exposure to Azinphos-methyl for the General Publica
NOEL (mg/kg) (species: endpoints) Child Adult Male Adult Female
Offsite Acute 4,400 9,400 9,400 Ambient Acute 12,000 32,000 48,000 Seasonal 22,000 49,000 53,000 Chronic 32,000 71,000 79,000 a Margin of Exposure = NOEL / Exposure Dosage. Acute and short-term NOEL = 0.75 mg/kg (humans, plasma and
RBC ChE inhibition). Seasonal NOEL = 0.25 mg/kg/day (humans, plasma and RBC ChE inhibition). Chronic NOEL = 0.15 mg/kg/day (dogs, diarrhea and RBC ChE inhibition). Exposure dosages are from Table 22. Values rounded to two significant figures.
aggregate MOEs for agricultural workers ranged from 7 to 2100 (Table 30). The MOEs for chronic aggregate exposure were calculated using the chronic exposure dosages in Table 26 and the chronic NOEL from the 1-year dog study (0.15 mg/kg/day). The chronic aggregate MOEs for agricultural workers ranged from 8 to 1500 (Table 30). Table 30. Estimated Margins of Exposure for Potential Aggregate Exposure to Azinphos-
methyl for Agricultural Workersa
Work Task Acute Short-term Seasonal Chronic M/L/Ab - Electrostatic 17-32 8-16 58-110 60-110 M/L/Ab - Airblast 15-19 8-10 52-66 54-68 Pilot 71 37 460 440 Mixer/Loader - Aerial 74 38 480 450 Applicator – Ground boom 190 100 660 600 Mixer/Loader - Ground boom 440 280 1500 1200 Applicator - Airblast 19 9 65 67 Mixer/Loader - Airblast 620 440 2100 1500 Harvester – Peach/nectarine 9 8 7 8 Harvester – Apple 13 11 10 10 Harvester – Orange 14 12 11 12 Thinner – Peach/nectarine 10 8 7 8 Thinner – Apple 16 13 13 13 Propper – Peach/nectarine 160 130 140 140 Propper – Apple 240 210 230 230 Harvester – Vegetables/berries 150 130 130 130 a Margin of Exposure = NOEL / Exposure Dosage. Acute and short-term NOEL = 0.75 mg/kg (humans, plasma and
RBC ChE inhibition). Seasonal NOEL = 0.25 mg/kg/day (humans, plasma and RBC ChE inhibition). Chronic NOEL = 0.15 mg/kg/day (dogs, diarrhea and RBC ChE inhibition). Exposure dosages from Table 25. Values rounded to two significant figures.
b M/L/A = Mixer/Loader/Applicator

77
V. RISK APPRAISAL
Introduction
Risk assessment is the process used to evaluate the potential for human exposure and the likelihood that the adverse effects observed in toxicity studies with laboratory animals will occur in humans under the specific exposure conditions. Every risk assessment has inherent limitations on the application of existing data to estimate the potential risk to human health. Therefore, certain assumptions and extrapolations are incorporated into the hazard identification, dose-response assessment, and exposure assessment processes. This, in turn, results in uncertainty in the risk characterization which integrates all the information from the previous three processes. Qualitatively, risk assessments for all chemicals have similar uncertainties. However, the degree or magnitude of the uncertainty can vary depending on the availability and quality of the data, and the types of exposure scenarios being assessed. Specific areas of uncertainty associated with this risk assessment for azinphos-methyl are delineated in the following discussion. Hazard Identification
The most sensitive endpoint with acute, subchronic and chronic exposure to azinphos-methyl was ChE inhibition. Although the physiological role of AChE in the nervous system is well known, there is some uncertainty regarding the toxicological significance of brain ChE inhibition because of the poor correlation between the severity of cholinergic signs and the level of ChE inhibition in the brain (U.S. EPA, 1988b). Several factors probably contribute to the poor correlation. One of these factors is that ChE inhibitors produce different degrees of inhibition in the various regions of the brain (Nieminen et al., 1990). Certain cholinergic signs may be due to inhibition in specific regions of the brain. The level of brain ChE inhibition required to produce these effects may not be representative if the activity is measured in the whole brain or regions of the brain that are insensitive to ChE inhibitors. Another factor is that some cholinergic signs may be due to peripheral rather than central inhibition of AChE (Murphy, 1986). For example, some of the respiratory effects may be due to peripheral inhibition of AChE in the diaphragm resulting in paralysis. In addition, brain ChE activity is usually measured at the end of the study whereas the cholinergic signs may be observed at various time points during the study. Often cholinergic signs are observed only at the beginning of the study and then the animals appear to develop a "tolerance" to the ChE inhibitor. This adaptation or "tolerance" may be due to several possible mechanisms including down-regulation of post-synaptic receptors (Costa et al., 1982). Finally, clinical observation in animal studies is a very crude and subjective measurement. Some mild cholinergic symptoms, such as headaches and anxiety, cannot readily be detected in animals. The clinical signs in animals can also be missed because of the timing of the observations, especially with reversible ChE inhibitors. Rodents are nocturnal and generally eat and drink at night. If a chemical is a reversible inhibitor, some of the cholinergic signs could be missed because the signs occurred shortly after the animals had eaten during the night. There may also be other subtle changes in neurological function that will only be detected if the animal is stressed or required to perform certain tasks (Nagymajtényi et al., 1988; Raffaele and Rees, 1990). It is possible that some level of brain ChE inhibition can occur without any untoward effect on neurological function, overt or subtle. However, the only way to be certain of this is through rigorous behavioral and neurophysiological testing in animals or humans after acute and long-term exposure. Although some neurobehavioral testing was conducted (FOB and motor activity) with acute and subchronic exposure to azinphos-methyl, no tests for memory or learning deficits were performed. Nor were there any tests for subtle neurological effects with chronic exposure to azinphos-methyl. Therefore, the assumption was

78
made that since there was a statistically significant inhibition of brain ChE inhibition, there was probably some deleterious effect to the neurological system.
The most thorough investigation of the neurological effects in laboratory animals after acute exposure to azinphos-methyl was an acute neurotoxicity study in rats (Sheets, 1994). The NOEL for overt toxicity in this study was 1 mg/kg based on effects observed in a FOB (sitting or lying in open field, reduced approach response and uncoordinated righting response) and brain ChE inhibition (49% of controls) in females. Both of these endpoints are of uncertain toxicological significance. As mentioned above, the brain ChE inhibition was assumed to be toxicologically significant because of the lack of testing for learning and memory deficits. The performance in the FOB is also uncertain because the differences were not statistically significant, but they were assumed to be toxicologically significant because only 3 of 18 female survived at 6 mg/kg. Therefore, it is possible the NOEL is higher than assumed. However, the LOEL of 3 mg/kg in this study was similar to the LOELs observed in two rat LD50 studies, 2.0 and 2.5 mg/kg (Crawford and Anderson, 1974; Mihail, 1978).
A NOEL was not observed for blood ChE inhibition in the acute neurotoxicity study in
rats based on a slight reduction of RBC ChE activity in females (83% of controls) at the lowest dose level, 1 mg/kg/day. The LOEL appears to be very close to the NOEL given that the reduction in RBC ChE activity was less than 20% of controls and the dose response curve for azinphos-methyl appears to be very steep since the majority of females (15/18) at 6 mg/kg died. Therefore, a more realistic estimate of the NOEL for RBC ChE inhibition may be obtained by dividing the LOEL by an uncertainty factor of 3 rather than default of 10. A higher NOEL for RBC ChE inhibition is supported by higher observed NOELs for plasma and RBC ChE inhibition in numerous subchronic and chronic studies including a 3-month inhalation study in rats, a developmental toxicity study in rats, a 16-week feeding study in rats, and a 2-year feeding study in rats (Kimmerle, 1976; Kowalski et al., 1987; Doull and Rehfuss, 1956; Schmidt and Chevaleir, 1984). The acute neurotoxicity study in rats was not used as the definitive study for evaluating acute exposure in humans because of the availability of an acceptable acute oral toxicity in a more relevant species, humans. However, if it had been used the MOEs would be 2.5 times lower than estimated.
The single oral (capsule) dose study in human volunteers was selected as the definitive study for evaluating acute and short-term exposure to azinphos-methyl with a critical NOEL of 0.75 mg/kg (MacFarlane and Freestone, 1998). No observable or measurable effects, including ChE inhibition, were reported at the highest dose level tested in males and females (1.0 and 0.75 mg/kg, respectively). Because no effects were reported at the highest dose levels tested, the NOEL could be higher. On the other hand, the subjects were not evaluated for neurophysiological or cognitive function, so its possible some subtle effect could have been overlooked. However, neurological effects were only observed in the acute neurotoxicity study in rats at dose levels that resulted in significant ChE inhibition in the plasma (>30%), RBCs (>60%), and brain (>50%) (Sheets, 1994). Therefore, it seems unlikely that effects would be seen at dose levels below that which caused significant plasma or RBC ChE inhibition in humans. Another possible deficiency with the acute human study is that they used the Boehringer-Mannheim kit to measure ChE activity in the blood. Wilson et al. (1997) reported that this kit underestimates ChE activity because of the high substrate concentration and low pH used in this kit. However, if comparisons are made with baseline or concurrent control values using the same kit, this deficiency becomes less important since they found that the results from this kit correlated well (r=0.99) with the recommended Ellman assay conditions. Since all the ChE measurements in the MacFarlane and Freestone study were measured with the Boehringer-Mannheim kit by the same laboratory, the impact of using this kit should be minimal.

79
Furthermore, the relative sensitivity of the ChE method used in the rat acute neurotoxicity study is uncertain since few details of the procedures were included in the study report except that it was a modification of the Ellman assay using dithionicotinic acid (DTNA) as the chromogen instead of dithiobisnitrobenzoate (DTNB) to avoid interference from hemoglobin. Wilson et al. (1996) reported comparable results for rat plasma and RBC ChE activity in assays with DTNA (340 nm, 37°C) and DTNB (410 nm, 37°C), but they had only one run with DTNA for comparison with 7 runs with DTNB. Furthermore, it is unknown if the assay conditions in the acute neurotoxicity study were the same as those used by Wilson et al. (1996). Another criticism of many human studies has been the small number of subjects per treatment group. In the MacFarlane and Freestone (1998) study, there were 7 subjects/sex/group. In the acute neurotoxicity study, 12 rats/sex were assigned to each treatment group for behavioral observations, but the ChE activity was only measured in satellite groups containing 6 rats/sex/group. However, if the acute neurotoxicity study in rats had been used as the definitive study (Sheets, 1994), the MOEs would be approximately 30% higher than estimated based on a NOEL of 1.0 mg/kg for overt toxicity and 45% lower than estimated based on an estimated NOEL of 0.33 mg/kg for RBC ChE inhibition. Even if the human study was not used for the critical NOEL because of its deficiencies, this study indicates that humans are not more sensitive than animals to azinphos-methyl on a mg/kg basis and could be used to justify reducing the uncertainty factor for interspecies variation.
The NOEL of 0.75 mg/kg for blood ChE inhibition in the MacFarlane and Freestone (1998) study is slightly higher than the absorbed NOAEL of 0.3 mg/kg that Carrier and Brunet (1999) estimated for a single exposure to azinphos-methyl. The estimated absorbed NOAEL was based on the lack of clinical signs or symptoms in peach harvest workers in a study conducted by McCurdy et al. (1994). The median plasma and RBC ChE activity was reduced by 9 and 7%, respectively, relative to baseline during an initial 3-day period. The estimated dermal NOEL for this study would be 1.9 mg/kg after adjusting for dermal absorption which was assumed to be 16.1% by these investigators based on the study by Feldman and Maibach (1974). The estimated absorbed NOEL was not used for evaluating acute or short-term exposure to azinphos-methyl despite being based on human data because the exposure was not controlled. Exposure was estimated in the Carrier and Brunet study based on urinary metabolite data from the McCurdy et al. (1994) study using a toxicokinetic model. Feldman and Maibach (1974) found that only about 70% of azinphos-methyl is excreted in urine within 5 days after a single dermal exposure. So the NOEL estimates of Carrier and Brunet (1999) are highly dependent on how accurately they estimated urinary excretion, as well as other toxicokinetic parameters, such as metabolic rates. The uncertainty in the actual exposure dosage would add additional uncertainty to the risk calculations. However, if the NOAEL from the Carrier and Brunet (1999) study had been used to evaluate acute exposure, the MOEs would be 2.5 times lower than estimated. The acute MOEs based on the NOEL from Carrier and Brunet (1999) study would be similar to those estimated using the acute neurotoxicity study in rats.
The most thorough investigation of the neurological effects in laboratory animals after subchronic exposure to azinphos-methyl was the subchronic neurotoxicity study in rats (Sheets and Hamilton, 1995). A NOEL was not established for plasma, RBC or brain ChE inhibition in this study, but it could be estimated to be 0.09 mg/kg/day by dividing the LOEL by a default uncertainty factor of 10. The actual subchronic NOEL is probably closer to the observed NOEL of 0.25 mg/kg/day in the 2-year rat study based on the same endpoints (Schmidt and Chevalier, 1984). If the NOEL from the 2-year rat study had been used to evaluate the seasonal occupational exposure instead of the human 28-day study, the seasonal MOEs would be the same since the NOEL was identical for both studies. The similarity in these NOELs also suggests that humans are not more sensitive than animals to seasonal or chronic exposure to

80
azinphos-methyl and; therefore, an additional uncertainty factor may not be needed for extrapolating from animals to humans.
The 28-day repeated oral (capsule) dose study in human volunteers conducted by MacFarlane and Freestone (1999) was selected as the definitive study for evaluating seasonal occupational and ambient air exposure to azinphos-methyl with a critical NOEL of 0.25 mg/kg. Only one dose level was tested in this study with 8 treated subjects and 4 control subjects. No treatment-related effects were observed at this dose. Since the same investigators conducted the single dose and 28-day human studies, some of the same concerns mentioned in the discussion of the single dose study also apply to the 28-day study, including no evaluation of neurophysiological or cognitive function, deficiencies with ChE methodology and the small group size. Its possible some subtle neurological effects were overlooked; however, neurological effects were only observed in the subchronic neurotoxicity study in rats at dose levels that resulted in significant ChE inhibition in the plasma (>55%), RBCs (>75%), and brain (>70%) (Sheets and Hamilton, 1995). Therefore, it seems unlikely that effects would be seen at dose levels below that which caused significant plasma or RBC ChE inhibition in humans. The Boehringer-Mannheim kit was used to measure ChE activity in both human studies; however, the limitations of this methodology are minor when comparisons are made with ChE activity measured by the same method. Furthermore, the sensitivity of the ChE methodology used in the human study is better understood than that used in the subchronic neurotoxicity study in rats since the methodology in the neurotoxicity study was not described in any detail. Only 8 subjects were used in the treatment group in the 28-day human study. In the subchronic neurotoxicity study, 12 rats/sex were assigned to each group for behavioral observations, but the ChE activity was only measured in satellite groups containing 6 rats/sex. In addition to these concerns, there are several more concerns with the 28-day study. One concern was the small number of control subjects (4). This was not considered a major deficiency since the preferable comparisons in adults would be with their baseline values, rather than control subject values. Another concern with this study was whether this exposure period was adequate to evaluate seasonal exposure that occurs over several months. Data presented in the Exposure Assessment section indicate that azinphos-methyl reaches a steady state in the body after about two weeks with repeated exposure. Therefore, the level of ChE inhibition would not be expected to change significantly after two weeks. The ChE inhibition data from the subchronic neurotoxicity study in rats also supports this conclusion since the level of plasma and RBC ChE inhibition were similar at week 4 and 13. The main concern with the 28-day human study conducted by MacFarlane and Freestone (1999) was the lack of female subjects. Since the acute and subchronic neurotoxicity studies for azinphos-methyl indicate that female rats are slightly more sensitive based on both their ChE inhibition and neurological signs, it is possible that female humans might also be more sensitive. The lack of female subjects will be addressed in this section under Risk Characterization by recommending a larger uncertainty factor for intraspecies variation.
Carrier and Brunet (1999) also estimated an absorbed NOEL of 0.1 mg/kg/day for repeated exposure to azinphos-methyl based on the monitoring data in peach harvesters. This absorbed NOEL is equivalent to a dermal NOEL of 0.62 mg/kg/day after adjusting for dermal absorption. As with their acute NOEL, this estimated subchronic NOEL was not used for evaluating seasonal occupational exposure to azinphos-methyl despite being based on human data because the exposure was not controlled. This approach would add additional uncertainty to the risk calculations. However, if the estimated absorbed NOEL by Carrier and Brunet for repeated exposure had been selected as the critical NOEL instead of the NOEL from the 28-day oral human study by MacFarlane and Freestone (1999), the seasonal MOEs for azinphos-methyl would 2.5 fold lower than estimated. The seasonal MOEs based on the NOEL from

81
Carrier and Brunet (1999) study would be similar to those estimated using the subchronic neurotoxicity study in rats.
While brain ChE inhibition was one of the more sensitive endpoints for overt toxicity for azinphos-methyl in most studies, it does not appear to be the most sensitive endpoint in one chronic dog study that was used for evaluating chronic exposure (Allen, 1990). An increase in diarrhea and mucus in the feces was observed in males at a dose level which did not produce significant brain ChE inhibition. These effects could be due to systemic or localized peripheral ChE inhibition. Although the increase in males did not exhibit a clear dose-response, a health protective assumption was made that the increase in frequency in males at 25 ppm was treatment-related and the NOEL was set at 5 ppm (M: 0.15 mg/kg; F: 0.16 mg/kg). If only the diarrhea in the females at 125 ppm was considered treatment-related, then the NOEL for overt toxicity would be 25 ppm (M: 0.69 mg/kg/day; F: 0.78 mg/kg/day) based on the diarrhea, and plasma and brain ChE inhibition. The NOEL for RBC ChE inhibition would still be 5 ppm (M: 0.15 mg/kg/day; F: 0.16 mg/kg/day). If the higher NOEL for overt toxicity was used for this study, then the NOEL from the rat chronic toxicity study (M: 0.25 mg/kg/day; F: 0.31 mg/kg/day) would have the lowest NOEL for overt toxicity (Schmidt and Chevalier, 1984). If the NOEL from the rat chronic toxicity study had been used to evaluate chronic occupational and dietary exposure to azinphos-methyl, then the chronic MOEs would be approximately 65% higher than estimated.
It would be preferable to use a NOEL from an inhalation study to evaluate the potential health effects from exposure to azinphos-methyl in ambient air. Three inhalation studies were available for azinphos-methyl which were not used because of deficiencies with the studies. In a 4-hour inhalation LC50 study (whole body), a NOEL of 23 mg/m3 (4.1 mg/kg) was reported based on unspecified signs of toxicity at 59 mg/m3 in male rats (Kimmerle, 1966). In another 4-hr inhalation LC50 study (head only), all of the female rats at the lowest dose tested, 80 mg/m3 (14.4 mg/kg) exhibited cholinergic signs (ocular and nasal discharge, salivation, hypoactivity, tremors, and/or twitching) (Shiotsuka, 1987). A NOEL of 1.4 mg/kg could be estimated for this study by dividing the lowest-observed-effect level (LOEL) by an uncertainty factor. If the NOELs for overt toxicity from these other studies had been used, the acute MOEs would be approximately two times larger than estimated using the NOEL for blood ChE inhibition in the single oral dose human study (MacFarlane and Freestone, 1998). The NOEL of 1.26 mg/kg/day for overt toxicity from the 3-month inhalation study could have also been selected as the critical NOEL for evaluating seasonal exposure (Kimmerle, 1976). The NOEL for plasma and RBC ChE inhibition in this study was even lower at 0.32 mg/kg/day. This study was not used because it had several deficiencies including no analysis of the test article, incomplete clinical chemistry and histopathological examination and no individual data. However, if the NOEL for plasma and RBC ChE inhibition from the subchronic inhalation study had been used instead of the NOEL for plasma and RBC ChE inhibition from 28-day oral human study, the seasonal MOEs would be 30% larger than estimated.
Exposure Assessment
The exposure from repeated, short-term exposure to azinphos-methyl was expressed as a daily body burden rather than an average daily exposure to take accumulation into account due to a half-life of approximately 24 hours in humans. This exposure dosage was then compared with a NOEL from a single exposure. An alternative to this approach would have been to take the average daily exposure and compare it with a NOEL after repeated, short-term exposure. The most appropriate NOEL in this case would have been the maternal NOEL of 1 mg/kg from a developmental rat toxicity study in which brain ChE inhibition (61% of controls)

82
was seen after 9 days of exposure during gestation (Kowalski et al., 1987). However, this NOEL was not different from the NOEL of 1.0 mg/kg seen in the acute neurotoxicity study in rats in which inactivity, reduced reflexes and brain ChE inhibition (49% of controls) was seen in females (Sheets, 1994). Consequently, the MOEs calculated would have been the same as the acute MOEs if the rat neurotoxicity study had been used as the definitive acute study. Furthermore, this approach does not allow an easy comparison of the acute and short-term exposure since NOELs from different species (human NOEL for acute and rat NOEL for short-term) would have been used.
A deterministic approach was used in the acute dietary exposure assessment as part of a tiered approach. Since the acute MOEs were acceptable for all populations subgroups with point estimates, a probabilistic analysis was not performed. Consequently, the acute dietary exposure estimates reported in this document are probably greater than actual exposures since it is unlikely that a person would consume all of the different commodities with residues at the high end in any one day. Residue values may have been overestimated for acute and chronic exposure for some commodities because of the use of field trial data (cranberries, filberts, pecans, walnuts, pistachio nuts, cottonseed, sugarcane) or the tolerance level (parsley). Residues in field trial studies are probably greater than estimated because they are usually measured closer to the time of harvest and have not undergone all of the degradation and processing that they would normally go through before being consumed. Furthermore, the limits of detection are fairly high in these studies, so the residues in samples with no detectable residues are probably overestimated. Use of DPR monitoring data for some commodities may have also overestimated residues for several reasons: 1) use of the whole commodity, not just the edible portion and 2) higher detection limits. When there was no data available on the percent crop treated, 100% was assumed for a few commodities (eggplant, peppers – all, pistachio nuts, sugarcane, parsley). It is noteworthy that in the commodity contribution analysis for acute and chronic exposure that sugarcane and/or parsley came out as major contributors to exposure for several population subgroups. In actuality, it seems unlikely that either were major contributors. Since sugarcane is so highly refined as consumed, it seems unlikely that there would be any significant residues. With parsley it seems unlikely that 100% of the crop is treated and that it would be consumed on a chronic basis at 1/2 of tolerance level.
Uncertainties associated with the ambient air exposure assessment are discussed in detail in the exposure assessment document for airborne azinphos-methyl (Formoli, 2003). The uncertainties include inhalation absorption of azinphos-methyl, indoor air concentrations of azinphos-methyl, dermal exposure from airborne azinphos-methyl, air concentrations throughout season of use, and air concentrations of azinphos-methyl since 1987.
Risk Characterization
Generally, an MOE of at least 100 is considered sufficiently protective of human health when data is derived from animal studies. The MOE of 100 allows for humans being 10 times more sensitive than animals and for the most sensitive human being 10 times more sensitive than the least sensitive human. When the NOEL is derived from a human study, an MOE of 10 or greater is generally considered sufficiently protective to allow for interspecies variation.
As mentioned under the discussion of the single dose and 28-day human studies, the
findings from these studies suggest that humans are not more sensitive than rats. The NOEL for blood ChE inhibition in rats after acute exposure to azinphos-methyl appears to be less than 1 mg/kg based on reduced RBC ChE activity in females (83% of controls) at the lowest dose tested (Sheets, 1994). The NOEL was estimated to be 0.3 mg/kg by dividing the LOEL by 3
83
since only 17% RBC ChE inhibition was observed. The NOEL for this same endpoint in the single-dose human study was equal to or greater than 0.75 mg/kg, the highest dose level tested in both sexes (MacFarlane and Freestone, 1998). The subchronic NOEL in rats after a 90-day exposure was less than 0.91 mg/kg/day, the lowest dose level tested, based on reduced blood and brain ChE activity in both sexes (59-92%, respectively) (Sheets and Hamilton, 1995). The NOEL was estimated to be 0.09 mg/kg/day by dividing the LOEL by the default uncertainty factor of 10. These studies clearly indicate that humans are not more sensitive than rats to azinphos-methyl on an acute or subchronic basis and that the interspecies uncertainty factor can be reduced.
If the NOEL for RBC ChE inhibition had been used from the rat acute neurotoxicity
study, the MOEs would not only be about 60% lower than estimated, but a higher MOE (i.e., 100) could be required to be considered adequately protective. The low incidence of illness reports since 1998 also suggest that the risks to workers are more accurately estimated by use of the human NOEL rather than the animal NOEL. In 1998, DPR implemented emergency regulations which increased the protective clothing and equipment required during application. These regulations became permanent in 2000. Prior to these regulations, there were 197 illness reports associated with azinphos-methyl exposure between 1982 and 1997. Since these regulations went into effect, there have only been 3 illnesses reported that were probably or possibly associated with exposure to azinphos-methyl. In all 3 cases, accidental or intentional protective equipment removal appears to be involved.
The acute and subchronic NOELs for blood ChE inhibition in humans was established in
adults. There was no evidence of increased pre- or postnatal sensitivity in the developmental and reproductive toxicity studies for azinphos-methyl as discussed in the Hazard Identification section. Therefore, the default assumption of a 10-fold variation in the sensitivity of the human population should cover both adults and children. It should also be noted that in a recent risk assessment for azinphos-methyl, that U.S. EPA recommended that the additional 10X safety factor for infants and children under FQPA be removed (Eiden, 1999).
When the critical NOEL is based on data in both sexes, the default uncertainty factor of
10 for intraspecies variation is probably adequate. However, in the 28-day human study only males were tested. Since the acute and subchronic neurotoxicity studies for azinphos-methyl indicate that female rats are slightly more sensitive based on both their ChE inhibition and neurological signs, it is possible that female humans are also more sensitive. Consequently, a larger uncertainty factor may be warranted for intraspecies variation to adequately protect females. Therefore, an MOE greater than 30 is recommended for seasonal occupational and ambient air exposure.
A NOEL of 0.25 mg/kg/day was observed in the 2-year chronic toxicity study in rats based on reduced blood and brain ChE activity in one or both sexes (65-86% of controls) (Schmidt and Chevalier, 1984). This was not the study used to calculate the chronic MOEs; however, this study demonstrates that even with continued exposure for 2 years in rats, the most sensitive endpoint was still ChE inhibition with no apparent increase in ChE inhibition. It is interesting to note that the ChE inhibition data from the subchronic neurotoxicity study in rats show that the level of plasma and RBC ChE inhibition were similar at weeks 4 and 13. Formoli and Fong (2001) estimated that azinphos-methyl reached steady state in humans after approximately two weeks with repeated exposure. Therefore, the chronic NOEL for blood ChE inhibition in humans should be the same as the NOEL for blood ChE inhibition in the subchronic human study, 0.25 mg/kg/day (MacFarlane and Freestone, 1999). This human subchronic NOEL also happens to be the same as the NOEL for the 2-year rat study based on plasma,

84
RBC and brain ChE inhibition (Schmidt and Chevalier, 1984). Consequently, an MOE of at least 30 is recommended for chronic dietary, occupational and ambient air exposure, too.
The MOEs for acute occupational exposure were greater than 10 for all pesticide workers, except for peach harvesters and thinners. The MOEs for short-term occupational exposure were greater than 10 for all workers, except airblast applicators and for peach harvesters and thinners. The MOEs for seasonal and chronic occupational exposure were greater than 30 for all handlers, but less than 30 for most field workers, except proppers and vegetable harvesters. The MOEs for acute and chronic dietary exposure were greater than 100 for all population subgroups. The MOEs for acute, seasonal and chronic exposure to azinphos-methyl in ambient air were all greater than 1,000 for all population subgroups. U.S. EPA=s Human Health Risk Assessment for Azinphos-methyl
U.S. EPA completed a Human Health Risk Assessment document for azinphos-methyl in May 1999 (Eiden, 1999) in which they evaluated dietary and occupational exposure. Although U.S. EPA does not consider plasma or RBC ChE inhibition an adverse effect in itself, it has used it as a surrogate for peripheral nervous system (PNS) ChE inhibition. In the past, DPR has not considered blood ChE inhibition to be an adverse effect or used it as a surrogate for PNS ChE inhibition, but the department is in the process of reevaluating its science policy regarding the use of ChE inhibition in risk assessment. This project is not only evaluating the toxicological significance of blood ChE inhibition, but also how to define toxicological significance (i.e., by statistical significance or a threshold for percent inhibition). For this reason, NOELs for both overt toxicity (which include brain ChE inhibition) and blood ChE inhibition have been identified in this document, if they are not the same. This policy is anticipated to be finalized by the end of 2003. Depending on the final outcome of this project, the NOELs identified in this report may change.
U.S. EPA did not use the single-dose or 28-day human studies conducted by
MacFarlane and Freestone (1998 & 1999) in their risk assessment for azinphos-methyl due to a policy at that time not to use human studies which were designed to establish NOELs. Instead, for acute dietary exposure they used the acute neurotoxicity study in rats (Sheets, 1994). For occupational exposure, they used RBC ChE inhibition in a dermal absorption study to evaluate short-term dermal exposure. U.S. EPA chose not to use a 21-day dermal toxicity study in rabbits, because they considered the rabbits less sensitive than rats due to unique physiological and biochemical characteristics (which were not identified). The dermal absorption study in rats was not submitted to DPR, so it was not included in this risk assessment. However, even if it had been available, preference would have still been given to the single-dose human study to evaluate short-term occupational dermal exposure. To evaluate intermediate-term occupational dermal exposure, U.S. EPA used the NOEL for RBC ChE inhibition in the 1-year oral dog study (Allen, 1990). For inhalation occupational exposure of any time period, the NOEL for plasma and RBC ChE inhibition from a 90-day inhalation study was used (Kimmerle, 1976). U.S. EPA did not estimate exposure to azinphos-methyl in ambient air for the general public.
More recently, U.S. EPA has released their Interim Reregistration Eligibility Document (IRED) for comment (U.S. EPA, 2001a). The NOELs used by U.S. EPA in the IRED for azinphos-methyl to evaluate dietary and occupational exposure did not change from their 1999 risk assessment. However, U.S. EPA did propose removing the 10X interspecies uncertainty factor for acute exposure based on the single-dose oral study in humans. They were reluctant to remove the 10X interspecies uncertainty factor for seasonal and chronic exposure based on the 28-day human study due to pup mortalities in the 1- and 2-generation rat reproductive

85
toxicity studies at the same dose levels that caused ChE inhibition (Holzum, 1990; Eiben and Janda, 1984). However, there appears to be some inconsistency within the IRED in terms of the interpretation of these studies since they also recommended that the 10X FQPA safety factor be removed based on these same studies. DPR’s evaluation of these reproductive toxicity studies supports the conclusion that pups are not more sensitive to azinphos-methyl (see discussion in the next section under Pre- and Post-natal Sensitivity).
There were some points of agreement between the two agencies in their risk assessments. Both DPR and U.S. EPA used the 1-year oral dog study with a NOEL of 0.15 mg/kg/day to evaluate chronic exposure to azinphos-methyl (Allen, 1990). DPR agreed with U.S. EPA=s analysis of the developmental and reproductive toxicity studies in that there was no evidence of increased pre- or post-natal sensitivity to azinphos-methyl and they did not recommend an additional uncertainty factor of 10X be used under FQPA. In addition, U.S. EPA agreed with DPR=s analysis of the weight of evidence for oncogenicity and classified azinphos-methyl as a Group E carcinogen or Anot likely@ to be a human carcinogen.
Issues Related to the Food Quality Protection Act The Food Quality Protection Act of 1996 mandated U.S. EPA to “upgrade its risk assessment process as part of the tolerance setting procedures” (U.S. EPA, 1997a and b). The improvements to risk assessment were based on the recommendations from the 1993 National Academy of Sciences report, “Pesticides in the Diets of Infants and Children” (NAS, 1993). The Act required an explicit finding that tolerances are safe for children. U.S. EPA was required to use an extra 10-fold safety factor to take into account potential pre- and post-natal developmental toxicity and the completeness of the data unless U.S. EPA determined, based on reliable data, that a different margin would be safe. In addition, U.S. EPA must consider available information on: 1) aggregate exposure from all non-occupational sources; 2) effects of cumulative exposure to the pesticide and other substances with common mechanisms of toxicity; 3) the effects of in utero exposure; and 4) the potential for endocrine disrupting effects. Pre- and Post-natal Sensitivity
Developmental toxicity studies in rats and rabbits and reproductive toxicity studies in rats were considered in assessing the potential for greater sensitivity in infants and children than adults. Two developmental toxicity studies were conducted for azinphos-methyl which met FIFRA guidelines, one in rats and the other in rabbits (Kowalski et al., 1987; Clemens et al., 1988. No treatment-related increases in fetal malformations or variations were observed in rats and rabbits in these studies. Maternal effects were primarily brain ChE inhibition. In rats, the maternal brain ChE activity was reduced (73% of controls) at 2.0 mg/kg/day on day 20 of gestation; however, fetal brain ChE activity was unaffected. In rabbits, brain ChE activity was reduced to 88% of controls in does at 6 mg/kg/day on day 28. Ataxia and tremors were also observed in the does at 6 mg/kg/day. A slight increase in pre- and post-implantation losses was seen at 6 mg/kg/day; however, brain ChE activity was not measured in fetuses. These findings in rats and rabbits suggest there is no increased prenatal sensitivity to azinphos-methyl.
An acceptable 2-generation, 2-litter reproductive toxicity study was conducted in which azinphos-methyl was administered in the feed to rats at 0, 5,15 or 45 ppm (Eiben and Janda, 1984). Several signs were observed in adults at 45 ppm, including alopecia, inflammation of the eyes, convulsions, and death. Four of the 5 deaths occurred in females during lactation. The convulsions were also seen primarily in females. The investigators attributed the increased convulsions and death in females to increased consumption of feed during gestation and

86
lactation. There was a slight reduction in pup survival to day 4 and day 21 (11% and 8%, respectively) at 15 ppm in one generation, but not both. Brain ChE activity was not measured in this study; however, it was measured in a subsequent 1-generation reproductive toxicity study (Holzum, 1990). Rats were fed azinphos-methyl in the diet at 0, 5, 15 or 45 ppm. The NOEL for reduced brain ChE activity (F: 52% of controls) in the parental generation was 5 ppm. The NOEL for reduced brain ChE activity in pups (54% of controls) was 15 ppm. Pup survival to day 4 and pup body weights were also significantly reduced at 15 and 45 ppm in the 1-generation study. The reduced pup survival at 15 ppm does not appear to be due to ChE inhibition since the reduction in brain ChE activity in pups at this dose level (86% of controls) was not statistically significant and does not appear to be of sufficient magnitude to have caused mortalities. It is possible the pups at 15 ppm died due to maternal neglect since dams at 15 ppm did have significantly reduced brain ChE activity from day 11 post coitus (79% of controls) to day 28 post partum (52% of controls). However, there was insufficient information in the report to determine the cause of death of the pups. Consequently, no definitive link between the pup mortalities and maternal toxicity could be established. Based on the 1-generation study, DPR toxicologists concluded the parental NOEL for overt toxicity was 5 ppm (0.4 mg/kg/day). The parental NOEL for RBC ChE was less than 5 ppm based on significant inhibition in females (53% of controls) at 5 ppm. Based on the reduced pup survival in both the 1- and 2-generation studies, DPR toxicologists determined the reproductive NOEL was 5 ppm. Therefore, DPR concluded there was no evidence of increased pre- or post-natal sensitivity to azinphos-methyl.
Endocrine Effects The Food Quality Protection Act (FQPA) of 1996 required U.S. EPA to develop a screening program to determine the endocrine disruption potential of pesticides. In 1997, the Risk Assessment Forum of the U.S. EPA published a report that reviewed the current state of science relative to environmental endocrine disruption (U.S. EPA, 1997c). U.S. EPA formed the Endocrine Disrupter Screening and Testing Advisory Committee (EDSTAC) to develop a strategy for screening and testing of pesticides for their potential to produce endocrine disruption. The EDSTAC members include various stakeholders and scientific experts. This screening and testing process is expected to be implemented by August of 1999 as required by FQPA. Environmental chemicals can interact with the endocrine system, resulting in cancer, reproductive and/or developmental anomalies (EDSTAC, 1998). It may produce these effects by affecting hormonal production and synthesis, binding directly to hormone receptors or interfering with the breakdown of hormones (U.S. EPA, 1997c). The interim science policy stated in U.S. EPA’s 1997 report is that “the Agency does not consider endocrine disruption to be an adverse endpoint per se, but rather to be a mode or mechanism of action leading to other outcomes.” Possible endocrine-related effects were seen in several reproductive toxicity studies for azinphos-methyl, including reductions in viability and lactation indices and impaired spermatogenesis (Root et al., 1965; Eiben and Janda, 1984; Holzum, 1990; Soliman d El Zalabani, 1981). Other possible endocrine-related effects were seen in one oncogenicity study in rats where an increase in tumors of the pituitary, pancreas, thyroid, parathyroid and adrenal glands were seen in males (NCI, 1978). However, it is unclear from these data if these effects are mediated through endocrine disruption, ChE inhibition or some other mechanism.
Cumulative Toxicity There is a potential for cumulative toxicity between azinphos-methyl and other organophosphates (OPs) because they have a common mechanism of toxicity, inhibition of

87
AChE. However, until recently, a scientific defensible approach to quantitatively evaluate the potential for cumulative toxicity was not available. An elaborate methodology was recently developed by U.S. EPA to assess the exposure to multiple chemicals with a common mechanism of action (U.S. EPA, 2002a). Because the OPs were assigned priority for tolerance reassessment, they were the first to be considered as a “common mechanism group” for cumulative risk assessments. The U.S. EPA recently completed a preliminary cumulative risk assessment for the OPs (U.S. EPA, 2001b). The assessment estimated the potential risk from exposure to multiple OPs by multiple pathways. A total of 31 OP pesticides were included in the risk assessment. These OPs were selected based on their detection in the USDA’s PDP, as well as their potential for human exposure through residential, non-occupational uses and drinking water. The assessment utilized data from three exposure pathways: food, drinking water and residential/non-occupational exposure to OPs (air, soil, grass, indoor surfaces). Azinphos-methyl was one of the evaluated OPs in the food and drinking water exposure pathways.
U.S. EPA employed the relative potency factor (RPF) method to determine the combined exposure to the OPs. RPF was defined as the ratio of the toxic potency of a compound to that of an index chemical. Methamidophos was selected as the index chemical, because of the quality and extensive availability of its dose-response data for all routes of exposure. The toxic potencies for the OPs were based on the common endpoint of the inhibition of the brain ChE activity in female rats for 21 days or longer. Both, the point of comparison among the chemicals and the point of departure (POD) for the index chemical was based on the BMD10, the benchmark response of 10% reduction of the ChE activity. In this analysis, U.S. EPA considered the exposure to OP residues in foods as uniform across the U.S. Twelve regional assessments were conducted for drinking water and residential exposures. The uniform food exposure estimate was combined with region-specific exposures from residential uses and drinking water. In Region 7, which included California, the use of azinphos-methyl on almonds, walnuts, apples and pears was considered in the drinking water exposure modeling.
The conclusions from the preliminary OP cumulative risk assessment were that the drinking water is not a major contributor to the total risk. The exposures from OPs in food at percentiles above the 95th percentile for all population subgroups were at least one order of magnitude higher than water. U.S. EPA indicated that additional sensitivity analysis is needed on the upper percentiles of the food exposure assessments before any risk management decisions can be made. U.S. EPA is in the process of developing guidelines for the application of the FQPA factor for pre and post-natal sensitivity in the cumulative risk assessments for chemicals with a common mechanism of toxicity (U.S. EPA, 2002b).
There is evidence that azinphos-methyl may also act synergistically with other organophosphates (OPs), such as, DDVP, diazinon, disulfoton, when exposed simultaneously (DuBois, 1962b; DuBois, 1958; McCollister et al., 1968; Witherup and Schlecht, 1963). Synergism between organophosphates is not uncommon, although the exact mechanism of this synergism is uncertain (Murphy, 1986). One possible mechanism is the inhibition the carboxylesterase enzymes that are involved in the detoxification of some OPs. Another mechanism could be competition for non-vital binding sites which may act as a buffer, thereby protecting AChE.

88
VI. TOLERANCE ASSESSMENT
A. INTRODUCTION
U.S. EPA
U.S. EPA is responsible under the Federal Food, Drug, and Cosmetic Act (FFDCA) for setting tolerances for pesticide residues in RACs (Section 408 of FFDCA) and processed commodities (Section 409 of FFDCA). A tolerance is the legal maximum residue concentration of a pesticide which is allowed on a raw agricultural commodity or processed food. The tolerances are established at levels necessary for the maximum application rate and frequency, and not expected to produce deleterious health effects in humans from chronic dietary exposure (U.S. EPA, 1991). The data requirements for tolerances include: (1) residue chemistry, (2) environmental fate, (3) toxicology, (4) product performance such as efficacy, and (5) product chemistry (Code of Federal Regulations, 1996). The field studies must reflect the proposed use with respect to the rate and mode of application, number and timing of applications and formulations proposed (U.S. EPA, 1982).
In 1996, the Food Quality Protection Act (FQPA) amended the overall regulation of pesticide residues under FIFRA and FFDCA (U.S. EPA, 1997a and b). One major change was the removal of the Delaney Clause that prohibited residues of cancer-causing pesticides in processed foods. The tolerances must be health-based and the same standards are used to establish tolerances for both the RACs and their processed forms. FQPA required an explicit finding that tolerances are safe for children. U.S. EPA was required to use an extra 10-fold safety factor to take into account potential pre- and post-natal developmental toxicity and the completeness of the data unless U.S. EPA determined, based on reliable data, that a different margin would be safe. In addition, the evaluations of the tolerance must take into account: (1) aggregate exposure from all non-occupational sources, (2) effects from cumulative exposure to the pesticide and other substances with common mechanisms of toxicity, (3) effects of in utero exposure; and (4) potential for endocrine disrupting effects.
Under FQPA, U.S. EPA is also required to reassess all existing tolerances and exemptions from tolerances for both active and inert ingredients by 2006 (U.S. EPA, 1997d). Previously, U.S. EPA reassessed tolerances as part of its reregistration and Special Review processes. In the evaluation of tolerances, the U.S. EPA uses a tiered approach and the assessment includes all label-use commodities.
In its Interim Reregistration Eligibility Document (IRED) for azinphos-methyl, U.S. EPA (2001) proposed canceling 28 uses of azinphos-methyl immediately, including alfalfa, beans (succulent or snap), birdsfoot trefoil, broccoli, cabbage (including Chinese), caneberries (foliar application only), cauliflower, citrus, celery, clover, cucumbers, eggplants, filberts, grapes, melons, nectarines, nursery stock (other than quarantine use), onions (green), onions (dry bulb), parsley, pecans, peppers, plums and dried plums, potatoes, quince, spinach, strawberries and tomatoes. The uses were considered to have minimal benefits. Another 7 uses were allowed to continue with a 4-year phase out. These include almonds, cherries (tart), cotton, cranberries, peaches, pistachios, and walnuts. These uses were considered to have moderately high economic benefits, but the risks outweigh the benefits. The 8 remaining uses were considered to have significant economic benefits and there is no adequate substitute. These remaining uses include apples (and crabapples), blueberries (lowbush and highbush), Brussels sprouts (application to soil at transplant only), caneberries (application to canes and soil only), sweet cherries, quarantine use on nursery stock, pears, and southern pine seed

89
orchards. These uses were considered eligible for reregistration with 4-year time-limited tolerances.
California
In California, U.S. EPA established tolerances are evaluated under the mandate of Assembly Bill 2161, generally referred to as the Food Safety Act (Bronzan and Jones, 1989). The Act requires DPR to conduct an assessment of dietary risks associated with the consumption of produce and processed food treated with pesticides. In these assessments, the tolerance for each specific commodity is evaluated individually and is discussed in the following sections. The previous Risk Characterization Document for azinphos-methyl conducted by DPR evaluated many of these tolerances (Lewis, 1998); however, the tolerances for most of these commodities has changed. In addition, more recent consumption data from CSFII is available. Therefore, the tolerances for azinphos-methyl were reevaluated. The tolerances for the 28 uses that U.S. EPA has proposed to cancel immediately were not included in this tolerance assessment. However, the 7 uses with the 4-year phase-out and the 8 uses with 4-year time-limited tolerances were included in this tolerance assessment since their use will continue for at least several years. The food tolerances for these remaining uses are as follows: caneberries (8 ppm), blueberries (5 ppm), apples, crabapples and pears (1.5 ppm), Brussels sprouts, cherries and peaches (2 ppm), cottonseed and cranberries (0.5 ppm), pistachios and walnuts (0.3 ppm) and almonds (0.2 ppm). B. ACUTE EXPOSURE An acute exposure assessment was conducted for each individual label-approved commodity with the residue level set to the tolerance. The DEEM Acute Analysis software program and the 1994-1998 USDA CSFII data were used in this assessment. . The acute tolerance assessment does not routinely address multiple commodities at the tolerance levels since the probability of consuming multiple commodities at the tolerance decreases as the number of commodities included in the assessment increases. The 95th percentile of user-day exposures for specific population subgroups was used in evaluating the margins of exposure.
The acute MOEs for 10 of these commodities are summarized in Table 31. Two commodities, Brussels sprouts and pistachios, were not included in this table because the consumption reported in the 1994-1998 USDA CSFII data was so low that there less than 25 user-days in most population subgroups. The tolerance for Brussels sprouts is the same as that for peaches and cherries which are higher consumption commodities. Therefore, if the MOEs are adequate for these commodities, they should also be adequate for Brussels sprouts. A similar assumption can be made for pistachios based on the walnuts since they have the same tolerance level, but walnuts have a higher consumption. For the 10 commodities included in Table 29, the 95th percentile was not reported for some population subgroups because there were too few user-days (< 25 user-days) for that commodity to get a reliable estimate of the distribution curve. This occurred most frequently with pregnant or nursing females, 13 years or old, due the small number of women surveyed in these subgroups (140 total person-days for pregnant women and 84 person-days for nursing women). When the number of user-days for any given population subgroup was equal to or greater than 25, but less than 100, the MOEs were flagged because they still may not be representative due to the small number of user-days at or above the 95th percentile (usually less than 5).

90
Table 31. Margins of Exposure for Acute Dietary Exposure to Tolerance Levels of Azinphos-methyl on Selected Raw Agricultural Commoditiesa
Population Subgroup
Applesb
Pears
Peaches
Cherries
Cottonseed
U.S. Population
37
80
90
470
15,000
Western Region
36
74
94
390
13,000
Nursing Infants (<1 yr)
18
20*
28*
260*
6,200
Non-Nursing Infants (<1 yr)
14
25
28
200
4,200
Children (1-6 yrs)
15
46
42
380
6,400
Children (7-12 yrs)
46
97
91
450
10,000
Females (13+ yrs/P/NN)
38*
IC
IC
IC
26,000
Females (13+ yrs/N)
76*
IC
IC
IC
11,000*
Females (13-19 yrs/NP/NN)
52
140*
110*
960
18,000
Females (20+ yrs/NP/NN)
110
150
140
600
25,000
Males (13-19 yrs)
77
220*
130*
470
13,000
Males (20+ yrs)
100
180
140
490
24,000
Seniors (55+ yrs)
110
170
150
460
28,000
a Based on 95th exposure percentile for all user-day population subgroups. Values rounded to two significant figures b Includes crabapples * The number of user-days for this commodity in this population subgroup was small (≥25 and <100); therefore, the 95th
percentile estimate may not be representative due to the small number of user-days at or above the 95th percentile (<5). IC Too few people consumed this commodity in this population subgroup (< 25 user-days) to obtain a reliable estimate of the
distribution curve P Pregnant NN Not nursing N Nursing NP Not pregnant
The MOEs for all of the commodities were greater than 10 and many were greater than 100. Since the acute NOEL is based on human data, an MOE of 10 or greater is generally considered adequate. Therefore, the food tolerances for these remaining uses of azinphos-methyl appear to be adequately protective of human health. C. CHRONIC EXPOSURE
A chronic exposure assessment using residues equal to the established tolerances for individual or combinations of commodities has not been conducted because it is highly improbable that an individual would chronically consume single or multiple commodities with pesticide residues at the tolerance levels. This conclusion is supported by data from both federal and DPR (formerly CDFA) pesticide monitoring programs which indicate that less than

91
Table 31 (cont.). Margins of Exposure for Acute Dietary Exposure to Tolerance Levels of Azinphos-methyl on Selected Raw Agricultural Commodities a
Population Subgroup
Blueberries
Caneberries
Cranberries
Almonds
Walnuts
U.S. Population
190
530
730
12,000
16,000
Western Region
210
190
710
11,000
15,000
Nursing Infants (<1 yr)
91*
40*
IC
IC
IC
Non-Nursing Infants (<1 yr)
120
45
910*
IC
IC
Children (1-6 yrs)
160
380
340
7,000
10,000
Children (7-12 yrs)
230
580
730
14,000
19,000
Females (13+ yrs/P/NN)
IC
IC
IC
IC
IC
Females (13+ yrs/N)
IC
IC
IC
IC
IC
Females (13-19 yrs/NP/NN)
170*
760
890*
11,000*
14,000
Females (20+ yrs/NP/NN)
190
960
1,100
12,000
17,000
Males (13-19 yrs)
200*
460
890*
19,000*
24,000
Males (20+ yrs)
240
670
680
14,000
19,000
Seniors (55+ yrs)
220
950
1,100
17,000
18,000
a Based on 95th exposure percentile for all user-day population subgroups. * The number of user-days for this commodity in this population subgroup was small (≥25 and <100); therefore, the 95th
percentile estimate may not be representative due to the small number of user-days at or above the 95th percentile (<5). IC Too few people consumed this commodity in this population subgroup (< 25 user-days) to obtain a reliable estimate of the
distribution curve P Pregnant NN Not nursing N Nursing NP Not pregnant
one percent of all sampled commodities have residue levels at or above the established tolerance (DPR, 2002a&b).

92
VII. REFERENCE CONCENTRATIONS
Air concentrations of azinphos-methyl below the reference concentrations (RfCs) are generally considered sufficiently low to protect human health. RfCs were calculated for azinphos-methyl for acute, seasonal and chronic exposures. The NOELs from oral studies were converted to equivalent human inhalation NOELs by dividing the oral NOELs by the respiratory rate for humans.
)kg/m(rateyrespirator)(mg/kg NOEL oral
=)(mg/m NOEL inhalation human 3human
3
Since children have the highest respiratory rate for humans relative to their body weight, their respiratory rate was used for humans. The resulting equivalent acute human inhalation NOEL was 1.01 mg/m3 based on human plasma and RBC ChE inhibition, assuming a 24-hr respiratory rate of 0.74 m3/kg for a 6-year old child. The equivalent subchronic human inhalation NOEL was 0.34 mg/m3 based on human plasma and RBC ChE inhibition. The equivalent chronic human inhalation NOEL was 0.203 mg/m3 based on diarrhea and RBC ChE inhibition in dogs. Generally, the RfCs are calculated by dividing the equivalent human inhalation NOELs by an uncertainty factor of 100 when based on a NOEL from an animal study to account for interspecies and intraspecies variation in susceptibility. When the NOEL is from a human study the RfC is calculated by dividing by an uncertainty factor of only 10 for intraspecies variation in sensitivity. Since only male humans were tested in the 28-day human study, the subchronic NOEL was divided by an uncertainty factor of 30 to allow for possible greater sensitivity in female humans. An uncertainty factor of 30 was also used for calculating the chronic RfC using the NOEL from a dog study since results from the 28-day human study suggests that humans are not more sensitive than animals.
The resultant RfC for acute exposure (24-hour) is 101 μg/m3 (7.8 ppb) based on human plasma and RBC ChE inhibition (Table 32). The highest 24-hour concentration detected in the monitoring of azinphos-methyl in ambient air was 0.11 μg/m3 (8.4 ppt) at the Pond site. The highest air concentration detected in offsite monitoring was 2.2 μg/m3 (0.17 ppb) during a 3-hour monitoring interval during and 1 hour after application. Using the detection limit of 0.08 μg/m3 for the remainder of the day, the 24-hour average air concentration was equivalent to 0.34 μg/m3 (26 ppt). The RfC for seasonal exposure to azinphos-methyl is 11 μg/m3 (0.87 ppb) based on human plasma and RBC ChE inhibition, respectively (Table 32). The average air concentration at the Pond site during the one-month monitoring period was 26 ng/m3 (2.0 ppt). The RfC for chronic exposure is 6.8 μg/m3 (0.52 ppb) based on diarrhea and RBC ChE inhibition in dogs (Table 32). Assuming the season for azinphos-methyl use lasts 5 months, the annual average air concentration at the Pond site would be 1.0 ng/m3 (0.8 ppt).
100) (e.g., factory uncertaint)(mg/m NOEL inhalation human
= )(mg/m RfC3
3
g) (317.3 M.WtC)25 @ L (24.5 M.Vol.
x )(mg/m RfC = (ppm) RfCo
3

93
Table 32. Reference Concentrations for Azinphos-methyl in Ambient Air
NOEL (mg/kg) (species: endpoints) Reference Concentration μg/m3 (ppb)
Acute 0.75 (human: plasma/RBC ChE) 101 (7.8) Seasonal 0.25 (human: plasma/RBC ChE) 11 (0.87) Chronic 0.15 (dog: diarrhea, RBC ChE) 6.8 (0.52)

94
VIII. CONCLUSIONS
The risks of potential adverse human health effects from occupational and dietary exposure to azinphos-methyl were evaluated. Generally, a MOE greater than 100 is desirable to protect against adverse health effects in humans when the NOEL is based on animal data. When the NOEL is based on human data, a MOE of at least 10 is generally desirable. Since only one sex was tested in the 28-day repeated dose human study, a MOE of at least 30 is recommended for seasonal exposure. Although the chronic NOEL is based on animal data, the 28-day human study indicates that humans are no more sensitive than animals. Therefore, an MOE of 30 is also recommended for chronic exposure. Based on the NOELs selected for azinphos-methyl, mitigation should be considered when the acute and short-term MOEs were less than 10 and the seasonal and chronic MOEs were less than 30. The MOEs for acute occupational exposure were greater than 10 for all agricultural workers, except peach harvesters and thinners. The MOEs for short-term occupational exposure were less than 10 for airblast applicators and for peach harvesters and thinners. The MOEs for seasonal and chronic occupational exposure were greater than 30 for all agricultural workers, except for all tree crop harvesters and thinners. For acute and chronic dietary exposure, the MOEs were greater than 100 for all population subgroups. Non-nursing infants less than one year old had the lowest MOEs for both acute and chronic dietary exposure. An acute tolerance assessment was conducted on only those commodities that U.S. EPA has not proposed revoking the tolerance for at least 4 years. The acute MOEs for these commodities were all greater than 10 and many were greater than 100. The MOEs for acute, seasonal and chronic exposure to azinphos-methyl in ambient air are all greater than 1,000. The acute, seasonal and chronic RfCs for azinphos-methyl in ambient air are 101 μg/m3 (7.8 ppb), 11 μg/m3 (0.87 ppb), and 6.8 μg/m3 (0.51 ppb), respectively. The aggregate MOEs for agricultural workers was only slightly lower than their occupational MOEs due to the high contribution of the occupational exposure. Since the MOEs for offsite and ambient air were all greater than 1,000 and it’s contribution to the aggregate exposure for agricultural workers was less than 10%, it was not included in the aggregate exposure. Even if the occupational exposure is reduced through mitigation, which would increase the contribution from residential air to the aggregate exposure, the air exposure at the monitored level would still not be of significant concern. Offsite and ambient air exposure also contributed less than 10% to the aggregate exposure for the general public; consequently, no aggregate MOEs were calculated for the general public since the only other exposure was dietary.

95
IX. REFERENCES Alam, M.T., M. Corbeil, A. Chagnon, and S.S. Kasitiya, 1974. Chromosomal anomalies
induced by the organic phosphate pesticide Guthion in Chinese hamster ovary cells. Chromosoma 49:77-86.
Alam, M.T., and S.S. Kasitiya, 1976. Cytological effects of an organic phosphate pesticide in
human cells in vitro. Can. J. Genet. Cytol. 18:665-671. Allen, T.R. (Research and Consulting Co. AG), 1990. 52-Week oral toxicity (feeding) study
with azinphos-methyl (E 1582) in the dog. Mobay Chem. Corp. Report No. 100644. DPR Vol. 154-254, #89216.
Allon, N., L. Raveh, E. Gilat, E. Cohen, J. Grunwald, and Y. Ashani, 1998. Prophylaxis
against soman inhalation toxicity in guinea pigs by pretreatment alone with human serum butyrylcholinesterase. Toxicol. Sci. 43: 121-128.
Al-Adil, K.M., E.R. White, W.L. Winterlin, and W.W. Kilgore, 1973. Uptake and translocation
of Guthion by beans and barley. J. Agr. Food and Chem. 21: 376-379. Mobay Chem. Corp. Report No. 37138. DPR Vol. 154-082, #916411.
Anderson, C.A., J.C. Cavaqnol, C.J. Cohen, A.D. Cohick, R.T. Evans, L.J. Everett, J.
Hensel, R.P. Honeycutt, E.R. Levy, W.W. Loeffler, D.L. Nelson, T. Parr, T.B. Waggoner, and J.W. Yound, 1974. Guthion (azinphosmethyl): organophosphorus insecticide. Residue Rev. 51:123-180. DPR Vol. 154-196, #65665.
Arnold, D. (Industrial Bio-test Laboratories, Inc.), 1971. Mutagenic study with Guthion in
albino mice. Mobay Chem. Corp. Report No. 30114. DPR Vol. 154-131, #11798. Ashby, J. and R.W. Tennant, 1991. Definitive relationships among chemical structure,
carcinogenicity and mutagenicity for 301 chemicals tested by the U.S. NTP. Mutat. Res. 257: 229-306.
Atwell, S. and C. Close, 1976. Leaching characteristics of Guthion on aged soil. Mobay
Chem. Corp. Report No. 48466. DPR Vol. 154-082, #916230. Bayer AG, 1981. Chemical and physical properties of Guthion technical. Mobay Chem. Corp.
Report No. 94291. DPR Vol. 154-168, #57959. Baird, J.W., 1987. Density of Guthion technical. Mobay Corp. Report No. 94306. DPR Vol.
154-175, #58939. Bauman, E.K. and D.L. Nelson, 1969. Acute oral toxicity of Guthion 50% wettable powder.
Chemagro Corp. Report No. 24933. DPR Vol. 154-077, #916433. Bianchi, L., A. Zannoli, R. Pizzala, L.A. Stivala, and E. Chiesara, 1994. Genotoxicity assay
of five pesticides and their mixtures in Saccharomyces cerevisiae D7. Mutat. Res. 321: 203-211.

96
Bianchi-Santamaria, A., M. Gobbi, M. Cembran, and A. Arnaboldi, 1997. Human lymphocyte micronucleus genotoxicity test with mixtures of phytochemicals in environmental concentrations. Mutat. Res. 388: 27-32.
Brimijoin, S., 1992. Enzymology and biology of cholinesterases. In: Proceedings of the U.S.
EPA Workshop on Cholinesterase Methodology. U.S. Environmental Protection Agency. December 4-5, 1991.
Brimijoin, S., and C. Koenigsberger, 1999. Cholinesterase in neural development: new
findings and toxicologic implications. Env. Health Persp. 107 (Suppl 1):59-64. Bronzan and Jones, 1989. Assembly Bill 2161, Addition to the Food and Agriculture Code
SEC 8 section 13060. California Food and Agriculture Code, Sacramento, CA. Cannon, L. and B. Taylor Jr. (Cannon Laboratories, Inc.), 1978. 1-Hour LC50 inhalation
toxicity study of azinphos-methyl 50W (Cotnion-methyl 50W). Gowan Co. DPR Vol. 154-137, #38207.
Cannon, L. and B. Taylor Jr. (Cannon Laboratories, Inc.), 1979. Inhalation LC50 toxicity
study of azinphos-methyl 2 EC (24% a.i.). Gowan Co. DPR Vol. 154-137, #38213. Carere, A., V.A. Ortali, G. Cardamone, and G. Morpurgo, 1978. Mutagenicity of dichlorvos
and other structurally related pesticides in Salmonella and Streptomyces. Chem. Biol. Interact. 22(2/3):297-308.
Carrier, G. and R.C. Brunet, 1999. A toxicokinetic model to assess the risk of azinphosmethyl
exposure in humans through measures of urinary elimination of alkylphosphates. Toxicol. Sci. 47: 23-32.
Chemagro Corp., 1963. Guthion - Filberts. Chemagro Corp. Report No. 11256. DPR Vol.
154-058, #916266. Chemagro Corp., 1967. Guthion - Processed sugar cane (variety CP-50-28). Chemagro Corp.
Report No. 19654. DPR 154-041, #916300. Chen, H.H., S.R. Sirianni, and C.C. Huang, 1982a. Sister chromatid exchanges and cell-cycle
delay in Chinese hamster V79 cells treated with 9 organophosphorus compounds (8 pesticides and 1 defoliant). Mutat. Res. 103:307-313.
Chen, H.H., S.R. Sirianni, and C.C. Huang, 1982b. Sister chromatid exchanges in Chinese
hamster cells treated with seventeen organophosphorus compounds in the presence of a metabolic activation system. Environ. Mutagen. 4:621-624.
Chopade, H.M. and L.L Bosnak, 1988. Metabolism of [phenyl-UL-14C] azinphos-methyl in
cotton. Mobay Corp. Report No. 95651. DPR Vol. 154-197, #66484. Clemens, G.R., J.J. Bare, and R.E. Hartnagel Jr. (Miles Inc.), 1988. A teratology study in the
rabbit with azinphos-methyl (Guthion technical). Mobay Chem. Corp. Report No. 97406. DPR Vol. 154-201, #68778.

97
CFR, 1992. Data Requirements for Registration. Code of Federal Regulations, Title 40., Parts 158. Office of the Federal Register National Archives and Records Administration.
Cooper, D., Y. Terrell, G.S.E. Parke, and S.J. Charles III (Cannon Lab., Inc.), 1978. Acute
oral LD50 of azinphos-methyl 50W (Cotnion-methyl 50W) in rats. Rohm & Hass, Co., DPR Vol. 154-085, #916429.
Costa, L.G., B.W. Schwab, and S.D. Murphy, 1982. Tolerance to anticholinesterase
compounds in mammals. Toxicol. 25: 79-87. Crawford, C.R. and R. Anderson, 1970. The acute inhalation toxicity of Guthion 62.5%
wettable powder to male and female rats. Chemagro Corp. Report No. 28735. DPR Vol. 154-077, #916506.
Crawford, C.R. and R.H. Anderson (Baychem Corp.), 1974. The acute oral toxicity of
Guthion technical, benzazimide and methyl benzazimide to rats. Mobay Chem. Corp. Report No. 41190. DPR Vol. 154-114, #11738.
Crawford, C.R. and D.L. Nelson, 1970a. Acute oral and dermal toxicity of Guthion 2% dust to
rats. Chemagro Corp. Report No. 27457. DPR Vol. 154-077, #43683 & #916436. Crawford, C.R. and D.L. Nelson, 1970b. The acute inhalation toxicity of Guthion 2% dust to
rats and mice. Chemagro Corp. Report No. 27316. DPR Vol. 154-077,#916508. Dahm, P.A., B.E. Kopecky, and C.B. Walker, 1962. Activation of organophosphorus
insecticides by rat liver microsomes. Toxicol. Appl. Pharmacol. 4: 683-696. DPR Vol. 154-198, #66489.
De Ferrari, M., M. Artuso, S. Bonassi, S. Bonatti, Z. Cavalieri, D. Pescatore, E. Marchini, V.
Pisano, and A. Abbondondolo, 1991. Cytogenetic biomonitoring of an Italian population exposed to pesticides: chromosome aberration and sister-chromatid exchange analysis in peripheral blood lymphocytes. Mut. Res. 260: 105-113.
Degraeve, N., J. Gilot-Delhalle, J. Moutschen, M. Moutschen-Dahmen, A. Colizzi, N.
Houbrechts, and M. Chollet, 1980. Comparison of the mutagenic activity of organophosphorus insecticides in mouse and in the yeast Schizosaccharomyces pombe. Mutat. Res. 74(3): 201-202.
Degraeve, N., M.C. Chollet, and J. Moutschen, 1985. Mutagenic efficiency of
organophosphorus insecticides used in combined treatments. Environ. Health Perspect. 60: 395-398.
Degraeve, N., M.C. Chollet and J. Moutschen, 1986. Mutagenic effects induced by
organophosphorus compounds. J. Toxicol. Clin. Exp. 6(1): 5-11. Also reported in: (1) Degraeve, N., J. Gilot-Delhalle, J. Moutschen, M. Moutschen-Dahmen, A. Colizzi, N. Houbrechts, and M. Chollet, 1980. Comparison of the mutagenic activity of organophosphorus insecticides in mouse and in the yeast Schizosaccharomyces pombe. Mutat. Res. 74(3): 201-202. (2) Degraeve, N., M.C. Chollet, and J. Moutschen, 1984. Cytogenetic effects induced by organophosphorus pesticides in mouse spermatocytes. Toxicol. Lett. 21: 315-319.
98
Diril, N., S. Sumer, and A. Izbirik, 1990. A survey on the mutagenic effects of some
organophosphorus insecticides in the Salmonella/microsome test system (abstract). Doga Muhendislik Ve Cevre Bilimleri. 14(2): 272-279.
Doull, J. and P. Anido (Univ. of Chicago), 1957a. Effects of diets containing Guthion and/or
Diazinon on dogs. Mobay Chem. Corp. Report No. 1733. DPR Vol. 154-134, #15835. Doull, J. and P. Anido (Univ. of Chicago), 1957b. Effect of high dietary levels of guthion on
rats (final report). Mobay Chem. Corp. Report No. 1762. DPR Vol. 154-134, #15828. Doull, J. and K.P. DuBois (Univ. of Chicago), 1956. Acute inhalation toxicity of Guthion
(Bayer 17147) to rats and mice. Chemagro Corp. Report No. 1192. DPR Vol. 154-045, #916515.
Doull, J. and P.A. Rehfuss (Univ. of Chicago), 1956. The effect of diets containing Guthion
(Bayer 17147) on rats (final report). Chemagro Corp. Report No. 1077b. DPR Vol. 154-095, #916465.
Doull, J., R. DiGiacomo, and J. Meskauskas (Univ. of Chicago), 1966. Short term breeding
studies with Guthion in rabbits. Chemagro Corp. Report No. 18952. DPR Vol. 154-045, #916534.
DPR, 1992a. Sampling for Pesticide Residues in California Well Water - 1992 Well Inventory
Data Base, Cumulative Report 1986-1992. Department of Pesticide Regulation, California Environmental Protection Agency, Sacramento, CA.
DPR, 1992b. California Crop Sheet, Peaches. Worker Health and Safety Branch, Department
of Pesticide Regulation, California Environmental Protection Agency. September 1992. DPR, 1993. Sampling for Pesticide Residues in California Well Water - 1993 Update Well
Inventory Data Base. Department of Pesticide Regulation, California Environmental Protection Agency, Sacramento, CA.
DPR, 1994. Sampling for Pesticide Residues in California Well Water - 1994 Update Well
Inventory Data Base. Department of Pesticide Regulation, California Environmental Protection Agency, Sacramento, CA.
DPR, 1995. Sampling for Pesticide Residues in California Well Water - 1995 Update Well
Inventory Data Base. Department of Pesticide Regulation, California Environmental Protection Agency, Sacramento, CA.
DPR, 1997. Sampling for Pesticide Residues in California Well Water - 1996 Update Well
Inventory Data Base. Department of Pesticide Regulation, California Environmental Protection Agency, Sacramento, CA.
DPR, 1998. Sampling for Pesticide Residues in California Well Water - 1997 Update Well
Inventory Data Base. Department of Pesticide Regulation, California Environmental Protection Agency, Sacramento, CA.

99
DPR, 1999. Sampling for Pesticide Residues in California Well Water - 1999 Update Well Inventory Data Base. Department of Pesticide Regulation, California Environmental Protection Agency, Sacramento, CA.
DPR, 2000a. Pesticide Use Report - Annual 1999. Information Services Branch, Department of
Pesticide Regulation, California Environmental Protection Agency. Indexed by Chemical, 520pp.
DPR, 2000b. 2000 Status Report - Pesticide Contamination Prevention Act. Department of
Pesticide Regulation, California Environmental Protection Agency, Sacramento, CA. DPR, 2000c. Sampling for Pesticide Residues in California Well Water - 1998 Update Well
Inventory Data Base. Department of Pesticide Regulation, California Environmental Protection Agency, Sacramento, CA.
DPR, 2000d. Sampling for Pesticide Residues in California Well Water - 2000 Update Well
Inventory Data Base. Department of Pesticide Regulation, California Environmental Protection Agency, Sacramento, CA.
DPR, 2001. Residues in Fresh Produce, 1996-1999. Query of DPR’s internal database.
Department of Pesticide Regulation, California Environmental Protection Agency, Sacramento, CA.
DPR, 2002a. Residues in Fresh Produce – 1996 Monitoring Program. Pesticide Enforcement
Branch, Department of Pesticide Regulation, California Environmental Protection Agency. http://www.cdpr.ca.gov/docs/dprdocs/residues/resi1996/rsfr1996.htm.
DPR, 2002b. Residues in Fresh Produce – 1997 Monitoring Program. Pesticide Enforcement
Branch, Department of Pesticide Regulation, California Environmental Protection Agency. http://www.cdpr.ca.gov/docs/dprdocs/residue/resi1997/rsfr1997.htm.
Drager, G. (Bayer AG), 1987. Investigations of the metabolism of azinphos-methyl on apples I.
Determination of the 14C-accountability and the metabolite pattern. Mobay Corp. Report No. 95664. DPR Vol. 154-196, #66473.
Drevenkar, V., Z. Radiƒ, ð. Vasiliƒ, and E. Reiner, 1991. Dialkylphosphorus metabolites in the
urine and activities of esterase in the serum as biochemical indices for human absorption of organophosphorus pesticides. Arch. Environ. Contam. Toxicol. 20: 417-422.
DuBois, K.P. (Univ. of Chicago), 1956a. The acute toxicity of Guthion and EPN given
simultaneously to rats. Chemagro Corp. Report No. 1355. DPR Vol. 154-095, #916483. DuBois, K.P. (Univ. of Chicago), 1956b. The acute toxicity of Guthion and malathion given
simultaneously to rats. Chemagro Corp. Report No. 1351. DPR Vol. 154-095, #29140. DuBois, K.P. (Univ. of Chicago), 1956c. The acute toxicity of Guthion given simultaneously to
rats with parathion or systox to rats. Chemagro Corp. Report No. 1359. DPR Vol. 154-095, #916484.

100
DuBois, K.P. (Univ. of Chicago), 1958. Potentiation of the toxicity of insecticidal organic phosphates. Arch. Ind. Health 18: 488-496.
DuBois, K.P. (Univ. of Chicago), 1962a. The acute oral toxicity of three guthion formulations
to rats. Chemagro Corp. Report No. 10349. DPR Vol. 154-072, #916473. DuBois, K.P. (Univ. of Chicago), 1962b. Comparison of the potentiation of acute toxicity from
Guthion plus Ethion and Guthion plus Ethion. Chemagro Corp. Report No. 10320. DPR Vol. 154-045, #916446.
DuBois, K.P. (Univ. of Chicago), 1963. Acute oral and dermal toxicity of two guthion
formulations. Chemagro Corp. Report No. 13128. DPR Vol. 154-045, #41925. DuBois, K.P. (Univ. of Chicago), 1967. Acute inhalation toxicity of Guthion ULV to rats and
mice. Chemagro Corp. Report No. 21242. DPR Vol. 154-097, #916513. DuBois, K.P. (Univ. of Chicago), 1970a. The acute oral and dermal toxicity of a wettable
powder of Guthion. Chemagro Corp. Report No. 28476. DPR Vol. 154-077, #43687 & #43688.
DuBois, K.P. (Univ. of Chicago), 1970b. Acute oral and inhalation toxicity of two guthion
formulations to female rats. Chemagro Corp. Report No. 27498. DPR Vol. 154-099, 916482.
DuBois, K.P. and F. Kinoshita (Univ. of Chicago), 1963a. The acute toxicity of Bayer 41831
in combination with other anticholinesterase insecticides. Chemagro Corp. Report No. 12299. DPR Vol. 154-045, #916448.
DuBois, K.P. and F. Kinoshita (Univ. of Chicago), 1963b. The acute toxicity of Bayer 25141
in combination with other anticholinesterase insecticides. Chemagro Corp. Report No. 12300. DPR Vol. 154-045, #916449.
DuBois, K.P. and F. Kinoshita (Univ. of Chicago), 1965a. The acute toxicity of Bayer 37289
in combination with other anticholinesterase agents to adult, female rats. Chemagro Corp. Report No. 15983. DPR Vol. 154-045, #916455
DuBois, K.P. and F. Kinoshita (Univ. of Chicago), 1965b. The acute toxicity of Bayer 9002
in combination with other anticholinesterase agents to adult, female rats. Chemagro Corp. Report No. 15990. DPR Vol. 154-045, #916457.
DuBois, K.P. and F. Kinoshita (Univ. of Chicago), 1965c. The acute oral and dermal toxicity
of some pesticide formulations to male rats. Mobay Chem. Corp. Report No. 16756. DPR Vol.154-045, #41929.
DuBois, K.P. and F. Kinoshita (Univ. of Chicago), 1970. Acute oral, dermal and inhalation
toxicity of two Guthion formulations to rats. Chemagro Corp. Report No. 27449. DPR Vol 154-077, #43681, #43682, & #916435.
DuBois, K.P. and P. Kleeburg (Univ. of Chicago), 1970. Acute inhalation toxicity of two
Guthion formulations to rats and mice. Chemagro Corp. Report No. 27346. DPR Vol. 154-077, #916509.

101
DuBois, K.P. and S.D. Murphy (Univ. of Chicago), 1956. Dermal toxicity of an emulsifiable concentrate of Guthion to rats. Chemagro Corp. Report No. 1172. DPR Vol. 154-045, #916499.
DuBois, K.P. and A.B. Raymund (Univ. of Chicago), 1960. The acute toxicity of Ethyl
Guthion in combination with other anticholinesterase agents. Chemagro Corp. Report No. 4839. DPR Vol. 154-077, #916471.
DuBois, K.P. and A.B. Raymund (Univ. of Chicago), 1961. The acute toxicity of Bayer 37344
in combination with other anticholinesterase insecticides. Chemagro Corp. Report No. 7880. DPR Vol. 154-045, #916445.
DuBois, K.P., D.R. Thursh, and S.D. Murphy, 1957a. Studies on the toxicity and
pharmacological actions of the dimethoxy ester of benzo triazine dithiophosphoric acid (DBD, Guthion). J. Pharmacol. Exptl. Therap. 119: 208-218. DPR Vol. 154-077, #916432. Also reported in : DuBois, K.P. (Univ. of Chicago), 1955. The acute mammalian toxicity and mechanism of action of Bayer 17147. Chemagro Corp. Report No. 987. DPR Vol. 154-095, #916464.
DuBois K.P., P.D. Wardean, and J. Doull (Univ. of Chicago), 1957b. The acute toxicity of
Guthion in combination with other organic phosphates. Chemagro Report No. 1487. DPR Vol. 154-095, #916485.
Ecker, W., 1976. [14C]Azinphosmethyl, metabolism studies on rats; preliminary results. Mobay
Chem. Corp. Report No. 66572. DPR Vol. 154-120, #13696. EDSTAC, 1998. Endocrine Disruptor Screening and Testing Advisory Committee (EDSTAC) -
Final Report. August 1998. Eiben, R. and B. Janda (Bayer AG), 1984. R 1582 (common name: azinphos-methyl, the
active ingredient of Guthion) Two generation study on rats. Mobay Chem. Corp. Report No. 94814. DPR Vol. 154-179, #61966.
Eiben, R., W. Schmidt, and E. Löser, 1983. R 1582 (common name: azinphos-methyl, the
active ingredient of Guthion) toxicity study on rats with particular attention to cholinesterase activity (28-day feeding study as a range-finding test for a 2-year study). Mobay Chem. Corp. Report No. 95608. DPR Vol. 154-195, #66534.
Eiden, C, 1999. Human Health Risk Assessment – Azinphos-methyl. U.S. EPA, Office of
Pesticide Programs, Health Effects Division. May 19, 1999 El-Banhawy, M.A. and M.A. El-Ganzuri, 1986. Histochemical studies on polysaccharides and
lipids in the liver of rats treated with lindane, Gusathion and tamaron. Proc. Zool. Soc., A.R. Egypt. 10:257-269.
Ellenhorn, M.J. and D. G. Barceloux (eds.), 1988. Pesticides. In: Medical Toxicology:
Diagnosis and Treatment of Human Poisoning, pp. 1069-1108. Elsevier, New York. Everett, L.J., C.A. Anderson, and D. MacDougall, 1966. Nature and extent of Guthion
residues in milk and tissues resulting from treated forage. Agri. Food Chem. 14(1): 47-53. DPR Vol. 154-198, #65675.

102
Feldman, R.J. and H.I. Maibach, 1974. Percutaneous penetration of some pesticides and herbicides in man. Toxicol. Appl. Pharmacol. 28: 126-132.
Flint, D.R., D.D. Church, H.R. Shaw, and J. Armour II (Chemagro Corp.), 1970. Soil runoff,
leaching, and adsorption, and water stability studies with Guthion. Mobay Chem. Corp. Report No. 28936. DPR Vol. 154-082, #916231.
Flucke, W. and B. Schilde, 1980. Gusathion-M active ingredient (R 1582) subacute cutaneous
study of toxicity to rabbits. Mobay Chem. Corp. Report No. 69359. DPR Vol. 154-133, #17113.
Formoli, T.A., 2003. Public Exposure to Airborne Azinphos-methyl in California. HS-1796.
Worker Health and Safety Branch, Department of Pesticide Regulation, California Environmental Protection Agency.
Formoli, T.A. and H.R. Fong, 2001. Estimation of Exposure of Persons in California to
Pesticide Products That Contain Azinphos-methyl. HS-1650. Worker Health and Safety Branch, Department of Pesticide Regulation, California Environmental Protection Agency.
Franklin, C.A., R.A. Fenske, R. Greenhalgh, L. Mathieu, H.V. Denley, J.T. Leffingwell, and
R.C. Spear, 1981. Correlation of urinary pesticide metabolite excretion with estimated dermal contact in the course of occupational exposure to Guthion. J. Toxicol. Environ. Health 7: 715-731.
Gaines, T.B., 1960. The acute toxicity of pesticides to rats. Toxicol. Appl. Pharmacol. 2: 88-99.
DPR Vol. 154-045, #41924. Also reported in: Gaines, T. B., 1969. Acute toxicity of pesticides. Toxicol. Appl. Pharmacol. 14(3): 515-534.
Garrett, N.E., H.F. Stack, and M.D. Waters, 1986. Evaluation of the genetic activity profiles of
65 pesticides. Mutat. Res. 168(3): 301-326. Gart, J.J., D. Krewski, P.N. Lee, R.E. Tarone, and J. Wahrendorf, 1986. Statistical Methods
in Cancer Research, Vol. III - The Design and Analysis of Long-term Animal Experiments. International Agency for Research on Cancer Scientific Publication No. 79. Lyon, France. pp. 82-85.
Gilot-Delhalle, J., A. Colizzi, J. Moutschen, and M. Moutschen-Dahmen, 1983.
Mutagenicity of some organophosphorus compounds at the ade6 locus of Schizosaccharomyces pombe. Mutat. Res. 117(1-2): 139-148.
Glaza, S.M. (Hazleton Laboratories America, Inc.), 1988. Acute delayed neurotoxicity study
in the domestic fowl. Mobay Chem. Corp. Report No. 94862. DPR Vol. 154-207, #71143.
G\mez-Arroyo, S., N. Noriega-Aldana, A. Osorio, F. Galicia, S. Ling, and R. Villlobos-
Pietrini, 1992. Sister-chromatid exchange analysis in a rural population of Mexico exposed to pesticides

103
Grace, T.J., 1990. Azinphos-methyl (2L-formulation) - Magnitude of the residue in unprocessed cottonseed and cottonseed processed commodities. Mobay Corp. Report No. 100080. DPR Vol 154-232, #86504.
Grace, T.J. and K.S. Cain, 1990. Dissipation of azinphos-methyl in California soils. Mobay
Corp. Report No. 100164. DPR Vol. 154-250, #91446. Grisaru, D., M. Sternfeld, A. Eldor, D. Glick, and H. Soreq, 1999. Structural roles of
acetylcholinesterase variants in biology and pathology. Eur. J. Biochem., 264: 672-686. Gronberg, R.R., 1989. Photolysis of azinphos-methyl in soil - abbreviated study. Mobay Corp.
Report No. 99777. DPR Vol. 154-250, #91447. Gronberg, R.R., D.R. Flint, H.R. Shaw, and F.E. Sandie (Baychem Corp.), 1974. The
metabolism of Guthion in grain sorghum plants. Mobay Chemical Corp. Report No. 41372. DPR Vol. 154-082, #916221.
Gronberg, R.R., K.M. Pitcher, D.R. Flint, 1975. The metabolism of Guthion in oranges.
Mobay Chem. Corp. Report No. 44756. DPR Vol. No. 154-082, #916224. Gronberg, R.R., R.J. Pollock and J.P. Wargo, 1979. The metabolism of Guthion in sandy
loam soil. Mobay Chem. Corp. Report No. 68030. DPR Vol. 154-159, #49799 & #49800.
Gronberg, R.R., V.J. Lemke, and M.B. Lasley, 1988. Metabolism of Azinphos-methyl in
lactating goats. Mobay Corp. Report No. 95649. DPR Vol. 154-198, #66486. Gunderson, E.L., 1995. FDA Total Diet Study, July 1986-April 1991, Dietary intakes of
pesticides, selected elements and other chemicals. J. AOAC Intern. 78(6): 1353-1363. Gunther, F.A., G.E. Carmen, R.C. Blinn, and J.H. Barkley, 1963. Persistence of residues of
Guthion on and in mature lemons and oranges and in laboratory processed citrus "pulp" cattle feed. Agr. Food Chem. 11 (5): 424-427. DPR Vol. 154-197, #65662. Also reported in: Gunther, F.A. (Univ. of Calif., Riverside), 1962. Progress report on the persistence of the residues of Guthion on and in mature lemons and oranges, and in progressed citrus "pulp" cattlefeed. Chemagro Corp. Report No. 8681. DPR Vol. 154-053, #916392.
Gupta, R.C., G.T. Patterson, and W.-D. Dettbarn, 1991. Comparison of cholinergic and
neuromuscular toxicity following acute exposure to sarin and VX in rat. Fund. Appl. Toxicol. 16: 449-458.
Guthrie, F.E., P.V. Shah, and D.E. Moreland, 1974. Effects of pesticides on active transport of
glucose through the isolated intestine of the mouse. J. Agr. Food Chem. 22(4):713-715. DPR Vol. 154-120, #13697.
Harris, D.L. (WARF Inst.), 1976a. Skin irritation, eye irritation, inhalation - Cotnion Tech.
Aceto Agri. Chem. Corp. DPR Vol. 154-089, #42110, #42111 & #42112. Harris, D.L. (WARF Inst.), 1976b. Skin irritation, eye irritation, inhalation - Cotnion 25WP.
Aceto Agri. Chem. Corp. DPR Vol. 154-089, #42107, #42108 & #42109.

104
Hayes, R.H., 1985. Oncogenicity study of azinphos-methyl (Guthion) in mice. Mobay Chem. Corp. Report No. 88991. DPR Vol. 154-146, #27120.
Hecht, G. (Bayer AG), 1955. Toxicology of Bayer 17147 (R 1582). Chemagro Corp. Report
No. 627. DPR Vol. 154-095, #29133. Heimann, K.G. (Bayer AG), 1982. R 1582 (azinphos-methyl, the active ingredient of Guthion)
study of the acute oral and dermal toxicity to rats. Mobay Chem. Corp. Report No. 82383. DPR Vol. 154-114, #11736 & #42518.
Heimann, K.G. (Bayer AG), 1987. E 1582 (Common name: azinphos-methyl) Study of skin
sensitization effect on guinea pigs (Buehler Patch Test). Mobay Corp. Report No. 98565. DPR Vol. 154-213, #73923.
Herbold, B. (Bayer AG), 1978. R1582 (active ingredient of Guthion) Salmonella/microsome
test for determination of point mutations. Mobay Chem. Corp. Report No. 7965. DPR Vol. 154-131/114, #11799/34204.
Herbold, B. (Bayer AG), 1979a. R1582 - Dominant lethal study on male mouse to test for
mutagenic effects. Mobay Chem. Corp. Report No. 8425. DPR 154-131/114, #11797. Herbold, B. (Bayer AG), 1979b. R 1582 - Micronucleus test on mouse to evaluate R 1582 for
potential mutagenic effects. Mobay Chem. Corp. Report No. 69077. DPR Vol. 154-131, #11800.
Herbold, B. (Bayer AG), 1984. R1582 (c.n. azinphos-methyl) Pol test on E. coli to evaluate for
potential DNA damage. Mobay Chem. Corp. Report No. 86471. DPR 154-114, #34201. Herbold, B.A. (Bayer AG), 1986. E 1582 (c.n. azinphos-methyl) Cytogenetic study with human
lymphocyte cultures in vitro to evaluate for harmful effect on chromosomes. Mobay Chem. Corp. Report No. 94575. DPR Vol. 154-178, #61360.
Herbold, B.A. (Bayer AG), 1988. E 1582 (c.n. azinphos-methyl) Salmonella/microsome test to
evaluate for point mutagenic effects. Mobay Chem. Corp. Report No. 97413. DPR Vol. 154-203, #69935.
Heuer, B., B. Yaron, and Y. Birk, 1974. Guthion half-life in aqueous solutions and on glass
surfaces. Bull. Environ. Contam. Toxicol. 11: 532-537. Mobay Chem. Corp. Report No. 41038. DPR Vol. 154-082, #916384.
Hixson, E.J., 1979. Eye and dermal irritancy of Guthion 50 WP. Mobay Chem. Corp. Report
No. 68336. DPR Vol. 154-114, #42523 & #42524. Holzum, B. (Bayer AG), 1990. E 1852 (R 1582) (c.n. azinphos-methyl) Investigation of
inhibition of cholinesterase activity in plasma, erythrocytes and brain in a 1-generation study. Mobay Chem. Corp. Report No. 100646. DPR Vol. 154-256, #89539.
Hoorn, A.J.W. (Litton Bionetics), 1983. Mutagenicity evaluation of R1582 (c.n.
azinphosmethyl) in the reverse mutation induction assay with Saccharomyces cerevisiae strains S138 and S211a. Mobay Chem. Corp. Report No. 85917. DPR 154-114, #34203.

105
IR-4 Project, 1990. Reregistration Update. IR-4 Newsletter 21(4): 7. Interregional Project No. 4. Rutgers University, New Jersey.
Jbilo, O., C.F. Bartels, A. Chatonnet, J.P. Toutant, and O. Lockridge, 1994. Tissue
distribution of human acetylcholinesterase and butyrylcholinesterase messenger RNA. Toxicon. 32(11): 1445-1457.
JMPR, 1991. Azinphos-methyl. In: Pesticide Residues in Food – 1991, Toxicology Evaluations.
Joint Meeting of the FAO Panel of Experts on Pesticide Residues in Food and the Environment and the WHO Expert Group on Pesticide Residues. World Health Organization: Geneva. September 16-25, 1991. pp. 3-23
JMPR, 1999. Interpretation of cholinesterase inhibition. Pesticide Residues in Food – 1998.
Report of the Joint Meeting of the FAO Panel of Experts on Pesticide Residues in Food and the Environment and the WHO Core Assessment Group on Pesticide Residues, Rome, Italy, 21-30 September 1998. FAO Plant Production and Protection Paper 148. Rome: World Health Organization and Food and Agriculture Organization of the United Nations. pp. 17-19.
Kao, L.R.M., 1988. Disposition and metabolism of azinphos-methyl in rats. Mobay Chem.
Corp. Report No. 98327. DPR Vol. 154-204, #70784. Kavlock, R.J., N. Chernoff, and E.H. Rogers, 1985. The effect of acute maternal toxicity on
fetal development in the mouse. Teratog. Carcinog. Mutgen. 5(1): 3-13. Kimmerle, G. (Bayer AG), 1964. Neurotoxicity studies with Guthion active ingredient.
Chemagro Corp. Report No. 15221. DPR 154-045, #24183. Kimmerle, G. (Bayer AG), 1965. Neurotoxic studies with guthion active ingredient. Chemagro
Corp. Report No. 17563. DPR Vol. 154-045, #24182. Also reported in: Kimmerle and Löser (1974) cited below.
Kimmerle, G. (Bayer AG), 1966. Methyl Guthion (R 1582) inhalation tests. Chemagro Corp.
Report No. 18520. DPR 154-045, #41931. Kimmerle, G., 1976. Subchronic inhalation toxicity of azinphos-methyl in rats. Arch. Toxicol.
35: 83-89. DPR Vol. 154-114, #42525. Kimmerle, G. and E. Löser (Bayer AG), 1974. Delayed neurotoxicity of organophosphorus
compounds and copper concentration in the serum of hens. In: Coulston F. and F. Korte (eds.). Environmental Quality and Safety, Vol. 3. Global Aspects of Chemistry, Toxicology and Technology as Applied to the Environment. Academic Press, New York. pp 173-178.
Knapp, T.A. and P.E. Doyle (Cannon Laboratories, Inc.), 1979a. Primary eye irritation study
of azinphos methyl 2 EC on New Zealand albino rabbits. Gowan Co. DPR Vol. No. 154-137, #38212.
106
Knapp, T.A. and P.E. Doyle (Cannon Laboratories, Inc.), 1979b. A primary dermal irritation study of azinphos methyl 2 EC on abraded and nonabraded skin of New Zealand albino rabbits. Gowan Co. DPR Vol. 154-137, #38211.
Kowalski, R.L., G.R. Clemens, J.J. Bare, and R.E. Hartnagel Jr. (Miles Inc.), 1987. A
teratology study with azinphos-methyl (Guthion technical) in the rat. Mobay Chem. Corp. Report #94987. DPR Vol. 154-189, #65021.
Kraus, J.F., D.M. Richards, N.O. Borhani, R. Mull, W.W. Kilgore, and W. Winterlin, 1977.
Physiological response to organophosphate residues in field workers. Arch. Environ. Contam. Toxicol. 5: 471-485.
Krohn, J., 1987. Water solubility of azinphos-methyl pure active ingredient. Mobay Corp.
Report No. 95024. DPR Vol. 154-187, #64714. Krolski, M.E., 1988a. The metabolism of azinphos-methyl in potatoes. Mobay Corp. Report
No. 95648. DPR Vol. 154-197, #66485. Krolski, M.E., 1988b. The metabolism of azinphos-methyl in apples. Mobay Corp. Report No.
95647. DPR Vol. #154-196, #66482, Kuhr, R. J., A.C. Davis, and J.B. Bourke (New York State Agricultural Experiment Station),
Undated. Dissipation of Guthion, Sevin, Polyram, Phygon and Systox from apple orchard soil. Mobay Chem. Corp. Report No. 36593. DPR Vol. 154-082, #916410.
Lamb, D.W. and R.H. Anderson, 1974. The acute oral toxicity of Guthion, benzazimide and
methyl benzazimide to fasted and nonfasted rats using CMC as the excipient. Mobay Chem. Corp. Report No. 41621. DPR Vol. 154-114, #11739.
Lamb, D.W. and D.J. Roney, 1976. Accumulation and persistence of residues in channel
catfish exposed to Guthion-14C. Mobay Chem. Corp. Report No. 48221. DPR Vol. 154-082, #916418.
Lander, F. and M. Rrnne, 1995. Frequency of sister chromatid exchange and hematological
effects in pesticide-exposed greenhouse sprayers. Scand. J. Work Environ. Health 21: 283-288.
Lawlor, T.E., 1987. Salmonella/mammalian-microsome plate incorporation mutagenicity assay
(Ames test). Mobay Chem. Corp. Report No. 94782. DPR Vol. 154-178, #61361. Lefkowitz, R. J., B. B. Hoffman and P. Taylor, 1990. Neurohumoral Transmission: The
Autonomic and Somatic Motor Nervous Systems. In: Goodman and Gilman's: The Pharmacological Basis of Therapeutics 8th Edition (Gilman, A.G., T. W. Rall, A. S. Nies and P. Taylor, Eds.), pp. 84-130. Pergamon Press, New York.
Levine, B.S. and S.D. Murphy, 1977. Effect of piperonyl butoxide on the metabolism of
dimethyl and diethyl phosphorothionate insecticides. Toxicol. Appl. Pharmacol. 40: 393-406.

107
Lewis, C.M., C.J. Rech, and T.A. Formoli, 1998. Azinphos-methyl (Guthion) - Risk Characterization Document. Medical Toxicology and Worker Health and Safety Branches, Department of Pesticide Regulation, California Environmental Protection Agency. April 29, 1998.
Li, B., J.A. A. Ticu, W. Xie, L.M. Schopfer, P. Hammond, S. Brimijoin, S.H. Hinrichs and O.
Lockridge, 2000. Abundant tissue butyrylcholinesterase and its possible function in the acetylcholinesterase knockout mouse. J. Neurochem. 75(3): 1320-1331.
Liang, T.T. and E.P. Lichtenstein, 1972. Effect of light, temperature, and pH on the
degradation of azinphos-methyl. J. Econ. Entomol. 65(2): 315-321. Mobay Chem. Corp. Report No. 32670, DPR Vol. 154-082, #916226.
Liang, T.T. and E.P. Lichtenstein, 1976. Effects of soils and leaf surfaces on the
photodecomposition of [14C] azinphosmethyl. Agr. Food Chem. 24: 1205-1210. Lightowler, J.E. and J.R. Gardner (Life Science Research), 1978a. Cotnion: acute oral
toxicity study in rats. Gowan Co. DPR Vol. 154-137, #38209. Lightowler, J.E. and J.R. Gardner (Life Science Research), 1978b. Cotnion: acute
percutaneous toxicity to rats. Gowan Co. DPR Vol. 154-137, #38210. Lin, S., C. Chen, S.D. Murphy, and R.M. Caprioli, 1980. Quantitative high-performance liquid
chromatography and mass spectrophotometry for the analysis of the in vitro metabolism of the insecticide azinphos-methyl (Guthion) by rat liver homogenates. J. Agr. Food Chem. 28: 85-88. Mobay Chem. Corp. Report No. 68766. DPR Vol. 154-120, #13695.
Lockridge, O., 1990. Genetic variants of human serum cholinesterase influence metabolism of
the muscle relaxant succinylcholine. Pharmacol. Ther. 47(1): 35-60. Lockridge, O. and P. Masson, 2000. Pesticides and susceptible populations: people with
butyrylcholinesterase genetic variants may be at risk. Neurotoxicology. 21(1-2): 113-126.
Loeffler, W.W., 1964. The effect of processing on Guthion residues in sugar cane products.
Chemagro Corp. Report No. 12846. DPR Vol. 154-040, #916305. Lorke, D. (Huntington Research Centre), 1966a. Toxicity of Gusathion during repeated
administration to rats for two years. Mobay Chem. Corp. Report No. 20693. DPR Vol. 154-097, #916526. Also reported in: Worden, A.N., G.H. Wheldon, P.R.B. Noel, and L.E. Mawdesley-Thomas, 1973. Toxicity of gusathion for the rat and dog. Toxicol. Appl. Pharmacol. 24: 405-412.
Lorke, D. (Huntington Research Centre), 1966b. Gusathion (Bayer 171147) Chronic oral
toxicity study in dogs. Mobay Chem. Corp. Report No. 19798. DPR Vol. 154-045, #916525. Also reported in: Worden, A.N., G.H. Wheldon, P.R.B. Noel, and L.E. Mawdesley-Thomas, 1973. Toxicity of gusathion for the rat and dog. Toxicol. Appl. Pharmacol. 24: 405-412.

108
Löser, E. and D. Lorke (Bayer AG), 1967. Cholinesterase activity in the case of dogs having been administered Guthion in the feed. Mobay Chem. Corp. Report No. 20793. DPR Vol. 154-257, #98124.
MacFarlane, P. and S. Freestone (Inveresk Clinical Research Limited), 1998. A
randomised double blind ascending single oral dose study with azinphos-methyl to determine the no effect level on plasma and RBC cholinesterase activity. Bayer Corp. DPR Vol. 154-308, Rec No. 167613.
MacFarlane, P. and S. Freestone (Inveresk Clinical Research Limited), 1999. A
randomised double blind placebo controlled study with azinphos-methyl to determine the no effect level on plasma and RBC cholinesterase activity after repeat doses. Bayer Corp. DPR Vol. 154-318, Rec. No. 182478.
Machemer, L. (Bayer AG), 1977. R 1582 (Active ingredient for Gusathion) Studies for
embryotoxic and teratogenic effects on rabbits following oral administration. Mobay Chem. Corp. Report No. 44853. DPR 154-114, #34198.
Magill, L.J. and L.J. Everett (Chemagro Corp.), 1966. Guthion 14C study on lettuce. Mobay
Chem. Corp. Report No. 18636. DPR Vol. 154-082, #13651. March, R.B., T.R. Fukuto, and R.L. Metcalf (Univ. of Calif., Riverside), 1957. Metabolism of
32P-Guthion in the white mouse and American cockroach. Mobay Chem. Corp. Report No. 1584. DPR Vol. 154-082, #916535.
McCollister, D.D., K.J. Olson, and V.K. Rowe, 1968. Toxicology of 4-tert-butyl-2-chlorophenyl
methyl methylphosphoramidate (Ruelene) in laboratory animals. Fd. Cosmet. Toxicol. 6: 185-198. DPR Vol. 154-077, #916443.
McCurdy, S.A., M.E. Hansen, C.P. Weisskopf, R.L. Lopez, R. Schneider, J. Spencer, J.R.
Sanborn, R.I. Kreiger, B.W. Wilson, D.F. Goldsmith, and M.B. Schenker, 1994. Assessment of azinphosmethyl exposure in California peach harvest workers. Arch. Environ. Health 49(4): 289-296.
Mehler, L., 2004. Database query of the California Pesticide Illness Surveillance Program,
1982-2001. Worker Health and Safety Branch, Department of Pesticide Regulation, California Environmental Protection Agency. Generated February 19, 2004.
Mendoza, C.E., 1976. Toxicity and effects of malathion on esterases of suckling albino rats.
Toxicol. Appl. Pharmacol. 35: 229-238. Mihail, F. and D. Lorke (Bayer AG), 1978. R-1582 (Gusathion M active ingredient): Acute
toxicity studies. Mobay Chem. Corp. Report No. 67362. DPR Vol. 154-114, #11737 & #42517.
Morgan, J.G., 1987a. The aqueous photolysis of Guthion-phenyl-UL-14C. Mobay Corp. Report
No. 94709. DPR Vol. 154-176, #59325. Morgan, J.G., 1987b. The photodecomposition of Guthion-phenyl-UL-1 C on soil. Mobay Corp.
Report No. 94708. DPR Vol. 154-176, #59234.
109
Morpurgo, G., F. Aulicino, M. Bignami, L. Conti, and A. Velcich, 1977. Relationship between structure and mutagenicity of dichlorvos and other pesticides. Atti. Acad. Naz. Lincei Cl. Sci. Fish. Mat. Nat. Rend. 62(5): 692-701.
Motoyama, N. and W. C. Dauterman, 1972. The in vitro metabolism of azinphosmethyl by
mouse liver. Pest. Biochem. Physiol. 2:170-177. Mobay Chem. Corp. Report No. 35113. DPR Vol. 154-082, #916536.
Murphy, S.D., 1986. Chapter 18: Toxic effects of pesticides. In: Casarett and Doull's
Toxicology: The Basic Science of Poisons, 3rd ed. (Klaassen, C.D., M.O. Amdur, J. Doull, Eds.), pp. 519-581. Macmillan Publishing Co., Inc., New York. 974 pp.
Murphy, S.D. and K.P. DuBois (Univ. of Chicago), 1957. Enzymatic conversion of Guthion to
an anticholinesterase agent. Chemagro Corp. Report No. 1481. DPR Vol. 154-095, #29139.
Murphy, S.D. and S. Porter, 1966. Effects of toxic chemicals on some adaptive liver enzymes,
liver glycogen and blood glucose in fasted rats. Biochem. Pharmacol. 15: 1665-1676. Myhr, B.C. and D.J. Brusick (Litton Bionetics, Inc.), 1983. Evaluation of R1582 (c.n.
azinphosmethyl) in the primary rat hepatocyte unscheduled DNA synthesis assay. Mobay Chem. Corp. Report No. 86397. DPR Vol. 154-114, #34202.
Nagymajtényi, L., I. Dési, and R. Lorencz, 1988. Neurophysiological markers as early signs
of organophosphate neurotoxicity. Neurotoxicol. Teratol. 10: 429-434. NCI (Gulf South Research Institute), 1978. Bioassay of azinphos-methyl for possible
carcinogenicity. National Cancer Institute. DHEW Publication No. (NIH) 78-1319. NTIS PB-286-371. DPR Vol. 154-108/145, #38721/38253. Also reported in: Milman, H.A., J.M. Ward, and K.C. Chu, 1978. Pancreatic carcinogenesis and naturally occurring pancreatic neoplasms of rats and mice in the NCI carcinogenesis testing program. J. Environm. Pathol. Toxicol. 1: 829-840.
Nelson, D.L., 1967a. The dermal toxicity of Guthion 50 percent wettable powder to adult
female rats. Chemagro Corp. Report No. 21212. DPR Vol 154-097, #916503. Nelson, D.L., 1967b. A study of the acute dermal toxicity of a sample of Guthion ME spray
concentrate. Chemagro Corp. Report No. 21181. DPR Vol. 154-100,, #42511. Nelson, D.L., 1968. The acute mammalian toxicity of two samples of Guthion technical to adult
female rats. Chemagro Corp. Report No. 22579. DPR Vol. 154-097, #916478. Nelson, D.L., 1978a. The acute oral toxicity of Guthion 2S to rats. Mobay Chem. Corp. Report
No. 66514. DPR Vol. 154-114, #11733. Nelson, D.L., 1978b. Acute dermal toxicity of Guthion 2S emulsifiable to rabbits. Chemagro
Corp. Report No. 66250. DPR Vol. 154-114, #11730. Nelson, D.L., 1978c. Acute inhalation toxicity of Guthion 2S to rabbits. Mobay Chem. Corp.
Report No. 66157. DPR Vol. 154-114, #11729.

110
Nelson, D.L., 1978d. The eye and dermal irritancy of Guthion 2S to rabbits. Mobay Chem. Corp. Report No. 66124. DPR Vol. 154-114, #66124.
Nelson, D.L., 1979a. Acute oral toxicity of Guthion 2L to rats. Mobay Chem. Corp. Report No.
68028. DPR Vol. 154-114, #11732. Nelson, D.L., 1979b. Acute oral toxicity of Guthion 50% wettable powder. Mobay Chem. Corp.
Report No. 68029. DPR Vol. 154-114, #11731. Nelson, D.L., 1979c. Guthion 50% wettable powder - acute dermal toxicity to rabbits. Mobay
Chem Corp. Report No. 68266. DPR Vol. 154-166, #62874. Nelson, D.L. and E.K. Bauman, 1968. Acute oral and dermal toxicity of a Guthion liquid
concentrate (22.2% ai). Chemagro Corp. Report No. 23018. DPR Vol. 154-094, #41587 & #41588.
Nelson, D.L. and E.K. Bauman, 1969. Acute oral and dermal toxicity of a Guthion 2 lb/gal
spray concentrate (22% ai). Chemagro Corp. Report No. 24198. DPR Vol. 154-077, #43679 & #916441.
Nelson, D.L. and J. Doull, 1967. Acute inhalation toxicity of Guthion 50 per cent wettable
powder. Chemagro Corp. Report No. 21302. DPR Vol. 154-097, #916514. Ni, Z., S. Li, Y. Liu, Y. Tang and D. Pang, 1993. Induction of micronucleus by
organophosphorus pesticides both in vivo and in vitro (abstract). J. West China Univ. of Med. Sci. 24(1): 82-86.
Nicholas, A.H. and H. Van Den Berghe, 1982. Sister chromatid exchange and pesticides, with
emphasis on organophosphates, In: Sister Chromatid Exchange. Alan R. Liss, Inc., New York. pp 327-354.
Nieminen, S.A., A. Lecklin, O. Heikkinen, and P. Ylitalo, 1990. Acute behavioural effects of
the organophosphates sarin and soman in rats. Pharmacol. Toxicol. 67: 36-40. NAS, 1993. Pesticides in the Diets of Infants and Children. National Research Council,
National Academy of Sciences. National Academy Press, Washington, D.C. Padilla, S., V.C. Moser, C.N. Pope and W.S. Brimijoin, 1992. Paraoxon toxicity is not
potentiated by prior reduction in blood acetylcholinesterase. Toxicol. Appl. Pharmacol. 117: 110-115.
Pantuck, E.J., 1993. Plasma cholinesterase: gene and variations. Anesth. Analg. 77(2): 380-
386. Pasquet, J., A. Mazuret, J. Fournel, and F. Koenig, 1976. Acute oral and percutaneous
toxicity of phosalone in the rat in comparison with azinphosmethyl and parathion. Toxicol. Appl. Pharmacol. 37: 85-92.
111
Patzschke, K., L.A. Wegner, and H. Weber (Bayer AG), 1976. 14C-Azinphosmethyl ( 4C-Guthion), Biokinetic studies on rats. Mobay Chem. Corp. Report No. 53035. DPR 154-120, #13693.
Porter, M.C., R.E. Craigo, and R.E. Hartnagel, Jr. (Miles Laboratories, Inc.), 1987a. Dermal
sensitization evaluation of Guthion technical in the guinea pig. Mobay Corp. Report No. 94697. DPR Vol. 154-174, #59192.
Porter, M.C., R.E. Craigo, and R.E. Hartnagel, Jr. (Miles Laboratories, Inc.), 1987b. Dermal
sensitization evaluation of Guthion 35% WP in the guinea pig. Mobay Corp. Report No. 94698. DPR Vol. 154-184, #63225.
Pruett, S.B., D.K. Ensley, and P.L. Crittenden, 1993. The role of chemical-induced stress
responses in immunosuppression: a review of quantitative associations and cause-effect relationships between chemical-induced stress responses and immunosuppression. J. Toxicol. Environ. Health 39: 163-192.
Raffaele, K.C. and C. Rees, 1990. Neurotoxicology dose/response assessment for several
cholinesterase inhibitors: use of uncertainty factors. Neurotoxicol. 11: 237-256. Raveh, L., J. Grunwald, D. Marcus, Y. Papier, E. Cohen, and Y. Ashani, 1993. Human
butyrylcholinesterase as a general prophylactic antidote for nerve agent toxicity. In vitro and in vivo quantitative characterization. Biochem. Pharmacol. 45(12): 2465-2474.
Raveh, L., E. Grauer, J. Grunwald, E. Cohen, and Y. Ashani, 1997. The stoichiometry of
protection against soman and VX toxicity in monkeys pretreated with human butyrylcholinesterase. Toxicol. Appl. Pharmacol. 145:43-53.
Riccio, E., G. Shepherd, A. Pomeroy, K. Mortelmans, and M.D. Waters, 1981. Comparative
studies between the S. cerevisiae D3 and D7 assays of eleven pesticides. Environ. Mutagen. 3: 327.
Richards, D.M., J.F. Kraus, P. Kurtz, N.O. Borhani, R. Mull, W. Winterlin, and W.W. Kilgore,
1978. A controlled field trial of physiological responses to organophosphate residues in farm workers. J. Environ. Pathol. Toxicol. 2: 493-512.
Rider, J.A., J.I. Swader, E.J. Puletti, 1972. Anticholinesterase toxicity studies with Guthion,
Phosdrin, Di-syston, and Trithion in human subjects. Presented at Federation Meeting, April 10, 1972, Atlantic City, N.J. DPR Vol. No. 154-114, #11726.
Ridlen, R.L. and L.K. Pfankuche, 1988. Distribution and metabolism of [14C] azinphos-methyl
in laying hens. Mobay Corp. Report No. 95650. DPR Vol. 154-199, #67181. Root, M., D. Vesselinovitch, J. Meskauskas, and J. Doull, 1965. Effect of Guthion in the diet
on the reproduction and lactation in mice. Chemagro Corp. Report No. 16963. DPR 154-045, #916533.
Rosenfeld, G. (Cosmopolitan Safety Evaluation, Inc.), 1984a. Guinea pig sensitization study
(Buehler), Test article: Methyl azinphos 50 WP. Gowan Co. DPR Vol. 154-137, #38208.

112
Rosenfeld, G. (Cosmopolitan Safety Evaluation, Inc.), 1984b. Guinea pig sensitization study (Buehler), Test article: Methyl azinphos 20 EC. Gowan Co. DPR Vol. 154-137, #38214.
Sandie, F.E., 1983. The determination of the octanol/water partition coefficient for Guthion.
Mobay Chem. Corp. Report No. 85731. DPR Vol. 154-165, #85731. Sato, I., 1959. Studies on organic phosphorus Gusathion (Guthion) and Phosdrin. 1. The
toxicity of Gusathion and Phosdrin. Kumamoto Med. J. 12: 312-317. Scheele, B., F. Führ, and G. Krampitz, 1977. Studies on the conversion and metabolism of
carbonyl-14C-labeled azinphosmethyl in poultry (English translation). Landwirtsch. Forsch. 30(1): 56-68. DPR Vol. 154-198, #65674.
Schmidt, W.M. and Chevalier (Bayer AG), 1984. R 1582 (Common name: azinphos-methyl)
Study of chronic toxicity and carcinogenicity to Wistar rats (administration in the feed up to 2 years). Mobay Chem. Corp. Report No. 99167. DPR Vol. 154-214, #74676.
Schneider, F., S. Saiz, and D. Alcoser, 1987. Comparison of applicator exposure to azinphos-
methyl using electrostatic and conventional air blast sprayers in California in 1986. Worker Health and Safety Branch, California Department of Food and Agriculture. HS-1407.
Schneider, F., K. Steenland, B. Hernandez, B. Wilson, R. Krieger, J. Spencer, and S.
Margetich, 1994. Monitoring peach harvest workers exposed to azinphosmethyl residues in Sutter County, California, 1991. Environ. Health Persp. 102(6-7): 580-585.
Schulz, K.R., E.P. Lichtenstein, T.T. Liang, and T.W. Fuhremann, 1970. Persistence and
degradation of azinphos-methyl in soils as affected by formation and mode of application. J. Econ. Entomol. 63: 432-437. Mobay Chem. Corp. Report No. 25186. DPR Vol. 154-082, #916386.
Seaman, L. (Cannon Laboratories, Inc.), 1978a. Primary eye irritation study of azinphos-
methyl 50W (Cotnion-methyl 50W) on New Zealand albino rabbits. Gowan Co. DPR Vol. 154-137, #38205.
Seaman, L. (Cannon Laboratories, Inc.), 1978b. A primary dermal irritation study of
azinphos-methyl 50W (Cotnion-methyl 50W) on abraded and nonabraded skin of New Zealand albino rabbits. Gowan Co. DPR Vol. 154-137, #38204.
Seaman, L. and P. Imlay (Cannon Laboratories, Inc.), 1978. The acute dermal LD50 of
azinphos-methyl (Cotnion-methyl) 50W on New Zealand albino rabbits. Gowan Co. DPR Vol. 154-137, #38206.
Seiber, J.N., M.M. McChesney, J.E. Woodrow, and T.S. Shibamoto, 1988. Final report to
the Air Resources Board: Pilot analysis of azinphos-methyl in air. Contract No. A5-169-43. Department of Environmental Toxicology, University of California, Davis.
Selim, S. (Xenobitotic Laboratories, Inc. and Pharma Bio-Research Clinics, B.V.), 1999.
Absorption, excretion, balance and pharmacokinetics of 14C radioactivity after single dose dermal application of single dose dermal application of three dose levels of 14C

113
labeled Guthion to healthy volunteers. Bayer Corp. DPR Vol. 154-307, Rec. No. 167-193.
Shah, R.G., J. Lagueux, S. Kapur, P. Levallois, P. Ayotte, M. Tremblay, J. Zee and G.G.
Poirier, 1997. Determination of genotoxicity of the metabolites of the pesticides Guthion, Sencor, Lorox, Reglone, Daconil, and Admire by 32P-postlabeling. Mol. Cell. Biochem. 169: 177-184.
Sheets, L.P., 1990a. Acute oral toxicity study with Guthion 35 WP in rats. Mobay Corp. Report
No. 100589. DPR Vol. 154-253. #95779. Sheets, L.P., 1990b. Acute dermal toxicity study with Guthion 35 WP in rats. Mobay Corp.
Report No. 100582. DPR Vol. 154-253, #95777. Sheets, L.P., 1990c. Primary eye irritation study with Guthion 35 WP in rabbits. Mobay Corp.
Report No. 100276. DPR Vol. 154-253, #95776. Sheets, L.P., 1990d. Primary dermal irritation study with Guthion 35 WP in rabbits. Mobay
Corp. Report No. 100274. DPR Vol. 154-253, #95775. Sheets, L.P., 1994. An acute oral neurotoxicity screening study with technical grade azinphos-
methyl (Guthion7) in Fischer 344 rats. Miles Inc. Report No. 106365. DPR Vol. 154-269, #132080.
Sheets, L.P. and B.F. Hamilton, 1995. A subchronic dietary neurotoxicity screening
study with technical grade azinphos-methyl (Guthion7) in Fischer 344 rats. Miles Inc. Report No. 106839. DPR Vol. 154-277, #135548.
Shiotsuka, R.N., 1986. Acute inhalation toxicity study with Guthion 50% wettable powder dust
in Sprague-Dawley rats. Mobay Corp. Report No. 94216. DPR Vol. 154-167, #58412. Shiotsuka, R.N., 1987. Acute four-hour inhalation toxicity study with Guthion technical in rats.
Mobay Chem. Corp. Report No. 94636. DPR Vol. 154-174, #59190. Short, R.D., J.L. Minor, T.M. Unger, and C.C. Lee (U.S. EPA), 1978. Teratology of Guthion.
EPA Report # EPA-600/1-78-056. Mobay Chem. Corp. Report No. 68906. DPR Vol. 154-107, #916532 & 38720. Also reported in : Short, R.D., J.L. Minor, C. Lee, N. Chernoff, and R.L. Baron, 1980. Developmental toxicity of Guthion in rats and mice. Toxicology 43: 177-186.
Simmon, V.F., D.C. Poole, G.W. Newell, 1976. In vitro mutagenic studies of twenty pesticides.
Toxicol. Appl. Pharmacol. 37(1): 109. Also reported in: (1) Waters, M.D., V.F. Simmon, A.D. Mitchell, T.A. Jorgenson, and R. Valencia, 1980. Overview of short-term tests for the mutagenic and carcinogenic potential of pesticides. J. Environ. Sci. Health Part B. 15: 867-906; (2) Waters, M.D., S. Nesnow, V.F. Simmon, A.D. Mitchell, T.A. Jorgenson, and R. Valencia, 1981. Pesticides: mutagenic and carcinogenic potential. ACS Symp. Ser. 160: 89-113.
Soliman, A.A. and L.M. El-Zalabani, 1981. Impairment of spermatogenesis by
organophosphorus pesticides. Bull. Alexandria Fac. Med. 17(1): 125-130.

114
Sparks, S.S., G.B. Quistad and J.E. Casida, 1999. Organophosphorus pesticide-induced butyrylcholinesterase inhibition and potentiation of succinylcholine toxicity in mice. J. Biochem. Molecul. Toxicol. 13(2): 113-118.
Staiff, C.D., S.W. Comer, J.F. Armstrong, and H.R. Wolfe, 1975. Persistence of
azinphosmethyl in soil. Bull. Environ. Contam. Toxicol. 13(3): 1-7. Mobay Report No. 44757. DPR Vol. 154-082, #916385.
Starner, K., 2004. Database query of DPR Surface Water Monitoring Data. Environmental
Monitoring Branch, Department of Pesticide Regulation, California Environmental Protection Agency. Queried February 13, 2004.
Steffens, W. and J. Wieneke, 1975. Influence of humidity and rain on uptake and metabolism
of 14C-azinphos-methyl in bean plants. Arch. Environ. Cont. Tox. 3: 364-370. Mobay Chem. Corp. Report No. 45571. DPR Vol. 154-082, #916225.
Steffens, W. and J. Wieneke, 1976. Studies on the uptake, metabolism and degradation of
14C-labelled Gusathion in kidney beans, I. Extraction, fractionation and 14C balance. Pflanzenschutz-Nachrichten 29: 1-17. DPR Vol. 154-120, #13752. Also reported in: Steffens, W. and J. Wieneke (Nuclear Research Installation Julich Gmbh), 1973. Studies on the uptake and metabolism of Gusathion in kidney beans (Phaseolus vulgaris L.). Mobay Chem. Corp. Report No. 38944. DPR Vol. 154-082, #916412.
Stokes, L. A. Stark, E. Marshall and A. Narang, 1995. Neurotoxicity among pesticide
applicators exposed to organophosphates. Occup. Environ. Med. 52: 648-653. Sultatos, L.G. and L. Woods, 1988. The role of glutathione in the detoxification of the
insecticides methyl parathion and azinphos-methyl in the mouse. Toxicol. Appl. Pharmacol. 96(1): 168-174.
Talbott, T.D., 1987. Calculation of Henry's law constant. Mobay Corp. Report No. 91241.
DPR Vol. 154-187, #64716. Talbott, T.D. and B. Mosier, 1987. Vapor pressure of Guthion pure active ingredient. Mobay
Corp. Report No. 94690. DPR Vol. 154-177, #53952. Tayler, R.E., 1965. Report on demyelination studies on hens, Guthion. Mobay Chem. Corp.
Report No. 15949. DPR Vol. 154-045, #24541. Thyssen, J. (Bayer AG), 1981. R-1582 (Azinphos-methyl, the active ingredient of Guthion)
Study of the irritant effect on the skin and mucous membranes. Mobay Chem. Corp. Report No. 87434. DPR Vol. 154-114, #11727 & #42519.
Trepanier G., F. Marchessault, J. Bansal, and A. Chagnon, 1977. Cytological effects of
insecticides on a human lymphoblastoid cell line. In Vitro 13: 201. USDA, 1994-1998. Food and Nutrient Intake of Individuals in the United States, 1994-1996 and
1998. Continuing Survey of Food Intakes by Individuals, 1994-1996 and 1998. Agricultural Research Service, U.S. Department of Agriculture .

115
U.S. EPA, 1982. Pesticide Assessment Guidelines Subdivision O- Residue Chemistry. Office of Pesticides and Toxic Substances, U.S. Environmental Protection Agency. Document No. EPA-540/9-82-023.
U.S. EPA, 1986a. Guidance for the Reregistration of Pesticide Products Containing Azinphos-
methyl as the Active Ingredient. Office of Pesticide and Toxic Substances, U.S. Environmental Protection Agency.
U.S. EPA, 1986b. Azinphos-methyl (Guthion), Pesticide Fact Sheet. Office of Pesticides and
Toxic Substances, Office of Pesticide Programs, U.S. Environmental Protection Agency. U.S. EPA, 1988. Recommendations for and documentation of biological values for use in risk
assessment. Environmental Criteria and Assessment Office, Office of Health and Environmental Assessment, Office of Research and Development, U.S. Environmental Protection Agency. Document No. EPA/600/6-87/008.
U.S. EPA, 1993. An SAB Report: Cholinesterase Inhibition and Risk Assessment. Review of
the Risk Assessment Forums Draft Guidance on the Use of Data on Cholinesterase Inhibition in Risk Assessment by the SAB/SAP Joint Committee. U.S. Environmental Protection Agency. EPA-SAB-EHC-93-011.
U.S. EPA, 1997a. The Federal Insecticide Fungicide, and Rodenticide Act (FIFRA) and Federal
Food, Drug, and Cosmetic Act (FFDCA) as Amended by the Food Quality Protection Act (FQPA) of August 3, 1996. Document no. 730L97001, March 1997. Office of Pesticide Programs, U.S. Environmental Protection Agency, Washington, D.C.
U.S. EPA, 1997b. 1996 Food Quality Protection Act Implementation Plan. March, 1977. Office
of Prevention, Pesticides and Toxic Substances (7506C), U.S. Environmental Protection Agency, Washington, D.C. (http://www.epa.gov/opppsps1/fqpa/impplan.pdf)
U.S. EPA, 1997c. Special Report on Environmental Endocrine Disruption: An Effects
Assessment and Analysis. Risk Assessment Forum, U.S. Environmental Protection Agency, Washington, D.C.
U.S. EPA, 1999. Overview of Azinphos-methyl Revised Risk Assessment. Office of Pesticide
Programs, U.S. Environmental Protection Agency. 5/18/99. (http://www.epa.gov/pesticides/op/azinphos/mayover.pdf)
U.S. EPA, 2000a. Office of Pesticide Programs Science Policy on the Use of Data on
Cholinesterase Inhibition for Risk Assessments of Organophosphorus and Carbamate Pesticides. Office of Pesticide Programs, U.S. Environmental Protection Agency, Washington, D.C. August 18, 2000.
U.S. EPA, 2000b. Azinphos-methyl, revocation and lowering of certain tolerances; tolerance
actions (final rule). Federal Register, June 22, 2000. Vol. 65 (121): 38748-38753. U.S. EPA, 2001a. Interim Reregistration Eligibility Decision for Azinphos-methyl. Case No.
0235. Office of Pesticide Programs, U.S. Environmental Protection Agency. October 30, 2001. (http://www.epa.gov/oppsrrd1/REDs/azinphosmethyl_ired.pdf)

116
U.S. EPA, 2001b. Preliminary Cumulative Risk assessment of the Organophosphorus Pesticides. Office of Pesticide Programs, U.S. Environmental Protection Agency. December 3, 2001. (http://www.epa.gov/pesticides/cumulative/pra-op)
U.S. EPA, 2002a. Guidance on Cumulative Risk Assessment of Pesticide Chemicals That
Have a Common Mechanism of Toxicity. Office of Pesticide Programs, U.S. Environmental Protection Agency. January 14, 2002. (http://www.epa.gov/pesticides/trac/science/cumulative_guidance.pdf)
U.S. EPA, 2002b. Consideration of the FQPA Safety Factor and Other Uncertainty Factors in
Cumulative Risk Assessment of Chemicals Sharing a Common Mechanism of Toxicity. Draft Document. Office of Pesticide Programs, U.S. Environmental Protection Agency. February 28, 2002. (http://www.epa.gov/pesticides/trac/science/consid_draft.pdf)
Valencia, R. 1981. Mutagenesis screening of pesticides using Drosophila. WARF Institute.
U.S. EPA Document No. 600/1-81-017. NTIS No. PB81-160848. pp. 3-18,22. Vallini, G., A. Pera, and M. De Bertoldi, 1983. Genotoxic effects of some agricultural
pesticides in vitro tested with Aspergillus nidulans. Environ. Pollut., Ser. A. 30(1): 39-58. Van Goethem, L., 1987. Azinphos-methyl, the active ingredient of Guthion: correlation of the
findings in the two-generation study with the results of a 28-day toxicity study and a chronic toxicity study. Mobay Corp. Report No. 94817. DPR Vol. 154-179, #61965.
Vigfusson, N.V., E.R. Vyse, C.A. Pernsteiner, and R.J. Dawson, 1983. In vivo induction of
sister-chromatid exchange in Umbra limi by the insecticides endrin, chlordane, diazinon and Guthion. Mutat. Res. 118: 61-68.
Vogel, W.H., 1993. The effect of stress on toxicological investigations. Human Environ.
Toxicol. 12: 265-271. Vos, J.G., E.I. Krajnc, P.K. Beekhof, M.J. Van Logten, 1983. Methods for testing immune
effects of toxic chemicals: evaluation of the immunotoxicity of various pesticides in the rat. Pestic. Chem.: Hum. Welfare Environ. Proc. Int. Congr. Pestic. Chem. 5th ed. 3: 497-504.
Wargo, J.P., 1978. The effect of feeding Guthion to dairy cattle. Mobay Chem. Corp. Report
No. 66648. DPR Vol 154-117, #11746. Warren, D.L., 1990. Acute four-hour inhalation toxicity study with Guthion 35 WP in rats.
Mobay Corp. Report No. 100588. DPR Vol. 154-253, #95788. Weber, H., K. Patzschke, and L.A. Wegner (Bayer AG), 1980. [Phenyl-UL-14C] benzazimide,
biokinetic study on rats. Mobay Chem. Corp. Report No. 69015. DPR Vol. 154-120, #13694.
Wieneke, J. and W. Steffens, 1976. Studies on the uptake, metabolism and degradation of
14C-labelled Gusathion in kidney beans, II. Separation and identification of metabolites. Pflanzenschutz-Nachrichten 29: 18-34. DPR Vol. 154-120, #13751. Also reported in: Steffens, W. and J. Wieneke (Nuclear Research Installation Julich Gmbh), 1973.

117
Studies on the uptake and metabolism of Gusathion in kidney beans (Phaseolus vulgaris L.). Mobay Chem. Corp. Report No. 38944. DPR Vol. 154-082, #916412.
Wilkes, L.C., J.P. Wargo, and R.R. Gronberg, 1979a. Dissipation of Guthion in buffered
aqueous solution. Mobay Chem. Corp. Report No. 67983. DPR Vol. 154-159, #49798. Wilkes, L.C., J.P. Wargo, and R.R. Gronberg, 1979b. Photodegradation of Guthion in
aqueous solution. Mobay Chem. Corp. Report No. 67980. DPR Vol. 154-159, #49796. Wilkes, L.C., J.P. Wargo, and R.R. Gronberg, 1979c. Photodegradation of Guthion in a soil
surface. Mobay Chem. Corp. Report No. 67979. DPR Vol. 154-159, #49795. Wilson, B.W., S. Padilla, J.D. Henderson, S. Brimijoin, P.D. Dass, G. Elliot, B. Jaeger, D.
Lanz, R. Pearson, and R. Spies, 1996. Factors in standardizing automated cholinesterase assays. J. Toxicol. Environ. Health, 48: 187-195.
Wilson, B.W., J.R. Sanborn, M.A. O’Malley, J.D. Henderson, and J.R. Billitti, 1997.
Monitoring the pesticide-exposed worker. Occup. Med., 12(2): 347-363. Witherup, S. and H. Schlecht (Univ. of Cincinnati), 1963. The immediate toxicity of Vapona,
Ciodrin and Bidrin in various combinations with other organophosphorus insecticides. Chemagro Corp. Report No. 27985. DPR Vol. 154-077, #916431.
Yaron, B., B. Heuer, and Y. Birk, 1974. Kinetics of azinphos-methyl losses in the soil
environment. J. Agric. Food Chem., 22: 439-441. Zeiger, E., B. Anderson, S. Haworth, T. Lawlor, K. Mortelmans, and W. Speck, 1987.
Salmonella mutagenicity tests: III. Results from the testing of 255 chemicals. Environ. Mutag., 9(Suppl. 9): 1-110.
Ziegler, D.A. and S.A. Hallenbeck (Analytical Development Corp.), 1987. Adsorption of
Guthion to silt loam, sandy loam, sand, and clay loam. Mobay Report No. 95084. DPR Vol. 154-187, #64717.

118
APPENDIX A
Acute Dietary Exposure Analysis Printouts

119
California Department of Pesticide Regulation Ver. 7.76 DEEM Acute analysis for AZINPHOS METHYL Residue file name: H:\MyFiles\DEEM Files\Azinphos-methyl\azinphos-methyl-dietary-acute2002.RS7 Analysis Date 04-23-2002 Residue file dated: 12-21-2001/09:04:44/14 Reference dose (NOEL) = 0.75 mg/kg bw/day Comment: DPR acute NOEL (human blood ChE inhibition). -------------------------------------------------------------------------------- Food Crop Def Res Adj.Factors Comment Code Grp Food Name (ppm) #1 #2 ---- ---- ------------------------------- ---------- ------ ------ ------- 1 13A Blackberries 0.080000 1.000 1.000 DPR hi Full comment: DPR high for caneberries 96-99 2 13A Boysenberries 0.080000 1.000 1.000 DPR hi Full comment: DPR high for caneberries 96-99 4 13A Loganberries 0.080000 1.000 1.000 DPR hi Full comment: DPR high for caneberries 96-99 5 13A Raspberries 0.080000 1.000 1.000 DPR hi Full comment: DPR high for caneberries 96-99 7 13B Blueberries 0.470000 1.000 1.000 DPR hi Full comment: DPR high blueberry residue 96-99 8 O Cranberries 0.030000 1.000 1.000 REG fi Full comment: REG field trail data 9 O Cranberries-juice 0.030000 1.100 1.000 REG fi Full comment: REG field trail data 13 O Grapes 0.027000 1.000 1.000 PDP 95 Full comment: PDP 95th% (1995, 96 CA specific) 14 O Grapes-raisins 0.027000 4.300 1.000 PDP 95 Full comment: PDP 95th% (1995, 96 CA specific) 15 O Grapes-juice 0.008000 1.000 1.000 PDP CA Full comment: PDP CA specific grape juice LOD 1998 17 O Strawberries 0.008000 1.000 1.000 PDP 19 Full comment: PDP 1998 CA specific LOD 20 10 Citrus citron 0.020000 1.000 1.000 PDP or Full comment: PDP orange as surrogate 1996 22 10 Grapefruit-peeled fruit 0.171000 1.000 1.000 DPR 95 Full comment: DPR 95th% residue value 96-99 23 10 Grapefruit-juice 0.008000 2.100 1.000 PDP CA Full comment: PDP CA specific O.J. LOD as surrogate 24 10 Kumquats 0.020000 1.000 1.000 PDP or Full comment: PDP orange as surrogate 1996 26 10 Lemons-peeled fruit 0.257000 1.000 1.000 DPR 95 Full comment: DPR 95th% residue value 96-99 27 10 Lemons-peel 0.257000 1.000 1.000 DPR 95 Full comment: DPR 95th% residue value 96-99 28 10 Lemons-juice 0.008000 1.100 1.000 PDP CA Full comment: PDP CA specific O.J. LOD as surrogate 30 10 Limes-peeled fruit 0.072000 1.000 1.000 DPR 95 Full comment: DPR 95th% residue value 96-99 31 10 Limes-peel 0.072000 1.000 1.000 DPR 95 Full comment: DPR 95th% residue value 96-99 32 10 Limes-juice 0.008000 1.000 1.000 PDP CA Full comment: PDP CA specific O.J. LOD as surrogate 33 10 Oranges-juice-concentrate 0.008000 3.700 1.000 PDP CA Full comment: PDP CA specific O.J. LOD 34 10 Oranges-peeled fruit 0.020000 1.000 1.000 PDP CA Full comment: PDP CA specific LOD 35 10 Oranges-peel 0.020000 1.000 1.000 PDP CA Full comment: PDP CA specific LOD 36 10 Oranges-juice 0.008000 1.000 1.000 PDP CA

120
Full comment: PDP CA specific O.J. LOD 37 10 Tangelos 0.020000 1.000 1.000 PDP CA Full comment: PDP CA orange as surrogate 38 10 Tangerines 0.020000 1.000 1.000 PDP CA Full comment: PDP CA orange as surrogate 39 10 Tangerines-juice 0.008000 1.300 1.000 PDP CA Full comment: PDP CA specific O.J. LOD as surrogate 40 14 Almonds 0.050000 1.000 1.000 DPR LO Full comment: DPR LOD value 44 14 Filberts (hazelnuts) 0.100000 1.000 1.000 REG fi Full comment: REG field trail data, LOD 47 14 Pecans 0.100000 1.000 1.000 REG fi Full comment: REG filbert nut as surrogate 48 14 Walnuts 0.100000 1.000 1.000 REG fi Full comment: REG filbert nut as surrogate 50 O Pistachio nuts 0.100000 1.000 1.000 REG fi Full comment: REG filbert nut as surrogate 52 11 Apples 11-Uncooked 0.148000 1.000 1.000 PDP 95 Full comment: PDP 95th% (1995, 96, CA specific) 12-Cooked: NFS 0.148000 1.000 1.000 PDP 95 Full comment: PDP 95th% (1995, 96, CA specific) 13-Baked 0.148000 1.000 1.000 PDP 95 Full comment: PDP 95th% (1995, 96, CA specific) 14-Boiled 0.148000 1.000 1.000 PDP 95 Full comment: PDP 95th% (1995, 96, CA specific) 15-Fried 0.148000 1.000 1.000 PDP 95 Full comment: PDP 95th% (1995, 96, CA specific) 18-Dried 0.148000 1.000 1.000 PDP 95 Full comment: PDP 95th% (1995, 96, CA specific) 31-Canned: NFS 0.148000 1.000 1.000 PDP 95 Full comment: PDP 95th% (1995, 96, CA specific) 32-Canned: Cooked 0.148000 1.000 1.000 PDP 95 Full comment: PDP 95th% (1995, 96, CA specific) 33-Canned: Baked 0.148000 1.000 1.000 PDP 95 Full comment: PDP 95th% (1995, 96, CA specific) 34-Canned: Boiled 0.148000 1.000 1.000 PDP 95 Full comment: PDP 95th% (1995, 96, CA specific) 42-Frozen: Cooked 0.148000 1.000 1.000 PDP 95 Full comment: PDP 95th% (1995, 96, CA specific) 53 11 Apples-dried 0.148000 8.000 1.000 PDP 95 Full comment: PDP 95th% (1995, 96, CA specific) 54 11 Apples-juice/cider 0.008700 1.000 1.000 PDP a. Full comment: PDP a.j. data (1997, 98, CA specific) 55 11 Crabapples 0.148000 1.000 1.000 PDP ap Full comment: PDP apple as surrogate 1995, 96 56 11 Pears 11-Uncooked 0.297000 1.000 1.000 PDP 95 Full comment: PDP 95th% (1998 CA composite) 12-Cooked: NFS 0.297000 1.000 1.000 PDP 95 Full comment: PDP 95th% (1998 CA composite) 13-Baked 0.297000 1.000 1.000 PDP 95 Full comment: PDP 95th% (1998 CA composite) 14-Boiled 0.297000 1.000 1.000 PDP 95 Full comment: PDP 95th% (1998 CA composite) 31-Canned: NFS 0.297000 1.000 1.000 PDP 95 Full comment: PDP 95th% (1998 CA composite) 57 11 Pears-dried 1.500000 1.000 1.000 EPA to Full comment: EPA tolerance 58 11 Quinces 0.148000 1.000 1.000 PDP ap

121
Full comment: PDP apple 95th% (95, 96 CA specific) 61 12 Cherries 0.211000 1.000 1.000 DPR 95 Full comment: DPR 95th% residue value 96-99 62 12 Cherries-dried 0.211000 4.000 1.000 DPR 95 Full comment: DPR 95th% residue value 96-99 63 12 Cherries-juice 0.055000 1.500 1.000 DPR ac Full comment: DPR acute average 64 12 Nectarines 0.067000 1.000 1.000 PDP pe Full comment: PDP peach as surrogate 65 12 Peaches 11-Uncooked 0.067000 1.000 1.000 PDP 95 Full comment: PDP 95th% (1996, 97 CA lab specific) 12-Cooked: NFS 0.067000 1.000 1.000 PDP 95 Full comment: PDP 95th% (1996, 97 CA lab specific) 13-Baked 0.067000 1.000 1.000 PDP 95 Full comment: PDP 95th% (1996, 97 CA lab specific) 14-Boiled 0.067000 1.000 1.000 PDP 95 Full comment: PDP 95th% (1996, 97 CA lab specific) 31-Canned: NFS 0.067000 1.000 1.000 PDP 95 Full comment: PDP 95th% (1996, 97 CA lab specific) 41-Frozen: NFS 0.067000 1.000 1.000 PDP 95 Full comment: PDP 95th% (1996, 97 CA lab specific) 66 12 Peaches-dried 0.067000 7.000 1.000 PDP 95 Full comment: PDP 95th% (1996, 97 CA lab specific) 67 12 Plums (damsons) 0.050000 1.000 1.000 DPR LO Full comment: DPR LOD value 96-99 68 12 Plums-prunes (dried) 0.050000 5.000 1.000 DPR LO Full comment: DPR LOD value 96-99 69 12 Plums/prune-juice 0.050000 1.400 1.000 DPR LO Full comment: DPR LOD value 96-99 139 8 Paprika 0.187000 1.000 1.000 DPR ch Full comment: DPR chili pepper as surrogate 96-99 141 9A Melons-cantaloupes-juice 0.008000 1.000 1.000 PDP CA Full comment: PDP CA specific cantaloupe LOD 142 9A Melons-cantaloupes-pulp 0.008000 1.000 1.000 PDP CA Full comment: PDP CA specific cantaloupe LOD 143 9A Casabas 0.008000 1.000 1.000 PDP CA Full comment: PDP CA specific cantaloupe LOD 1998 144 9A Crenshaws 0.008000 1.000 1.000 PDP CA Full comment: PDP CA specific cantaloupe LOD 1998 145 9A Melons-honeydew 0.008000 1.000 1.000 PDP CA Full comment: PDP CA specific cantaloupe LOD 146 9A Melons-persian 0.008000 1.000 1.000 PDP CA Full comment: PDP CA specific cantaloupe LOD 147 9A Watermelon 0.008000 1.000 1.000 PDP CA Full comment: PDP CA specific cantaloupe LOD 148 9B Cucumbers 0.049000 1.000 1.000 DPR 95 Full comment: DPR 95th% residue value 96-99 154 8 Eggplant 0.091000 1.000 1.000 DPR 95 Full comment: DPR 95th% residue value 96-99 155 8 Peppers-sweet(garden) 0.169000 1.000 1.000 DPR 95 Full comment: DPR 95th% residue value 96-99 156 8 Peppers-chilli incl jalapeno 0.187000 1.000 1.000 DPR 95 Full comment: DPR 95th% residue value 96-99 157 8 Peppers-other 0.187000 1.000 1.000 DPR ch Full comment: DPR chili pepper as surrogate 96-99 159 8 Tomatoes-whole 0.013000 1.000 1.000 PDP 95 Full comment: PDP 95th% (1998 CA specific) 160 8 Tomatoes-juice 0.008300 0.242 1.000 PDP 19 Full comment: PDP 1998 CA specific acute avg
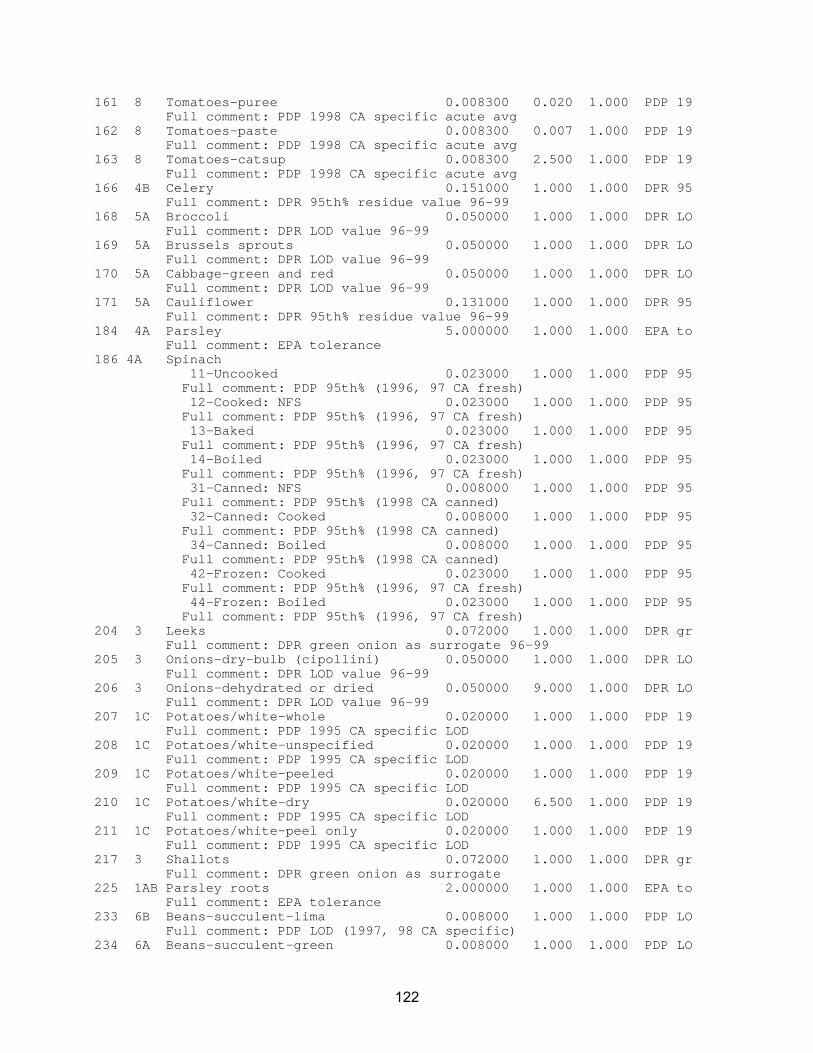
122
161 8 Tomatoes-puree 0.008300 0.020 1.000 PDP 19 Full comment: PDP 1998 CA specific acute avg 162 8 Tomatoes-paste 0.008300 0.007 1.000 PDP 19 Full comment: PDP 1998 CA specific acute avg 163 8 Tomatoes-catsup 0.008300 2.500 1.000 PDP 19 Full comment: PDP 1998 CA specific acute avg 166 4B Celery 0.151000 1.000 1.000 DPR 95 Full comment: DPR 95th% residue value 96-99 168 5A Broccoli 0.050000 1.000 1.000 DPR LO Full comment: DPR LOD value 96-99 169 5A Brussels sprouts 0.050000 1.000 1.000 DPR LO Full comment: DPR LOD value 96-99 170 5A Cabbage-green and red 0.050000 1.000 1.000 DPR LO Full comment: DPR LOD value 96-99 171 5A Cauliflower 0.131000 1.000 1.000 DPR 95 Full comment: DPR 95th% residue value 96-99 184 4A Parsley 5.000000 1.000 1.000 EPA to Full comment: EPA tolerance 186 4A Spinach 11-Uncooked 0.023000 1.000 1.000 PDP 95 Full comment: PDP 95th% (1996, 97 CA fresh) 12-Cooked: NFS 0.023000 1.000 1.000 PDP 95 Full comment: PDP 95th% (1996, 97 CA fresh) 13-Baked 0.023000 1.000 1.000 PDP 95 Full comment: PDP 95th% (1996, 97 CA fresh) 14-Boiled 0.023000 1.000 1.000 PDP 95 Full comment: PDP 95th% (1996, 97 CA fresh) 31-Canned: NFS 0.008000 1.000 1.000 PDP 95 Full comment: PDP 95th% (1998 CA canned) 32-Canned: Cooked 0.008000 1.000 1.000 PDP 95 Full comment: PDP 95th% (1998 CA canned) 34-Canned: Boiled 0.008000 1.000 1.000 PDP 95 Full comment: PDP 95th% (1998 CA canned) 42-Frozen: Cooked 0.023000 1.000 1.000 PDP 95 Full comment: PDP 95th% (1996, 97 CA fresh) 44-Frozen: Boiled 0.023000 1.000 1.000 PDP 95 Full comment: PDP 95th% (1996, 97 CA fresh) 204 3 Leeks 0.072000 1.000 1.000 DPR gr Full comment: DPR green onion as surrogate 96-99 205 3 Onions-dry-bulb (cipollini) 0.050000 1.000 1.000 DPR LO Full comment: DPR LOD value 96-99 206 3 Onions-dehydrated or dried 0.050000 9.000 1.000 DPR LO Full comment: DPR LOD value 96-99 207 1C Potatoes/white-whole 0.020000 1.000 1.000 PDP 19 Full comment: PDP 1995 CA specific LOD 208 1C Potatoes/white-unspecified 0.020000 1.000 1.000 PDP 19 Full comment: PDP 1995 CA specific LOD 209 1C Potatoes/white-peeled 0.020000 1.000 1.000 PDP 19 Full comment: PDP 1995 CA specific LOD 210 1C Potatoes/white-dry 0.020000 6.500 1.000 PDP 19 Full comment: PDP 1995 CA specific LOD 211 1C Potatoes/white-peel only 0.020000 1.000 1.000 PDP 19 Full comment: PDP 1995 CA specific LOD 217 3 Shallots 0.072000 1.000 1.000 DPR gr Full comment: DPR green onion as surrogate 225 1AB Parsley roots 2.000000 1.000 1.000 EPA to Full comment: EPA tolerance 233 6B Beans-succulent-lima 0.008000 1.000 1.000 PDP LO Full comment: PDP LOD (1997, 98 CA specific) 234 6A Beans-succulent-green 0.008000 1.000 1.000 PDP LO

123
Full comment: PDP LOD (1997, 98 CA specific) 235 6A Beans-succulent-other 0.008000 1.000 1.000 PDP LO Full comment: PDP LOD (1997, 98 CA specific) 236 6A Beans-succulent-yellow/wax 0.008000 1.000 1.000 PDP LO Full comment: PDP LOD (1997, 98 CA specific) 250 6B Beans-succulent-broadbeans 0.008000 1.000 1.000 PDP LO Full comment: PDP LOD (1997, 98 CA specific) 257 O Beans-succulent-hyacinth 0.008000 1.000 1.000 PDP LO Full comment: PDP LOD (1997, 98 CA specific) 262 3 Onions-green 0.072000 1.000 1.000 DPR 95 Full comment: DPR 95th% residue value 96-99 283 O Sugar-cane 0.100000 1.000 1.000 REG fi Full comment: REG field trial data, LOD 284 O Sugar-cane/molasses 0.100000 1.000 1.000 REG fi Full comment: REG field trial data, LOD 290 O Cottonseed-oil 0.100000 1.000 1.000 REG fi Full comment: REG field trail data 291 O Cottonseed-meal 0.050000 1.000 1.000 REG fi Full comment: REG field trail data 315 O Grapes-wine and sherry 0.008000 1.000 1.000 PDP CA Full comment: PDP CA specific grape juice LOD 1998 377 11 Apples-juice-concentrate 0.008700 3.000 1.000 PDP a. Full comment: PDP a.j. data (1997, 98, CA specific) 380 13A Blackberries-juice 0.080000 1.000 1.000 DPR hi Full comment: DPR high for caneberries 96-99 383 5B Cabbage-savoy 0.050000 1.000 1.000 DPR LO Full comment: DPR LOD value 96-99 384 4B Celery juice 0.101000 1.000 1.000 DPR ac Full comment: DPR acute average 96-99 389 O Cranberries-juice-concentrate 0.030000 3.300 1.000 REG fi Full comment: REG field trail data 392 O Grapes-juice-concentrate 0.008000 3.000 1.000 PDP CA Full comment: PDP CA specific grape juice LOD 1998 402 12 Peaches-juice 0.015000 1.000 1.000 PDP ac Full comment: PDP acute mean (1996, 97 CA) 404 11 Pears-juice 0.055000 1.000 1.000 PDP ac Full comment: PDP acute mean (1998 CA composite) 416 O Strawberries-juice 0.008000 1.000 1.000 PDP 19 Full comment: PDP 1998 CA specific LOD 420 10 Tangerines-juice-concentrate 0.008000 4.100 1.000 PDP CA Full comment: PDP CA specific O.J. LOD as surrogate 423 8 Tomatoes-dried 0.013000 14.300 1.000 PDP 95 Full comment: PDP 95th% (1998 CA specific) 431 14 Walnut oil 0.100000 1.000 1.000 REG fi Full comment: REG filbert nut as surrogate 436 9A Watermelon-juice 0.008000 1.000 1.000 PDP CA Full comment: PDP CA specific cantaloupe LOD 441 10 Grapefruit-juice-concentrate 0.008000 8.260 1.000 PDP CA Full comment: PDP CA specific O.J. LOD as surrogate 442 10 Lemons-juice-concentrate 0.008000 6.300 1.000 PDP CA Full comment: PDP CA specific O.J. LOD as surrogate 443 10 Limes-juice-concentrate 0.008000 3.000 1.000 PDP CA Full comment: PDP CA specific O.J. LOD as surrogate 448 10 Grapefruit peel 0.171000 1.000 1.000 DPR 95 Full comment: DPR 95th% residue value 96-99 451 5A Broccoli-chinese 0.050000 1.000 1.000 DPR LO Full comment: DPR LOD value 96-99 467 19B Celery seed 0.101000 1.000 1.000 DPR ac Full comment: DPR acute average 96-99

124
California Department of Pesticide Regulation Ver. 7.76 DEEM ACUTE Analysis for AZINPHOS METHYL (1994-98 data) Residue file: azinphos-methyl-dietary-acute2002.RS7 Adjustment factor #2 NOT used. Analysis Date: 04-23-2002/15:30:26 Residue file dated: 12-21-2001/09:04:44/14 NOEL (Acute) = 0.750000 mg/kg body-wt/day Daily totals for food and foodform consumption used. Run Comment: "DPR acute NOEL (human blood ChE inhibition)." =============================================================================== Summary calculations (per capita): 95th Percentile 99th Percentile 99.9th Percentile Exposure MOE Exposure MOE Exposure MOE ---------- -------- ---------- -------- ---------- -------- U.S. Population: 0.000998 751 0.002088 359 0.004515 166 Western region: 0.001125 666 0.002255 332 0.004683 160 Nursing infants (<1 yr old): 0.002812 266 0.004776 157 0.006777 110 Non-nursing infants (<1 yr old): 0.003457 216 0.005498 136 0.008089 92 Children 1-6 yrs: 0.002356 318 0.003987 188 0.007131 105 Children 7-12 yrs: 0.001282 585 0.002472 303 0.004686 160 Females 13+ (preg/not nursing): 0.000755 994 0.001378 544 0.002203 340 Females 13+ (nursing): 0.000685 1094 0.001213 618 0.001453 516 Females 13-19 (not preg or nursing): 0.000635 1180 0.001117 671 0.001498 500 Females 20+ (not preg or nursing): 0.000711 1054 0.001263 593 0.002084 359 Males 13-19 yrs: 0.000731 1025 0.001173 639 0.002255 332 Males 20+ yrs: 0.000672 1116 0.001107 677 0.001936 387 Seniors 55+: 0.000782 958 0.001336 561 0.002391 313 Custom demographics 1: Workers, 16+ yrs: 0.000682 1099 0.001191 629 0.002075 361
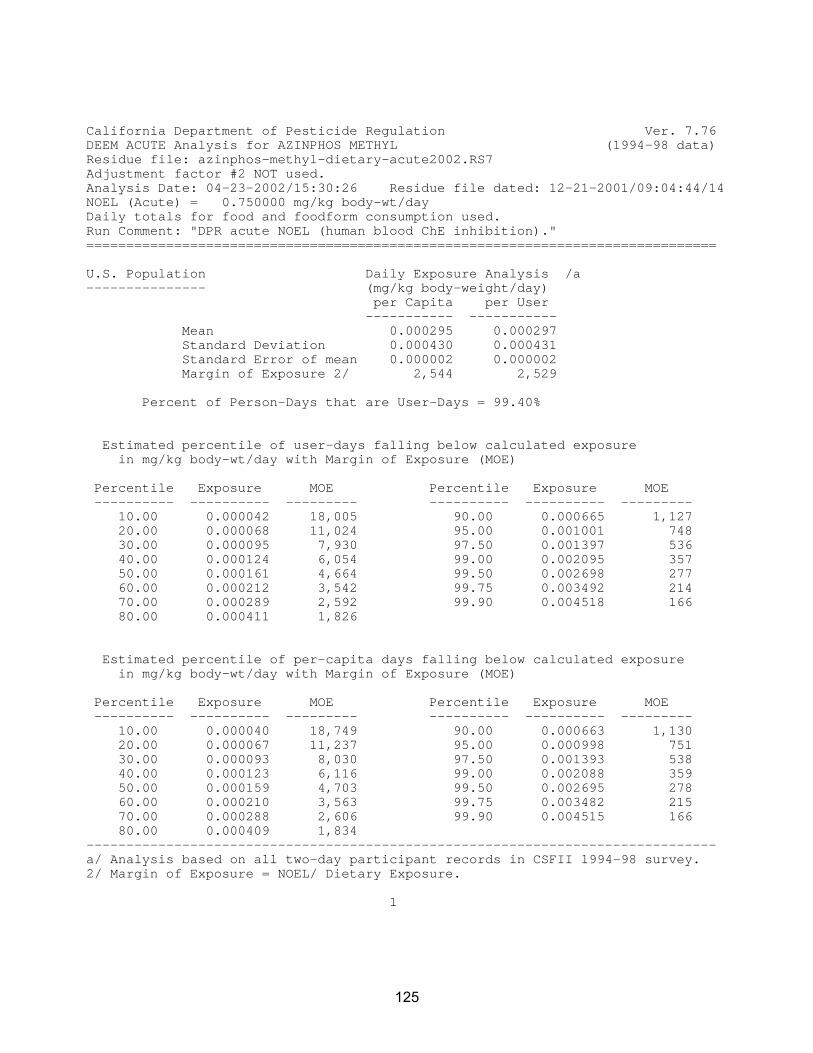
125
California Department of Pesticide Regulation Ver. 7.76 DEEM ACUTE Analysis for AZINPHOS METHYL (1994-98 data) Residue file: azinphos-methyl-dietary-acute2002.RS7 Adjustment factor #2 NOT used. Analysis Date: 04-23-2002/15:30:26 Residue file dated: 12-21-2001/09:04:44/14 NOEL (Acute) = 0.750000 mg/kg body-wt/day Daily totals for food and foodform consumption used. Run Comment: "DPR acute NOEL (human blood ChE inhibition)." =============================================================================== U.S. Population Daily Exposure Analysis /a --------------- (mg/kg body-weight/day) per Capita per User ----------- ----------- Mean 0.000295 0.000297 Standard Deviation 0.000430 0.000431 Standard Error of mean 0.000002 0.000002 Margin of Exposure 2/ 2,544 2,529 Percent of Person-Days that are User-Days = 99.40% Estimated percentile of user-days falling below calculated exposure in mg/kg body-wt/day with Margin of Exposure (MOE) Percentile Exposure MOE Percentile Exposure MOE ---------- ---------- --------- ---------- ---------- --------- 10.00 0.000042 18,005 90.00 0.000665 1,127 20.00 0.000068 11,024 95.00 0.001001 748 30.00 0.000095 7,930 97.50 0.001397 536 40.00 0.000124 6,054 99.00 0.002095 357 50.00 0.000161 4,664 99.50 0.002698 277 60.00 0.000212 3,542 99.75 0.003492 214 70.00 0.000289 2,592 99.90 0.004518 166 80.00 0.000411 1,826 Estimated percentile of per-capita days falling below calculated exposure in mg/kg body-wt/day with Margin of Exposure (MOE) Percentile Exposure MOE Percentile Exposure MOE ---------- ---------- --------- ---------- ---------- --------- 10.00 0.000040 18,749 90.00 0.000663 1,130 20.00 0.000067 11,237 95.00 0.000998 751 30.00 0.000093 8,030 97.50 0.001393 538 40.00 0.000123 6,116 99.00 0.002088 359 50.00 0.000159 4,703 99.50 0.002695 278 60.00 0.000210 3,563 99.75 0.003482 215 70.00 0.000288 2,606 99.90 0.004515 166 80.00 0.000409 1,834 ------------------------------------------------------------------------------- a/ Analysis based on all two-day participant records in CSFII 1994-98 survey. 2/ Margin of Exposure = NOEL/ Dietary Exposure. 1

126
California Department of Pesticide Regulation Ver. 7.76 DEEM ACUTE Analysis for AZINPHOS METHYL (1994-98 data) Residue file: azinphos-methyl-dietary-acute2002.RS7 Adjustment factor #2 NOT used. Analysis Date: 04-23-2002/15:30:26 Residue file dated: 12-21-2001/09:04:44/14 NOEL (Acute) = 0.750000 mg/kg body-wt/day Daily totals for food and foodform consumption used. Run Comment: "DPR acute NOEL (human blood ChE inhibition)." =============================================================================== Western region Daily Exposure Analysis -------------- (mg/kg body-weight/day) per Capita per User ----------- ----------- Mean 0.000332 0.000335 Standard Deviation 0.000466 0.000467 Standard Error of mean 0.000005 0.000005 Margin of Exposure 2,261 2,241 Percent of Person-Days that are User-Days = 99.14% Estimated percentile of user-days falling below calculated exposure in mg/kg body-wt/day with Margin of Exposure (MOE) Percentile Exposure MOE Percentile Exposure MOE ---------- ---------- --------- ---------- ---------- --------- 10.00 0.000047 16,051 90.00 0.000748 1,003 20.00 0.000076 9,870 95.00 0.001133 662 30.00 0.000108 6,957 97.50 0.001597 469 40.00 0.000140 5,338 99.00 0.002261 331 50.00 0.000187 4,015 99.50 0.002820 265 60.00 0.000245 3,062 99.75 0.003673 204 70.00 0.000336 2,231 99.90 0.004685 160 80.00 0.000470 1,596 Estimated percentile of per-capita days falling below calculated exposure in mg/kg body-wt/day with Margin of Exposure (MOE) Percentile Exposure MOE Percentile Exposure MOE ---------- ---------- --------- ---------- ---------- --------- 10.00 0.000044 16,978 90.00 0.000743 1,008 20.00 0.000074 10,197 95.00 0.001125 666 30.00 0.000105 7,110 97.50 0.001591 471 40.00 0.000139 5,400 99.00 0.002255 332 50.00 0.000185 4,050 99.50 0.002798 268 60.00 0.000243 3,090 99.75 0.003654 205 70.00 0.000332 2,257 99.90 0.004683 160 80.00 0.000467 1,605 2

127
California Department of Pesticide Regulation Ver. 7.76 DEEM ACUTE Analysis for AZINPHOS METHYL (1994-98 data) Residue file: azinphos-methyl-dietary-acute2002.RS7 Adjustment factor #2 NOT used. Analysis Date: 04-23-2002/15:30:26 Residue file dated: 12-21-2001/09:04:44/14 NOEL (Acute) = 0.750000 mg/kg body-wt/day Daily totals for food and foodform consumption used. Run Comment: "DPR acute NOEL (human blood ChE inhibition)." =============================================================================== Nursing infants (<1 yr old) Daily Exposure Analysis --------------------------- (mg/kg body-weight/day) per Capita per User ----------- ----------- Mean 0.000479 0.001023 Standard Deviation 0.001017 0.001286 Standard Error of mean 0.000035 0.000063 Margin of Exposure 1,565 733 Percent of Person-Days that are User-Days = 46.85% Estimated percentile of user-days falling below calculated exposure in mg/kg body-wt/day with Margin of Exposure (MOE) Percentile Exposure MOE Percentile Exposure MOE ---------- ---------- --------- ---------- ---------- --------- 10.00 0.000042 17,951 90.00 0.002882 260 20.00 0.000093 8,084 95.00 0.003943 190 30.00 0.000188 3,995 97.50 0.004748 157 40.00 0.000303 2,477 99.00 0.006181 121 50.00 0.000489 1,534 99.50 0.006371 117 60.00 0.000789 950 99.75 0.006572 114 70.00 0.001227 611 99.90 0.006786 110 80.00 0.001710 438 Estimated percentile of per-capita days falling below calculated exposure in mg/kg body-wt/day with Margin of Exposure (MOE) Percentile Exposure MOE Percentile Exposure MOE ---------- ---------- --------- ---------- ---------- --------- 10.00 0.000000 >1,000,000 90.00 0.001627 460 20.00 0.000000 >1,000,000 95.00 0.002812 266 30.00 0.000000 >1,000,000 97.50 0.003907 191 40.00 0.000000 >1,000,000 99.00 0.004776 157 50.00 0.000000 >1,000,000 99.50 0.006168 121 60.00 0.000076 9,836 99.75 0.006367 117 70.00 0.000241 3,110 99.90 0.006777 110 80.00 0.000706 1,061 3

128
California Department of Pesticide Regulation Ver. 7.76 DEEM ACUTE Analysis for AZINPHOS METHYL (1994-98 data) Residue file: azinphos-methyl-dietary-acute2002.RS7 Adjustment factor #2 NOT used. Analysis Date: 04-23-2002/15:30:26 Residue file dated: 12-21-2001/09:04:44/14 NOEL (Acute) = 0.750000 mg/kg body-wt/day Daily totals for food and foodform consumption used. Run Comment: "DPR acute NOEL (human blood ChE inhibition)." =============================================================================== Non-nursing infants (<1 yr old) Daily Exposure Analysis ------------------------------- (mg/kg body-weight/day) per Capita per User ----------- ----------- Mean 0.000861 0.001084 Standard Deviation 0.001189 0.001240 Standard Error of mean 0.000026 0.000030 Margin of Exposure 871 692 Percent of Person-Days that are User-Days = 79.42% Estimated percentile of user-days falling below calculated exposure in mg/kg body-wt/day with Margin of Exposure (MOE) Percentile Exposure MOE Percentile Exposure MOE ---------- ---------- --------- ---------- ---------- --------- 10.00 0.000127 5,924 90.00 0.002760 271 20.00 0.000223 3,366 95.00 0.003749 200 30.00 0.000299 2,508 97.50 0.004405 170 40.00 0.000403 1,863 99.00 0.005628 133 50.00 0.000542 1,382 99.50 0.005975 125 60.00 0.000858 873 99.75 0.006931 108 70.00 0.001276 587 99.90 0.010068 74 80.00 0.001822 411 Estimated percentile of per-capita days falling below calculated exposure in mg/kg body-wt/day with Margin of Exposure (MOE) Percentile Exposure MOE Percentile Exposure MOE ---------- ---------- --------- ---------- ---------- --------- 10.00 0.000000 >1,000,000 90.00 0.002421 309 20.00 0.000000 >1,000,000 95.00 0.003457 216 30.00 0.000144 5,200 97.50 0.004210 178 40.00 0.000262 2,865 99.00 0.005498 136 50.00 0.000363 2,068 99.50 0.005881 127 60.00 0.000530 1,414 99.75 0.006456 116 70.00 0.000939 798 99.90 0.008089 92 80.00 0.001511 496 4

129
California Department of Pesticide Regulation Ver. 7.76 DEEM ACUTE Analysis for AZINPHOS METHYL (1994-98 data) Residue file: azinphos-methyl-dietary-acute2002.RS7 Adjustment factor #2 NOT used. Analysis Date: 04-23-2002/15:30:26 Residue file dated: 12-21-2001/09:04:44/14 NOEL (Acute) = 0.750000 mg/kg body-wt/day Daily totals for food and foodform consumption used. Run Comment: "DPR acute NOEL (human blood ChE inhibition)." =============================================================================== Children 1-6 yrs Daily Exposure Analysis ----------------- (mg/kg body-weight/day) per Capita per User ----------- ----------- Mean 0.000764 0.000764 Standard Deviation 0.000837 0.000837 Standard Error of mean 0.000007 0.000007 Margin of Exposure 981 981 Percent of Person-Days that are User-Days = 99.92% Estimated percentile of user-days falling below calculated exposure in mg/kg body-wt/day with Margin of Exposure (MOE) Percentile Exposure MOE Percentile Exposure MOE ---------- ---------- --------- ---------- ---------- --------- 10.00 0.000135 5,574 90.00 0.001752 428 20.00 0.000209 3,582 95.00 0.002357 318 30.00 0.000283 2,650 97.50 0.002997 250 40.00 0.000363 2,065 99.00 0.003988 188 50.00 0.000463 1,620 99.50 0.004754 157 60.00 0.000619 1,211 99.75 0.005630 133 70.00 0.000852 879 99.90 0.007132 105 80.00 0.001187 631 Estimated percentile of per-capita days falling below calculated exposure in mg/kg body-wt/day with Margin of Exposure (MOE) Percentile Exposure MOE Percentile Exposure MOE ---------- ---------- --------- ---------- ---------- --------- 10.00 0.000134 5,595 90.00 0.001752 428 20.00 0.000209 3,588 95.00 0.002356 318 30.00 0.000283 2,654 97.50 0.002995 250 40.00 0.000363 2,067 99.00 0.003987 188 50.00 0.000462 1,622 99.50 0.004753 157 60.00 0.000619 1,212 99.75 0.005629 133 70.00 0.000852 880 99.90 0.007131 105 80.00 0.001187 631 5

130
California Department of Pesticide Regulation Ver. 7.76 DEEM ACUTE Analysis for AZINPHOS METHYL (1994-98 data) Residue file: azinphos-methyl-dietary-acute2002.RS7 Adjustment factor #2 NOT used. Analysis Date: 04-23-2002/15:30:26 Residue file dated: 12-21-2001/09:04:44/14 NOEL (Acute) = 0.750000 mg/kg body-wt/day Daily totals for food and foodform consumption used. Run Comment: "DPR acute NOEL (human blood ChE inhibition)." =============================================================================== Children 7-12 yrs Daily Exposure Analysis ----------------- (mg/kg body-weight/day) per Capita per User ----------- ----------- Mean 0.000414 0.000414 Standard Deviation 0.000486 0.000486 Standard Error of mean 0.000009 0.000009 Margin of Exposure 1,811 1,811 Percent of Person-Days that are User-Days =100.00% Estimated percentile of user-days falling below calculated exposure in mg/kg body-wt/day with Margin of Exposure (MOE) Percentile Exposure MOE Percentile Exposure MOE ---------- ---------- --------- ---------- ---------- --------- 10.00 0.000080 9,336 90.00 0.000952 787 20.00 0.000117 6,385 95.00 0.001282 585 30.00 0.000155 4,853 97.50 0.001708 439 40.00 0.000194 3,860 99.00 0.002472 303 50.00 0.000242 3,104 99.50 0.003166 236 60.00 0.000316 2,375 99.75 0.003714 201 70.00 0.000436 1,720 99.90 0.004686 160 80.00 0.000618 1,213 Estimated percentile of per-capita days falling below calculated exposure in mg/kg body-wt/day with Margin of Exposure (MOE) Percentile Exposure MOE Percentile Exposure MOE ---------- ---------- --------- ---------- ---------- --------- 10.00 0.000080 9,336 90.00 0.000952 787 20.00 0.000117 6,385 95.00 0.001282 585 30.00 0.000155 4,853 97.50 0.001708 439 40.00 0.000194 3,860 99.00 0.002472 303 50.00 0.000242 3,104 99.50 0.003166 236 60.00 0.000316 2,375 99.75 0.003714 201 70.00 0.000436 1,720 99.90 0.004686 160 80.00 0.000618 1,213 6

131
California Department of Pesticide Regulation Ver. 7.76 DEEM ACUTE Analysis for AZINPHOS METHYL (1994-98 data) Residue file: azinphos-methyl-dietary-acute2002.RS7 Adjustment factor #2 NOT used. Analysis Date: 04-23-2002/15:30:26 Residue file dated: 12-21-2001/09:04:44/14 NOEL (Acute) = 0.750000 mg/kg body-wt/day Daily totals for food and foodform consumption used. Run Comment: "DPR acute NOEL (human blood ChE inhibition)." =============================================================================== Females 13+ (preg/not nursing) Daily Exposure Analysis ------------------------------ (mg/kg body-weight/day) per Capita per User ----------- ----------- Mean 0.000273 0.000273 Standard Deviation 0.000294 0.000294 Standard Error of mean 0.000025 0.000025 Margin of Exposure 2,745 2,745 Percent of Person-Days that are User-Days =100.00% Estimated percentile of user-days falling below calculated exposure in mg/kg body-wt/day with Margin of Exposure (MOE) Percentile Exposure MOE Percentile Exposure MOE ---------- ---------- --------- ---------- ---------- --------- 10.00 0.000044 17,047 90.00 0.000596 1,259 20.00 0.000084 8,967 95.00 0.000755 994 30.00 0.000114 6,596 97.50 0.001209 620 40.00 0.000147 5,117 99.00 0.001378 544 50.00 0.000190 3,948 99.50 0.002189 342 60.00 0.000237 3,159 99.75 0.002198 341 70.00 0.000281 2,671 99.90 0.002203 340 80.00 0.000412 1,819 Estimated percentile of per-capita days falling below calculated exposure in mg/kg body-wt/day with Margin of Exposure (MOE) Percentile Exposure MOE Percentile Exposure MOE ---------- ---------- --------- ---------- ---------- --------- 10.00 0.000044 17,047 90.00 0.000596 1,259 20.00 0.000084 8,967 95.00 0.000755 994 30.00 0.000114 6,596 97.50 0.001209 620 40.00 0.000147 5,117 99.00 0.001378 544 50.00 0.000190 3,948 99.50 0.002189 342 60.00 0.000237 3,159 99.75 0.002198 341 70.00 0.000281 2,671 99.90 0.002203 340 80.00 0.000412 1,819 7

132
California Department of Pesticide Regulation Ver. 7.76 DEEM ACUTE Analysis for AZINPHOS METHYL (1994-98 data) Residue file: azinphos-methyl-dietary-acute2002.RS7 Adjustment factor #2 NOT used. Analysis Date: 04-23-2002/15:30:26 Residue file dated: 12-21-2001/09:04:44/14 NOEL (Acute) = 0.750000 mg/kg body-wt/day Daily totals for food and foodform consumption used. Run Comment: "DPR acute NOEL (human blood ChE inhibition)." =============================================================================== Females 13+ (nursing) Daily Exposure Analysis --------------------- (mg/kg body-weight/day) per Capita per User ----------- ----------- Mean 0.000275 0.000275 Standard Deviation 0.000247 0.000247 Standard Error of mean 0.000027 0.000027 Margin of Exposure 2,722 2,722 Percent of Person-Days that are User-Days =100.00% Estimated percentile of user-days falling below calculated exposure in mg/kg body-wt/day with Margin of Exposure (MOE) Percentile Exposure MOE Percentile Exposure MOE ---------- ---------- --------- ---------- ---------- --------- 10.00 0.000053 14,136 90.00 0.000625 1,199 20.00 0.000080 9,420 95.00 0.000685 1,094 30.00 0.000113 6,654 97.50 0.001078 695 40.00 0.000166 4,527 99.00 0.001213 618 50.00 0.000218 3,435 99.50 0.001452 516 60.00 0.000252 2,976 99.75 0.001453 516 70.00 0.000313 2,399 99.90 0.001453 516 80.00 0.000406 1,848 Estimated percentile of per-capita days falling below calculated exposure in mg/kg body-wt/day with Margin of Exposure (MOE) Percentile Exposure MOE Percentile Exposure MOE ---------- ---------- --------- ---------- ---------- --------- 10.00 0.000053 14,136 90.00 0.000625 1,199 20.00 0.000080 9,420 95.00 0.000685 1,094 30.00 0.000113 6,654 97.50 0.001078 695 40.00 0.000166 4,527 99.00 0.001213 618 50.00 0.000218 3,435 99.50 0.001452 516 60.00 0.000252 2,976 99.75 0.001453 516 70.00 0.000313 2,399 99.90 0.001453 516 80.00 0.000406 1,848 8

133
California Department of Pesticide Regulation Ver. 7.76 DEEM ACUTE Analysis for AZINPHOS METHYL (1994-98 data) Residue file: azinphos-methyl-dietary-acute2002.RS7 Adjustment factor #2 NOT used. Analysis Date: 04-23-2002/15:30:26 Residue file dated: 12-21-2001/09:04:44/14 NOEL (Acute) = 0.750000 mg/kg body-wt/day Daily totals for food and foodform consumption used. Run Comment: "DPR acute NOEL (human blood ChE inhibition)." =============================================================================== Females 13-19 (not preg or nursing)Daily Exposure Analysis -----------------------------------(mg/kg body-weight/day) per Capita per User ----------- ----------- Mean 0.000207 0.000207 Standard Deviation 0.000218 0.000218 Standard Error of mean 0.000006 0.000006 Margin of Exposure 3,629 3,622 Percent of Person-Days that are User-Days = 99.80% Estimated percentile of user-days falling below calculated exposure in mg/kg body-wt/day with Margin of Exposure (MOE) Percentile Exposure MOE Percentile Exposure MOE ---------- ---------- --------- ---------- ---------- --------- 10.00 0.000040 18,868 90.00 0.000461 1,628 20.00 0.000065 11,514 95.00 0.000636 1,179 30.00 0.000087 8,607 97.50 0.000839 894 40.00 0.000108 6,970 99.00 0.001118 671 50.00 0.000134 5,614 99.50 0.001339 560 60.00 0.000172 4,355 99.75 0.001466 511 70.00 0.000220 3,401 99.90 0.001498 500 80.00 0.000298 2,516 Estimated percentile of per-capita days falling below calculated exposure in mg/kg body-wt/day with Margin of Exposure (MOE) Percentile Exposure MOE Percentile Exposure MOE ---------- ---------- --------- ---------- ---------- --------- 10.00 0.000039 19,003 90.00 0.000459 1,633 20.00 0.000065 11,593 95.00 0.000635 1,180 30.00 0.000087 8,636 97.50 0.000839 894 40.00 0.000107 6,988 99.00 0.001117 671 50.00 0.000133 5,628 99.50 0.001338 560 60.00 0.000172 4,363 99.75 0.001466 511 70.00 0.000220 3,404 99.90 0.001498 500 80.00 0.000298 2,520 9
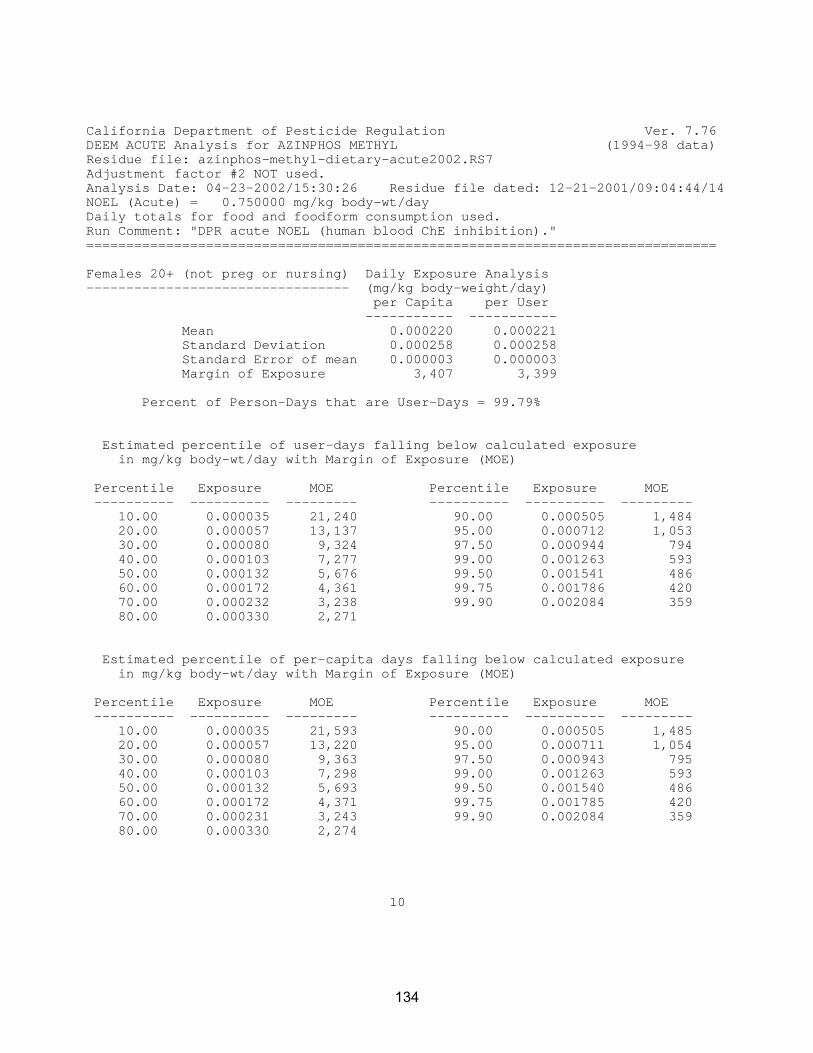
134
California Department of Pesticide Regulation Ver. 7.76 DEEM ACUTE Analysis for AZINPHOS METHYL (1994-98 data) Residue file: azinphos-methyl-dietary-acute2002.RS7 Adjustment factor #2 NOT used. Analysis Date: 04-23-2002/15:30:26 Residue file dated: 12-21-2001/09:04:44/14 NOEL (Acute) = 0.750000 mg/kg body-wt/day Daily totals for food and foodform consumption used. Run Comment: "DPR acute NOEL (human blood ChE inhibition)." =============================================================================== Females 20+ (not preg or nursing) Daily Exposure Analysis --------------------------------- (mg/kg body-weight/day) per Capita per User ----------- ----------- Mean 0.000220 0.000221 Standard Deviation 0.000258 0.000258 Standard Error of mean 0.000003 0.000003 Margin of Exposure 3,407 3,399 Percent of Person-Days that are User-Days = 99.79% Estimated percentile of user-days falling below calculated exposure in mg/kg body-wt/day with Margin of Exposure (MOE) Percentile Exposure MOE Percentile Exposure MOE ---------- ---------- --------- ---------- ---------- --------- 10.00 0.000035 21,240 90.00 0.000505 1,484 20.00 0.000057 13,137 95.00 0.000712 1,053 30.00 0.000080 9,324 97.50 0.000944 794 40.00 0.000103 7,277 99.00 0.001263 593 50.00 0.000132 5,676 99.50 0.001541 486 60.00 0.000172 4,361 99.75 0.001786 420 70.00 0.000232 3,238 99.90 0.002084 359 80.00 0.000330 2,271 Estimated percentile of per-capita days falling below calculated exposure in mg/kg body-wt/day with Margin of Exposure (MOE) Percentile Exposure MOE Percentile Exposure MOE ---------- ---------- --------- ---------- ---------- --------- 10.00 0.000035 21,593 90.00 0.000505 1,485 20.00 0.000057 13,220 95.00 0.000711 1,054 30.00 0.000080 9,363 97.50 0.000943 795 40.00 0.000103 7,298 99.00 0.001263 593 50.00 0.000132 5,693 99.50 0.001540 486 60.00 0.000172 4,371 99.75 0.001785 420 70.00 0.000231 3,243 99.90 0.002084 359 80.00 0.000330 2,274 10

135
California Department of Pesticide Regulation Ver. 7.76 DEEM ACUTE Analysis for AZINPHOS METHYL (1994-98 data) Residue file: azinphos-methyl-dietary-acute2002.RS7 Adjustment factor #2 NOT used. Analysis Date: 04-23-2002/15:30:26 Residue file dated: 12-21-2001/09:04:44/14 NOEL (Acute) = 0.750000 mg/kg body-wt/day Daily totals for food and foodform consumption used. Run Comment: "DPR acute NOEL (human blood ChE inhibition)." =============================================================================== Males 13-19 yrs Daily Exposure Analysis --------------- (mg/kg body-weight/day) per Capita per User ----------- ----------- Mean 0.000230 0.000230 Standard Deviation 0.000247 0.000247 Standard Error of mean 0.000007 0.000007 Margin of Exposure 3,258 3,258 Percent of Person-Days that are User-Days =100.00% Estimated percentile of user-days falling below calculated exposure in mg/kg body-wt/day with Margin of Exposure (MOE) Percentile Exposure MOE Percentile Exposure MOE ---------- ---------- --------- ---------- ---------- --------- 10.00 0.000044 17,070 90.00 0.000517 1,449 20.00 0.000069 10,812 95.00 0.000731 1,025 30.00 0.000096 7,815 97.50 0.000885 847 40.00 0.000118 6,356 99.00 0.001173 639 50.00 0.000145 5,179 99.50 0.001393 538 60.00 0.000184 4,081 99.75 0.002080 360 70.00 0.000250 3,003 99.90 0.002255 332 80.00 0.000338 2,215 Estimated percentile of per-capita days falling below calculated exposure in mg/kg body-wt/day with Margin of Exposure (MOE) Percentile Exposure MOE Percentile Exposure MOE ---------- ---------- --------- ---------- ---------- --------- 10.00 0.000044 17,070 90.00 0.000517 1,449 20.00 0.000069 10,812 95.00 0.000731 1,025 30.00 0.000096 7,815 97.50 0.000885 847 40.00 0.000118 6,356 99.00 0.001173 639 50.00 0.000145 5,179 99.50 0.001393 538 60.00 0.000184 4,081 99.75 0.002080 360 70.00 0.000250 3,003 99.90 0.002255 332 80.00 0.000338 2,215 11

136
California Department of Pesticide Regulation Ver. 7.76 DEEM ACUTE Analysis for AZINPHOS METHYL (1994-98 data) Residue file: azinphos-methyl-dietary-acute2002.RS7 Adjustment factor #2 NOT used. Analysis Date: 04-23-2002/15:30:26 Residue file dated: 12-21-2001/09:04:44/14 NOEL (Acute) = 0.750000 mg/kg body-wt/day Daily totals for food and foodform consumption used. Run Comment: "DPR acute NOEL (human blood ChE inhibition)." =============================================================================== Males 20+ yrs Daily Exposure Analysis ------------- (mg/kg body-weight/day) per Capita per User ----------- ----------- Mean 0.000215 0.000215 Standard Deviation 0.000239 0.000239 Standard Error of mean 0.000002 0.000002 Margin of Exposure 3,495 3,487 Percent of Person-Days that are User-Days = 99.77% Estimated percentile of user-days falling below calculated exposure in mg/kg body-wt/day with Margin of Exposure (MOE) Percentile Exposure MOE Percentile Exposure MOE ---------- ---------- --------- ---------- ---------- --------- 10.00 0.000036 20,599 90.00 0.000491 1,528 20.00 0.000061 12,350 95.00 0.000673 1,114 30.00 0.000082 9,114 97.50 0.000861 871 40.00 0.000109 6,895 99.00 0.001108 677 50.00 0.000138 5,427 99.50 0.001350 555 60.00 0.000175 4,290 99.75 0.001606 466 70.00 0.000228 3,291 99.90 0.001936 387 80.00 0.000322 2,325 Estimated percentile of per-capita days falling below calculated exposure in mg/kg body-wt/day with Margin of Exposure (MOE) Percentile Exposure MOE Percentile Exposure MOE ---------- ---------- --------- ---------- ---------- --------- 10.00 0.000036 20,907 90.00 0.000490 1,530 20.00 0.000060 12,417 95.00 0.000672 1,116 30.00 0.000082 9,151 97.50 0.000860 872 40.00 0.000108 6,918 99.00 0.001107 677 50.00 0.000138 5,443 99.50 0.001350 555 60.00 0.000174 4,304 99.75 0.001606 467 70.00 0.000227 3,299 99.90 0.001936 387 80.00 0.000322 2,330 12

137
California Department of Pesticide Regulation Ver. 7.76 DEEM ACUTE Analysis for AZINPHOS METHYL (1994-98 data) Residue file: azinphos-methyl-dietary-acute2002.RS7 Adjustment factor #2 NOT used. Analysis Date: 04-23-2002/15:30:26 Residue file dated: 12-21-2001/09:04:44/14 NOEL (Acute) = 0.750000 mg/kg body-wt/day Daily totals for food and foodform consumption used. Run Comment: "DPR acute NOEL (human blood ChE inhibition)." =============================================================================== Seniors 55+ Daily Exposure Analysis ----------- (mg/kg body-weight/day) per Capita per User ----------- ----------- Mean 0.000247 0.000247 Standard Deviation 0.000283 0.000283 Standard Error of mean 0.000003 0.000003 Margin of Exposure 3,036 3,033 Percent of Person-Days that are User-Days = 99.89% Estimated percentile of user-days falling below calculated exposure in mg/kg body-wt/day with Margin of Exposure (MOE) Percentile Exposure MOE Percentile Exposure MOE ---------- ---------- --------- ---------- ---------- --------- 10.00 0.000036 21,043 90.00 0.000584 1,285 20.00 0.000060 12,527 95.00 0.000782 958 30.00 0.000084 8,882 97.50 0.000984 761 40.00 0.000112 6,722 99.00 0.001336 561 50.00 0.000148 5,063 99.50 0.001603 467 60.00 0.000200 3,756 99.75 0.001805 415 70.00 0.000279 2,683 99.90 0.002391 313 80.00 0.000387 1,936 Estimated percentile of per-capita days falling below calculated exposure in mg/kg body-wt/day with Margin of Exposure (MOE) Percentile Exposure MOE Percentile Exposure MOE ---------- ---------- --------- ---------- ---------- --------- 10.00 0.000035 21,212 90.00 0.000583 1,286 20.00 0.000060 12,579 95.00 0.000782 958 30.00 0.000084 8,904 97.50 0.000984 762 40.00 0.000111 6,734 99.00 0.001336 561 50.00 0.000148 5,072 99.50 0.001603 468 60.00 0.000199 3,763 99.75 0.001804 415 70.00 0.000279 2,686 99.90 0.002391 313 80.00 0.000387 1,938 13

138
California Department of Pesticide Regulation Ver. 7.76 DEEM ACUTE Analysis for AZINPHOS METHYL (1994-98 data) Residue file: azinphos-methyl-dietary-acute2002.RS7 Adjustment factor #2 NOT used. Analysis Date: 04-23-2002/15:30:26 Residue file dated: 12-21-2001/09:04:44/14 NOEL (Acute) = 0.750000 mg/kg body-wt/day Daily totals for food and foodform consumption used. Run Comment: "DPR acute NOEL (human blood ChE inhibition)." =============================================================================== Custom demographics 1: Workers, 16+ yrs All Seasons All Regions Sex: M/F-all/ All Races Age-Low: 16 yrs High: 99 yrs --------------------------------------- Daily Exposure Analysis (mg/kg body-weight/day) per Capita per User ----------- ----------- Mean 0.000217 0.000218 Standard Deviation 0.000247 0.000248 Standard Error of mean 0.000002 0.000002 Margin of Exposure 3,451 3,444 Percent of Person-Days that are User-Days = 99.79% Estimated percentile of user-days falling below calculated exposure in mg/kg body-wt/day with Margin of Exposure (MOE) Percentile Exposure MOE Percentile Exposure MOE ---------- ---------- --------- ---------- ---------- --------- 10.00 0.000036 20,774 90.00 0.000499 1,503 20.00 0.000059 12,661 95.00 0.000683 1,098 30.00 0.000082 9,140 97.50 0.000891 841 40.00 0.000106 7,055 99.00 0.001192 629 50.00 0.000135 5,540 99.50 0.001438 521 60.00 0.000174 4,310 99.75 0.001676 447 70.00 0.000231 3,248 99.90 0.002076 361 80.00 0.000326 2,301 Estimated percentile of per-capita days falling below calculated exposure in mg/kg body-wt/day with Margin of Exposure (MOE) Percentile Exposure MOE Percentile Exposure MOE ---------- ---------- --------- ---------- ---------- --------- 10.00 0.000036 21,049 90.00 0.000498 1,504 20.00 0.000059 12,747 95.00 0.000682 1,099 30.00 0.000082 9,176 97.50 0.000891 841 40.00 0.000106 7,079 99.00 0.001191 629 50.00 0.000135 5,555 99.50 0.001437 521 60.00 0.000174 4,320 99.75 0.001675 447 70.00 0.000230 3,253 99.90 0.002075 361 80.00 0.000326 2,304 14

139
California Department of Pesticide Regulation DEEM Acute Critical Exposure Contribution Analysis (Ver 7.76) CSFII 1994-98 Residue file = H:\MyFiles\DEEM Files\Azinphos-methyl\azinphos-methyl-dietary-acute2002.RS7 Acute report = H:\MyFiles\DEEM Files\Azinphos-methyl\AZM acute 2002.AC7 Date and time of analysis: 04-23-2002 14:50:38 Daily totals for food and foodform consumption used. Adjustment factor #2 not used. Minimum exposure contribution = 5% Exposures divided by body weight Subpopulations: 1 U.S. Population 2 Western region 3 Nursing infants (<1 yr old) 4 Non-nursing infants (<1 yr old) 5 Children 1-6 yrs 6 Children 7-12 yrs 7 Females 13+ (preg/not nursing) 8 Females 13+ (nursing) 9 Females 13-19 (not preg or nursing) 10 Females 20+ (not preg or nursing) 11 Males 13-19 yrs 12 Males 20+ yrs 13 Seniors 55+ ================================================================================ U.S. Population Low percentile for CEC records: 95 Exposure (mg/day) = 0.000998 High percentile for CEC records: 96 Exposure (mg/day) = 0.001120 Number of actual records in this interval: 749 Critical foods/foodforms for this population (as derived from these records): N=number of appearances in all records (including duplicates) %=percent of total exposure for all records (including duplicates) Food FF N Percent Food Name ---- -- ----- ------- ------------- 52 11 260 21.69% Apples-Uncooked 52 14 72 5.94% Apples-Boiled 283 98 361 5.38% Sugar-cane-Refined 184 14 67 5.10% Parsley-Boiled

140
================================================================================ Western region Low percentile for CEC records: 95 Exposure (mg/day) = 0.001125 High percentile for CEC records: 96 Exposure (mg/day) = 0.001271 Number of actual records in this interval: 192 Critical foods/foodforms for this population (as derived from these records): N=number of appearances in all records (including duplicates) %=percent of total exposure for all records (including duplicates) Food FF N Percent Food Name ---- -- ----- ------- ------------- 52 11 89 30.05% Apples-Uncooked 52 14 25 8.33% Apples-Boiled ================================================================================ Nursing infants (<1 yr old) Low percentile for CEC records: 95 Exposure (mg/day) = 0.002812 High percentile for CEC records: 96 Exposure (mg/day) = 0.003083 Number of actual records in this interval: 8 Critical foods/foodforms for this population (as derived from these records): N=number of appearances in all records (including duplicates) %=percent of total exposure for all records (including duplicates) Food FF N Percent Food Name ---- -- ----- ------- ------------- 52 31 6 34.25% Apples-Canned: NFS 56 31 3 30.33% Pears-Canned: NFS 65 31 5 18.91% Peaches-Canned: NFS 52 32 3 6.79% Apples-Canned: Cooked ================================================================================ Non-nursing infants (<1 yr old) Low percentile for CEC records: 95 Exposure (mg/day) = 0.003457 High percentile for CEC records: 96 Exposure (mg/day) = 0.003739 Number of actual records in this interval: 18 Critical foods/foodforms for this population (as derived from these records): N=number of appearances in all records (including duplicates) %=percent of total exposure for all records (including duplicates) Food FF N Percent Food Name ---- -- ----- ------- ------------- 56 31 13 46.45% Pears-Canned: NFS 52 31 9 22.20% Apples-Canned: NFS 52 14 3 10.89% Apples-Boiled

141
================================================================================ Children 1-6 yrs Low percentile for CEC records: 95 Exposure (mg/day) = 0.002356 High percentile for CEC records: 96 Exposure (mg/day) = 0.002560 Number of actual records in this interval: 147 Critical foods/foodforms for this population (as derived from these records): N=number of appearances in all records (including duplicates) %=percent of total exposure for all records (including duplicates) Food FF N Percent Food Name ---- -- ----- ------- ------------- 52 11 73 29.45% Apples-Uncooked 52 14 28 13.47% Apples-Boiled 56 11 23 11.65% Pears-Uncooked 184 14 28 7.96% Parsley-Boiled 56 12 16 5.13% Pears-Cooked: NFS ================================================================================ Children 7-12 yrs Low percentile for CEC records: 95 Exposure (mg/day) = 0.001282 High percentile for CEC records: 96 Exposure (mg/day) = 0.001387 Number of actual records in this interval: 35 Critical foods/foodforms for this population (as derived from these records): N=number of appearances in all records (including duplicates) %=percent of total exposure for all records (including duplicates) Food FF N Percent Food Name ---- -- ----- ------- ------------- 52 11 13 22.56% Apples-Uncooked 184 14 7 12.03% Parsley-Boiled 56 11 6 11.63% Pears-Uncooked 56 12 8 9.51% Pears-Cooked: NFS 52 14 5 7.73% Apples-Boiled ================================================================================ Females 13+ (preg/not nursing) Low percentile for CEC records: 95 Exposure (mg/day) = 0.000755 High percentile for CEC records: 96 Exposure (mg/day) = 0.000873 Number of actual records in this interval: 2 Critical foods/foodforms for this population (as derived from these records): N=number of appearances in all records (including duplicates) %=percent of total exposure for all records (including duplicates) Food FF N Percent Food Name ---- -- ----- ------- ------------- 184 14 1 31.41% Parsley-Boiled 26 11 1 27.05% Lemons-peeled fruit-Uncooked 52 11 1 14.23% Apples-Uncooked 65 13 1 7.25% Peaches-Baked 156 15 1 6.72% Peppers-chilli incl jalapeno-Fried

142
================================================================================ Females 13+ (nursing) No CEC records for this population ================================================================================ Females 13-19 (not preg or nursing) Low percentile for CEC records: 95 Exposure (mg/day) = 0.000635 High percentile for CEC records: 96 Exposure (mg/day) = 0.000711 Number of actual records in this interval: 12 Critical foods/foodforms for this population (as derived from these records): N=number of appearances in all records (including duplicates) %=percent of total exposure for all records (including duplicates) Food FF N Percent Food Name ---- -- ----- ------- ------------- 52 11 9 50.32% Apples-Uncooked 52 14 1 7.10% Apples-Boiled ================================================================================ Females 20+ (not preg or nursing) Low percentile for CEC records: 95 Exposure (mg/day) = 0.000711 High percentile for CEC records: 96 Exposure (mg/day) = 0.000786 Number of actual records in this interval: 107 Critical foods/foodforms for this population (as derived from these records): N=number of appearances in all records (including duplicates) %=percent of total exposure for all records (including duplicates) Food FF N Percent Food Name ---- -- ----- ------- ------------- 52 11 46 25.50% Apples-Uncooked 56 11 14 9.51% Pears-Uncooked 22 11 15 9.04% Grapefruit-peeled fruit-Uncooked ================================================================================ Males 13-19 yrs Low percentile for CEC records: 95 Exposure (mg/day) = 0.000731 High percentile for CEC records: 96 Exposure (mg/day) = 0.000787 Number of actual records in this interval: 11 Critical foods/foodforms for this population (as derived from these records): N=number of appearances in all records (including duplicates) %=percent of total exposure for all records (including duplicates) Food FF N Percent Food Name ---- -- ----- ------- ------------- 56 12 2 11.03% Pears-Cooked: NFS 52 14 2 9.36% Apples-Boiled 52 11 2 9.30% Apples-Uncooked 61 13 1 7.58% Cherries-Baked 184 14 1 7.52% Parsley-Boiled 61 11 1 6.09% Cherries-Uncooked

143
================================================================================ Males 20+ yrs Low percentile for CEC records: 95 Exposure (mg/day) = 0.000672 High percentile for CEC records: 96 Exposure (mg/day) = 0.000728 Number of actual records in this interval: 85 Critical foods/foodforms for this population (as derived from these records): N=number of appearances in all records (including duplicates) %=percent of total exposure for all records (including duplicates) Food FF N Percent Food Name ---- -- ----- ------- ------------- 52 11 34 19.81% Apples-Uncooked 22 11 17 10.01% Grapefruit-peeled fruit-Uncooked 56 11 10 8.59% Pears-Uncooked 184 14 10 8.27% Parsley-Boiled ================================================================================ Seniors 55+ Low percentile for CEC records: 95 Exposure (mg/day) = 0.000782 High percentile for CEC records: 96 Exposure (mg/day) = 0.000848 Number of actual records in this interval: 73 Critical foods/foodforms for this population (as derived from these records): N=number of appearances in all records (including duplicates) %=percent of total exposure for all records (including duplicates) Food FF N Percent Food Name ---- -- ----- ------- ------------- 56 11 18 19.11% Pears-Uncooked 52 11 28 17.64% Apples-Uncooked 52 14 13 10.19% Apples-Boiled 22 11 8 7.19% Grapefruit-peeled fruit-Uncooked 56 12 10 6.98% Pears-Cooked: NFS

144
APPENDIX B
Chronic Dietary Exposure Analysis Printouts

145
California Department of Pesticide Regulation Ver. 7.76 DEEM Chronic analysis for AZINPHOS METHYL 1994-98 data Residue file: H:\MyFiles\DEEM Files\Azinphos-methyl\azinphos-methyl-dietary-chronic2002.RS7 Adjust. #2 used Analysis Date 04-22-2002 Residue file dated: 04-22-2002/16:09:45/14 Reference dose (NOEL) = 0.15 mg/kg bw/day Comment:DPR chronic NOEL. -------------------------------------------------------------------------------- Food Crop RESIDUE Adj.Factors Comment Code Grp Food Name (ppm) #1 #2 ---- ---- ------------------------------- ---------- ------ ------ ------- 1 13A Blackberries 0.032000 1.000 0.140 DPR AV Full comment: DPR AVG for caneberries 96-99 2 13A Boysenberries 0.032000 1.000 0.140 DPR AV Full comment: DPR AVG for caneberries 96-99 4 13A Loganberries 0.032000 1.000 0.140 DPR av Full comment: DPR average for caneberries 96-99 5 13A Raspberries 0.032000 1.000 0.140 DPR av Full comment: DPR average for caneberries 96-99 7 13B Blueberries 0.045000 1.000 0.510 DPR AV Full comment: DPR AVG residue 96-99 8 O Cranberries 0.030000 1.000 0.690 REG fi Full comment: REG field trail data 9 O Cranberries-juice 0.030000 1.100 0.690 REG fi Full comment: REG field trail data 13 O Grapes 0.009500 1.000 0.020 PDP AV Full comment: PDP AVG (1995, 96 CA specific) 14 O Grapes-raisins 0.009500 4.300 0.020 PDP AV Full comment: PDP AVG (1995, 96 CA specific) 15 O Grapes-juice 0.004000 1.000 0.020 PDP CA Full comment: PDP CA specific grape juice 1/2 LOD 17 O Strawberries 0.010000 1.000 0.120 PDP 19 Full comment: PDP 1998 CA specific 1/2 LOD 20 10 Citrus citron 0.010000 1.000 0.030 PDP or Full comment: PDP orange as surrogate 1996 22 10 Grapefruit-peeled fruit 0.052000 1.000 0.170 DPR av Full comment: DPR average residue 96-99 23 10 Grapefruit-juice 0.004000 2.100 0.170 PDP CA Full comment: PDP CA specific O.J. LOD as surrogate 24 10 Kumquats 0.010000 1.000 0.030 PDP or Full comment: PDP orange as surrogate 96 26 10 Lemons-peeled fruit 0.019000 1.000 0.010 DPR av Full comment: DPR average residue value 27 10 Lemons-peel 0.019000 1.000 0.010 DPR av Full comment: DPR average residue value 28 10 Lemons-juice 0.004000 1.100 0.010 PDP CA Full comment: PDP CA specific O.J. as surrogate 30 10 Limes-peeled fruit 0.026000 1.000 0.030 DPR av Full comment: DPR average residue 96-99 31 10 Limes-peel 0.026000 1.000 0.030 DPR av Full comment: DPR average residue 96-99 32 10 Limes-juice 0.004000 1.000 0.030 PDP CA Full comment: PDP CA specific O.J. as surrogate 33 10 Oranges-juice-concentrate 0.004000 3.700 0.030 PDP CA Full comment: PDP CA specific O.J. 1/2 LOD 34 10 Oranges-peeled fruit 0.010000 1.000 0.030 PDP CA Full comment: PDP CA specific 1/2 LOD

146
35 10 Oranges-peel 0.010000 1.000 0.030 PDP CA Full comment: PDP CA specific 1/2 LOD 36 10 Oranges-juice 0.004000 1.000 0.030 PDP CA Full comment: PDP CA specific O.J. 1/2 LOD 37 10 Tangelos 0.010000 1.000 0.030 PDP or Full comment: PDP orange as surrogate 38 10 Tangerines 0.010000 1.000 0.030 PDP or Full comment: PDP orange as surrogate 39 10 Tangerines-juice 0.004000 1.300 0.030 PDP CA Full comment: PDP CA specific O.J. 1/2 LOD surrogate 40 14 Almonds 0.025000 1.000 0.390 DPR 1/ Full comment: DPR 1/2 LOD residue 96-99 44 14 Filberts (hazelnuts) 0.050000 1.000 0.390 REG fi Full comment: REG field trail data, 1/2 LOD 47 14 Pecans 0.050000 1.000 0.030 REG fi Full comment: REG filbert nut as surrogate 48 14 Walnuts 0.050000 1.000 0.300 REG fi Full comment: REG filbert nut as surrogate 50 O Pistachio nuts 0.050000 1.000 1.000 REG fi Full comment: REG filbert nut as surrogate 52 11 Apples 0.042000 1.000 0.880 PDP AV Full comment: PDP AVG (1995, 96, CA specific) 53 11 Apples-dried 0.042000 8.000 0.880 PDP AV Full comment: PDP AVG (1995, 96, CA specific) 54 11 Apples-juice/cider 0.005000 1.000 0.880 PDP a. Full comment: PDP a.j. AVG (1997, 98, CA specific) 55 11 Crabapples 0.042000 1.000 0.010 PDP ap Full comment: PDP apple AVG 95-96 56 11 Pears 0.054000 1.000 0.910 PDP AV Full comment: PDP AVG (1996, 97 CA lab specific) 57 11 Pears-dried 0.054000 6.250 0.910 PDP AV Full comment: PDP AVG (1996, 97 CA lab specific) 58 11 Quinces 0.042000 1.000 0.750 PDP ap Full comment: PDP apple AVG as surrogate 95-96 61 12 Cherries 0.049000 1.000 0.690 DPR av Full comment: DPR average residue 96-99 62 12 Cherries-dried 0.049000 4.000 0.690 DPR av Full comment: DPR average residue 96-99 63 12 Cherries-juice 0.049000 1.500 0.690 DPR av Full comment: DPR average residue 96-99 64 12 Nectarines 0.089000 1.000 0.060 PDP pe Full comment: PDP peach as surrogate CA 96-97 65 12 Peaches 0.089000 1.000 0.300 PDP AV Full comment: PDP AVG (1996, 97 CA lab specific) 66 12 Peaches-dried 0.089000 7.000 0.300 PDP AV Full comment: PDP AVG (1996, 97 CA lab specific) 67 12 Plums (damsons) 0.025000 1.000 0.120 DPR 1/ Full comment: DPR 1/2 LOD 96-99 68 12 Plums-prunes (dried) 0.025000 5.000 0.120 DPR 1/ Full comment: DPR 1/2 LOD 96-99 69 12 Plums/prune-juice 0.025000 1.400 0.120 DPR 1/ Full comment: DPR 1/2 LOD 96-99 139 8 Paprika 0.037000 1.000 1.000 DPR ch Full comment: DPR chili pepper as surrogate 141 9A Melons-cantaloupes-juice 0.004000 1.000 0.050 PDP CA Full comment: PDP CA specific cantaloupe 1/2 LOD 142 9A Melons-cantaloupes-pulp 0.004000 1.000 0.050 PDP CA Full comment: PDP CA specific cantaloupe 1/2 LOD 143 9A Casabas 0.004000 1.000 0.020 PDP 1/ Full comment: PDP 1/2 LOD (CA cantaloupe 98)

147
144 9A Crenshaws 0.004000 1.000 0.020 PDP CA Full comment: PDP CA cantaloupe 1/2 LOD 98 145 9A Melons-honeydew 0.004000 1.000 0.020 PDP CA Full comment: PDP CA specific cantaloupe 1/2 LOD 146 9A Melons-persian 0.004000 1.000 0.020 PDP CA Full comment: PDP CA specific cantaloupe 1/2 LOD 147 9A Watermelon 0.004000 1.000 0.020 PDP CA Full comment: PDP CA specific cantaloupe 1/2 LOD 148 9B Cucumbers 0.011000 1.000 0.030 DPR av Full comment: DPR average residue 96-99 154 8 Eggplant 0.038000 1.000 1.000 DPR av Full comment: DPR average residue 96-99 155 8 Peppers-sweet(garden) 0.034000 1.000 1.000 DPR av Full comment: DPR average residue 96-99 156 8 Peppers-chilli incl jalapeno 0.037000 1.000 1.000 DPR av Full comment: DPR average residue 96-99 157 8 Peppers-other 0.037000 1.000 1.000 DPR ch Full comment: DPR chili pepper as surrogate 159 8 Tomatoes-whole 0.004500 1.000 0.100 PDP 19 Full comment: PDP 1998 CA specific avg 160 8 Tomatoes-juice 0.004500 0.242 0.110 PDP 19 Full comment: PDP 1998 CA specific avg 161 8 Tomatoes-puree 0.004500 0.020 0.110 PDP 19 Full comment: PDP 1998 CA specific avg 162 8 Tomatoes-paste 0.004500 0.007 0.110 PDP 19 Full comment: PDP 1998 CA specific avg 163 8 Tomatoes-catsup 0.004500 2.500 0.110 PDP 19 Full comment: PDP 1998 CA specific avg 166 4B Celery 0.052000 1.000 0.130 DPR av Full comment: DPR average residue 96-99 168 5A Broccoli 0.025000 1.000 0.010 DPR 1/ Full comment: DPR 1/2 LOD value 96-99 169 5A Brussels sprouts 0.025000 1.000 0.020 DPR 1/ Full comment: DPR 1/2 LOD value 96-99 170 5A Cabbage-green and red 0.025000 1.000 0.130 DPR 1/ Full comment: DPR 1/2 LOD value 96-99 171 5A Cauliflower 0.051000 1.000 0.020 DPR av Full comment: DPR average residue 96-99 184 4A Parsley 5.000000 1.000 1.000 1/2 EP Full comment: 1/2 EPA tolerance 186 4A Spinach 11-Uncooked 0.006000 1.000 0.020 PDP AV Full comment: PDP AVG Fresh (1996, 97 CA specific) 12-Cooked: NFS 0.006000 1.000 0.020 PDP AV Full comment: PDP AVG Fresh (1996, 97 CA specific) 13-Baked 0.006000 1.000 0.020 PDP AV Full comment: PDP AVG Fresh (1996, 97 CA specific) 14-Boiled 0.006000 1.000 0.020 PDP AV Full comment: PDP AVG Fresh (1996, 97 CA specific) 31-Canned: NFS 0.004000 1.000 0.020 PDP CA Full comment: PDP CA 98 canned 1/2 LOD 32-Canned: Cooked 0.004000 1.000 0.020 PDP CA Full comment: PDP CA 98 canned 1/2 LOD 34-Canned: Boiled 0.004000 1.000 0.020 PDP CA Full comment: PDP CA 98 canned 1/2 LOD 42-Frozen: Cooked 0.006000 1.000 0.020 PDP AV Full comment: PDP AVG Fresh (1996, 97 CA specific) 44-Frozen: Boiled 0.006000 1.000 0.020 PDP AV Full comment: PDP AVG Fresh (1996, 97 CA specific) 204 3 Leeks 0.011000 1.000 0.020 DPR gr

148
Full comment: DPR green onion AVG 96-99 205 3 Onions-dry-bulb (cipollini) 0.025000 1.000 0.020 DPR 1/ Full comment: DPR 1/2 LOD value 96-99 206 3 Onions-dehydrated or dried 0.025000 9.000 0.020 DPR 1/ Full comment: DPR 1/2 LOD value 96-99 207 1C Potatoes/white-whole 0.010000 1.000 0.100 PDP 19 Full comment: PDP 1995 CA specific 1/2 LOD 208 1C Potatoes/white-unspecified 0.010000 1.000 0.100 PDP 19 Full comment: PDP 1995 CA specific 1/2 LOD 209 1C Potatoes/white-peeled 0.010000 1.000 0.100 PDP 19 Full comment: PDP 1995 CA specific 1/2 LOD 210 1C Potatoes/white-dry 0.010000 6.500 0.100 PDP 19 Full comment: PDP 1995 CA specific 1/2 LOD 211 1C Potatoes/white-peel only 0.010000 1.000 0.100 PDP 19 Full comment: PDP 1995 CA specific 1/2 LOD 217 3 Shallots 0.011000 1.000 0.020 DPR gr Full comment: DPR green onion as surrogate 225 1AB Parsley roots 2.000000 1.000 1.000 1/2 EP Full comment: 1/2 EPA tolerance 233 6B Beans-succulent-lima 0.004000 1.000 0.010 PDP 1/ Full comment: PDP 1/2 LOD (1997, 98 CA specific) 234 6A Beans-succulent-green 0.004000 1.000 0.010 PDP 1/ Full comment: PDP 1/2 LOD (1997, 98 CA specific) 235 6A Beans-succulent-other 0.004000 1.000 0.010 PDP 1/ Full comment: PDP 1/2 LOD (1997, 98 CA specific) 236 6A Beans-succulent-yellow/wax 0.004000 1.000 0.010 PDP 1/ Full comment: PDP 1/2 LOD (1997, 98 CA specific) 250 6B Beans-succulent-broadbeans 0.004000 1.000 0.010 PDP 1/ Full comment: PDP 1/2 LOD (1997, 98 CA specific) 257 Beans-succulent-hyacinth 0.004000 1.000 0.010 PDP 1/ Full comment: PDP 1/2 LOD (1997, 98 CA specific) 262 3 Onions-green 0.011000 1.000 0.020 DPR av Full comment: DPR average residue 96-99 283 O Sugar-cane 0.050000 1.000 1.000 REG fi Full comment: REG field trial data, 1/2 LOD 284 O Sugar-cane/molasses 0.050000 1.000 1.000 REG fi Full comment: REG field trial data, 1/2 LOD 290 O Cottonseed-oil 0.050000 1.000 0.110 REG fi Full comment: REG field trail data, 1/2 LOD 291 O Cottonseed-meal 0.050000 1.000 0.110 REG fi Full comment: REG field trail data, 1/2 LOD 315 O Grapes-wine and sherry 0.004000 1.000 0.020 PDP CA Full comment: PDP CA specific grape juice 1/2 LOD 377 11 Apples-juice-concentrate 0.005000 3.000 0.880 PDP a. Full comment: PDP a.j. AVG (1997, 98, CA specific) 380 13A Blackberries-juice 0.032000 1.000 0.140 DPR AV Full comment: DPR AVG for caneberries 96-99 383 5B Cabbage-savoy 0.025000 1.000 0.130 DPR 1/ Full comment: DPR 1/2 LOD value 96-99 384 4B Celery juice 0.052000 1.000 0.130 DPR av Full comment: DPR average residue 96-99 389 O Cranberries-juice-concentrate 0.030000 3.300 0.690 REG fi Full comment: REG field trail data 392 O Grapes-juice-concentrate 0.004000 3.000 0.020 PDP CA Full comment: PDP CA specific grape juice 1/2 LOD 402 12 Peaches-juice 0.089000 1.000 0.300 PDP AV Full comment: PDP AVG (1996, 97 CA lab specific) 404 11 Pears-juice 0.054000 1.000 0.910 PDP AV Full comment: PDP AVG (1998 CA composite) 416 O Strawberries-juice 0.010000 1.000 0.120 PDP 19

149
Full comment: PDP 1998 CA specific 1/2 LOD 420 10 Tangerines-juice-concentrate 0.004000 4.100 0.030 PDP CA Full comment: PDP CA specific O.J. 1/2 LOD surrogate 423 8 Tomatoes-dried 0.004500 14.300 0.100 PDP 19 Full comment: PDP 1998 CA specific avg 431 14 Walnut oil 0.050000 1.000 0.300 REG fi Full comment: REG filbert nut as surrogate 436 9A Watermelon-juice 0.004000 1.000 0.020 PDP CA Full comment: PDP CA specific cantaloupe 1/2 LOD 441 10 Grapefruit-juice-concentrate 0.004000 8.260 0.170 PDP CA Full comment: PDP CA specific O.J. LOD as surrogate 442 10 Lemons-juice-concentrate 0.004000 6.300 0.010 PDP CA Full comment: PDP CA specific O.J. as surrogate 443 10 Limes-juice-concentrate 0.004000 3.000 0.030 PDP CA Full comment: PDP CA specific O.J. as surrogate 448 10 Grapefruit peel 0.052000 1.000 0.170 DPR av Full comment: DPR average residue 96-99 451 5A Broccoli-chinese 0.025000 1.000 0.010 DPR 1/ Full comment: DPR 1/2 LOD value 96-99 467 19B Celery seed 0.052000 1.000 0.130 DPR av Full comment: DPR average residue 96-99

150
California Department of Pesticide Regulation Ver. 7.76 DEEM Chronic analysis for AZINPHOS METHYL (1994-98 data) Residue file name: H:\MyFiles\DEEM Files\Azinphos-methyl\azinphos-methyl-dietary-chronic2002.RS7 Adjustment factor #2 used. Analysis Date 04-22-2002/16:39:51 Residue file dated: 04-22-2002/16:09:45/14 NOEL (Chronic) = .15 mg/kg bw/day COMMENT 1: DPR chronic NOEL. =============================================================================== Total exposure by population subgroup ------------------------------------------------------------------------------- Total Exposure ----------------------------------- Population mg/kg Percent Margin of Subgroup body wt/day of NOEL Exposr 1/ -------------------------------------- ------------- --------- --------- U.S. Population (total) 0.000073 0.05% 2,046 U.S. Population (spring season) 0.000071 0.05% 2,121 U.S. Population (summer season) 0.000068 0.05% 2,210 U.S. Population (autumn season) 0.000077 0.05% 1,944 U.S. Population (winter season) 0.000078 0.05% 1,934 Northeast region 0.000072 0.05% 2,073 Midwest region 0.000078 0.05% 1,927 Southern region 0.000066 0.04% 2,269 Western region 0.000081 0.05% 1,859 Hispanics 0.000084 0.06% 1,793 Non-hispanic whites 0.000072 0.05% 2,085 Non-hispanic blacks 0.000069 0.05% 2,178 Non-hisp/non-white/non-black 0.000084 0.06% 1,795 All infants (< 1 year) 0.000214 0.14% 702 Nursing infants 0.000122 0.08% 1,228 Non-nursing infants 0.000248 0.17% 604 Children 1-6 yrs 0.000205 0.14% 730 Children 7-12 yrs 0.000110 0.07% 1,366 Females 13-19 (not preg or nursing) 0.000057 0.04% 2,627 Females 20+ (not preg or nursing) 0.000049 0.03% 3,072 Females 13-50 yrs 0.000050 0.03% 2,993 Females 13+ (preg/not nursing) 0.000070 0.05% 2,155 Females 13+ (nursing) 0.000056 0.04% 2,682 Males 13-19 yrs 0.000063 0.04% 2,387 Males 20+ yrs 0.000051 0.03% 2,945 Seniors 55+ 0.000051 0.03% 2,945 -------------------------------------------------------------------------------

151
California Department of Pesticide Regulation Ver. 7.76 DEEM Chronic analysis for AZINPHOS METHYL (1994-98 data) Residue file name: H:\MyFiles\DEEM Files\Azinphos-methyl\azinphos-methyl-dietary-chronic2002.RS7 Adjustment factor #2 used. Analysis Date 04-22-2002/16:41:25 Residue file dated: 04-22-2002/16:09:45/14 NOEL (Chronic) = .15 mg/kg bw/day COMMENT 1: DPR chronic NOEL. =============================================================================== Critical Commodity Contribution Analysis for U.S. Population (total) Total Exposure =.0000733 mg/kg bw/day Crop groups with total exposure contribution > 10% Foods/Foodforms with exposure contribution > 5% ------------------------------------------------------------------------------- Crop group ------------ Exposure Analysis ----------- Food mg/kg |% of Total| Percent | Margin Foodform body wt/day| Exposure | of NOEL |of Exposr ---------------------------------- -----------|----------|-------- |--------- Crop Group = (O) Other Sugar-cane 0.0000170 23.21% 0.0% 8,816 ---------------------------------- -----------|----------|-------- |--------- Total for crop group 0.0000181 24.72% 0.0% 8,275 Crop Group = (4) Leafy Vegetables (except Brassica) Parsley 0.0000201 27.36% 0.0% 7,478 ---------------------------------- -----------|----------|-------- |--------- Total for crop group 0.0000205 27.91% 0.0% 7,330 Crop Group = (4A) Leafy Greens Parsley 0.0000201 27.36% 0.0% 7,478 ---------------------------------- -----------|----------|-------- |--------- Total for crop group 0.0000201 27.37% 0.0% 7,476 Crop Group = (11) Pome Fruits Apples 0.0000164 22.42% 0.0% 9,126 Pears 0.0000039 5.30% 0.0% 38,637 ---------------------------------- -----------|----------|-------- |--------- Total for crop group 0.0000251 34.27% 0.0% 5,970 Total for crop groups listed above: 0.0000637 86.90% 0.0% 2,354 ------------------------------------------------------------------------------- 1. Margin of Exposure = NOEL / Dietary Exposure 1

152
California Department of Pesticide Regulation Ver. 7.76 DEEM Chronic analysis for AZINPHOS METHYL (1994-98 data) Residue file name: H:\MyFiles\DEEM Files\Azinphos-methyl\azinphos-methyl-dietary-chronic2002.RS7 Adjustment factor #2 used. Analysis Date 04-22-2002/16:41:25 Residue file dated: 04-22-2002/16:09:45/14 NOEL (Chronic) = .15 mg/kg bw/day COMMENT 1: DPR chronic NOEL. =============================================================================== Critical Commodity Contribution Analysis for Western region Total Exposure =.0000807 mg/kg bw/day Crop groups with total exposure contribution > 10% Foods/Foodforms with exposure contribution > 5% ------------------------------------------------------------------------------- Crop group ------------ Exposure Analysis ----------- Food mg/kg |% of Total| Percent | Margin Foodform body wt/day| Exposure | of NOEL |of Exposr ---------------------------------- -----------|----------|-------- |--------- Crop Group = (O) Other Sugar-cane 0.0000164 20.36% 0.0% 9,128 ---------------------------------- -----------|----------|-------- |--------- Total for crop group 0.0000177 21.98% 0.0% 8,457 Crop Group = (4) Leafy Vegetables (except Brassica) Parsley 0.0000216 26.81% 0.0% 6,933 ---------------------------------- -----------|----------|-------- |--------- Total for crop group 0.0000221 27.44% 0.0% 6,773 Crop Group = (4A) Leafy Greens Parsley 0.0000216 26.81% 0.0% 6,933 ---------------------------------- -----------|----------|-------- |--------- Total for crop group 0.0000216 26.81% 0.0% 6,932 Crop Group = (11) Pome Fruits Apples 0.0000199 24.60% 0.0% 7,556 Pears 0.0000047 5.86% 0.0% 31,712 ---------------------------------- -----------|----------|-------- |--------- Total for crop group 0.0000301 37.32% 0.0% 4,980 Total for crop groups listed above: 0.0000700 86.74% 0.0% 2,143 ------------------------------------------------------------------------------- 1. Margin of Exposure = NOEL / Dietary Exposure 2

153
California Department of Pesticide Regulation Ver. 7.76 DEEM Chronic analysis for AZINPHOS METHYL (1994-98 data) Residue file name: H:\MyFiles\DEEM Files\Azinphos-methyl\azinphos-methyl-dietary-chronic2002.RS7 Adjustment factor #2 used. Analysis Date 04-22-2002/16:41:25 Residue file dated: 04-22-2002/16:09:45/14 NOEL (Chronic) = .15 mg/kg bw/day COMMENT 1: DPR chronic NOEL. =============================================================================== Critical Commodity Contribution Analysis for Nursing infants Total Exposure =.0001222 mg/kg bw/day Crop groups with total exposure contribution > 10% Foods/Foodforms with exposure contribution > 5% ------------------------------------------------------------------------------- Crop group ------------ Exposure Analysis ----------- Food mg/kg |% of Total| Percent | Margin Foodform body wt/day| Exposure | of NOEL |of Exposr ---------------------------------- -----------|----------|-------- |--------- Crop Group = (O) Other Sugar-cane 0.0000136 11.15% 0.0% 11,008 ---------------------------------- -----------|----------|-------- |--------- Total for crop group 0.0000140 11.49% 0.0% 10,682 Crop Group = (11) Pome Fruits Apples 0.0000466 38.15% 0.0% 3,219 Pears 0.0000228 18.67% 0.0% 6,577 Pears-juice 0.0000106 8.64% 0.0% 14,205 ---------------------------------- -----------|----------|-------- |--------- Total for crop group 0.0000873 71.45% 0.1% 1,719 Crop Group = (12) Stone Fruits Peaches 0.0000136 11.15% 0.0% 11,013 ---------------------------------- -----------|----------|-------- |--------- Total for crop group 0.0000151 12.38% 0.0% 9,918 Total for crop groups listed above: 0.0001164 95.32% 0.1% 1,288 ------------------------------------------------------------------------------- 1. Margin of Exposure = NOEL / Dietary Exposure 3

154
California Department of Pesticide Regulation Ver. 7.76 DEEM Chronic analysis for AZINPHOS METHYL (1994-98 data) Residue file name: H:\MyFiles\DEEM Files\Azinphos-methyl\azinphos-methyl-dietary-chronic2002.RS7 Adjustment factor #2 used. Analysis Date 04-22-2002/16:41:25 Residue file dated: 04-22-2002/16:09:45/14 NOEL (Chronic) = .15 mg/kg bw/day COMMENT 1: DPR chronic NOEL. =============================================================================== Critical Commodity Contribution Analysis for Non-nursing infants Total Exposure =.0002482 mg/kg bw/day Crop groups with total exposure contribution > 10% Foods/Foodforms with exposure contribution > 5% ------------------------------------------------------------------------------- Crop group ------------ Exposure Analysis ----------- Food mg/kg |% of Total| Percent | Margin Foodform body wt/day| Exposure | of NOEL |of Exposr ---------------------------------- -----------|----------|-------- |--------- Crop Group = (O) Other Sugar-cane 0.0000481 19.38% 0.0% 3,118 ---------------------------------- -----------|----------|-------- |--------- Total for crop group 0.0000495 19.94% 0.0% 3,031 Crop Group = (4) Leafy Vegetables (except Brassica) Parsley 0.0000154 6.19% 0.0% 9,766 ---------------------------------- -----------|----------|-------- |--------- Total for crop group 0.0000155 6.26% 0.0% 9,648 Crop Group = (4A) Leafy Greens Parsley 0.0000154 6.19% 0.0% 9,766 ---------------------------------- -----------|----------|-------- |--------- Total for crop group 0.0000154 6.19% 0.0% 9,759 Crop Group = (11) Pome Fruits Apples 0.0000737 29.69% 0.0% 2,035 Pears 0.0000313 12.59% 0.0% 4,798 Pears-juice 0.0000293 11.82% 0.0% 5,111 ---------------------------------- -----------|----------|-------- |--------- Total for crop group 0.0001546 62.29% 0.1% 970 Crop Group = (12) Stone Fruits Peaches 0.0000228 9.17% 0.0% 6,591 ---------------------------------- -----------|----------|-------- |--------- Total for crop group 0.0000255 10.29% 0.0% 5,871 Total for crop groups listed above: 0.0002452 98.79% 0.2% 612 ------------------------------------------------------------------------------- 1. Margin of Exposure = NOEL / Dietary Exposure 4

155
California Department of Pesticide Regulation Ver. 7.76 DEEM Chronic analysis for AZINPHOS METHYL (1994-98 data) Residue file name: H:\MyFiles\DEEM Files\Azinphos-methyl\azinphos-methyl-dietary-chronic2002.RS7 Adjustment factor #2 used. Analysis Date 04-22-2002/16:41:25 Residue file dated: 04-22-2002/16:09:45/14 NOEL (Chronic) = .15 mg/kg bw/day COMMENT 1: DPR chronic NOEL. =============================================================================== Critical Commodity Contribution Analysis for Children 1-6 yrs Total Exposure =.0002054 mg/kg bw/day Crop groups with total exposure contribution > 10% Foods/Foodforms with exposure contribution > 5% ------------------------------------------------------------------------------- Crop group ------------ Exposure Analysis ----------- Food mg/kg |% of Total| Percent | Margin Foodform body wt/day| Exposure | of NOEL |of Exposr ---------------------------------- -----------|----------|-------- |--------- Crop Group = (O) Other Sugar-cane 0.0000375 18.26% 0.0% 4,000 ---------------------------------- -----------|----------|-------- |--------- Total for crop group 0.0000402 19.58% 0.0% 3,729 Crop Group = (4) Leafy Vegetables (except Brassica) Parsley 0.0000468 22.79% 0.0% 3,204 ---------------------------------- -----------|----------|-------- |--------- Total for crop group 0.0000474 23.06% 0.0% 3,167 Crop Group = (4A) Leafy Greens Parsley 0.0000468 22.79% 0.0% 3,204 ---------------------------------- -----------|----------|-------- |--------- Total for crop group 0.0000468 22.80% 0.0% 3,203 Crop Group = (11) Pome Fruits Apples 0.0000595 28.98% 0.0% 2,520 Apples-juice/cider 0.0000182 8.84% 0.0% 8,262 Pears 0.0000125 6.10% 0.0% 11,969 ---------------------------------- -----------|----------|-------- |--------- Total for crop group 0.0000988 48.11% 0.1% 1,518 Total for crop groups listed above: 0.0001864 90.75% 0.1% 805 ------------------------------------------------------------------------------- 1. Margin of Exposure = NOEL / Dietary Exposure 5

156
California Department of Pesticide Regulation Ver. 7.76 DEEM Chronic analysis for AZINPHOS METHYL (1994-98 data) Residue file name: H:\MyFiles\DEEM Files\Azinphos-methyl\azinphos-methyl-dietary-chronic2002.RS7 Adjustment factor #2 used. Analysis Date 04-22-2002/16:41:25 Residue file dated: 04-22-2002/16:09:45/14 NOEL (Chronic) = .15 mg/kg bw/day COMMENT 1: DPR chronic NOEL. =============================================================================== Critical Commodity Contribution Analysis for Children 7-12 yrs Total Exposure =.0001098 mg/kg bw/day Crop groups with total exposure contribution > 10% Foods/Foodforms with exposure contribution > 5% ------------------------------------------------------------------------------- Crop group ------------ Exposure Analysis ----------- Food mg/kg |% of Total| Percent | Margin Foodform body wt/day| Exposure | of NOEL |of Exposr ---------------------------------- -----------|----------|-------- |--------- Crop Group = (O) Other Sugar-cane 0.0000304 27.68% 0.0% 4,936 ---------------------------------- -----------|----------|-------- |--------- Total for crop group 0.0000316 28.75% 0.0% 4,753 Crop Group = (4) Leafy Vegetables (except Brassica) Parsley 0.0000275 25.07% 0.0% 5,451 ---------------------------------- -----------|----------|-------- |--------- Total for crop group 0.0000280 25.48% 0.0% 5,362 Crop Group = (4A) Leafy Greens Parsley 0.0000275 25.07% 0.0% 5,451 ---------------------------------- -----------|----------|-------- |--------- Total for crop group 0.0000275 25.07% 0.0% 5,450 Crop Group = (11) Pome Fruits Apples 0.0000287 26.13% 0.0% 5,229 Pears 0.0000059 5.34% 0.0% 25,597 ---------------------------------- -----------|----------|-------- |--------- Total for crop group 0.0000396 36.04% 0.0% 3,791 Total for crop groups listed above: 0.0000991 90.27% 0.1% 1,514 ------------------------------------------------------------------------------- 1. Margin of Exposure = NOEL / Dietary Exposure 6

157
California Department of Pesticide Regulation Ver. 7.76 DEEM Chronic analysis for AZINPHOS METHYL (1994-98 data) Residue file name: H:\MyFiles\DEEM Files\Azinphos-methyl\azinphos-methyl-dietary-chronic2002.RS7 Adjustment factor #2 used. Analysis Date 04-22-2002/16:41:25 Residue file dated: 04-22-2002/16:09:45/14 NOEL (Chronic) = .15 mg/kg bw/day COMMENT 1: DPR chronic NOEL. =============================================================================== Critical Commodity Contribution Analysis for Females 13-19 (not preg or nursing) Total Exposure =.0000571 mg/kg bw/day Crop groups with total exposure contribution > 10% Foods/Foodforms with exposure contribution > 5% ------------------------------------------------------------------------------- Crop group ------------ Exposure Analysis ----------- Food mg/kg |% of Total| Percent | Margin Foodform body wt/day| Exposure | of NOEL |of Exposr ---------------------------------- -----------|----------|-------- |--------- Crop Group = (O) Other Sugar-cane 0.0000190 33.36% 0.0% 7,875 ---------------------------------- -----------|----------|-------- |--------- Total for crop group 0.0000197 34.54% 0.0% 7,607 Crop Group = (4) Leafy Vegetables (except Brassica) Parsley 0.0000185 32.40% 0.0% 8,108 ---------------------------------- -----------|----------|-------- |--------- Total for crop group 0.0000188 32.99% 0.0% 7,964 Crop Group = (4A) Leafy Greens Parsley 0.0000185 32.40% 0.0% 8,108 ---------------------------------- -----------|----------|-------- |--------- Total for crop group 0.0000185 32.40% 0.0% 8,108 Crop Group = (11) Pome Fruits Apples 0.0000078 13.72% 0.0% 19,151 ---------------------------------- -----------|----------|-------- |--------- Total for crop group 0.0000121 21.12% 0.0% 12,442 Total for crop groups listed above: 0.0000506 88.64% 0.0% 2,964 ------------------------------------------------------------------------------- 1. Margin of Exposure = NOEL / Dietary Exposure 7

158
California Department of Pesticide Regulation Ver. 7.76 DEEM Chronic analysis for AZINPHOS METHYL (1994-98 data) Residue file name: H:\MyFiles\DEEM Files\Azinphos-methyl\azinphos-methyl-dietary-chronic2002.RS7 Adjustment factor #2 used. Analysis Date 04-22-2002/16:41:25 Residue file dated: 04-22-2002/16:09:45/14 NOEL (Chronic) = .15 mg/kg bw/day COMMENT 1: DPR chronic NOEL. =============================================================================== Critical Commodity Contribution Analysis for Females 20+ (not preg or nursing) Total Exposure =.0000488 mg/kg bw/day Crop groups with total exposure contribution > 10% Foods/Foodforms with exposure contribution > 5% ------------------------------------------------------------------------------- Crop group ------------ Exposure Analysis ----------- Food mg/kg |% of Total| Percent | Margin Foodform body wt/day| Exposure | of NOEL |of Exposr ---------------------------------- -----------|----------|-------- |--------- Crop Group = (O) Other Sugar-cane 0.0000105 21.59% 0.0% 14,232 ---------------------------------- -----------|----------|-------- |--------- Total for crop group 0.0000115 23.53% 0.0% 13,058 Crop Group = (4) Leafy Vegetables (except Brassica) Parsley 0.0000147 30.18% 0.0% 10,180 ---------------------------------- -----------|----------|-------- |--------- Total for crop group 0.0000151 31.01% 0.0% 9,908 Crop Group = (4A) Leafy Greens Parsley 0.0000147 30.18% 0.0% 10,180 ---------------------------------- -----------|----------|-------- |--------- Total for crop group 0.0000147 30.19% 0.0% 10,176 Crop Group = (11) Pome Fruits Apples 0.0000099 20.31% 0.0% 15,124 Pears 0.0000025 5.19% 0.0% 59,209 ---------------------------------- -----------|----------|-------- |--------- Total for crop group 0.0000139 28.38% 0.0% 10,825 Total for crop groups listed above: 0.0000405 82.92% 0.0% 3,705 ------------------------------------------------------------------------------- 1. Margin of Exposure = NOEL / Dietary Exposure 8

159
California Department of Pesticide Regulation Ver. 7.76 DEEM Chronic analysis for AZINPHOS METHYL (1994-98 data) Residue file name: H:\MyFiles\DEEM Files\Azinphos-methyl\azinphos-methyl-dietary-chronic2002.RS7 Adjustment factor #2 used. Analysis Date 04-22-2002/16:41:25 Residue file dated: 04-22-2002/16:09:45/14 NOEL (Chronic) = .15 mg/kg bw/day COMMENT 1: DPR chronic NOEL. =============================================================================== Critical Commodity Contribution Analysis for Females 13+ (preg/not nursing) Total Exposure =.0000696 mg/kg bw/day Crop groups with total exposure contribution > 10% Foods/Foodforms with exposure contribution > 5% ------------------------------------------------------------------------------- Crop group ------------ Exposure Analysis ----------- Food mg/kg |% of Total| Percent | Margin Foodform body wt/day| Exposure | of NOEL |of Exposr ---------------------------------- -----------|----------|-------- |--------- Crop Group = (O) Other Sugar-cane 0.0000161 23.18% 0.0% 9,298 ---------------------------------- -----------|----------|-------- |--------- Total for crop group 0.0000171 24.52% 0.0% 8,789 Crop Group = (4) Leafy Vegetables (except Brassica) Parsley 0.0000177 25.45% 0.0% 8,470 ---------------------------------- -----------|----------|-------- |--------- Total for crop group 0.0000180 25.88% 0.0% 8,328 Crop Group = (4A) Leafy Greens Parsley 0.0000177 25.45% 0.0% 8,470 ---------------------------------- -----------|----------|-------- |--------- Total for crop group 0.0000177 25.45% 0.0% 8,469 Crop Group = (8) Fruiting Vegetables Peppers-chilli incl jalapeno 0.0000038 5.43% 0.0% 39,678 ---------------------------------- -----------|----------|-------- |--------- Total for crop group 0.0000047 6.69% 0.0% 32,207 Crop Group = (11) Pome Fruits Apples 0.0000182 26.20% 0.0% 8,226 ---------------------------------- -----------|----------|-------- |--------- Total for crop group 0.0000239 34.40% 0.0% 6,266 Total for crop groups listed above: 0.0000637 91.50% 0.0% 2,356 ------------------------------------------------------------------------------- 1. Margin of Exposure = NOEL / Dietary Exposure 9

160
California Department of Pesticide Regulation Ver. 7.76 DEEM Chronic analysis for AZINPHOS METHYL (1994-98 data) Residue file name: H:\MyFiles\DEEM Files\Azinphos-methyl\azinphos-methyl-dietary-chronic2002.RS7 Adjustment factor #2 used. Analysis Date 04-22-2002/16:41:25 Residue file dated: 04-22-2002/16:09:45/14 NOEL (Chronic) = .15 mg/kg bw/day COMMENT 1: DPR chronic NOEL. =============================================================================== Critical Commodity Contribution Analysis for Females 13+ (nursing) Total Exposure =.0000559 mg/kg bw/day Crop groups with total exposure contribution > 10% Foods/Foodforms with exposure contribution > 5% ------------------------------------------------------------------------------- Crop group ------------ Exposure Analysis ----------- Food mg/kg |% of Total| Percent | Margin Foodform body wt/day| Exposure | of NOEL |of Exposr ---------------------------------- -----------|----------|-------- |--------- Crop Group = (O) Other Sugar-cane 0.0000117 20.86% 0.0% 12,856 ---------------------------------- -----------|----------|-------- |--------- Total for crop group 0.0000122 21.80% 0.0% 12,301 Crop Group = (4) Leafy Vegetables (except Brassica) Parsley 0.0000108 19.27% 0.0% 13,921 ---------------------------------- -----------|----------|-------- |--------- Total for crop group 0.0000110 19.67% 0.0% 13,637 Crop Group = (4A) Leafy Greens Parsley 0.0000108 19.27% 0.0% 13,921 ---------------------------------- -----------|----------|-------- |--------- Total for crop group 0.0000108 19.28% 0.0% 13,913 Crop Group = (11) Pome Fruits Apples 0.0000133 23.84% 0.0% 11,252 Pears 0.0000038 6.81% 0.0% 39,379 ---------------------------------- -----------|----------|-------- |--------- Total for crop group 0.0000202 36.16% 0.0% 7,418 Crop Group = (12) Stone Fruits Total for crop group 0.0000056 10.01% 0.0% 26,791 Total for crop groups listed above: 0.0000490 87.64% 0.0% 3,060 ------------------------------------------------------------------------------- 1. Margin of Exposure = NOEL / Dietary Exposure 10

161
California Department of Pesticide Regulation Ver. 7.76 DEEM Chronic analysis for AZINPHOS METHYL (1994-98 data) Residue file name: H:\MyFiles\DEEM Files\Azinphos-methyl\azinphos-methyl-dietary-chronic2002.RS7 Adjustment factor #2 used. Analysis Date 04-22-2002/16:41:25 Residue file dated: 04-22-2002/16:09:45/14 NOEL (Chronic) = .15 mg/kg bw/day COMMENT 1: DPR chronic NOEL. =============================================================================== Critical Commodity Contribution Analysis for Males 13-19 yrs Total Exposure =.0000628 mg/kg bw/day Crop groups with total exposure contribution > 10% Foods/Foodforms with exposure contribution > 5% ------------------------------------------------------------------------------- Crop group ------------ Exposure Analysis ----------- Food mg/kg |% of Total| Percent | Margin Foodform body wt/day| Exposure | of NOEL |of Exposr ---------------------------------- -----------|----------|-------- |--------- Crop Group = (O) Other Sugar-cane 0.0000243 38.68% 0.0% 6,172 ---------------------------------- -----------|----------|-------- |--------- Total for crop group 0.0000249 39.62% 0.0% 6,026 Crop Group = (4) Leafy Vegetables (except Brassica) Parsley 0.0000198 31.59% 0.0% 7,559 ---------------------------------- -----------|----------|-------- |--------- Total for crop group 0.0000202 32.08% 0.0% 7,442 Crop Group = (4A) Leafy Greens Parsley 0.0000198 31.59% 0.0% 7,559 ---------------------------------- -----------|----------|-------- |--------- Total for crop group 0.0000198 31.59% 0.0% 7,558 Crop Group = (11) Pome Fruits Apples 0.0000077 12.22% 0.0% 19,533 ---------------------------------- -----------|----------|-------- |--------- Total for crop group 0.0000109 17.39% 0.0% 13,727 Total for crop groups listed above: 0.0000560 89.09% 0.0% 2,680 ------------------------------------------------------------------------------- 1. Margin of Exposure = NOEL / Dietary Exposure 11

162
California Department of Pesticide Regulation Ver. 7.76 DEEM Chronic analysis for AZINPHOS METHYL (1994-98 data) Residue file name: H:\MyFiles\DEEM Files\Azinphos-methyl\azinphos-methyl-dietary-chronic2002.RS7 Adjustment factor #2 used. Analysis Date 04-22-2002/16:41:25 Residue file dated: 04-22-2002/16:09:45/14 NOEL (Chronic) = .15 mg/kg bw/day COMMENT 1: DPR chronic NOEL. =============================================================================== Critical Commodity Contribution Analysis for Males 20+ yrs Total Exposure =.0000509 mg/kg bw/day Crop groups with total exposure contribution > 10% Foods/Foodforms with exposure contribution > 5% ------------------------------------------------------------------------------- Crop group ------------ Exposure Analysis ----------- Food mg/kg |% of Total| Percent | Margin Foodform body wt/day| Exposure | of NOEL |of Exposr ---------------------------------- -----------|----------|-------- |--------- Crop Group = (O) Other Sugar-cane 0.0000124 24.40% 0.0% 12,070 ---------------------------------- -----------|----------|-------- |--------- Total for crop group 0.0000134 26.31% 0.0% 11,190 Crop Group = (4) Leafy Vegetables (except Brassica) Parsley 0.0000170 33.42% 0.0% 8,811 ---------------------------------- -----------|----------|-------- |--------- Total for crop group 0.0000174 34.19% 0.0% 8,612 Crop Group = (4A) Leafy Greens Parsley 0.0000170 33.42% 0.0% 8,811 ---------------------------------- -----------|----------|-------- |--------- Total for crop group 0.0000170 33.43% 0.0% 8,809 Crop Group = (11) Pome Fruits Apples 0.0000085 16.68% 0.0% 17,650 ---------------------------------- -----------|----------|-------- |--------- Total for crop group 0.0000120 23.50% 0.0% 12,529 Total for crop groups listed above: 0.0000428 84.01% 0.0% 3,505 ------------------------------------------------------------------------------- 1. Margin of Exposure = NOEL / Dietary Exposure 12

163
California Department of Pesticide Regulation Ver. 7.76 DEEM Chronic analysis for AZINPHOS METHYL (1994-98 data) Residue file name: H:\MyFiles\DEEM Files\Azinphos-methyl\azinphos-methyl-dietary-chronic2002.RS7 Adjustment factor #2 used. Analysis Date 04-22-2002/16:41:25 Residue file dated: 04-22-2002/16:09:45/14 NOEL (Chronic) = .15 mg/kg bw/day COMMENT 1: DPR chronic NOEL. =============================================================================== Critical Commodity Contribution Analysis for Seniors 55+ Total Exposure =.0000509 mg/kg bw/day Crop groups with total exposure contribution > 10% Foods/Foodforms with exposure contribution > 5% ------------------------------------------------------------------------------- Crop group ------------ Exposure Analysis ----------- Food mg/kg |% of Total| Percent | Margin Foodform body wt/day| Exposure | of NOEL |of Exposr ---------------------------------- -----------|----------|-------- |--------- Crop Group = (O) Other Sugar-cane 0.0000081 15.84% 0.0% 18,588 ---------------------------------- -----------|----------|-------- |--------- Total for crop group 0.0000090 17.74% 0.0% 16,596 Crop Group = (4) Leafy Vegetables (except Brassica) Parsley 0.0000140 27.52% 0.0% 10,699 ---------------------------------- -----------|----------|-------- |--------- Total for crop group 0.0000145 28.42% 0.0% 10,362 Crop Group = (4A) Leafy Greens Parsley 0.0000140 27.52% 0.0% 10,699 ---------------------------------- -----------|----------|-------- |--------- Total for crop group 0.0000140 27.53% 0.0% 10,696 Crop Group = (11) Pome Fruits Apples 0.0000124 24.37% 0.0% 12,083 Pears 0.0000039 7.64% 0.0% 38,521 ---------------------------------- -----------|----------|-------- |--------- Total for crop group 0.0000177 34.73% 0.0% 8,478 Crop Group = (12) Stone Fruits Peaches 0.0000029 5.74% 0.0% 51,331 ---------------------------------- -----------|----------|-------- |--------- Total for crop group 0.0000041 8.02% 0.0% 36,733 Total for crop groups listed above: 0.0000453 88.91% 0.0% 3,312 ------------------------------------------------------------------------------- 1. Margin of Exposure = NOEL / Dietary Exposure 13