axis equity hybrid fund - axismf.com · axis equity hybrid fund (an open ended hybrid scheme...
TRANSCRIPT

Axis Equity Hybrid Fund (An open ended hybrid scheme investing predominantly in equity and equity related instruments)
This product is suitable for investors who are seeking*:
Capital appreciation along with generation of income
over medium to long term
Investment in equity and equity related instruments as
well as debt and money market instruments
*Investors should consult their financial advisers if in
doubt about whether the product is suitable for them.
NFO period:
20th July, 2018 to 3rd August, 2018

Best way is driving at moderate/economy speed with
controlled use of throttle
What gives best mileage
in a two wheeler
vehicle?
Commuter motorcycles usually come with an economy
indicator or a „green zone‟ painted on speedometer to display
sweet spot
2

Making the ride frugal!
MODERATE SPEED
Consumes less fuel
Offers optimum grunt
LESS THROTTLE MAXIMUM MILEAGE
Increases fuel efficiency
Reduces load on engine
Gives better control on the vehicle
3

Making the ride frugal!
EQUITY
Opportunity to capture growth
Potential of higher returns
FIXED INCOME RISK ADJUSTED RETURNS
Potential of higher return with relatively
lesser risk
Stability by being less volatile
Regular income generation
Minimum -2.2 2.4 1.4
Maximum 59.0 12.5 40.8
Average 17.6 6.8 14.7
Std Deviation 14.7 2.3 9.1
3 year performance (Rolling return - Apr 02 – May 18)
Risk Adjusted Return: 70% Equity + 30% Debt with monthly rebalancing. Equity: Nifty 50 TRI Index, Fixed Income: Crisil Composite Bond Fund Index; Data period: April 2002 – 31st May 2018. Source:
MFI, Axis Internal Analysis. Past performance may or may not be sustained in future. For illustration & explanation purpose only. Does not reflect performance of any scheme. All numbers are
annualized. 4

Different Reactions Every asset has its unique benefit in a portfolio to achieve a common goal
RECESSION:
Low growth, low inflation, falling interest rates Underperform Outperform Neutral
RECOVERY:
Medium growth, stable inflation, stable interest rates Outperform Neutral Neutral
GROWTH:
High growth, stable inflation, stable to rising interest rates Outperform Neutral Neutral
OVERHEATING:
High growth, rising inflation, rising interest rates Neutral Underperform Neutral
EQUITY DEBT CASH 5

DIVERSIFIES AND
REDUCES RISK
TAILORED TO YOUR
RISK PROFILE
BETTER TAX
EFFICIENCY
OFFERS STABLE
RETURNS OVER THE
MEDIUM TERM
Solution: Asset Allocation Appropriate asset allocation gives confidence though ups and downs of the market
Key ingredient of successful investing
6

7
NORMAL INVESTOR SMART INVESTOR
MARKET TIMING Tends to react to every market movement,
thus highly exposed to uncertainty
Investment linked to the risk profile and not
current market levels
CHASING THE HOTTEST
TREND
Continuous portfolio churn restricts the
portfolio from long term benefits
Steady Allocation over time
CYCLES OF GREED AND
FEAR
Irrational investment decision Asset allocation allows investors to “Buy
low-Sell high”
Smart choice! Asset allocation helps avoid market traps

Lower correlation
among asset classes Periodic Rebalancing
Reasonable downside
protection
Benefit from active
management
How does Asset
Allocation work to
benefit portfolios?
8

9
Equity: Nifty 50 Index, Debt: Crisil Composite Bond Fund Index; MFI, Axis Internal Analysis. Past performance may or may not be sustained in future. For illustration & explanation purpose only. Does not reflect performance of any scheme.
Lesser the correlation among assets, lower the risk Lower correlation among assets improves diversification gains
Not all asset class will move in same direction at all
times.
If correlation is higher, sensitivity to market
movement rises. This can add to overall risk.
Lower correlation acts as hedge against each other and
hence reduces risk and optimizes return
DEBT EQUITY
Returns (CAGR)
Bull market
(2004 - 07) 2.4% 48.6%
Bear market
(2008 - 09) 18.6% -50.3%

10
Equity: Nifty 50 Index, Debt: Crisil Composite Bond Fund Index; MFI, Axis Internal Analysis. ^Effective risk: Standard deviation based on daily returns for the investment period. Investment Period: (Apr 02 – May 18). Effective allocation is the allocation at the end of the period (May 18)
Diminish the tendency for “portfolio drift,” and thus potentially reduce their exposure to risk relative to their target asset allocation
Lowers overall risk and optimizes returns relative to target allocation
Rebalancing within the fund makes it cost & tax efficient for investors as compared to investors doing it at their end
Allocation at the
start of investment
Effective
allocation Effective Risk^
WITH
REBALANCING
70 Equity + 30 Debt
70 Equity + 30 Debt
13%
WITHOUT
REBALANCING
70 Equity + 30 Debt
90 Equity + 10 Debt
16%
Rebalancing benefit Effective risk management technique

SIMPLE INFOGRAPHIC SLIDE Downside protection through diversification Downside protection aim to reduce the frequency and/or magnitude of capital losses, resulting from significant asset market declines
Aims to limit the impact of potential losses from market downturns
If the markets fall by Increase needed to
recover
-10% 11%
-15% 18%
-20% 25%
-50% 100%
-80% 400%
Higher the fall, larger is the increase required to recover
-60%
-50%
-40%
-30%
-20%
-10%
0%
Apr-02 Apr-04 Apr-06 Apr-08 Apr-10 Apr-12 Apr-14 Apr-16 Apr-18
Equity
Fixed Income
Fixed Income: CRISIL Composite Bond Fund Index, Equity : Nifty 50 Index. Drawdown is the peak-to-trough decline during a specific recorded period of an investment. Past performance may or may not be sustained in future. Drawdown is the percentage between the peak and the subsequent trough.
11

12
Debt: CRISIL Composite Bond Fund Index, Equity : Nifty 50 Index TRI. Source: Axis Internal Analysis, CRISL, MFI. Past performance may or may not be sustained in future. For illustration & explanation purpose only. Does not reflect performance of any scheme. All returns are compounded annualized (CAGR)
3 YEARS 5 YEARS 10 YEARS
Index based static allocation portfolio
(70% Equity + 30% Debt) 7.8 12.3 9.3
CRISIL - AMFI Balance Fund
Performance Index 9.0 16.1 12.5
Benefit from active management Fund manager adds value through active management within the asset class
Research based investing with fundamental approach contributes to alpha generation in overall portfolio

Fixed Income Funds
Conservative Hybrid
Equity Savings Funds
Dynamic Equity Allocation Funds
Axis Equity Hybrid Fund
Equity Funds
13
Indicative positioning on risk return estimates from strategy based indices. For illustrative purposes only
Introducing Axis Equity Hybrid Fund Product Positioning : Balanced Approach to Investing
14
Please refer the Scheme Information Document for detailed description on asset allocation and investment strategy
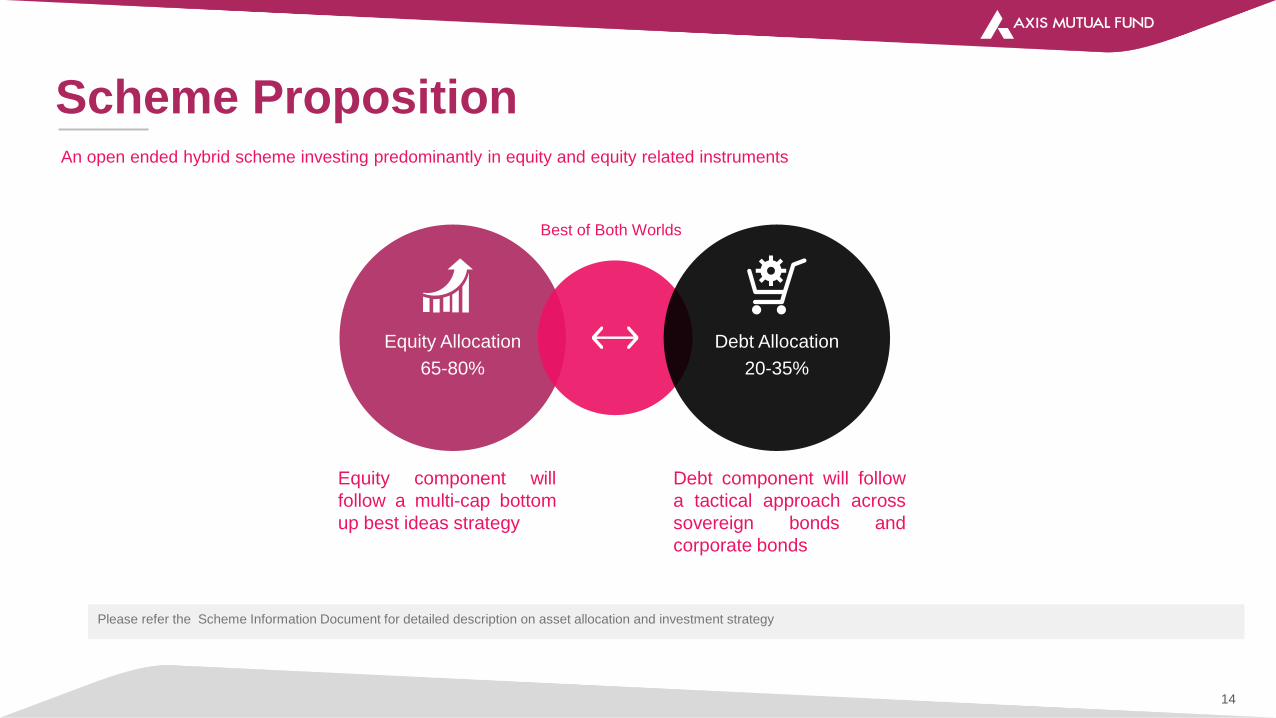
Scheme Proposition An open ended hybrid scheme investing predominantly in equity and equity related instruments
Equity Allocation
65-80%
Debt Allocation
20-35%
Best of Both Worlds
Equity component will
follow a multi-cap bottom
up best ideas strategy
Debt component will follow
a tactical approach across
sovereign bonds and
corporate bonds

Risk return tradeoff is likely to be favorable over the
medium term
Good ideas can do better irrespective of its
sector/theme/size
Focus on fast growing sectors with bottom up stock
picking approach
Equity
Investment Approach
Large cap bias with up to 30% in midcaps*
*Investment focus is based on current market outlook and is subject to fund manager
discretion. Investors are advised to refer SID for investment strategy of the scheme
EQUITY
15

8879.6
Indian economy entering a productive growth phase
We are positive on consumption with focus on urbanization with rural overlay; government reforms is expected to push growth
We see initial signs of capex revival, but full fledged investment-led growth is a while away
Accelerated growth in earnings is essential for valuation premium to sustain and increase
We continue to expect elevated volatility levels
Equity allocations should be looked at from a medium to long term perspective.
16
Current equity market view Summary

Discretionary Consumption
• Focus on companies with high
brand recall and niche product
portfolios.
• Also target companies benefiting
from the un-organized to organized
shift
Rural
• Capture the opportunity for
consumer spending on account of
government policies aimed at
enhancing rural livelihoods
• Improving trend in rural wage
growth is directly encouraging for
rural consumption & indirectly for
aggregate demand and for the
investment cycle
Retail Finance
• Improving financialisation and rural
penetration is likely to benefit retail
focused banks and NBFC`s
• Positive on B2C as compared to
B2B for the last several quarters
due to their underlying fundamental
strengths and significant market
opportunities
Export led sectors
• Provide hedge against depreciating
rupee
• Reasonable diversification to the
portfolio
Key investment themes Focus on urbanization with rural overlay; selective at cyclical and export led stories
17

The portfolio duration and credit exposures will be
decided based on a thorough research
Flexibility to invest in the entire range of debt
instruments across credit/duration spectrum
Active duration management
Debt
Investment Approach
Invest in best ideas
*Investment focus is based on current market outlook and is subject to fund manager
discretion. Investors are advised to refer SID for investment strategy of the scheme
DEBT
18

19
Source: Axis AMC Internal Analysis. Non- Government Securities include all securities that are not issued by government including CDs, CPs, Corporate Bonds, ZCBs, etc. This does not indicate any proposed allocation or future performance of Axis Equity Hybrid Fund.
Illustrative asset mix of actively managed fund Favourable credit cycle let us capture the
widened corporate bond spreads
Mid 2012
01
Favourable credit environment backed by improved
corporate profitability led us to shift to lower rated
corporate bonds from G-Sec and reduced maturity
Early 2016
03
Turnaround of credit cycle, slowing inflation and
improving macros led us to increase our portfolio
level duration predominantly via G-Sec exposure
Early 2014
02
Illustration of active management Judious asset mix : Two key risks to be managed: Interest rate risk and credit risk

8879.6
Markets seem to have priced in 50 basis rate hikes till March 2019
We do not expect any significant rally due to fiscal worries and weak demand supply dynamics
On a risk reward basis, the short end of the curve remains attractive as compared to long end of the curve
Short term corporate bonds offer lucrative opportunities with elevated yields and lower volatility
20
Current fixed income market view Summary

Improved credit ratio : 1402 upgrades and 839 downgrades in fiscal 2018
Reason for improvement:
Better financial indicators as corporates kept away from capital expenditure given the output gap – or substantial headroom in capacity utilisation – in many sectors
Source: CRISIL, Bloomberg. Data as on 25th May 2018
Credit ratio 3 year AA spreads over G-Sec
0.0
0.2
0.4
0.6
0.8
1.0
1.2
1.4
1.6
1.8
FY 13 Fy 14 FY 15 FY 16 FY 17 FY 18
0.5
0.7
0.9
1.1
1.3
1.5
1.7
1.9
May-15 May-16 May-17 May-18
21
Our focus: Improved corporate profitability Offering better spreads on lower rated bonds

22
£ Erstwhile Axis Income Saver Fund. ^Based on asset allocation in SID. Data as on 30th June 2018. ^Volatility is the standard deviation based on daily returns for last 1 year.
AXIS
REGULAR
SAVER
FUND£
AXIS TRIPLE
ADVANTAGE
FUND
AXIS
EQUITY
SAVER
FUND
AXIS
DYNAMIC
EQUITY
FUND
AXIS EQUITY
HYBRID
FUND
Category Conservative
Hybrid Fund
Multi Asset
Allocation
Equity
Savings
Dynamic
Asset
Allocation
Aggressive
Hybrid Fund
Equity Allocation Static Static Static Dynamic Static
Current Equity
Allocation
24% 76% 42% 48% (65-80%)^
Volatility^
(1 year)
3.5% 5.5% 4.8% 5.3% -
Axis approach not only focuses on
potential growth but also aims to
protect downside
Our multi-asset product suite An Aggressive Hybrid Fund, complementing the Axis Product Bouquet

23
Stocks: Nifty 50 TRI Index, Bonds: Crisil Composite Bond Fund Index;. Source: Axis Internal Analysis. Past performance may or may not be sustained in future. Index values are normalized to 100.
Simulated index performance with risk measures Asset allocation targets risk adjusted returns
STOCKS BONDS 70% STOCKS +
30% BONDS
Return 16.5% 6.9% 14.2%
Risk 18.5% 2.1% 13.0%

24
Features at a Glance
CRISIL Hybrid 35+65 - Aggressive
Index*
BENCHMARK TYPE
An open ended hybrid scheme
investing predominantly in equity
and equity related instruments
NAME
Axis Equity Hybrid Fund
Rs. 5,000 and in multiples of Re.
1/- thereafter
Minimum Additional Purchase
Amount of Rs.100 and in multiples
of Re. 1/- thereafter
MINIMUM APPLICATION AMOUNT EXIT LOAD
If redeemed/switched out on or before
12 months from the date of allotment:
- For 10% of investment: Nil
- For remaining investment: 1%
If redeemed/switched out after 12
months from the date of allotment: Nil
FUND MANAGER
Shreyash Devalkar & Ashish Naik
(Equity), R Sivakumar (Debt)
* Erstwhile called as CRISIL Balanced Fund Index

Special Feature : Automatic Encashment Plan
25
Past performance may or may not be sustained in future. Please refer to SID for detailed information on the above feature. *Tax paid is calculated @15% if redeemed before 1 year & @10% if redeemed after 1 year as the invested fund is assumed to be an equity fund Tax is calculated excluding cess and surcharge # Dividend distribution tax calculation for illustration purpose only, had the client withdrawn using a dividend option instead of AEP option ^ Dividend distribution tax is considered @11.648%, the rate applicable for individuals in an equity fund. Benefit of Indexation is not considered for calculation of capital gains amount in the above example. Dividend distribution tax calculation for illustration purpose only. The tax calculation assumes payout of the amount as dividend by Schemes. Declaration of dividend is subject to discretion of Trustee. As such there cannot be any assurance given on rate of dividend or on frequency for declaration of dividend. The information set out above is included for general information purpose only and does not constitute legal or tax advice. In view of the individual nature of the tax consequences, each investor is advised to consult his or her own tax consultant. Please consult your legal /tax advisor before making an investment
Illustration:
Investment Amount 10 lacs
Monthly Automatic Encashment Rs 7000
Tenor 24 months
XIRR (assumed) 6.5%
Total Withdrawal 1,68,000
*Total Capital Gains Tax Paid Rs 1,800
DIVIDEND OPTION AEP FACILITY
Amount of dividend is at fund manager‟s
discretion
Amount of monthly cashflow is pre decided
by the investor
Flexibility of dividend declaration is with fund
manager
Pre defined frequency of monthly withdrawal
Taxed at 10% (DDT) Capital gain tax proportionate to the amount
of withdrawal
This feature aims to provide a tax efficient
option for regular income
WHAT is AEP?
Investors can redeem a fixed percentage of
the investment value on a monthly basis
HOW does it work?
Investors looking for regular cash flow can
consider Automatic Encashment Plan as an
added feature under the scheme
WHY choose this option?

Market Update
26

GDP (%) Fiscal deficit (% GDP)
Forex reserves (US$m) Current account deficit (% GDP)
Source: Bloomberg, IMF (International Monetary Fund), Axis AMC Internal Analysis. Data as on 25th May 2018.
27
0
1
2
3
4
5
6
7
2009 2012 2015 2018
210,000
260,000
310,000
360,000
410,000
460,000
2009 2012 2015 2018-6
-5
-4
-3
-2
-1
0
2009 2011 2013 2015 2017
Indian economy entering a productive growth phase
6.7
8.6
8.9
6.7
5.5
6.4
7.4
8.2
7.1 6.5
7.4
5.0
6.0
7.0
8.0
9.0
10.0
2009 2011 2013 2015 2017
IMF
Forecast

Source: PMJDY, UIDAI, Company data, TRAI, IDC, NPCI, Morgan Stanley Research,
0
50
100
150
200
250
300
350
FY14 FY15 FY16 FY17 FY18 YTD
Mn of Bank A/cs opened under PMJDY
0%10%20%30%40%50%60%70%80%90%100%
0
200
400
600
800
1000
1200
1400
2010 2012 2014 2016
Aadhaar Assigned (mn) Aadhaar penetration
-
100
200
300
400
500
FY13 FY14 FY15 FY16 FY17 FY18 YTD
Total Data Subscribers (mn)
0
50
100
150
200
250
Aug-16 Nov-16 Feb-17 May-17 Aug-17 Nov-17 Feb-18
UPI Transactions Amount (Rs bn)
Government initiatives on inclusion, digitisation path breaking “JAM” trinity can transform the lifestyles of common citizens
28

Demand is making a comeback; synchronous recovery of consumption and exports should help lift capacity utilization
Source: Morgan Stanley. Data as on 30th June 2018
We are seeing initial signs of capex revival
29
-40%
-30%
-20%
-10%
0%
10%
20%
30%
40%
50%
60%
Dec-08 Jun-10 Dec-11 Jun-13 Dec-14 Jun-16 Dec-17
Order Book, Quarterly Order Inflows, Trailing 4-Quarter sum
74%
76%
72%
75%
79%
82%
FY13 FY14E FY15 FY16E FY18 FY19E
Recovery in capex cycle evident in order books Improvement in Capacity Utilisation

Urbanization with rural overlay supported by government reforms is expected to push growth
Source: Morgan Stanley. IBEF Data as on 30th June 2018
Consumption indicators are strong, with improved exports growth
30
Vehicle production in India („000 units) 2W/CW Sales - Robust
4,010
895
24,169
10,000
2,350
30,231
Passenger Vehicles Commercial Vehicles 2&3 Wheelers
FY 18 FY 21E-21%
-11%
-1%
9%
19%
29%
39%
May-12 May-14 May-16 May-18
YoY%
YoY% 3MMA
Two Wheeler Sales
-25%
-15%
-5%
5%
15%
25%
May-12 May-14 May-16 May-18
YoY%
YoY% 3MMA
Passenger Car Sales

Corporate sector is at the cusp of a significant earnings recovery in the coming quarters
Source: Bloomberg, CLSA, CL – CLSA estimate. Data as on 31st May 2018
Earnings growth is likely to stabilise post recent disruptions
7%
10%
3%
-4%
8%
14%
21%
-10%
-5%
0%
5%
10%
15%
20%
25%
FY 13 FY 14 FY 15 FY 16 FY 17 FY 18CL FY 19CL
Nifty Earnings Growth
31
Nifty Forward P/E
10
12
14
16
18
20
22
24
Jun-09 Jun-11 Jun-13 Jun-15 Jun-17

Market is moving back to fundamentals versus hope
Source: Bloomberg. Data as on 30th June 2018
Market outperformance has narrowed to only few performing stocks & sectors
32
Return Range CY 2017 YTD 18
No of stocks
Less than -10% 25 326
Between -10% and 0% 17 70
Up to 10% 35 48
Above 10% 403 57
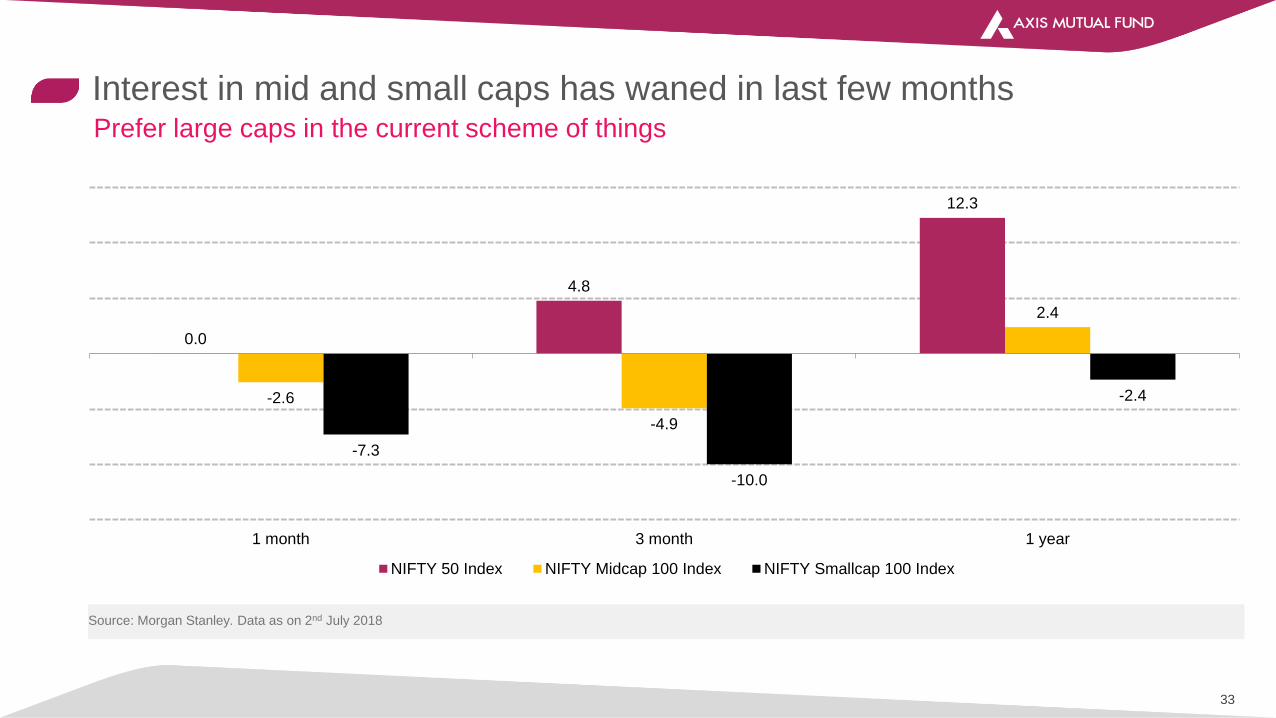
Prefer large caps in the current scheme of things
Source: Morgan Stanley. Data as on 2nd July 2018
Interest in mid and small caps has waned in last few months
33
0.0
4.8
12.3
-2.6
-4.9
2.4
-7.3
-10.0
-2.4
1 month 3 month 1 year
NIFTY 50 Index NIFTY Midcap 100 Index NIFTY Smallcap 100 Index

Source: Motilal Oswal, Axis AMC Analysis Past performance may or may not be sustained in future. Data as on 31st Dec 2017
Very few companies are able to sustain long term growth
Of the 613 companies, listed for 20 years from 1997 to 2017, only 87 companies had Price CAGR > 25%. Likewise, only 89 companies managed
Profit CAGR > 25%
Price CAGR No of
companies
% of total
<= 0% 41 7%
0 – 15% 292 48%
15 – 25% 193 31%
25 – 35% 70 11%
> 35% 17 3%
Total 613 100%
Profit CAGR No of
companies
% of total
<= 0% 167 27%
0 – 15% 243 40%
15 – 25% 114 19%
25 – 35% 32 5%
> 35% 57 9%
Total 613 100%
34

OUR
APPROACH
Axis is a bottom-up investor that focuses on
fundamental research driven investing
Our philosophy is focused on identifying quality
companies that have a sustainable medium to
long term growth potential run by capable
managements
AMELIA PEARCY
Designer
EQUITY KEY PILLARS OF OUR INVESTMENT
APPROACH
Growth
biased –
focusing on
sustainable
growth
Look for
quality
businesses
Aim to
deliver
superior risk
adjusted
returns
High
conviction
investors
35

Source: Axis
What do we mean by quality businesses?
Bottom-Up approach with 2-3 year view looking for
Strong business
model, which
demonstrates its
pricing power in the
product category
and the business it
is in, and ultimately
Good ROE’s
and cash flows
Secular growth
rate of the sector,
which is anywhere
around 1.5 to 2x of
GDP;
Strong
corporate
governance/Stro
ng promoter
pedigree
36

Identifying Quality Companies
37
Quantitative Factors
• Strong Return Metrics
• Stable Cash Flow
• High profitability, low debt-to-equity and earnings consistency
Qualitative Factors
• Strong management pedigree
• Transparency of operations for investors and key stakeholders
• Credible oversight committees & strong internal controls
• Sustainable long term business model
-
100.00
200.00
300.00
400.00
500.00
600.00
Mar-08 Mar-10 Mar-12 Mar-14 Mar-16 Mar-18
Quality Beats The Broader Market
S&P BSE Sensex (TR) S&P BSE 100 (TR)
S&P BSE 500 (TR) S&P BSE Quality Index (TR)
S&P BSE Quality (TR)
19.21%
S&P BSE 500 (TR)
10.21%
S&P BSE 100 (TR)
9.76%
S&P BSE Sensex (TR)
9.33%
Source: Asia Index Private Limited. Data as on 31st March 2018. Past performance may or may not be sustained in the future. All returns are calculated on a compound annual growth rate basis and on total return values which incorporate effects of corporate actions in the underlying constituents. All values normalized to 100

Quality stocks are consistent outperformers
Source: Bloomberg, Axis AMC Internal Research. Data for the period 31st March 2013 to 31st March 2018. Past performance may or may not be sustained in the future. Stocks mentioned may or may not be part of schemes of Axis Mutual Funds. Refer disclaimers at the end of the document. The stocks mentioned should not be construed as recommendations by Axis Asset Management Company or Axis Mutual Fund. The data provided above is solely for illustration purposes only
• High ROE Company Performance
Company ROE % 5 Yr CAGR
Page Industries 54.58 44.45
Maruti Suzuki 15.03 44.35
Bajaj Finance 17.80 42.97
Motherson Sumi Systems 28.06 41.22
Shree Cement 18.57 31.33
HDFC Bank 19.82 23.73
Asian Paints 31.40 20.03
TCS 37.77 16.21
• Low ROE Company Performance
Company ROE % 5 Yr CAGR
DLF 1.60 -1.08
Tata Power Co. 1.98 -1.18
Bharti Airtel 6.29 7.96
Bank of Baroda 6.36 3.23
BHEL 7.68 -5.73
NHPC Ltd 7.98 11.74
State Bank Of India 8.85 5.24
Oil & Natural Gas Corporation 14.56 0.72
38

Yearly returns between 1980-2017
Source: MFI, Data from Dec'80 - Dec'17, Returns are compounded annualized. Data based on yearly rolling of S&P BSE Sensex Index. Past performance may or may not be sustained in future.
Corrections have never been permanent
39
Less than -20% annual returns
Years following the worst
1997
2010
1994
1989
2004
1986 2013 2017
1996 1984 1992 1981 1985
2000 2015 1983 1990 1988 1991
1995 1987 1982 2014 2007 2009
2011 1998 2002 1993 2006 2003
2008 2001 2016 2012 2005 1999
-20 and less -20 to 0 0 to 20 20 to 40 40 to 60 60+

Rolling returns of Sensex (1980 - 2017)
Source: MFI, Data from Dec'80 - Dec'17, Returns are compounded annualized. Data based on yearly rolling of S&P BSE Sensex Index. Past performance may or may not be sustained in future.
Markets have rewarded long term investors
40

Product Label, Statutory Details and Risk Factors
41
Disclaimer: Past performance may or may not be sustained in the future. Sector(s) / Stock(s) / Issuer(s) mentioned above are for the purpose of disclosure of the portfolio of the Scheme(s) and should not be construed as recommendation. The fund manager(s) may or may not choose to hold the stock mentioned, from time to time. Investors are requested to consult their financial, tax and other advisors before taking any investment decision(s). Statutory Details: Axis Mutual Fund has been established as a Trust under the Indian Trusts Act, 1882, sponsored by Axis Bank Ltd. (liability restricted to Rs. 1 Lakh). Trustee: Axis Mutual Fund Trustee Ltd. Investment Manager: Axis Asset Management Co. Ltd. (the AMC). Risk Factors: Axis Bank Limited is not liable or responsible for any loss or shortfall resulting from the operation of the scheme. This document represents the views of Axis Asset Management Co. Ltd. and must not be taken as the basis for an investment decision. Neither Axis Mutual Fund, Axis Mutual Fund Trustee Limited nor Axis Asset Management Company Limited, its Directors or associates shall be liable for any damages including lost revenue or lost profits that may arise from the use of the information contained herein. No representation or warranty is made as to the accuracy, completeness or fairness of the information and opinions contained herein. The AMC reserves the right to make modifications and alterations to this statement as may be required from time to time. Mutual Fund Investments are subject to market risks, read all scheme related documents carefully.

Thank You