aws truewind, llc 081908/mesoscale_ewits_trc_081908.pdf• test various mesoscale model...
TRANSCRIPT

AWS Truewind, LLC
Eastern Wind Integration and Transmission Study
Michael Browermbrower@awstruewind [email protected]
August 19,2008
CONFIDENTIAL
Outline
• Introduction to AWS TruewindIntroduction to AWS Truewind• Scope of Work• Progress to Date• Issues and Concerns• Tasks Remaining
CONFIDENTIAL

Headquarters: Albany, NY
• Mapping• Energy Assessment• Project Engineering• Performance Evaluation• Forecasting
l Industry Leader & Consultant for 30,000+ MWl Full spectrum of wind plant design, development
and evaluation servicesand evaluation servicesl Project roles in over 50 countries
l Established in 1983; ~100 employees in 4 offices
CONFIDENTIAL© 2007 AWS
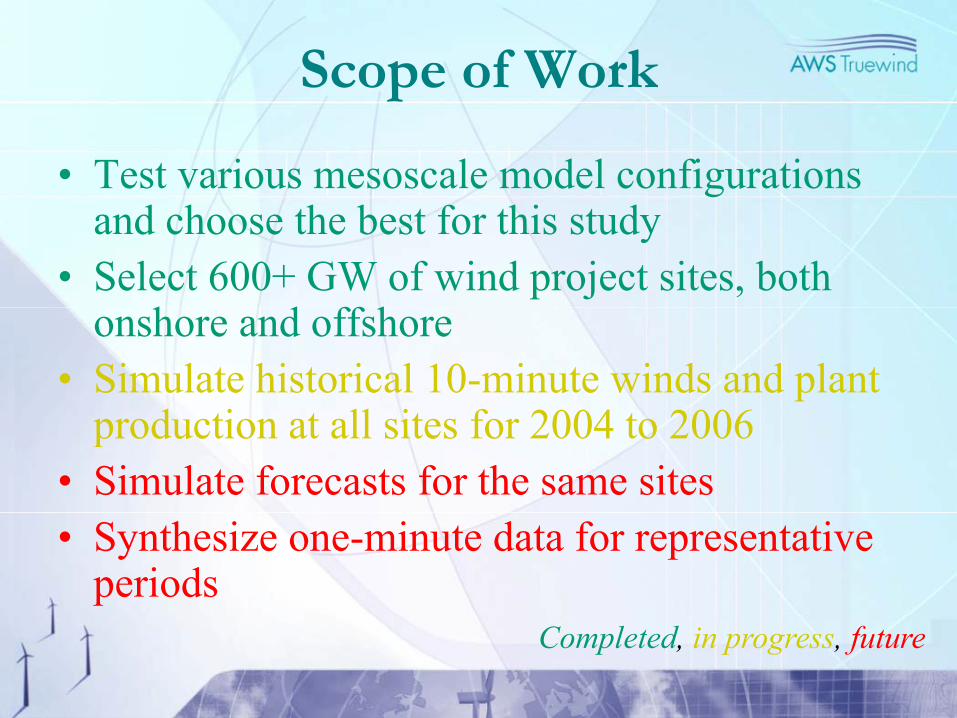
Scope of Work
• Test various mesoscale model configurations d h h b f hi dand choose the best for this study
• Select 600+ GW of wind project sites, both h d ff honshore and offshore
• Simulate historical 10-minute winds and plant d i ll i f 2004 2006production at all sites for 2004 to 2006
• Simulate forecasts for the same sites• Synthesize one-minute data for representative
periods
CONFIDENTIAL
Completed, in progress, future
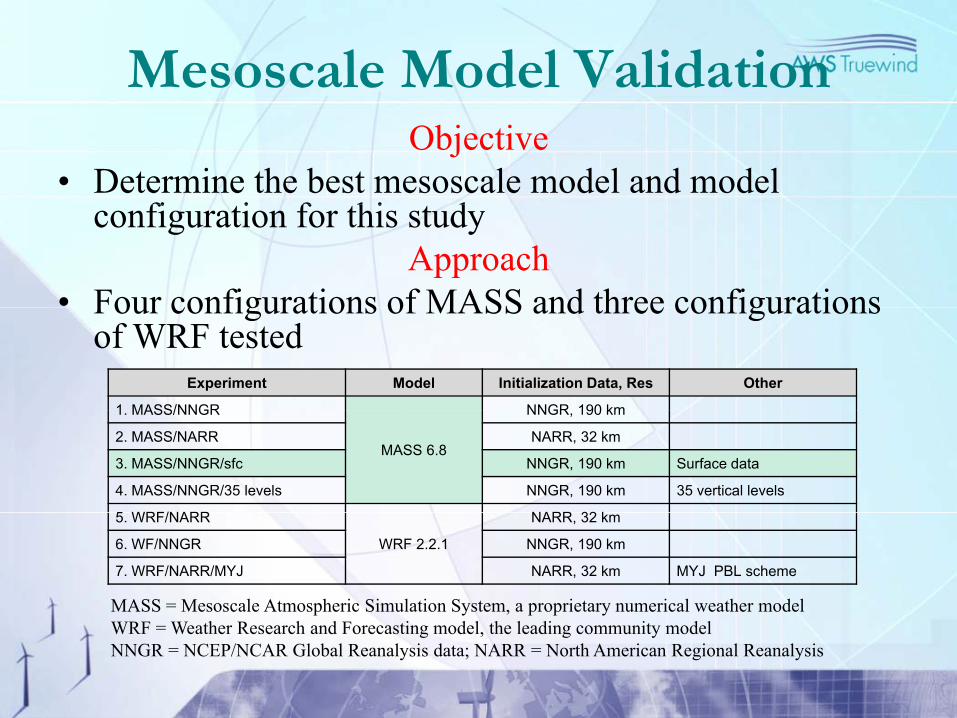
Mesoscale Model ValidationObjective
• Determine the best mesoscale model and model fi i f hi dconfiguration for this study
Approach• Four configurations of MASS and three configurationsFour configurations of MASS and three configurations
of WRF testedExperiment Model Initialization Data, Res Other
1 MASS/NNGR NNGR 190 km1. MASS/NNGR
MASS 6.8
NNGR, 190 km
2. MASS/NARR NARR, 32 km
3. MASS/NNGR/sfc NNGR, 190 km Surface data
4. MASS/NNGR/35 levels NNGR, 190 km 35 vertical levels
5 WRF/NARR NARR 32 k5. WRF/NARR
WRF 2.2.1
NARR, 32 km
6. WF/NNGR NNGR, 190 km
7. WRF/NARR/MYJ NARR, 32 km MYJ PBL scheme
MASS = Mesoscale Atmospheric Simulation System, a proprietary numerical weather model
CONFIDENTIAL
p y p p yWRF = Weather Research and Forecasting model, the leading community modelNNGR = NCEP/NCAR Global Reanalysis data; NARR = North American Regional Reanalysis
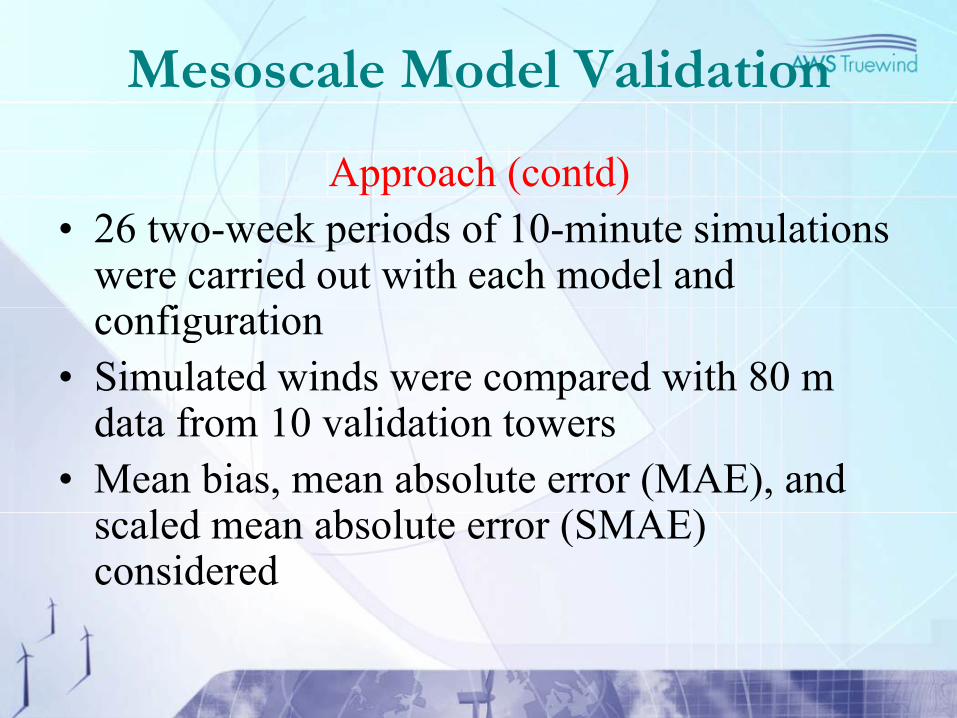
Mesoscale Model Validation
Approach (contd)• 26 two-week periods of 10-minute simulations
were carried out with each model and fi iconfiguration
• Simulated winds were compared with 80 m d f 10 lid idata from 10 validation towers
• Mean bias, mean absolute error (MAE), and l d b l (SMAE)scaled mean absolute error (SMAE)
considered
CONFIDENTIAL

Validation Towers
CONFIDENTIAL
Locations of towers are not exact
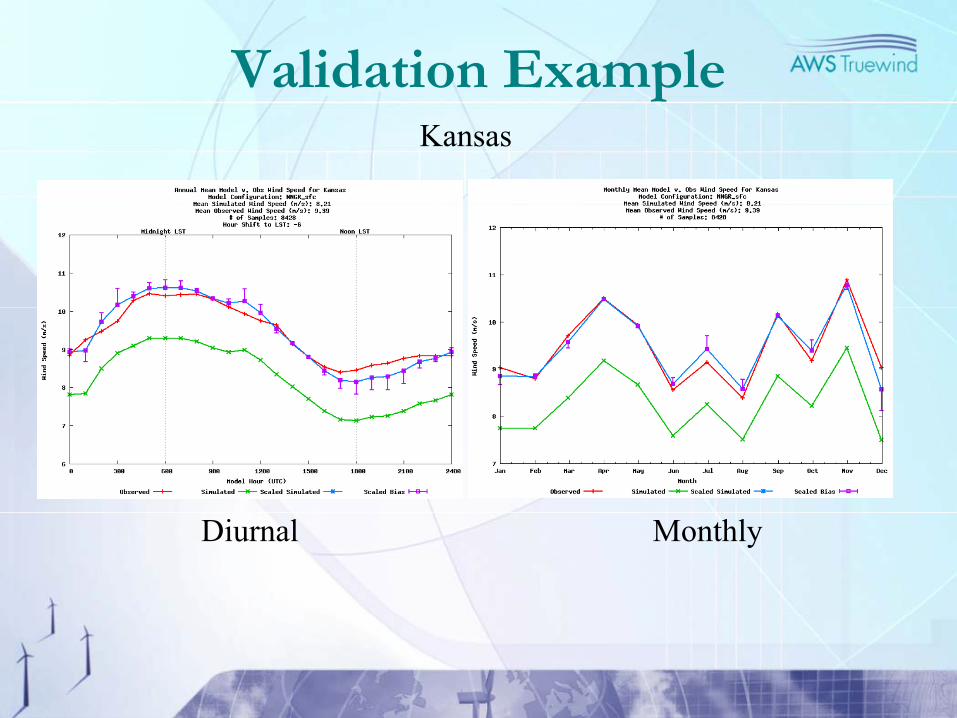
Validation ExampleKansas
Diurnal Monthly
CONFIDENTIAL
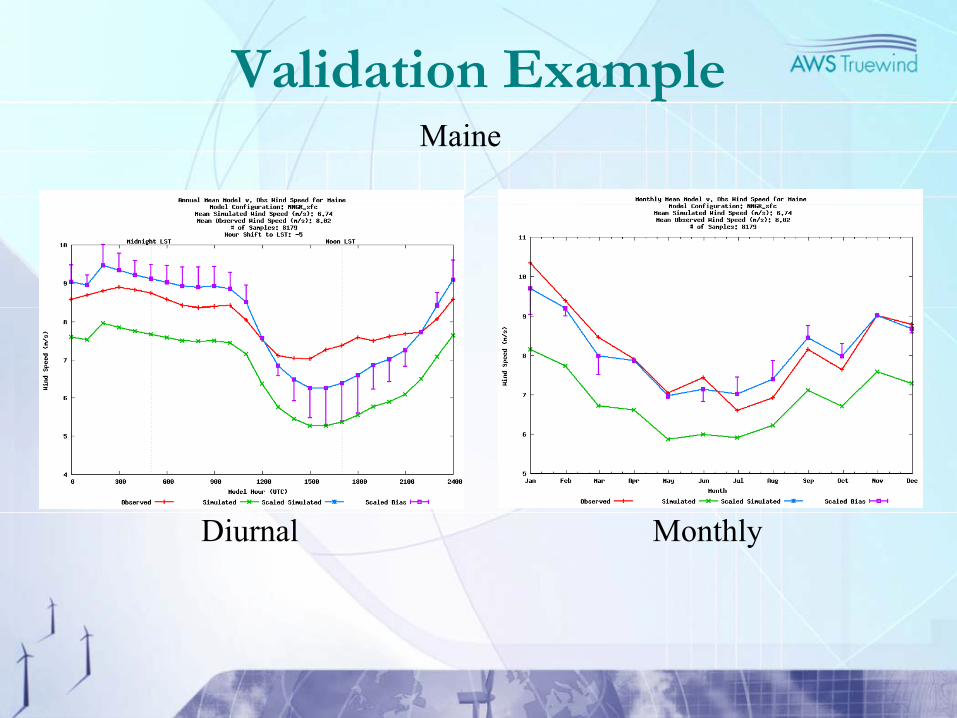
Validation ExampleMaine
Diurnal Monthly
CONFIDENTIAL
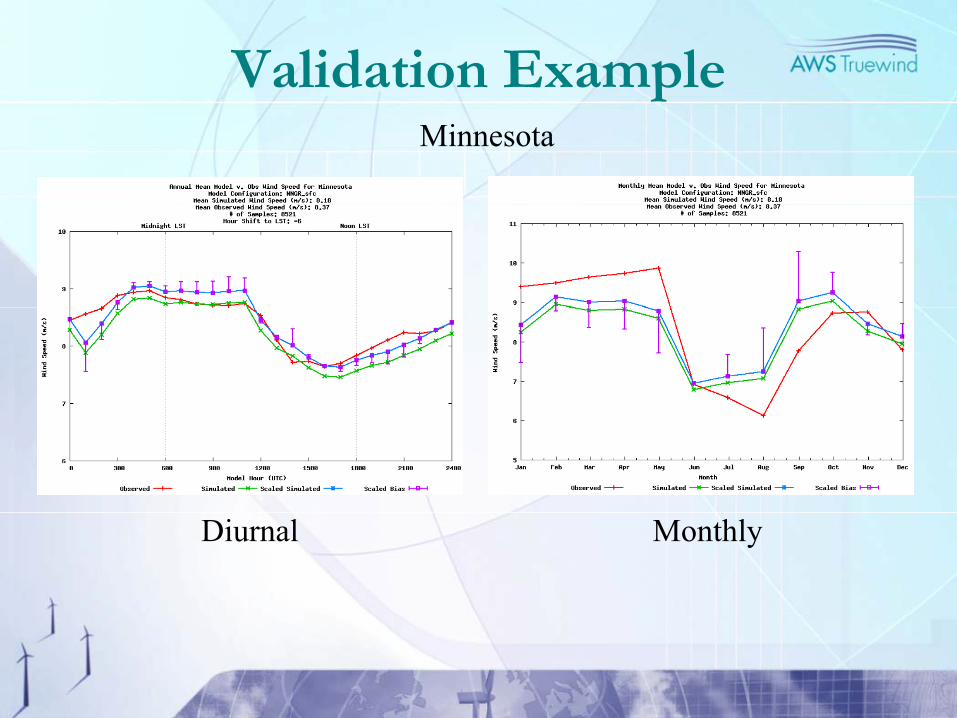
Validation ExampleMinnesota
Diurnal Monthly
CONFIDENTIAL
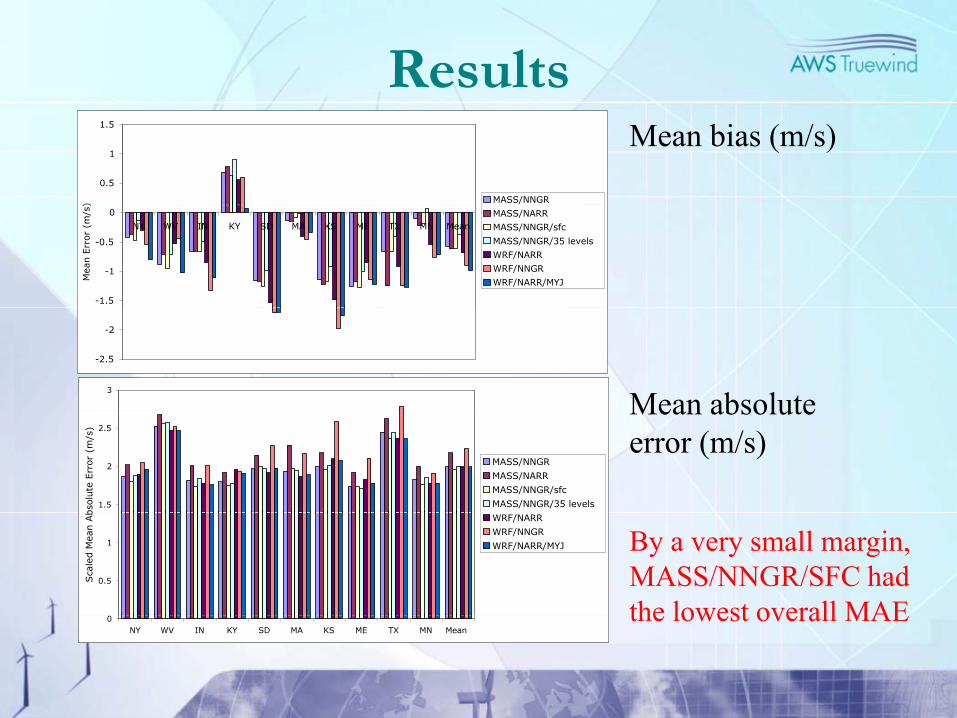
Results
0.5
1
1.5
) MASS/NNGR
Mean bias (m/s)
-1.5
-1
-0.5
0
NY WV IN KY SD MA KS ME TX MN Mean
Mea
n E
rror
(m/s
)
MASS/NARR
MASS/NNGR/sfc
MASS/NNGR/35 levels
WRF/NARR
WRF/NNGR
WRF/NARR/MYJ
-2.5
-2
3
Mean absolute
1.5
2
2.5
bso
lute
Err
or
(m/s
)
MASS/NNGR
MASS/NARR
MASS/NNGR/sfc
MASS/NNGR/35 levels
Mean absolute error (m/s)
0.5
1
Sca
led M
ean A
b
WRF/NARR
WRF/NNGR
WRF/NARR/MYJ By a very small margin, MASS/NNGR/SFC had the lowest overall MAE
CONFIDENTIAL
0NY WV IN KY SD MA KS ME TX MN Mean
the lowest overall MAE
Power Conversion Testing
Objective• Ensure that the conversion of simulated winds to plant• Ensure that the conversion of simulated winds to plant
output is realisticApproach
• Extract mesoscale data for three wind project sites monitored by NREL
• Convert the data to plant output using a combination ofConvert the data to plant output using a combination of deterministic and stochastic methods
• Compare resulting mean capacity factors, average ramp rates and diurnal/monthly patterns with actual data forrates, and diurnal/monthly patterns with actual data for 2004
• Adjust method where necessary
CONFIDENTIAL
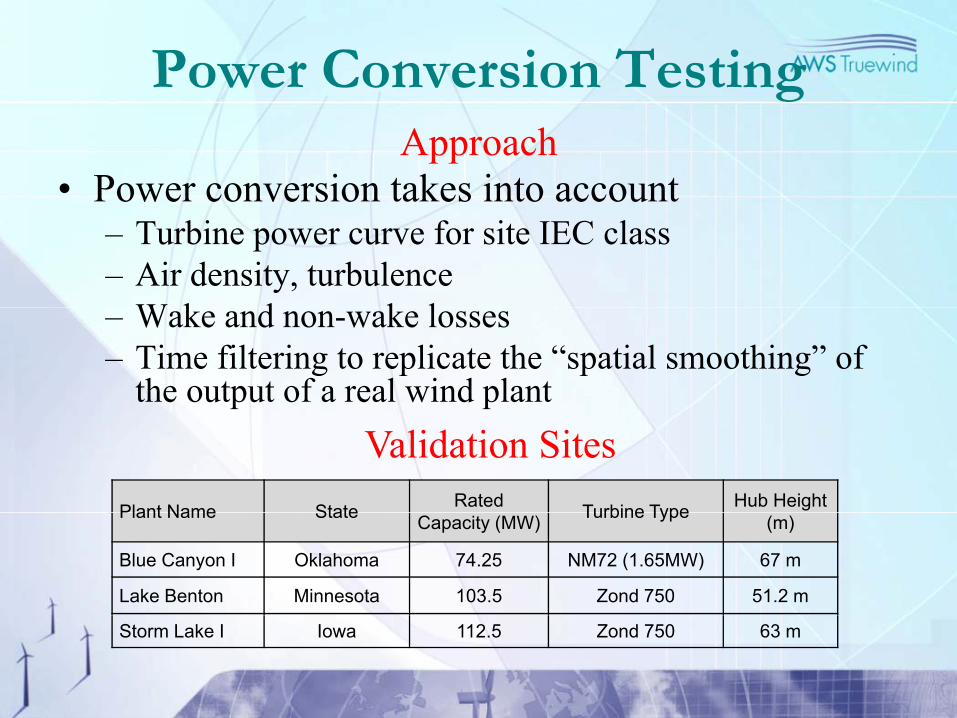
Power Conversion TestingApproach
• Power conversion takes into account– Turbine power curve for site IEC class– Air density, turbulence
W k d k l– Wake and non-wake losses– Time filtering to replicate the “spatial smoothing” of
the output of a real wind plant
Plant Name State Rated Turbine Type Hub Height
Validation SitesPlant Name State Capacity (MW) Turbine Type (m)
Blue Canyon I Oklahoma 74.25 NM72 (1.65MW) 67 m
Lake Benton Minnesota 103.5 Zond 750 51.2 m
CONFIDENTIAL
Storm Lake I Iowa 112.5 Zond 750 63 m
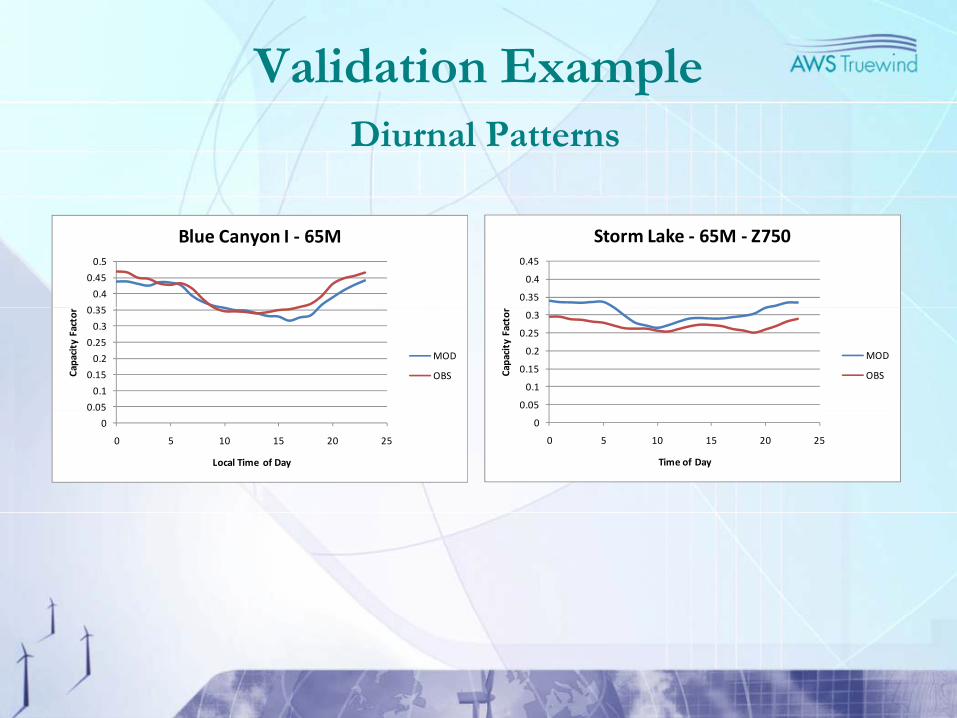
Validation ExampleDiurnal Patterns
0 35
0.4
0.45
0.5
Blue Canyon I ‐ 65M
0.35
0.4
0.45
Storm Lake ‐ 65M ‐ Z750
0.05
0.1
0.15
0.2
0.25
0.3
0.35
Capa
city
Fac
tor
MOD
OBS
0.05
0.1
0.15
0.2
0.25
0.3
Capa
city
Fac
tor
MOD
OBS
0
0.05
0 5 10 15 20 25
Local Time of Day
0
0 5 10 15 20 25
Time of Day
CONFIDENTIAL
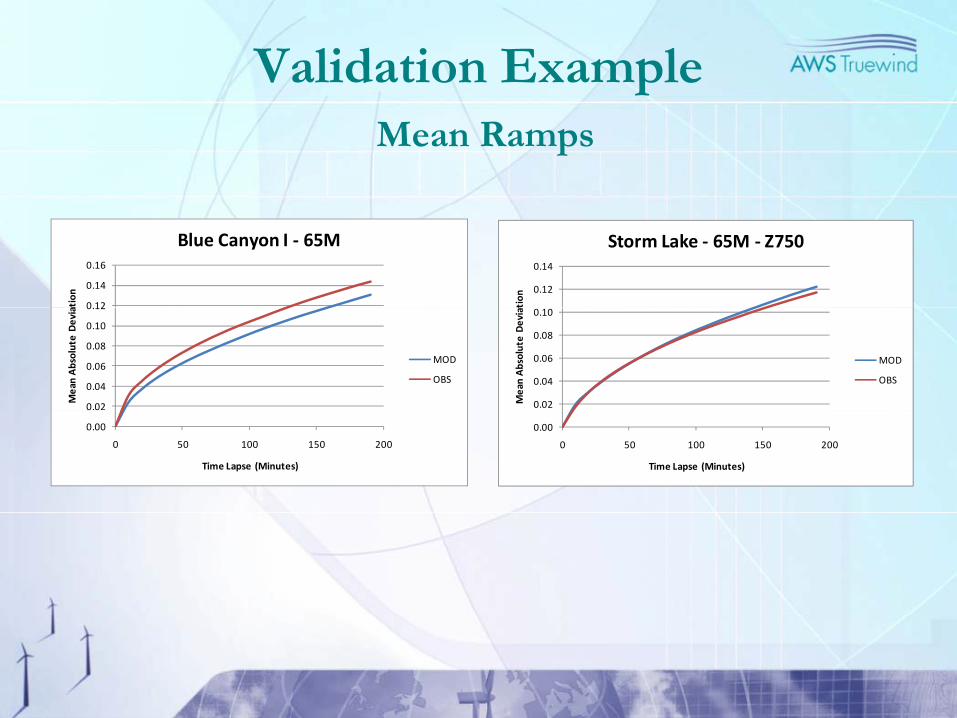
Validation ExampleMean Ramps
0.12
0.14
tion
Storm Lake ‐ 65M ‐ Z750
0 12
0.14
0.16
atio
n
Blue Canyon I ‐ 65M
0.02
0.04
0.06
0.08
0.10
Mea
n A
bsol
ute
Dev
iat
MOD
OBS
0.02
0.04
0.06
0.08
0.10
0.12
Mea
n A
bsol
ute
Dev
ia
MOD
OBS
0.00
0 50 100 150 200
Time Lapse (Minutes)
0.00
0 0
0 50 100 150 200
Time Lapse (Minutes)
CONFIDENTIAL

Site Selection
ObjectiveS l 600 GW f ff h d h i d• Select 600+ GW of offshore and onshore wind project sites with acceptable geographic diversitydiversity
ApproachP d l i d d f h• Produce seamless wind speed map of the regionC d i f i• Convert mean speeds to capacity factors using modeled wind speed distributions, composite IEC Class II power curve 80 m hub height
CONFIDENTIAL
IEC Class II power curve, 80 m hub height
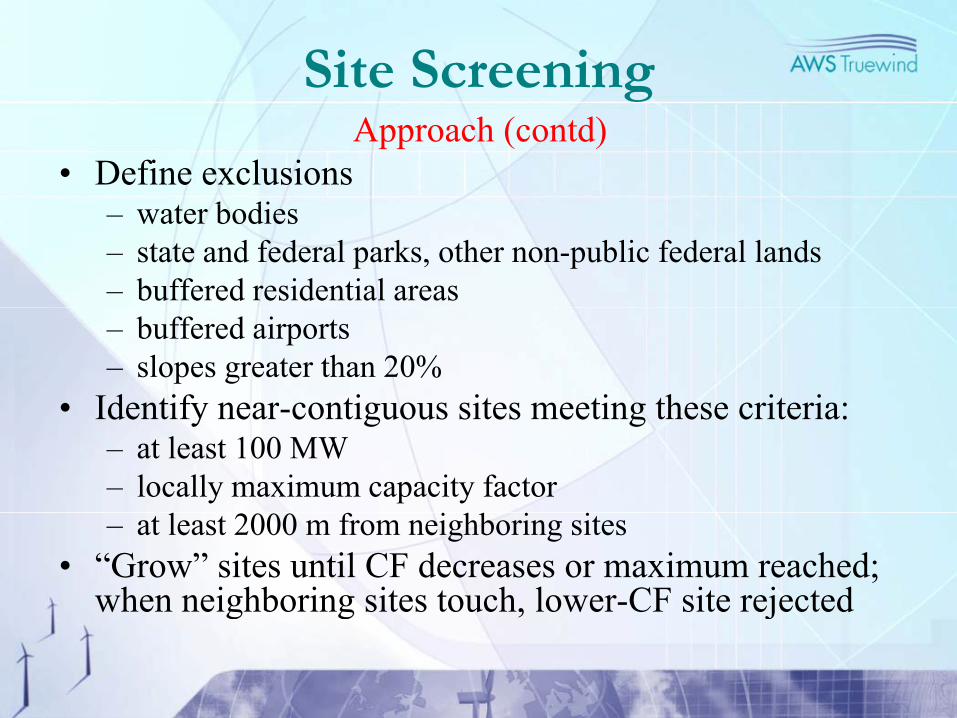
Site ScreeningApproach (contd)
• Define exclusionst b di– water bodies
– state and federal parks, other non-public federal lands– buffered residential areas– buffered airports– slopes greater than 20%
• Identify near-contiguous sites meeting these criteria:• Identify near-contiguous sites meeting these criteria:– at least 100 MW– locally maximum capacity factor– at least 2000 m from neighboring sites
• “Grow” sites until CF decreases or maximum reached; when neighboring sites touch, lower-CF site rejected
CONFIDENTIAL
g g , j
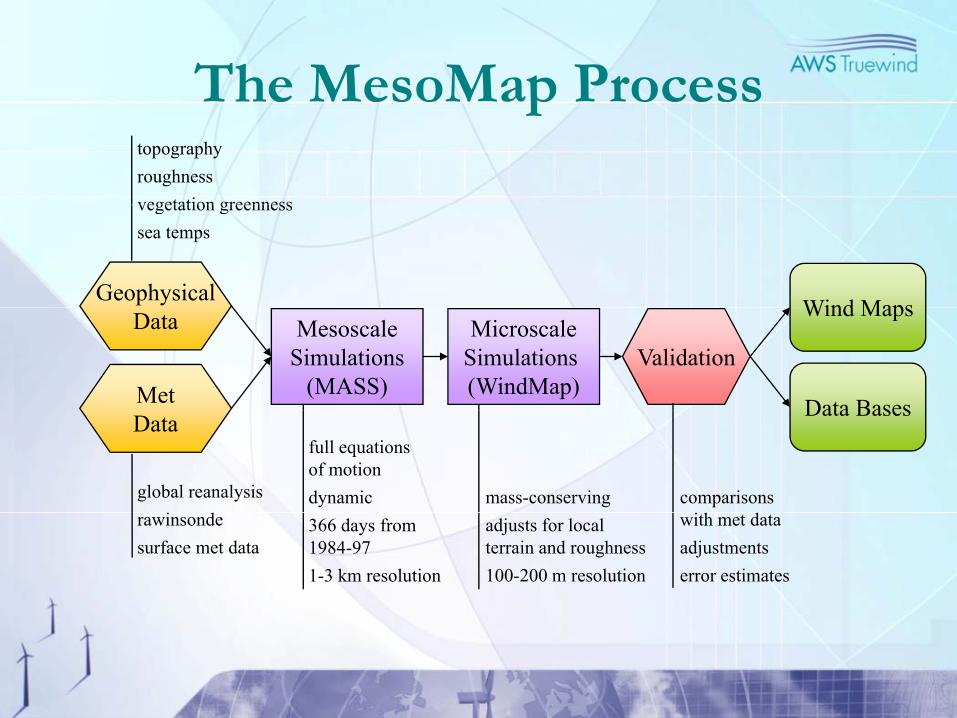
The MesoMap Processptopographyroughnessvegetation greenness
GeophysicalWind Maps
vegetation greennesssea temps
Data MesoscaleSimulations
(MASS)
MicroscaleSimulations (WindMap)
Wind Maps
Met Data Bases
Validation
DataData Bases
full equations of motiondynamic mass-conservingglobal reanalysis
i dcomparisons
i h d366 days from1984-971-3 km resolution
adjusts for localterrain and roughness100-200 m resolution
rawinsondesurface met data
with met dataadjustmentserror estimates
CONFIDENTIAL
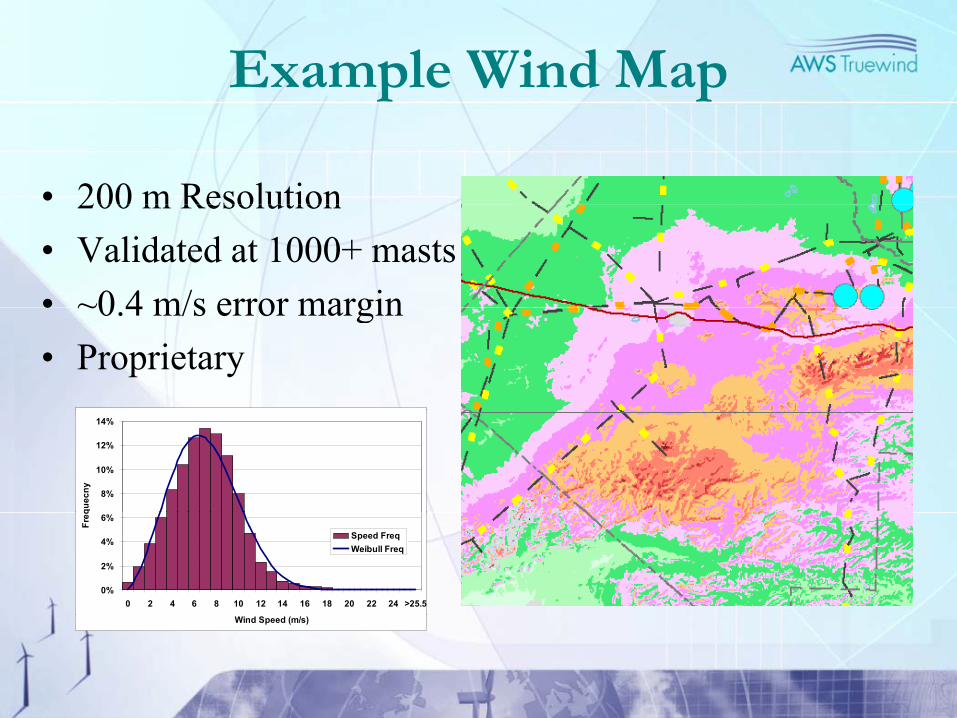
Example Wind Map
• 200 m Resolution200 m Resolution• Validated at 1000+ masts• ~0 4 m/s error margin• ~0.4 m/s error margin• Proprietary
8%
10%
12%
14%
quec
ny
0%
2%
4%
6%
0 2 4 6 8 10 12 14 16 18 20 22 24 >25.5
Freq
Speed FreqWeibull Freq
CONFIDENTIAL
Wind Speed (m/s)

Speed v. CF
0.6
Net Capacity Factor v. Mean Speed (Site Screening Only)
0 4
0.5
0.3
0.4
t Cap
acit
y Fa
ctor
0.1
0.2
Net
0
0 2 4 6 8 10 12
Mean Speed at 80 m (m/s)
CONFIDENTIAL

Site Screening
Accounts for:Wind speed distributionAir densityAir densityTurbine power curveExclusionsSite rankings
CONFIDENTIAL
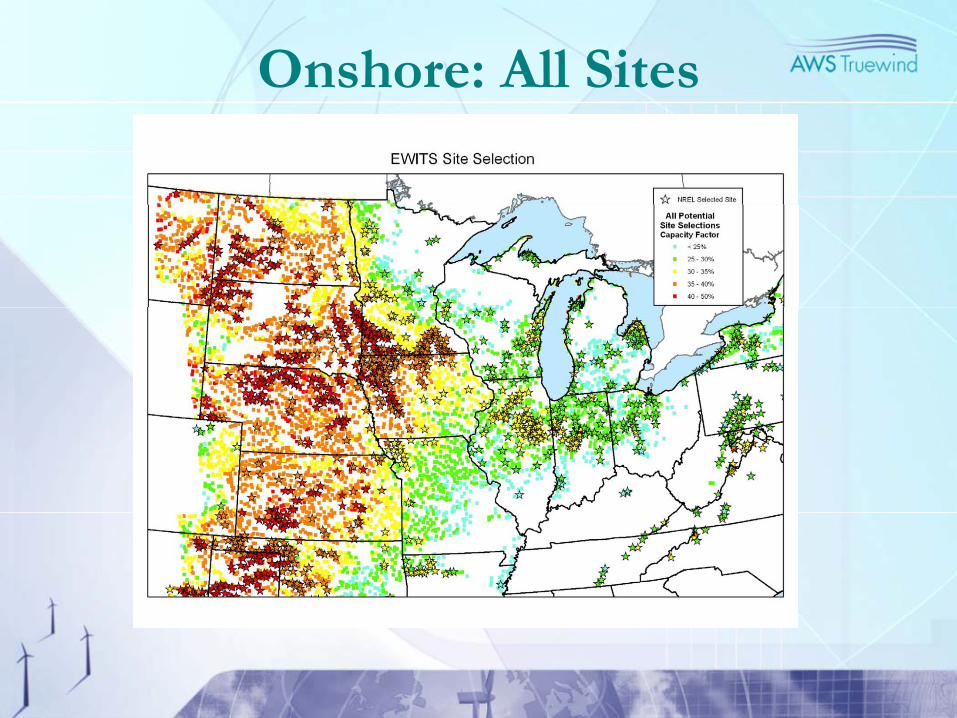
Onshore: All Sites
CONFIDENTIAL
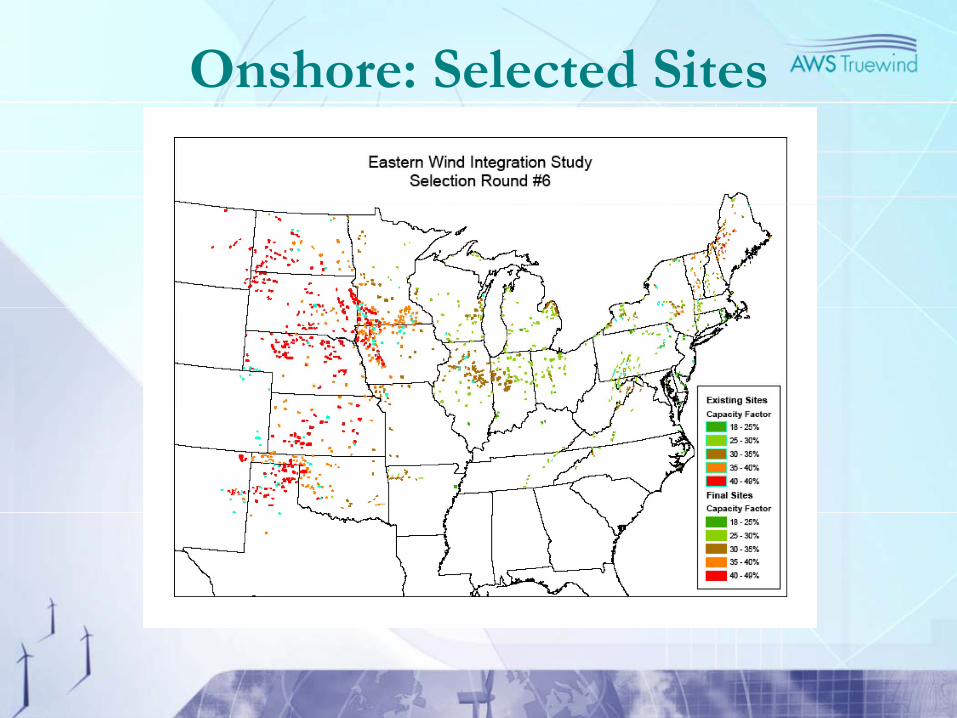
Onshore: Selected Sites
CONFIDENTIAL
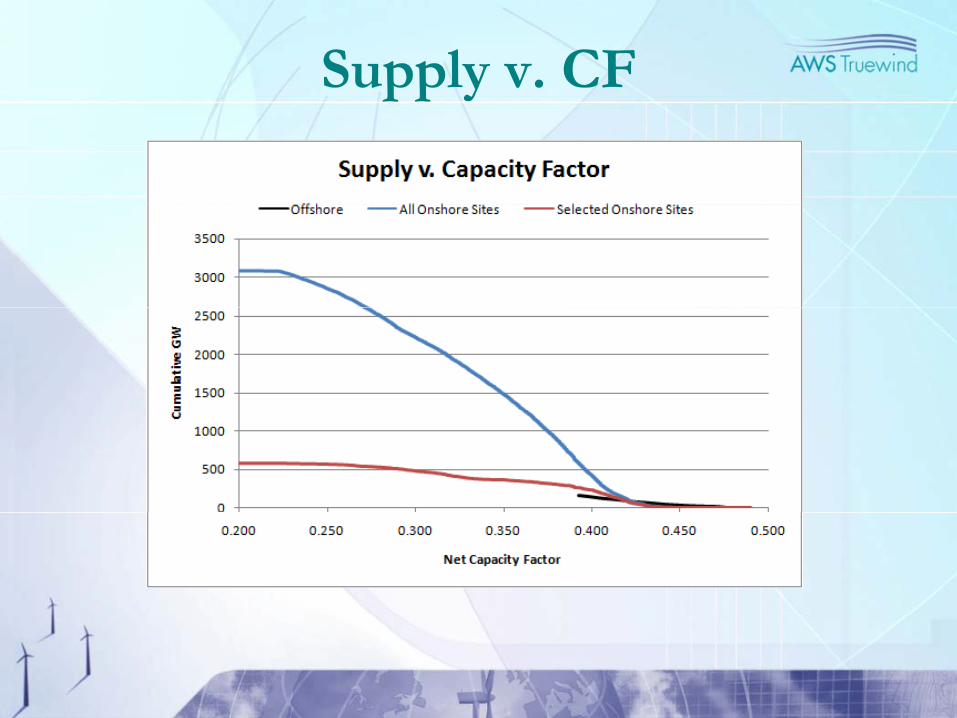
Supply v. CF
CONFIDENTIAL
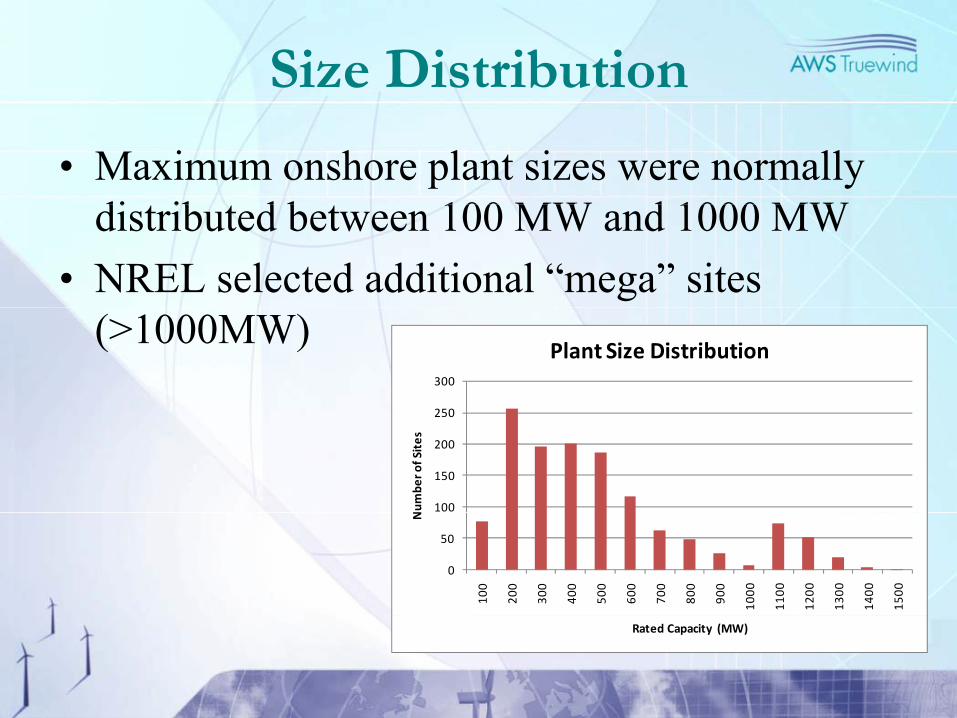
Size Distribution
• Maximum onshore plant sizes were normally di ib d b 100 MW d 1000 MWdistributed between 100 MW and 1000 MW
• NREL selected additional “mega” sites (>1000MW)
250
300
Plant Size Distribution
100
150
200
250N
umbe
r of S
ites
0
50
100
200
300
400
500
600
700
800
900
1000
1100
1200
1300
1400
1500
N
CONFIDENTIAL
Rated Capacity (MW)
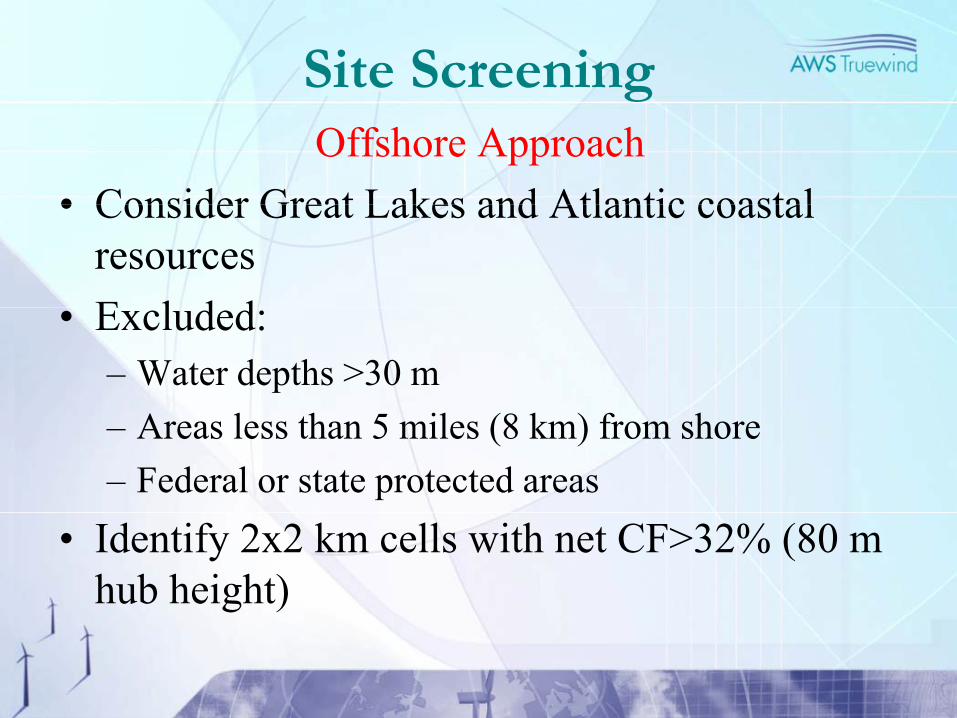
Site ScreeningOffshore Approach
• Consider Great Lakes and Atlantic coastal• Consider Great Lakes and Atlantic coastal resourcesE l d d• Excluded:– Water depths >30 m– Areas less than 5 miles (8 km) from shore– Federal or state protected areas
• Identify 2x2 km cells with net CF>32% (80 m hub height)
CONFIDENTIAL
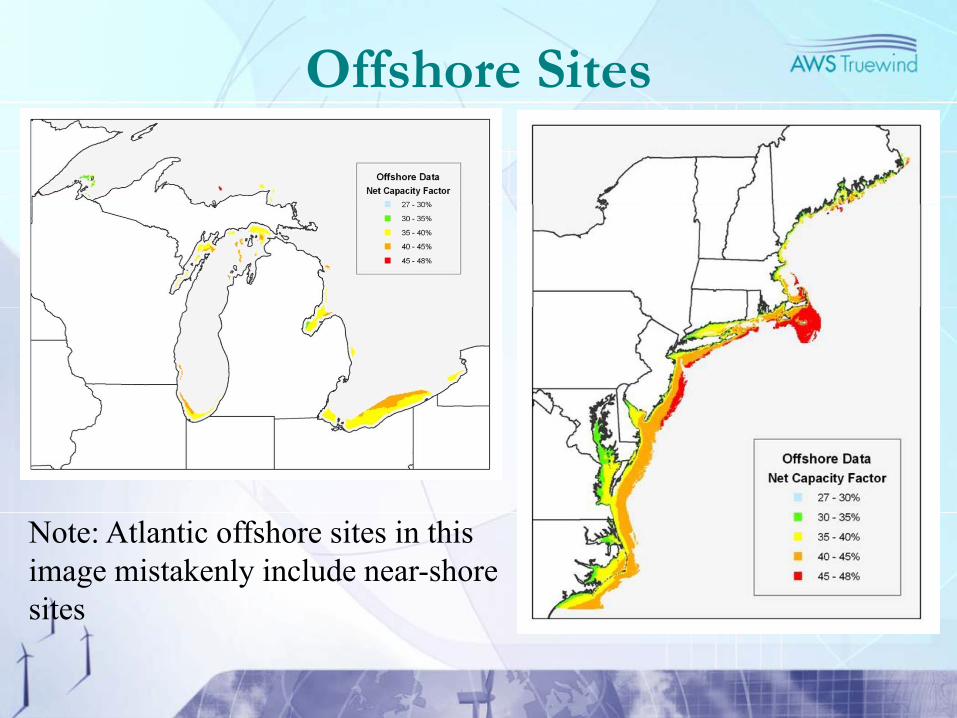
Offshore Sites
Note: Atlantic offshore sites in this image mistakenly include near-shore sites
CONFIDENTIAL
sites

TotalsState Onshore Offshore Total State Onshore Offshore TotalArkansas 4.0 4.0 New Hampshire 2.4 44.9 47.3Colorado 3.8 3.8 New Jersey 1.3 1.3 2.6C i 0 9 1 7 2 6 N M i 10 5 10 5Connecticut 0.9 1.7 2.6 New Mexico 10.5 10.5Delaware 1.0 4.4 5.4 New York 14.9 30.1 45.0Illinois 42.0 1.3 43.3 North Carolina 2.0 2.0 4.0Indiana 32.6 9.9 42.5 North Dakota 32.1 32.1Iowa 52.6 52.6 Ohio 17.4 2.2 19.7Kansas 46.1 46.1 Oklahoma 40.3 40.3Kentucky 1.5 1.5 Pennsylvania 7.0 15.8 22.7Maine 5.9 20.1 26.0 Rhode Island 1.0 29.6 30.6Maryland 1.1 0.0 1.1 South Dakota 48.5 48.5Massachusetts 2.2 26.9 29.0 Tennessee 0.9 0.9Michigan 23.9 10.0 34.0 Texas 31.9 31.9Minnesota 61.5 61.5 Vermont 2.0 2.0Missouri 10.1 10.1 Virginia 2.1 5.1 7.2Montana 5.8 5.8 West Virginia 2.4 2.4Nebraska 48.5 48.5 Wisconsin 20.5 3.2 23.7
Total 580.8 208.6 789.4
CONFIDENTIALOffshore totals may change

Main SimulationsProgress to Date
• 2004 and 2005 mesoscale simulations• 2004 and 2005 mesoscale simulations completed
• 2006 simulations under way to be completed• 2006 simulations under way, to be completed early September
• Conversion of 2004 data to plant output for• Conversion of 2004 data to plant output for onshore sites completed and delivered
• Conversion of 2004 data for offshore and extra• Conversion of 2004 data for offshore and extra MISO sites in progress (this week)
CONFIDENTIAL
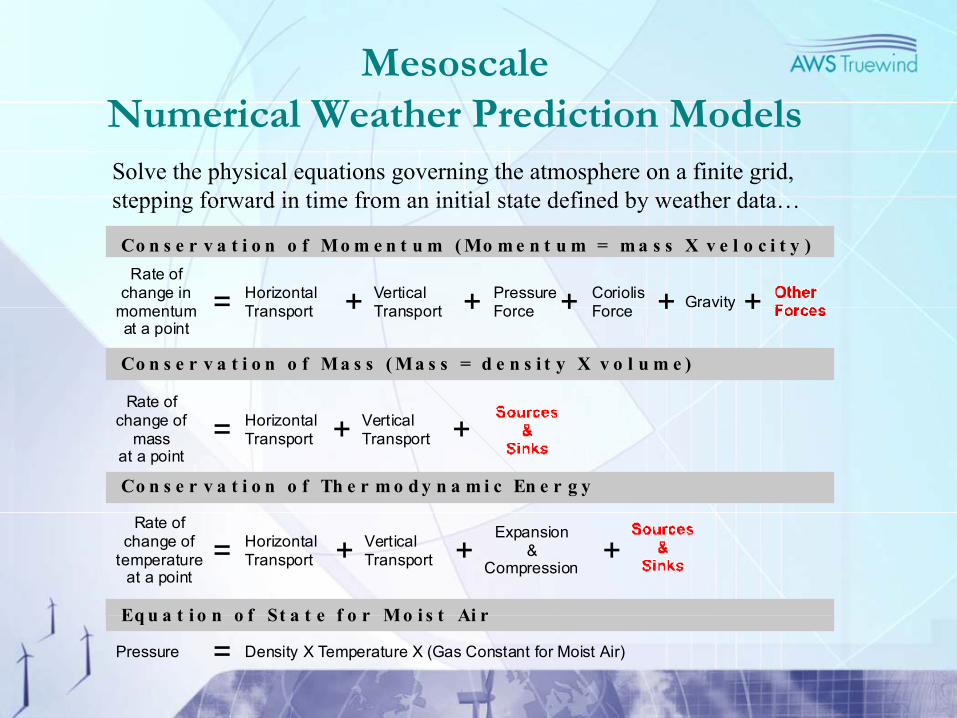
Mesoscale N i l W h P di i M d lNumerical Weather Prediction ModelsSolve the physical equations governing the atmosphere on a finite grid, stepping forward in time from an initial state defined by weather data
Rate ofchange in
t = HorizontalT t
VerticalT t
PressureF
CoriolisF+ + + + Gravity +
Co n s e r v a t i o n o f Mo m e n t u m (Mo me n t u m = ma s s X v e l o c i t y )
stepping forward in time from an initial state defined by weather data…
momentumat a point
Transport Transport Force Force+ + + + y +
Rate of
Co n s e r v a t i o n o f Ma s s (Ma s s = d e n s i t y X v o l u m e )
change ofmass
at a point= Horizontal
Transport + VerticalTransport +
Co n s e r v a t i o n o f Th e r mo dy n a m i c En e r g y
Rate ofchange of
temperatureat a point
= HorizontalTransport + Vertical
Transport +Expansion
&Compression
+
Equ a t i o n o f St a t e f o r Mo i s t Ai r
CONFIDENTIALPressure = Density X Temperature X (Gas Constant for Moist Air)
Equ a t i o n o f St a t e f o r Mo i s t Ai r
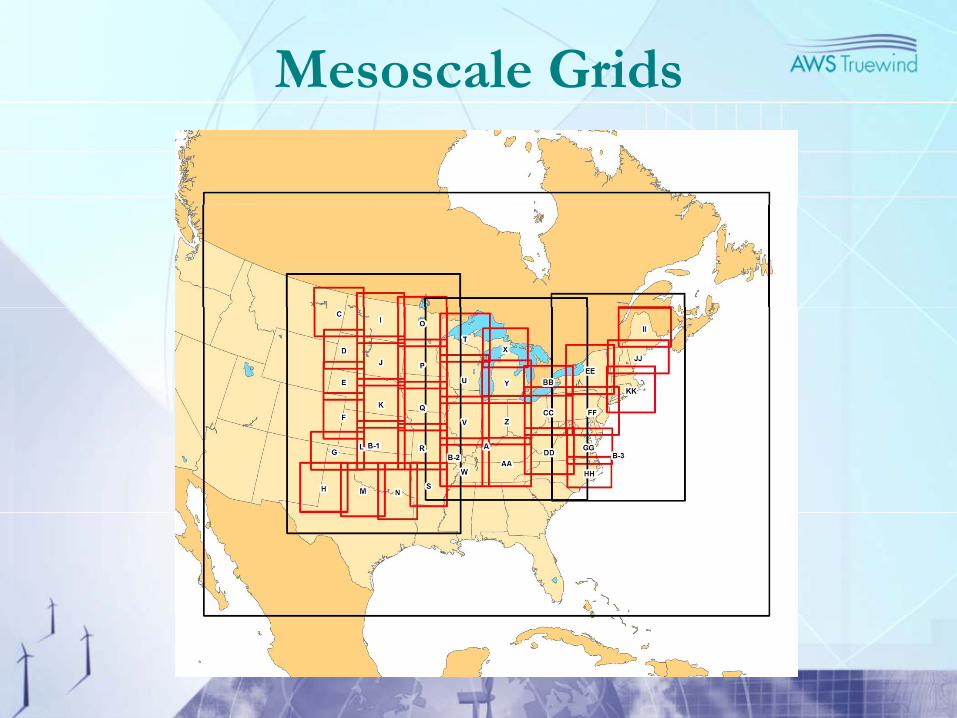
Mesoscale Grids
CONFIDENTIAL
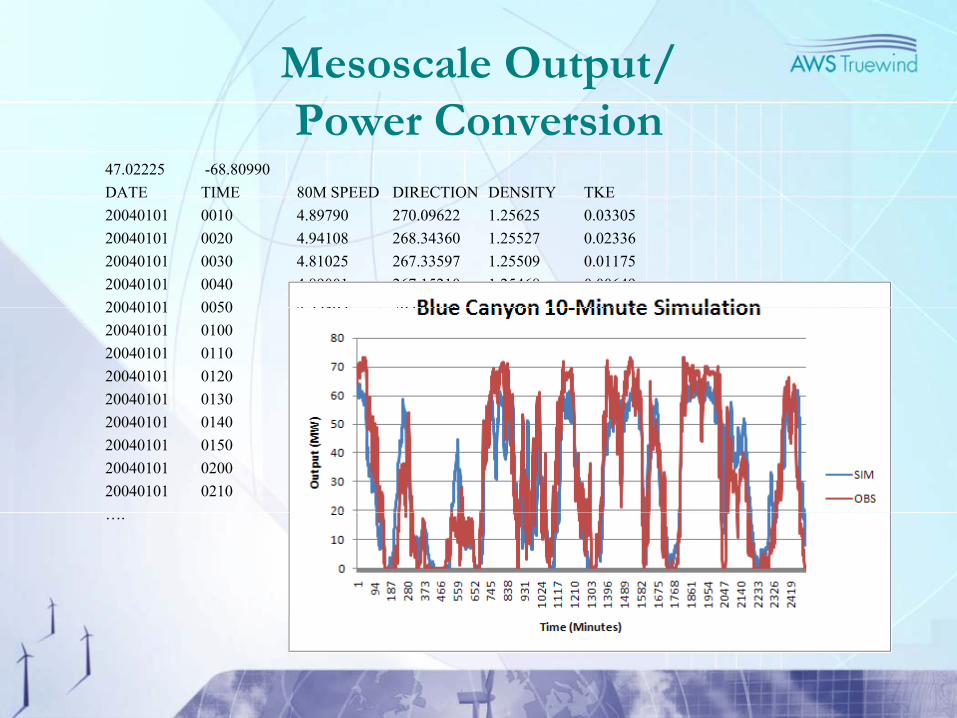
Mesoscale Output/Power Conversion
47.02225 -68.80990DATE TIME 80M SPEED DIRECTION DENSITY TKE20040101 0010 4.89790 270.09622 1.25625 0.0330520040101 0020 4.94108 268.34360 1.25527 0.0233620040101 0030 4.81025 267.33597 1.25509 0.0117520040101 0040 4.89001 267.15210 1.25468 0.0064920040101 0050 4 55865 265 43286 1 25415 0 0047320040101 0050 4.55865 265.43286 1.25415 0.0047320040101 0100 4.70651 265.82401 1.25480 0.0025220040101 0110 4.84289 269.14575 1.25461 0.0021420040101 0120 4.85045 266.78668 1.25462 0.0024720040101 0130 4.76209 266.21219 1.25440 0.0026820040101 0140 4.74387 263.26474 1.25424 0.0022020040101 0150 4.89790 260.24161 1.25384 0.0024620040101 0200 4.93185 256.34119 1.25321 0.0035120040101 0210 4.87496 252.86868 1.25324 0.00413….
CONFIDENTIAL
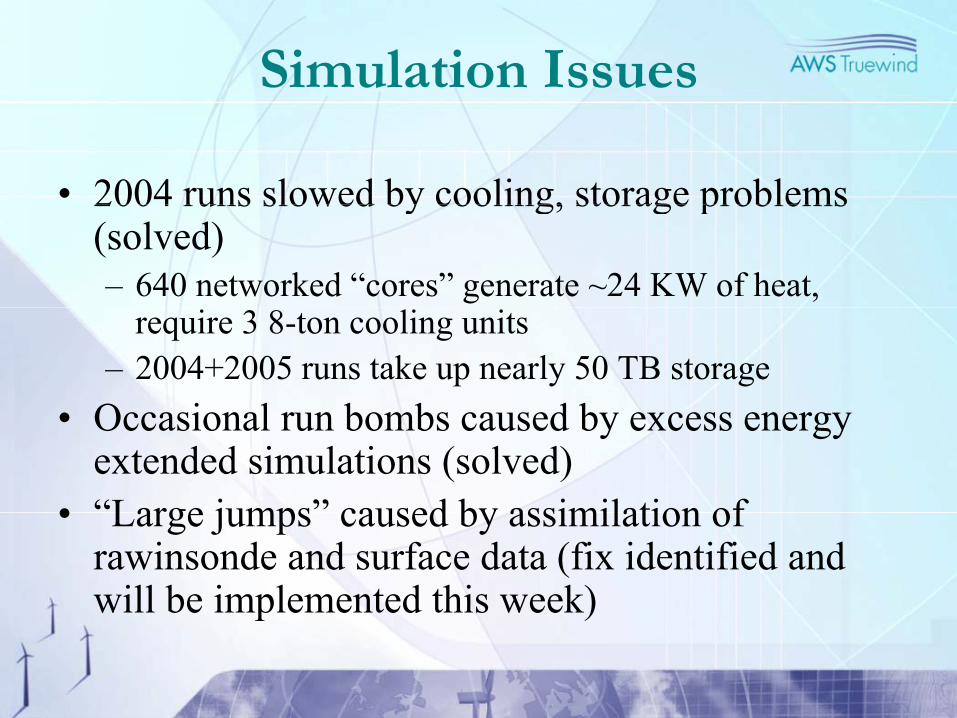
Simulation Issues
• 2004 runs slowed by cooling, storage problems2004 runs slowed by cooling, storage problems (solved)– 640 networked “cores” generate ~24 KW of heat,
require 3 8-ton cooling units– 2004+2005 runs take up nearly 50 TB storage
O i l b b d b• Occasional run bombs caused by excess energy extended simulations (solved)
• “Large jumps” caused by assimilation of• Large jumps caused by assimilation of rawinsonde and surface data (fix identified and will be implemented this week)
CONFIDENTIAL
p )

Data Assimilation Impact
Observations assimilated by the model every 12 hours can abruptlyhours can abruptly change wind speeds. After-h k l t tshocks last up to
one hour.
CONFIDENTIAL

Pragmatic Solution
Replace affected data with randomly modulated linearmodulated linear trend. Ten 10-minute records per d l dday are replaced.
CONFIDENTIAL
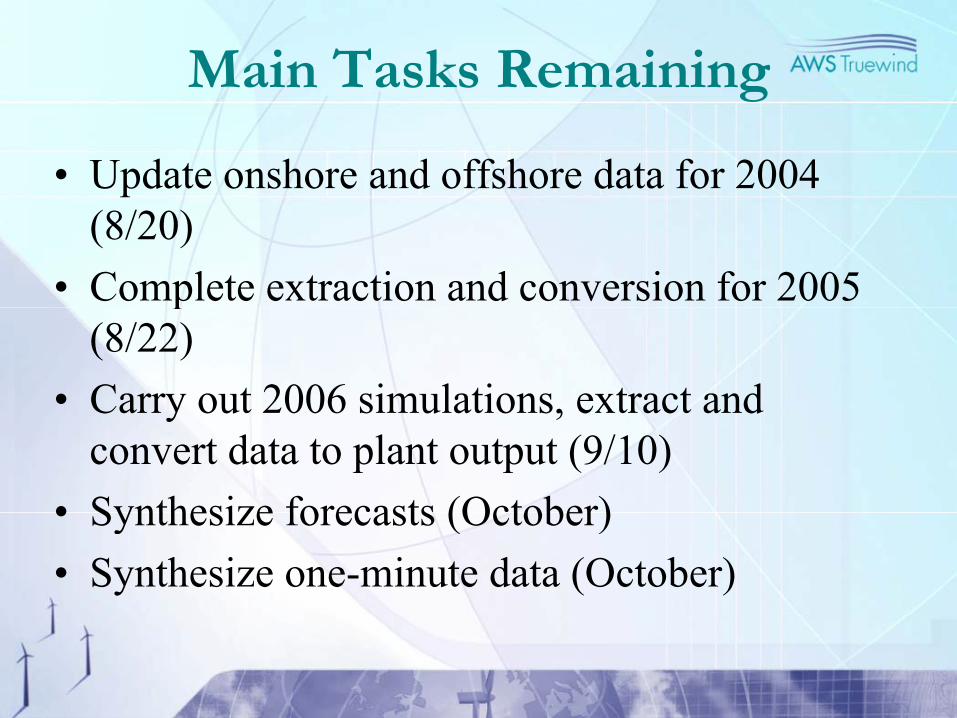
Main Tasks Remaining
• Update onshore and offshore data for 2004 (8/20)
• Complete extraction and conversion for 2005 p(8/22)
• Carry out 2006 simulations, extract andCarry out 2006 simulations, extract and convert data to plant output (9/10)
• Synthesize forecasts (October)• Synthesize forecasts (October)• Synthesize one-minute data (October)
CONFIDENTIAL