awareness and evaluation of k-state research and extension summer 2007 telephone survey results...
TRANSCRIPT

Awareness and Evaluation ofK-State Research and Extension
Summer 2007 Telephone Survey Results
Department of Communications
Presented by Pat Melgares

Why are we doing this?
• Five Year Marketing Plan (2006-2010)
• Target marketing

Methods
• Randomized digit dialing
• Survey Research Center (KU)
• All Kansas adults (age 18-older)
• Evening phone calls (June/July)
• Goal: 500 response

Results
• 512 responses (26.4 percent)
• 95% confidence level
• +/- 4% margin of error

Results
Respondents expressed a stronger awareness of “Extension” compared to KAES, CES or KSRE
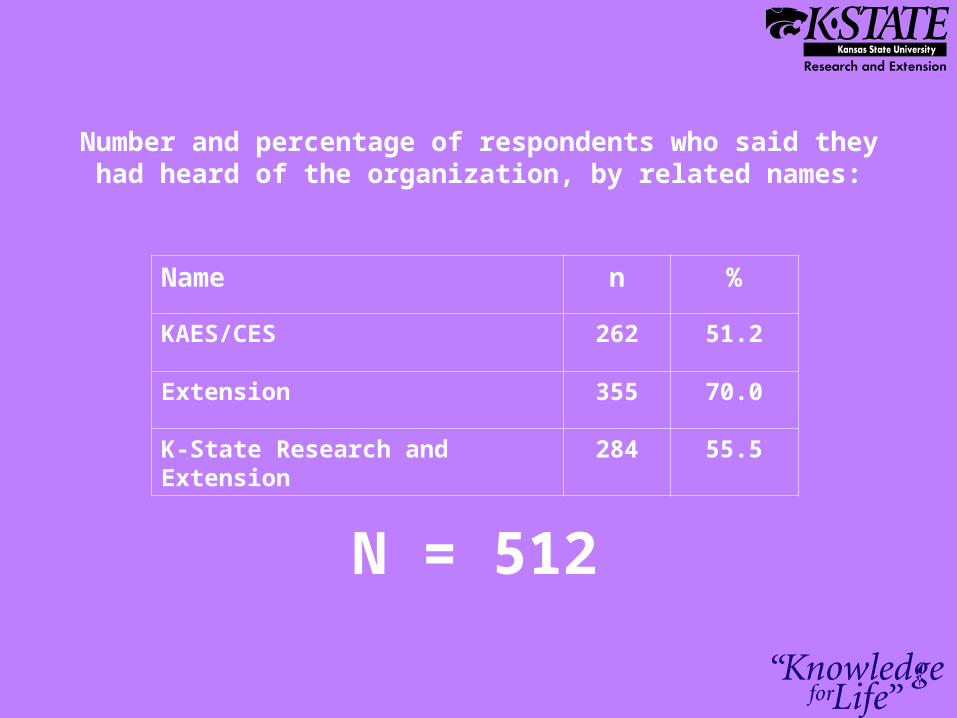
Name n %
KAES/CES 262 51.2
Extension 355 70.0
K-State Research and Extension 284 55.5
Number and percentage of respondents who said they had heard of the organization, by related names:
N = 512

Results
71% associated this system with Kansas State University

Name n %
Kansas State University 364 71.1
University of Kansas 128 25.0
Other 20 3.9
This system is associated with a university in the state of Kansas. Which university do you think that is?
N = 512

Results
Information is perceived to be credible

n %
Very credible 379 74.0
Somewhat credible 77 15.0
Not credible 16 3.1
No response 40 7.8
Would you consider information from K-State Research and Extension to be very credible, somewhat credible, or not credible?
N = 512

Results
Service is perceived to be important in the state of Kansas

n %
Very important 381 74.4
Somewhat important 117 22.9
Not important 13 2.5
No response 1 .2
In your opinion, is it very important, somewhat important, or not
important to maintain this type of service in the state of Kansas?
N = 512

n %
Strongly approve 60 11.7
Approve 376 69.5
Neither approve or disapprove 79 15.4
Disapprove 13 2.5
Strong disapprove 1 .2
No response 3 .6
Do you approve, strongly approve, neither approve nor disapprove, disapprove, or
strongly disapprove of spending public funds to support this program?
N = 512

Results
All areas of service are considered high interest among respondents

Topic n %
Community development 400 78.1
Environmental preservation issues 476 92.6
Farming, ranching, agribusiness or small acreage management
361 68.5
Health and nutrition issues 474 92.6
Home and family issues 424 82.8
Lawn, gardening, or landscaping information 416 81.2
Youth development issues 434 84.8
Number and percentage of respondents who said they are very or somewhat interested in selected topic areas:
N = 512

Results
Internet/computer usage is high; awareness of KSRE Web site is low

n %
Daily 283 55.3
Weekly 68 13.3
1-3 times/month 35 6.8
Never 121 23.6
How often do you use the Internet for any purpose?
N = 512

n %
Know the Web address 27 5.3
Have been to the site 67 13.1
Awareness of K-State Research and Extension Web site, or local county Web site
N = 512
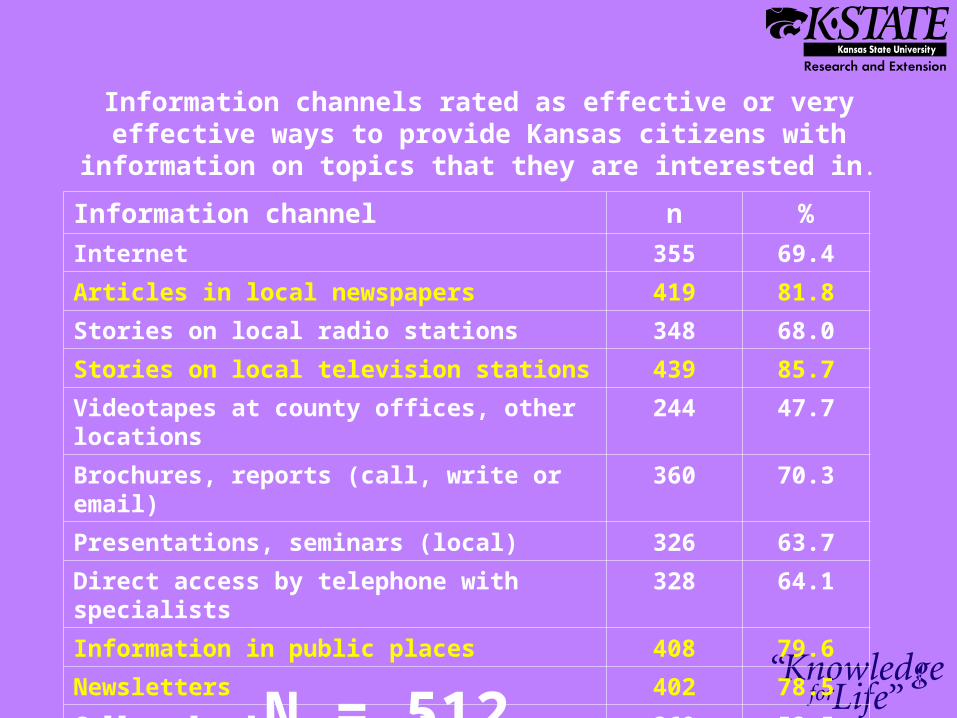
Information channel n %
Internet 355 69.4
Articles in local newspapers 419 81.8
Stories on local radio stations 348 68.0
Stories on local television stations 439 85.7
Videotapes at county offices, other locations 244 47.7
Brochures, reports (call, write or email) 360 70.3
Presentations, seminars (local) 326 63.7
Direct access by telephone with specialists 328 64.1
Information in public places 408 79.6
Newsletters 402 78.5
College-level courses, classes 269 52.5
Information channels rated as effective or very effective ways to provide Kansas citizens with information on topics that they are
interested in.
N = 512

Results
Information Channels
Young adults (ages 24-44)Internet, TV, public places, brochures/reports, newsletters
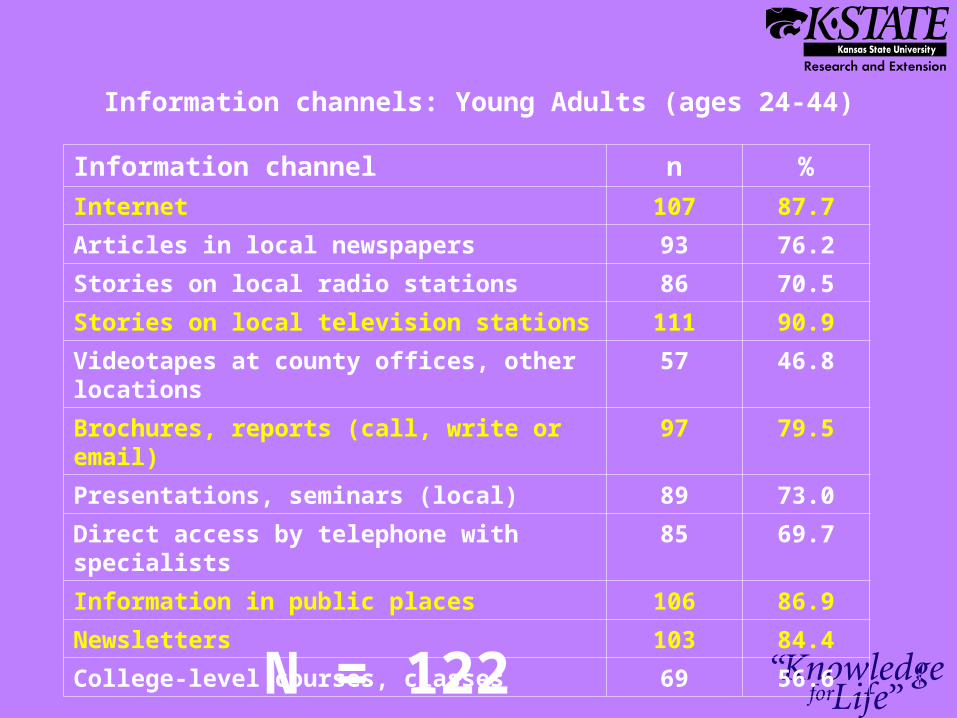
Information channel n %
Internet 107 87.7
Articles in local newspapers 93 76.2
Stories on local radio stations 86 70.5
Stories on local television stations 111 90.9
Videotapes at county offices, other locations 57 46.8
Brochures, reports (call, write or email) 97 79.5
Presentations, seminars (local) 89 73.0
Direct access by telephone with specialists 85 69.7
Information in public places 106 86.9
Newsletters 103 84.4
College-level courses, classes 69 56.6
Information channels: Young Adults (ages 24-44)
N = 122

Results
Information Channels
Current UsersNewspapers, TV, brochures/reports, presentations/seminars, telephone, public places, newsletters

Information channel n %
Internet 99 65.1
Articles in local newspapers 132 86.9
Stories on local radio stations 100 65.8
Stories on local television stations 127 83.5
Videotapes at county offices, other locations 85 55.9
Brochures, reports (call, write or email) 134 87.9
Presentations, seminars (local) 119 78.3
Direct access by telephone with specialists 117 77.0
Information in public places 131 86.2
Newsletters 132 86.9
College-level courses, classes 82 53.9
Information channels: Current Users
N = 152

Results
Information Channels
Non-UsersNewspapers, TV, public places, newsletters

Information channel n %
Internet 256 71.1
Articles in local newspapers 287 79.7
Stories on local radio stations 248 68.9
Stories on local television stations 312 86.7
Videotapes at county offices, other locations 159 44.2
Brochures, reports (call, write or email) 226 62.8
Presentations, seminars (local) 207 57.5
Direct access by telephone with specialists 211 58.6
Information in public places 277 77.0
Newsletters 270 75.0
College-level courses, classes 187 52.0
Information channels: Non-Users
N = 360

Results
Information Channels
Metro ResidentsInternet, radio, telephone, public places

Information channel n %
Internet 143 84.2
Articles in local newspapers 115 67.6
Stories on local radio stations 142 83.5
Stories on local television stations 86 50.6
Videotapes at county offices, other locations 109 64.1
Brochures, reports (call, write or email) 106 62.4
Presentations, seminars (local) 103 60.6
Direct access by telephone with specialists 142 83.6
Information in public places 135 79.4
Newsletters 82 48.3
College-level courses, classes 103 60.6
Information channels: Metro Residents
N = 122

Results
Information Channels
Suburban ResidentsInternet, newspapers, radio, TV, public places

Information channel n %
Internet 132 77.2
Articles in local newspapers 147 86.0
Stories on local radio stations 120 70.1
Stories on local television stations 152 88.9
Videotapes at county offices, other locations 56 32.7
Brochures, reports (call, write or email) 127 74.3
Presentations, seminars (local) 112 65.5
Direct access by telephone with specialists 112 65.5
Information in public places 131 76.6
Newsletters 124 72.6
College-level courses, classes 94 55.0
Information channels: Suburban Residents
N = 171

Results
Information Channels
Rural ResidentsNewspapers, TV, brochures/reports, public places, newsletters

Information channel n %
Internet 111 68.5
Articles in local newspapers 121 74.7
Stories on local radio stations 106 65.5
Stories on local television stations 137 84.6
Videotapes at county offices, other locations 95 58.7
Brochures, reports (call, write or email) 121 74.7
Presentations, seminars (local) 100 61.7
Direct access by telephone with specialists 105 64.8
Information in public places 127 78.4
Newsletters 135 83.3
College-level courses, classes 85 52.5
Information channels: Rural Residents
N = 162

Results
Information Channels
Least effectiveVideotapes, courses/classes*(moderately effective for Current Users)

Results
Web technologies
Minimal familiarity, mostly blogs, discussion boards, and chat rooms
Higher overall among men than women.

Technology Mean SD
Podcasts 1.60 1.11
YouTube 1.99 1.39
News feeds, or RSS Feeds 1.63 1.11
Blog 2.22 1.36
Discussion board 2.28 1.43
Chatroom 2.34 1.47
Mean scores for respondents’ familiarity with common or emerging Web technologies.
SCALE: 1 – Completely unfamiliar; 3 – Somewhat familiar;5 – Very familiar with the technology and have used it.

Additional research
• Focus groups (metro areas)
• Web address survey

County Web AddressesInternal: K-State Research and Extension Faculty/Staff
N Mean Mode SD
www.oznet.ksu.edu/countyname 176 2.99 3 1.244
www.ksu.edu/countyname 176 3.80 4(a) 1.202
countyname.ksu.edu 175 3.38 5 1.346
extension.k-state.edu/county 175 2.03 1 1.103
(county)extension.ksu.edu 174 2.50 1 1.276
countynameextension.ksu.edu 172 2.34 1 1.326
www.ksre.org/countyname 176 2.09 1 1.166
countyname.ksre.org 176 2.01 1 1.136
SCALE: 1 – Strongly dislike it; 2 – Dislike it;3 – Neither Like or Dislike it; 4 – Like it; 5 – Strongly like it.

County Web AddressesExternal: Metro and Non-Metro Kansas Residents
N Mean Mode SD
www.oznet.ksu.edu/countyname 324 2.41 1 1.186
www.ksu.edu/countyname 320 3.65 4 1.159
countyname.ksu.edu 321 3.56 4 1.208
extension.k-state.edu/county 321 2.44 2 1.147
(county)extension.ksu.edu 321 2.78 2 1.252
countynameextension.ksu.edu 320 2.80 2 1.342
www.ksre.org/countyname 319 2.09 1 1.086
countyname.ksre.org 319 2.23 1 1.193
SCALE: 1 – Strongly dislike it; 2 – Dislike it;3 – Neither Like or Dislike it; 4 – Like it; 5 – Strongly like it.

KSRE Web AddressesInternal: K-State Research and Extension Faculty/Staff
N Mean Mode SD
www.oznet.ksu.edu 174 3.54 4 1.156
www.knowledgeforlife.com 174 2.19 1 1.150
www.ksre.org 173 2.69 1 1.331
www.weknowkansas.com 173 1.69 1 1.021
extension.ksu.edu 174 3.41 3 1.198
research.ksu.edu 172 2.26 1 1.056
extension.k-state.edu 174 2.82 3 1.234
research.k-state.edu 173 2.01 1 .064
SCALE: 1 – Strongly dislike it; 2 – Dislike it;3 – Neither Like or Dislike it; 4 – Like it; 5 – Strongly like it.

KSRE Web AddressesExternal: Metro and Non-Metro Kansas Residents
N Mean Mode SD
www.oznet.ksu.edu 316 2.67 1 1.370
www.knowledgeforlife.com 313 2.30 2 1.129
www.ksre.org 314 2.51 2 1.226
www.weknowkansas.com 312 2.01 1 1.094
extension.ksu.edu 318 3.79 4 1.108
research.ksu.edu 315 3.03 3 1.142
extension.k-state.edu 312 3.37 4 1.198
research.k-state.edu 312 2.82 3 1.153
SCALE: 1 – Strongly dislike it; 2 – Dislike it;3 – Neither Like or Dislike it; 4 – Like it; 5 – Strongly like it.

What’s Next?
Market Research

Questions