awarded for research promotion and website content by ... maha weekly market round up... · award...
TRANSCRIPT
Award Winner 2010 Excellence in Brokerage Business
Awarded for Research Promotion and Website Content
By
Muscat Securities Market
Muscat Securities Market
and
Value Creators

Al Maha Research
www.almahafinancial.com Page 2 of 14
Muscat Securities Market and Value Creators 31 January 2012
Al Maha Financial Services LLC
Contents Page No.
Introduction ................................................................................................................................................................3
Emerging Markets outperform the World Index....................................................................................................4
MSM – Best Performing Market amongst the major Gulf markets........................................................................5
Identifying the „Value Creators‟...............................................................................................................................6
Stock Screening Criteria and Process....................................................................................................................................6
The Value Creators...........................................................................................................................................................8
Sector Classification of Value Creators...................................................................................................................................8
Comparative Performance Analysis........................................................................................................................................10
MSM continues to offer attractive investment opportunities
for long-term Value Creation...................................................................................................................12

Al Maha Research
www.almahafinancial.com Page 3 of 14
Muscat Securities Market and Value Creators 31 January 2012
Al Maha Financial Services LLC
Introduction
Conventional investing wisdom tells us that with a long time horizon, equity investors earn a
significantly higher return than other asset classes like fixed-income, commodities or cash. In
any portfolio, equity is considered as the growth-asset for its long-term performance. Equity
markets are also the most developed, transparent, well regulated and easily accessible markets
for investors around the globe. Equities not only have historically provided superior returns, they
also constantly provide opportunities for high return investments over a long term compared to
other types of investments.
“Look at market fluctuations as your friend rather than your enemy; profit from folly rather
than participate in it.” – Warren Buffet
While equity investments offer significant return potential and diversification benefits, they are
also more volatile than some other assets like bonds or cash. Higher volatility is a hallmark of
this asset class. It is this high volatility of the markets that can be viewed as a friend rather than a
foe by the long-term value investors. Speculation coupled with fear and greed is the enemy of an
ordinary investor. Whereas, adequate research and knowledge spent into selecting the right
stocks coupled with patience to hold it over a long term despite the ups and downs of the market,
is a proven strategy for superior returns.
Our endeavor through this research exercise is
To gauge the returns of the Muscat Securities Market (MSM) over a long term and
compare it to the returns of major regional markets to ascertain the best performing
market in the region
To identify the value creators in the MSM over the last seven years, that have
significantly outperformed the MSM 30 Index
To conduct a comparative performance analysis of the value creators with other high-
return investments like those in crude oil and gold.
For this exercise, we track the market, stocks’ performance and returns for the investors over the
last seven years starting from the 1st of January 2005 to 31 December 2011. The period after
2005 has been vibrant for MSM, as the market depth and breadth as well as trade intensity
witnessed impressive growth during this period compared to the previous years. Average daily
turnover for the seven years from 2005 to 2011 more than doubled compared to that of 2004 and
average number of regular market securities traded during the period also grew by more than a
third of those traded during 2004.

Al Maha Research
www.almahafinancial.com Page 4 of 14
Muscat Securities Market and Value Creators 31 January 2012
Al Maha Financial Services LLC
Emerging Markets outperform the World Index
During the last seven year period, the emerging markets have significantly outperformed the
developed markets and the world indices backed by their robust economic growth and
fundamental strength. The Europe, Middle East and Africa Region (EMEA Region) too has been
noticeably outperforming the World Index during this period. The MSCI Emerging Markets
Index returned 68.99% for the period, while the EMEA Index returned a 26.78%.
Source: Morgan Stanley Capital International (MSCI)
0
50
100
150
200
250
300
Jan 01, 2005 Jan 01, 2006 Jan 01, 2007 Jan 01, 2008 Jan 01, 2009 Jan 01, 2010 Jan 01, 2011
Relative Performance of MSCI Equity Indices
Europe, Middle East & Africa Emerging Markets World Index
-
5,000
10,000
15,000
20,000
25,000
30,000
2004 2005 2006 2007 2008 2009 2010 2011
MSM Trading Statistics (2004-2011)
Avg. Daily Volume (in millions)
Avg. Daily Turnover (RO millions)
Avg. Daily Trades
40
45
50
55
60
65
70
2004 2005 2006 2007 2008 2009 2010 2011
Number of Securities traded -
Regular Market (2004-2011)
Source: MSM, Al Maha Financial Research
MSM also witnessed more and more companies being listed, including some of the present blue
chips after 2004 which provide a better representation of the market. In addition, a longer period
smoothens out the effects of periods of significant upsides, downsides and fluctuating trade
activity.
Al Maha Research
www.almahafinancial.com Page 5 of 14
Muscat Securities Market and Value Creators 31 January 2012
Al Maha Financial Services LLC
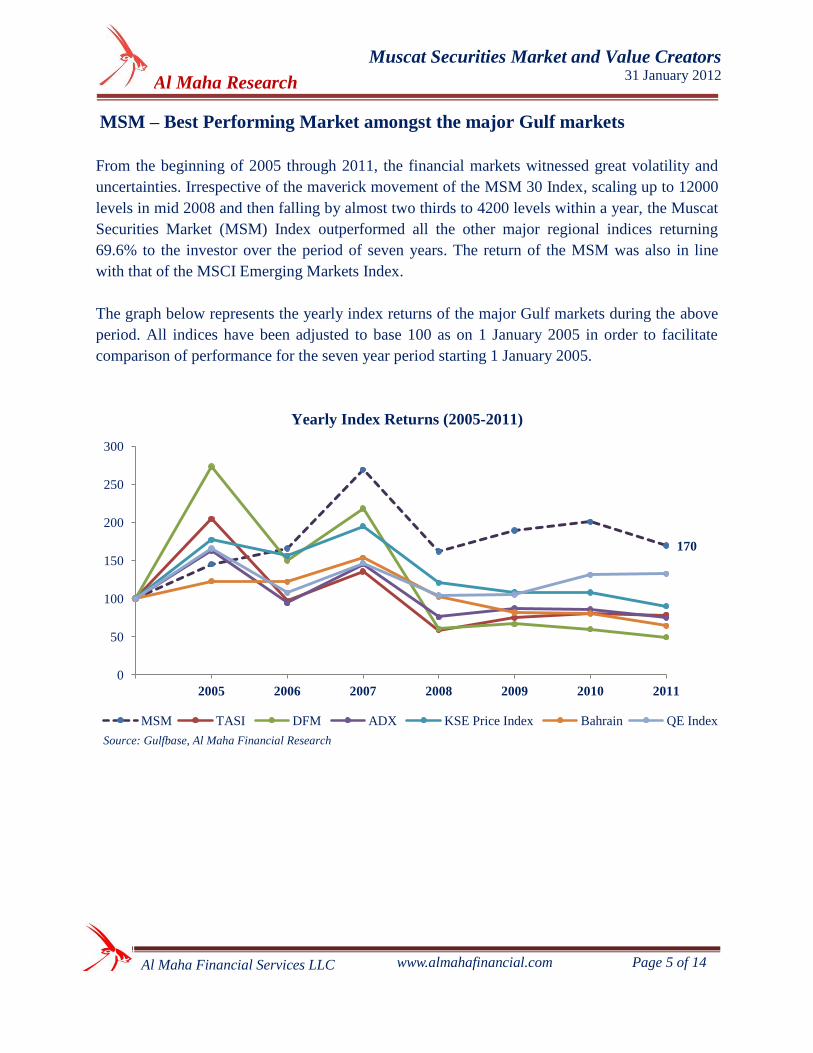
MSM – Best Performing Market amongst the major Gulf markets
From the beginning of 2005 through 2011, the financial markets witnessed great volatility and
uncertainties. Irrespective of the maverick movement of the MSM 30 Index, scaling up to 12000
levels in mid 2008 and then falling by almost two thirds to 4200 levels within a year, the Muscat
Securities Market (MSM) Index outperformed all the other major regional indices returning
69.6% to the investor over the period of seven years. The return of the MSM was also in line
with that of the MSCI Emerging Markets Index.
The graph below represents the yearly index returns of the major Gulf markets during the above
period. All indices have been adjusted to base 100 as on 1 January 2005 in order to facilitate
comparison of performance for the seven year period starting 1 January 2005.
Yearly Index Returns (2005-2011)
170
0
50
100
150
200
250
300
2005 2006 2007 2008 2009 2010 2011
MSM TASI DFM ADX KSE Price Index Bahrain QE Index
Source: Gulfbase, Al Maha Financial Research

Al Maha Research
www.almahafinancial.com Page 6 of 14
Muscat Securities Market and Value Creators 31 January 2012
Al Maha Financial Services LLC
Identifying the ‘Value Creators’
Over the years as MSM gave superior returns compared to major regional markets, there have
been hidden gems that have significantly outperformed the Index as well as investments in other
assets. These stocks have multiplied an investment many fold and have been the ‘Value
Creators’ for long-term investors.
The general myth...
Most investors believe that frontline and large-cap stocks like Bank Muscat, Omantel, etc give
superior returns compared to less liquid, small and mid-cap stocks. Blue-chips like these are also
more popular with institutions, retail investors and traders alike and hence enjoy relatively higher
liquidity.
Our finding is contrary to the myth…
However, findings of our research exercise are contrary to the general myth and reveal that
Value Creators, which have given maximum returns to the investors in the longer term, have in
fact been the unpopular, small and mid-cap stocks. Most of these stocks may not fit very well in
a trader’s short-term perspective; however, they have proved to be silent winners in the long
term.
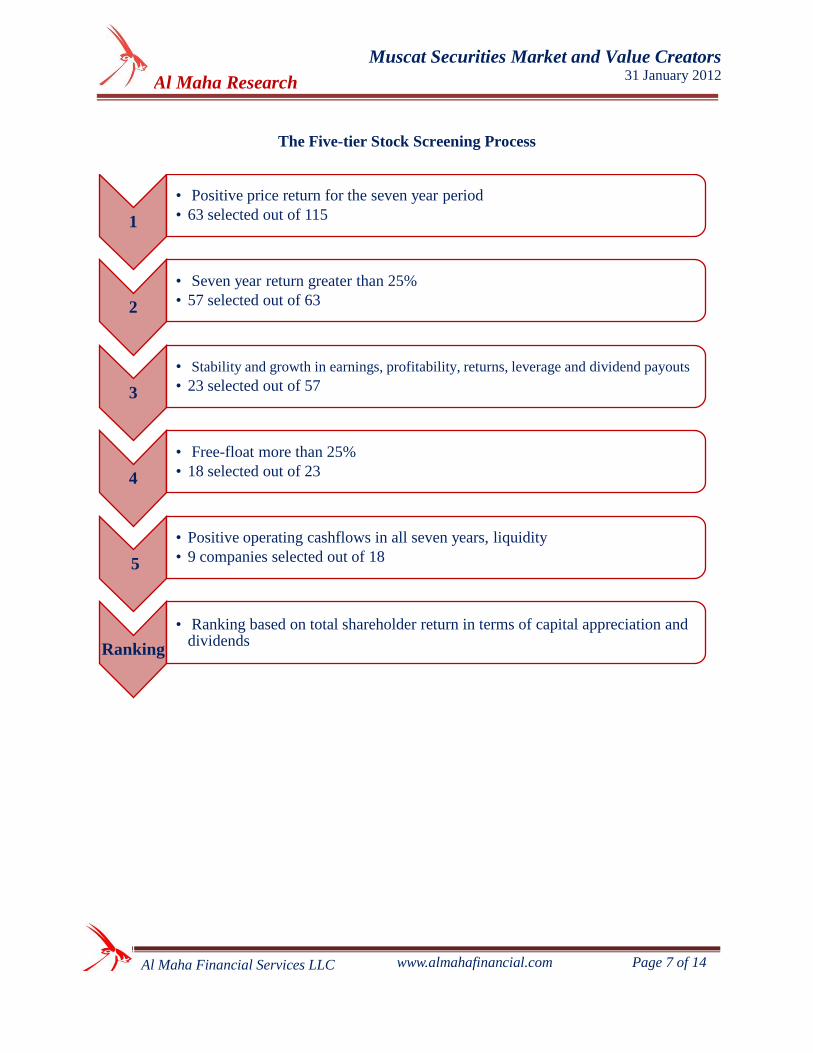
Stock Screening Criteria and the Process
In order to identify the Value Creators, a five-tier screening process based on various criteria was
used to screen and filter all the 115 stocks presently listed on the MSM. The basic criteria used
for screening was high positive price returns over the seven year period from 2005 to 2011. The
selected stocks were then screened for their financial health and stability, operational
performance and dividend payout history. Other criteria used for screening were free-float,
operating cash flows and stocks’ liquidity.
Al Maha Research
www.almahafinancial.com Page 7 of 14
Muscat Securities Market and Value Creators 31 January 2012
Al Maha Financial Services LLC
The Five-tier Stock Screening Process
1
• Positive price return for the seven year period
• 63 selected out of 115
2
• Seven year return greater than 25%
• 57 selected out of 63
3
• Stability and growth in earnings, profitability, returns, leverage and dividend payouts
• 23 selected out of 57
4
• Free-float more than 25%
• 18 selected out of 23
5
• Positive operating cashflows in all seven years, liquidity
• 9 companies selected out of 18
Ranking
• Ranking based on total shareholder return in terms of capital appreciation and dividends

Al Maha Research
www.almahafinancial.com Page 8 of 14
Muscat Securities Market and Value Creators 31 January 2012
Al Maha Financial Services LLC
The Value Creators
Source: MSM, Al Maha Financial Research
Sector Classification of Value Creators
Industrial and Service Sector stocks have led the chase…
During the period, the Industry sector has been the best performing sector returning an
impressive 115.2%; followed by the Service sector returning 69.2%, also in line with the MSM
30 Index. The graph below represents the relative performance of the MSM 30 and the Sector
Indices over the seven year period. All indices have been adjusted to base 1 as on 1 January 2005
in order to facilitate comparison.
Source: MSM, Al Maha Financial Research
Rank Stock
Total Shareholder
Return
(2005-2011)
1 Shell Oman Marketing 517%
2 Oman Oil Marketing 398%
5 Oman Refreshment 389%
4 Al Maha Petroleum Products Marketing 347%
3 Oman Chlorine 296%
6 Muscat Gases 249%
7 Al Anwar Ceramic Tiles 209%
8 Raysut Cement 162%
9 Oman Chromite 75%
0
1
2
3
4
5
6
Jan
2, 2005
Feb
8, 2006
Dec
7, 2006
Oct
3, 2007
Aug
4, 2008
Jun
10, 2009
Apr
14, 2010
Feb
20, 2011
Dec
28, 2011
Relative Performance of MSM 30 and Sector Indices
MSM30 Index Financial Index Industrial Index Services Index

Al Maha Research
www.almahafinancial.com Page 9 of 14
Muscat Securities Market and Value Creators 31 January 2012
Al Maha Financial Services LLC
Hence it should be no surprise that five of our Value Creators belong to the industrial sector. A
mix of these stocks fairly represents the major industrial sectors of our economy.
Source: Al Maha Financial Research
Oil & Gas marketing sector – major contributor to value creation
Historically, the Oil & Gas Marketing sector has been of prime focus for growth of the economy.
Crude oil has accounted for over 30 percent of Oman's GDP since 1980 and petroleum activities
(crude and natural gas) contributed to around 46% of our total GDP for the year 2010. Hence,
Oil & Gas related companies have largely contributed towards the overall growth and value
creation in the economy and the market.
This is also evident from the superior positive returns provided by all the listed Oil & Gas
companies. Four of the five companies also make it to our value creators list, re-emphasizing the
importance and performance of this sector. The Oil & Gas companies have strong and stable core
business models with healthy cash reserves and zero or low debt. Historically, these companies
have achieved constant positive growth and paid high cash dividends to investors.
The future outlook of this sector continues to remain positive with Oman’s investment in the oil
and gas sector expected to exceed RO 6.6 billion during the period of the Eighth Five Year Plan
(2011-2015) and estimated at RO 1.3 billion (13% of total estimated expenditure) for the year
2012.
Rank Stock Sector
3 Oman Chlorine Chemical
5 Oman Refreshment Food & Beverage
7 Al Anwar Ceramic Tiles Construction Materials Support
8 Raysut Cement Cement
9 Oman Chromite Mining

Al Maha Research
www.almahafinancial.com Page 10 of 14
Muscat Securities Market and Value Creators 31 January 2012
Al Maha Financial Services LLC
Comparative Performance Analysis
“In the long run, a portfolio of well chosen stocks and/or equity mutual funds will always
outperform a portfolio of bonds or a money-market account.” – Peter Lynch
During the past decade, assets like energy-related commodities and precious metals have given
high-returns to investors. For the seven year period under consideration, investment in Gold
would provide an investor with a handsome return of 258% while Crude Oil returned 134%.
However, most of MSM’s Value Creators have performed better than investments in Gold and
Crude, pleasantly surprising the market and hence increasing confidence in wise equity
investments.
Majority of our Value Creators have outperformed the returns of Gold and Crude Oil, during the
period as shown below.
Most stocks display superior performance compared to Gold and Crude Oil…
Comparative 7 Year Returns (2005-2011)
Source: MSM, Energy Information Administration (EIA), www.onlygold.com
75%
134%
162%
209%
249%
258%
296%
347%
389%
398%
517%
0% 100% 200% 300% 400% 500% 600%
Oman Chromite
Crude Oil
Raysut Cement
Al Anwar Ceramic
Muscat Gases
Gold
Oman Chlorine
Al Maha Petroleum
Oman Refreshment
Oman Oil
Shell Oman

Al Maha Research
www.almahafinancial.com Page 11 of 14
Muscat Securities Market and Value Creators 31 January 2012
Al Maha Financial Services LLC
It is also interesting to note that all the Oil & Gas related stocks have also significantly
outperformed the performance of the underlying commodity.
Relative performance of Oil related stocks to Crude Oil
Source: MSM, Al Maha Financial Research
616.7
498.3446.6
234.4
0
100
200
300
400
500
600
700
2005 2006 2007 2008 2009 2010 2011
Shell Oman Oman Oil Al Maha Petroleum Crude Oil

Al Maha Research
www.almahafinancial.com Page 12 of 14
Muscat Securities Market and Value Creators 31 January 2012
Al Maha Financial Services LLC
MSM continues to offer attractive investment opportunities for long-term Value
Creation...
The performance of the above listed value creators and the market lay down clear examples of
superior equity performance on careful and rational stock selection, for the long-term,
irrespective of short-term market fluctuations. The Muscat Securities Market represents a
comparatively smaller but dynamic market that has been gaining in importance in the recent past.
The MSM is one of the very well regulated, transparent and investor-friendly markets in the
region. It currently trades at attractive valuations compared to other major GCC markets and also
offers the high dividend yield to investors in the region. MSM’s relatively low Market
Capitalization to Gross Domestic Product (GDP) also reflects the temporary under pricing of the
market to the economic scenario.
As witnessed in the past, the market’s performance will continue to be driven by the country’s
macro-economic stability, steady growth and planned development measures. According to the
International Monetary Fund (IMF), Oman's economy is projected to keep expanding in the
medium term as a result of a massive investment and development programme put forth by the
Eighth Five Year Plan (2011-2015). The IMF expects real GDP growth at five per cent in 2012,
far higher than the average three per cent targeted by the five-year blueprint. Oman has also had
very low debt and is expected to maintain its low debt to GDP in future. The demographics of
the Sultanate too are conducive to stable growth with younger population and an increase in their
disposable income levels. Oman’s ambitious Vision 2020 aims to diversify the economy,
reducing its dependence on revenue from hydrocarbons and focus on various other sectors like
infrastructure, tourism, logistics, manufacturing and other industries, offering investors more
opportunities for long-term investments.
Hence, despite the temporary fluctuations of the market, the high long-term returns of MSM
equity have been closely tied to the overall economic development, fundamental strength and
operational performance of businesses. The positive future outlook driven by the continuing
strength of these factors makes MSM equity a stable long-term value investment opportunity
rather than a short-term market play.
Al Maha Research
www.almahafinancial.com Page 13 of 14
Muscat Securities Market and Value Creators 31 January 2012
Al Maha Financial Services LLC
Contacts Telephone E-mail
Research:
Suresh Kumar 24827137 [email protected]
Radhika Gadhia 24827138 [email protected]
Khushboo Badlani 24827140 [email protected]
Portfolio Management :
S.V. Uppiliappan 24827169 [email protected]
Brokerage:
Abdullah Al Hinai 24827188 [email protected]
Mahmoud Al Hamsaidi 24827144 [email protected]
Nasser Al Banna 24827177 [email protected]
Operations & Customer service :
Zakia Al Ghammari 24827134 [email protected]
Muna Al Hashmi 24827139 [email protected]
Al Maha Financial Services LLC
PO Box 1065 PC 117, Al Wadi Al Kabir, Sultanate of Oman Tel: 00 968 2482 7171, Fax: 00968 24827121
Award Winner 2010 Excellence in Brokerage Business
Awarded for Research Promotion and Website Content
By
Muscat Securities Market

Al Maha Research
www.almahafinancial.com Page 14 of 14
Muscat Securities Market and Value Creators 31 January 2012
Al Maha Financial Services LLC
DISCLAIMER: The research report has been prepared by Al Maha Financial Services LLC for private circulation amongst
selected clientele for information purposes only and should not be construed as an offer to sell or the solicitation of an offer
to purchase or subscribe any investment. This Report is not directed to, or intended to be used by, any person or entity who
(or which) is a citizen of (or domiciled) in any jurisdiction where such distribution, publication, availability or use would be
contrary to law or regulation or which would subject the company to any registration or licensing requirements within such
jurisdiction. Al Maha Financial Services LLC will not be liable for any direct or indirect losses arising from the use thereof,
and the investors are expected to use the information contained herein at their own risk. Al Maha Financial Services LLC
and its affiliates including analyst who has issued this report, may, on the date of this report, and from time to time, have
long or short positions in, and buy or sell the securities of the companies mentioned herein or engage in any other transaction
involving such securities and earn brokerage or compensation or act as advisor or have other potential conflict of interest
with respect to companies mentioned herein or inconsistent with any recommendation and related information and opinions.
Al Maha Financial Services LLC and its affiliates may seek to provide or have engaged in providing corporate finance,
investment banking or other advisory services in a merger or specific transaction to the companies referred to in this report,
as on the date of this report or in the past.
The information contained in this report has been obtained from the sources believed to be reliable and in good faith, but
which may not be verified independently. While utmost care has been taken in preparing the above report, Al Maha
Financial Services LLC makes no guarantee, representation or warranty, whether expressed or implied, and accepts no
responsibility or liability to its accuracy and completeness of the data, being provided. Opinion expressed is our current
opinion as of the date appearing on this material only. We do not undertake to advise you as to any change of our views
expressed in this document. The investments discussed in this report may not be suitable for all the investors. Investors must
take their own decision based on their specific investment objectives and financial position, and using such independent
advisors, as they believe necessary. Income from investments may fluctuate. The price or value of the investments, to which
this report relates, either directly or indirectly, may fall against the interest of investors. This document is strictly for the use
of recipients only. None of the material provided herein may be reproduced, rewritten, rehashed, published, resold or
distributed in any manner whatsoever without the prior and explicit written permission of Al Maha Financial Services LLC.