avz minerals limited (“avz” or “the company”) manono
TRANSCRIPT
22 October 2019 Dear Shareholder,
AVZ Minerals Limited (“AVZ” or “the Company”) presents to you a more in-depth, contextual interpretive guide for the Manono Lithium and Tin Project (“Manono Project”) - Phase 1 metallurgical test work results. This letter includes a general outline of current markets and uses for lithium as well as potential process flow sheets for Manono to produce an initial target spodumene concentrate with a grade of +6%Li2O.
With reference to the following ASX announcements relating to Phase 1 metallurgical test work results released in 2019 (5th & 13th of August; 16th of September and the 9th of October), we present herein the Company’s guide that we are confident will assist you further in generating the necessary perspective on our tier one lithium and tin project.
LITHIUM USES AND MARKETS The metal, minerals, and chemical market analyst, Roskill, has previously highlighted that lithium end-use can generally be divided into two broad market categories: chemical and technical application markets. To understand further on the chemical and technical application markets, please kindly refer to the AVZ’S website.
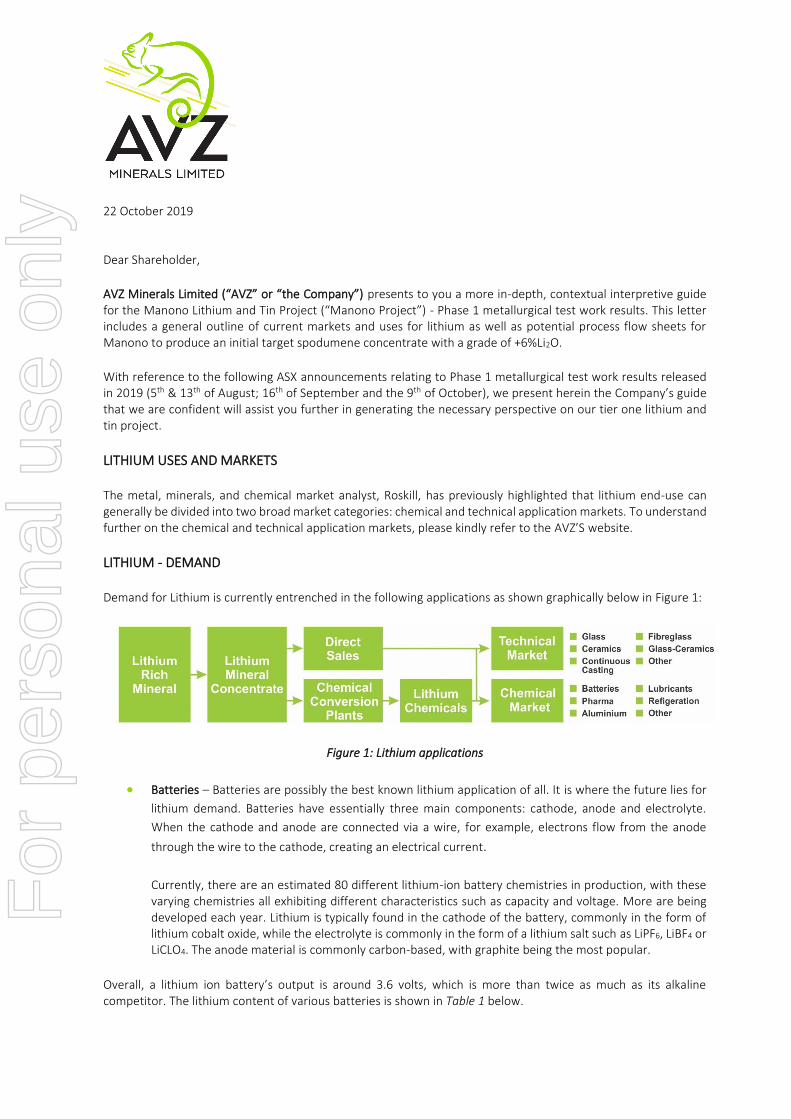
LITHIUM - DEMAND Demand for Lithium is currently entrenched in the following applications as shown graphically below in Figure 1:
Figure 1: Lithium applications
• Batteries – Batteries are possibly the best known lithium application of all. It is where the future lies for
lithium demand. Batteries have essentially three main components: cathode, anode and electrolyte.
When the cathode and anode are connected via a wire, for example, electrons flow from the anode
through the wire to the cathode, creating an electrical current.
Currently, there are an estimated 80 different lithium-ion battery chemistries in production, with these varying chemistries all exhibiting different characteristics such as capacity and voltage. More are being developed each year. Lithium is typically found in the cathode of the battery, commonly in the form of lithium cobalt oxide, while the electrolyte is commonly in the form of a lithium salt such as LiPF6, LiBF4 or LiCLO4. The anode material is commonly carbon-based, with graphite being the most popular.
Overall, a lithium ion battery’s output is around 3.6 volts, which is more than twice as much as its alkaline competitor. The lithium content of various batteries is shown in Table 1 below.
For
per
sona
l use
onl
y

2 | P a g e
Table 1: Lithium content on various batteries
• Lubricant Grease – An estimated US$4 billion market, in which lithium-based greases make up 75%.
Lithium-based greases generally have good stability, high temperature characteristics and water-
resistance properties.
• Glass – Lithium typically sourced from the mineral spodumene reduces the viscosity and thermal
expansion of glass and therefore leads to increased melting efficiencies and/or larger effective furnace
capacities. The end result is a substantial energy saving for the glass manufacturers.
• Ceramics – Lithium is used in the ceramics industry to produce glazes. The glazes improve a ceramic
piece’s shock absorption and stain resistance, protecting the piece against damage. Lithium carbonate is
typically used for this application.
• Health Products – Lithium, in small amounts (around 0.170 mg/L), is prescribed to those with bipolar
disorders or individuals with depression who don’t respond to anti-depressants.
For further general information on supply and demand, visit AVZ’s website.
NATURAL MINERAL OCCURRENCES Lithium occurs naturally in the earth in one of two main forms: brines (salars) and hard rock sources such as pegmatites. The following diagram gives an overall schematic of the simplified process from source to potential end product. Pegmatites will require further processing to achieve final products for market use. AVZ hosts the largest undeveloped spodumene lithium resource in the world within the Roche Dure prospect at Manono.
CHEMISTRY TYPE LITHIUM CONTENT PER CELL (g)
Primary batteries
Lithium manganese-dioxide (Li-MnO2) Button/coin 0.05–0.10
Cylindrical 0.60–4.00
Lithium iron disulfide (Li-FeS2) Cylindrical 1.35
Lithium thionyl chloride (Li-SOCl2) Cylindrical 0.60–2.75
Lithium sulfur dioxide (Li-SO2) Cylindrical 2.10
Secondary batteries
Lithium cobalt dioxide ion (Li-CoO2) Cylindrical 0.35–0.65
Prismatic 2.46
Lithium ion industrial battery pack (Li-ion) Prismatic 16.00–26.00
Lithium cobalt dioxide polymer (Li-poly) Prismatic 0.30–3.10
For
per
sona
l use
onl
y

3 | P a g e
Brines require intensive chemical treatment to produce a useable product such as a chloride, hydroxide or carbonate and their chemistry is very variable given that they are a “live system” and are constantly replenishing with new material of different chemical composition. The issue we see here is that with this constant change of chemistry comes a constant change of process technique in order to be able to recover a usable product. We believe that to have a constant feed stock from a hard rock resource is by far the easiest way to achieve a saleable product for current markets. Roche Dure, given its homogeneity and lack of variability is a premium source of constant feed to produce a very high grade product with very low deleterious elements. Stated simply, the quality (quantity of deleterious elements and lithium grade) of spodumene concentrate (SC) products impacts the conversion process and quality of the lithium chemicals. We are aiming to develop a leading reputation on our SC6 material based on its consistently high grade and low levels of impurities. Creating a consistent and reliable product is paramount in any further processing of spodumene be it sulphate, carbonate or hydroxide. Having a reliable and consistently high grade and clean product is a requirement in a vertically integrated business.
We will not expand further on brines here. Spodumene (which is a lithium pyroxene – LiAl(SiO3)2 ) deposits however, are commonly hosted in pegmatites, which are igneous rocks intruded in a subsurface setting, with interlocking crystals usually larger than 2.5cm in size, of a “granitic” composition. Most pegmatites are formed in sheets of rock as either dykes, veins or as we believe we uniquely have at Manono, as lopoliths. Most pegmatites are mined by conventional open pit methods, followed by crushing, grinding and extraction using a mixture of gravity, heavy media separation, magnetic separation and flotation to produce a concentrate, largely comprised of spodumene, but with minor amounts of waste minerals including quartz and feldspar. Invariably, two concentrate qualities are often produced from the same deposit – a chemical grade (“CG”) concentrate and a premium technical grade (“TG”) concentrate, dependent upon customers’ requirements and capital intensity. A common by-product is tin and tantalite and other tantalum minerals. AVZ has the potential to produce an initial chemical grade product for sale to battery manufacturers, but also has the ability to develop, at a later stage, a technical grade product if the planned Phase 2 test work proves positive. The concentrate can then be further treated, through roasting, to produce ßeta-spodumene for ceramics, and lithium derivatives including carbonate, hydroxides and chloride versions for other uses. TG concentrates, which are largely used in glass and ceramics applications, particularly in low thermal shock ceramics, require low iron contents (maximum of 0.15% to 0.5% Fe2O3, dependent on use, but the lower levels are preferred), and with LiO2 grades of at least 6.5%. Specifications for CG concentrate, as used in battery applications, are less strict, with concentrate grades of a minimum of SC5.0, preferred SC6.0, with Fe2O3 of less than 1% being preferred. AVZ is very confident that it can produce an +SC6.0 concentrate with low iron, fluorine, mica and phosphorous with current test work indicating iron oxide as Fe2O3 in the concentrates of all tests being well below the chemical grade SC6.0 limit of 0.8% and currently above the technical grade limits of 0.25-0.12% at around 0.35 to 0.5% Fe2O3. Other parameters are used as guidelines for product classification and these are presented as an example in Table 2 - Comparative Specifications for Various Global Hard Rock Lithium Projects. F
or p
erso
nal u
se o
nly
4 | P a g e
AVZ’S METALLURGICAL TEST WORK APPROACH A well-defined Phase 1 test work program is needed to support engineering cost estimates prepared as part of the Manono Definitive Feasibility Study (DFS). AVZ is confident in the metallurgical discovery process to explain further, and in some detail, to its shareholders the key methodology, findings to date and the potential process recovery flow sheet to produce a spodumene concentrate ready for sale. Manufacturing an +SC6.0 is the first stage in the potential product stream that AVZ is actively pursuing. Hard rock lithium deposits (pegmatites), like Manono, require only a few flowsheet components in order to produce a lithium rich concentrate for sale: Crushing; mica removal; primary beneficiation (DMS); secondary beneficiation (if required); and by-product recovery.
At Manono and in particular the Roche Dure deposit, lithium resides almost exclusively in the mineral spodumene (LiAlSi2O6) (https://en.wikipedia.org/wiki/Spodumene) and at Roche Dure, we believe that the pegmatite has a unique homogeneity to its mineralisation (low deleterious elements and high purity of grade) and that consequently the lithium rich pegmatite will easily convert to a spodumene mineral rich concentrate. Current terminology uses the prefix “SC” for spodumene concentrate to differentiate it from brine lithium. This prefix is usually followed by a number, to one decimal place, to define the percentage of lithium within the concentrate. Therefore, SC6.0 will be a 6% lithia concentrate and when lithia resides exclusively in spodumene a maximum lithia grade of 8% corresponds with 100% spodumene source. The Flowsheet components, needed to produce a spodumene rich concentrate include:
• ROM (Run of Mine) Ore Crushing. Typically, a 2-stage conventional crushing circuit including primary jaw
crushing and secondary cone crushing is required ahead of the final High-Pressure Grinding Rolls (HPGR)
crushing stage. All breakage of ore falls under the term, Comminution.
HPGR crushing is preferred as the final crushing stage and is the industry standard due to the HPGR’s
ability to: withstand the very high wear rates that accompany lithium hard rock ores: capability of
producing a small product size, below that of conventional crushing equipment and having a unique
ability in their design to break rock along mineral boundaries to help prevent production of fines material
and thus loss of lithia.
• Mica Removal Process. Mica is not desirable in spodumene concentrates due to its ability to dilute the
lithium grade and its possible contamination by elements such as species of iron and fluorine forming
part of the mica structure. Iron and fluorine are highly deleterious to the downstream processing of
chemical grade spodumene concentrates.
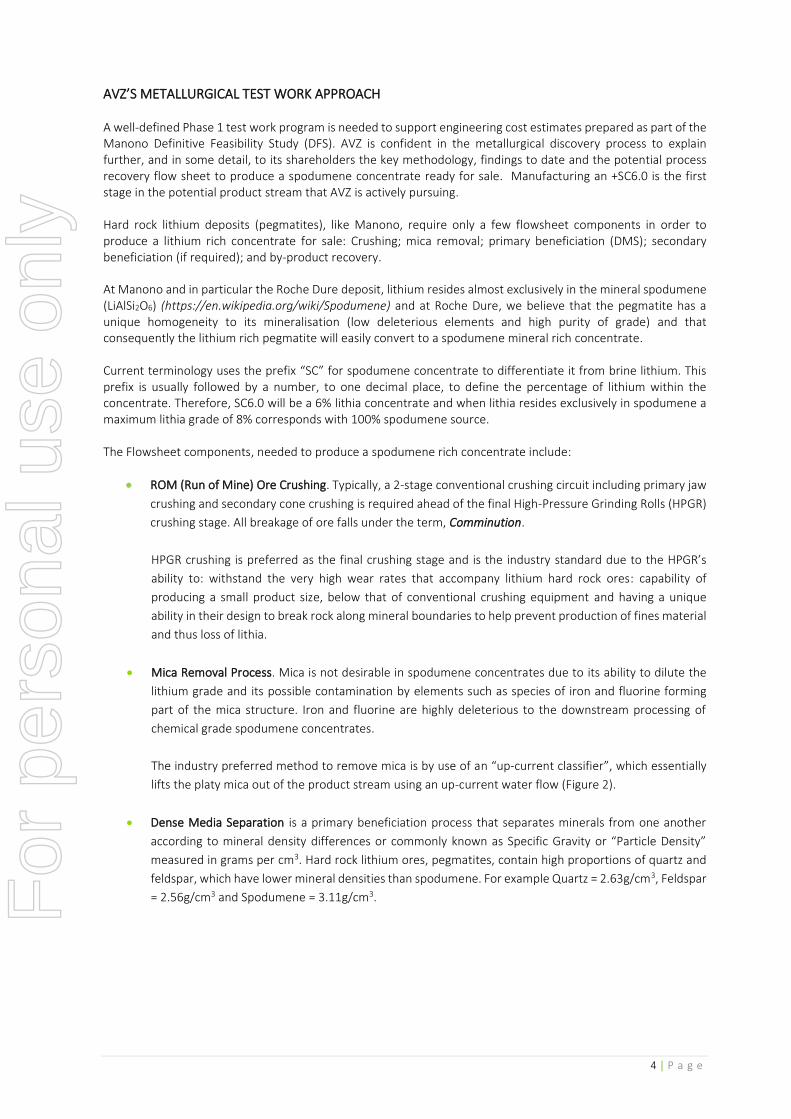
The industry preferred method to remove mica is by use of an “up-current classifier”, which essentially
lifts the platy mica out of the product stream using an up-current water flow (Figure 2).
• Dense Media Separation is a primary beneficiation process that separates minerals from one another
according to mineral density differences or commonly known as Specific Gravity or “Particle Density”
measured in grams per cm3. Hard rock lithium ores, pegmatites, contain high proportions of quartz and
feldspar, which have lower mineral densities than spodumene. For example Quartz = 2.63g/cm3, Feldspar
= 2.56g/cm3 and Spodumene = 3.11g/cm3.
For
per
sona
l use
onl
y
5 | P a g e
Figure 2: Bench scale Up Current or Reflux Classifier for Mica removal
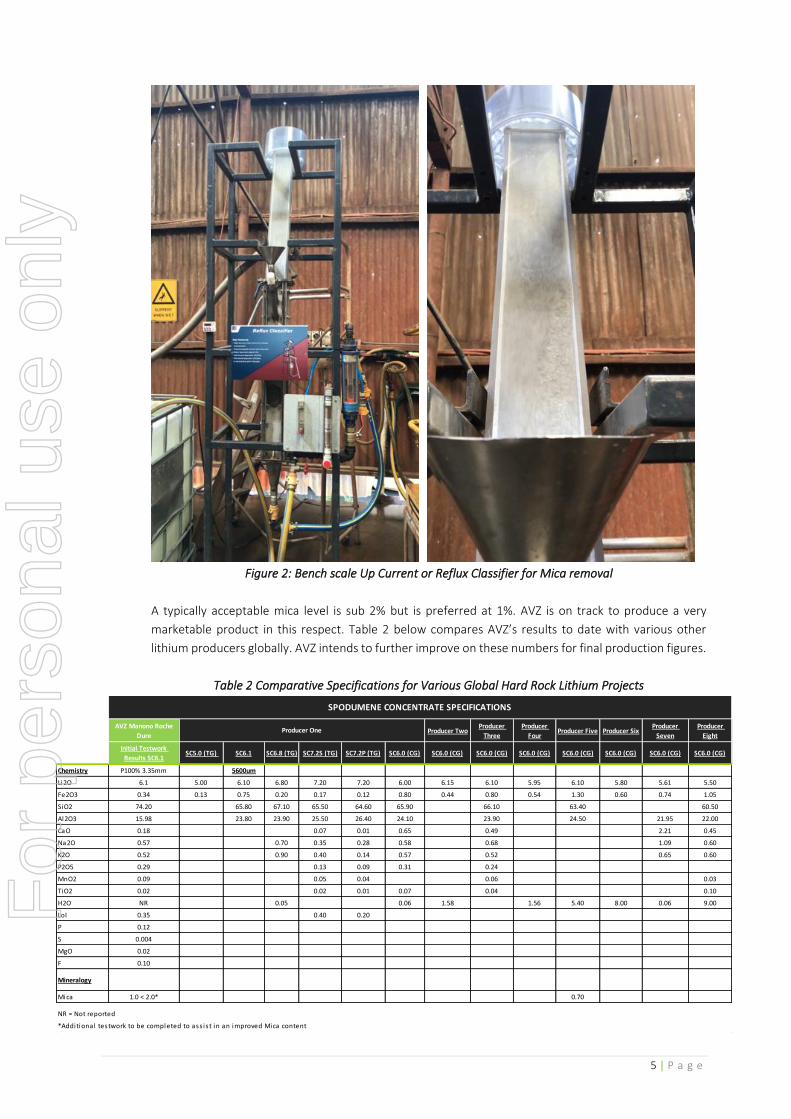
A typically acceptable mica level is sub 2% but is preferred at 1%. AVZ is on track to produce a very
marketable product in this respect. Table 2 below compares AVZ’s results to date with various other
lithium producers globally. AVZ intends to further improve on these numbers for final production figures.
Table 2 Comparative Specifications for Various Global Hard Rock Lithium Projects
AVZ Manono Roche
DureProducer Two
Producer
Three
Producer
FourProducer Five Producer Six
Producer
Seven
Producer
Eight
Initial Testwork
Results SC6.1SC5.0 (TG) SC6.1 SC6.8 (TG) SC7.2S (TG) SC7.2P (TG) SC6.0 (CG) SC6.0 (CG) SC6.0 (CG) SC6.0 (CG) SC6.0 (CG) SC6.0 (CG) SC6.0 (CG) SC6.0 (CG)
Chemistry P100% 3.35mm 5600um
Li2O 6.1 5.00 6.10 6.80 7.20 7.20 6.00 6.15 6.10 5.95 6.10 5.80 5.61 5.50
Fe2O3 0.34 0.13 0.75 0.20 0.17 0.12 0.80 0.44 0.80 0.54 1.30 0.60 0.74 1.05
SiO2 74.20 65.80 67.10 65.50 64.60 65.90 66.10 63.40 60.50
Al2O3 15.98 23.80 23.90 25.50 26.40 24.10 23.90 24.50 21.95 22.00
CaO 0.18 0.07 0.01 0.65 0.49 2.21 0.45
Na2O 0.57 0.70 0.35 0.28 0.58 0.68 1.09 0.60
K2O 0.52 0.90 0.40 0.14 0.57 0.52 0.65 0.60
P2O5 0.29 0.13 0.09 0.31 0.24
MnO2 0.09 0.05 0.04 0.06 0.03
TiO2 0.02 0.02 0.01 0.07 0.04 0.10
H2O NR 0.05 0.06 1.58 1.56 5.40 8.00 0.06 9.00
LoI 0.35 0.40 0.20
P 0.12
S 0.004
MgO 0.02
F 0.10
Mineralogy
Mica 1.0 < 2.0* 0.70
Producer One
SPODUMENE CONCENTRATE SPECIFICATIONS
NR = Not reported
*Additional testwork to be completed to ass is t in an improved Mica content
For
per
sona
l use
onl
y

6 | P a g e
NB: Figures above for AVZ’s SC6.1 are presented as an interim number based on test work completed to date and only to a 5.56 and 3.35mm crush size. These are expected to be improved and further in-depth test work will investigate production of a Technical Grade material. Table 2 represents specifications from disclosed and recent company presentations as published by respective project owners as at current date. These specifications may have been prepared under different reporting regimes and may not be directly comparable. AVZ accepts no responsibility for the accuracy of the specifications other than its own.
Consequently, spodumene can be separated from quartz and feldspar using dense medium separation
(DMS). The efficiency of mineral separation is influenced by the extent of spodumene liberation from the
gangue quartz and feldspar minerals during comminution. Liberated (post crushing) spodumene particles
have higher density than composite spodumene and quartz/feldspar particles and have a better
opportunity of being recovered to a higher grade spodumene concentrate than composite particles.
Crush particle size ahead of the DMS process is important, in that the crush size and liberation are
interdependent. For example, when the spodumene crystal size is small, the crush size needs to be small
to sufficiently liberate the spodumene so that it can be concentrated. A large spodumene crystal size,
requires only minimal crushing for adequate liberation ahead of spodumene recovery.
Depending on the number of DMS stages used, the DMS process produces:
i. a spodumene rich concentrate such as SC6.0,
ii. a low lithium grade waste product, high in quartz and feldspar concentration, and
iii. an intermediate lithium grade product containing mainly composites of spodumene and gangue
minerals.
Additionally, the DMS process produces an untreated stream containing particles deemed too small to process using DMS, which is usually particles smaller than 0.5mm, known as fines, as described below.
• Secondary beneficiation process. This is normally added to improve project economics by increasing
overall lithium recovery through treatment of the fines, <0.5mm particles, and the intermediate products
derived from the DMS. Secondary beneficiation includes processes like fine grinding, desliming,
magnetics removal, spodumene flotation and spodumene concentrate dewatering.
Secondary beneficiation involves technically challenging processes and requires a better technical
understanding gained through further ongoing test work of product from the mining and processing
operations. It is planned that all <0.5mm fines will be stored onsite and used as a source for bulk test
work to produce further lithium concentrate of a potentially higher quality once the process is further
refined. The stockpile of fines can provide run of mine feed stock for future recovery processes.
• By-Product production includes tin and tantalum and potentially other minerals. By-product recovery is
considered when their deportment in the product, waste, intermediate and <0.5mm particle streams, is
well understood. With over 27,500m of diamond core drilling, logging and assaying, we have noted two
associations of tin and tantalum within the orebody. Firstly, the disseminated low grade tin and tantalum
mineralisation that is almost homogenously distributed throughout the pegmatite and a secondary
higher-grade tin mineralisation, with associated tantalum, within greisen zones within hanging and
footwall host rocks. These have variable tin grades but do exceed 10% in places. The spatial distribution
of this mineralisation within these zones is not well understood at the current drill spacing, but detailed
mapping and sampling from the pit floor, when the water has been pumped out, will greatly assist in this
effort. High grade tin zones potentially present as a highly economic scenario for the operations and if
found to be sufficient in quantum and grade, AVZ would seriously consider construction of a tin and
tantalum recovery plant as an adjunct to the main lithium processing facility planned for Roche Dure.
For
per
sona
l use
onl
y
7 | P a g e
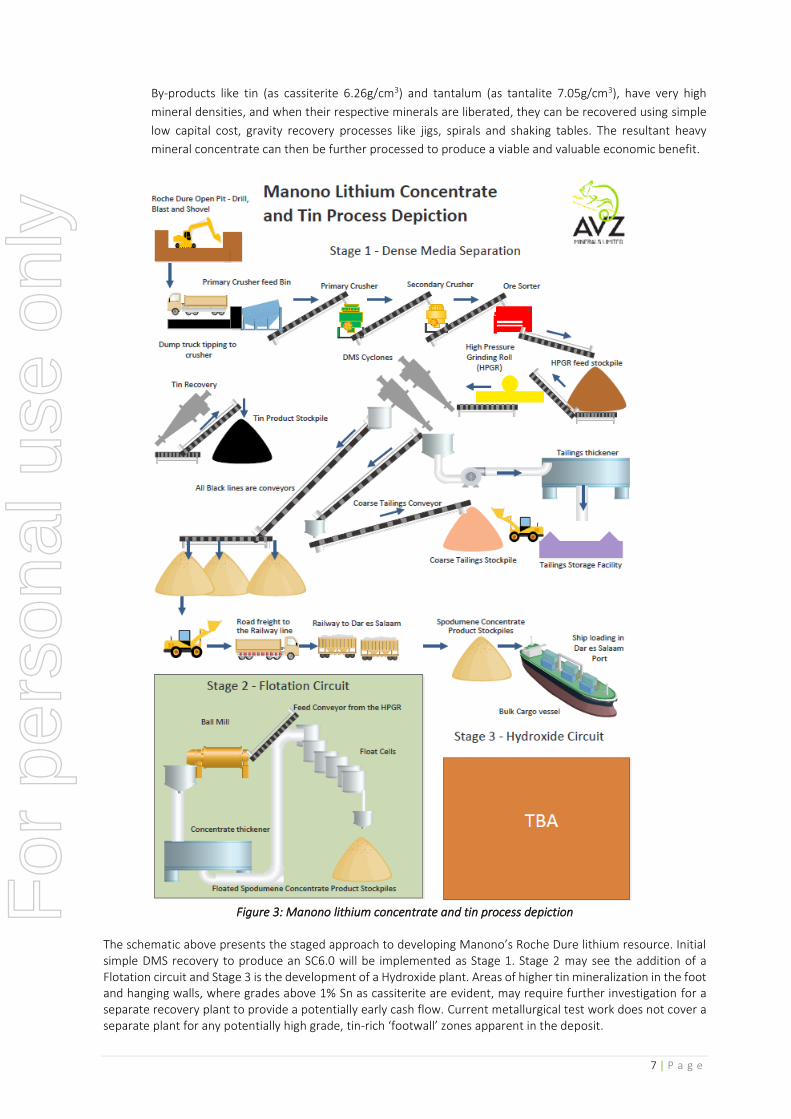
By-products like tin (as cassiterite 6.26g/cm3) and tantalum (as tantalite 7.05g/cm3), have very high
mineral densities, and when their respective minerals are liberated, they can be recovered using simple
low capital cost, gravity recovery processes like jigs, spirals and shaking tables. The resultant heavy
mineral concentrate can then be further processed to produce a viable and valuable economic benefit.
Figure 3: Manono lithium concentrate and tin process depiction
The schematic above presents the staged approach to developing Manono’s Roche Dure lithium resource. Initial simple DMS recovery to produce an SC6.0 will be implemented as Stage 1. Stage 2 may see the addition of a Flotation circuit and Stage 3 is the development of a Hydroxide plant. Areas of higher tin mineralization in the foot and hanging walls, where grades above 1% Sn as cassiterite are evident, may require further investigation for a separate recovery plant to provide a potentially early cash flow. Current metallurgical test work does not cover a separate plant for any potentially high grade, tin-rich ‘footwall’ zones apparent in the deposit.
For
per
sona
l use
onl
y

8 | P a g e
AVZ TEST RESULTS – A DISCUSSION AVZ completed a short diamond drilling program to source metallurgical sample and then shipped 5 complete PQ sized core holes from the Roche Dure deposit to Perth, Western Australia. The sites for the 5 drill holes were carefully selected to encounter pegmatite mineralisation within the area designated at a JORC Measured Resource category and including as much variability in both pegmatite, host rocks and weathering levels to ensure complete sample variability and representivity was presented. This material, almost 13 tonnes of full core, has formed the basis for all test work completed to date in this stage of testing.
CHARACTERISATION TEST WORK
Initial characterisation test work was completed using HLS (Heavy Liquid Separation) to determine the theoretical maximum spodumene liberation at various crush sizes. Additionally, mineral species were also investigated to examine if they can be readily separated with minimal mineral inter-growth to ensure spodumene itself does not contain excessive concentrations of iron bound in its structure. Examination of Roche Dure pegmatite sample indicated almost no inter-growth between spodumene and gangue minerals exists. Also, the spodumene contains very low iron percentages and well inside specified limits for spodumene concentrate. HLS provides a perfect separation between test densities as opposed to less efficient density separations occurring in DMS. Consequently, HLS testing provides a theoretical result and removes any influence on the test result caused by varying equipment separation efficiencies in DMS test work. HLS testing is typically conducted on particles sizes at and below where DMS testing is conducted. HLS test results on the smaller size fractions provide liberation characteristics and potential recovery opportunities for by-product minerals residing in the streams, too fine to be processed by DMS.
COMMINUTION TESTING Comminution testing (the method of reducing one particle size to another smaller particle size through crushing, grinding, cutting etc.) was conducted on Roche Dure ore samples to examine:
• Crushing energy requirement;
• Resistance to impact breakage;
• Grinding energy requirement;
• Abrasiveness, and;
• HPGR amenability testing to help define HPGR equipment energy and breakage capacity.
Hard rock spodumene containing pegmatite ores of industry peers have to date demonstrated very similar comminution test results to test work undertaken on Manono Project material. There have been no surprises here for AVZ. Specifically, the Roche Dure ore samples confirmed that the comminution test results are very similar to other hard rock lithium pegmatite ores within Australia and as reported globally. The strong similarities of the Roche Dure comminution test results with hard rock lithium peers begins to sharply diverge with regards to lithia recovery rates, at a DMS stage only process route, where Manono resource material consistently demonstrates conspicuously well above average recoveries.
DENSE MEDIA SEPARATION TESTING The very first stage of DMS testing is to determine the most economic ore crush size resulting in sufficiently high spodumene liberation to ensure spodumene can be recovered to a spodumene rich concentrate at acceptable lithium grades and recoveries. This stage of testing is also used to investigate deleterious element carry-over into the spodumene concentrate. There can be some confusion between the terms: HLS, HMS and DMS test work. Simply, HLS or Heavy liquid Separation is the use of non-site (laboratory) scale tests using a heavy liquid to separate out spodumene as a theoretically perfect separation: Heavy Media Separation (HMS) and Dense Media Separation (DMS) are essentially the same and rely on a heavy media, usually an iron silicate with a precise specific gravity , being added
For
per
sona
l use
onl
y

9 | P a g e
to the process to allow separation of the lighter waste products and the heavy ore products. We refer to HLS and DMS testing within our test work. DMS testing is not conducted at laboratory scale and is relatively expensive. Subsequently, heavy liquid separation (HLS) is used as a relatively cheap alternative test program. In addition, HLS provides a theoretically perfect separation between test densities as opposed to less efficient density separations occurring in DMS. Consequently, HLS testing provides a theoretical result and removes any influence on the test result caused by varying equipment separation efficiencies in DMS. Readers of a report on metallurgical test work would need to exercise great caution on the readability of that report, if the exact nature of the testing and equipment used is not stated unambiguously. If raw data on deleterious elements is not disclosed, or if there is relative but a distinct lack of information and data points to supply the necessary perspective to inform readers of the character of the SC product’s economics, incorrect assumptions can easily be made.
HLS testing at three crush sizes; 10.0mm, 5.56mm and 3.35mm (Table 3), was conducted to identify crush size with maximum lithium recovery and lithium grade. Current convention states that lithium grade be reported as lithia (Li2O) instead of lithium. The Manono HLS results (refer to ASX announcement dated 13th August 2019) demonstrate that lithium recovery improves with decreasing crush size. Also, lithia grade improves with decreasing crush size. HLS results presented in Table 3 below, are inclusive of lithium losses to the <0.5mm size fraction. The smaller crush size liberates more spodumene from the gangue minerals than the coarser crush size. Iron concentrations in the spodumene product, reported as the iron oxide hematite (Fe2O3), are well below chemical grade limits in spodumene concentrates (SC6.0), which specify a maximum concentration of 0.8% Fe2O3. Based on this HLS test work the smallest tested crush size would be preferred and iron contamination in a Manono spodumene concentrate will be well below maximum limits.
Test Description
Recovery Grade
Li2O Li2O Fe2O3
(%) (%) (%)
1 HLS: 3.35mm 70.4 6.6 0.40
2 HLS: 5.56mm 65.9 6.2 0.36
3 HLS: 10.0mm 61.7 5.8 0.40
Table 3: Heavy Liquid Separation met test work results Selecting the most economically beneficial crush size is a trade-off between lithia recovery and the capital and operating costs behind achieving the crush size. Normally, the smaller crush size requires a more capital intensive circuit and operating costs are higher than the larger crush size because of higher energy demands and higher equipment wear rates. Subsequently, both the 5.56mm and 3.35mm crush sizes were carried through to the DMS testing for better definition of metallurgical parameters required for economic evaluation. Phase 2 test work will determine the final crush size for Manono. DMS testing is conducted at two different scales; lab-pilot scale using a 100mm diameter cyclone and constant pressure DMS circuit suitable for samples up to 15kg (DMS100) and plant scale using a 250mm diameter cyclone, variable inlet pressure DMS circuit for samples typically in excess of 50kg (DMS250). Initial DMS testing was conducted using the pilot scale DMS test rig (DMS100) to preserve sample, minimize costs and to evaluate DMS performance.
For
per
sona
l use
onl
y

10 | P a g e
There are numerous ways to present DMS test results:
• graphically as test density versus test lithium recovery;
• test density versus lithia grade;
• test lithium recovery versus lithia grade; and
• tabling point test results of grade and recovery at test density is another alternative.
From a metallurgical perspective a graphical presentation of test lithia grade versus test lithium recovery provides the most useful data and any reference to test density is presented by the graphical points; the higher the grade, the higher the density. Figure 4 below presents the grade-recovery curves for each DMS 100 test.
Figure 4: Dense Media Separation 100 – Grade Recovery test results
Three 5.56mm crush DMS tests were conducted, one to a test SG of 2.9, which failed to achieve 6% lithia in the concentrate and, two tests; one without and the other with a pre-treatment process to remove mica prior to testing (designated with an RC “Reflux Classifier” in the description). Both the 2.95 SG tests at 5.56mm could produce a concentrate lithia grade of 6% at 59% recovery. To compare this result with the HLS test, at 6.2% lithia grade, HLS lithium recovery was 65.9% and DMS lithium recovery approximately 58%. This represents a lithium recovery discount of 8% for DMS compared with HLS, which is well within expectations. Comparing the 3.35mm and 5.56mm crush results there is a 4% increase in lithium recovery achieved by reducing the crush size entailing a concentrate lithia grade of 6%. The recovery differences range is less at lower concentrate lithia grades. Comparisons of detrimental compounds or elements like iron as iron oxide, mica and fluorine is best presented in a tabular form where the contaminant concentration applies to a specific concentrate product grade and recovery. Table 4 below includes iron oxide, mica and fluorine contaminant concentration where assayed, otherwise depicted with a “NA”, in the DMS100 test spodumene concentrates.
For
per
sona
l use
onl
y

11 | P a g e
Test Description
Recovery Grade
Li2O Li2O Fe2O3 Mica F
(%) (%) (%) (%) (g/t)
1 DMS100: 5.56mm, 2.95SG 59.8 5.8 0.50 2.7 59
2 DMS100: 5.56mm, RC, 2.9SG 60.9 5.9 0.45 2.1 82
3 DMS100: 3.35mm, RC, 2.9SG 62.8 6.0 0.44 1.7 NA
Table 4: Dense Media Separation 100 met test work results Iron oxide as Fe2O3 in the concentrates of all tests was well below the chemical grade SC6.0 limit of 0.8% and above the technical grade limits of between 0.12-0.25%.
Albemarle produce a set of technical sheets for their various technical grade spodumene concentrate products which give a guideline for specification requirements. One notable difference between our proposed product at this stage, using a DMS only and Albemarle’s “complete” process, is the grain size. AVZ is intending at this stage to crush to 5.56mm and reject anything <0.5mm to the fine grain stockpiles. Albemarle’s products range from <1000um (1mm) to <63um (0.063mm), which is very fine grinding compared to AVZ’s proposed grind levels with a resultant increase in grade and decrease in deleterious materials. More can be sourced from the Albermarle website below. [https://www.albemarle.com/businesses/lithium/products/product-finder?pinfo=Spodumene]. Mica concentration in the product improved (decreased) with increasing concentrate lithia grade. Spodumene concentrates can contain up to 4% mica, however, concentrates with less than 2% mica are preferred by the battery manufacturers. DMS testing with a mica removal pre-treatment step was able to achieve slightly above 2% mica in the spodumene concentrate at 5.56mm crush. At the 3.35mm crush size and a mica removal pre-treatment step, spodumene concentrate mica concentration was below 2%, making it a highly desirable product in the marketplace. Ongoing test work is expected to improve this aspect of the product at Manono. Fluorine concentrations in the spodumene concentrates are negligible and pose no issue for battery manufacturing.
LABORATORY PILOT AND LARGE SCALE DMS TEST WORK COMPARISON The final stage of DMS testing examined potential differences in DMS performance between lab-pilot and large scale DMS circuit performance (DMS250). A large scale DMS test was conducted in a DMS circuit containing a 250mm cyclone, approximately 2.5 times the diameter of the pilot scale DMS100 cyclone. A sample was prepared to a crush size of 5.56mm, which presently appears to be the most economic crush size. The DMS250 test result is graphically presented in the Figure 5 below, with all other 5.56mm DMS test results for comparison. The DMS250 test lithium recovery is approximately 4% less than the DMS100 result at equivalent lithia grade of 6% (SC6.0). The recovery reduction in the larger scale test is more than expected and upon closer examination the mass reporting to the final DMS stage of the test was far greater than the mass reporting to the DMS100 test final DMS stage. Consequently, the efficiency of this final DMS20 separation stage was less efficient than the DMS100 tests. Minor DMS250 test parameter changes will rectify the over representation of mass to the first DMS stage and optimization is expected to reduce the recovery difference with the DMS100.
For
per
sona
l use
onl
y

12 | P a g e
Figure 5: DMS100 and DMS200 – Grade Recovery test results
Only iron oxide impurity in the DMS250 test spodumene concentrate is presently available for reporting and is presented at Test Description ‘4’ with other 5.56mm crush DMS test spodumene concentrate assays in Table 5 below.
Test Description
Recovery Grade
Li2O Li2O Fe2O3 Mica F
(%) (%) (%) (%) (g/t)
1 DMS100: 5.56mm, 2.95SG 59.8 5.8 0.50 2.7 59
2 DMS100: 5.56mm, RC, 2.9SG 60.9 5.9 0.45 2.1 82
3 DMS100: 3.35mm, RC, 2.9SG 62.8 6.0 0.44 1.7 NA
4 DMS250: 5.56mm, 2.9SG 59.6 5.8 0.49 NA NA
Table 5 - DMS100 and DMS250 Beneficiation Results The larger scale DMS spodumene concentrate iron oxide concentration is similar to the lab-pilot scale DMS100 tests at 0.486% Fe2O3, which is still well within SC6.0 concentrate iron limits. F
or p
erso
nal u
se o
nly
13 | P a g e
SECONDARY BENEFICIATION PROCESS TESTING Secondary beneficiation process testing is not part of the Phase 1 metallurgical testing program because early testing has focused primarily on DMS recovery of spodumene. This will be undertaken in the Phase 2 metallurgical test work program.
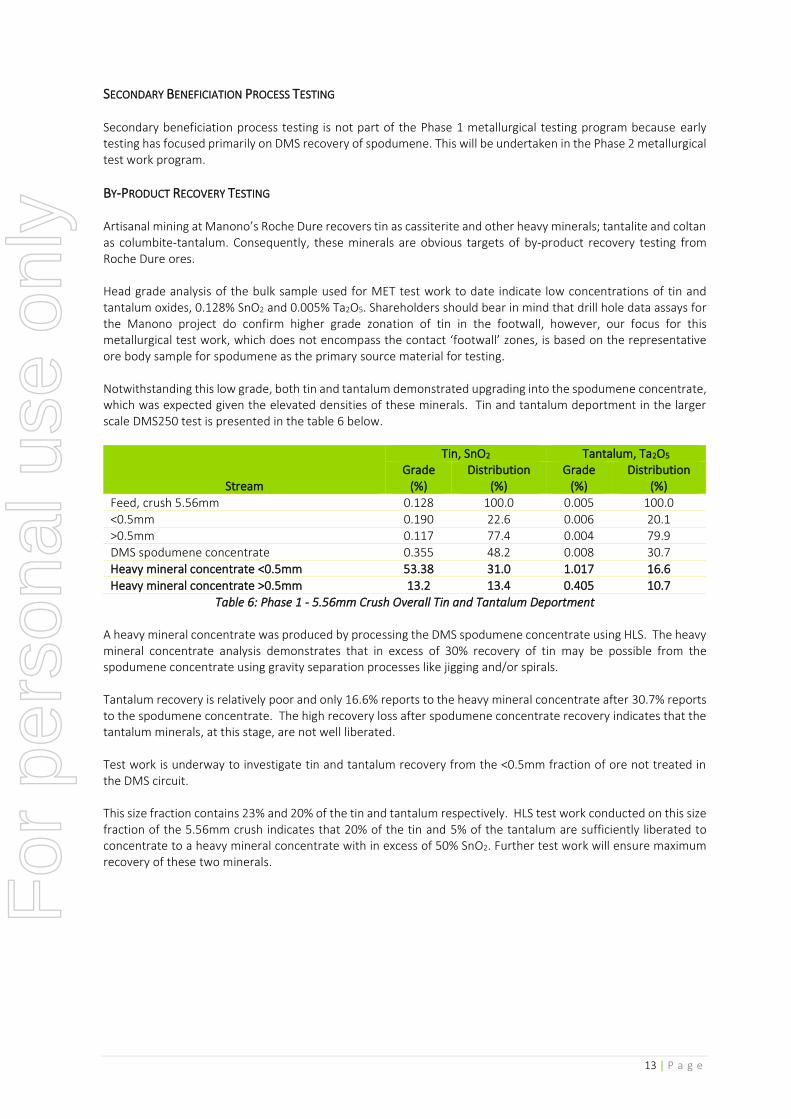
BY-PRODUCT RECOVERY TESTING Artisanal mining at Manono’s Roche Dure recovers tin as cassiterite and other heavy minerals; tantalite and coltan as columbite-tantalum. Consequently, these minerals are obvious targets of by-product recovery testing from Roche Dure ores. Head grade analysis of the bulk sample used for MET test work to date indicate low concentrations of tin and tantalum oxides, 0.128% SnO2 and 0.005% Ta2O5. Shareholders should bear in mind that drill hole data assays for the Manono project do confirm higher grade zonation of tin in the footwall, however, our focus for this metallurgical test work, which does not encompass the contact ‘footwall’ zones, is based on the representative ore body sample for spodumene as the primary source material for testing. Notwithstanding this low grade, both tin and tantalum demonstrated upgrading into the spodumene concentrate, which was expected given the elevated densities of these minerals. Tin and tantalum deportment in the larger scale DMS250 test is presented in the table 6 below.
Stream
Tin, SnO2 Tantalum, Ta2O5 Grade
(%) Distribution
(%) Grade
(%) Distribution
(%)
Feed, crush 5.56mm 0.128 100.0 0.005 100.0
<0.5mm 0.190 22.6 0.006 20.1 >0.5mm 0.117 77.4 0.004 79.9
DMS spodumene concentrate 0.355 48.2 0.008 30.7
Heavy mineral concentrate <0.5mm 53.38 31.0 1.017 16.6
Heavy mineral concentrate >0.5mm 13.2 13.4 0.405 10.7
Table 6: Phase 1 - 5.56mm Crush Overall Tin and Tantalum Deportment A heavy mineral concentrate was produced by processing the DMS spodumene concentrate using HLS. The heavy mineral concentrate analysis demonstrates that in excess of 30% recovery of tin may be possible from the spodumene concentrate using gravity separation processes like jigging and/or spirals. Tantalum recovery is relatively poor and only 16.6% reports to the heavy mineral concentrate after 30.7% reports to the spodumene concentrate. The high recovery loss after spodumene concentrate recovery indicates that the tantalum minerals, at this stage, are not well liberated. Test work is underway to investigate tin and tantalum recovery from the <0.5mm fraction of ore not treated in the DMS circuit. This size fraction contains 23% and 20% of the tin and tantalum respectively. HLS test work conducted on this size fraction of the 5.56mm crush indicates that 20% of the tin and 5% of the tantalum are sufficiently liberated to concentrate to a heavy mineral concentrate with in excess of 50% SnO2. Further test work will ensure maximum recovery of these two minerals.
F
or p
erso
nal u
se o
nly

14 | P a g e
IN CONCLUSION Further test work (Phase 2) is being executed to finalise the metallurgical test work program for our planned operations However, AVZ has achieved the following to date:
• Completed comminution test work demonstrating crushing energy, rock competency and abrasion
qualities similar to the other economic hard rock lithium ores.
• Completed successful HLS test work to characterize the material. HLS test work demonstrating that
spodumene liberation improves with decreasing crush size. A crush size of 10mm does not provide
enough liberation to be considered as a viable crush size for DMS testing.
• Completed DSM100 test work at 5.56mm and 3.35mm crush sizes with excellent liberation of spodumene
at crush sizes at or below 5.56mm.
• Completed some Reflux Classifier test work for removal of Mica from the product stream, with good
success, to a <2% Mica level.
• All DMS and HLS test spodumene concentrate contained iron concentrations well below SC6.0
specification of 0.8%Fe2O3.
• An SC6.1 product has been produced using the DMS250 laboratory test equipment with the following
data: Crush size 5.56mm: Recovery 55%: SC6.1% and 0.48% Fe2O3.
• DMS concentrate Fluorine concentrations were low, which is likely due to the very low mica
concentrations also in the concentrate.
• Examination of DMS250 concentrate has identified that the tin mineral is well liberated and can be
collected to a heavy mineral tin rich concentrate.
TO SUMMARISE Pegmatite is extracted from open pits using traditional mining techniques. Drilling, blasting, shovels and trucks are used to extract broken pegmatite ore which is then mechanically crushed to reduce its size through a multi staged crushing process. A DMS plant can then be used to produce a spodumene concentrate at a specific crush size. Various “add-ons” can be inserted into the process flow sheet to augment cleaning of the product such as ore sorters, magnetic separation and optical sorters. AVZ will complete further test work associated with iron reduction and improved product characteristics during the Phase 2 metallurgical test work. The crushed ore can be further milled to produce a finer sized product, which is more suitable for further separation in flotation cells. The <0.5mm fines will also provide an excellent source of material for use in flotation test work and ultimately spodumene concentrate production. In these cells, the various other minerals, including quartz, feldspar and micas, are removed. In some cases, an Up Current or Reflux Classifier is used to remove minerals such as mica prior to flotation cell concentrators. These processes, either singularly or together, result in the formation of a spodumene concentrate which can be either sold for direct application in the manufacture of glass and ceramics or further chemically processed to create lithium carbonate or lithium hydroxide for use in lithium ion batteries. Although there are a number of processes for further treatment of spodumene concentrate, they all begin with lithium extraction from ore followed by chemical conversion and then purification. AVZ has, with this initial metallurgical information, moved to develop a DMS only (Stage 1) processing circuit for initial concentrate production at Manono. A simple, robust and industrially proven DMS only lithium recovery circuit is expected to be economically feasible. However, notwithstanding this approach, AVZ is actively pursuing a staged development approach to add a secondary beneficiation circuit later in the project life as better technical understanding of secondary beneficiation avails. This will include a Flotation circuit (Stage 2) and finally a Stage 3 Hydroxide plant, should economic conditions prevailing at the time support it.
For
per
sona
l use
onl
y

15 | P a g e
Secondary beneficiation does have some technically challenging processes and despite the possible improved lithium recovery, the complimentary technical complication may not be economic until better technical understanding is achieved in time, through further ongoing test work of product sourced from the mining and processing operations in Stages 1 and 2. Many current producers have seen their process flow sheets include crushing, DMS, Flotation and Hydroxide plants as a single implementation, only to see disaster strike with ongoing underperformance and financial burden. AVZ believes that a staged approach and intensive test work of material prior to installing each further Process Flow sheet component, is the safest and most logical way to advance Manono to its full potential.
Yours sincerely, Nigel Ferguson Managing Director
Competent Persons Statement
The information in this document that relates to metallurgical test work results is based on, and fairly represents information complied and reviewed by Mr Nigel Ferguson, a Competent Person who is a Fellow of The Australasian Institute of Mining and Metallurgy and Member of the Australian Institute of Geoscientists. Mr Ferguson is a Director of AVZ Minerals Limited. Mr Ferguson has sufficient experience that is relevant to the style of mineralisation and type of deposit under consideration and to the activity being undertaken to qualify as a Competent Person as defined in the 2012 Edition of the “Australasian Code for Reporting of Exploration Results, Mineral Resource and Ore Reserves”. Mr Ferguson consents to the inclusion in this document of the matters based on this information in the form and context in which it appears. Refer to ASX announcements dated 5th and 13th August 2019, 16th September 2019 and 9th October 2019 for the full detail of the metallurgical test work results.
For
per
sona
l use
onl
y