avradcom itechnical report o eotapri qe1. (stops) flight test reportj um siulation team 11....
TRANSCRIPT

AVRADCOMITechnical Report -79-1
----- -LEVEL
I STABILIZED TERRAIN OPTICAL POSITION SENSOR STOPS
SI FLIGHT TEST REPORT
Christos M. Tsoubanos
AVIONICS RESEARCH & DEVELOPMENT ACTIVITY
CL-I
ui
I January 1979SDIC
SD I STR I BUT ION STATEMENT
I Approved lor public release: E M• in"•,distribution unlimited, g 2
Research and Development Technical ReportAviation Research and Development Command
17 10
- ----------
NOTICES
Mdaiucmers
The citation of trade names and names )f manufacturers in
this report in not to be construed as official Governmenti-dOrleement of appeoval of eommerciel Producta or servicesreferenced herein.
Dispositlen
Destroy this reort When it is no longer needed. Do notraturn it to the origisatr.
.1

1k, UNCLASSIFIEDSECURITY CLASSIFICATION OF THIS PACK (MRb. D~at £Awfors
READ INMTUCTIONSREPORT DOCMIENTATION PAGE BZOR CQOfPt G FORK
-' ~VRACONTR-7-1 GOT ACESSION NO. 3. RECIPIENT'S CATALOG NUMBER
'Stabilized Terrain Optical Position Sensor1 . TYE O EOTaPRI QE1.(STOPS) Flight Test ReportJ UM
Siulation Team
11. CONTROLLING OFFICE NAME AND ADDRESS TU 1Headquarters7USA Avionics Research & Development Activity 1S RO AK-; -\Fort Monmouth, New Jersey 07703 4
14. MONITOPING AGENCY NAME & ADDRESS(II different from Crotntrollng Office) 1S. SECURITY CLASLTS. r Q
UNCLASSIFIED
1So. DECL ASSI FICATION/ DOWNORAXINO
16. DISTRIBUTION STATEMENT (at91 Oheoo"")
Approved for public release; distribution unlimited
17 I. DIST RIGU rCON ST ATEMEN T (of the abstract entered In Block 2t4. It different from Roepdr) 55W
Io. SUPPLEMENTARY NOTES
1S. KEY WORDS (Contlowe on, reverse side If eceea7r ond Identify by block nomabor)Hover Sensors Night Vision Systes
7PNVS Symbology FIHover Systems Dsly
Ujj. TWACT (Centlnue an mvorse sd it~ If nocoanpmd Idea"& Or b"eh et
This report presents the flight test results and evaluation of a brass-
The braisfbo- %del of the self-contai-cz-, absolut *, position sensor referredas Stabilixt. T9errain Optical Position Sensor (STOP31) was successfully installeand flown on the Avionica Research and Development Aitivity's Experimental Ve-hicle for Avionics Research (EVAR) project helicopter.
(OVER)
,IIA )' )ASECURITY CLPEFCATIVI OF TIMIS P1111106
-7-

_ VAVCLASS PICATION OF -THS4 PA911111i .aja Mboin
The results derived from the test indicate that position radial &ccuraciesof better than 5 feet can be exp~ected at constant (60 feet AGL) altitude. Formission maneuvers such as the bob-up and rems k, designed for the MEH, positionradial errors are in the order of 10 to 20 feet.
kA
MCLAUV

TABLE OF CONTENTS
Page
1. INTRODUCTION 1
2. SYSTEM DESCRIPTION 3
3. FLIGHT TEST EFFORT 10
4. FLIGHT TEST RESULTS 26
5. CONCLUSIONS/OBSERVATIONS 47
6. RECOMMENDATIONS 48
TABLES
1. FLIGHT TEST MATRIX 21
2. APPROACH TO A HOVER AREA 39
FIGURES
1. Present system 1
" 2. Present pilot presentation on TV monitor 23. Proposed system 24. Proposed pilot presentation on TV monitor 2
t 5. Gimbal-mirror assembly (with shroud removed) 46. Gimbal-mirror signal drive di&aram 57. STOPS TITED symbol generator 68. STOPS transition and/or hover displayed symbology 79. Block diagram of complemented velocity generation
with time varying time constants 910. STOPS FOV diagram 1111. Electronic image inversion 12
12. Pilot mirror control unit 1313. EVAR showing sensor location 1414. STOPS brassboard mocel 1615. Lightweight doppler navigation system 1716. Daylight Random Scene Motion Sensors 1817. V/R IR sensor 1918. Sample of computer data printout 23-2519. Cell 1 - stabilized mirror with symbology (hover radius
cumulative histogram) 2720. Cell 1 - stabilized mirror with symbology (hover radius
statistics) 28
-. J~70 9.44
Page
21. Cell 1 -- stabilized mirror with symbology (altitude meanand standard deviation) 30
22. Cell 2 - unstabilized mirror with symbology (hover radiuscumulative histogram) 31
23. Cell 2 - unstabilized mirror with symbology (hover radiusstatistics) 32
24. Cell 2 - unstabilized mirrpr and symbology (altitude meanand standard deviationi) 33
25. Cell 3 - front seat (VFR) performance (hover radius cumula-tive histogram) 35
26. Cell 3 - front seat (VFR) performance (hover radius statistics) 3627. Cell 3 - front seat (VFR) performance (altitude mean and
standard deviation) 3728. Cell 4 - stabilized mirror, no symbols, constant altitude
(hover radius cumulative histogram) 3829. Cell 5 - approach/transition to a hover (hover radius cumula-
tive histogram) 4030. Cell 5 - approach/transition to a hover (hover radius statistics) 4231. Cell 5 - approach/transition to a hover (altitude mean and
standard deviation) 4332. SpeciaL runs constant altitude (hover radius cumulative
histogram) 4433. Flight control displacement 4534. Standard deviation of helicopter attitude 46
iii
24~
V
'- ~ " - -P
1. INTRODUCTION
This report presents the flight test effort for the Stabilized Terrain
Optical Position Sensor (STOPS) project. The STOPS brassboard gimbal was in-
tegrated into a hover system and waa successfully flown on the Experimental
Vehicle for Avionics Research (EVAR) project helicopter of the US Army Avionics
Research and Development Activity, Fort Monmouth, New Jersey.
a. Background. The STOPS was envisioned as a self-contained position
sensor and obstacle clearing device for helicopters equipped with a night vis-
ion system such as a Forward Looking Infrared (FLIR) or a Los: Light Level TV
(LLLTV). The tactikal deployment of Army helicopters such as the Advanced
-Atack Helicopter (AAH), Advanced Scoui Helicopter (ASH), MEDEVAC, etc., dur-
ing night operations will require some visual means for obstacle clearance and
possibly a self-contained hover aid device.
A concept was formulated which provided this capability. Assuming a
night vision sensor with a field-of-view (FOV) of 450 by 600 is rigidly moun-
ted near the nose of a helicopter, the presentation of the image on a panel
mounted display (PMD) appears as shown in Figures 1 and 2. Given this condi-
tion, by inserting a mirror in the upper portion of the FOV (Figure 3) and
"with the appropriate image reinversion (electronically performed), the STOPS
concept is achieved and the presentation is as shown in Figure 4. This. pres-
entation allows the pilot to see in front as well as beneath the helicopter.
A simulation ensued which demonstrated the potential of the conceptual sys-
tem.1 This was later followed by a flight test simulation of STOPS 2 on the
Research Aircraft Visual Environment (RAVE) project helicopter.
Figure 1. Present system
1A report on the FY-74 Avionics Ia-House Laboratory Independent Research
(ILR), "Stabi•ixzed Terrain OptiaaZ Position Sensor (STOPS), ECOM-4283 Tech-
nical Report, December 1974.2,muaZ Precision Hover wfith Sueriposed symboZogy on FU? Imageff Hilell',
R. J.; Johnson, D. C.; Tsoubanos, C. M.; Ai.S 31st Annual National Forum,
Washington, DC, May 1975.
SKY
NORIZOI
FWD LOOKIIKTERRAIN gIJ
I IKNH T.Y. i11TOR
Figure 2. Present pilot presentation on TV monitor
PI!M to NOL
0 01 1h r
Figure 3. Proposed system
IhACE
SAMILIZED13SM LUKK OM
UCNj PLTa*t U,
~~~Figure 4.3.pmd U Popo ed sytemIH
Figure 4, Proposed pilot presentation on TV monitor
!2
Si.-
-"4.-4) C
The successful ground simulation with verification of the concept during- e flight test effort and acceptance by the test subjects encouraged the con-tinuation of the concept into the pt zurement of a brassboard model for flighttesting..
b. Objective. The objsLrtive of this flight test effort was to demon-strate the capability and potential of the STOPS brassboard model as a self-contained hover aid and obstacle clearing device.
2. SYSTEM DESCRIPTION
a. Gimballed Mirror Ass y. The STOPS brassboard niodcl was designed andbrlcate" by Actron Industries under Contract Number N62269-ý5-C-0312. Figure
5 shows the ilo-axis gimbal system. It is of conventional design and consistsof outer roll and inner pitch gimbals to which a mirror is attached. The oper-ating limits of the gimbal system are +150 in roll and +150 up to -25* down inpitch. The servc system error is less than +1/20 in roll and +1/4* in pitch.A 7- by 12-inch mirror designed to operate in the 8-14 micron Infrared (IR) re-gion is atteched to the pitch axis of the gimbal. Overall weight of the brass-board model is 47.5 lbs. The physical size of the gimbal and mirror was dicta-ted by the existing location of the FLIR and daylight TV camera within the noseof the test helicopter. The :.assboard model was designed with the added flex-ibility for switching mirror position to view either the FLIR or daylight TVinstalled at the time on the helicopter. More will be presented on this inthe aircraft installation description.
The design of the STOPS system did not include provisions for stowing themirror during normal NOE flying. This mode was discussed, but due to the in-crease in cost, the existing design was accepted. The selected standby or stowmode resulted in the mirror being parallel to the ground and positioned 60 upfrom the optical centerline of the TV camera. Thi- caused some obscuration ofthe image which was unacceptable to the pilots for Nap-of-the-Earth (NOE) fly-ing, but since NOE flights were not to be performed it did not become a majorissue. In any future eesign, the capability of stowing the mirror completelyaway from the sensor fie..d-of-view would be implemented.
The integration of the gimbal with the required electronics for the hoversystem configuration is shLvnl in Figure 6.
b. Symbol Generator. The symbol generator used in chis flight test pro-gram was a modified version of an existing analog unit flown in two previousstudies. 3 "4 This modified unit (Figure 7) the so-called STOPS Tactical Avion-ics System Simulator Integrated Trajectory ErTor Display (TITED) included theimage inverter and also incorporated the variable time constants for the com-plemented velocity and acceleration signal drive requirements. It also pro-
vided three symbology modes, enroute, approach/transition, anr hover. Of pri-mary interest during the flight test was the hover symbology with soae emphasison the approach/transition symbology mode. These symbology mAodes are describedbelow.
-+"De•veZpMt and Flight Teat Evaluation of a Self-Contained Infrared HoverI Systemi," Tsoubanos, C. M., US Army Avionics R&D Activity, Fort Monimouth, NJ,Technical Report ECOW4520, August 1977.
J 4"DoppZer Hover System," Tsoubenos, C. M., US Army Avionics R&D Activ1•:y, FortMonmouth, NJ, Technical Report AVRADA-78-10, April 1978.
3
-~ ~ A-% -.

cc
oc
1--.
0-
-J-
Figure 5. Gimbal-mirror asombly (vitzi shroud removed)4
4 .4 5,

CLU
IC,)
(~(A
I
CL 00
t- 1CI
V.-
C - U

pigure 7. STOPS TITF.D syE3bOl generator

(]) Hover Display Symbology Mode. The hover symbols u:;ed In theSTOPS evaluation are shown in Figure 8.
Acceleration (Attitude)Vector
Altitude and 0Rate of Climb
Scale •. Velocity Vector
Torque --
Reference ----- l
Al tiitude -iliHelicopter Symbol
Ground Line . Rate of Climb
"Figure 8. STOPS transition and/or hover displayed symbology
This symbnlogy represents quantitative flight information essential forexecuting a precise hover mission. In the ccnter of the display a large circlesymbolically represents the helicopter rotor and/or display reference. Heli-copter ground velocity is measured about this reference while helicopter ac-celeration is measured about the aircraft's vc-loclty vector tip. To the leftof the helicopter reference are displayed torque, rate of climb, and radar a]-
V" titude. One scale is used to reference the chree parameters. The ground linesymbol is the reference for zero altitude and zero torque. A larger horizontalline to the left of the rate of climb symbol is the reference for zero rate ofclimb. This symbology is superimposed eleLtronihally o~er a gruuiJ J-,do ..The pilot then uses the symbology to control helicopter altitude and to maintainposition over some selected ground reference. The technique for maintaining an;accurate hover using the symbology would be as follows: The pilot selects onhis video a ground (position information) reference, for example, a shrub. Heplaces the acceleration symbol on the selected reference by manipulating thecyclic. By maintaining the acceleration symbol over the reference, the heli-copter translates towards the reference. When the helicopter symbol becomescentered over the ground reference, the pilot is at the desired hover point andthe acceleration and velocity vector values become zero (in an ideal case). Ananalytical explanacion of the above technique may be found in reference 5.
While the horizontal symbolic information acceleration, velocity vector andvideo position provide the pilot the means to maintain a stable hover, thetorque, rate of climb and radar altitude assist him in accurately holding hisposition in space. Pilot manipulations of the collective allow him to see in-stantaneous torque changes, followed by vertical rates and ultimately, by
7
- -7

altitude changes. By selecting the desired altitude, the pilot can use thetorque symbol along with the rate of climb/descent and radar altitude symbolto maintain an accurate altitude.
The symbology gains selected for this flight test are similar to those de-termined in the simulator and a previous hover flight test 2 to be optimum at a50-foot altitude. They are expressed as inches of symbol movement on the dis-play per measured aircraft quantity and are as follous:
Position gain Kp W 0.08 in/ft (12.5 ft/in)
Velocity gain Kv - 0.4 in/fps (12.5 fps/in)
Acceleration (attitude) gain Ka - 0.25 in/deg (4.0 deg/in), (2.25 fps 2 /in)
Altitude (gain) Kh = 0.1 in/ft (100 it/fn)
Rate of Climb gain Kh - 0.001 in/fpm (1000 fp./iu)
Torque gain (Kq - 0.02 in/% (50%/in)
The selected gains for position, velocity, and acceleration form a secondorder critically danped symbol movement for optimum hover performance. Thegains and/or ratios between these displayed parameters are also applicable forhelicopter altitude changes, provided t.he position sensor output is constantas a function of altitude. If this is not the case, mid it would not be foran angular position sensor such as STOPS, the gains optimized for oMie altitudewould probably degrade hover performance at other altitudes. Techniques suchas a zoom lense and/or velocity and acceleation gain changes can be implemen-ted as a function of altitude to maintain the desired gain values. These tech-niques were not incorporated. A decision was made to retain the optimized gainfor a 50-foot hover altitude throughout the helicopter altitude excursions andaccept thR anticipated degraded hover performance at the other alticudeG.
(2) Approach/transition mode. The approach/transition symbology formatis identical to the hover with onlyy e exception. The velocity vector is nowscaled at 20 fps/in and is driven from the raw doppler VR and VD velocity sig-nals. All other disp Layed symbols have the same gain ussd for the hover mode.
(3) Symbol d"ive reguiremcnts. The necessary sensors to drive the sya-bology are the vertical gyro, radar altimeter, IVSI (rate-of-climb), headinggyro and Lightweight Doppler Navigation System (LUNS). The outputs of thesesensors are. processed and shaped to reduce signal noise and provide appropriategain for symbol movement.
An assumption is made that for a single rotor helicopter, translational ac-celeration may be approximated by attitude for small angles (less than 10 de-grees). Steady state trim attitude offsets are ramwed through the use of avachout filter circuit with appropriate time constants. This approach was suc-cessfully demonstrated in some previous studies2 ts and as a result was incorpor-ated in this test.
8
7 -a
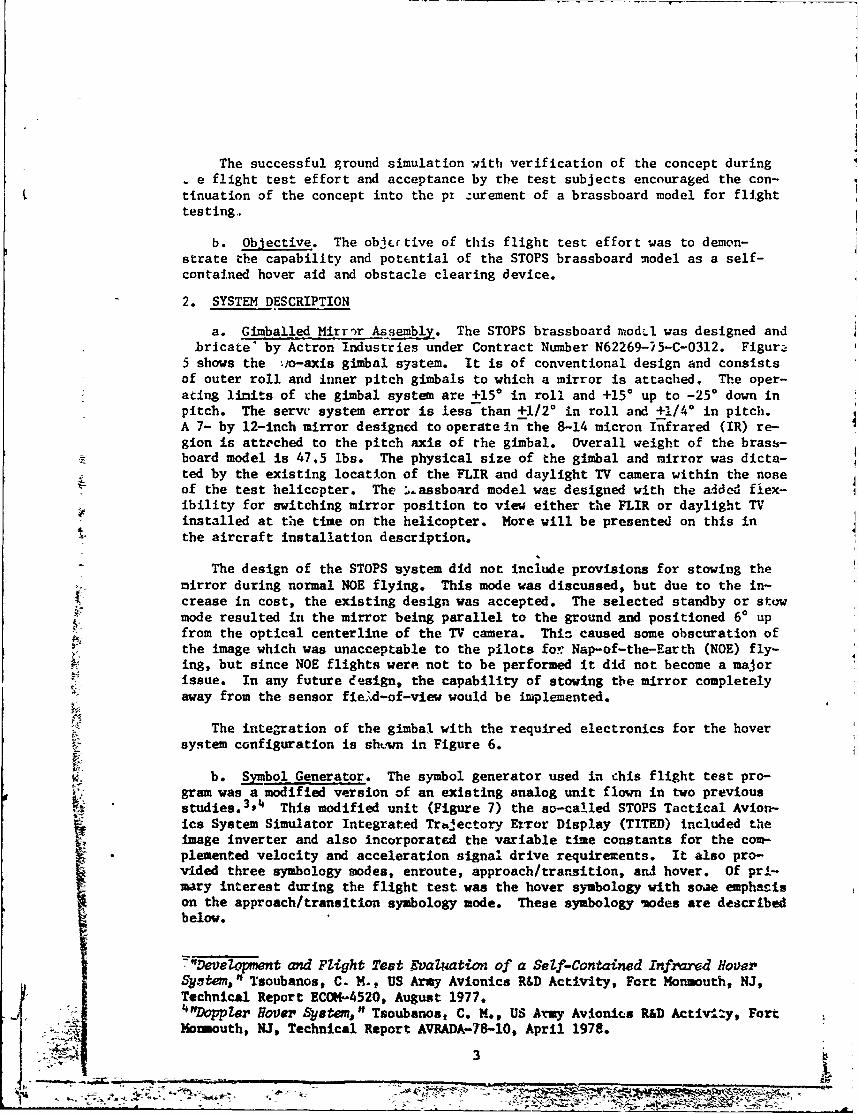
Of particular inter:est is the signal processing used to imple~nent the vel-ocity vector drive for the hover mode. The velocity vector drive is a comple-mented signal derived from the LDNS and vertical gyro5 by use of the filteringtechnique shown in Figure 9.
A variable time constant was incorporated into the processing as recommen-ded in a previous study. 5 This resulted in the velocity vector becoming a usefulparameter in less than 10 seconds after switching to the hover mode rather thanthe 30 seconds previously required. 4 To provide this, a technique was imple-mented within the symbol generator which switched appropriate vilued capacitorsinto the circuit of concern in order to vary the time constants. The followingdiagram (Figure 9) shows the complementary velocity source and the variabletime constants.
APPROACH/TRANS It"IONVELOCITY 20 FPS/IN
10 RAD/SEC HOVER
V H, K1 TI VELOCITYutOPPLER PSSz S + 10
0.4 IN/FPS(2.5 FPS/IN)
GYO.IVALT FROM 0,3STO
10.0 SEC IN T
S10 RAD/SEC 10. EC
PAS "LW K3 T3 S K2 r
SFILTER Tr3 S + I T2 S + 1
WHERE ACCELERATION (ATTITUDE)Kv = K2 - K,2 =0.4 INiFPS) (2.5 FPS/IN) 2K4 DEG/IN = 0.44 IN/FPS2 (2.25 FPS /IN)
Ka = K3 = 0.25 IN/DEG (4.0 DEG/IN)
Figure 9. Block diagram of complemented velocity generationwith time varying time constants
5T7acROa Hover Under NOR Cmditiona," SHUPE, N. K.; Clark, R. F.; AM Sympo-siu, Fort Momouth, NJ, April 1976.
9
-M -

The above selection allows the doppler to provide velocity at frequenciesbelow 0.1 rad/sec and the psuedo integration of the attitude provides velocityabove 0.1 rad/sec.
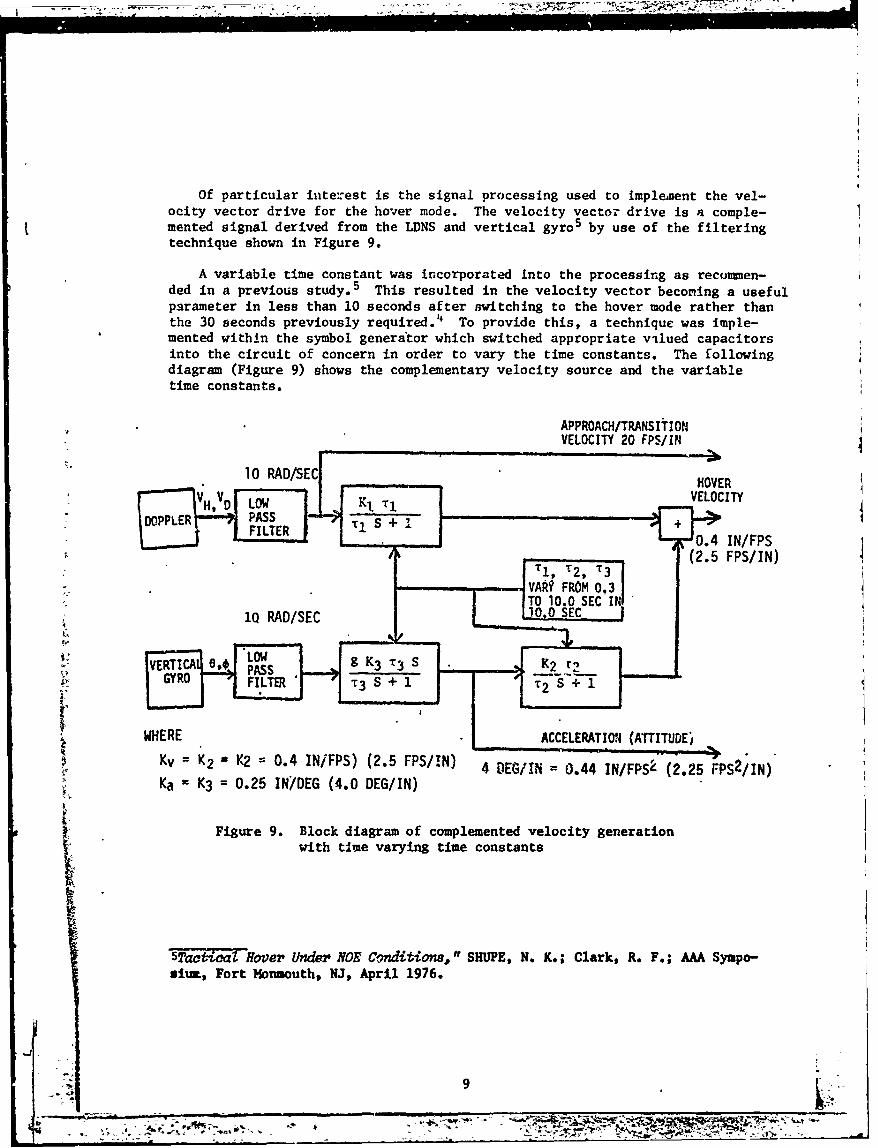
(4) Mirror ,mase inverter. One of the design problems with the STOPSconcept which had to be solved was the inversion of the fore-aft doenlookingimage due to the mirror. The diagram of Figure 10 shows the two fields-of-viewof interest labeled "A" and "B." Field-of-view "A" is the ome which requiresreinversion. This particular problem could have been resolved by using a prismor other means, but would have restlted in a large and complex system. There-fore, the mirror image re-inversion was performed electronically.
The reinversion of the Image, to a normal view as would be seen throughthe chin bubble of a helicopter, w&s performed on the vertical sync signal ofthe TV monitor. This modification splits the vertical ramp signal in half.Half the ramp is used for a normal presen:ation. The other half of the ramp isinverted. This inverted ramp iz used to correct for mirror Image inversion.Figure 11 illustrates the reinversion.
Figure lla shows the normal TV iW* as it would be seen with the mirrormounted in front of the camera. (See 7fgure 10 for portion of Innaer field-of-view labeled "P' and "B".) The typial1 vertical rip is shown on the right.
On Figure llb, the two images, forward and downlookbg are relocated tomake them normal to an out of the cockpit view, but the downlooking image hasyet to be corrected. The modified ramp for this relocation is shown on theright.
Figure llc shows the image that would be seen through the chin bubble, aswell as the cockpit window. The verLical ramp inversion iU also shown.
c. Pilot's Mirror Controx Unit. While the pilot navigated to the hoverpoint, the mirror was in the ozowet position. At the specific hover area, teused the Pilot's YZrzor Control Unit to activate STOPS. This automaticallypositioned the mirror at an angle in front of the Imaging sensor to look direc-tly beneath the nose of the helicopter. It also actirated the Image invertercircuitry and turned the in-bology Ca which resulted in the presentation of thesplit image with superimposed symbology on the TV monitor. In addition to thesefunctions, the mnit also had a mirror pitch and ron bias control. This biasoption allowed the pilot to change the attitude of the mirror to check forground obstccles beneath the aircraft before actual movement of the helicopterwas made. A picture of the Pilot's Mirror Control Unit (PMCU) installed on theRVAR third station left side consle is shown in Figure 12.
3. FLIGHT TEST EFFORT
The flight test vehicle fcr this program was the Experimental Vehicle forAvionics Resg-rch (EVAR) project helicopter. A cutaway view of the helicopter
and the location of the various s•nsors are shown In Figure 13. A descriptionof the helicopter, a Marine CE-53A Model, sad its avionics subsystems may befound in Reference 1. For this flight test progrm, the STOPS brasboard modeland ancilliary hardware had to be ins=,*ied on the helicopter. A descripticn ofthe ancilliary hatdriare and system installation follows.
J "o 10
-P

zz
0m
Fiur 1, TOS OVdizr
qlý- _Q
tAMIN PULSES
DOVVNILOOKING 0oIMAGEIf'IERTEDFORWARD BIMAGE _-____ +÷IVa)
0FORWARDBIMAGEDOWN +6V.
LOOKING ,IMAGEINVERTEDb)+2
FORWARDBIMAGE BSTABILIZED gvDOWN
_A
LOOKING I-- -- - I. +12IMAGE C) mw AUsiII
Fiture U. Iloctromic Una lmtavic
12

CIT
4L
131
Figure -12. Pilo miro cotolui
__ -~4 - 13

I 4
Fiur 13. E.ATown et octo
U U,

a. Hardware Installation. The STOPS Gimbal was designed as stated earlierto be used with either a FLIR or daylight TV system. In the absence of a FLIR,
L the daylight TV camera was used to provide the imagery. A picture of the in-stallation is shown in Figure 14.
The installation was accomplished by Naval Air Development Center (NADC)project support personnel. No mechanical installation problems were encounter-ed. A major area of concern was the helicopter vibration environment and thepossible wind loading on the gimbal due to the rotor downwash. The cover andthe mounting plate, designed by NADC, were adequate to eliminate any downwasheffects and to reduce any apparent gimbal system vibrations. After the in-stallation, checkout and calibration was accomplished in a short time. Duringthis checkout, it was discovered that as the helicopter altitude increased togreater than 150 feet, some jitter was visible on the STOPS image. By increas-ing the servo gain on the STOPS gimbal, the jitter was eliminated.
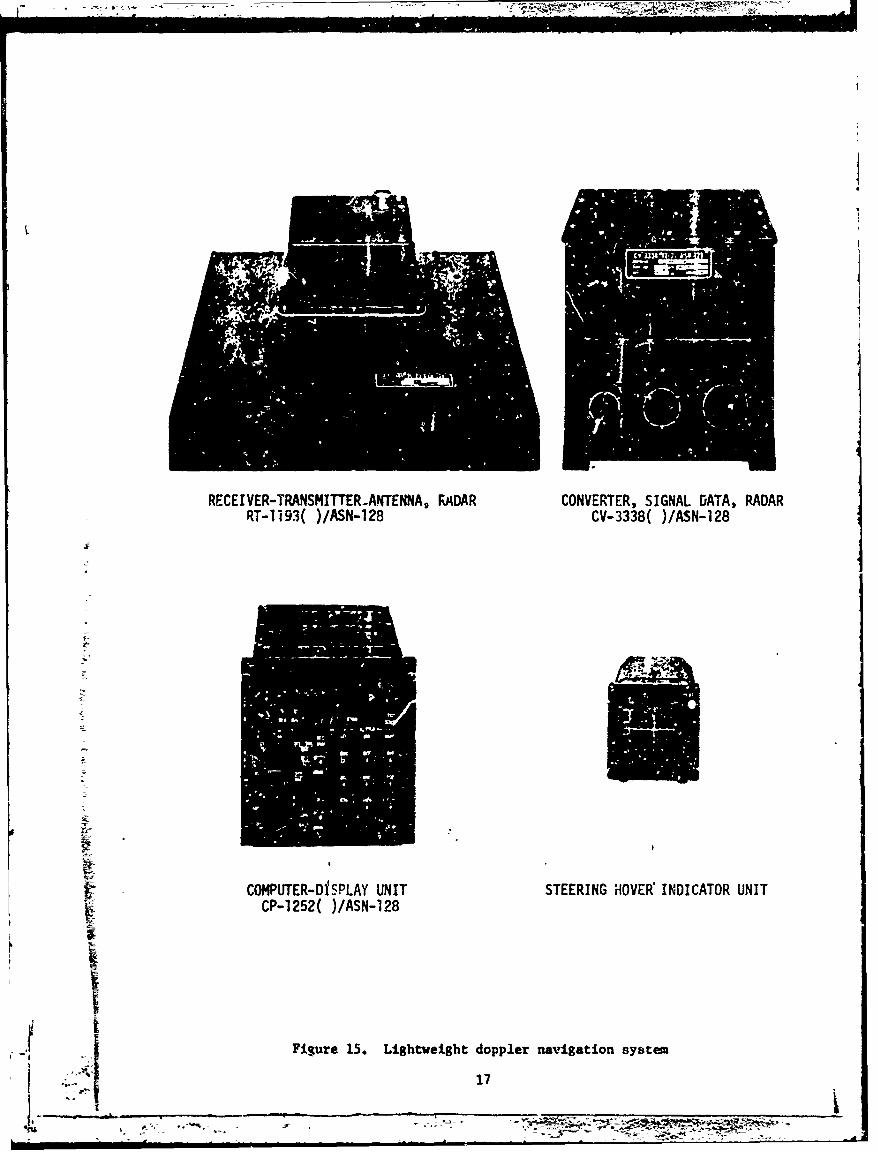
(1) Lightweight Doppler Navigation System (LDNS). The Singer Kear-fott LDNS (Figure 15), was used in this flight test program to provide the lowfrequency velocity component required for the velocity vector. No installationdifficulties were encountered since it has been previously installed on theEVAR project helicopter. 4 However, some grounding problems were encounteredbetween the LDNS and the symbol generator, but were easily remedied.
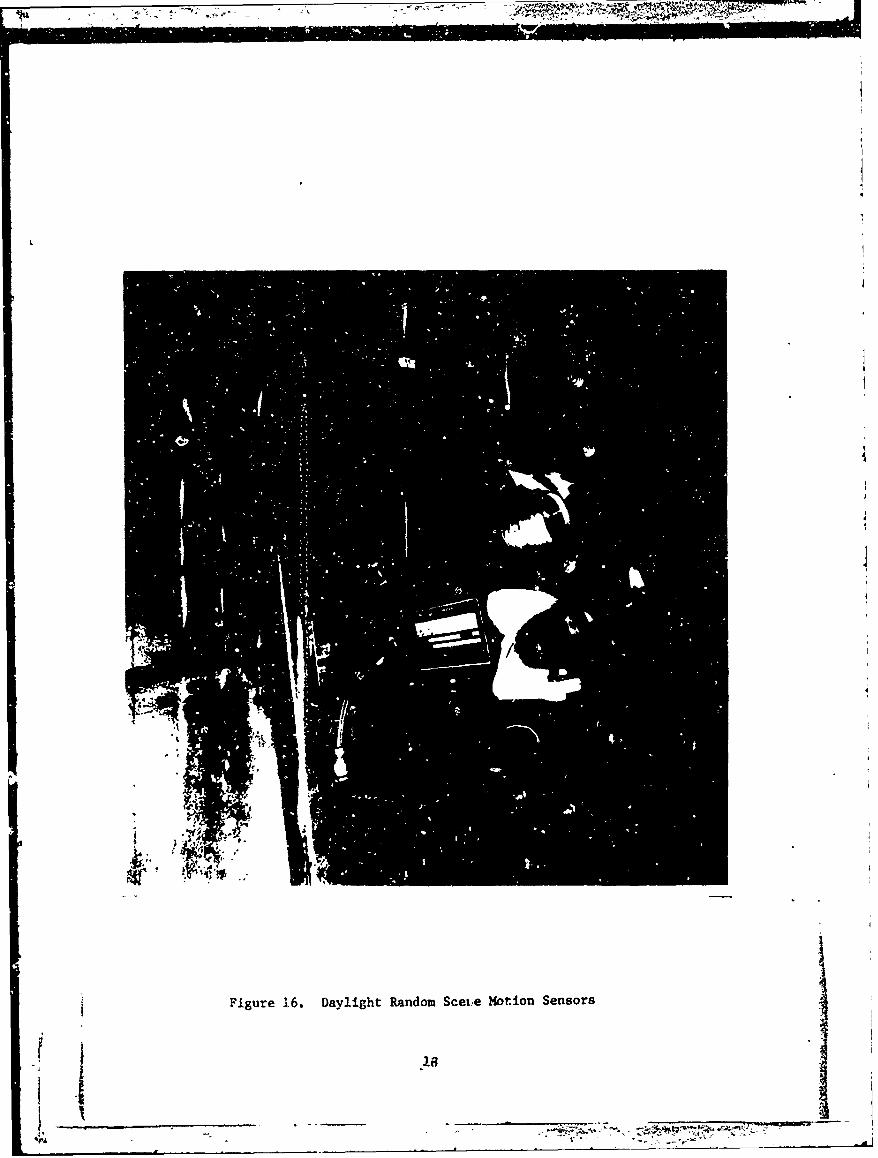
(2) Actron daylight velocity sensors. The Actron Model HG-453, Ran-dom Scene Motion Sensors (RSMS) 2 , convolution-type electro-optical sensors,were rigidly mounted on a plate in the "cargo hook well" (Figure 16) of theproject helicopter. It was the inteition to use these sensors, after the heli-copter angular rates were subtracted out, to provide backup velocity informa-tion for the velocity vector in the absence of the Lightweight Doppler Naviga-tion System (LDNS). In the initial -:heckout, it was discovered that the RSMSsignal was of poor quality and contaLned an offset, which could not be readilycorrected. Due to the flight schedule constraints, little time was allocatedin troubleshooting to correct the RSMS sensor problems and the effort was de-leted from the flight test.
(3) V/R IR sensor. A single axis velocity/range (V/R) infrared sen-sor procured by NADC from Actron Industries 3 for a Navy application was in-
L stalled in the cargc "hook well"- (Figure 17). Its output signals V/R, trackand fail states were made available for recording for future analysis. The,sensor was flown by NADC project personnel over ships at various helicopteraltitudes and speeds. The objective was to collect IR sensor data to evaluatethe device for the specific Navy application.
b. Instrumentation/Data Collection. All signals required for the hoversymbology and others such as the helicopter angular rates and flight controlscyclic, collective and pedal positions were made available for recording pur-poses.
(1) Data Acquisition Unit (DAU): The EVAR onboard DAU 2 was used torecord the following helicopter parameters: pitch, roll, heading, pitch rate,roll rate, yaw rate, cyclic, collective, pedal position, torque, radar alti-tude, and rate-of-climb. In addition to these, the doppler analog velocity out-puts from the Steering Hover Indicator Unit (SHIU), VH, VD, and VV, the STOPSmirror, pitch and roll feedback cignals and the RSMS signals were also recorded
r for the data reduction phase of the program.
-Vi5

i
Figure 14. STOPS brassboard model
!- 1 161 _ __ _
'I _____________ - --
RECEIVER-TRANSMITTER-ANTENNAo RADAR CONVERTER, SIGNAL DATA, RADARRT-1193( )/ASN-128 CV-3338( )/ASN-128
-COMPUTER-DfSPLAY UNIT STEERING HOVER'INDICATOR UNITCP-1252( )/ASN-128W
Figure 15. Lightweight doppler navigation system51 17
* - -
-- I
4' �
FIgure 16. Daylight Random Scexe Motion Sensors
f j 16
I _______ ____________________ _____________________________
* *-4-*�.-'� -

Figure 17. V/lI IR sensor
19 -7
(2) Video Po..ition Recording System (VPRS). To record the pilothover performance, the downlooking TV camera system as described in Reference4 was utilized. A l-s cond code pulse of a 5-KHZ tone was recorded on theaudio track of the vid, o tape for synchronizing the DAU and this tape duringthe data reduction pha :e.
c. Flight Test D. sign Plan. The Flight Test Design Plan for evaluatingthe STOPS model with the hover symbology Lnd various maneuvers was based onthe experience and results of the TASS simulation1 and the RAVE flight test ef-fort. 4 The design plan further included the implementation of an approach toa specified hover point and completion of the prescribed hover maneuver. Theplan included some tactical hover missions which were conducted at IndiantownGap, PA.
(1) Missions. Two mission maneuvers were flight tested: a "bob-up"/remask, and an approach/transition to a hover. The "bob-up"'/remask maneuversare typical AAH or ASH maneuvers. The "bob-up" maneuver allows the helicopter,from a position masked by natural or man-made features, to increase its alti-tude to a sufficient height to engage a target. The remask maneuver allowsthe helicopter to rapilly descend to masked altitude to avoid enemy detection.The approach/transitioi to a hover maneuver was included in the test to deter-mine pilot ability to fly the helicopter using the symbology and STOPS imageryto a selected area and initiate a hover. This maneuver had not been success-fully flown in the earlier hover flight test programs 2 4.
(2) Cell selection. Using the above two mission maneuvers, the fol-lowing cells were selected and flown by the subject pilots.
Cell l.- Stabilized mirror with hover aymbology. This cell con-tained the split screen TV image and hover symbology. The STOPS image was sta-bilized in pitch and roll.
Cell 2 - Unstabilized mirror with hover symbology. This cell issimilar to Cell 1 with the exception that the STOPS gimbal does not compensatefor aircraft pitch and roll attitude changes. Thus, the STOPS image is un-stabilized.
Cell 3 - Front seat hovers. This is a baseline cell of the sub-ject pilot performance while flying the helicopter from the front seat or nor.-mal visual flight rules (VFR).
Cell 4 - Stabilized mirror - no hover symbo!ogy. This cell issimilar to Cell 1 with the exclusion of the symbology.
Cell 5 - Approach/transition to a hover. This cell utilized boththe split screen and full screen for~ward-looking inagery (STOPS in standby mode)with the approach/tran ition symbology. Once the subject pilot made theapproach/transition to the hover point, then this cell became identical to Cell
I.IThe flight test m trix used for evaluation is shown in Table 1.
5 77
IUI
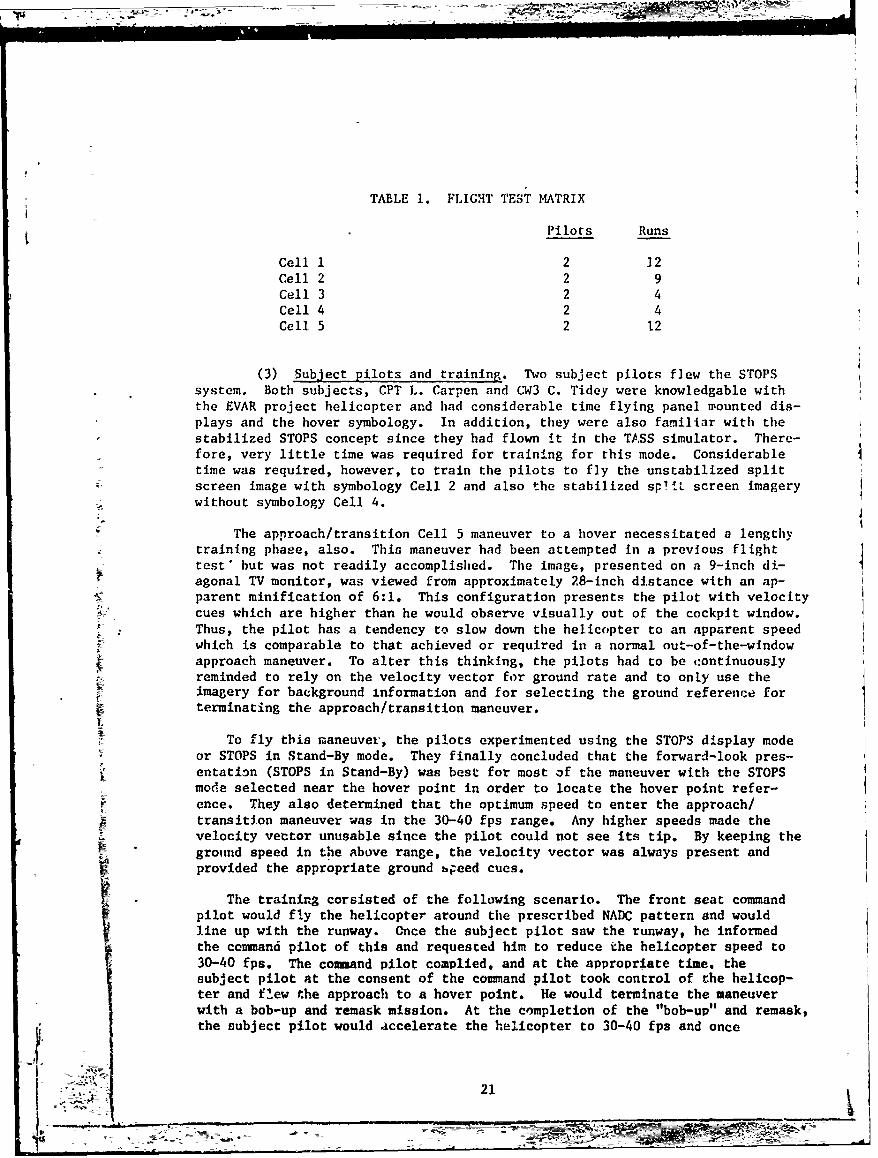
TAELE 1. FLIGHT TEST MATRIX
Pilots Runs
Cell 1 2 12Cell 2 2 9Cell 3 2 4Cell 4 2 4Cell 5 2 12
(3) Subject pilots and training. Two subject pilots flew the sropssystem. Both subjects, CPT L. Carpen and CW3 C. Tidey were knowledgable withthe EVAR project helicopter and had considerable time flying panel mounted dis-plays and the hover symbology. In addition, they were also familiar with thestabilized STOPS concept since they had flown it in the TASS simulator. There-fore, very little time was required for training for this mode. Considerabletime was required, however, to train the pilots to fly the unstabilized splitscreen image with symbology Cell 2 and also the stabilized sp"iL screen imagerywithout symbology Cell 4.
The approach/transition Cell 5 maneuver to a hover necessitated a lengthytraining phaee, also. This maneuver had been attempted in a previous flighttest' but was not readily accomplished. The image, presented on a 9-inch di-agonal TV monitor, was viewed from approximately 28-inch distance with an ap-parent minification of 6:1. This configuration presents the pilot with velocitycues which are higher than he would observe visually out of the cockpit window.Thus, the pilot has a tendency to slow down the helicopter to an apparent speedwhich is comparable to that achieved or required in a normal out-of-the-windowapproach maneuver. To alter this thinking, the pilots had to be continuouslyreminded to rely on the velocity vector for ground rate and to only use theimagery for background information and for selecting the ground reference forterminating the approach/transition maneuver.
To fly this maneuver, the pilots experimented using the STOPS display modeor STOPS in Stand-By mode. They finally concluded that the forward-look pres-entation (STOPS in Stand-By) was best for most of the maneuver with the STOPSmode selected near the hover point in order to locate the hover point refer-ence. They also determined that the optimum speed to enter the approach/transition maneuver was in the 30-40 fps range. Any higher speeds made thevelocity vettor unusable since the pilot could not see its tip. By keeping theground speed in the above range, the velocity vector was always present andprovided the appropriate ground bpeed cues.
The trainirg corsisted of the following scenario. The front seat commandpilot would fly the helicopter around the prescribed NADC pattern and wouldline up with the runway. Once the subject pilot saw the runway, he informedthe command pilot of this and requested him to reduce the helicopter speed to30-40 fps. The command pilot complied, and at the appropriate time. thesubject pilot at the consent of the command pilot took control of the helicop-ter and flew the approach to a hover point. He would terminate the maneuverwith a bob-up and remask mission. At the completion of the "bob-up" and remask,
the subject pilot would accelerate the helicopter to 30-40 fps and once
I ;°2.
again enter into a s-cond approach/transition maneuver to a new hover area, Atthe completion of this hover, the coumand pilot would fly the helicopter aroundthe pattern and position the helicopter for the subject pilot for the next
training run.
d. Flight Test Procedures. All testing was conducted at the NADC airfieldunder visual meteorological conditions during daylight hours. After obtainingrequired clearance from the NADC tower to operate in a specific area within theairfield, the command safety pilot flew the helicopter to the hover site. Whileat the hover site, the subject pilot entered the third pilot test station, andcoordinated with the command pilot to engage the 3rd station flight controls.With these engaged, the command pilot allowed the subject pilot to fly the heli-copter over some prominent ground reference, for example, the center of the air-field compass rose.
Using this as a reference, the pilot flew the appropriate cells. The on-board observer informed the test subject when to initiate the hover and timedthe run. He also informed the test subject when to enter into the InitialHover (IH) 50 feet, Bob-up (BU) 150-200 feet, High Altitude Hover (HH) 200 feet,Remask (RM) to 50 feet, and Low Hover (LH) 50 feet submaneuvers.
e. Data Reduction. Data recorded on the two tapes, one tape from the DAUand one from the video recorder, was used to determine quantitative hover per-formance for thL cells flown.
In order to reduce the data, the video tape had to be digitized. This dig-
itized data was synchronized with the DAU data and used to calculate hover per-formance. The procedure for digitizing required a Tektronix 4551 light penunit. The particular system generates X and Y voltages proportlonal to the po-sition of a lig'st pen tracking the video image. 3pecifically, an operator ini-tiated the digitizing of the vide.o information by holding the light pen on thesurface of the monitor over a selected reference point. He then allowed tnevideo recorder to replay the record i'agery of the particular data run. As theground image information changed, the observer had to manually move the 1i1htpen to follow the initial selected reference. The light pen position was iam-pled and digitized at 0.1 second intervals. The I second, modulated 5-KHzpulse recorded on the audio track was used to synchronize the computer clock tothe data tape. If the original selected point vent off the face of the monitor,the operator would select a new reference and the movement of the pen (X, Y vol-tages) to the new reference point would be incorporated in the data reduction.
Using the above technique, all video data tapes were reduced to digital for-mat. Thia new digitized tape with data samples every 0.1 second was synchro-nized with the DAU flight data for the actual ground position error computation.The reduction program written for the Doppler Hover System" Study was used toaccount for helicopter attitide, heading and altitude and to perform the sta-tistical computations.
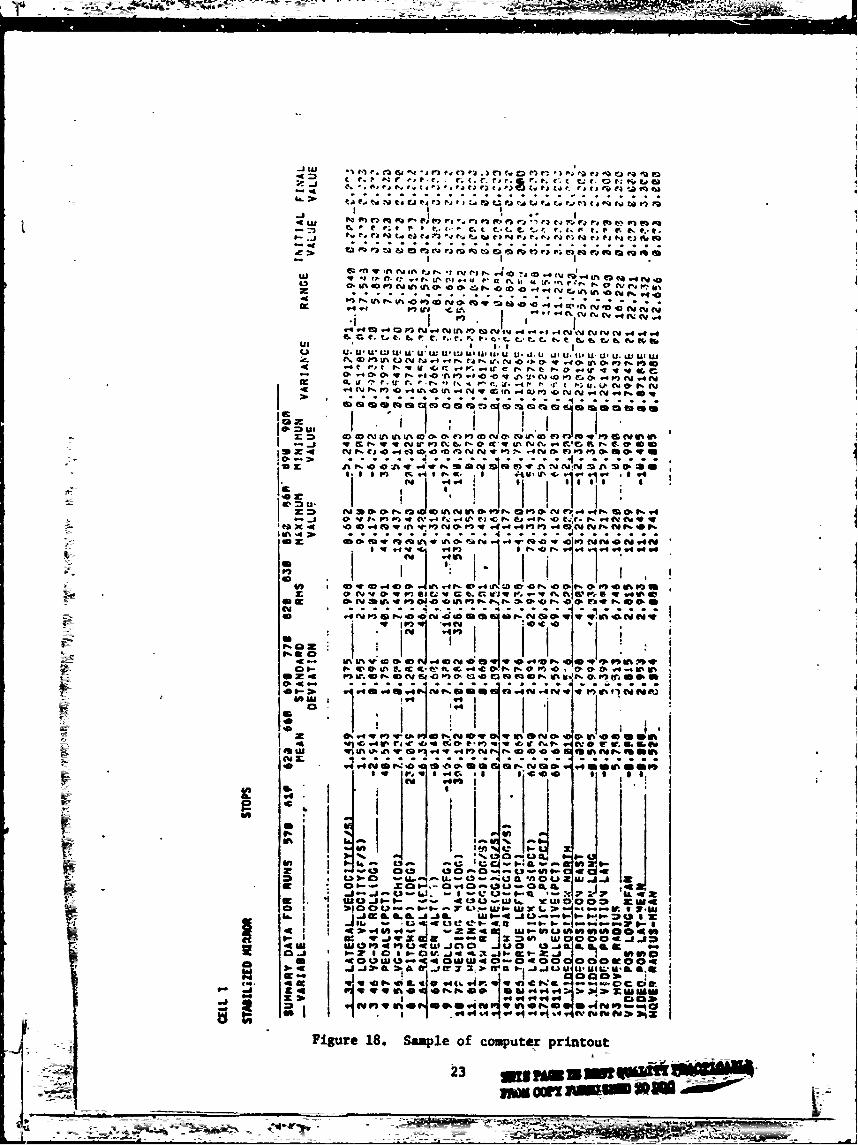
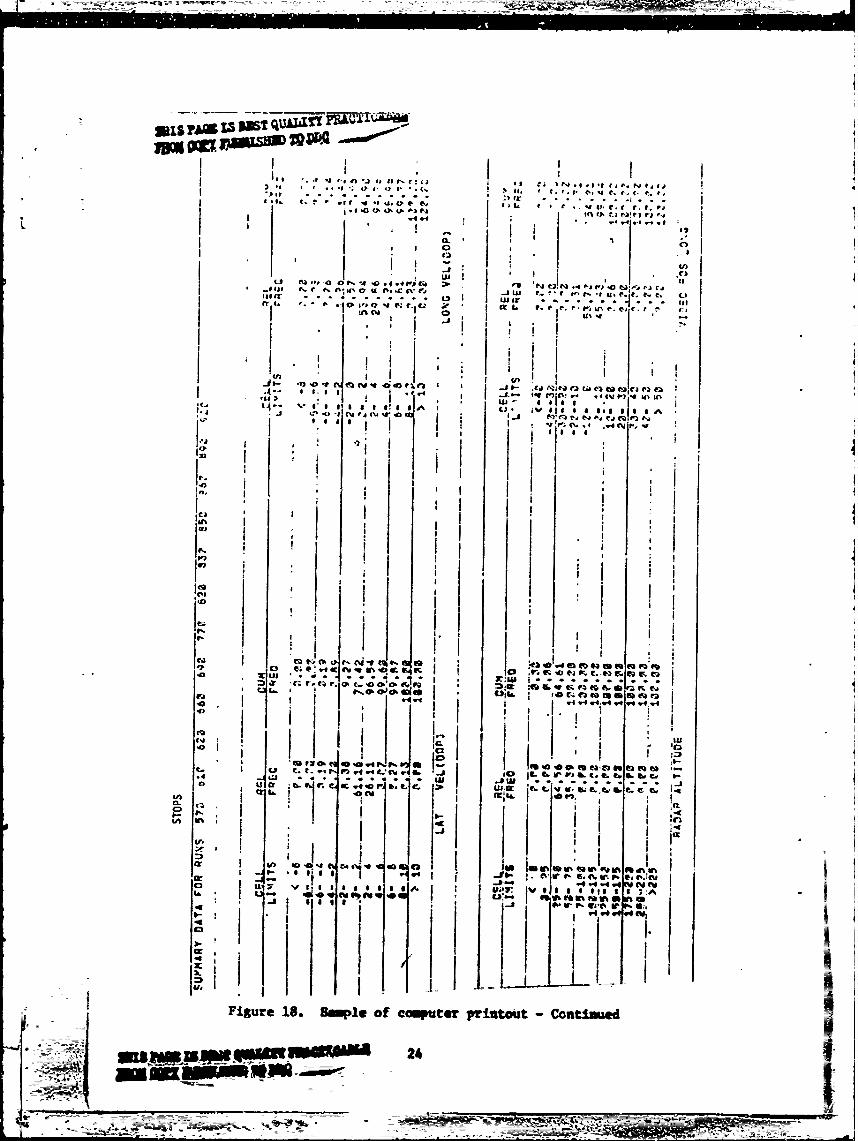
The expected error of this technique was show-in Reference 4 to be lessthan 5 feet. This error is considered acceptable. The program computed mean,standard deviation, variance, maxima, minimum, range, initial add final values.It also compites histograms of doppler velbcitles, radar altitude. hover radiusand hover radious about the mean position. A sample copy of the computer print-
out is shown in Figure 18.
4 IA:. .22
.14E -- =2s
G' CC . e- I
FI ') 7*. If% CU In P It , 1 rv (U %!."n7#F C, a) )4~cP u~.a- &( t. .r. -- % t z t' P ftr C-, ..
- ) I I
.4.4W ~ : .40 -0 V .4 UN CU CC K) r- 0'd 144. r) CM 4 CUNti10 1. a1 #-r . -4? ( W .V U 0
'r- 0.= us . .t . t.t ( e.. . to -V. t1 VC.t ana:31 '0. 0 AS 9% 4% in 0 M M( * 4 M W, w UN. 44
m z .4 M P, C2,04 04;- N M M) M N I-Ot " U-NN 46. 4" M@ M"
S. . . !) ~ . . P . . ...* . . 4. I .
P. K.. ;A Vaja
Im .4 ýO0.4ý"FM0tv4in t~ -*"( ,"v,.4'0V'0F)Nto! 4N
e -4 #1]n ..U, I
40 IV O- 04, r IvI UN Ii&ý f-'0N , q
CU - .-U . .~ . .P .a .t -4 O 4 .. .F . .
*-D C;4.4. NC U Cl4 M 0N4vFv Va)n &" ;
N ZD .-9. 4 "I.G P O 1 4 0 0 a e M DV*P - ."t. a 4
0,, 4C sýO'* U
10 $- ZI a-a- #) 7" Ufa- WVL -c ~ lu
VCJ m ý'0 .0jv v, W. .0Y w o 4D a ona 1 4 4 %C -C F ?W* t%&, * ."9 -eCUI"av o.J fir. %o 4AdT- I . . . .. .
Z-. .4. C"a#1 0.CD4V, M i M -.4 9 t1 %W4tf
_IS Figure~C 18 aml f opu rituC~ ii
61 ~ ~ 2 TL43 g 4- -- L , 9It We
ow rAMSw 30
A . .
4 1 0f t PI C. I t. C IrC
.0.W4L 4 #4 U-4~ N. .. 1~ 414 1)g wA . l~ jit
*ý-1U r- Iu- r, .1 *l r -i 4ý Crr, t, 1. f, rGl . ,P t r-t Usf 4. ~ .e * . II I
Cr ". eý t- I ýe 0,C
I 4r% tne I4,r4nNt. tt0 I3r'I2 I;4 M A4 I) .4 Iv k-*I ý -o v! 'a~ ox~l ' 4 .. b ca ~ )1 4~~~~~ CP.~. 4.I) i
I a
lea1j l I.
04 t KC. 0,":x Us *r II
I M
I -N iu
.6-~~~~~ ~ ~~ C .u1 b . - z.r~K4. C- W. %ae,.4 r -e*0.0 j ~ :'w.........
I I I -C'0 II
jtx
v -0. 4weM"e
Figure 18. Sampe of computer privtmst - continued Tx
24J~- M4 _ _ X

-- - °-
i~i 1. f;I e .Vý r ' r e I
1 - Cl- a a%
II-#Lat. 9.1 "I 19. i" 99 t% r '. 'iA3 P. •--
,i v a , it ,IiJ I I
9~M a59l M
, |
W e3 0.| C 4v ,0C9 c
, C 4 V" . U . ..
I .,, - *4a9I ti . t i 0aI
4I. U 9E V S ,I Ol SI I II w 8 4% IT
I
CA a& 7, 0 r -a n ka,
°I I I ''I !
10.1
a IQ oit, i , 0 , V ,
II*
r.. all
tn-C a a Fttr 6-, C.pl 111 Mo- e p"aou M- ot:I;nu:d
- i-
Ia I
L I aj
-.-. 1 --- 01A.. U.X IIII I III!J. 111 M av I, Ow 9 4 W4 94 C. yI V
At #UI I I Iw
I i
Fiur*~~~ 8. SampleuJX ofcmue rntu otne
it- q~o. v~r~r 25

4. FLIGHT TEST RESULTS
The results of the STOPS flight test effort are shown in Figures 19 through30. To best explain these results, each cell will be analyzed separately and acomparison of the cells will be presented.
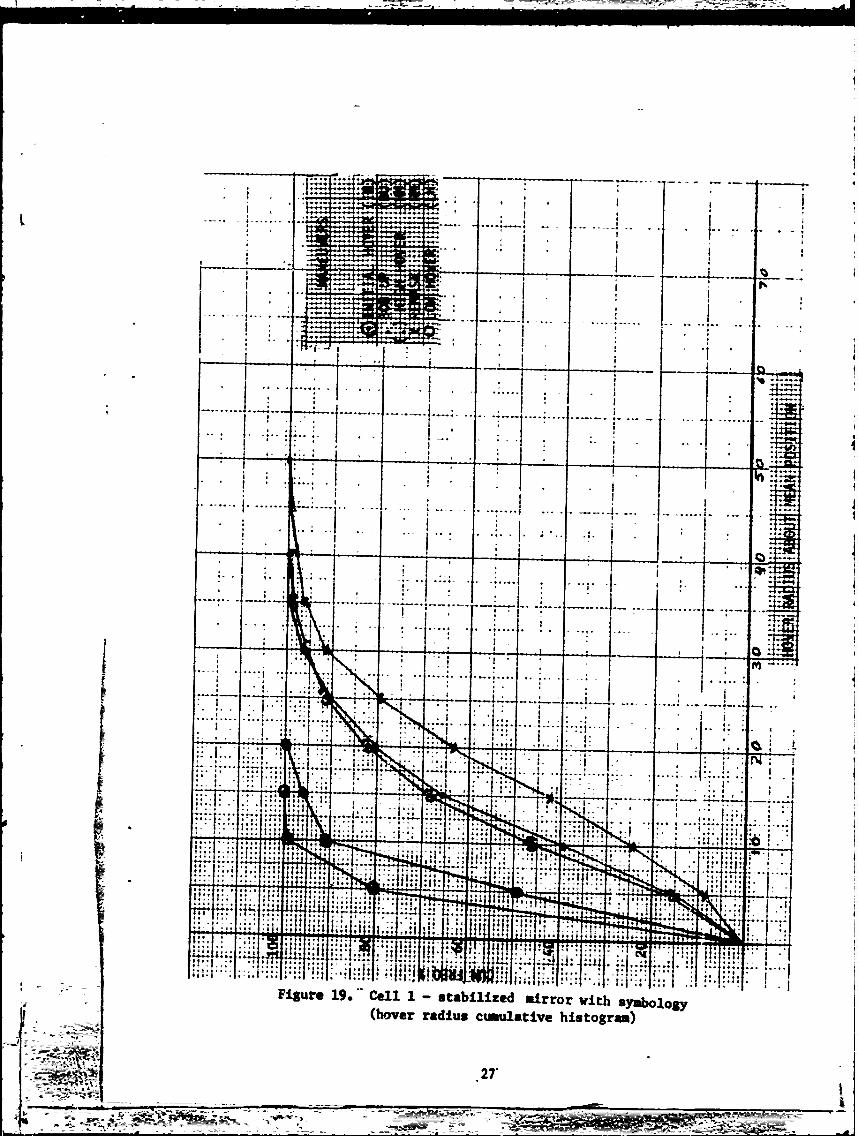
a. Cell 1. Stabilized STOPS. Figure 19 shows the cumulative frequencyof the hover performance of the hover radius about the mean position. As canbe seen, the IH and LH at the 50-percent point are less than 5 feet. This er-ror is comparable to the TASS STOPS simulationI and slightly larger than theflight test of the stimulated STOPS. 2 The errors accumulated for the BU, HHare twice those for the IH and errors for the RN are three times those for theIH. These increased errors can be expected since the position symbology gainwhich is now represented by the actual ground image was optimized for the 50-foot altitude and not for 200 feet and pilot has the additional task of monitor-ing altitude varntions. Also, as altitude increases, the initial selectedhover point is much more difficult to resolve. As stated earlier in the sym-bology description section by optimizing the symbology gains for one particularaltitude degraded hover performance was expected for different altitudes. Thedata appears to substantiate the assumption.
The translational position error contribution (Figure 20a) is predominantin the fore-aft axis, especially during the BU, HH, and RN. The fore-aft tolateral standard deviation ratio is approximately 2 to I.. These-position er-rors correlate well with the results of the DHS flight test study.*
A comparison of the standard deviation results of the IH position errors(Figure 20b) with the results obtained under the Low Level Night Operations(LLNO) 6 effort for a similar maneuver shows no significant difference. Themean of the standard deviations of the position errors for this study is 2.5feet and for the LLNO less than 2 feet. This agreement between the LLNO simu-lated STOPS and the actual STOPS brassboard model testing verify the results ofthe current flight test and confirm the STOPS potential.
Some further explanation is necessary to clarify the cause of the higherthan normal position errors encountered during the remask maneuver. As can beseen on Figures 20a and 20b, the remask maneuver position errors are greater.The most likely explanation for this is probably due to,
(1) inability of the pilot to select a well defined ground reference,
(2) concentration of the pilot on the altitude and rate of descent,and
(3) The measurement technique for deteradning hover performance error.
All these factors contribute varying degrees of err,,r to the pilot's performance.These factors also contribute errors during the bob-up and higher hover but to alesser degree. To further explain this, for the bob-up maneuver, the pilot ini-ates the hover from a well defined ground hover reference. As the bob-upmaneuver is executed, ,his reference becomes much smkller and the position cues
3 6fl" Level Night Operations Stdy," System Engimering Team, Advanced Avionics
Systems Technical Area, Avionics Laboratory, Teehlcal Report ECOM-4417, FortMonacuth, NJ, June 1976.
'26-
I _ __ _ _ _ __ _ _ _
I-
:T X
....... .. F L 9... .... .. .....-
.. .... . .....
J I,1- -- L
-4 1 lot"I
* * t1f...
Figure 19. Cell 1 stabilized mirror wt yblg(hover radius cumulative histogram)
27'
M__________Z
~J7-

i 7. -1
... ........ ... .. ....... ... ..
.. .~ .. ......
.. .. . ..:.. ... . .... . ..
a. LONG/LAT STANDARD DEVIATION (6k, 6 POSITION ERRORS)
... ......
.......... ...... ... ........ ........
-*4 E4 25..
*~.ta... .. s.I~t..... ~ 4 4
HOVER RAIU ABUToA STOFiur 20l Cel1To±izdmro it y lg
2to.
V . ! ....
presented to the pilot are not as pronounced. This, along with the cross con-trolling of cyclic and collective, tend to increase the position error. Itshould be mentioned that the data collected is referenced about the groundhover point selected just prior to changing altitude. As the helicopter ascendsand the ground reference becomes less discernible to the pilot due to loss ofresolution, in his attempt to optimize the hover, he may have been forced toselect a different and more pronounced ground target. However, performance isstill measured about the original selected hover point. Thus, the pilot ispenalized although he may be holding a precise hover over the new reference.
For the high altitude hover (HH), the radial position errors (Figure 20b)are slightly greater than those of the bob-up (BU) maneuver. This tends tosubstantiate the explanation of the inability of the pilot to resolve the orig-inal reference point at the higher altitude. The penalty is again higher posi-tion errors caused by the continuous wandering in search of a pronounced or theoriginal reference point about which the data is measured.
Returning to the remask maneuver, the pilot selects a ground target at thehigh hover. He uses this reference and initiates his descent. This positionaccuracy tends to decrease since he must pay close a.tention to the rate ofdescent and altitude. As he descends and the ground detail becomes more dis-cernible, he may recognize some prominent feature or even the initial hover pointand may try to hover over this point. By doing so, he again is penalized in hishover performance. This is depicted by the larger errors during RM shown inFigure 20b as compared to the other four submaneuvers of the same cell.
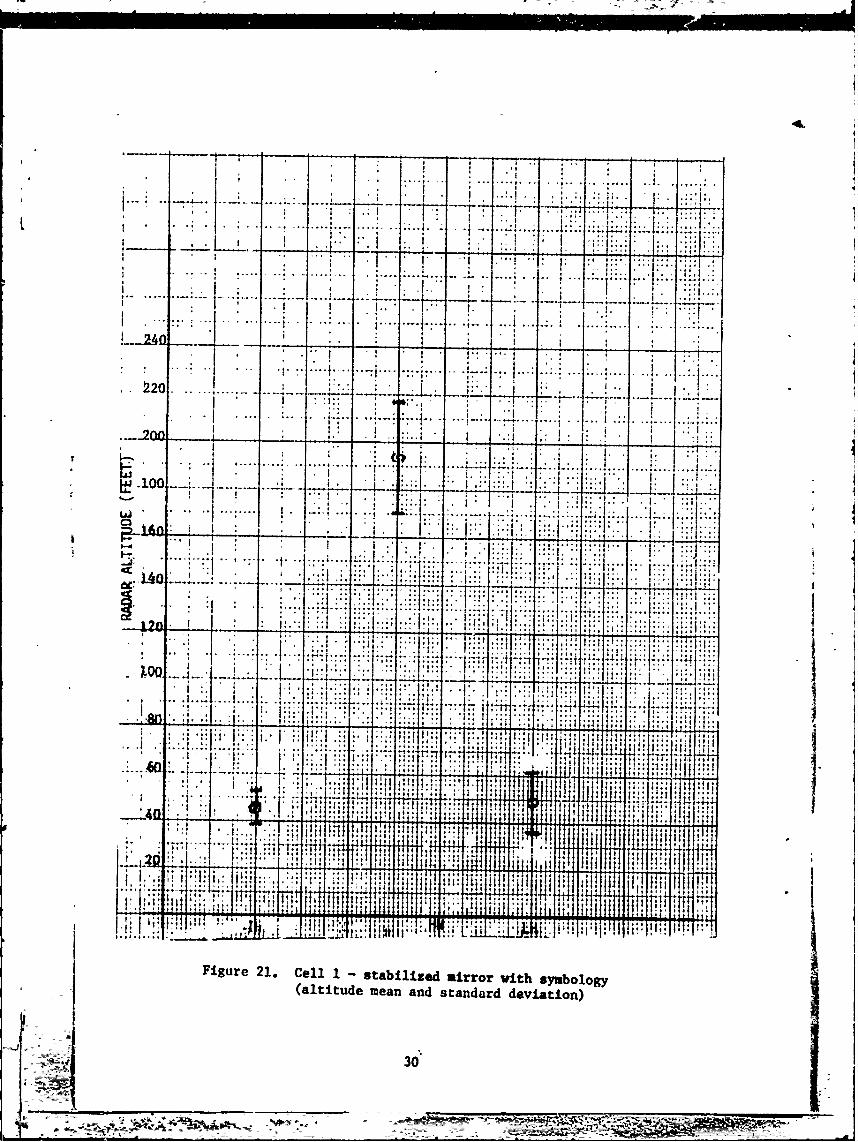
The altitude standard deviations about the mean for the IH, HH, and LHIare shown in Figure 21. It appears that the subject has difficulty maintainingirecise altitude at the high hover. An explanation might be that the pilot maytend to relax his altitude control since the aircraft is clear of obstacles.Also, since he is near the lower gain of displayed altitude, the altitude ex-
cursions appear smaller and he devotes less time in optimizing or stabilizingE altitude. in retrospect, it would have been ideal to hover the helicopter near
a tree line and only have the pilot just break mask. This would have forcedhim to pay closer attention to altitude.
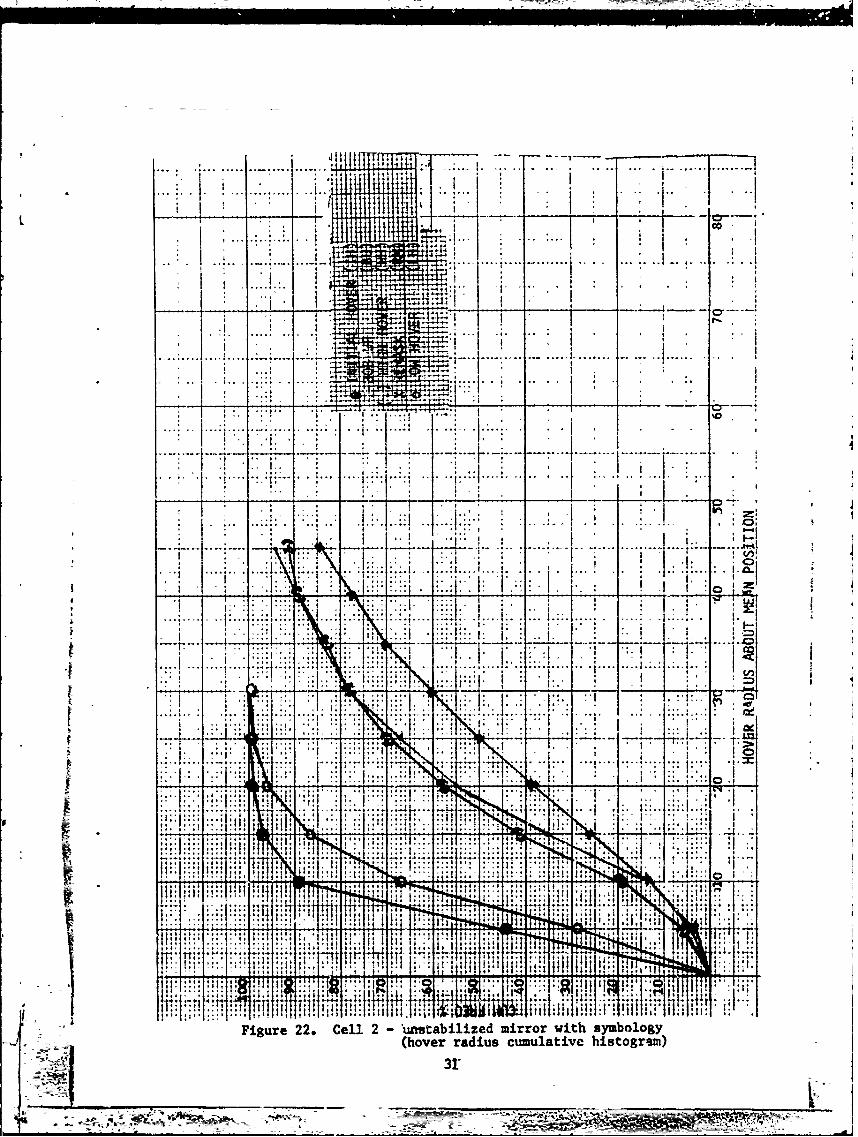
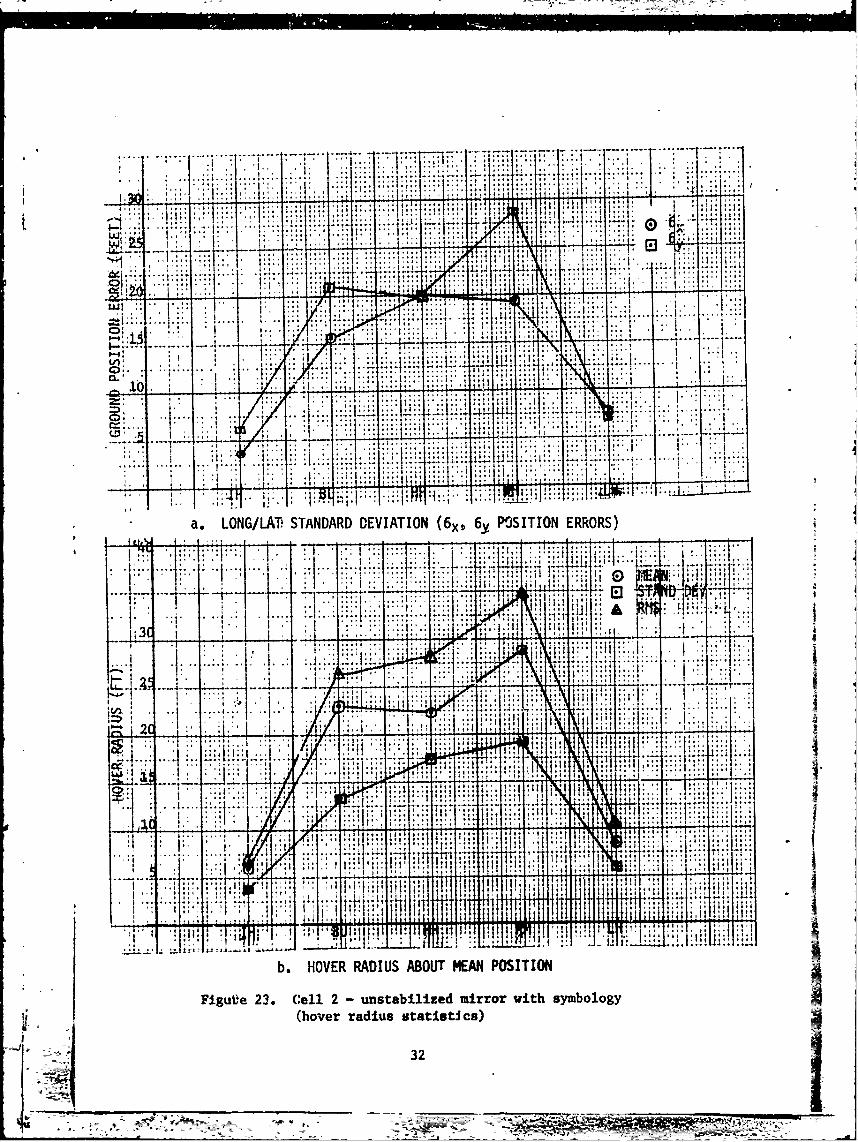
b. Cell 2. Unstabilized STOPS. The results of Cell 2 are shown in Fig-ures 22, 23, and 24. Figure 22 shows the cumulative frequency of the hover per-formance. As can be seen, the IH and LE position errors are less than 10 feetat the 50-percent point. For the HH and BU, the errors increase by 10 feet andfor the RM by 15 feet. The major position error standard deviation is in thelateral axis as shown in Figure 23a. The hover radius standard deviation aboutthe mean position for the IH and LH are approximately 5 feet as shown in Figure23b, with higher errors accumulated in the BU, HH, and RM maneuvers.
The ability of the subjects to maintain altitude during the IH, HH, andLH is shown in Figure 24. The standard error for the IH and LH is in the orderof 10 feet. The subjects seem to have greater difficulty in maintaining accuratealtitude at the HH. The standard altitude errors of Cell 2 are comparable tothose of Cell 1.
Li ~29k
-Alid =_ V .-.. •••
.177.... ......
-1001
C3 ..1 . 1: ....
.. ... .... -
:% ...
X 0.. . f.. *... .
"I . 4 1!; ",1
.404. ..... HI
F 10 14 .1
T I MI t~* 1~~~ 1144,.j.4
Fiur 21 Cel1saiie 4rrvt
Yblg
(attd mea an4tnaddvain
6 I 4 ... I:'30
4 4 1'
-L
4 4 74.i4
4 1 I
. 4 .. . ... .
.. . . . .. .. . . . . .
7 -I - 7... . ...
.4.44.-
I i. ti H i
4 --... -... .
14 j:'
Id I
. .. 4 .. : 1 1.. 414
M I.4 ::t 'pt
Cel2-tSi irrwth syboog
t 4..... 31:
- 5i.4
..... . .....................
... ~~~~~. .... . .. . . . .... 4~
.. . .. . . . .
a. LONG/LA1T STANDARD DEVIATION (6xt, 6y POSITION ERRORS)
..........................
Ml. 41
P'! '. 1HI
b. HOE ADU BUTMA PSTO
Figute~~....1 L' 23 el2-Isaiie irrwt yblg
(hover raiu sttsis32.
Ka4. 7..

.44
i ' I* *i .. .I
.. . ........... ... ... . . .... ... ........-
j AIII
,"2..
. - ' . * 1 i '" i :'-
I , '. .....',' . .. i . "
* . . . i ,
. ... . ." "
-,,-.,, , ---- ' t . "
-4"=....... .. ... -4 .. " -
' . - . 7 .... . .i" " ..M , '1
A ! :: I . --: .. I" "
....... . .. .
!4,ii is I . . . i,
* . . .. .,:'.:.K. 1 "1:", ...
Fg e4. C 2 4-;:1:': m
,. *... I.., .. 4_.... I_,:1. : . : j::: . 1;,.1,
i~t; "'...... .- .1 ..•7, I' ,...... : I- .I . ... .. I . 9",,"*
"'' 'i,.;' ." ::: ': ;; '" 7.j... ..I.I + - . ,-_ ' I,:'
... I4,j4...
9.44 I '44 94........ 49 :~ . : '
1; : I 4 ... .... |I . . .
4..4 4 s '---. -.. L : I 4....
.(altitude mean and standard deviaions)
•.3
c. Cell 3. Front Seat - The results of Cell 3 are shown on Figures 25,26, and 27. As can be seen in Figure 25, the front seat subject is able tohiover within a 10-foot radius 50 percent of the time during the IH, HH, and LH.There is an increase of approximately 8 feet for the BU and RM maneuvers. Theseresults confirm the findings of a previous study4 as to what hover accuracy canbe expected from a pilot with all available visual cues.
Figure 26a show the standard deviations for each axis. The hover radiusmean, standard deviation and RMS are shown in Figure 26b. These figures alsoreflect the previous findings. 4 In questioning the pilots about their perform-ance from the front seat, they tend to believe that the hovers are "perfect."The quantitative measurement shows otherwise. This may imply that pilot opinionin judging performance might itot be realistic.
Their ability to maintain altitude (Figure 27) seem to be much be-er thanin the previous two cells. It is quite probable, that since the deviations areless than 10 feet, the altitude hold might have been engaged.
d. Cell 4. Stabilized Mirror, No Symbols, Constant Altitude. Figure 28shows the cumulative probability of the hover performance without symbology.This cell was designed with the bob-up and remask maneuvers, but due to the in-ability of the pilot to stabilize the helicopter, the bob-up and remask wereeliminated. The results of the Cell 4 at constant altitude, approximately 60-feet hover, indicate that the pilot can achieve a rather "good" hover. A com-parison with Cell 1 shows that for this cell, at the 50-percent point, the hoverradius has more than doubled. At the 80-percent point, the Cell 4 radius is al-most 15 feet while that of Cell 1 is only 5 feet. The errors associated withthis cell at a constant altitude can be classified acceptable. However, sincethe subjects could not accomplish the bob-up and remask maneuvers using thiscell, one may conclude that such a configuration without symbols has a limitedapplication.
Attempts to fly other cells, such as Cell 2 without symbology, were quicklyterminated. It was rather difficult to maintain a stable hover, and the safetypilots usually would override the test subject and assume control of the heli-copter.
e. Cell 5. Hover Maneuvers after Completion of Approach/Tranaition to aHover. This particular cell provides a good insight to the potential of im-agery and superimposed symbology for accomplishing the terminal area maneuvers.The ability of the test subject to use this information to decelerate the heli-copter to a complete stop, perform the required hover submaneuvers and then ac-celerate and make an approach to a new hover area, was demonstrated success-fully. The data shown on Table 2 reflect that the deceleration was initiatedat an average altitude of 81 feet and 20 fps average forward speed. The av-erage ground speed increased to 27 fps with the average altitude increasing to114 feet before finally settling to an average of 40 feet or 10 feet less thanthe desired value of approximately 50 feet. The test subject then completedthe required hover submaneuvers. From this location the test subjectaccelerated/decelerated the helicopter to a new hover area.
For this acceleration/deceleration maneuver, the subject pilot attained anaverage maximum speed of 36 fps and 112-feet altitude before settling to anaverage of 30 feet or 20 feet less than tt desired value of 50 feet.
S-34 7~:1 _ _ _ __ _ _ W_ _ _ _ _ _ _ __ _ _ __ _ M

IEIICI
~C
~1 7
I IZ

~~--... .. .. .. ........- - - -
LL.-~--~
____ _. ......... _......
:2. 3D . .. .H-i-H--
-I I
.. . .. . . . . .. . . . . .I .
a. LONG/LAT STANDARD DEVIATION+ (6x, 6y POSITION ERRORS)
-. 30
.. 4..- . . ..... .... ...
LL-A
.... ... .... .. ..... ...
b. HOVER RADIUS ABOUT MEAN POSITION
Figure 26. Cell 3 - front seat (VFR) performance(hover radius statistics)
=~-. -- ~ = _- 36_

,+ .. ....+ i i+.. ....... .. ; +.. .. ... .... .. ...... ... .................
-7 , --7 -
"' -- . .. :+ +.i +"..... ... . ...- .. .. ..
24..
F7,
"". . ....... ...... ...
+ . .... . .... .. ..
, .... .. .. + ... _ =o _ +. ....... .. .. +...... ....... ........
:Ad:
..... . ... ..... .
... .I . .....
Figur 27 el3 fotsI '4-.pefomac
80- ' ' .. .. 1.....i .... ..... . . . .. *... . ... ...-. ._. ._ _,_ _ _
, iue 7* e, fr.. . .nt. se (V R perf.r.an.
(altitud~a mean and standard deviation)
37-
!-•+..+ : L• t

.. .. .. ... .. ... ... . .......
S. ...
... . ......†.†
L~~~~.. ......... .. ... .... :
*,II I-
it.
. . ..
... ... ... -.... .... ..
I I
....-...... .. . .. .......
... 1 ... . .. . . . .. .. . ....
, :. a. . :: "
9 I
4 ,. -,-- -- I .. . . . . .... a
a ... ' " i : i : .: I I... ... ,I ! * .i
II", i I .! . . ,. •i i
4 . I I: ::-" : I " : '
Figure 28. Cell 4 -stabilized mirror, no symbols, constant altitude_ !(hover radius cumulative histogram)
• - 4.
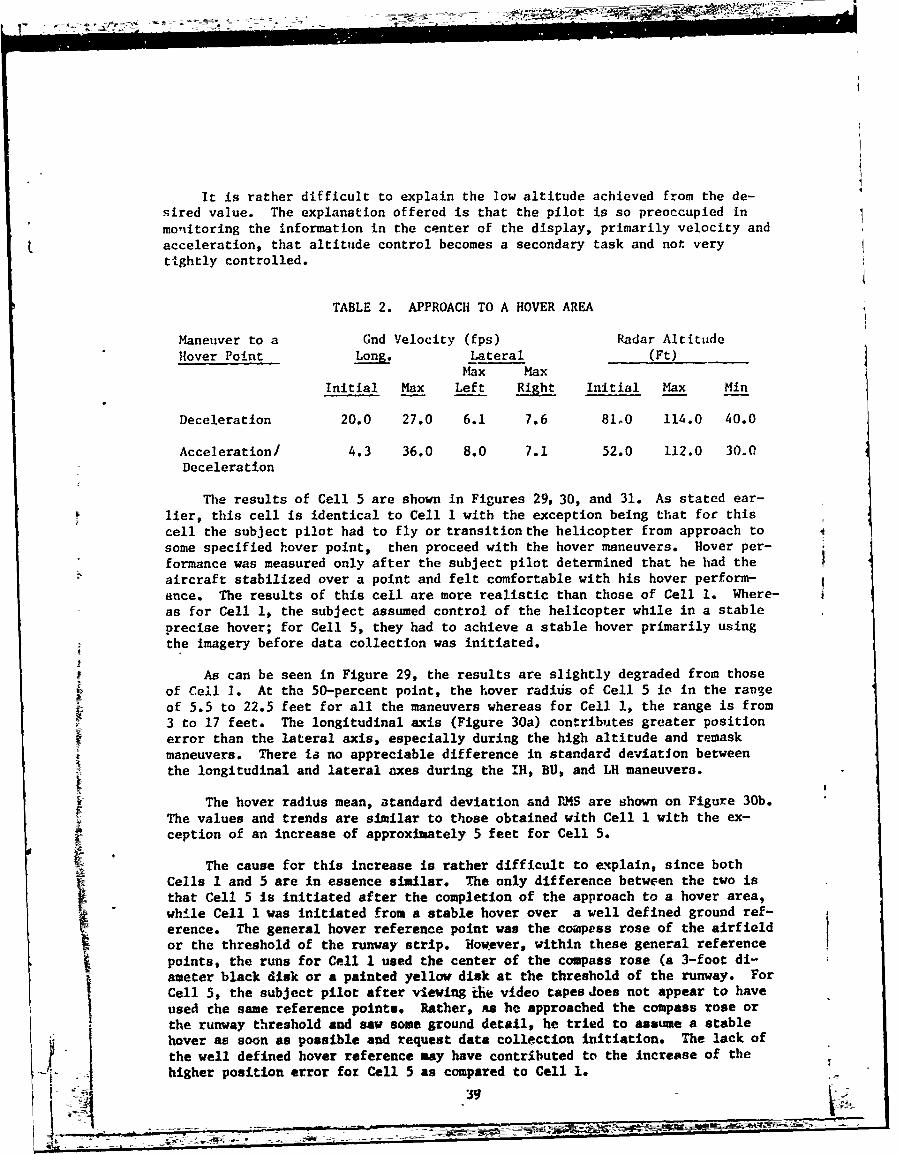
It is rather difficult to explain the low altitude achieved from the de-sired value. The explanation offered is that the pilot is so preoccupied inmo,•itoring the information in the center of the display, primarily velocity andacceleration, that altitude control becomes a secondary task and not verytightly controlled.
TABLE 2. APPROACH TO A HOVER AREA
Maneuver to a Gnd Velocity (fps) Radar AltitudeHover Point Long. Lateral (Ft)
Max Max
Initial Max Left Right Initial Max Min
Deceleration 20.0 27.0 6.1 7.6 8M0 114.0 40.0
Acceleration/ 4.3 36.0 8.0 7.1 52.0 112.0 30.0Deceleration
The results of Cell 5 are shown in Figures 29, 30, and 31. As stated ear-lier, this cell is identical to Cell 1 with the exception being that foc thiscell the subject pilot had to fly or transition the helicopter from approach tosome specified hover point, then proceed with the hover maneuvers. Hover per-formance was measured only after the subject pilot determined that he had theaircraft stabilized over a point and felt comfortable with his hover perform-ance. The results of this cell are more realistic than those of Cell 1. Where-as for Cell 1, the subject assumed control of the helicopter while in a stableprecise hover; for Cell 5, they had to achieve a stable hover primarily usingthe imagery before data collection was initiated.
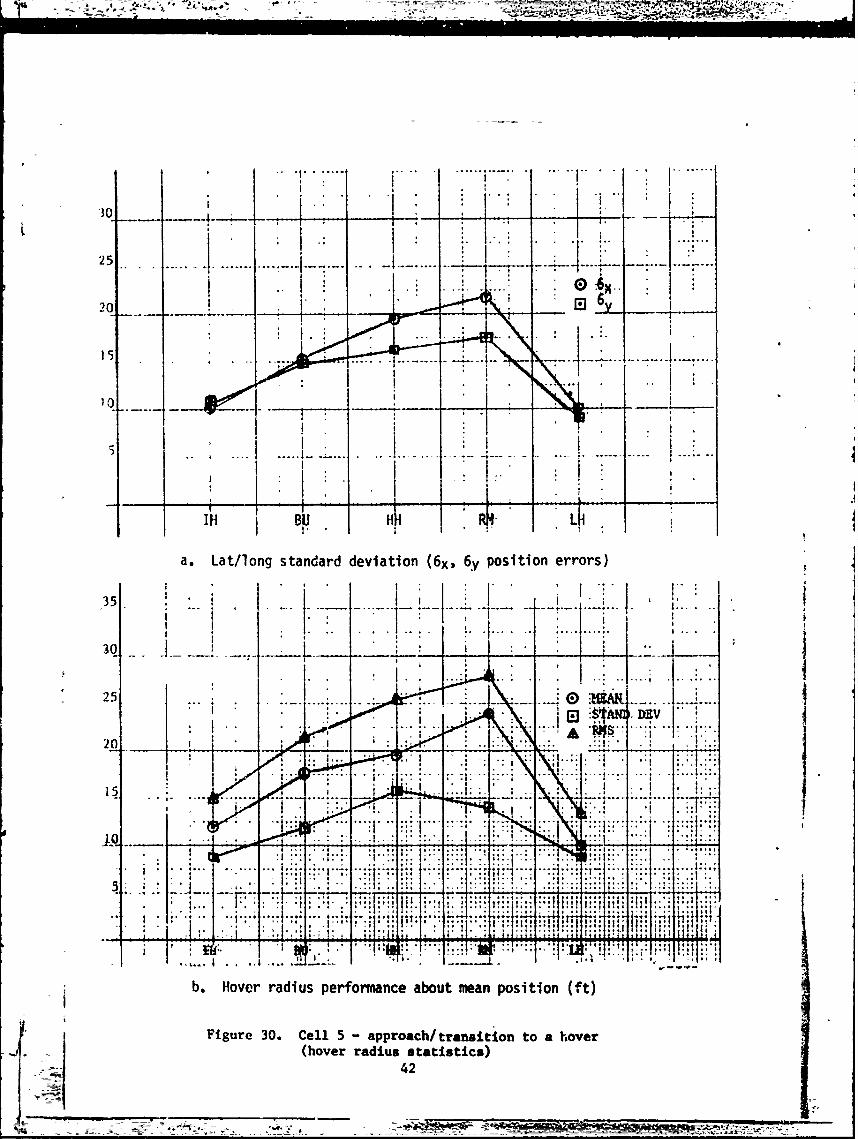
As can be seen in Figure 29, the results are slightly degraded from thoseof Cell 1. At the 50-percent point, the hover raditis of Cell 5 io in the rangeof 5.5 to 22.5 feet for all the maneuvers whereas for Cell 1, the range is from3 to 17 feet. The longitudinal axis (Figure 30a) contributes greater positionerror than the lateral axis, especially during the high altitude and remaskmaneuvers. There ia no appreciable difference in standard deviation betweenthe longitudinal and lateral axes during the 1H, BU, and LH maneuvers.
The hover radius mean, standard deviation and PAS are shown on Figure 30b.The values and trends are similar to those obtained with Cell I with the ex-ception of an increase of approximately 5 feet for Cell 5.
The cause for this increase is rather difficult to emplain, since bothCells 1 and 5 are in essence similar. The only difference between the two isthat Cell 5 is initiated after the completion of the approach to a hover area,while Cell 1 was initiated from a stable hover over a well defined ground ref-erence. The general hover reference point was the ccrapess rose of the airfieldor the threshold of the runway strip. However, within these general referencepoints, the runs for Cell 1 used the center of the compass rose (a 3-foot di-ameter black disk or a painted yellow disk at the threshold of the runway. ForCell 5, the subject pilot after viewing ihe video tapes does not appear to haveused the same reference points. Rather, as he approached the compass rose orthe runway threshold and saw some ground detail, he tried to assume a stablehover as soon as possible and request data collection initiation. The lack of
the well defined hover reference may have contributed to the increase of the
:y* :higher position error for Cell 5 as compared to Cell 1.
359
1' --t

.. .. .. ..
I I Ca
4"" N.,.7
*.ii 4
*4 A-1 CM
AOO
,Z- i

The altitude standar., deviations (Figure 29) about the mean altitude forthe IH and HH appear to be greater than the errors of Cell 1. It is very pos-
t sible that the subject pilot was more preoccupied during the approach/transitionto a hover area with helicopter stability and position control rather than al-titude accuracy. This inability to control altitude more precisely is also re-flected for the high hover. The only explanation which is offered is that sincethe helicopter is sufficiently high, the pilot may concentrate more in control-ling helicopter position rather than altitude. This is especially true sincethe downlook image resolution and gain are reduced at high altitudes. Therefore,the pilot has to pay closer attention to the hover symbology, velccity, and ac-celeration to maintain position and less time may be devoted to altitude con-trol.
f. Special Runs. Just prior to the completion of the flight test program,the Navy safety pilots were asked to participate as subject pilots and fly theSTOPS system. They willingly agreed; however, due to other commitments, theydid not have time available for training, but wished to fly the system anyway.They were briefed on the system and the symbology prior to liftoff. At thehover site, two Navy pilots observed an Army subject pilot flying the system.The Navy pilots, one at a time, sat at the 3rd station and, after some familiar-ization with the 3rd seat flight controls, flew the STOPS System, Cell 1. Eachhad approximately 10 minutes of training and then flew two runs for data. Theyflew a constant altitude hover with altitude and heading maintained by the frontseat safety pilot. The results of these flights are shown in Figure 32.
Although not enough data was collected for any statistical significance,it is interesting to note that their ability to comprehend the STOPS displaypresentation and manipulate the symbology to achieve a stable hover after verylimited training effects favorably on the system. It should also be noted thatneither pilot had flown using a 2-dimensional display or symbology previous tothis encounter.
g. Aircraft Control and Attitude Excursions. Figure 33 shows the stand-ard deviation of percent of full travel Pf the flight controls for Cells 1, 2,3, and 5. Cell 4 is not included since it was a constant altitude hovel. Thegeneral trend of these curves seem to reflect higher control displacement dur-ing the bob-up, high hover, and remask maneuvers. In comparison to the baselineCell 3, Cell 1 deviations are higher overall while those of Cell 2 are onlyhigher for the lateral cyclic. The control motions of Cell 5 are higher thanthose of Cell 3. This may be indicative of increased workload imposed on thepilot in his attempt to transition from approach to a hover maneuver.
Figure 34 shows the standard deviations of the pitch and roll helicopterattitudes of Cells 1, 2, 3, and 5. In general, there is a greater deviation inattitude for the dynamic maneuvers such as the bob-up and remask and also forthe high hover. In comparison to the baseline Cell 3, Cell 1, Cell 2, and es-pecially Cell 5 show an overall increase in the attitude standard deviation.
L This increase in attitude deviation may be attributed to the pilot forcing thehelicopter to attain a more precise hover.
h. Subject Pilot Coments. The subject pilot comments favored the ptten-* tial offered by the STOPS concept (Cell 1) as a visual means for obstacle clear-
ing below the helicopter and its ability to allow them to easily and safely
41
I;~ R - -
'30 'I 'I
25 . --....L20 -
a. Lat/long standard deviation (6x, 6ýy position errors)
35.
20 . :151
b. Hover radius performance about mean position (ft)
Figure 30. Cell 5 -approach/transition to a hover(hover radius statistics)
42

-i-:= , • -:÷ -- • -L -•- -- -- - --- m "• •:-. o• ,.,• __4..A..• :-
... ..........
* .•
.......... I
... ..4 ..: 4 .I .
I 4 I
I . .. .'. . .. .. fit... I .I . : ....... ..
43
I I .I5 .- 6 . . . . . . . . . . 4- .. .... . 4. . . . .
L U . . . .. .I. .
'4-" ' : I I'l f : I . I , ' 4
; .J ' :" 'jS4 I 4
4 ,:.. ... :I. 1'* • .
: ' ,J . . ": , , . ' '" * .-.-... 4. ... I4 . • , . . 4.. i . , i , 4 .,
I .. !.... i .. ' i v I - t..• -i-, , . -... -.. .- I . . ; i . ' . ! ... 4 ' ,
S- . " . .. l,'_ . , . i . . .. I . ... . .. ..... ... ... I.i ... .:'.. . ' j14 , I ,, . I. 1 , I. )-•
,... .. 4.4. ... ..,: i T''l . .. .!' tH 1 : ,t'FF .. _ .. . .', . . . , , • l . . .
- i .... .... .. I 1. • , . . i .. 4 ,S. . . . . . . . . . . .1. . . . . . ..44 4 . 4... . . 4. . . .I. .1' .. ., . . . . ..* . ;
::.I...n • .... '.. ...,' ".......4 ;'"'~ 441 -44 4 j "; ....
,,. . 4. :4: .. A .24 ,:::' 4 !., . -4. ..... .414 4,, 4,:',I4,
".. ::..:.jz : . ;... ..... ;..I.a~ " : ... ,..,I~2 ,•; ],FI TL'
Figure 31. Cell 5 - approach/transition to a hover
43 ;

_ _ =- ZD~ -
. ... .. . .. . ..- -- -
?
-------- ----
. .... .. . . . . . . . . . .
117 - PF
~ ~.T'
4;;44

-- ---- ----- - --
-
TLA ST,
LjJ, *4ELL.=J: 4 I
_j)
P, 0
$41
r tF 7i - ~ i7
J__I__

j,0 PITdH,
L5.
.. .. . 41
Q........... ...... . . . . . . . . . [
* CEL 3 .~. ... ......
1.5 I
W1.0
.. ......... ~
............................ .t ... . ...
4.4
I&4 !Hm..
'F i g u r 34. Tanaddvaino eiotrattd
H*46!... i. .
perform the hover, bob-up, and remask maneuvers. They objected to the obscura-tion of the image caused by the stow position of the mirror and the location of
L the mirror and symbology mode control switches (Figure 12). They felt that themirror mode control as wel. as the symbology mode formating switch should beincorporated on the cyclic or collective stick controls. The hover symbologywas readily accepted with the exception of heading. The heading deviation sym-,.ology did not provide them adequate information and they preferred to engage
the helicopter heading hold system.
The pilots also commented on the need for some means of indicating an upperand lower limit setting on the radar altitude symbology.
5. CONCLUSIONS/OBSERVATIONS
The STOPS brassboard flight test evaluation substantiates the earlierground base and flight test simulation results of the system's potential to pro-vide a self-contained hover aid. The split image presentation along with thehover symbology provide the test subject the means to perform the "bob-up" andremask maneuvers -ith ease and confidence. Specific conclusions based on theflight test results are as follows:
a. STOPS Gimbal.
(1) The STOPS gimba] was successfully integrated and flown on theEVAR project helicopter.
(2) The STOPS gimbal dngle freedom was sufficient for the EVAR atti-
tudes encountered,
(3) Image smear or jitter from the mizror was unnoticeable.
(4) The split screen presentation did not adversely affect the testsubject.
(5) The obstruction of 40 to 60 in the center of the FOV with themirror in STANDBY mode was unacceptable.
b. STOPS Hover System.
(1) The STOPS with the hover symbology concept was successfully demon-strated as a self-contained hovwr system.
(2) Subject pilots preferred to fly Cell 1 stabilized mirror symbologyover other cells.
(3) Very little training was required to fly Cell 1, as demonstratedby the Navy subjects.
(4) The hover radius position errors for Cell 1 ranged from approxi-t mately 2.3 feet for the IH and LH to 7.5 feet for BU, 15 feet for 11H, and 18
feet for the RM.
(5) The findings for Cell 1 are similar to those derived in the STrPSground simulation as well as the earlier flight test simulation program.
F i _ _ _47

! • • .. •• ••, -o • • • . 4:- • -_ ±• i•• •
(6) The position errors of Cell 2 (unstabilized mirror with symbology)are higher than those of Cell 1, and attempts to nerform the hover maneuvers
with an unstabilized mirror image without symbology were not successful.
(7) Hover radiius errors under VFR conditions, Cell 3, are in therange of 5 to 10 feet.
(8) The incorporation of the transition-to-a-hover mode symbology wassuccessfully demonstrated by having the subjects initiate tlhe transition fromapproach to a hover at 20-25 knots airspeed.
(9) Cell 5, the approach/transition maneuver, indicates that pilotperformance degrades slightly, and that pilot workload (stick movement) increasesover those cells that were initiated from a stable hover.
6. RECOMMENDATIONS
The successful flight test demonstration of the brassboard model STOPS inthe various configurations tested, leads one to believe that it truly has a po-tential application in military and possibly civil helicopter 7 operations Insuch areas as logging and perhaps offshore transportation of personnel on theoil rig platforms. The following recommendations are offered to improve Lheove .:'I STOPS hover system cor~cept.
a. The brassboard design should be miniaturized and integrated with theappropriate night vision sensor to reduce the present weight and size.
b. That the present design be altered to eliminate the obscuration of theimi-e when the mirror is in the stow position.
c. That the capability to maintain the same display position gain ýor anyaltitude be incorporated.
d. That the mirror activation and symbology mode controls be p: ,tided onthe collective or cyclic for easy access.
I
7Stabilized terrain optical position sensor - US Patent #3,944,729,INarch 16. 1976.
48 HMS FM 206-79
-~ - - - I. ~ -A