avp for institutional effectiveness and director of ir muriel lopez-wagner assistant director tanner...
TRANSCRIPT


AVP for Institutional Effectiveness and Director of IR
• Muriel Lopez-Wagner
Assistant Director• Tanner Carollo
Institutional Effectiveness Associate
• Joanna Oxendine
Research Technicians• Allan Taing, David Dysart,
Michael Rose
Administrative Support Coordinator
• Yamira Murga
Casual Worker• Salena Soria
Student Assistants• Lauren Albrecht, Eric Cazares,


• Syntaxes•Merging Variables•Merging Cases• Custom Tables• Cross Tabs
•How to Save a File

• Hello Everyone!• First, download the three SPSS files
that are on the ir.csusb.edu webpage. In the Other Sources section.• They are called ‘Dataset1’, ‘Dataset2’,
and ‘Dataset3’• Please open them in the numeric
order they are marked. • If you are in the workshop, the three
files should already be opened and ready for you to use.
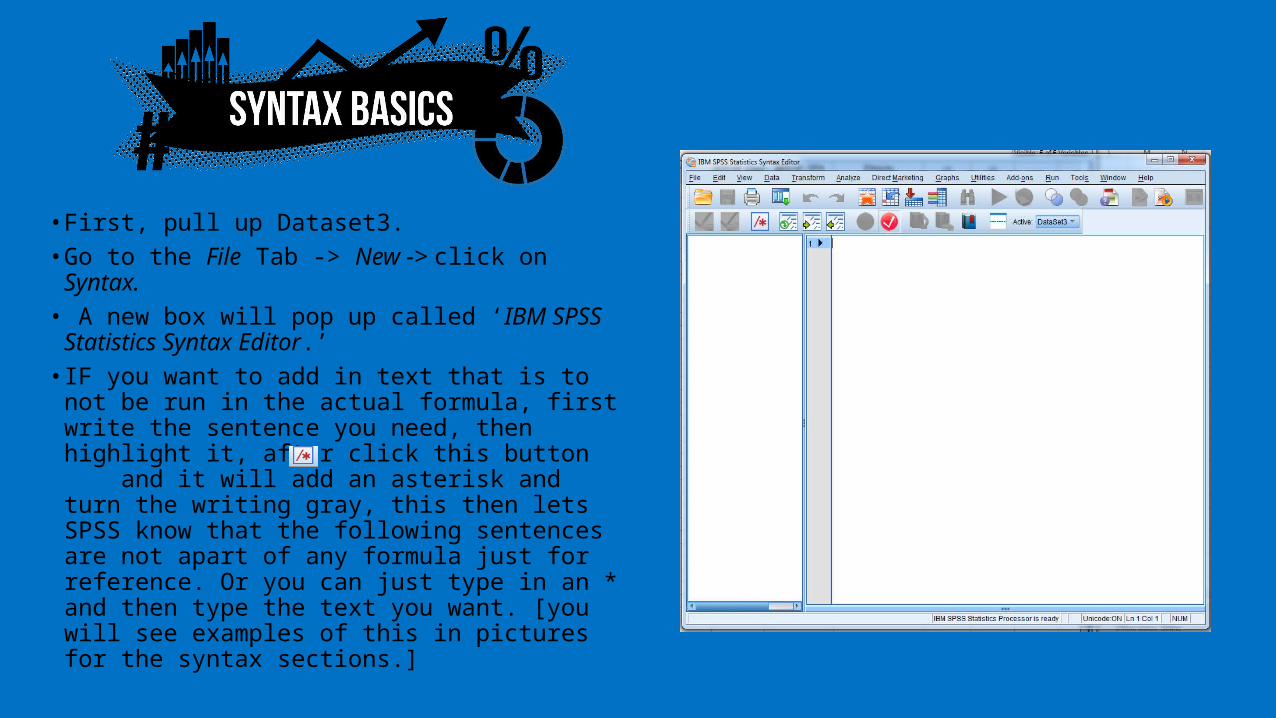
• First, pull up Dataset3.• Go to the File Tab -> New -> click on
Syntax. • A new box will pop up called ‘IBM SPSS
Statistics Syntax Editor.’• IF you want to add in text that is to not be
run in the actual formula, first write the sentence you need, then highlight it, after click this button and it will add an asterisk and turn the writing gray, this then lets SPSS know that the following sentences are not apart of any formula just for reference. Or you can just type in an * and then type the text you want. [you will see examples of this in pictures for the syntax sections.]

• A very important area in the syntax tool bar is the ‘Active:’ section. This area shows you what dataset the syntax will run on. Make sure this is always the right dataset you want the syntax to run on. Otherwise, you could accidently change data in another document that you did not mean to.
• To see which dataset you want to use, look at your document’s top bar, after the file name of the document there will be the dataset name in [].

• Lets Start!• First pull up Dataset3 and go to Variable
View. We will be changing two variable names in order for them to match to Dataset1’s names.
• In your syntax box, type in Rename Variables [when you first type in rename a drop box will pop up, you can then click on the formula title you want]. Then continue to write the formula as you see in the picture to your right.
• Basic Formula will be written as follows:• Rename Variables (Variable name 1 [original]
= Variable Name 2 [the name it will change to]).
Execute.
If you have multiple names you want to change you will not have to add a period after each (old = new), you only add a period at the end of the last (old = new). If you do not add a period after the last group names the syntax will not run.
*Note: the writing in white is what MUST be includedin writing this formula, otherwise SPSS will not run it.

• Lets Run the Syntax!• Now that we have our written formula,
highlight the section you want to run. The section you highlight is the formula that will run on the specific dataset you want it to. This is helpful when you have many syntax's saved on one file, but do not want to run them all at once. What you highlight is the only formula(s) that will run.
• After making sure the syntax box is set to the right dataset [for this workshop it will be dataset3] click on the Play button which is the green triangle on one of the top bars. Do not press enter, the Play button is the only button or key that SPSS will recognize to run the syntax.

• Results!• After you press the play
button, the variable names of ‘Lvl_2014’ and ‘GPA_2014’ should be changed to ‘ClassLevel’ and ‘GPA.’
Old
New
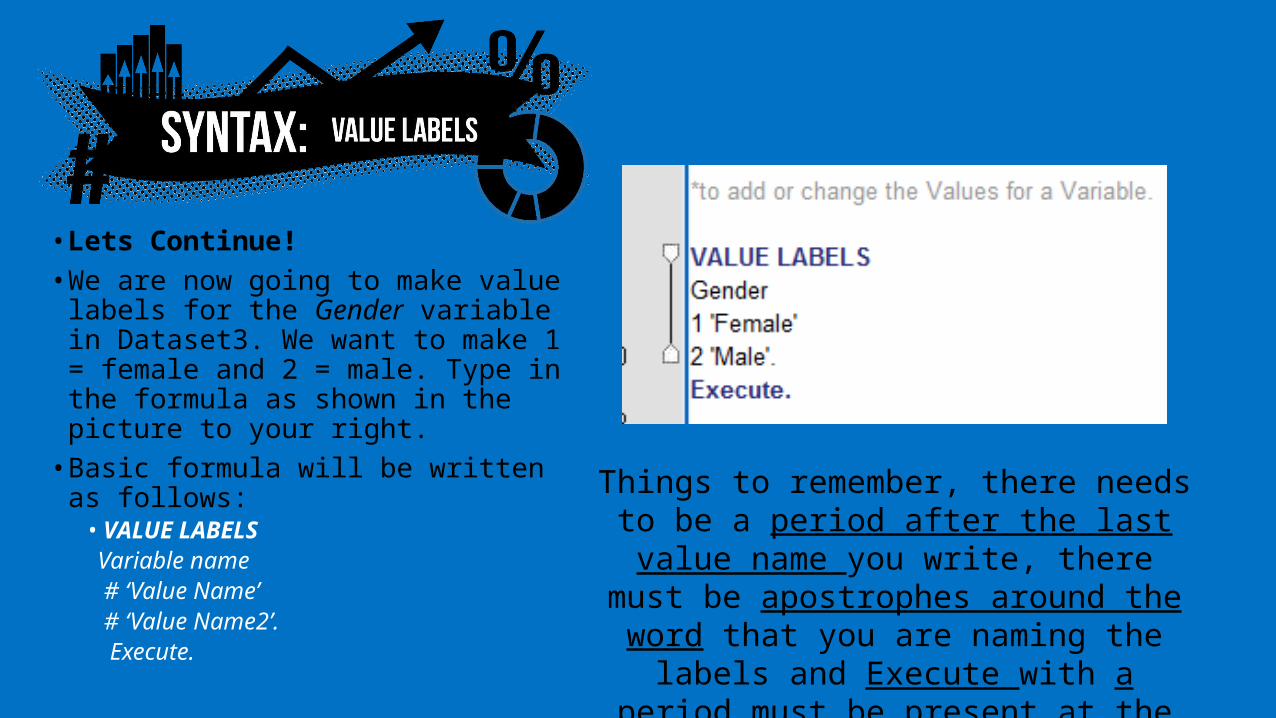
• Lets Continue!• We are now going to make value
labels for the Gender variable in Dataset3. We want to make 1 = female and 2 = male. Type in the formula as shown in the picture to your right.
• Basic formula will be written as follows:• VALUE LABELS Variable name # ‘Value Name’ # ‘Value Name2’. Execute.
Things to remember, there needs to be a period after the last value name you write, there must be apostrophes around the word that you are naming the labels and Execute with a period
must be present at the end.

• Lets Run it!• Highlight the value labels
formula only and press the green play button. Once again make sure the dataset is for dataset3.• Now you will see that where
there was a ‘none’ for values on Gender there is now the Values you have created for it.
Before
After

• In order to merge two files together you must have the type’s and widths of variables the same for both datasets in order for the merge to work.
• Now we will focus on how to change the size for a numeric variable to match another in a separate document.
• We will be changing GPA in Dataset3 from 11 width and 0 decimals to 12 width with 2 decimals.
• Pull up your syntax box and type the following formula as shown to the right.
• Basic formula:• FORMATS Variable (F##.#).

• Now highlight the formula in your syntax box and run it for the dataset on Dataset3.
• Results:• After running the Formats formula
you will see that the width and decimals of GPA has changed to what you have specified.

• Lastly we will be doing a syntax for how to change the width for a string[text] variable.
• This formula can also be used to change the type as well; from String to Numeric and vice versa.
• Go to your syntax box and type in the two formulas shown to your right, for both the Ethnicity and ID.
• Basic formula:• ALTER TYPE variable (A##).• ALTER TYPE variable (F#.#).
Changing the width of a String Variable.
Changing the String variable into a Numeric one.
*use all syntax’s on the dataset for SPSS2_Doc 3!

• Highlight the two formulas and press the play button.• Results• Now the ID variable is
Numeric instead of string and the width for the string variable Ethnicity is now at 16 instead of 15.

• A helpful tool SPSS has is merging. This allows you to bring over variables from Doc B to Doc A. Today our doc B is Dataset2 and doc A is Dataset1.• First! You have to decide which
variable you will be using for the match. This variable must be present in both documents you will be merging [i.e. student ID’s].• For today we will be using the
‘ID’ variable for all merging.
• Second, make sure that the ID variable is Ascending on both datasets! Otherwise, the merge won’t work. • You can do this by right
clicking on the variable you need, in this case ID and then clicking sort ascending as was shown in the first Workshop for SPSS Basics.

• Third, you want to make sure there are no duplicate cases in your file. If there are, then the merge will be stopped by SPSS. • You can check this by
going to the Data tab -> Identify duplicate cases.• The pop up screen like the
picture to your left will then show up.

• Click on the ID variable and bring it into the ‘Define matching cases by:’ box. • Next look at the Variables to
Create box, here it is asking if you want the last case of a group or the first one to be flagged as your primary. This is useful if you have another category you want the duplicate cases to be arranged.• For this workshop we will leave
the, Variables to Create, as is.

• Now click OK. • You will then get an output screen,
showing you if there were duplicates and how many or if there are none.
• Ours shows that there are none. • This also provides a new variable
named PrimaryLast, this variable is useful to use if there are duplicates.
• If you did have duplicates you could then do a data select of PrimaryLast =1, in the output box select delete unselected cases, then click on OK. It would then eliminate the duplicate cases.
• This picture on the bottom, shows what it would look like if there were duplicate cases.
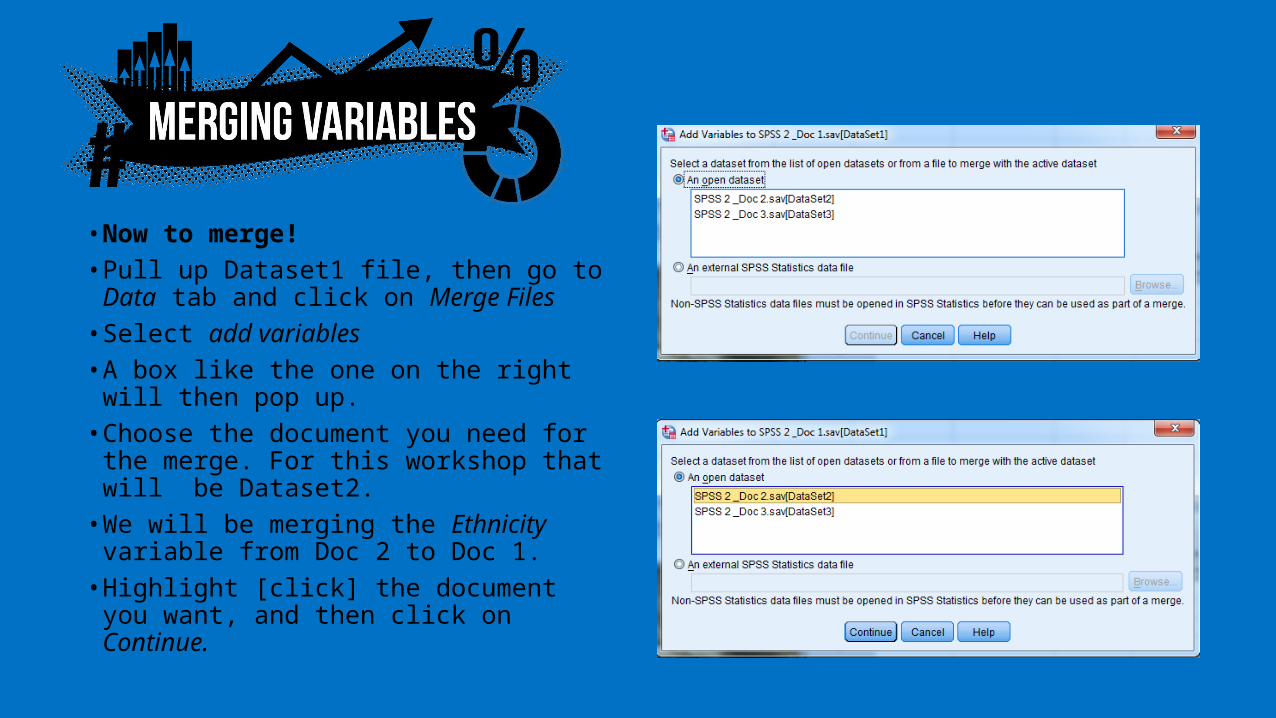
• Now to merge!• Pull up Dataset1 file, then go to
Data tab and click on Merge Files• Select add variables• A box like the one on the right will
then pop up. • Choose the document you need
for the merge. For this workshop that will be Dataset2.
• We will be merging the Ethnicity variable from Doc 2 to Doc 1.
• Highlight [click] the document you want, and then click on Continue.

• After clicking Continue you will get another pop up box like the picture to your left. • The ‘excluded variables’ are
those that are in both data sets.• Those in the ‘New Active
Dataset’ that have an (*) are variables from doc 1; while those with (+) are variables from Dataset2. These are the one’s you are able to add to Dataset1.

• Now, highlight the ID variable.• Click the following boxes: ‘Match cases on key
variables’, ‘Cases are sorted in order of key variables in both datasets’ and ‘Non-active dataset is keyed table.’
• Then click the arrow toward the Key Variables box and it will bring over the ID variable to that box.
• Now you have two options, you can click Paste and it will then paste the formula for the merge in a syntax or you can click on OK and it will start the merge.
• Clicking paste is handy if you need to merge multiple times, this allows you to change a few pieces on the syntax and then run it for another file.
• For this workshop click on PASTE.• *go to next page when you see the warning box.

• You will then get this warning.
• It is once again letting you know that if your variables are not ascending then it will not do the merge.
• We made sure the variable ID was in the beginning.
• Click OK.
• Since we made sure there were no duplicates and that both the variables of ID were ascending order, in Dataset1 and 2, this formula will run smoothly.
• Go to your syntax box, you will now see the formula for the merge. Highlight that formula [Starts with Match Files] and then press the play button. Remember to have the right Active dataset!
• As shown to the left. Ethnicity is now added to the Dataset 1.

• Now lets say we have a document from another year or section of something and we want to add all the cases in one file to another. They have the same variables in both, so we can’t add variables we need to add cases.
• We will be using Dataset1 and Dataset3 for this merge. We want to merge the content on Dataset3 to Dataset1.
• It does not matter if cases are ascending or if there are duplicates for add cases.

• First, pull up the Dataset1 file.• You will once again go to
the Data tab and click on Merge Files.• But this time you will click
on add cases. • You will get the same pop
up box, this time click on Dataset3 and then click on continue.

• A pop up box, like the picture to your left, will come up.
• ‘Unpaired variables’ are variables that are in both files but are not matching in both files on either their name, type, width or decimal. It is important to make sure any variables you need are not in this section, because they will be deleted after the merge if left in this box.
• To prevent important variable from being erased you can click on the variable then use the arrow to bring it over to the right, or if they are the same variable. Go to the documents and make sure that their name, type, width or decimal are the same and when you try again the variable should not be in the ‘unpaired variables’ any longer.
• Though we cleaned our documents through our syntax's earlier in this workshop the variable PrimaryLast is in the unpaired variables. Go ahead and leave it there, it will be erased from our new file.
• Once again the (*) are the variables that are the active dataset, and (+) are from the second file you want to get cases from.

• Okay now for the merge, as you can see all of our variables matched correctly, which is shown by all the variable being placed in the ‘Variables in New Active Dataset’ box.
• Now click PASTE. • Pull up your syntax box, you will now
see the merge cases formula [starts with Add Files]. It should be 5 lines long. Highlight that formula then for the Dataset1 dataset, press the play button.
• Now your cases from Dataset3 are now added to Dataset1.

• Now lets say you want to see what the ethnicity % breakdown is by ClassLevel, you would then do a custom table. • First, pull up your Dataset1
file.• Go to Analyze and click on
Tables then click on Custom Tables. • A pop up box like the pic on
your left will then come up.

• Once you have the pop up box, click on ClassLevel and drag it over to the rows side. Once the rows becomes bolded in a red outline you can then let go of the variable, and it will be brought over.
• Now click on ethnicity and drag it over to the right hand side of where it shows ‘categor.’ on ClassLevel.
• You will see a red rectangle appear, if it is all the way to the right within that ‘Categor’ box then you are correct and let go of the mouse.
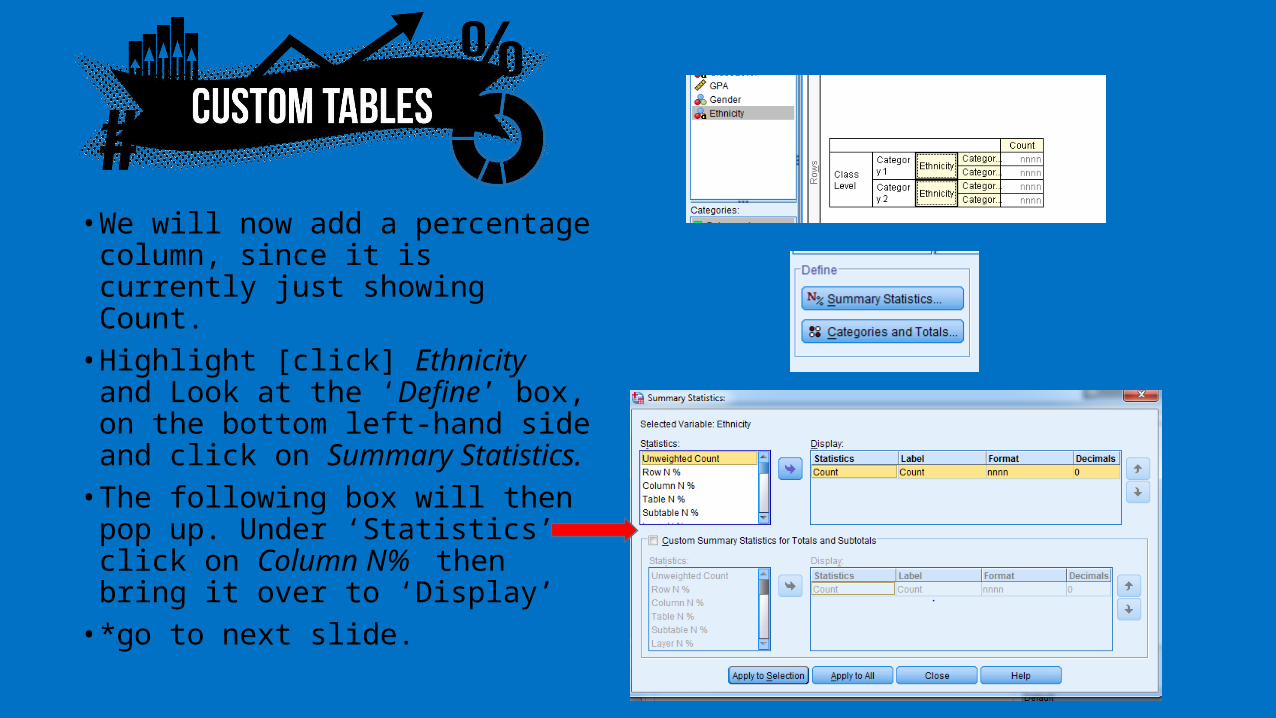
• We will now add a percentage column, since it is currently just showing Count. • Highlight [click] Ethnicity and
Look at the ‘Define’ box, on the bottom left-hand side and click on Summary Statistics. • The following box will then pop
up. Under ‘Statistics’ click on Column N% then bring it over to ‘Display’ • *go to next slide.
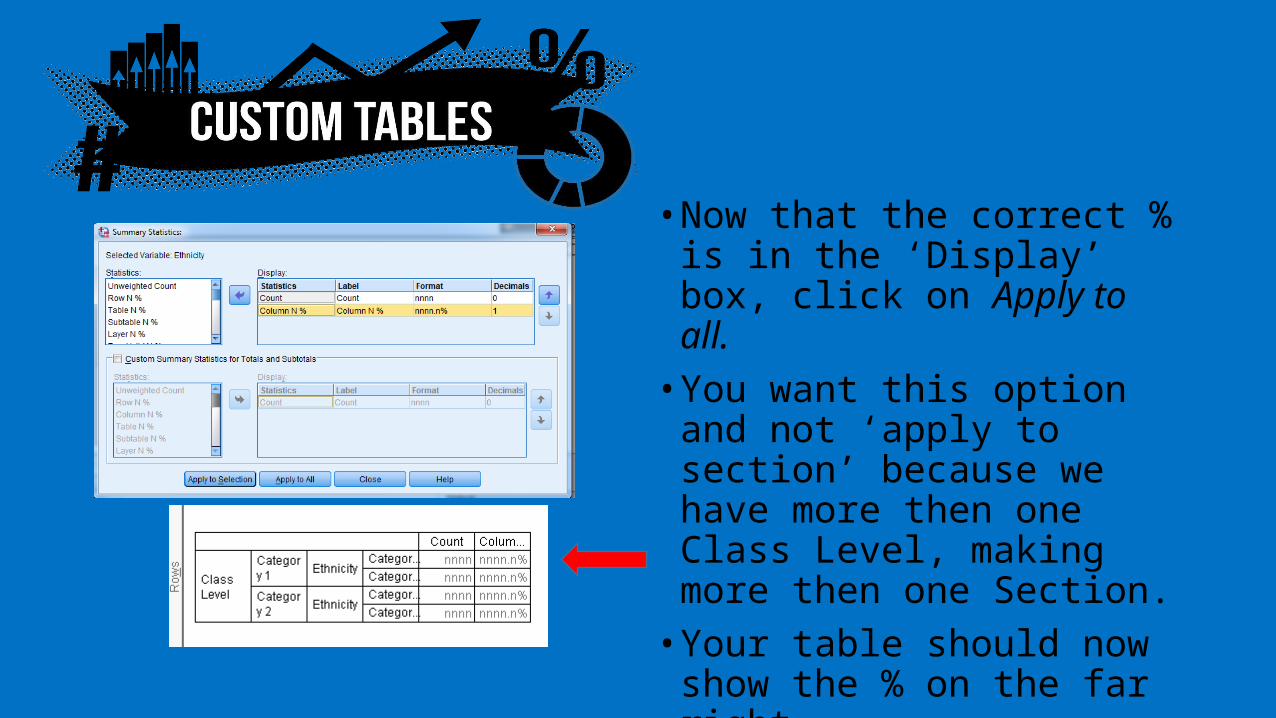
• Now that the correct % is in the ‘Display’ box, click on Apply to all. • You want this option and
not ‘apply to section’ because we have more then one Class Level, making more then one Section. • Your table should now
show the % on the far right.
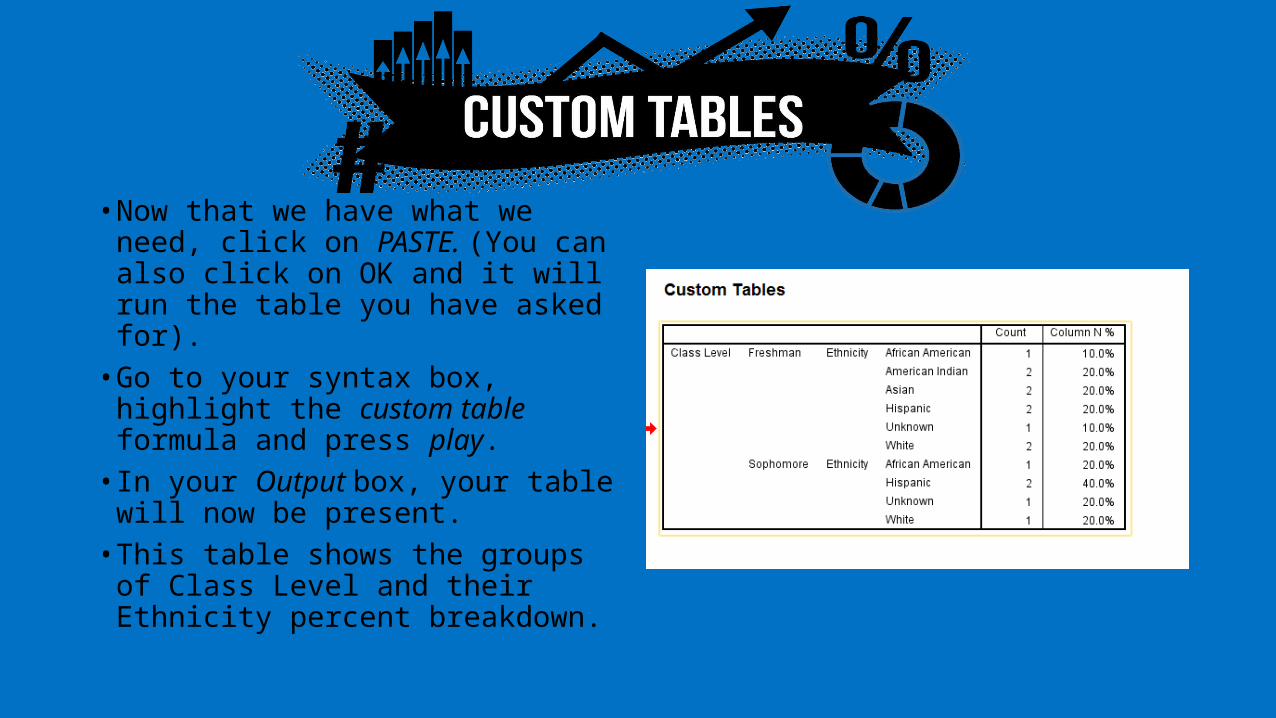
• Now that we have what we need, click on PASTE. (You can also click on OK and it will run the table you have asked for). • Go to your syntax box,
highlight the custom table formula and press play.• In your Output box, your table
will now be present.• This table shows the groups of
Class Level and their Ethnicity percent breakdown.

• Lastly we will be doing Cross tabs. • Cross tabs are useful if you want
to see the total count for each variable by group but also how many are presently in each group and subgroup. • This table is like a multiplication
table, you will be able to select a group on the X axis [with one figure] and one on the y and then if you move till your fingers meet, you will see a count for the two groups you were following.

• First, pull up Dataset1 and go to Analyze.
• Click on Descriptive Statistics.• And then click on Crosstabs.• A new pop up box will appear, as
shown on the left. • Today is going to be basic, we are
going to place the Ethnicity variable in the Row section and ClassLevel in the column section.
• Do not worry about any other section or button for this workshop.

• In order to add in the selected variable in the row or column section, click on the variable and then click the arrow to the selected section to bring it over. Or you can click on the variable and drag it over to the right box you want the variable to be placed in.• Now click PASTE. • Pull up for Syntax box and
highlight the crosstabs formula. Press the Play button and then look at your output box.
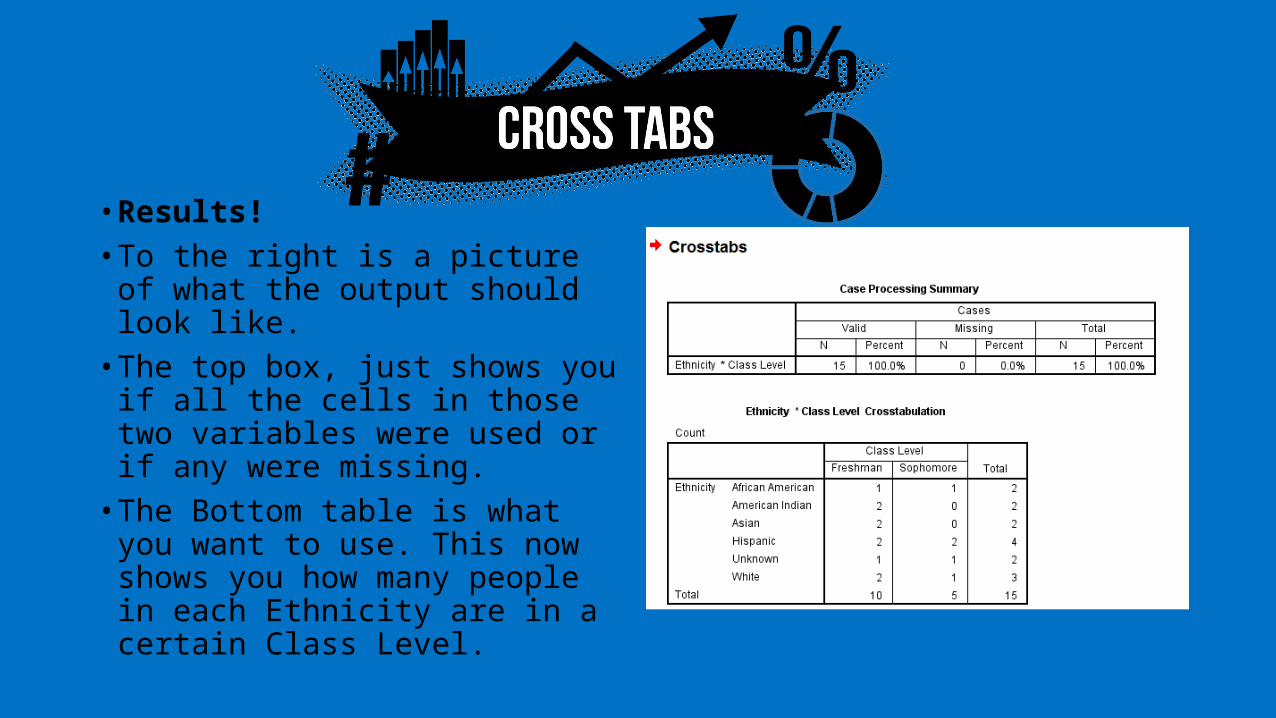
• Results!• To the right is a picture of
what the output should look like. • The top box, just shows you if
all the cells in those two variables were used or if any were missing.• The Bottom table is what you
want to use. This now shows you how many people in each Ethnicity are in a certain Class Level.

• Now that we have all our data in a single file, lets save it!
• Go to the File tab and then click on Save As.
• For the purpose of this workshop we will save it on the desktop and name it Merged.
• We want the ‘Save as type:’ to be SPSS, though the drop box will also show you other options, one being excel.
• Then click on Save. (though there is also a paste button here as well if you want to add it to a syntax).
• Look on your desktop, you should see you saved file presently there.
•Questions/comments?•Upcoming Workshops:• January 15: Adobe Illustrator• February: SPSS Basics –Part 3 [Date TBA]
•Contact Us• AD-170• 909-537-5052• [email protected]
