avoiding pitfalls in shale or other oil & gas...
TRANSCRIPT

AVOIDING PITFALLS IN SHALE OR OTHER OIL & GAS DEVELOPMENTS
APRIL 16, 2014
SPE GCS
FACILITIES & OPS
GEORGE E. KING, P.E.
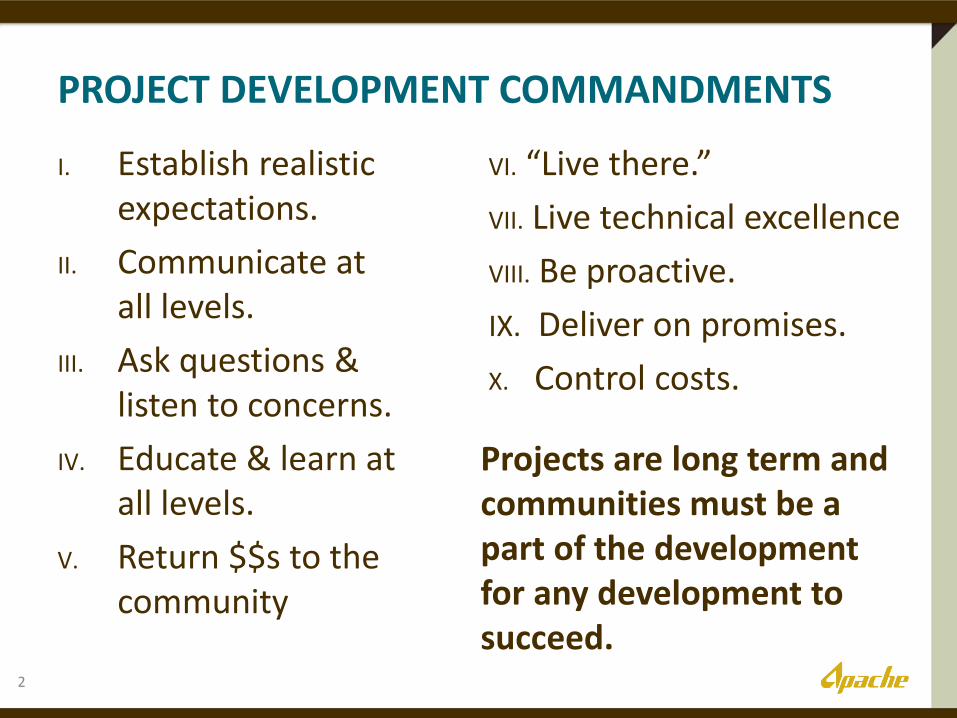
I. Establish realistic expectations.
II. Communicate at all levels.
III. Ask questions & listen to concerns.
IV. Educate & learn at all levels.
V. Return $$s to the community
VI. “Live there.”
VII. Live technical excellence
VIII. Be proactive.
IX. Deliver on promises.
X. Control costs.
PROJECT DEVELOPMENT COMMANDMENTS
2
Projects are long term and communities must be a part of the development for any development to succeed.

SEQUENCE OF EVENTS IN A DEVELOPMENT
3

UNCONVENTIONAL PLAYS ARE TECHNOLOGY DRIVEN
4

Reality is reality. It is “Just the Facts” – but, which are often in scarce supply and can be twisted.
Perception is a measure of our ignorance on any given subject at a point in time. Perception can be changed with education, but education takes time and is a better preventative than a cure. Educate early!
HOWEVER – if perception is not treated with education, it can become a long term “reality”, nearly always in a detrimental way.
MY THOUGHTS ON PERCEPTION AND REALITY
5

From the Community To Management & Workers
Are there jobs? How long will this
last? (benefit vs. congestion)
How much will it disrupt our lives?
Will it tie up traffic? What are the
hazards? “Can you put it
somewhere else?”
Who benefits?
How many wells will it take to “work”?
What is the market & what will competitors do?
What technology is needed?
How to control costs?
ESTABLISHING EXPECTATIONS
6

HIGH LEVEL REGIONAL CHECKS
7
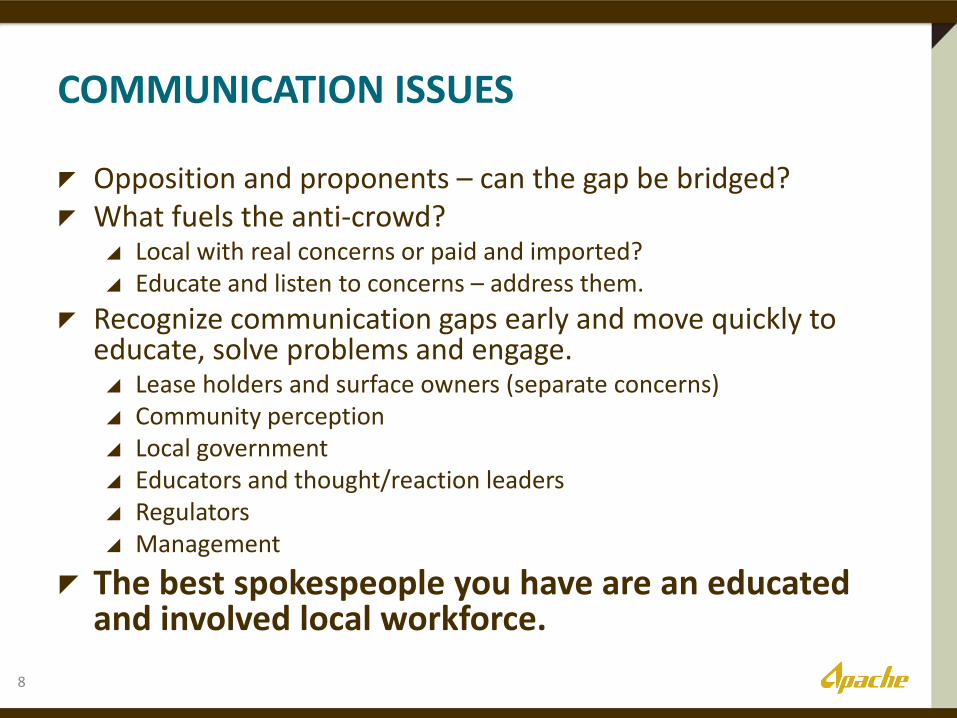
Opposition and proponents – can the gap be bridged? What fuels the anti-crowd?
Local with real concerns or paid and imported? Educate and listen to concerns – address them.
Recognize communication gaps early and move quickly to educate, solve problems and engage. Lease holders and surface owners (separate concerns) Community perception Local government Educators and thought/reaction leaders Regulators Management
The best spokespeople you have are an educated and involved local workforce.
COMMUNICATION ISSUES
8
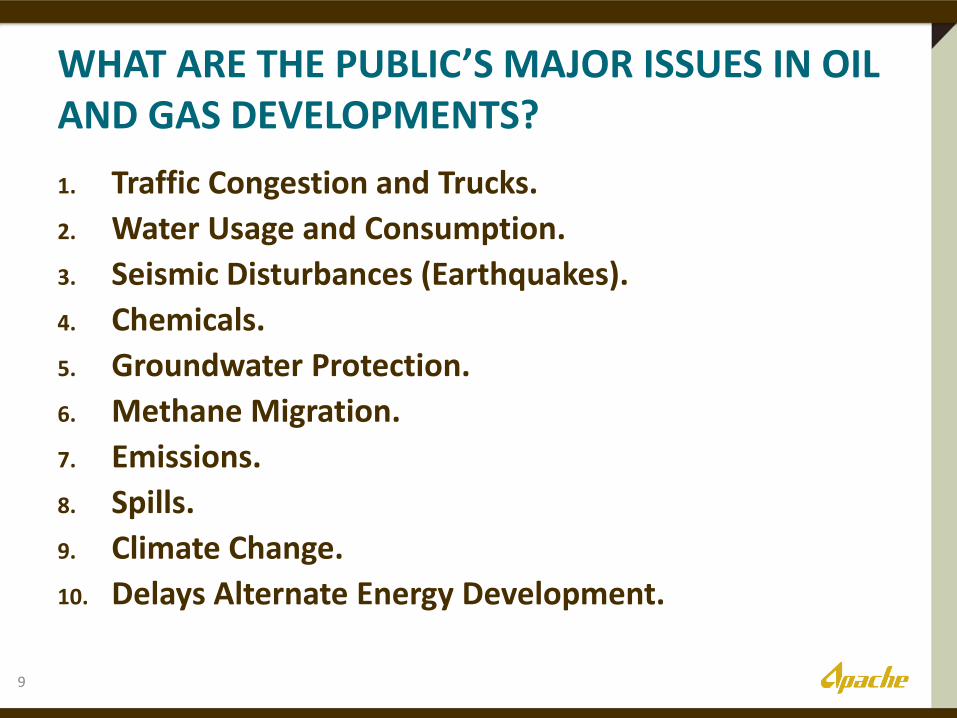
1. Traffic Congestion and Trucks.
2. Water Usage and Consumption.
3. Seismic Disturbances (Earthquakes).
4. Chemicals.
5. Groundwater Protection.
6. Methane Migration.
7. Emissions.
8. Spills.
9. Climate Change.
10. Delays Alternate Energy Development.
WHAT ARE THE PUBLIC’S MAJOR ISSUES IN OIL AND GAS DEVELOPMENTS?
9

1. Trucks – temporary pipelines, On-site recycle, dust control, scheduling
2. Water – put water use in perspective & stop using fresh water for fracturing
3. Seismic – pre-lease investigation & lessen disposal needs by recycling.
4. Chemicals – limit use to EPAs D.F.E. or North Sea Gold Band products.
5. Groundwater protection – prevent spills, pre-lease review of pay zone depth and barriers. Know the barriers and warning signs.
6. Gas Migration – highly localized, educate and work through gas issues. Limit air drilling.
7. Emissions – no venting, minimize flaring, use air for controls, not gas.
8. Spills – transport changes, who is driving the trucks?
9. Climate change – educate, gas use reduces all pollutants.
10. Alternate energy – explain cyclic problems of alternate energy sources & how to use it in combination with your development (recycling, powering pad equipment, etc.).
WHAT ADDRESSES THE ISSUES?
10
Produced Water Re-injection (floods)
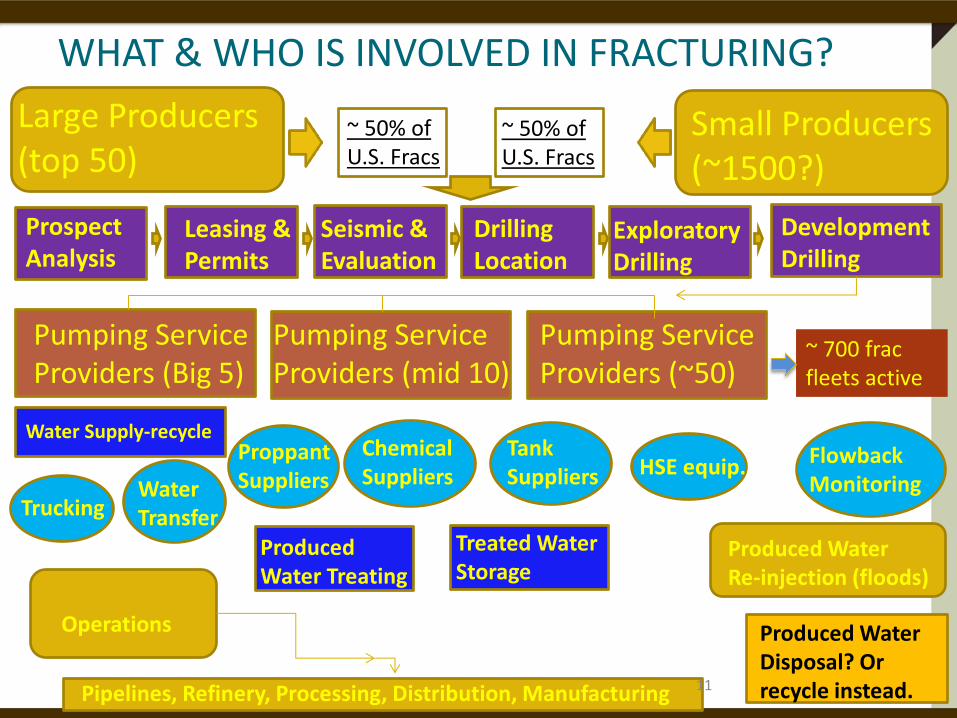
WHAT & WHO IS INVOLVED IN FRACTURING?
Large Producers (top 50)
Small Producers (~1500?)
Pumping Service Providers (Big 5)
Pumping Service Providers (mid 10)
Pumping Service Providers (~50)
~ 700 frac fleets active
Trucking Water Transfer
Proppant Suppliers
Chemical Suppliers
Tank Suppliers HSE equip. Flowback
Monitoring
Water Supply-recycle
Produced Water Treating
Produced Water Disposal? Or recycle instead.
~ 50% of U.S. Fracs
Treated Water Storage
Operations
~ 50% of U.S. Fracs
Prospect Analysis
Leasing & Permits
Seismic & Evaluation
Drilling Location
Exploratory Drilling
Development Drilling
Pipelines, Refinery, Processing, Distribution, Manufacturing 11

12
13
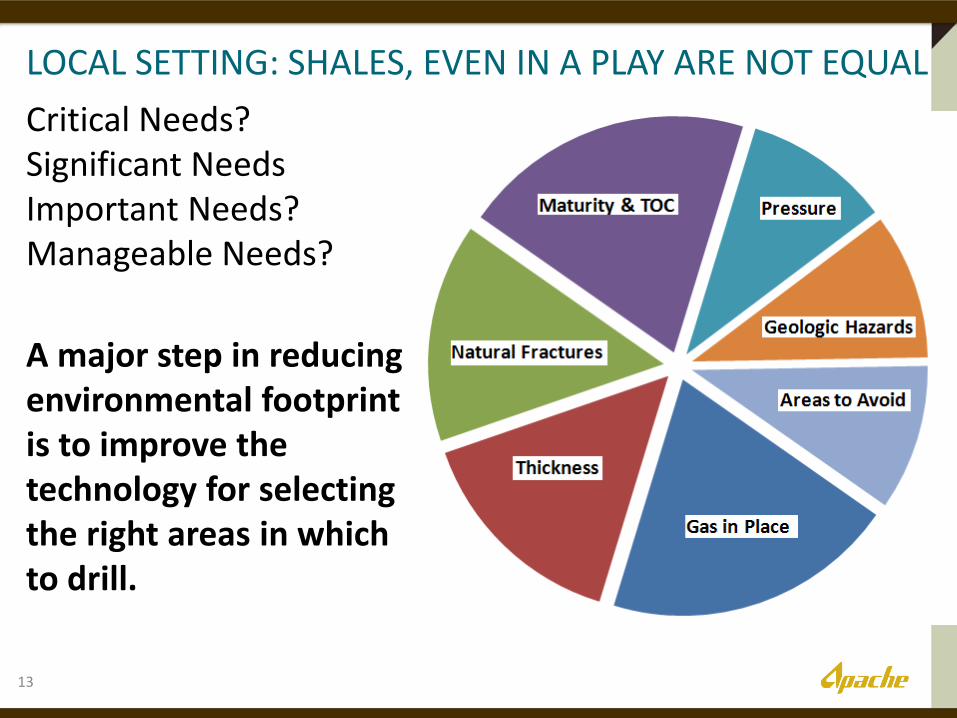
LOCAL SETTING: SHALES, EVEN IN A PLAY ARE NOT EQUAL
Critical Needs? Significant Needs Important Needs? Manageable Needs?
A major step in reducing environmental footprint is to improve the technology for selecting the right areas in which to drill.

Of the shale wells drilled to date, an estimation can be made that:
1/3rd of shale wells are not economical – mostly older wells
1/3rd of shale wells are marginally economical.
1/3rd of wells are so economical that they carry the development.
THE 1/3 : 1/3 : 1/3 CLASSIFICATION & HOW TO IMPROVE THE ODDS AND LOWER RISK.
14
We could possible achieve ~33% or more savings in shale development, reduce water & chemicals by half and slash emissions, if we could eliminate the bottom 1/3rd of wells and improve the marginal characteristics of the middle third of shale wells.
Nature controls location, hydrocarbons in place, depth, pressure & natural flow paths. Operators control drilling and completion, stimulation and production. Politicians control regulations and taxes.

FINDING THE SWEET SPOT LOWERS RISK OF POOR WELLS.
15
Focusing the drilling using technology is the best way to maximize economics and minimize the number of wells.

HOW DO FLUIDS TRAVEL IN THE ROCK?
16

IDENTIFYING AND MANAGING RISK (FROM SPE 152596 – ESTIMATING AND EVALUATING FRACTURING RISK)
1.Spill clean fresh or salt water 2.Spill biocide 3.Spill dry additives 4.Spill of diesel from truck wreck 5.Spill of diesel -wrecked re-fueler 6.Spill frac tank water, no adds 7.Spill frac tank water w/adds 8.Spill diesel fuel while re-fueling 9.Spill of frac tank -flowback water 10. Frac press ruptures surface casing 11. Cooling pulls tubing out of packer (casing maintains integrity) 12. Mud channel, well < 2000 ft 13. Mud channel, well > 2000 ft 14. Intersects well in the pay zone 15. Intersect properly abandoned well 16. Intersects improperly abandoned well 17. Frac to surface through rock, well greater than 2000 ft deep. 18. Earthquake, mag. >5.0 19. Frac intersects a natural seep 20. Emissions > background 21. Normal frac operation – no problems.
The Red / Yellow / Green designations are an attempt at comparison bracket of operational states of must avoid / caution / acceptable risk measurements.

Many oil & gas wells penetrate major and minor aquifers.
Longstanding (Texas) History:
Freshwater protection regulations (depth, cement surface casing, pressure test) starting in the 1930’s and sharply tightened in late 1960’s.
Approximately 300,000 producing wells including 50,000 injection wells
Approximately 500,000 fracturing operations since 1950 AQUIFERS – Texas Water Development Board
OIL & GAS FIELDS – Bureau of Economic Geology, UT Austin
Know the territory you want to develop. What are the hazards?
18
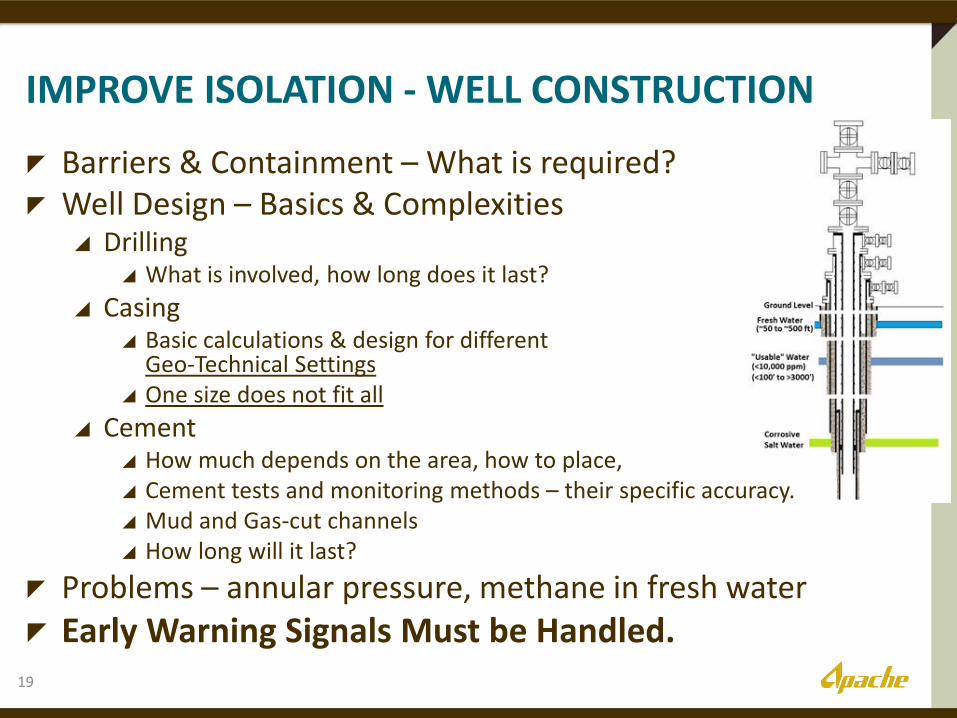
IMPROVE ISOLATION - WELL CONSTRUCTION
Barriers & Containment – What is required? Well Design – Basics & Complexities
Drilling What is involved, how long does it last?
Casing Basic calculations & design for different
Geo-Technical Settings One size does not fit all
Cement How much depends on the area, how to place, Cement tests and monitoring methods – their specific accuracy. Mud and Gas-cut channels How long will it last?
Problems – annular pressure, methane in fresh water
Early Warning Signals Must be Handled. 19

CEMENT SEAL IS IMPORTANT – CEMENT TOP IS EVEN MORE IMPORTANT IF IN DOUBT - RUN MORE CEMENT THAN REQUIRED AND DO MORE TESTING.
20

MULTI-FRACTURED HORIZONTAL WELLS ARE ACTUALLY MORE ENVIRONMENTALLY SOUND.
Shales are so low permeability that the gas inflow is controlled by the area of the shale that is actually stimulated and contacted by the fracturing treatment.
• Each horizontal well can replace 10 to 30 vertical wells.
• Horizontal & extended reach wells can often be grouped into pad developments.
12 wells on one 6 acre pad drain 6000 acres of reservoir. Footprint reduced by 93% over vertical well development – Apache Canada

DEVELOPMENT BY VERTICAL OR HORIZONTAL WELLS? 9+ SQ. MILE AREA (6000 ACRES)
Horizontal well advantages: • Less land used •Agreed upon pad placement • Less traffic, • Less dust, • Less urban / wildlife disturbance,
• Less air pollution. • All wells penetrate the ground in the same area – can be easily monitored •Sharply lower methane vapor loss (low press capture and compression)
6000 acres: Items Vertical Wells
Horizontal Well Pad
Wells (80 acre spacing) >75 12
Roads (miles) 28 2
Gas/Oil Pipelines (miles) 30 4
Frac Water supply pipeline (miles)
30 2
Facility Pads 8 1
Trucking Miles (on pad) 45000 36000 (or 1400 with water pipeline)
Rig Mob/De-Mob 75 1
Fresh water monitor area 6000 acres 8 acres
Pad Footprint (acres) 150 6
Total Development Footprint 566 acres 45
Total Production Footprint 491 acres 33 22

Sand System
Automated Refueling System
Facility Installation
HP Frac Manifold Acid Pumping Kit
Pumpdown Kit
Slick-Cable Trucks
Debolt Water Pipeline
CT Pumpers
P Tank(s)
MCC
Wellheads GORV
Over 100 people on site 24/7 • Learning: Both Surface and Sub-surface simultaneous operations plans are mandatory.
• Safety training updates are required to enter site and monitored by continually updated entry passes.
• Improvements in economics and safety seen year-on-year 23

Frac Jobs Use Millions of Gallons of Water and this can total 50 to 100 billion gallons per year in Texas (home to half of all US wells & fracs in 2013). But in perspective: City of Houston loses ~22 billion gallons of drinking
water per year from line leaks (Houston Chronicle). Municipal water losses from 54% of cities in TX
were 225 billion gallons in 2010 (TX Water Development Board).
Just 2 of the 19 coal fired TX power plants use twice the water than Eagle Ford Fracturing Uses in a Year.
For 2011 thru 2013, for all 3 years total, Fracturing used 25% of 1 day’s water use in the US.
Americans use 9 trillion gallons watering lawns & golf courses every year (EPA). In TX, that’s 18 times more water on lawns than in a year of Fracs – every year.
In many areas, Apache is using 100% brackish water and virtually no fresh water.
ARE WE REALLY RUNNING OUT OF WATER FOR FRACTURING? – PUT IT IN PERSPECTIVE.
24
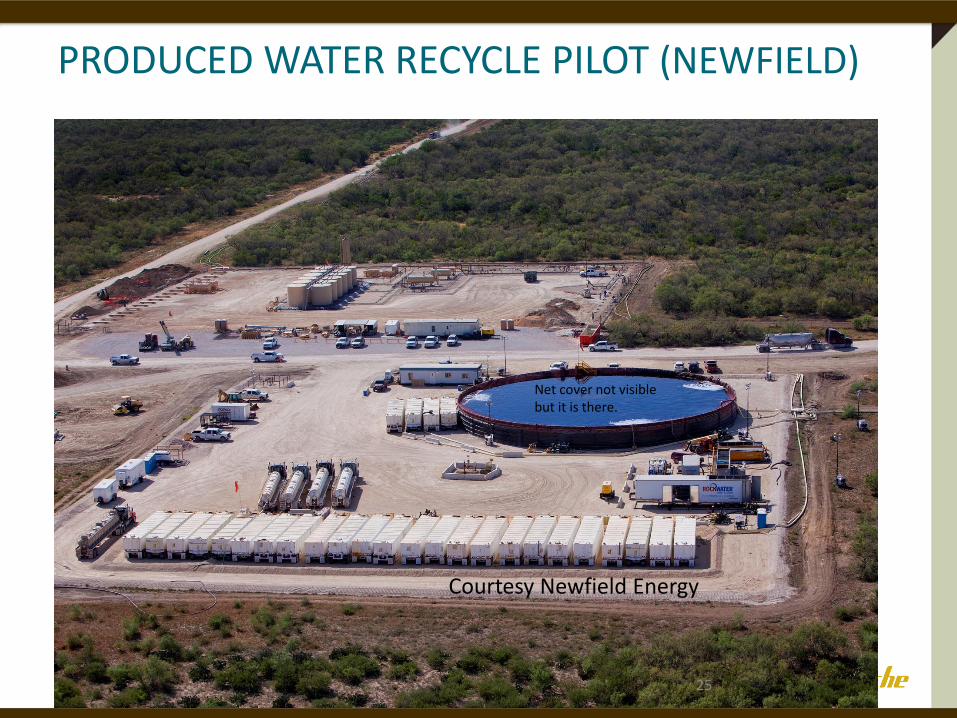
PRODUCED WATER RECYCLE PILOT (NEWFIELD)
Net cover not visible but it is there.
Courtesy Newfield Energy
25
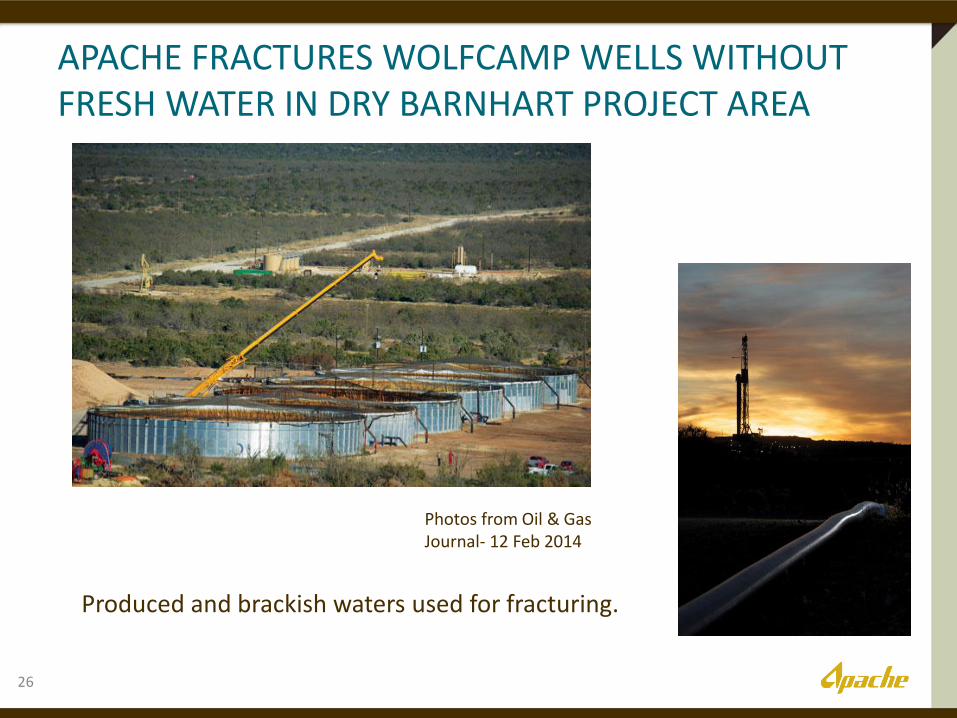
APACHE FRACTURES WOLFCAMP WELLS WITHOUT FRESH WATER IN DRY BARNHART PROJECT AREA
26
Photos from Oil & Gas Journal- 12 Feb 2014
Produced and brackish waters used for fracturing.

FRESH WATER IS ACTUALLY PRODUCED WHEN METHANE IS BURNED AS A FUEL.
Average gas shale frac uses 5,000,000 gallons of water (salt water is replacing some fresh water as fracturing fluid).
When methane is burned as a fuel:
CH4 + 2O2 => CO2 + 2H2O
100,000 BTU of methane => 9.41 lb of water
100,000 BTU (methane) = 100 scf of methane
1 mmscf of methane produces [(1,000,000/100 * 9.41)/8.33 lb/gal] = 11,300 gal
1 bcf produces 11,300,000 gallons of fresh water
Gas shale wells produce 1 to 10+ bcf over their lifetime.
27

FRACTURING FLUIDS – WHAT ARE THEY? WHAT IS THE RISK?
Slick Water Fluids – salt or fresh water with friction reducer & biocide. 0.05% to 0.2% total additives.
Risk level – v. low chemically, fractures are small. ----------------------------------------------------------------
Hybrid or Gelled Fracs – salt or fresh water with polymer, x-linker, biocide, acid, scale inhibitor, breaker, etc. 0.25 to 0.1% additives.
Risk level – low chemically, fractures wider, taller & longer.
28
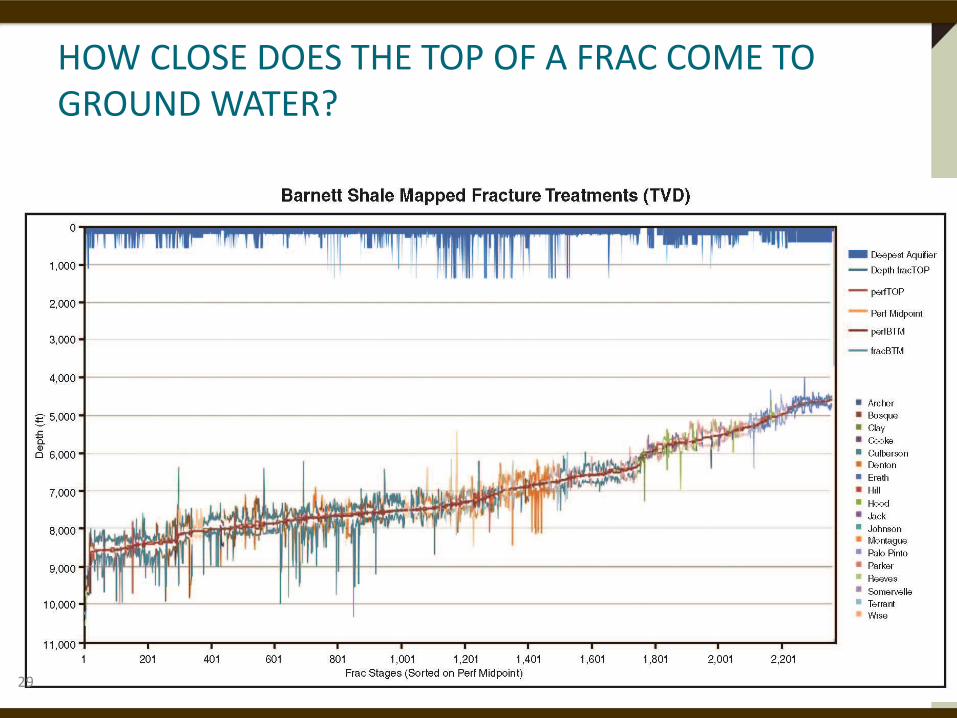
HOW CLOSE DOES THE TOP OF A FRAC COME TO GROUND WATER?
29

HOW CLOSE DOES THE TOP OF A FRAC COME TO GROUND WATER?
30

USING TECHNOLOGY: FRAC MONITORING METHODS EDUCATE YOURSELF AND THE COMMUNITY ON HOW TO MONITOR YOUR WELLS. SHOWCASE YOUR OPERATIONS.
Frac Monitoring
Technique
Frac Loc.
in Well
Frac
Direction
Frac
Height
Frac
Length
Investigation
Timing
Comments
Surface Pressure No No Indirect No Real Time
Downhole Pressure No No Indirect No Post Frac or
Real Time
More accurate
than surface
pressure
Fiber optic, (temp,
press, sound)
Yes No No No Real Time Run on casing
Microseismic Yes Yes Yes Yes 5 min. delay
Tilt Meters Yes Yes Yes Yes 5 min. delay
Temperature Logging Yes No Vert. wells No Post frac Vert. Wells
Tracer Tagged
Proppant
Yes Transverse or
longitudinal Only in
vertical
No Post Frac Investigation to a
few inches
Chemical Tracers in
frac fluid
No No No No Post Frac Tag water or oil
Production Log Yes No Only in
Vertical
No Post Frac
Pressure Build Up,
Production Tests &
Interference tests
No Indirect Indirect Indirect Post Production
31

SO – WHAT ARE RISKS TO GROUNDWATER BY OIL & GAS ACTIVITIES? Major Risk
Poor performance by the few.
Not understanding the ABSOLUTE importance of cement and coupling performance in establishing isolation.
Lack of effective maintenance.
Moderate Risk Transport wrecks & spills of on-site stored chemicals
Poor cementing practices and improper coupling selection and make-up
Minor Risks Drilling phases (generally not on shales: low perm)
Well construction (early leaks) & older era or vintage wells.
Thread leaks (connections)
Near zero risks Properly placed and test cement in producing wells, regardless of age
The specific act of fracturing rock
32

Why is gas in my water well?? Gas migration >>200+ yrs.
old, highly regional, many causes, 1000’s of natural seeps.
SPE 166142, Barrier vs. Well Failure, King
High Risk
Low Risk
Are there areas that you shouldn’t drill?

SPE 166142, Barrier vs. Well Failure, King
Methane Seepage from Soils Oil & Gas Seeps are indicators of oil & gas beneath the surface. Gas and Oil
seeps in PA & New York were mapped by explorers in the 1600’s. First gas
well in NY was 28 ft deep, Drake’s oil well in PA was 69 ft deep. How deep are
the fresh water wells there?
Many natural seep flows diminished as wells were drilled & produced. Coal
Point Seep (Santa Barbara Channel, CA) is an example.

First – it is Produced Fluid – not a waste. It has value.
Returning Fluid Composition: Frac base water and frac
additives Waters from one or more
formations A variety of salts and ions –
some stable, some not. Isotopes that can range from
benign to low dose radioactive Solids of silica and many other
minerals Hydrocarbon gas and liquids Other gases
Consistency – highly variable Early time gaining salinity Late time – less saline?
FLOWBACK – WHAT IS IT? HOW LONG DOES IT LAST?
35
Experience with large developments shows total cost of water (acquiring, treating, trucking and disposal or recycle), shows recycled water much cheaper than fresh water without recycle.

1,000
10,00
0
100
,000
1,000
,000
10,00
0,000
Lakeview Gusher,CA Onshore, 1910
Santa BarbaraBlowout, CA, 1969
Tanker Grounding,MA, 1976
Tanker Grounding,AK, 1989
Tanker Grounding,TX, 1990
Sabotage, Kuwait,1992
Tanker Grounding,LA, 2000
Pipelines Rupturedby Hurricanes,…
Barge Collision, LA,2008
Tanker Collision, TX,2010
Pipeline Corrosion,MI, 2010
Macondo Blowout,GOM, 2010
Natural Seeps,Coal Point, CA, Yearly
Natural Seeps,GOM, Yearly
BARRELS
Single Estimate
High Value Range
Comparing
Spills & Seeps
Various sources – data
in SPE 166142
Natural seep volumes of oil into the Gulf of Mexico alone total about ¼ of the volume of the Macondo spill – every year!
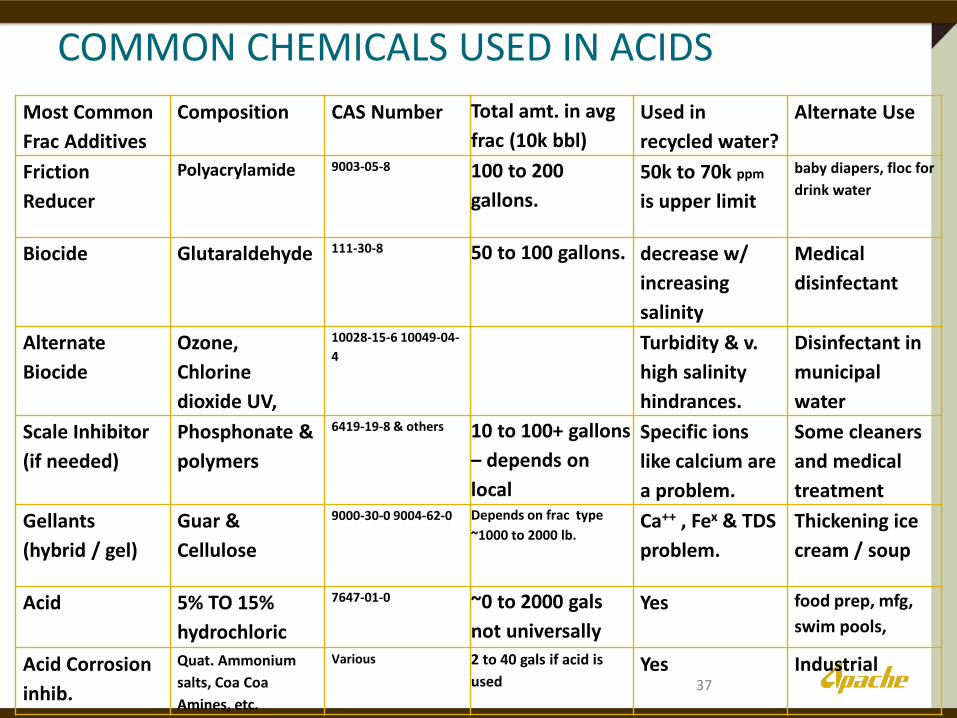
Most Common
Frac Additives
Composition CAS Number Total amt. in avg
frac (10k bbl)
Used in
recycled water?
Alternate Use
Friction
Reducer
Polyacrylamide 9003-05-8 100 to 200
gallons.
50k to 70k ppm
is upper limit
baby diapers, floc for
drink water
Biocide Glutaraldehyde 111-30-8 50 to 100 gallons. decrease w/
increasing
salinity
Medical
disinfectant
Alternate
Biocide
Ozone,
Chlorine
dioxide UV,
10028-15-6 10049-04-
4 Turbidity & v.
high salinity
hindrances.
Disinfectant in
municipal
water
Scale Inhibitor
(if needed)
Phosphonate &
polymers
6419-19-8 & others 10 to 100+ gallons
– depends on
local
Specific ions
like calcium are
a problem.
Some cleaners
and medical
treatment
Gellants
(hybrid / gel)
Guar &
Cellulose
9000-30-0 9004-62-0 Depends on frac type
~1000 to 2000 lb. Ca++ , Fex & TDS
problem.
Thickening ice
cream / soup
Acid 5% TO 15%
hydrochloric
7647-01-0 ~0 to 2000 gals
not universally
Yes food prep, mfg,
swim pools,
Acid Corrosion
inhib.
Quat. Ammonium
salts, Coa Coa
Amines, etc.
Various 2 to 40 gals if acid is
used Yes Industrial
COMMON CHEMICALS USED IN ACIDS
37

WATER MANAGEMENT: QUANTITIES FLOWED BACK IN SHALE RESERVOIRS (RANGES)
Basin or Area
% Frac Water Recovered
Typical Frac Volume Used (Gal.)
Typical Chemical % in Frac
Chemical % in Flowback (Gross Est.)
Barnett 30 to 50% 4 to 5 mm 0.2% <0.05%
Devonian 40 to 50% 4 to 5 mm 0.2% <0.1%
Eagle Ford 5 to 10% 4 to 5 mm 0.3 to 0.4% (Hybrid Frac)
<0.2% (polymer dominated)
Fayetteville 30 to 60% 3 to 4 mm 0.2% <0.05%
Haynesville 5 to 15% 4 to 6mm 0.3% (Hybrid Frac)
<0.1% (polymer dominated)
Horn River 30 to 50% 10 to 12mm (salt water Supply wells)
<0.1% (Apache) <0.05%
Woodford 30 to 50% 4 to 5 mm 0.2% <0.05%
Sources: SPE 133456, SPE 152596, communication with operators in these basins. Also SPE papers on produced water treating.
38
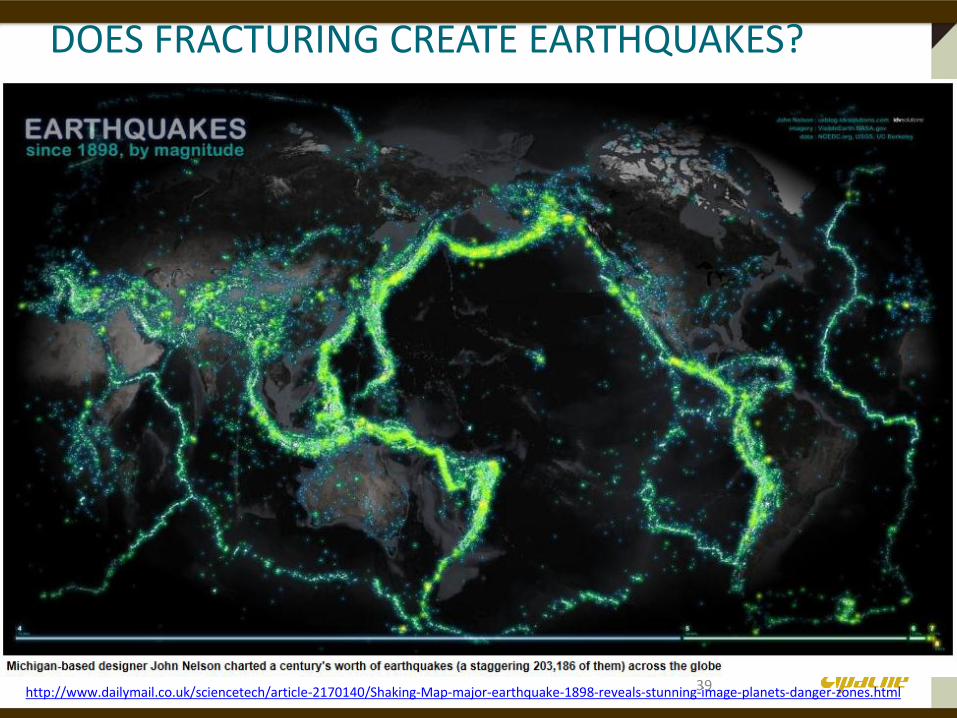
http://www.dailymail.co.uk/sciencetech/article-2170140/Shaking-Map-major-earthquake-1898-reveals-stunning-image-planets-danger-zones.html
DOES FRACTURING CREATE EARTHQUAKES?
39
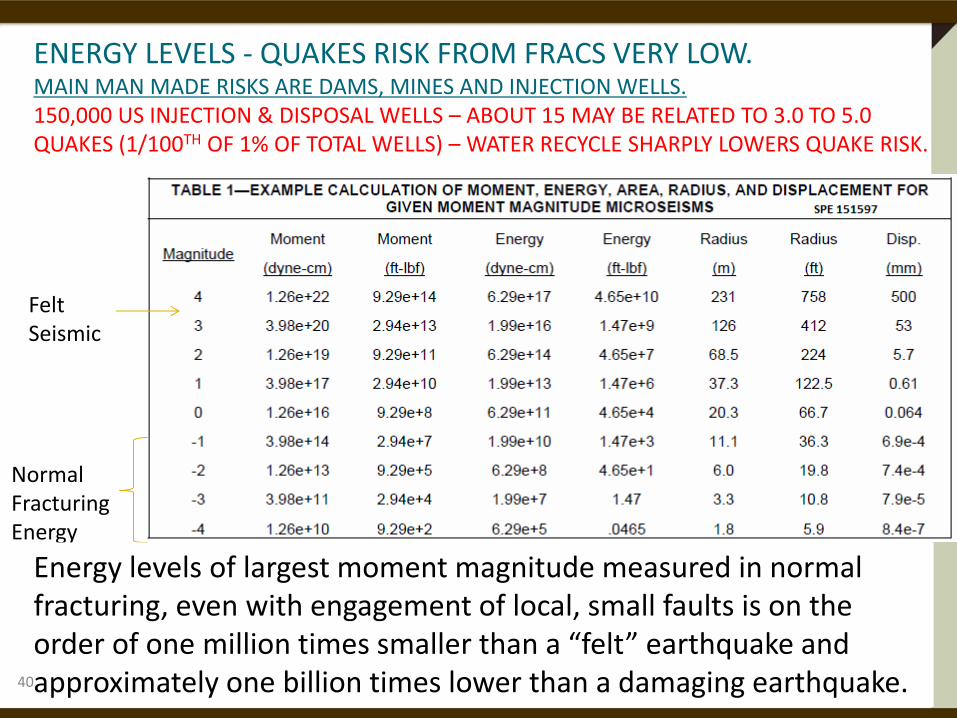
ENERGY LEVELS - QUAKES RISK FROM FRACS VERY LOW. MAIN MAN MADE RISKS ARE DAMS, MINES AND INJECTION WELLS. 150,000 US INJECTION & DISPOSAL WELLS – ABOUT 15 MAY BE RELATED TO 3.0 TO 5.0 QUAKES (1/100TH OF 1% OF TOTAL WELLS) – WATER RECYCLE SHARPLY LOWERS QUAKE RISK.
Felt Seismic
Normal Fracturing Energy
Energy levels of largest moment magnitude measured in normal fracturing, even with engagement of local, small faults is on the order of one million times smaller than a “felt” earthquake and approximately one billion times lower than a damaging earthquake. 40

EARTHQUAKES State Magnitude Date
Alaska 9.2 1964 03 28
Arkansas 7.7 1811 12 16
California 7.9 1857 01 09
California 7.8 1906 04 18
Colorado 6.6 1882 04 18
Louisiana 4.2 1930 10 19
Montana 7.3 1959 08 18
N Mexico 7 1906 11 15
New York 5.8 1944 09 05
N. Dakota 5.5 1909 05 16
Ohio 5.4 1937 03 09
Oklahoma 5.5 2011 11 06
PA 5.2 1998 09 25
TX 5.8 1931 08 16
Virginia 5.9 1897 05 31
W. Virginia 4.5 1969 11 20
Wyoming 6.5 1959 08 18
~7 quakes each day felt in U.S. Small quakes are common & swarms of ~20,000 in a few months are not unusual (Example 19,000 tremors in Eola AR, 3,000 in Mamoth Lake CA, and 500 in Moodus CN in 1982/83). Most high mag. earthquakes predate shale development & frac invention. For a damaging quake (6.0 or higher), stresses rip 100’s of miles of major faults. Major quake depths are 2 to >7 miles beneath the surface.
41

EARTHQUAKES ARE NOW MORE EASILY RECORDED AND ANNOUNCED. MORE SEISMIC STATIONS AND FASTER DATA ACQUISITIONS INCREASED NUMBERS OF SMALL QUAKES IN RANGE OF SENSORS.
42
1
10
100
1000
10000
100000
1990 1995 2000 2005 2010
WW Magnitude 8+ US 8+
WW 7 US 7
WW 5 & 6 US 5 & 6
WW 4 US 4
43
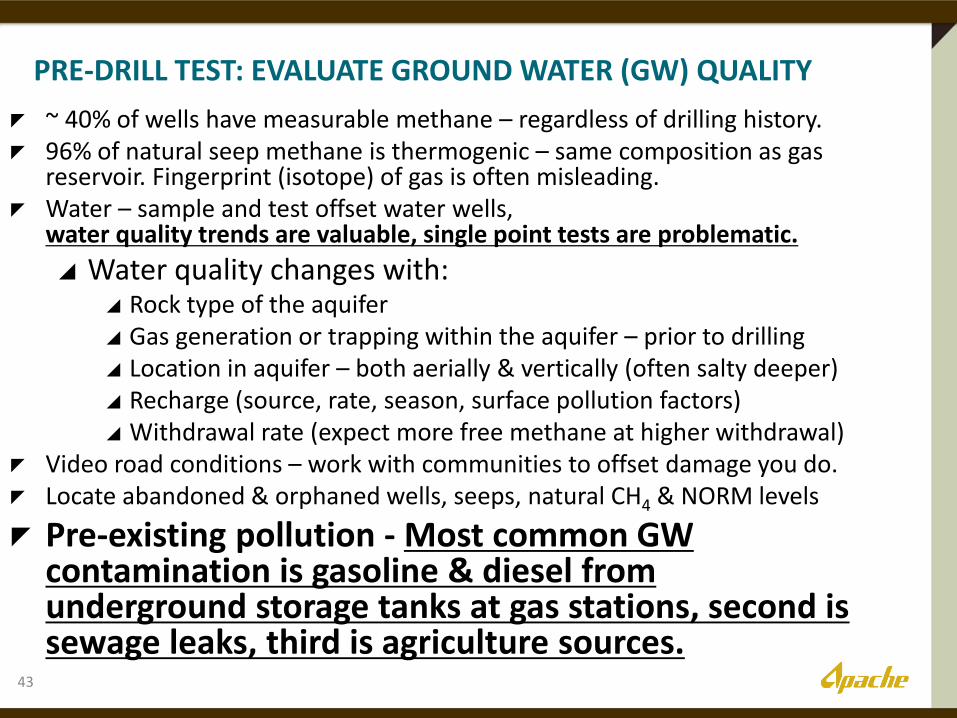
~ 40% of wells have measurable methane – regardless of drilling history. 96% of natural seep methane is thermogenic – same composition as gas
reservoir. Fingerprint (isotope) of gas is often misleading. Water – sample and test offset water wells,
water quality trends are valuable, single point tests are problematic.
Water quality changes with: Rock type of the aquifer Gas generation or trapping within the aquifer – prior to drilling Location in aquifer – both aerially & vertically (often salty deeper) Recharge (source, rate, season, surface pollution factors) Withdrawal rate (expect more free methane at higher withdrawal)
Video road conditions – work with communities to offset damage you do. Locate abandoned & orphaned wells, seeps, natural CH4 & NORM levels
Pre-existing pollution - Most common GW contamination is gasoline & diesel from underground storage tanks at gas stations, second is sewage leaks, third is agriculture sources.
PRE-DRILL TEST: EVALUATE GROUND WATER (GW) QUALITY
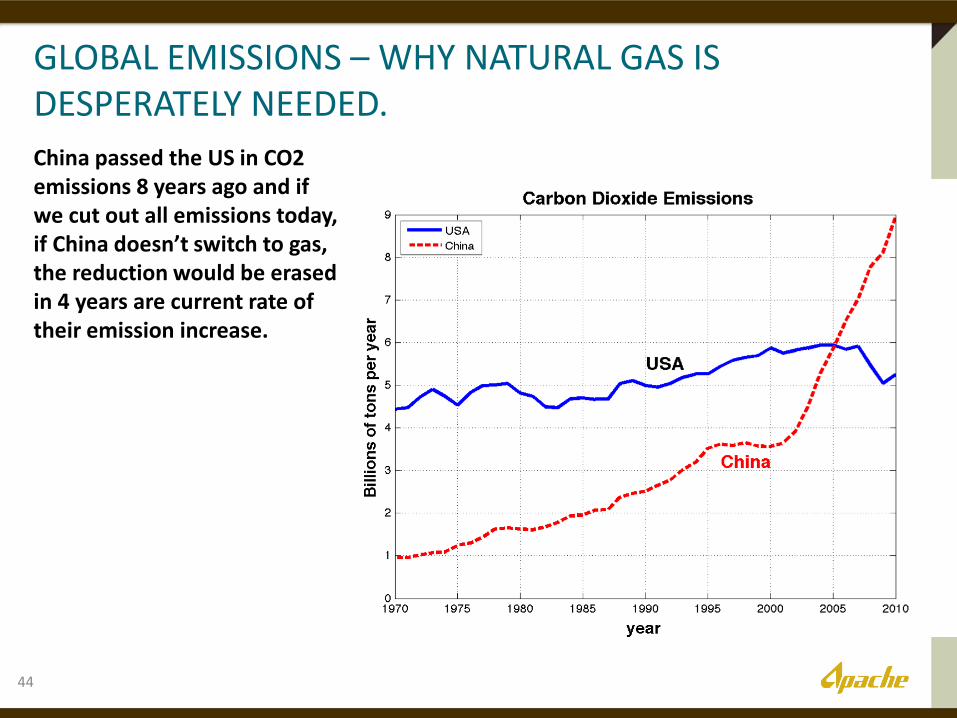
GLOBAL EMISSIONS – WHY NATURAL GAS IS DESPERATELY NEEDED.
44
China passed the US in CO2 emissions 8 years ago and if we cut out all emissions today, if China doesn’t switch to gas, the reduction would be erased in 4 years are current rate of their emission increase.

45
Shale Gas Basins and Pipeline Systems
Slide from Talk by Rich Muller
Coal Power Pollution in China

Power frac spread with dual-fuel or electricity. Substitute 60% of diesel with natural gas.
Generate electricity from field gas on-site.
Operate pad equipment with compressed air or solar.
FRAC SITE & WELL OPERATION EMISSIONS – WHAT CAN WE DO?
46
Documented tests of actual well sites show methane leak rates are below 1% (UT/EDF, 2013)
Methane venting common in 2007/8 (Yale/NOAA study) has been stopped. Remaining areas of work are pneumatic operated equipment and other small volume but regular releases need to be replaced with solar or air operated controls and/or low pressure gas recovery systems.

NEGATIVES FOR LARGE SCALE WELL DEVELOPMENTS
Well development can be a traffic nightmare in urban environments.
Road damage is significant in areas with roads not meant for industrial use.
Dust, noise, spills, wrecks, soil disturbance & people “activities” increase during development. -----------------------------------------------------------------
Areas not accustomed to oil & gas developments usually lack infrastructure to minimize many of the large well development problems.
47

CAN & SHOULD EVERY WELL BE FRACTURED?
No. Some wells don’t need fracturing. Some wells cannot be fractured safely. Some geology makes gas migration more likely.
Rules of Thumb: Fracturing in deeper wells poses less risk (>2000 ft). Stand off from bottom of fresh water ~1000 ft (safety factor varies). Need two cemented barriers between fluid flow path & fresh water. Fracturing in older wells is higher risk (test & derate max. pressure?). Well construction best practices are required. A “pop-off” or pressure release valve is good insurance.
– Set below the minimum burst pressure of the pipe. – A line from the valve to a tank prevents spills in event of a over-pressure. – Odds against a pipe rupture are about 50,000:1 to 100,000:1.
Areas with gas seeps & historical near-surface gas more likely to see gas migration before & after well development.
48
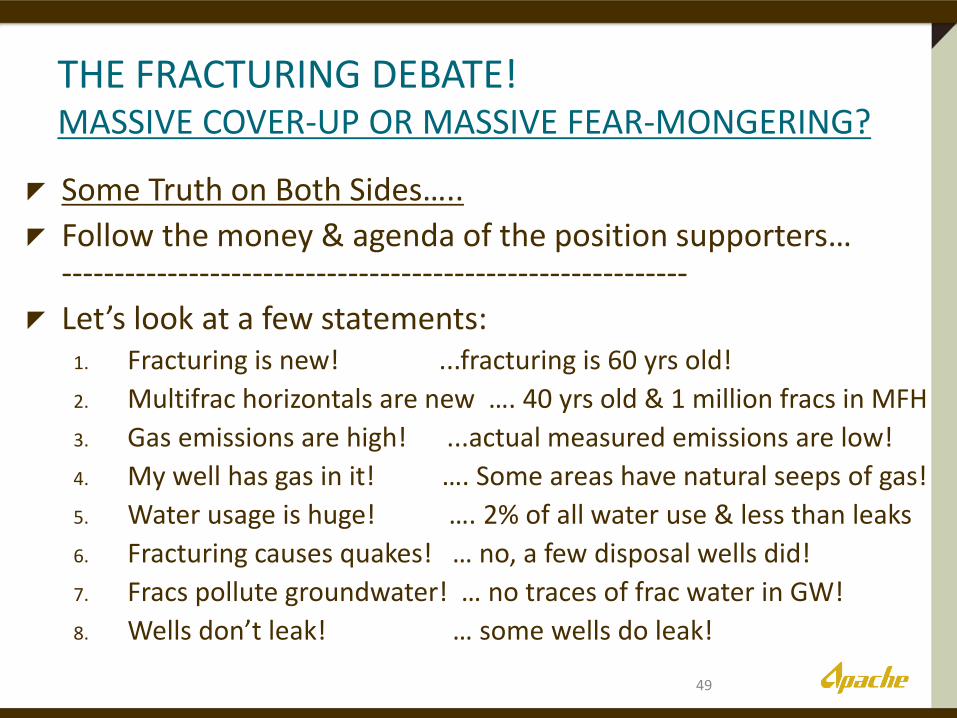
THE FRACTURING DEBATE! MASSIVE COVER-UP OR MASSIVE FEAR-MONGERING?
Some Truth on Both Sides…..
Follow the money & agenda of the position supporters… -----------------------------------------------------------
Let’s look at a few statements: 1. Fracturing is new! ...fracturing is 60 yrs old!
2. Multifrac horizontals are new …. 40 yrs old & 1 million fracs in MFH
3. Gas emissions are high! ...actual measured emissions are low!
4. My well has gas in it! …. Some areas have natural seeps of gas!
5. Water usage is huge! …. 2% of all water use & less than leaks
6. Fracturing causes quakes! … no, a few disposal wells did!
7. Fracs pollute groundwater! … no traces of frac water in GW!
8. Wells don’t leak! … some wells do leak!
49

What is safe?
Risk = Frequency of Occurrence vs. Impact
Slide 50
Risk exists in every action.
What is operationally safe?
Occurrence & impact create a
threat level that we can
understand & accept or reject
based on what we believe:
hopefully on assessment of facts.
What does the public
think is safe?
SPE 166142, Barrier vs. Well Failure, King

51

52
Some “forget it” Factors (and some tempering) Gas in place too low
Maturity out of range
TOC (total organic content) too low (but check TR!)
Too shallow and/or too low pressure
Bad Lease terms
Delay Red Flags Market and transport not ready
Disposal, permits, regulations, access problems
Infrastructure limited or absent
DEAL BREAKERS – MY OPINION (MAYBE JUST MORE DIFFICULT?)

REDUCING THE
IMPACT OF
SHALE GAS
DEVELOPMENT
IS CRITICAL
53
Questions? More Information at www.GEKengineering.com
Restored shale drilling site - Chesapeake
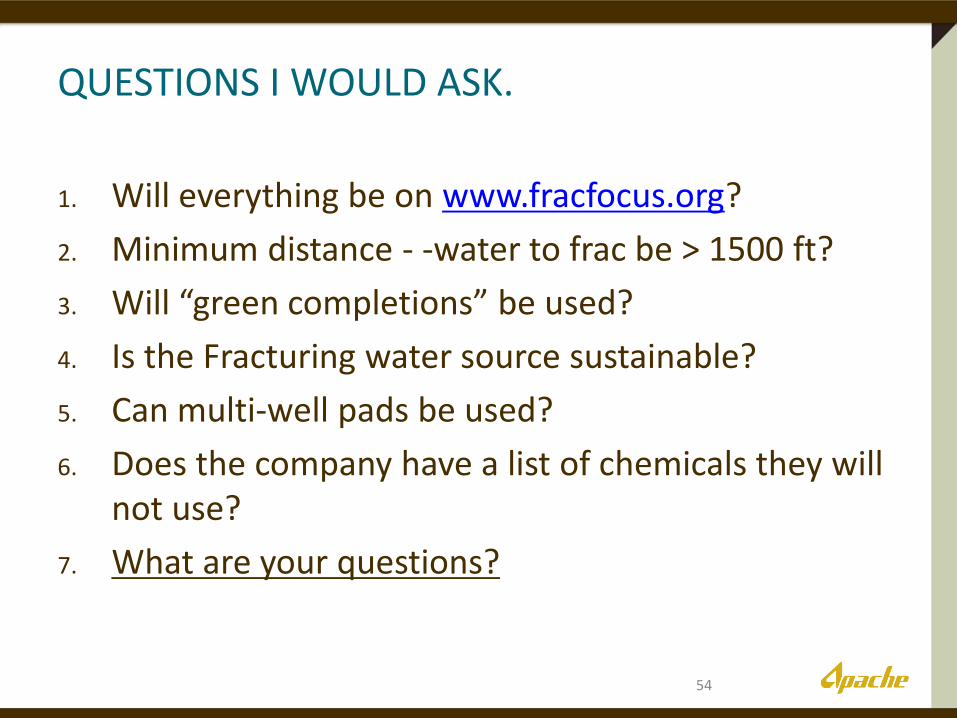
QUESTIONS I WOULD ASK.
1. Will everything be on www.fracfocus.org?
2. Minimum distance - -water to frac be > 1500 ft?
3. Will “green completions” be used?
4. Is the Fracturing water source sustainable?
5. Can multi-well pads be used?
6. Does the company have a list of chemicals they will not use?
7. What are your questions?
54

55
Completion Optimization Expertise – local knowledge often better than books
Infrastructure? Cost to do first few jobs?
Water supply (cost in $ and community displeasure)
Disposal cost (trucking and disposal)
Lease factors Bonus
Percent
Continuous drilling
Damages
Water rights (AND responsibilities)
ECONOMIC FACTORS