avoiding competition-e p d evidence from … natural to wonder how frequently these situations arise...
TRANSCRIPT

AVOIDING COMPETITION-ENHANCING PRICE DISCRIMINATION:EVIDENCE FROM THE U.S. AIRLINE INDUSTRY
MATTHEW S. LEWIS∗
Preliminary Draft
March 1, 2018
Abstract
The theoretical literature has identified conditions under which price discrimination inoligopoly markets can lead to more aggressive competition and lower profits, yet few em-pirical studies have examined the extent to which this occurs or the ability of firms to avoidthis lower-profit equilibrium. In this study I describe how competition-enhancing discrim-ination might arise in the airline industry and formulate a new empirical approach thatutilizes price quote data to measure price discrimination while controlling for potentiallyconfounding cost heterogeneity. The empirical findings reveal that carriers within the U.S.domestic market systematically avoid this form of discrimination, suggesting a successfulcoordination on uniform pricing that has likely allowed carriers to maintain higher profits.
∗John E. Walker Department of Economics, Clemson University, 228 Sirrine Hall, Box 341309, Clemson, SC29634-1309, [email protected]

I Introduction
Price discrimination is often viewed as a valuable tool that firms with market power can use
to extract additional surplus and increase profits. This intuition is based on the fact that
price discrimination by a monopolist will always generate profits that are at least as large
as under uniform pricing. In oligopoly markets, the same intuition does not necessarily
apply. Price discrimination by oligopolists can result in higher equilibrium profits for all
firms. However, when it is possible to target discounts to customers who have a higher
willingness to pay for a rival firm’s product, equilibrium profits can be lower for all firms
under price discrimination than under uniform pricing. In a variety of settings (Thisse
and Vives, 1988; Shaffer and Zhang, 1995, 2002; Corts, 1998; Chen et al., 2001), the
ability to price discriminate can result in a prisoner’s dilemma in which each firm has a
dominant strategy to price discriminate despite the fact that profits would be higher for all
if discrimination were not possible.
Given the potential for price discrimination to intensify oligopoly competition, it
seems natural to wonder how frequently these situations arise in real-world markets. Sur-
prisingly, despite an extensive theoretical literature, virtually no empirical evidence exists
on the prevalence or extent of pro-competitive price discrimination or the ability of firms
to potentially prevent aggressive competition by avoiding the use of price discrimination
in these situations.1 This study aims to help fill this gap in the literature by examining the
role of pro-competitive price discrimination in an important and commonly-studied market:
airline travel.
Economists often use airline pricing as a canonical example of price discrimination
across consumer groups, and an extensive literature has documented and examined the
use of various forms of price discrimination in this market (e.g., Stavins, 2001; Puller and
Taylor, 2012; Puller et al., 2009; Dana, 1998; Borenstein and Rose, 1994; Gerardi and
Shapiro, 2009). Airlines are known to frequently charge more for tickets on the same flights1Examples of some of the few empirical papers that do consider price discrimination targeting rivals’ cus-
tomers include Asplund et al. (2008) who study subscription discounts offered by local newspapers in Swedenand Miller and Osborne (2014) who study location-based price discrimination in the Southeastern U.S. cementindustry.
1

to passengers that purchase: one-way tickets rather than round-trip tickets, itineraries that
don’t include a Saturday night stay-over, or tickets that are eligible for refunds or exchanges.
The goal in offering these different fares is to encourage passengers with a less elastic
demand for travel (e.g., business travelers) to pay higher fares while allowing more elastic
passengers (e.g., leisure travelers) to select lower fares. Such strategies, however, do not
segment consumers based on the likelihood that they prefer one particular airline over
another and, therefore, can not be used to target discounts to customers who prefer a rival
carrier.
In light of this, my study begins with a review of the theoretical conditions under
which price discrimination can enhance competition and a discussion of what such strate-
gies might look like in the airline market. The empirical analysis then focuses on a particular
form price discrimination which meets three important criteria: 1) it has the potential to
enhance competition; 2) it is clearly feasible for airlines to implement; and 3) it is possible
to identify and measure empirically. Specifically, I examine the potential for airlines to price
discriminate based on the airport from which a passenger’s itinerary originates.
Due to frequent flyer and and other incentive programs, many passengers prefer to
concentrate their trips on one airline. However, it is easier to maintain loyalty to an airline
if that airline flies to more destinations from the customer’s home airport. Previous work
has clearly revealed that customers traveling on a given route are more likely to choose the
airline that has the largest presence at the originating airport (e.g., Borenstein, 1991). As
a result, if an airline is flying on a route between airports A and B and has a significantly
larger airport presence at A, they have a clear opportunity to price discriminate by charging
passengers originating out of airport A (i.e., flying a round trip from A to B to A) more than
those originating out of airport B (traveling from B to A to B).
Using data on airline price quotes for specific flights I implement an empirical de-
sign that isolates fare differences resulting from this type of directional price discrimination.
Unlike much of the previous research on airline price discrimination (which relies on less
detailed data), my approach eliminates potentially confounding cost differences by compar-
ing different prices quoted at the exact same time for seats on the exact same flight. More
2
specifically, I compare the price charged for a specific round-trip itinerary from airport A to
airport B to the price that a round-trip passenger traveling from B to A would pay to fly on
the exact same flights.2
The results clearly reveal that carriers serving domestic routes within the United
States do not directionally price discriminate, choosing instead to systematically avoid offer-
ing discounted fares to customers who prefer to fly on rival carriers. Over 99% of itineraries
exhibit identical prices for passengers originating at different endpoints. This behavior
is particularly striking given that the same airlines engage so regularly in other forms of
(profit-enhancing) price discrimination on these same U.S. routes. Considering that a rel-
atively small number of airlines interact frequently across a large number of routes, the
complete lack of price discrimination targeting rivals’ customers could plausibly result from
a tacit coordination to restrict the strategy set and prevent aggressive price competition.
This conclusion is further supported by the fact that these same airlines do engage in this
exact form of directional price discrimination on international routes (from U.S. airports)
where they tend to face a much more diverse set of rival carriers and where directional
price discrimination is less likely to result in more intense competition.
To my knowledge, this is the first study to investigate the use of potentially competition-
enhancing forms of price discrimination in the airline industry. A recent working paper by
Luttmann (2017) also considers the idea of directional price discrimination, but focuses on
the possibility of discriminating based on differences in endpoint city demographics rather
than targeting rival airlines’ loyal customers. Moreover, Luttmann’s analysis relies on quar-
terly route-level average fares derived from the U.S. Department of Transportation’s Origin
and Destination Survey (DB1B) which are more highly aggregated than my flight level price
quote data. With these aggregate data it is not possible to identify whether different price
levels are being charged or whether customers in some cities are simply more likely to pur-
chase higher priced tickets (with fewer restrictions, for example) than consumers in other
cities. Interestingly, Luttmann concludes from his findings that airlines do engage in direc-2While it would be impossible for the same two flights to actually serve as a round trip in both directions
since the outbound flight must occur before the inbound flight, I detail in Section III how this comparison canstill be made under the assumption that the prices of specific outbound and inbound legs are independent oftheir pairings.
3
tional price discrimination, whereas I am able to confirm with more detailed data that this
does not appear to be the case.
II Oligopoly Price Discrimination and Airline Pricing
Theoretical studies including Borenstein (1985) and Holmes (1989) have established that
price discrimination in non-monopoly markets is sustainable and can generate higher prof-
its. Unlike the monopoly case, however, conditions can arise under which discrimination
leads to lower prices for consumers and lower profits for firms. As illustrated clearly by
Corts (1998), if competing firms agree on which types of consumers are more elastic, equi-
librium prices under price discrimination will be higher for less-elastic consumers and lower
for more-elastic consumers—mirroring the impact of price discrimination under monopoly.
In contrast, when firms disagree on which groups are more elastic and when each firm tends
to sell more to the group they view as less elastic, then price discrimination can result in
“all-out competition” where prices are lower for all consumer groups than under uniform
pricing. In this case, the firms may collectively prefer not to have the ability to price dis-
criminate, as uniform pricing by all firms produces higher profits. In the language of Corts
(1998), the former case represents a market exhibiting best-response symmetry while the
latter case exhibits best-response asymmetry. Though Corts (1998) demonstrates this result
for differentiated-product oligopolists engaging in third-degree price discrimination, simi-
lar outcomes have been show to arise, for example, when spatially-differentiated firms en-
gage in individualized location-specific pricing (Thisse and Vives, 1988; Shaffer and Zhang,
2002) or use coupons targeted at consumers in certain locations (Shaffer and Zhang, 1995).
Airlines do not have the the ability to use individualized pricing, and they often lack
the information necessary to directly classify an individual as being of a particular customer
type. Instead, they tend to rely on a small set of observable factors that indicate whether
a consumer is more likely to be of a particular type: the day and time of the flight, how
long they stay at their destination, when the flight is booked, whether the fares include
cancelation restrictions, etc. These factors are used to separate leisure travelers who exhibit
more elastic demand from business travelers who tend to have more inelastic demand. As a
4

result, discriminatory pricing based on these factors will exhibit best-response symmetry in
that all airlines prefer to target leisure travelers with lower fares and business travelers with
higher fares, and such strategies can be expected to result in higher airline profits rather
than more aggressive price competition.
Price discrimination schemes exhibiting best-response asymmetry require some in-
formation about the consumer that is correlated with the consumer’s relative valuations of
products from different sellers. The firm may directly observe some characteristic of the
consumer or it may infer the consumer’s preferences based on who they have purchased
from in the past (as in Fudenberg and Tirole, 2000). In the airline market, however, this
information is quite limited, particularly when prices are quoted before customers enter
any identifying personal information. Inference regarding a consumer’s preferences over
carriers must be drawn from the characteristics of the flight they are looking for. Though
most flight characteristics are better suited for separating business and leisure travelers, it
may be possible to utilize the origin airport of the passengers’ itinerary to take advantage
of geographic heterogeneity in preferences for different airlines.
Research on the so-called “hub premium” has provided clear evidence that con-
sumers prefer to fly on airlines that offer more flights originating out of their city’s airport.
Frequent flyer programs and other corporate loyalty programs encourage customers to con-
centrate their flying with one airline, and airlines that fly to more destinations allow cus-
tomers to both accumulate loyalty credit on more of their trips and utilize loyalty rewards
to to fly to more destinations. As a result, when an airline flies a round-trip between one
airport from which it serves many routes (like a hub airport) and another from which it
serves only a few routes, customers on the route originating from the first airport are likely
to have a stronger preference for this airline than those originating from the second airport.
Direct empirical evidence is provided by Borenstein (1991), who shows that airlines with a
substantially higher overall airport passenger share at Airport A than at Airport B tend to
have a significantly higher market share on the round-trip route from A to B to A than they
they do on the route B to A to B. In other words, passengers on the route originating from
Airport A prefer to fly on the airline with the highest airport share at A while passengers
on the same route originating from B prefer to fly on the airline with the largest Airport B
5

share.
Based on this geographic heterogeneity, airlines may have an incentive to charge
higher prices to passengers originating out of airports where they are more highly valued
(because of their large airport presence). On routes where the airline has a significantly
larger presence at one endpoint airport than the other, this could be accomplished through
the use of directional price discrimination where passengers on the same route are charged
different prices based on their origin airport. Moreover, if the carriers on the route differ
in their relative presence at the two endpoint airports, then directional price discrimination
could very likely exhibit best-response asymmetry causing Airline 1 to have a higher price
on A to B to A than on B to A to B while Airline 2 has a lower price. Therefore, unlike
other forms of price discrimination commonly studied in airline markets, directional price
discrimination has the potential to enhance competition and result in lower equilibrium
profits.
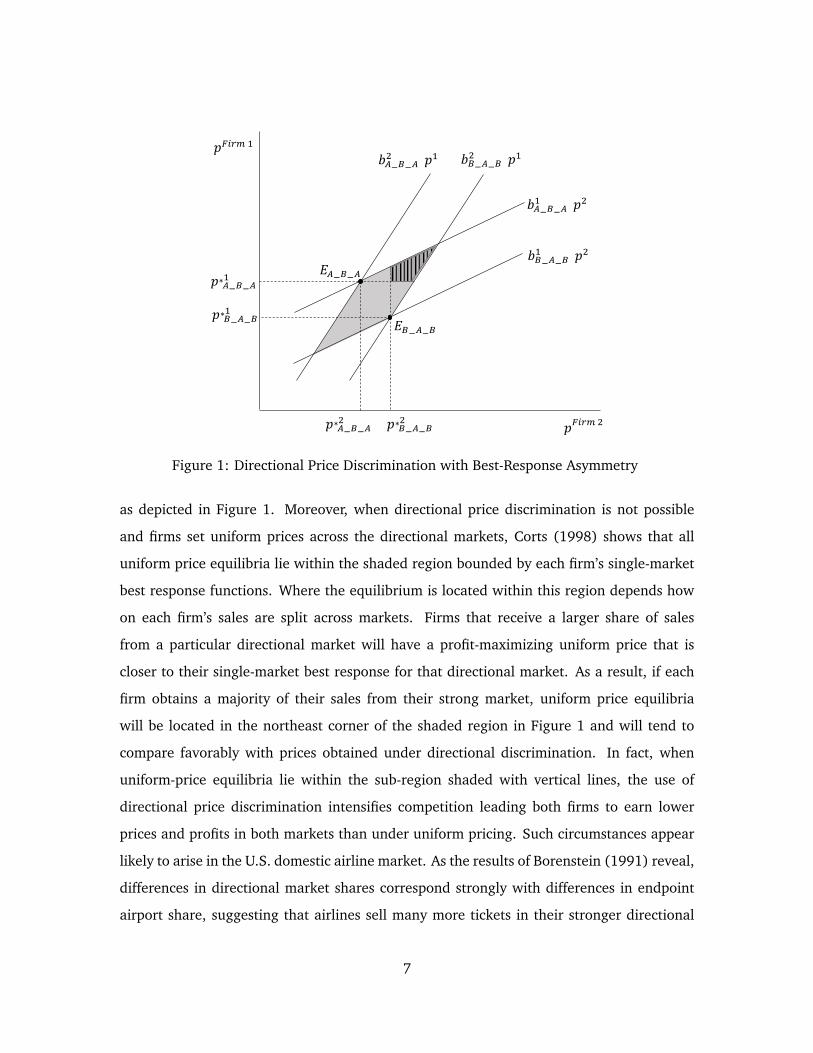
A simple theoretical example in the spirit of Corts (1998) makes this point clear.
Consider a standard differentiated-product price-setting environment in which two firms
each sell tickets in both directional non-stop markets between airports A and B: the round
trip from A to B to A and the round trip from B to A to B. Suppose that Firm 1 has a larger
airport presence at Airport A than Airport B and Firm 2 has a larger presence at B than A,
so that Firm 1 is valued more highly by travelers originating from A than from B while Firm
2 is valued more highly by those originating from B than from A. To reflect this, assume
that Firm 1’s best response, b1(p2), to any price by Firm 2 is always higher in the A to B to
A market than the B to A to B market, and the reverse is true for Firm 2:
b1A_B_A(p2) > b1B_A_B(p2) ∀ p2 (1)
b2B_A_B(p1) > b2A_B_A(p1) ∀ p1.
Under this assumption competition exhibits best-response asymmetry, where the A to B to A
market represents the strong market for Firm 1 and B to A to B represents the strong market
for Firm 2.
When the firms engage in directional price discrimination the equilibrium prices in
each directional market are determined by the intersections of these best response curves
6
𝑏𝑏𝐵𝐵−𝐴𝐴−𝐵𝐵2 (𝑝𝑝1)
𝑏𝑏𝐴𝐴−𝐵𝐵−𝐴𝐴1 (𝑝𝑝2)
𝑏𝑏𝐵𝐵−𝐴𝐴−𝐵𝐵1 (𝑝𝑝2)
𝑝𝑝𝐹𝐹𝐹𝐹𝐹𝐹𝐹𝐹 1
𝑝𝑝𝐹𝐹𝐹𝐹𝐹𝐹𝐹𝐹 2
𝐸𝐸𝐴𝐴−𝐵𝐵−𝐴𝐴
𝐸𝐸𝐵𝐵−𝐴𝐴−𝐵𝐵
𝑏𝑏𝐴𝐴−𝐵𝐵−𝐴𝐴2 (𝑝𝑝1)
𝑝𝑝 𝐴𝐴−𝐵𝐵−𝐴𝐴∗1
𝑝𝑝 𝐵𝐵−𝐴𝐴−𝐵𝐵∗1
𝑝𝑝 𝐴𝐴−𝐵𝐵−𝐴𝐴∗2
𝑝𝑝 𝐵𝐵−𝐴𝐴−𝐵𝐵∗2
Figure 1: Directional Price Discrimination with Best-Response Asymmetry
as depicted in Figure 1. Moreover, when directional price discrimination is not possible
and firms set uniform prices across the directional markets, Corts (1998) shows that all
uniform price equilibria lie within the shaded region bounded by each firm’s single-market
best response functions. Where the equilibrium is located within this region depends how
on each firm’s sales are split across markets. Firms that receive a larger share of sales
from a particular directional market will have a profit-maximizing uniform price that is
closer to their single-market best response for that directional market. As a result, if each
firm obtains a majority of their sales from their strong market, uniform price equilibria
will be located in the northeast corner of the shaded region in Figure 1 and will tend to
compare favorably with prices obtained under directional discrimination. In fact, when
uniform-price equilibria lie within the sub-region shaded with vertical lines, the use of
directional price discrimination intensifies competition leading both firms to earn lower
prices and profits in both markets than under uniform pricing. Such circumstances appear
likely to arise in the U.S. domestic airline market. As the results of Borenstein (1991) reveal,
differences in directional market shares correspond strongly with differences in endpoint
airport share, suggesting that airlines sell many more tickets in their stronger directional
7

market than in their weaker directional market. Consequently, under conditions of best-
response asymmetry a prisoners dilemma is likely to arise in which the use of directional
price discrimination represents a dominant strategy for airlines yet leads to lower profits in
equilibrium.
It is important to note that directional price discrimination can also arise under con-
ditions of best-response symmetry. Consider a route in which all travelers from endpoint
city A have a substantially lower willingness to pay to travel from A to B to A than do those
in city B traveling from B to A to B. Travelers originating from A may still prefer a different
carrier than those originating from B, but if these carrier preferences are outweighed by the
differences in the general willingness to pay for travel, then all carriers on the route will
view travelers originating from A as more elastic and may all charge lower fares on A to B to
A than on B to A to B. When best-response symmetry holds, directional discrimination will
be more profitable for all firms than uniform pricing. Consequently, if directional discrimi-
nation is observed on a route, determining whether competing airlines charge higher fares
to passengers originating from the same airport or different airports can serve as an indi-
cator of whether the market exhibits best-response symmetry or best-response asymmetry
and, hence, whether discrimination increases profits or intensifies competition.
III Empirical Strategy
The goal of my empirical analysis is to reveal the extent to which airlines engage in competition-
enhancing price discrimination that targets discounts to customers who prefer to travel on
rival carriers. I focus in particular on examining directional price discrimination for several
important reasons. First, there is strong empirical evidence revealing substantial differences
in passenger preferences between origin airports on a route. Second, airlines clearly have
the ability to charge different prices to passengers departing from different origin airports.
Third, comparing prices for round trip itineraries on the same route utilizing the same
flights eliminates unobserved cost differences and results in a more accurate measure of the
degree of price discrimination.
In this setting price discrimination on the non-stop route between airports A and
8

B represents a difference in fares between passengers traveling on a round trip from A to
B to A and passengers traveling from B to A to B that cannot be explained by differences
in the airline’s underlying costs. The opportunity costs of selling a seat on a specific flight
can be influenced by many factors that are difficult to observe or control for. At any point
in time, however, that opportunity cost should be the same regardless of what passenger
purchases the ticket. As a result, any observed differences in fares offered concurrently to
different groups for a seat on the same flight can be interpreted as resulting from price
discrimination.
Any flight between airports A and B will undoubtedly carry some passengers who
originated their round trip at A and others that originated at B. On the other hand, a
particular pair of flights from A to B and B to A can only represent a round trip itinerary
from A to B to A if the A to B flight occurs before the B to A flight, and vise versa for the
B to A to B itinerary. No passengers with different origin airports can ever have identical
itineraries. This appears to undermine the empirical strategy of comparing round-trip fares
offered on the exact same flights. Fortunately, with one additional assumption (that is
strongly supported in the data) it is possible to recreate this comparison.
The necessary assumption (as stated in Assumption 1) is that airlines determine
prices for the outbound and inbound legs of a round trip independently of which leg they
are paired with.
Assumption 1 At any particular time, there exists a unique set of latent prices for each po-tential outbound flight and for each potential inbound flight on a given route such that theobserved price of any round trip itinerary on the route will be the sum of the latent prices ofthe associated outbound and inbound flights.
To clarify the implications of the assumption, denote the latent price for outbound flight X
as PX , the latent price for inbound flight Y as PY , and the observed price for a round trip
itinerary consisting of outbound flight X and inbound flight Y as PX_Y . If the assumption
holds, then for any two outbound flights X and X’ and inbound flights Y and Y’ it follows
that:
PX_Y − PX′_Y = (PX + PY )− (PX′ + PY ) = (PX + PY ′)− (PX′ + PY ′) = PX_Y ′ − PX′_Y ′ .
9

Fortunately, by using different pairs of inbound and outbound flights, it will actually be
possible to demonstrate that this condition holds in the data, providing further support for
the main identifying assumption.
Given this assumption, it becomes possible to compare round-trip fares quoted to
a passenger originating at A and a passenger originating at B for travel on the exact same
flights. More specifically, consider round trip itineraries involving flights on two out of four
possible dates: Date 1, Date 2, Date 3 and Date 4, and denote flights based on origin,
destination, and date such that an itinerary including a flight from A to B on Date 1 and
from B to A on Date 2 would be represented by AB1_BA2. For a passenger originating at
airport A, let the price of this itinerary be represented as PAAB1_BA2. Consider three possible
itineraries originating from A: AB1_BA2, AB3_BA4, and AB1_BA4. Figure 2 depicts each
of these itineraries using dotted lines connecting their two component flights. The third
itinerary shares one flight each with the first two. Therefore, if each flight (or leg) is priced
independently of what itinerary it belongs to, then PAAB1_BA2+PA
AB3_BA4−PAAB1_BA4 should
be equal to PABA2_AB3, representing the price it would cost a passenger originating at A to
take the BA2 and AB3 flights. Of course, this pair of flights does not represent a viable round
trip itinerary for a passenger originating at airport A because the BA flight occurs before the
AB flight. However, if each flight is priced independent of its itinerary, then it does represent
the incremental price charged for this pair of flights to a passenger originating out of airport
A and it can be directly compared to the price that a passenger originating from B would
pay to fly this itinerary: PBBA2_AB3.
Following this logic, the difference between the price charged to a passenger origi-
nating at airport A and the passenger originating at airport B for a round trip ticket on the
route between A and B can be measured as:
PA − PB = PAAB1_BA2 + PA
AB3_BA4 − PAAB1_BA4 − PB
BA2_AB3. (2)
By design, this represents a difference in the prices quoted to two different consumer types
for travel on the exact same flights (specifically, flights BA2 and AB3), so it can not be
explained by differences in cost of service. Consequently, I adopt this difference as my
measure of the degree of directional price discrimination on the route between A and B.
10

Airport A Airport B
AB1
BA2
AB3
BA4
Flights
Date 1
Date 2
Date 3
Date 4
AB1_BA2
BA2_AB3
AB3_BA4
AB1_BA4
Figure 2: Flights and Itineraries Used to Identify Directional Price Discrimination
Notice that the directional price difference measured in Equation 2 is based on
round trip itineraries involving the specific flights AB1, BA2, AB3, and BA4. If an airline
flies more than one flight per day on the route, then more than one measure of the price
difference can be constructed. As an example, if the airline offers 2 flights per day in each
direction, then there are 24 = 16 possible combinations of flights that could be used, and
therefore 16 different observations of directional price differences on the AB route.
IV Data
The primary data used for analysis are price quotes for specific flight itineraries obtained
from an airfare aggregator website. The aggregator itself collects itinerary and fare infor-
mation in real time from a Global Distribution System (GDS) that disseminates the current
fares provided by each airline to the Airline Tariff Publishing Company (ATPCO). My analy-
sis will focus on non-stop round-trip coach-class fares on the top 500 most heavily-traveled
U.S. domestic routes and, for comparison, the top 300 non-stop international routes involv-
11

ing one U.S. airport.3 For each quoted itinerary, the data include: the fare, ticketing carrier,
operating carrier, origin and destination airports, and the flight times and dates of the out-
bound and inbound flights. Itineraries involving flights by more than one ticketing carrier
are excluded.
Fares obtained by the airfare aggregator through the GDS come directly from the
airlines and reflect the prices one would find offered for sale on each airline’s website.
Often, the aggregator will also present alternative quotes for the exact same flight (on the
same airline) that it has collected from booking engines such as Expedia, Orbitz, Travelocity
and a number of smaller travel sites. These fares are often the same as that from the carrier
website, but not always. Fares from these other sources may include additional discounts
or markups added by the booking agent that do not reflect the strategic pricing decisions
of the airline. As a result, my analysis will only utilize fares have been obtained by the
aggregator directly from the airline.
Domestic Routes
Pricing information is observed for all major domestic airlines with the exception of South-
west Airlines, whose prices are consistently absent from airfare aggregator websites. Flight
information and departure times are still observed for Southwest Airlines, however, so the
presence of Southwest can still be accounted for when examining route-level competition.
In all cases, the ticketing carrier is considered the carrier of interest. On nearly
all domestic flights, the operating carrier is either the same as the ticketing carrier or is
a regional airline (e.g., Piedmont Airlines, Republic Airlines, Mesa Airlines) who has been
contracted to operate the flight on behalf of the ticketing airline. On the occasion where
a major carrier is serving as an operating carrier for different ticketing airline (usually
American selling tickets for a flight operated by Alaska Airlines, or vise versa), these price
quote observations are dropped.
Computing the measure of directional price discrimination described in the previous3The top 500 non-stop routes were selected based on total enplanements recorded in the U.S. Department
of Transportation’s (DOT) Origin and Destination Survey (DB1B) during the year 2016. Similarly, the top 300international routes were selected based on total passengers reported in then U.S. DOT’s T-100f during 2016.
12

section requires price quotes observed at a particular point in time for four different round-
trip itineraries on each potential route, as depicted in Figure 2. The travel dates for which
I have obtained this information consist of four consecutive Tuesdays: March 6th, 13th,
20th, and 27th of 2018. These price quotes were obtained in mid-January. Though quotes
are collected across different days, all price quotes for itineraries on particular route are
collected within minutes of each other, insuring that all within-route price comparisons
are appropriately based on fares that were offered concurrently. Note that all observed
itineraries include a weekend stayover. Given that airlines have been known to charge
lower prices when itineraries involve a weekend stayover, this approach assures that the
itineraries within each price comparison group are comparable.4
A route r is defined by its unique paring of endpoint airports A and B, and is not di-
rectional. Correspondingly, PAcri represents the price of the round-trip itinerary i originating
out of airport A on route r provided by carrier c, and PBcri represents the price of the round-
trip itinerary i originating out of airport B on route r provided by carrier c. The prices PAcri
and PBcri are then constructed as in Equation 2 and used to generate the directional price
difference for itinerary i served by carrier c on route r:
DirectionalPriceDiff cri = PAcri − PB
cri.
It will also helpful be to measure the price difference in percentage terms, which is similarly
constructed as follows:
DirectionalPriceDiff%cri =PAcri − PB
cri
PBcri
.
In addition to obtaining price quote data for the sampled routes, I have also col-
lected 2016 ticket sales and passenger enplanements for each carrier on each route from
the U.S. DOT’s Origin and Destination Survey (DB1B) as well as demographic information
for metropolitan areas surrounding endpoint airports from the U.S. Census 2016 Ameri-
can Community Survey. Passenger enplanement counts are used to construct airport mar-
ket shares while non-stop round-trip ticket sales are used to construct route-level market
shares. The variables are defined for carrier c, route r, and airport a as follows:4In other words, travel dates are selected to maximize the likelihood that Assumption 1 is satisfied.
13

EndpointAirportMarketSharecra: The sum of all passenger enplanements on flights by
carrier c departing from airport a not including those on route r divided by the sum
of all passenger enplanements (by any carrier) departing from airport a not including
those on route r.
RivalsEndpointAirportMarketSharecra: The weighted average of EndpointAirportMarketSharekra
across all carriers k ∈ K that compete with carrier c on route r, weighted according
to each competitor’s relative route share: RouteSharekra.
RouteSharecra: The sum of all non-stop round-trip tickets sold by carrier c on route r
originating from airport a divided by the sum of all non-stop round-trip tickets sold
(by any carrier) on route r originating from airport a.
EndpointMSAMedianIncomea: The 2010 median income in the MSA surrounding end-
point airport a.
EndpointMSAPopulationa: The 2010 population in the MSA surrounding endpoint air-
port a.
As described in the previous section, my empirical strategy is based on studying
directional differences in round trip prices charged to passengers on the same exact flights
but originating out of different endpoint airports. Correspondingly, for each of the variables
above, the values at the two endpoints airports of the route r are differenced (and in some
cases log-transformed) to generate the following:
EndpointShareDiff cr: The difference in the values of EndpointAirportMarketSharecra
for endpoint airports A and B of route r.
RivalsEndpointShareDiff cr: The difference in the values of RivalsEndpointAirportMarketSharecra
for endpoint airports A and B of route r.
RouteShareDiff cr: The difference in the values of RouteSharecra for endpoint airports
A and B of route r.
LogMedianIncomeDiff r: The difference in the values of ln(EndpointMSAMedianIncomea)
for endpoint airports A and B of route r.
14
LogPopulationDiff r: The difference in the values of ln(EndpointMSAPopulationa)
for endpoint airports A and B of route r.
International Routes
Price quotes for international routes were obtained for two different sets of travel dates.
The first set consists of quotes collected during the second week of December for travel on
four consecutive Wednesdays: Feb. 21st and 28th and Mar. 7th and 14th of 2018. The
second set was collected during the third week of January for travel on four consecutive
Tuesdays: Mar. 6th, 13th, 20th, and 27th of 2018. Fare information is unavailable for a
handful of foreign carriers such as China Eastern and Interjet, but these airlines collectively
represent less than 1% of total observations on the sampled routes.
As in the domestic data, the ticketing carrier is considered the carrier of interest.
However, code sharing arrangements are much more common in the international market
where major carriers frequently sell tickets for flights operated by another major airline,
usually when both airlines are members of the same airline alliance (e.g., Star Alliance,
Oneworld, Sky Team). As a result, several ticketing carriers are often observed selling tick-
ets on the same flight, sometimes at similar prices to each other and sometimes at different
prices. In order to avoid the complexities of code sharing as much as possible, I choose
to focus on the “primary” carrier for each airline alliance on each route, where primary is
defined as the airline within each alliance that operates the largest number of flights on the
route. All quoted fares where the primary alliance carrier serves as the ticketing carrier are
then included in the sample regardless of whether they also serve as operating carrier for
the flights. Airlines that are not members of an international alliance serve as both ticketing
and operating carriers on their flights, so all quotes by these airlines are also included.
Directional price difference measures are constructed exactly as they are for do-
mestic routes. To make interpretation of the results more straightforward the difference
measure is calculated as the price of a round trip originating out of the U.S. endpoint air-
port minus the price of the equivalent round trip originating out of the foreign endpoint
airport. Unfortunately, the supplemental data on airport market shares and demographics
15

gathered for domestic airports are not available for foreign airports or cities. As a result, I
focus mainly on measures of U.S endpoint airport share for international routes:
U.S.EndpointAirportMarketSharecr: The sum of all passenger enplanements on flights
by carrier c departing from the U.S. endpoint airport not including those on route r
divided by the sum of all passenger enplanements (by any carrier) departing from the
U.S. airport not including those on route r.
U.S.EndpointAirportAllianceMarketSharecr: The sum of all passenger enplanements
on flights by carrier c or alliance partners of carrier c departing from the U.S. endpoint
airport not including those on route r divided by the sum of all passenger enplane-
ments (by any carrier) departing from the U.S. airport not including those on route
r.
Evidence Supporting the Identifying Assumption
The proposed approach for measuring directional price discrimination relies crucially on
the assumption that airlines set the underlying prices of the outbound and inbound legs of
a round trip independently of which leg they are paired with (Assumption 1). Fortunately,
it is possible to provide empirical support for this assumption by testing one of its more
immediate implications. As described in the previous section, the assumption implies that
the price difference between two round-trip itineraries involving the same inbound flight
but different outbound flights should be the same regardless of which inbound flight they
are paired with.
An example of this price comparison is provided in Table 1. Itineraries 1 & 2 have
different outbound flights but share the same inbound flight and differ in price by $30.
Itineraries 3 & 4 have the same outbound flights as 1 & 2 but are paired with a different
inbound flight. Despite being cheaper than 1 & 2, itineraries 3 & 4 still differ by the same
$30, suggesting that the relative prices the two outbound flights do not change when paired
with a different inbound flight.
To test this assumption more broadly in the data, I identify nearly 3 million pairs of
itineraries that share a common outbound or inbound flight (like the pairs 1 & 2 or 3 & 4 in
16

Table 1: Example of Prices that Support the Identifying AssumptionAmerican Airlines: Indianapolis, IN (IND) to Washington, DC (DCA)Departing Mar. 13, 2017, Returning: Mar. 20, 2017
Itinerary Outbound Inbound Airfare Airfare DifferenceDeparture Time Departure Time
1 7:13 AM 2:59 PM $2012 7:40 PM 2:59 PM $171
$30
3 7:13 AM 7:46 PM $1574 7:40 PM 7:46 PM $127
$30
Table 1). Then I determine whether the difference in price between the two itineraries ever
changes when the common outbound or inbound flight is exchanged with another possible
flight. If the price difference always remains the same whenever this common flight is
replaced with another common flight, I consider these observations to be consistent with
the identifying assumption. If the price difference for the itinerary pair does change when
the common flight is exchanged for another, then I designate the itinerary pair as exhibiting
a violation of the identifying assumption. Across all itinerary pairs, over 98 percent appear
to be consistent with the identifying assumption. This remains true even when exchanging
the common outbound or inbound flight with a flight from a different day. I interpret this
evidence as a clear validation of the proposed approach for identifying directional price
discrimination.
With fewer than two percent of itinerary pairs exhibiting prices that violate Assump-
tion 1, the impact of including such flights in my analysis of price discrimination is likely
to be relatively minor. However, these observations will generate nonzero values of my
directional price difference measure even when no differences in prices actually exist. To
be conservative, I have chosen to exclude from my remaining analysis all observations for
an airline on a particular route if any of its prices on that route violate the identifying
assumption in the tests above.
After eliminating potentially problematic observations, the domestic sample includes
prices for 865 unique airline-route pairs from 381 different routes and the international
sample includes prices for 483 airline-route pairs from 249 different routes.
17

V Empirical Analysis and Results
Domestic Route Shares
As described in Section II, directional pricing on a route is likely to exhibit best response
asymmetry and generate lower profits because directional market shares on specific routes
are positively correlated with market shares at origin airport of the round trip. In other
words, carriers have greater market shares on routes where they also sell predominantly
to frequent flyer members with less elastic demand. Borenstein (1991) provides the most
direct evidence of this, showing that the an airline’s market share on the round-trip route
from A to B to A tends to be larger than its market share on the route from B to A to B when
that airline has a greater presence at Airport A than at Airport B or when its rival carriers
on the route have a smaller presence at Airport A than at Airport B. However, his finding
is based on data from 1986. The structure of the airline market and the nature of loyalty
programs have both changed dramatically in the last three decades, so I begin my analysis
by estimating a basic version of the model in Borenstein (1991) using data from 2016.
The first specification uses a simple directional difference in market share, RouteShareDiffcr,
as the dependent variable. Since this dependent variable is bounded within the range [-1,1]
Borenstein (1991) instead chooses to use a logistic transformation of the route share vari-
able defined as
LogRouteSharecra = ln
(RouteSharecra
1− RouteSharecra
),
where the directional difference, LogRouteShareDiffcr, is simply the difference in the values
of LogRouteSharecra for endpoint airports A and B of route r. A second specification is
estimated using this alternative dependent variable.
I focus my analysis on the top 1000 non-stop domestic routes according to U.S.
DOT’s DB1B ticket sales data. Any routes that have only one carrier are excluded as route
shares in both directions would be 100%. In addition, since the DB1B data is a 10% sample
of tickets sold, observations for carrier-route pairs that have less than 500 sampled tickets
(implying less than 5000 travelers annually) are dropped to ensure that observed carriers
18

Table 2: Impact of Airline’s Origin Airport Dominance on Route Market Share
Dependent Variable: RouteShareDiffcr LogRouteShareDiffcr
(1) (2)
EndpointShareDiff 0.205 1.11(0.007) (0.04)
RivalsEndpointShareDiff -0.165 -0.85(0.007) (0.04)
constant -0.002 -0.02(0.001) (0.01)
N 1583 1583R2 0.61 0.51
Notes: Standard errors are reported in parentheses and are clustered at the origin-destination
pair level to control for correlation airlines within the same route.
represent legitimate competitors on the route.5 The results reported in Table 2 confirm that
the relationships identified by Borenstein are still present today. In both specifications, the
coefficient estimates on EndpointShareDiffcr are positive and large and the coefficient esti-
mates on RivalsEndpointShareDiffcr are negative and only slightly smaller in magnitude.6
Based on the specification in Column 1, a 10 percentage point increase in origin airport
share would yield an increase in route share of 2 percentage points. If that increase in
origin airport share comes at the expense of an airline that also competes on this route,
then the effect on route share would be significantly larger. The logistic specification in
Column 2 is more directly comparable to the specifications in Borenstein (1991), and, in-
terestingly, the coefficient estimates are quite similar in size to those obtained by Borenstein
roughly three decades ago. Clearly travelers continue to prefer flying on carriers that have
a dominant position at their origin airport.
Domestic Route Fares
The remaining empirical analysis is primarily focused on determining the extent to which
the substantial within-route directional differences in carrier preferences revealed above5This restriction eliminates less than 16% of carrier-route observations. Ticket sales for these carriers are
still included in route share calculations for other carriers.6The variable RivalsEndpointShareDiffcr is calculated using route-share weighted averages of rivals’ airport
shares. Therefore, it can be viewed as exogenous to carrier c’s route share as long as the relative shares of rivalsare determined independently from their collective share on the route.
19
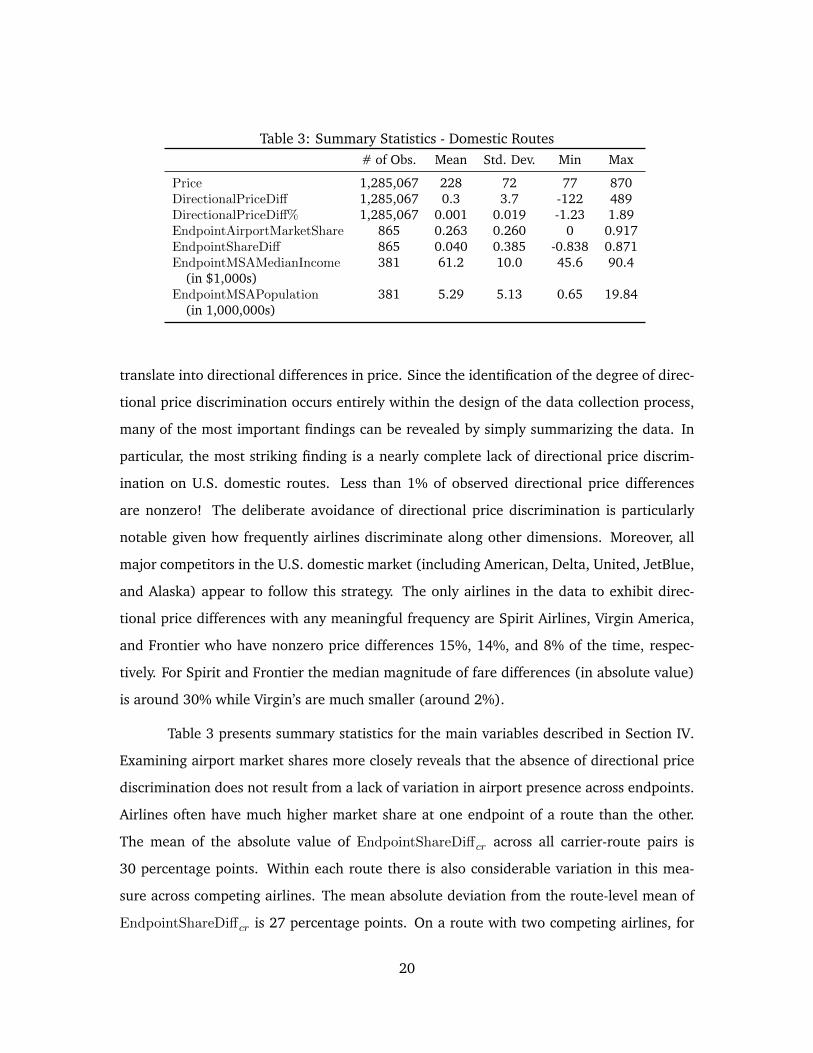
Table 3: Summary Statistics - Domestic Routes# of Obs. Mean Std. Dev. Min Max
Price 1,285,067 228 72 77 870DirectionalPriceDiff 1,285,067 0.3 3.7 -122 489DirectionalPriceDiff% 1,285,067 0.001 0.019 -1.23 1.89EndpointAirportMarketShare 865 0.263 0.260 0 0.917EndpointShareDiff 865 0.040 0.385 -0.838 0.871EndpointMSAMedianIncome 381 61.2 10.0 45.6 90.4
(in $1,000s)EndpointMSAPopulation 381 5.29 5.13 0.65 19.84
(in 1,000,000s)
translate into directional differences in price. Since the identification of the degree of direc-
tional price discrimination occurs entirely within the design of the data collection process,
many of the most important findings can be revealed by simply summarizing the data. In
particular, the most striking finding is a nearly complete lack of directional price discrim-
ination on U.S. domestic routes. Less than 1% of observed directional price differences
are nonzero! The deliberate avoidance of directional price discrimination is particularly
notable given how frequently airlines discriminate along other dimensions. Moreover, all
major competitors in the U.S. domestic market (including American, Delta, United, JetBlue,
and Alaska) appear to follow this strategy. The only airlines in the data to exhibit direc-
tional price differences with any meaningful frequency are Spirit Airlines, Virgin America,
and Frontier who have nonzero price differences 15%, 14%, and 8% of the time, respec-
tively. For Spirit and Frontier the median magnitude of fare differences (in absolute value)
is around 30% while Virgin’s are much smaller (around 2%).
Table 3 presents summary statistics for the main variables described in Section IV.
Examining airport market shares more closely reveals that the absence of directional price
discrimination does not result from a lack of variation in airport presence across endpoints.
Airlines often have much higher market share at one endpoint of a route than the other.
The mean of the absolute value of EndpointShareDiffcr across all carrier-route pairs is
30 percentage points. Within each route there is also considerable variation in this mea-
sure across competing airlines. The mean absolute deviation from the route-level mean of
EndpointShareDiffcr is 27 percentage points. On a route with two competing airlines, for
20
example, this implies that the EndpointShareDiffcr of the competitors differ by 52 percent-
age points on average. Moreover, it is often the case that one competitor will have a higher
market share at one endpoint while another competitor will have a higher market share at
the other endpoint. Of routes served by more than one carrier, over 71% have at least one
carrier with a negative value of EndpointShareDiffcr and another carrier with a positive
value. In other words, to the extent that willingness-to-pay is influenced by an airline’s
market share at the originating airport, competing airlines on the route between A and B
may frequently disagree on whether A-B-A travelers are more elastic than B-A-B travelers.
Although directional price differences are uncommon on domestic routes, it is still
possible to explore whether the directional differences that are observed seem to arise in
patterns consistent with price discrimination. If airlines are discriminating based on con-
sumers’ preference to fly with an airline that has a large presence at their airport of ori-
gin, we would expect the EndpointShareDiffcr variable to be positively correlated with
DirectionalPriceDiffcr. Since the fares of competing carriers (or alliances) on the route are
strategic complements in the terminology of Bulow et al. (1985), such discrimination would
also cause DirectionalPriceDiffcr to be increasing in RivalsEndpointShareDiffcr. Directional
price differences can also be used to discriminate when travelers originating from one of
the endpoints have a more elastic demand for travel (regardless of airline) than travelers
originating from the other endpoint. For example, willingness-to-pay might vary with the
average income level of the city or the size of the metropolitan area of the traveler. Table 4
reports coefficient estimates from several models that relate the directional price difference
to differences in own and rivals’ endpoint airport shares and demographics. Since these
explanatory variables are all observed at the route-carrier or route level, the dependent
variable has also been aggregated to represent the average of the directional price differ-
ence observed for carrier c on route r. While these regressions are largely intended to be
descriptive in nature, it is worthwhile to note that firms’ pricing decisions on a particular
route r are unlikely to have any influence on the values of the explanatory variables. Prices
on the route are likely to influence market shares on the route, but the airport share mea-
sure used here represents each carrier’s share of passengers on all routes out of the endpoint
airport other than route r.
21

Table 4: Factors Associated with Directional Differences in Domestic FaresAll route-carrier pairs Only route-carriers with
nonzero price differences
(1) (2) (3) (4)
EndpointShareDiff -0.0023 -0.0027 -0.2705 -0.1987(0.0120) (0.0128) (0.3012) (0.3585)
RivalEndpointShareDiff 0.0119 0.0116 0.1286 0.1837(0.0135) (0.0141) (0.2588) (0.3241)
LogMedianIncomeDiff -0.0079 -0.1992(0.0166) (0.4738)
LogPopulationDiff 0.0015 0.0147(0.0031) (0.0748)
constant 0.0032 0.0036 0.0617 0.0528(0.0033) (0.0036) (0.0824) (0.0870)
N 817 817 39 39R2 0.0022 0.0027 0.0489 0.054Dependent Variable: Carrier-Route Average Percent Directional Price Difference
The results clearly reveal that directional price differences are not related to differ-
ences in endpoint airport presence or other endpoint demographics that would suggest pos-
sible price discrimination. When estimated using all route-carrier pairs (Columns 1 & 2), the
coefficients estimates are all close to zero and coefficient values of any economically mean-
ingful magnitude can be statistically rejected. Columns 3 & 4 report the results obtained
when restricting the sample to include only the 39 route-carrier pairs on which a nonzero
price difference was observed. All coefficients remain statistically indistinguishable from
zero but the estimates are much more imprecise given the smaller sample size. Observed
price differences could reflect discrimination along dimensions not considered here, but the
fact that they occur only rarely and exhibit no relationship with observable market charac-
teristics suggests that these directional price differences could also result from misreported
prices or transitory deviations that arise during the ongoing optimization of fares.
It is worth highlighting that the ability to accurately document the lack of directional
discrimination relies crucially on the customized fare quote data and empirical strategy uti-
lized here. Attempting to measure directional price differences using average fares from the
Department of Transportation’s commonly used DB1B 10% ticket sample database intro-
22

duces the potential for substantial bias resulting from an inability to control for unobserved
factors. The DB1B only reports prices by route and quarter, so it is not possible to construct
directional differences in prices for travel on the same exact flights. If travelers from one
endpoint more frequently book tickets at the last minute or purchase tickets on higher-
priced flights (peak travel times or days), directional differences in quarterly-average fares
may primarily reflect differences in cost or scarcity-pricing rather than price discrimination.
In fact, misleading conclusions could easily be drawn from such an analysis. For comparison
purposes, Appendix A presents a replication of the specifications in Table 4 using average
airfares derived from the DB1B. The resulting coefficient estimates on EndpointShareDiffcr
and on the demographic variables are economically sizable and strongly statistically signif-
icant despite the fact that true directional price differences are virtually non-existent in my
disaggregated price quote data. The comparison reveals why Luttmann (2017) concludes
(using DB1B data) that airlines directionally discriminate based on demographics while I
conclude that discrimination is absent in the U.S. domestic market.
International Route Fares
The empirical evidence above indicates an overwhelming lack of directional price differ-
ences on domestic airline routes. Before discussing why this might be the case, it is helpful
to point out that the pricing behavior exhibited on international routes is entirely different.
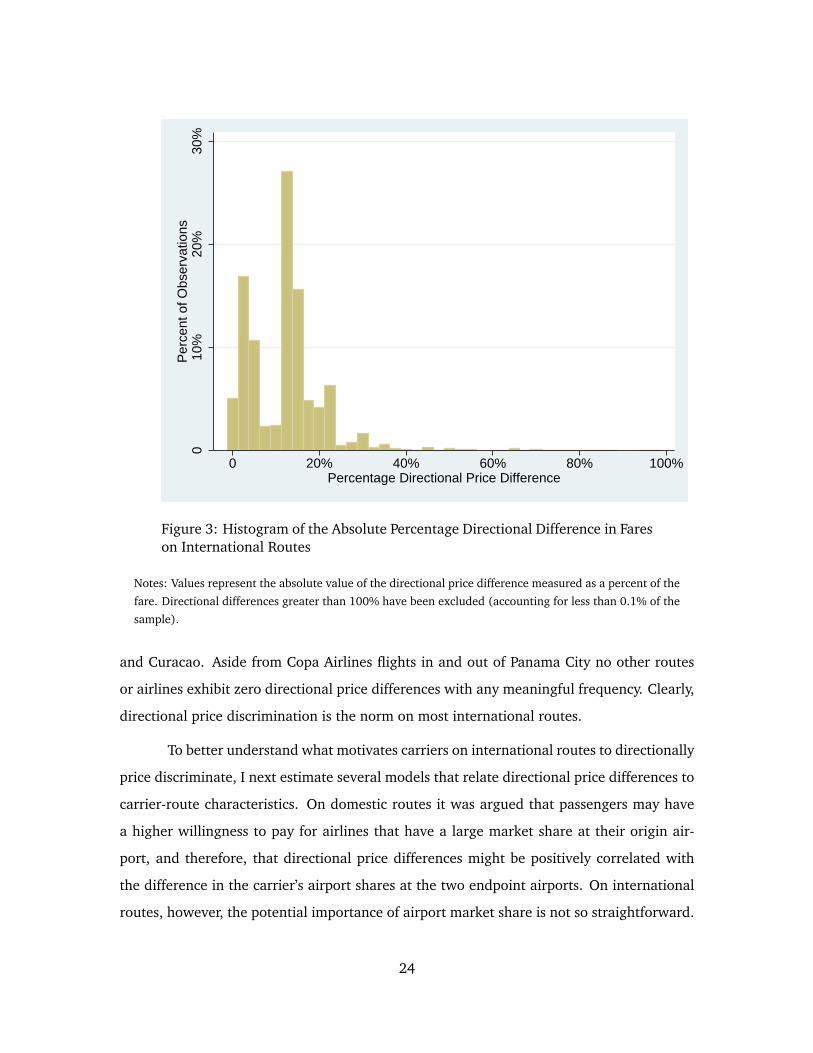
Just as the absence of directional price differences was immediately clear in the
domestic route data, basic summary statistics from international routes reveal a pervasive
use of directional discrimination. Over 92% of routes exhibit directional price differences,
and in most cases the magnitudes of these differences are substantial. Figure 3 displays a
histogram of the percentage directional difference in fares (in absolute value). Over 64%
of observed directional differences are larger than 10% of the fare on the route.
There are only a handful of routes on which airlines offer fares with no directional
price difference. These mainly consist of flights by any airline (including American Airlines,
Delta, JetBlue, and Bahamasair) in and out of Nassau, Havana, or Bermuda, as well as
several American Airlines routes in the Caribbean to destinations including Grand Cayman
23
010
%20
%30
%P
erce
nt o
f Obs
erva
tions
0 20% 40% 60% 80% 100%Percentage Directional Price Difference
Figure 3: Histogram of the Absolute Percentage Directional Difference in Fareson International Routes
Notes: Values represent the absolute value of the directional price difference measured as a percent of the
fare. Directional differences greater than 100% have been excluded (accounting for less than 0.1% of the
sample).
and Curacao. Aside from Copa Airlines flights in and out of Panama City no other routes
or airlines exhibit zero directional price differences with any meaningful frequency. Clearly,
directional price discrimination is the norm on most international routes.
To better understand what motivates carriers on international routes to directionally
price discriminate, I next estimate several models that relate directional price differences to
carrier-route characteristics. On domestic routes it was argued that passengers may have
a higher willingness to pay for airlines that have a large market share at their origin air-
port, and therefore, that directional price differences might be positively correlated with
the difference in the carrier’s airport shares at the two endpoint airports. On international
routes, however, the potential importance of airport market share is not so straightforward.
24

Table 5: Summary Statistics - International Routes
# of Obs. Mean Std. Dev. Min Max
Price 216,017 385 238 166 7696DirectionalPriceDiff 216,017 36 116 -5648 2380DirectionalPriceDiff% 216,017 0.10 0.13 -2.87 1.78U.S.EndpointAirportAllianceShare 715 0.355 0.278 0 0.910RivalEndpointAirportAllianceShare 715 0.134 0.195 0 0.889
Frequent flyer programs give consumers an incentive to remain loyal to airlines that have
a high market share in their local airport, but on international flights passengers can typi-
cally use and/or accrue frequent flier miles in an airline’s program while traveling with the
airline’s alliance partners as well. Therefore, while Atlanta residents (who tend to be Delta
frequent fliers because Delta dominates the Atlanta airport) may have a high value of taking
a Delta flight when flying to London, London residents may also have a high value of taking
Delta when flying to Atlanta if they are Virgin Atlantic (Delta’s SkyTeam partner) frequent
flier members. In this case, the total origin airport share of the airline alliance may be more
important than the airport share of the actual ticketing carrier.
Unfortunately, for international routes I only observe airport market shares at the
U.S. endpoint airport, so a difference in endpoint airport shares for a route can not be con-
structed. Nevertheless, if airlines from a particular alliance have a high share at the U.S.
airport, this may still be correlated with higher directional price differences, which on inter-
national routes are defined as the price of a round trip originating out of the U.S. endpoint
airport minus the price of the equivalent round trip originating out of the foreign endpoint
airport. Table 6 reports the results of a simple regression of directional fare differences on
the U.S. endpoint airport alliance market share and the average endpoint airport market
share of other alliances competing on the route. Columns 3 & 4 restrict the sample to only
route-carrier combinations that exhibit directional price differences, and Columns 2 & 4
adds foreign-endpoint-airport fixed effects to control for differences across countries that
may impact directional difference in airfares. Recall that (as described in Section IV) I
avoid the complications of intra-alliance pricing decisions amongst alliance-partner carriers
by keeping only one alliance partner per route (the one that operates the most flights on the
25
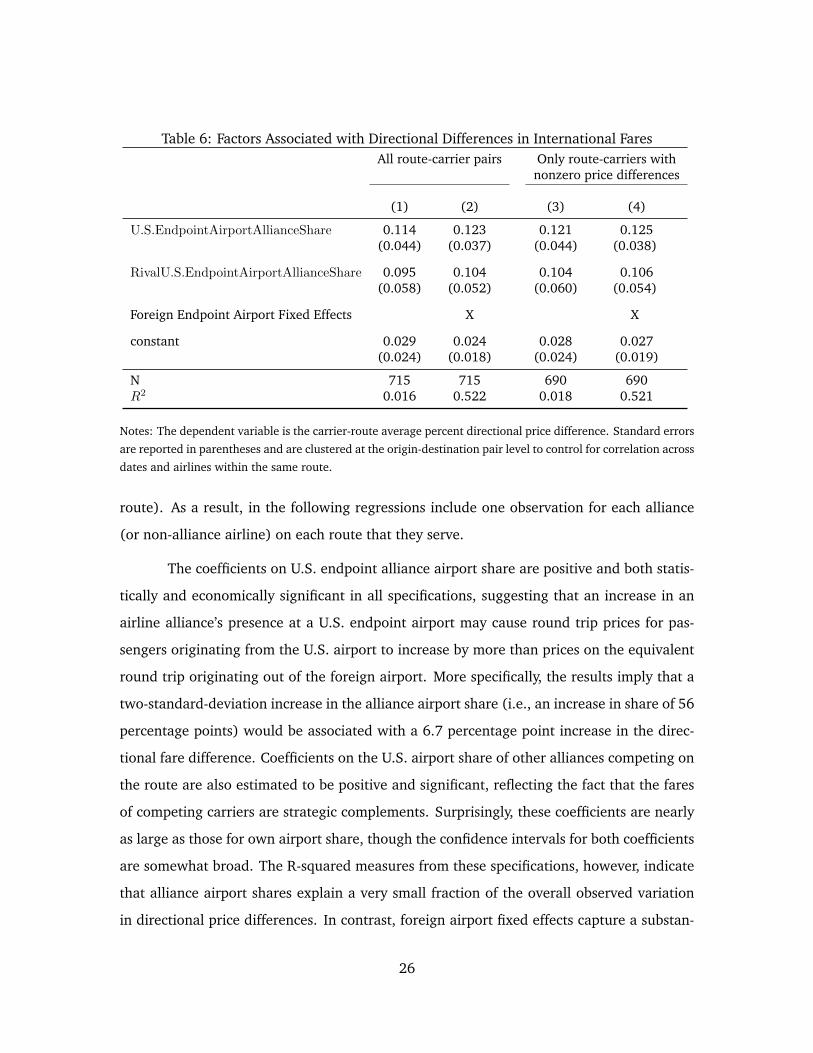
Table 6: Factors Associated with Directional Differences in International FaresAll route-carrier pairs Only route-carriers with
nonzero price differences
(1) (2) (3) (4)
U.S.EndpointAirportAllianceShare 0.114 0.123 0.121 0.125(0.044) (0.037) (0.044) (0.038)
RivalU.S.EndpointAirportAllianceShare 0.095 0.104 0.104 0.106(0.058) (0.052) (0.060) (0.054)
Foreign Endpoint Airport Fixed Effects X X
constant 0.029 0.024 0.028 0.027(0.024) (0.018) (0.024) (0.019)
N 715 715 690 690R2 0.016 0.522 0.018 0.521
Notes: The dependent variable is the carrier-route average percent directional price difference. Standard errors
are reported in parentheses and are clustered at the origin-destination pair level to control for correlation across
dates and airlines within the same route.
route). As a result, in the following regressions include one observation for each alliance
(or non-alliance airline) on each route that they serve.
The coefficients on U.S. endpoint alliance airport share are positive and both statis-
tically and economically significant in all specifications, suggesting that an increase in an
airline alliance’s presence at a U.S. endpoint airport may cause round trip prices for pas-
sengers originating from the U.S. airport to increase by more than prices on the equivalent
round trip originating out of the foreign airport. More specifically, the results imply that a
two-standard-deviation increase in the alliance airport share (i.e., an increase in share of 56
percentage points) would be associated with a 6.7 percentage point increase in the direc-
tional fare difference. Coefficients on the U.S. airport share of other alliances competing on
the route are also estimated to be positive and significant, reflecting the fact that the fares
of competing carriers are strategic complements. Surprisingly, these coefficients are nearly
as large as those for own airport share, though the confidence intervals for both coefficients
are somewhat broad. The R-squared measures from these specifications, however, indicate
that alliance airport shares explain a very small fraction of the overall observed variation
in directional price differences. In contrast, foreign airport fixed effects capture a substan-
26

tial share of the variation in directional price differences, as indicated by the much larger
R-squared values in Columns 2 & 4.
To the extent that the foreign-airport fixed effects absorb any differences in the
average level of alliance airport share at the foreign airport, which is unobservable due
to data limitations, some of the variation in directional price differences that is explained
by the fixed effects might be attributable to differences in alliance airport share between
endpoints. The fixed effects will also capture any directional price differences that are
associated with differences across the countries in income or any other characteristics that
influence willingness to pay for travel on the route. If the latter form of discrimination is
substantial, then directional price differences should be symmetric across carriers indicating
that the carriers on the route all charge lower prices at the same endpoint. Of the 481
routes represented in the final sample, just 140 are served by more than one airline alliance
(or non-alliance airline). Of those routes, 37 (or 26%) contain one or more airlines with a
positive directional price difference and also contain one or more with a negative directional
price difference. In other words, the direction of price discounting is symmetric on roughly
three quarters of the routes.
VI Discussion
Unlike other common forms of price discrimination in airline markets, directional price
discrimination can be used in markets exhibiting best-response asymmetry where compet-
ing carriers disagree on which consumers should be targeted with discounted prices. This
is notable because price discrimination under best-response asymmetry generally leads to
lower prices and lower profits for all firms than when discrimination is not possible. In fact,
such cases represent a prisoner’s dilemma in which each firm has a dominant strategy to
discriminate even though profits would be higher if all firms instead used uniform prices.
The underlying structure of the U.S. domestic airline industry is likely to generate
situations of best-response asymmetry on many routes. Domestic carriers regularly maintain
very high airport shares at a select number of airports (particularly at their hub airports),
and they often fly on routes connecting an airport where they have a large share to an
27

airport where a rival carrier has a large share. Moreover, empirical evidence has shown
that consumers strongly prefer to travel on carriers that have a large presence at the airport
where they originate their round-trip. Such preferences will generally create best-response
asymmetry, providing an incentive for carriers to engage in directional price discrimination,
setting fares such that the direction of discounting would be asymmetric across carriers on
the route.
My empirical analysis of U.S. domestic airline routes, however, reveals that uniform
prices (i.e., zero directional price differences) are maintained by every major carrier on
virtually all routes. This form of discrimination is absent despite the fact that the costs and
complexities of implementing directional differences appear to be minimal. Carriers are
known to regularly use other forms of price discrimination on domestic routes, and I show
that these same U.S. carriers do use directional price differences on most international
routes. The systematic and nearly universal avoidance of directional differences in the
domestic market instead seems entirely consistent with a coordinated effort to overcome
the prisoner’s dilemma created by best-response asymmetry and avoid the more aggressive
form of competition that would result.
The setting exhibits many of the factors known to facilitate tacit coordination. The
domestic market contains a relatively small and stable set of carriers, and these carriers
repeatedly interact with each other over time and across a large number of different routes.
Prices are highly visible and carriers can easily detect and respond to the use of directional
price differences by rival carriers. Perhaps most importantly, the elimination of directional
discrimination may be much easier to establish and sustain than other tacit arrangements
such as the coordination of price levels. Prices differ across routes and often need to be
adjusted independently to account for cost and demand fluctuations, whereas a compre-
hensive strategy to avoid directional price differences would require no adjustment.
Consistent also with a tacit coordination amongst carriers to avoid directional price
differences is the fact that small low-cost carriers (Spirit and Frontier) deviate from this
strategy much more frequently than the larger carriers. In general, smaller firms have a
greater incentive to deviate from tacit arrangements to steal market share and such devia-
28

tions may be less likely to trigger larger rivals to abandon their coordinated strategy.
International markets provide an interesting setting for comparison. A much larger
collection of carriers are present, and routes to different countries or regions are usually
served by a varying collection of competitors. Moreover, the populations served at each
endpoint are likely to exhibit greater heterogeneity than those on domestic routes within
the U.S. International airline alliances also change the nature of loyalty programs and may
impact the extent to which preferences for specific airlines differ between endpoints.
The pervasive use of directional price differences on these routes demonstrates the
feasibility of this form of discrimination, but also indicates that coordination by carriers to
avoid such directional discrimination may either be more difficult to support or less ben-
eficial in the international setting. Due to loyalty programs, differences in an airline’s (or
airline alliance’s) airport share between endpoints on a route can result in cases of best-
response asymmetry, but this will not always be the case. When the overall elasticity of
demand for travel on the route (regardless of carrier) is sufficiently lower at one endpoint
than the other, the incentive for all airlines to charge higher prices at the same less-elastic
endpoint may overcome any asymmetry in preferences generated by asymmetric endpoint
market shares. In that case, best-response symmetry will result, and directional price dis-
crimination used to offer low prices to travelers originating form more elastic countries
would generate higher prices and profits for all firms (just as in the monopoly setting). The
prisoner’s dilemma does not arise and coordination to avoid directional price differences
would be counterproductive.
The empirical evidence from international routes reveals pricing behavior that is
consistent with best-response symmetry most routes. Directional price differences are sym-
metric across carriers on nearly 75% of the multi-carrier routes and international destina-
tion fixed effects explain a much greater share of directional price differences than do the
U.S. endpoint airport market shares, suggesting potentially large differences in elasticity
for travel between U.S. and foreign endpoints. International alliances may also end up
reducing the degree of asymmetry in airline preferences across endpoints.7
7For example, the route between Seoul, South Korea and San Francisco is served by United, Delta, andKorean Air. Delta and Korean Air are both SkyTeam members, so either airline’s flights may be reasonably
29

Although it is not possible to provide direct proof of tacit coordination by domes-
tic carriers to avoid directional discrimination, the collection of evidence revealed here is
certainly consistent with this conclusion. The findings clearly show that directional price
differences are almost entirely absent on domestic routes—where they would have likely
intensified competition—despite being quite common on international routes where they
are more likely to enhance profits. It is important to point out that while this form of co-
ordination may increase industry profits it does not represent a violation of U.S. antitrust
law unless carriers explicitly discuss implementing such strategies. If anything, the straight-
forward nature of this form of coordinated behavior raises the likelihood that such pricing
strategies arise tacitly from repeated interactions in the marketplace making explicit com-
munication unnecessary.
VII Conclusion
The theoretical literature has established that price discrimination can intensify competition
in oligopoly markets under conditions of best-response asymmetry, yet few empirical studies
have examined the extent to which this occurs or the ability of firms to avoid this lower-
profit equilibrium. This study analyzes the role of competition-enhancing discrimination
within the airline industry, where previous work has extensively examined discrimination
but has focused entirely on forms of discrimination that reflect best-response symmetry. I
identify a form of price discrimination that is very likely to exhibit best-response asymmetry
within the U.S. domestic market and show that carriers have successfully avoided engaging
in this form of competition-enhancing discrimination despite using similar pricing strategies
frequently on international routes. The findings highlight the importance of considering
potential coordination in firms’ strategic decisions of whether to utilize certain forms of
price discrimination. Hopefully, future work will provide additional evidence form other
markets to improve our understanding the conditions under which firms engage in (or
attractive to Delta or Korean Air frequent fliers. United flights may be more attractive for United frequent fliersbased in San Francisco, but United is part of the Star Alliance which also includes Asiana Airlines, so Asianafrequent fliers based in Seoul may also find United flights equally attractive. Since most international flightsin the sample involve major international airports that are likely to be hubs for foreign carriers that are alliedwith U.S. carriers, large asymmetries in the alliance preferences across endpoint airports may be somewhatinfrequent.
30

avoid) competition-enhancing price discrimination.
References
Asplund, Marcus, Rickard Eriksson, and Niklas Strand, “Price Discrimination inOligopoly: Evidence from Regional Newspapers,” The Journal of Industrial Economics,2008, 56 (2), 333–346.
Borenstein, Severin, “Price Discrimination in Free-Entry Markets,” The RAND Journal ofEconomics, 1985, 16 (3), 380–397.
, “The Dominant-Firm Advantage in Multiproduct Industries: Evidence from the U. S.Airlines,” The Quarterly Journal of Economics, 1991, 106 (4), 1237–1266.
and Nancy Rose, “Competition and Price Dispersion in the U.S. Airline Industry,” TheJournal of Political Economy, August 1994, 112 (4), 653–683.
Bulow, Jeremy I., John D. Geanakoplos, and Paul D. Klemperer, “Multimarket Oligopoly:Strategic Substitutes and Complements,” Journal of Political Economy, 1985, 93 (3), 488–511.
Chen, Yuxin, Chakravarthi Narasimhan, and Z. John Zhang, “Consumer Heterogeneityand Competitive Price-Matching Guarantees,” Marketing Science, 2001, 20 (3), 300–314.
Corts, Kenneth S., “Third-Degree Price Discrimination in Oligopoly: All-Out Competitionand Strategic Commitment,” The RAND Journal of Economics, 1998, 29 (2), 306–323.
Dana, James D., “AdvancedRPurchase Discounts and Price Discrimination in CompetitiveMarkets,” Journal of Political Economy, 1998, 106 (2), 395–422.
Fudenberg, Drew and Jean Tirole, “Customer Poaching adn Brand Switching,” RAND Jour-nal of Economics, Winter 2000, 31 (4), 634–657.
Gerardi, Kristopher S. and Adam Hale Shapiro, “Does Competition Reduce Price Disper-sion? New Evidence from the Airline Industry,” Journal of Political Economy, 2009, 117(1), 1–37.
Holmes, Thomas J., “The Effects of Third-Degree Price Discrimination in Oligopoly,” TheAmerican Economic Review, 1989, 79 (1), 244–250.
Luttmann, Alexander, “Evidence of Directional Price Discrimination in the U.S. Airline In-dustry,” June 2017. Paper presented at the 2017 International Transportation EconomicsAssociation Annual Conference (ITEA).
Miller, Nathan H. and Matthew Osborne, “Spatial differentiation and price discrimina-tion in the cement industry: evidence from a structural model,” The RAND Journal ofEconomics, 2014, 45 (2), 221–247.
31

Puller, Steven L. and Lisa M. Taylor, “Price discrimination by day-of-week of purchase:Evidence from the U.S. airline industry,” Journal of Economic Behavior & Organization,2012, 84 (3), 801 – 812.
, Anirban Sengupta, and Steven N. Wiggins, “Testing Theories of Scarcity Pricing in theAirline Industry,” Working Paper 15555, National Bureau of Economic Research Decem-ber 2009.
Shaffer, Greg and Z. John Zhang, “Competitive Coupon Targeting,” Marketing Science,1995, 14 (4), 395–416.
and , “Competitive One-to-One Promotions,” Management Science, 2002, 48 (9),1143–1160.
Stavins, Joanna, “Price Discrimination in the Airline Market: The Effect of Market Concen-tration,” The Review of Economics and Statistics, 2001, 83 (1), 200–202.
Thisse, Jacques-Francois and Xavier Vives, “On The Strategic Choice of Spatial PricePolicy,” The American Economic Review, 1988, 78 (1), 122–137.
32
Appendix A: Directional Fare Differences Using DB1B Data
Analysis based on disaggregated fare quote data clearly reveals a lack of directional price
discrimination in the U.S. domestic airline market. However, a similar investigation per-
formed using quarterly-average prices from the DOT’s DB1B 10% ticket sample database
has the potential to yield misleading results due to aggregation and the inability to control
for unobserved heterogeneity in costs across the flights of a particular carrier and route
within a given quarter. In this appendix, I explore this potential by estimating the speci-
fications in Table 4 using average fares computed form the DB1B data. These regressions
also help relate my results to those of Luttmann (2017) who studies directional price dif-
ferences using DB1B data and relates these to endpoint airport demographics (though not
to the endpoint airport market shares that are the focus of my study).
As in Table 4, an observation is a unique route-carrier pair, and the sample includes
the top 1000 routes as measured by passenger enplanements.8 The new directional price
difference measure is defined as:
DirectionalPriceDiffDB1B%cr =PAcr − PB
cr
PBcr
,
where PAcr and PB
cr represent the average fares of tickets sold on route r by carrier c during
the year 2016 that originate out of airport A and airport B respectively. All other variable
are defined exactly as in the main analysis.
Directional differences in the DB1B-based price measure are, in fact, substantially
different than those observed in the disaggregate fare-quote data. The median size (in
absolute value) of the directional differences in average fares is around 6.7% as compared
with a median of zero in the fare quote data. Nearly 20% of carrier-route observations
exhibit directional fare differences of over 15%.
Results from the regressions relating these DB1B prices to endpoint airport charac-
teristics are reported in Table 7. Columns 3 thorough 6 limit the sample to only the largest
500 routes to more closely match the selection of routes in the fare quote data. All speci-
fications indicate large and statistically significant positive relationships between endpoint8Carrier-route observations are only included if the carrier has more than 500 tickets appearing in the DB1B
10% sample (implying more than 5000 travelers annually) on that route.
33

Table 7: Analysis of Directional Differences in DB1B Average Fares
Top 1000 routes Top 500 routes
(1) (2) (3) (4) (5) (6)
EndpointShareDiff 0.124 0.077 0.162 0.113(0.007) (0.007) (0.012) (0.009)
RivalEndpointShareDiff -0.004 -0.053 0.016 -0.037(0.012) (0.011) (0.017) (0.013)
LogMedianIncomeDiff 0.163 0.162 0.184 0.182(0.015) (0.015) (0.019) (0.019)
LogPopulationDiff 0.025 0.020 0.034 0.030(0.002) (0.003) (0.003) (0.003)
constant 0.003 0.002 -0.0003 0.001 -0.002 -0.004(0.004) (0.003) (0.003) (0.005) (0.004) (0.004)
N 1791 1791 1791 1160 1160 1160R2 0.180 0.236 0.361 0.211 0.283 0.442
Notes: The dependent variable is the percent directional difference in DB1B average ticket prices for a carrier
on a route. Standard errors are reported in parentheses and are clustered at the origin-destination pair level to
control for correlation across airlines within the same route.
airport share differences and directional price differences. Similarly, prices appear to be
higher for travelers departing out of larger cites and cities with higher median income. For
example, a one standard deviation increase in carrier endpoint airport share is associated
with an increase in price on the order of 5 percent, and a 15 percent (i.e., roughly 1 stan-
dard deviation) increase in median income is associated with an increase in price of about
2.5 percent. Without fare quote data one might be tempted to conclude from these results
that airlines do engage in directional price discrimination. However, given that actual fare
quotes did not exhibit any meaningful directional differences, observed differences in the
DB1B average ticket prices most likely indicate that travelers from large high-income cities
and travelers buying tickets from a carrier that dominates the origin airport more often
purchase tickets on relatively expensive flights or purchase closer to the date of travel. Dif-
ferences in prices across flights operated by a carrier on a route may result in part from
price discrimination but are also likely to reflect differences in the (opportunity) cost of
operating the flight. As a result, it appears that drawing conclusion about directional price
discrimination from DB1B data is likely to be highly misleading.
34