avo investigation of the ben nevis reservoir at the hebron · pdf filein a neural network...
TRANSCRIPT

AVO investigation of the Ben Nevis reservoir at the Hebron asset Andrew J. Royle (CREWES Project and Geo-X Systems Ltd.), John D. Logel (Anadarko Canada Corp.), and Laurence R. Lines (CREWES Project, Univ. of Calgary) Summary This paper investigates the amplitude variation with offset (AVO) behavior at the Ben Nevis reservoir zone in an attempt to predict API oil gravity variations. Intercept, gradient, fluid factor, and density reflectivity attribute volumes were extracted to observe the AVO effects at the reservoir zone. These attributes isolated the oil zones associated with the Ben Nevis reservoir and showed differences between the adjacent fault block reservoir zones. Detailed crossplotting at the oil bearing well locations isolated anomalous zones associated with the response at the top of the reservoir. Simultaneous inversion methods were applied to the dataset, which provided useful information on the nature of the lithology and pore fluids. The AVO and inversion attributes were then used as inputs in a neural network analysis for porosity and fluid density. The porosity volume correlated closely with the well data across the asset and the fluid density volume showed variations in oil density across the asset. Introduction The Hebron asset is comprised of Hebron, West Ben Nevis, and the Ben Nevis fields. This prospect is located in the southern portion of the Jeanne d’Arc Basin, approximately 350 kilometers from St. John’s, Newfoundland (Figure 1). Significant discovery licenses covering this asset were awarded in the mid 1980’s based on four exploratory wells over an area of approximately 36 square kilometers.
Figure.1: Hebron / Ben Nevis location map. Oil in place potential for the asset including un-drilled fault blocks is estimated to exceed 2 billion barrels. The CNOPB1 states that there are about 400 million barrels of recoverable oil, based on what has been already drilled, making Hebron the second largest field in the Jeanne d’Arc Basin after Hibernia. The upper Ben Nevis horizon
1 Canada-Newfoundland Offshore Petroleum Board
encountered significant volumes of crude with gravities in the range of 19 to 21 degree API. Oil is usually classified as heavy if it has API gravities of 20 degrees or less. Therefore, the oil encountered in the Ben Nevis is still not as dense as water. The density of this oil however presents several production challenges and may require special processing equipment. The Hibernia and Jeanne d’Arc horizons encountered marginal volumes of lighter gravity crude. The Hibernia formation encountered 29-degree gravity oil while the Jeanne d’Arc encountered highly variable gravities from 24 to 36 degree gravity oil, the higher of which are similar to those of the Hibernia oil field (Figure 2). The oil in the Ben Nevis zone has a specific gravity ranging from approximately 0.84 to 0.95. Therefore, it may be possible to distinguish between the different gravity hydrocarbons. The Ben Nevis has a gas cap in the structural high regions of the eastern fault blocks; this may aid in discriminating some of the reservoir zones and the hydrocarbon boundaries. Interpretation and Analysis In this analysis a subset of the 3D volume covering the Hebron asset was pre-stack migrated in preparation for AVO analysis. The key horizon markers used were the Petrel marker, top Ben Nevis, A-marker, and the B-marker. The reservoir quality in the Ben Nevis degrades from the higher regions in the west to the deeper regions in the east. The porosity decreases with depth and the P-wave velocity and density increase with depth. This influences the AVO response at the Ben Nevis zone.
Figure 2: Schematic cross section of Hebron / Ben Nevis asset (Provais, 2000).
AVO investigation of the Ben Nevis reservoir at the Hebron asset
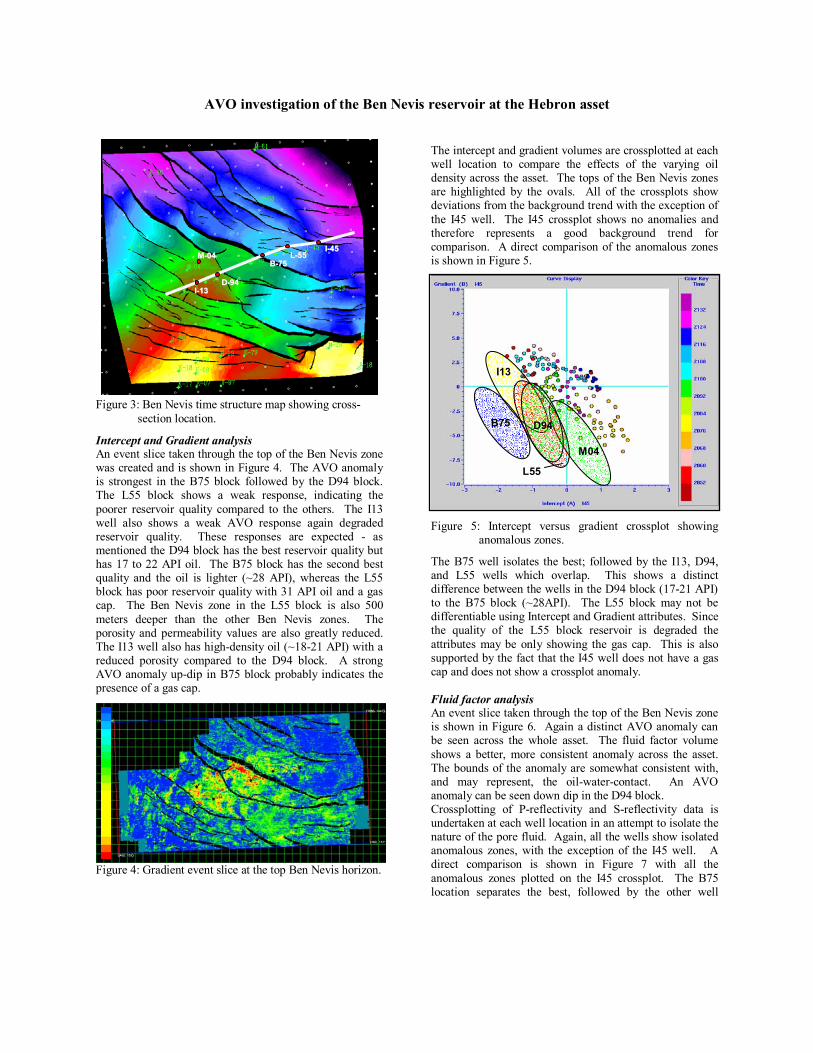
Figure 3: Ben Nevis time structure map showing cross-
section location.
Intercept and Gradient analysis An event slice taken through the top of the Ben Nevis zone was created and is shown in Figure 4. The AVO anomaly is strongest in the B75 block followed by the D94 block. The L55 block shows a weak response, indicating the poorer reservoir quality compared to the others. The I13 well also shows a weak AVO response again degraded reservoir quality. These responses are expected - as mentioned the D94 block has the best reservoir quality but has 17 to 22 API oil. The B75 block has the second best quality and the oil is lighter (~28 API), whereas the L55 block has poor reservoir quality with 31 API oil and a gas cap. The Ben Nevis zone in the L55 block is also 500 meters deeper than the other Ben Nevis zones. The porosity and permeability values are also greatly reduced. The I13 well also has high-density oil (~18-21 API) with a reduced porosity compared to the D94 block. A strong AVO anomaly up-dip in B75 block probably indicates the presence of a gas cap.
Figure 4: Gradient event slice at the top Ben Nevis horizon.
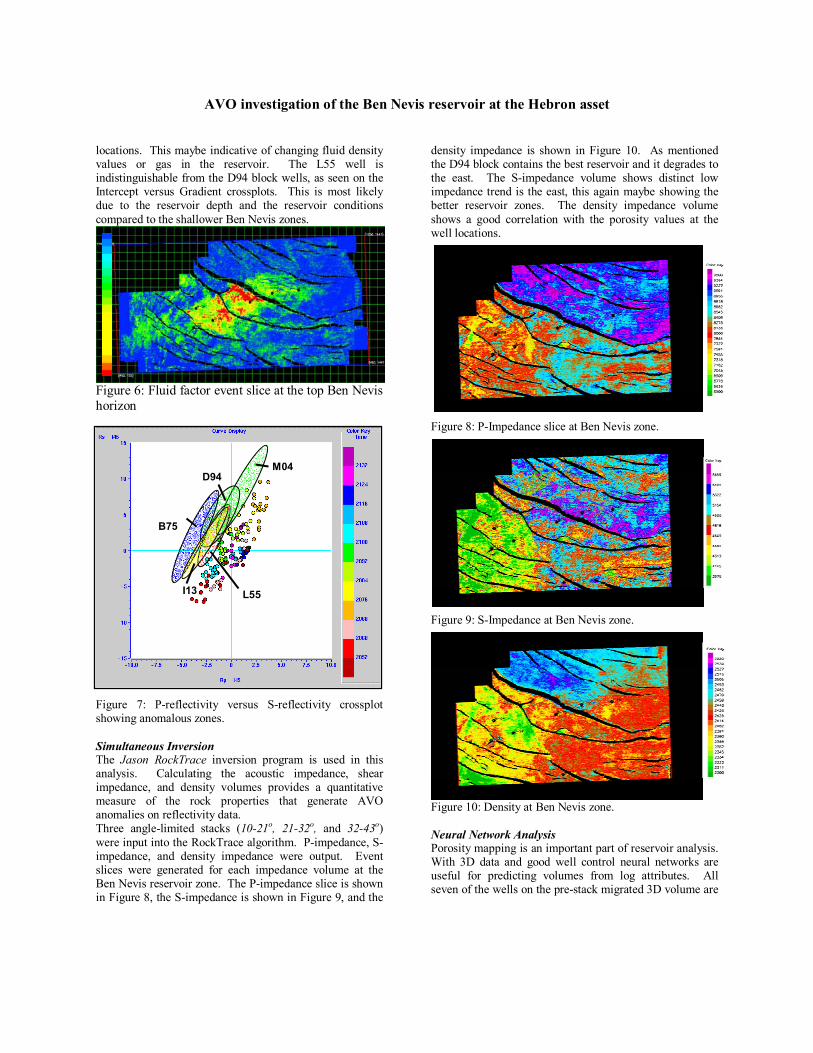
The intercept and gradient volumes are crossplotted at each well location to compare the effects of the varying oil density across the asset. The tops of the Ben Nevis zones are highlighted by the ovals. All of the crossplots show deviations from the background trend with the exception of the I45 well. The I45 crossplot shows no anomalies and therefore represents a good background trend for comparison. A direct comparison of the anomalous zones is shown in Figure 5.
Figure 5: Intercept versus gradient crossplot showing
anomalous zones.
The B75 well isolates the best; followed by the I13, D94, and L55 wells which overlap. This shows a distinct difference between the wells in the D94 block (17-21 API) to the B75 block (~28API). The L55 block may not be differentiable using Intercept and Gradient attributes. Since the quality of the L55 block reservoir is degraded the attributes may be only showing the gas cap. This is also supported by the fact that the I45 well does not have a gas cap and does not show a crossplot anomaly. Fluid factor analysis An event slice taken through the top of the Ben Nevis zone is shown in Figure 6. Again a distinct AVO anomaly can be seen across the whole asset. The fluid factor volume shows a better, more consistent anomaly across the asset. The bounds of the anomaly are somewhat consistent with, and may represent, the oil-water-contact. An AVO anomaly can be seen down dip in the D94 block. Crossplotting of P-reflectivity and S-reflectivity data is undertaken at each well location in an attempt to isolate the nature of the pore fluid. Again, all the wells show isolated anomalous zones, with the exception of the I45 well. A direct comparison is shown in Figure 7 with all the anomalous zones plotted on the I45 crossplot. The B75 location separates the best, followed by the other well
MM--0044
DD--9944 II--1133
BB--7755 LL--5555
II--4455
B75
M04
I13
D94
L55
AVO investigation of the Ben Nevis reservoir at the Hebron asset
locations. This maybe indicative of changing fluid density values or gas in the reservoir. The L55 well is indistinguishable from the D94 block wells, as seen on the Intercept versus Gradient crossplots. This is most likely due to the reservoir depth and the reservoir conditions compared to the shallower Ben Nevis zones.
Figure 6: Fluid factor event slice at the top Ben Nevis horizon
Error!
Figure 7: P-reflectivity versus S-reflectivity crossplot showing anomalous zones. Simultaneous Inversion The Jason RockTrace inversion program is used in this analysis. Calculating the acoustic impedance, shear impedance, and density volumes provides a quantitative measure of the rock properties that generate AVO anomalies on reflectivity data. Three angle-limited stacks (10-21o, 21-32o, and 32-43o) were input into the RockTrace algorithm. P-impedance, S-impedance, and density impedance were output. Event slices were generated for each impedance volume at the Ben Nevis reservoir zone. The P-impedance slice is shown in Figure 8, the S-impedance is shown in Figure 9, and the
density impedance is shown in Figure 10. As mentioned the D94 block contains the best reservoir and it degrades to the east. The S-impedance volume shows distinct low impedance trend is the east, this again maybe showing the better reservoir zones. The density impedance volume shows a good correlation with the porosity values at the well locations.
Figure 8: P-Impedance slice at Ben Nevis zone.
Figure 9: S-Impedance at Ben Nevis zone.
Figure 10: Density at Ben Nevis zone. Neural Network Analysis Porosity mapping is an important part of reservoir analysis. With 3D data and good well control neural networks are useful for predicting volumes from log attributes. All seven of the wells on the pre-stack migrated 3D volume are
B75
D94
I13 L55
M04

AVO investigation of the Ben Nevis reservoir at the Hebron asset
used in the neural network analysis. In input attributes include: stacked seismic data, intercept, gradient, fluid factor, P-impedance, S-impedance, and density. Figure 11 shows an event slice at the Ben Nevis horizon from the derived porosity cube. Figure 11: Porosity event slice at Ben Nevis zone.
Fluid density logs were created at each of the well locations using the water saturation log and known values for the oil and brine densities in each of the Ben Nevis reservoir zones. Again all seven wells were input for the fluid density prediction. The input attributes included: P-impedance, S-impedance, density, VP/VS, fluid factor, intercept, gradient, porosity, and stacked seismic volumes.
Figure 12: Fluid density event slice at Ben Nevis zone.
The fluid density volume (Figure 12) shows good correlation with the oil-water-contact in all the wells. In the Hebron block an oil density of approximately 930 kg/m3 can be seen. In the West Ben Nevis block the oil density is around 915 kg/m3 at the B75 well location. These values are dictated by the higher water saturation. The oil density values in the Ben Nevis block are approximately 750 kg/m3, which represent the lower density oil. The water saturation is also high in the Ben Nevis block in comparison with the Hebron block. Conclusions In this paper AVO methods were used in an attempt to distinguish oil density variations at the Ben Nevis oil reservoir. The AVO attribute time slices at the top of the Ben Nevis show the variations across to Hebron asset. The crossplots allow isolation and comparison of the AVO responses at the top of the Ben Nevis zone. The inversion volumes showed good insight on the reservoir quality and
pore fluid. Neural network results showed good correlation with the well control across the asset. The results from the neural network analysis were very encouraging. The predictions done in the past only used the stacked seismic attributes and P-impedance. Whereas, in the analysis AVO attributes, S-impedance, and density were also included. The density proved to be the best input attribute being the first and second ranked attribute in the step-wise regression analysis. The fluid density volume also correlates closely with the well control and oil-water-contact. The Hebron Ben Nevis zone is currently the only Ben Nevis zone that is economic and will be developed. The West Ben Nevis block zone has a much thinner oil column and higher water saturation. In the Ben Nevis block the reservoir quality is too poor for development at this point in time. References Aki, K., and Richards, P. G., 1980, Quantitative
seismology: W. H. Freeman & Co. Allen, J. L. and Peddy C. P., 1993, ‘Amplitude Variation
with Offset: Gulf Coast Case Studies’, SEG, Tulsa, Oklahoma.
Batzle, M. and Wang, Z., 1992, Seismic properties of pore fluids: Geophysics, 57, 1396-1408.
Fatti, J.L., Smith, G.C., Vail, P.J., Strauss, P.J., Levitt, P.R., 1994 Detection of gas in sandstone reservoirs using AVO analysis: Geophysics, 59, 1362-1376
Pendrel, J., 2001, Seismic inversion - The best tool for reservoir characterization: Recorder, 26, no. 1, 16-24.
Pendrel, J., and Dickson, T., 2003, Simultaneous AVO inversion to P-Impedance and VP/VS, CSEG 2003 annual convention expanded abstracts.
Provais, D. A., 2000, Hebron Asset Appraisal – East Coast of Canada Case History, GeoCanada expanded abstracts.
Shuey, R.T., 1985, A simplification of the Zoeppritz equations: Geophysics, 50, 609-614.
Smith, G. C., and Gidlow, P. M., 1987, Weighted stacking for rock property estimation in gas sands: Geophysical Prospecting, 35, 993-1014.
Acknowledgements We would like to thank Exxon-Mobil, Petro-Canada, ChevronTexaco, and Norsk-Hydro for their work on this field and the release of well data to the public domain. We would like to acknowledge Brian Grant, John Evans, Craig Coulombe, Paul Gremell, Suzanne Verheyde, Mark MacLeod and Mike Donovan of ChevronTexaco Canada Resources and Gerald Sullivan and Ed Stacey of Petro-Canada. We would like to thank Hampson-Russell for the use of their software, especially Brian Russell and Arthur Lee. We also would like to thank the CREWES sponsors and GEO-X Systems Ltd. for their support of this research.