aviva uk: the aviva family finances report 5 - january 2012
TRANSCRIPT

8/3/2019 Aviva UK: The Aviva Family Finances Report 5 - January 2012
http://slidepdf.com/reader/full/aviva-uk-the-aviva-family-finances-report-5-january-2012 1/32
The Aviva FamilyFinances ReportJanuary – 2012
FAM_REP_V4_33760_BRO.indd 1 16/01/2012 10:55

8/3/2019 Aviva UK: The Aviva Family Finances Report 5 - January 2012
http://slidepdf.com/reader/full/aviva-uk-the-aviva-family-finances-report-5-january-2012 2/32FAM_REP_V4_33760_BRO.indd 2 16/01/2012 10:55
8/3/2019 Aviva UK: The Aviva Family Finances Report 5 - January 2012
http://slidepdf.com/reader/full/aviva-uk-the-aviva-family-finances-report-5-january-2012 3/32
The typical UK family
While 84% of the UK population lives as part of a family, theconcept of the ‘traditional’ family is now outmoded. In theFamily Finances Report, Aviva recognises there are variousdifferent types of modern families (see page four for groupstracked) and looks at their individual approaches to financesincluding wealth, debt and expenditure.
In addition, this January 2012 report looks at why finances can be a taboo topic for families,
and also the implications for those who don’t discuss ‘what if?’ scenarios with their loved
ones. Here Aviva encourages families to overcome these taboos and think about how their
families might cope financially, if their circumstances were to change.
Overview:
l Income – Average incomes rise but are hit by the impact of inflation (pg 5).
l Sourcesofincome– Sources of income remain steady over the year (pg 7).
l Expenditure – Spending levels remain steady as families juggle priorities (pg 9).
l Familywealth – Cost of living impacts on savings (pg 12).
l Housingwealth– Family house prices rise but housing wealth lags behind (pg 15).
l Familyborrowing– Level of unsecured debts doubles in a year (pg 18).
l Looktothefuture – Inflation fears top list of family concerns for 2012 (pg 20).
l Spotlight– Failure to discuss the ‘what ifs’ leaves families open to potential problems
(pg 22).
l AcrosstheUK – Regional data shows Londoners have it all – highest incomes but
also highest debts (pg 28).
The Aviva Family Finances Report 3
FAM_REP_V4_33760_BRO.indd 3 16/01/2012 10:55
8/3/2019 Aviva UK: The Aviva Family Finances Report 5 - January 2012
http://slidepdf.com/reader/full/aviva-uk-the-aviva-family-finances-report-5-january-2012 4/32
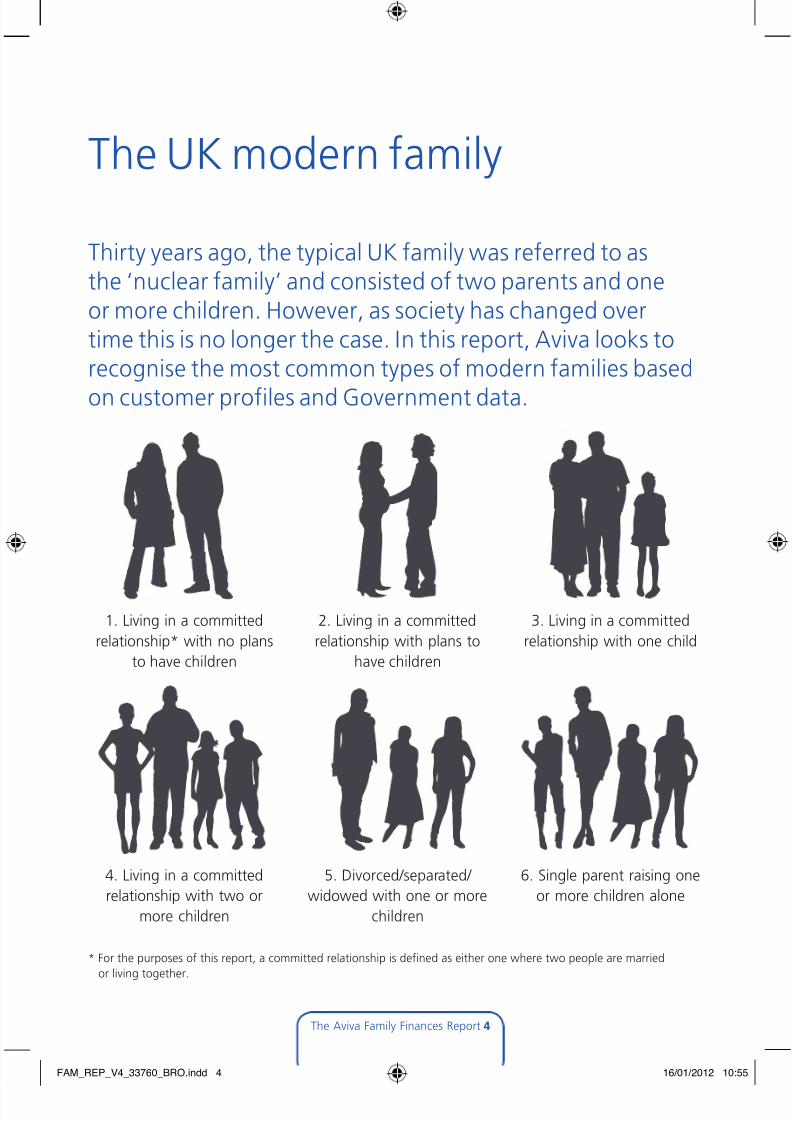
The UK modern family
The Aviva Family Finances Report 4
1. Living in a committed
relationship* with no plans
to have children
2. Living in a committed
relationship with plans to
have children
3. Living in a committed
relationship with one child
4. Living in a committed
relationship with two or
more children
5. Divorced/separated/
widowed with one or more
children
6. Single parent raising one
or more children alone
* For the purposes of this report, a committed relationship is defined as either one where two people are married
or living together.
Thirty years ago, the typical UK family was referred to asthe ‘nuclear family’ and consisted of two parents and oneor more children. However, as society has changed overtime this is no longer the case. In this report, Aviva looks torecognise the most common types of modern families based
on customer profiles and Government data.
FAM_REP_V4_33760_BRO.indd 4 16/01/2012 10:55
8/3/2019 Aviva UK: The Aviva Family Finances Report 5 - January 2012
http://slidepdf.com/reader/full/aviva-uk-the-aviva-family-finances-report-5-january-2012 5/32
Income
Averageincomesrisebutareabsorbedbytheimpactofinflation
The typical (i.e. the ‘median’ family in the
middle of the sample) monthly net income
of a family in the UK is now £2,066, which is
up (4%) on the previous quarter (November
2011 – £1,983), and up 7% compared to the
same time last year (January 2011 – £1,937).
The main factor behind this increase is the
rise in incomes experienced by those families
in committed relationships without children.
Those couples who are planning to have
children reported an 11% increase (year-
on-year) in monthly income from £2,187
(January 2011) to £2,433 (January 2012),and those living with a partner who do
not plan to have children reported a 10%
increase (year-on-year) in monthly income
from £2,010 (January 2011) to £2,220
(January 2012).
These two groups have the highest number of
people who derive an income from a ‘primary
job’ – i.e. income as a result of full timeemployment for the main breadwinner. Eighty
per cent of those families who plan to have
children, and 72% of those who do not plan
to have children, report this type of income.
The Aviva Family Finances Report 5
FAM_REP_V4_33760_BRO.indd 5 16/01/2012 10:55
8/3/2019 Aviva UK: The Aviva Family Finances Report 5 - January 2012
http://slidepdf.com/reader/full/aviva-uk-the-aviva-family-finances-report-5-january-2012 6/32
The Aviva Family Finances Report 6
Previous Family Finances Reports have noted the negative impact that children – especially
young children – can have on a family’s income and parents’ earning capacities, and this
appears to be the case still. Most family units with children also reported a slight year-on-year
increase in incomes, however divorced/separated/widowed parents reported a year-on-year
decrease from £1,387 (January 2011) to £1,075 (January 2012) per month. This decrease
has possibly been exacerbated by the changes to benefit payments which came into force in
2011, and also the impact of rising unemployment over the year.
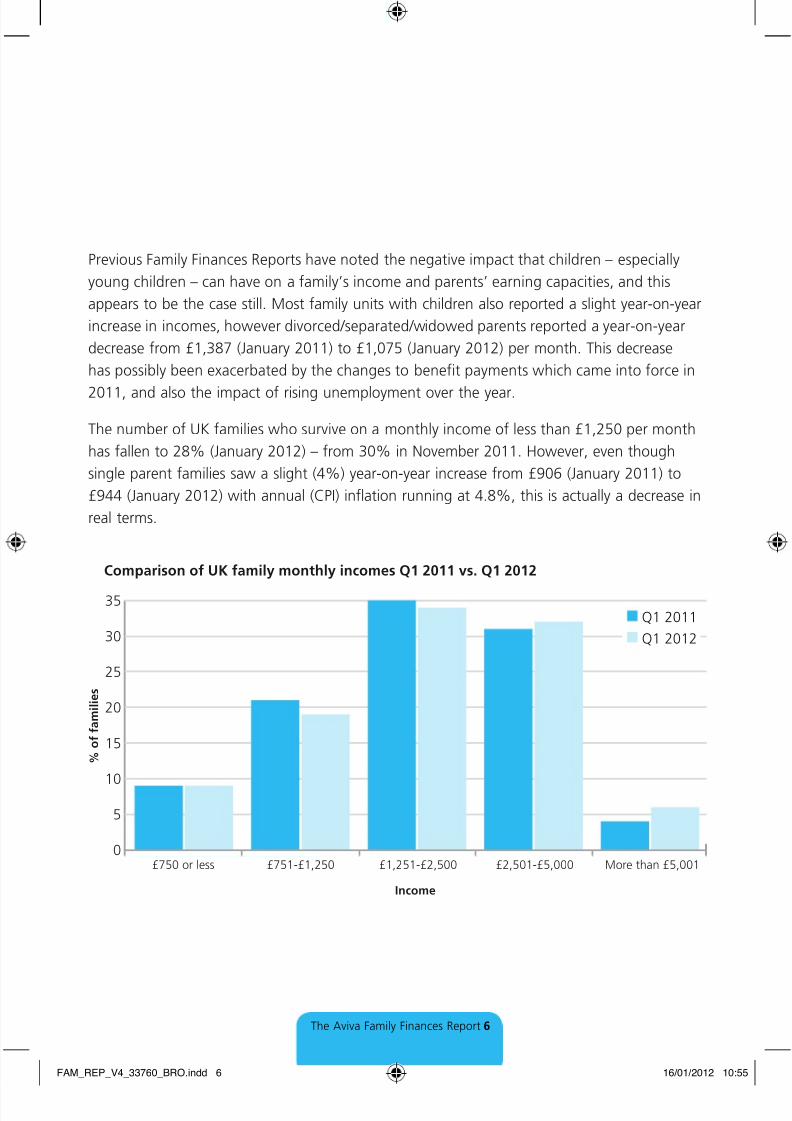
The number of UK families who survive on a monthly income of less than £1,250 per month
has fallen to 28% (January 2012) – from 30% in November 2011. However, even though
single parent families saw a slight (4%) year-on-year increase from £906 (January 2011) to
£944 (January 2012) with annual (CPI) inflation running at 4.8%, this is actually a decrease in
real terms.
0
5
10
15
20
25
30
35
Comparison of UK family monthly incomes Q1 2011 vs. Q1 2012
% o
f f a m i l i e s
Income
£750 or less £751-£1,250 £1,251-£2,500 £2,501-£5,000 More than £5,001
Q1 2011
Q1 2012
FAM_REP_V4_33760_BRO.indd 6 16/01/2012 10:55

8/3/2019 Aviva UK: The Aviva Family Finances Report 5 - January 2012
http://slidepdf.com/reader/full/aviva-uk-the-aviva-family-finances-report-5-january-2012 7/32
Sourcesofincome
The most common source of income for UK families is still the salary from a primary income
earner (69% – January 2012), although this has been falling over the past few quarters from a
high of 72% in August 2011 to 70% in November 2011. Government labour market statistics
for December 2011 support this declining trend as they show the unemployment rate is the
highest since 1996 and the number of unemployed people is the highest since 1994.
The number of families who obtain an income from spousal earnings remains relatively steady
(33% – January 2012 compared to 32% – November 2011), as does the number of families
who receive contributions from part-time or second jobs (18% – January 2012 compared to
18% – November 2011). The families most likely to report a part-time or second job are those
who are married with two or more children. More than one in five of these families (22% –
January 2012) are reliant on income from a second job to supplement their monthly income.
More than a fifth of families (22% – January 2012) rely on benefits to provide a
proportion of their monthly income. This has remained fairly steady over the last year(20% – January 2011). However, we have seen the number of single parents (50% – January
2012 vs. 54% – January 2011) and the number of divorced/separated/widowed parents
(47% – January 2012 vs. 54% – January 2011) claiming benefits fall. This suggests that the
Government’s benefit reforms have had an impact on some areas – a view supported by the
monthly income levels of these groups mentioned earlier.
Despite a year of low interest rates, volatile stock markets and falling bond yields, five per
cent of UK families still receive an income from savings and investments, although it is not
clear whether this is income from interest or from dipping into the capital. Families without
children are the most likely to receive an income from savings and investments, with 9% of
couples planning children, and 7% in a committed relationship with no plans to have children
reporting this.
The Aviva Family Finances Report 7
FAM_REP_V4_33760_BRO.indd 7 16/01/2012 10:55

8/3/2019 Aviva UK: The Aviva Family Finances Report 5 - January 2012
http://slidepdf.com/reader/full/aviva-uk-the-aviva-family-finances-report-5-january-2012 8/32
Spendingremainssteadyasfamiliesjugglepriorities
Despite the impact of inflation over the year, the average monthly family expenditure has
remained steady over the last 12 months. However there has been a notable drop in the
amount spent on children’s activities from 4% of monthly income in January 2011 to 1% in
January 2012.
There has been a slight dip in the amount spent on energy bills since the last quarter (6% –November 2011 compared to 5% – January 2012) which may be due to unseasonably mild
weather. There has also been a slight increase in the amount being spent on entertainment,
recreation and holidays (3% – November 2011 compared to 4% – January 2012) which could
be as a result of the festive period.
As a percentage of expenditure, debt repayment is also slightly higher than a year ago (8%
– January 2011 compared to 9% – January 2012), although lower than a peak seen in the
second quarter of 2011 (10%).
Expenditure
The Aviva Family Finances Report 8
FAM_REP_V4_33760_BRO.indd 8 16/01/2012 10:55
8/3/2019 Aviva UK: The Aviva Family Finances Report 5 - January 2012
http://slidepdf.com/reader/full/aviva-uk-the-aviva-family-finances-report-5-january-2012 9/32
The Aviva Family Finances Report 9
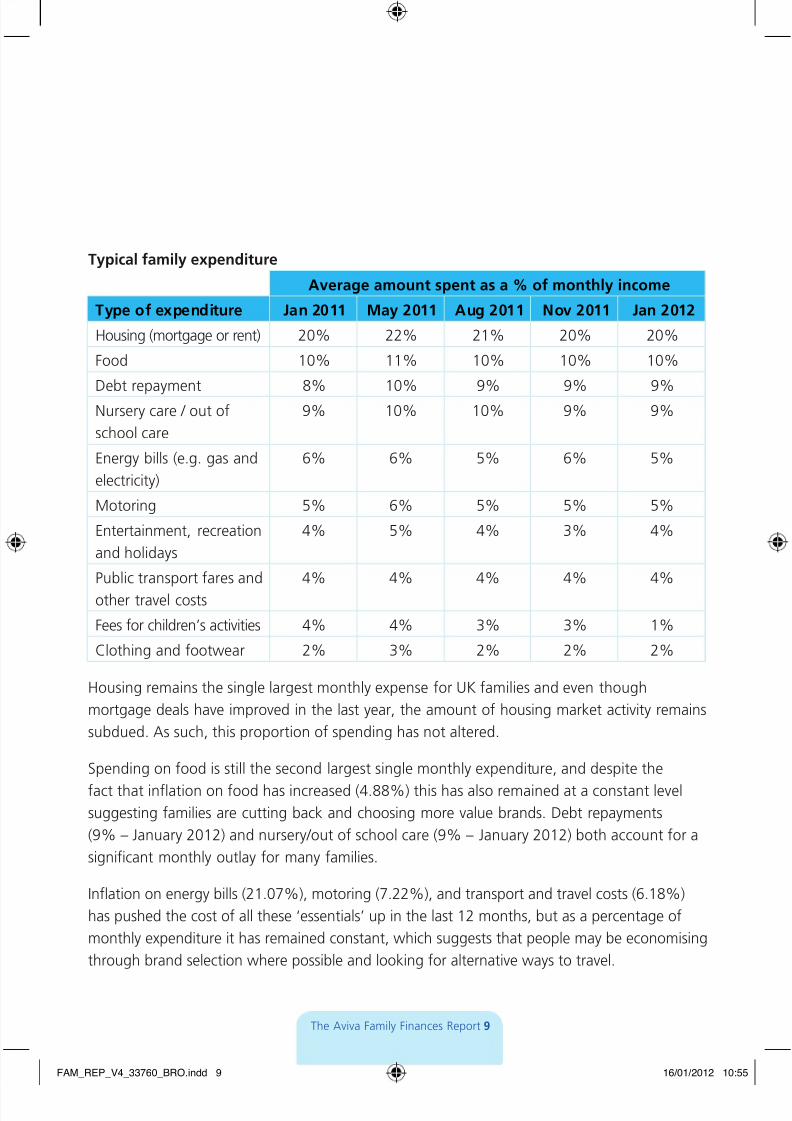
Typicalfamilyexpenditure
Averageamountspentasa%ofmonthlyincome
Typeofexpenditure Jan2011 May2011 Aug2011 Nov2011 Jan2012
Housing (mortgage or rent) 20% 22% 21% 20% 20%
Food 10% 11% 10% 10% 10%
Debt repayment 8% 10% 9% 9% 9%Nursery care / out of
school care
9% 10% 10% 9% 9%
Energy bills (e.g. gas and
electricity)
6% 6% 5% 6% 5%
Motoring 5% 6% 5% 5% 5%
Entertainment, recreation
and holidays
4% 5% 4% 3% 4%
Public transport fares and
other travel costs
4% 4% 4% 4% 4%
Fees for children’s activities 4% 4% 3% 3% 1%
Clothing and footwear 2% 3% 2% 2% 2%
Housing remains the single largest monthly expense for UK families and even though
mortgage deals have improved in the last year, the amount of housing market activity remains
subdued. As such, this proportion of spending has not altered.
Spending on food is still the second largest single monthly expenditure, and despite the
fact that inflation on food has increased (4.88%) this has also remained at a constant level
suggesting families are cutting back and choosing more value brands. Debt repayments
(9% – January 2012) and nursery/out of school care (9% – January 2012) both account for a
significant monthly outlay for many families.
Inflation on energy bills (21.07%), motoring (7.22%), and transport and travel costs (6.18%)
has pushed the cost of all these ‘essentials’ up in the last 12 months, but as a percentage of
monthly expenditure it has remained constant, which suggests that people may be economising
through brand selection where possible and looking for alternative ways to travel.
FAM_REP_V4_33760_BRO.indd 9 16/01/2012 10:55
8/3/2019 Aviva UK: The Aviva Family Finances Report 5 - January 2012
http://slidepdf.com/reader/full/aviva-uk-the-aviva-family-finances-report-5-january-2012 10/32
Spendingtrends
It is just as telling to see where families are not spending money, and the Family Finances
Report also tracks where UK families are cutting back and which expenses are vital. This
indicates what the fixed costs are for families and how their spending habits are affected by thestate of their finances.
Housing is an essential need, but the number of UK families who claim they do not spend
money on housing has been rising slowly over the last six months. In August 2011 20% said
they didn’t spend money on housing. By November 2011 this had risen to 21%, and in January
2012 22% of families said they are not spending any income on housing. This suggests that
they either own their own home outright, receive accommodation through employment, or are
supported by the State. In addition, some younger families may be economising by living with
extended family members.
The trend towards cutting back on non-essential items has continued into 2012, with 22%
of families (January 2012) claiming they are not spending money on personal goods (up from
17% in August 2011) and 30% saying they do without entertainment/recreation/holidays
(compared to 21% in August 2011). Almost half (42%) of families say they have cut out
spending on leisure goods completely (as opposed to 36% in August 2011).
The Aviva Family Finances Report 10
“UK families are determined to maintain their standard
of living despite the increases to the costs of goods and
services. Value for money is the watchword for many
families who have maintained spending on non-essential
items. Although with prices still rising, families may belooking to make further cutbacks in 2012.”
Louise Colley, head of protection sales and marketing, Aviva
FAM_REP_V4_33760_BRO.indd 10 16/01/2012 10:55

8/3/2019 Aviva UK: The Aviva Family Finances Report 5 - January 2012
http://slidepdf.com/reader/full/aviva-uk-the-aviva-family-finances-report-5-january-2012 11/32
However, while the percentage of monthly income spent on fees for children’s activities has
fallen in the last 12 months, the number of families spending money on these pursuits has
grown compared to a year ago. This might suggest that while families are paring back their
spending where possible, some are now having to spend money on low cost activities for their
children as there are fewer`free’ activities being provided.
PercentageoffamilieswhospendmoneyonthisexpenseonamonthlybasisTypeofexpenditure Nov2011 Jan2012
Housing (mortgage or rent) 79% 78%
Debt repayment 52% 52%
Entertainment, recreation and holidays 75% 70%
Public transport fares and other travel costs 67% 66%
Fees for children’s activities 48% 50%
Leisure goods 61% 58%
Eating out and takeaways 80% 77%
The Aviva Family Finances Report 11
FAM_REP_V4_33760_BRO.indd 11 16/01/2012 10:55

8/3/2019 Aviva UK: The Aviva Family Finances Report 5 - January 2012
http://slidepdf.com/reader/full/aviva-uk-the-aviva-family-finances-report-5-january-2012 12/32
Family wealth
Costoflivingimpactsonsavings
The rising cost of living in the last 12 months has meant UK families are finding it progressively
harder to set aside money each month. This report found the typical amount now being saved
on a monthly basis is £21 (January 2012), down from £22 in January 2011 – although there
was a spike in August when this reached £34.
Nevertheless, families are showing their resolve to maintain savings wherever possible and 70%of families say that they have some form of savings. There is no change from the last quarter in
terms of how many families have nothing set aside in savings (30% January 2012), but looking
over the last 12 months this has improved from 33% in January 2011.
The average (mean) amount UK families have in savings and investments (excluding pensions
and property) has increased significantly, but this is because the mean average is skewed by the
five per cent of families (January 2012) who have savings and investments worth more than
£100,000. Taking these people out of the equation brings the average down considerably.
The typical UK family (i.e. the family in the middle of the sample) has savings of £928 (January2012) which is actually up a more modest 9% from £849 in January 2011. This means that the
typical UK family has savings totalling less than half (45%) of the average (median) monthly
income of £2,066.
The majority of families classed as single parents (59%) and parents who are divorced/
separated/widowed (61%) say they do not manage to save anything each month.
These figures are significantly higher than the UK average, which shows that 42% of all
families save nothing on a monthly basis (January 2012). This figure is now at its highest level
for 12 months (40% in January 2011) and suggests that it is getting harder for families to save,
and also that there is a core group of families who are unable or unwilling to save.
It is notable that while the number of men who do not save regularly has fallen from 36%
(January 2011) to 33% (January 2012), for women the opposite is true and now 47% (January
2012) do not save on a monthly basis compared to 42% in January 2011. This trend is mirrored
by the typical (median) amounts being saved, with the typical monthly amount saved by a man
standing at £47 (January 2012) – up from £39 in January 2011 – while for women it has halved
over the same period from £16 a month to just £8 a month.
The Aviva Family Finances Report 12
FAM_REP_V4_33760_BRO.indd 12 16/01/2012 10:55
8/3/2019 Aviva UK: The Aviva Family Finances Report 5 - January 2012
http://slidepdf.com/reader/full/aviva-uk-the-aviva-family-finances-report-5-january-2012 13/32
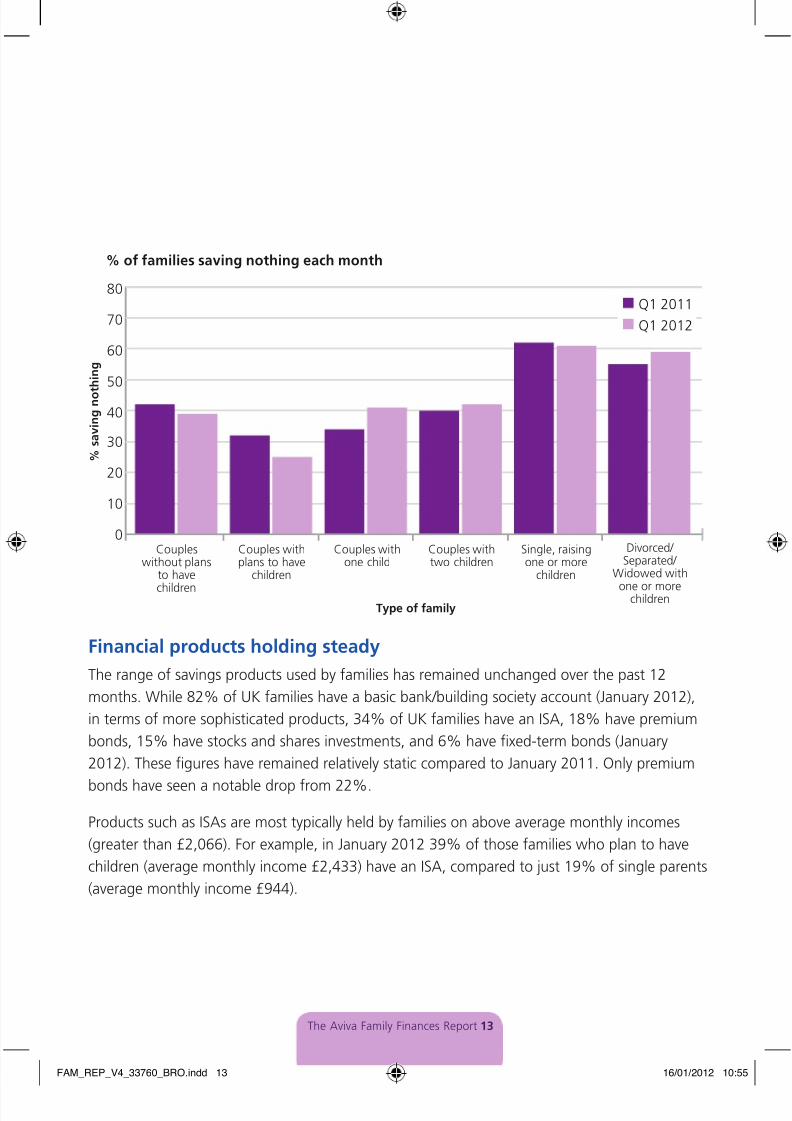
Financialproductsholdingsteady
The range of savings products used by families has remained unchanged over the past 12
months. While 82% of UK families have a basic bank/building society account (January 2012),
in terms of more sophisticated products, 34% of UK families have an ISA, 18% have premium
bonds, 15% have stocks and shares investments, and 6% have fixed-term bonds (January
2012). These figures have remained relatively static compared to January 2011. Only premium
bonds have seen a notable drop from 22%.
Products such as ISAs are most typically held by families on above average monthly incomes
(greater than £2,066). For example, in January 2012 39% of those families who plan to have
children (average monthly income £2,433) have an ISA, compared to just 19% of single parents
(average monthly income £944).
The Aviva Family Finances Report 13
0
10
20
30
40
50
60
70
80
% of families saving nothing each month
% s
a v i n g n o t h i n g
Type of family
Coupleswithout plans
to have
children
Couples withplans to have
children
Couples withone child
Couples withtwo children
Single, raisingone or more
children
Divorced/ Separated/
Widowed with
one or morechildren
Q1 2011
Q1 2012
FAM_REP_V4_33760_BRO.indd 13 16/01/2012 10:55

8/3/2019 Aviva UK: The Aviva Family Finances Report 5 - January 2012
http://slidepdf.com/reader/full/aviva-uk-the-aviva-family-finances-report-5-january-2012 14/32
This trend is similar for those who hold private pensions, with 33% of UK families (January
2012) holding a pension set up by their employer and 20% holding a personal private pension.
In January 2012, 30% of those families planning to have children (average monthly income
£2,433) have an employer pension, compared to just 21% of those divorced/separated/
widowed parents raising one or more children alone (average monthly income £1,075).
The number of families with protection insurance has also fallen over the last 12 months.While families with life insurance was up from 39% (January 2011) to 40% (January 2012),
the number with private health insurance is down from 15% (January 2011) to 12% (January
2012), and those with critical illness policies has fallen from 13% (January 2011) to 12%
(January 2012), with income protection down from 11% to 10%.
The Aviva Family Finances Report 14
“The latest Family Finances Report demonstrates that UK
families are feeling the pinch and as such are trying to
build and maintain a savings ‘buffer’ to protect themselves.However, at the same time the number of families who
have some type of protection insurance has declined. While
savings are clearly important, families should be aware that
protection products provide signicantly more nancial
security, should the unexpected happen.”
Louise Colley, head of protection sales and marketing, Aviva
FAM_REP_V4_33760_BRO.indd 14 16/01/2012 10:55
8/3/2019 Aviva UK: The Aviva Family Finances Report 5 - January 2012
http://slidepdf.com/reader/full/aviva-uk-the-aviva-family-finances-report-5-january-2012 15/32
Housing wealth
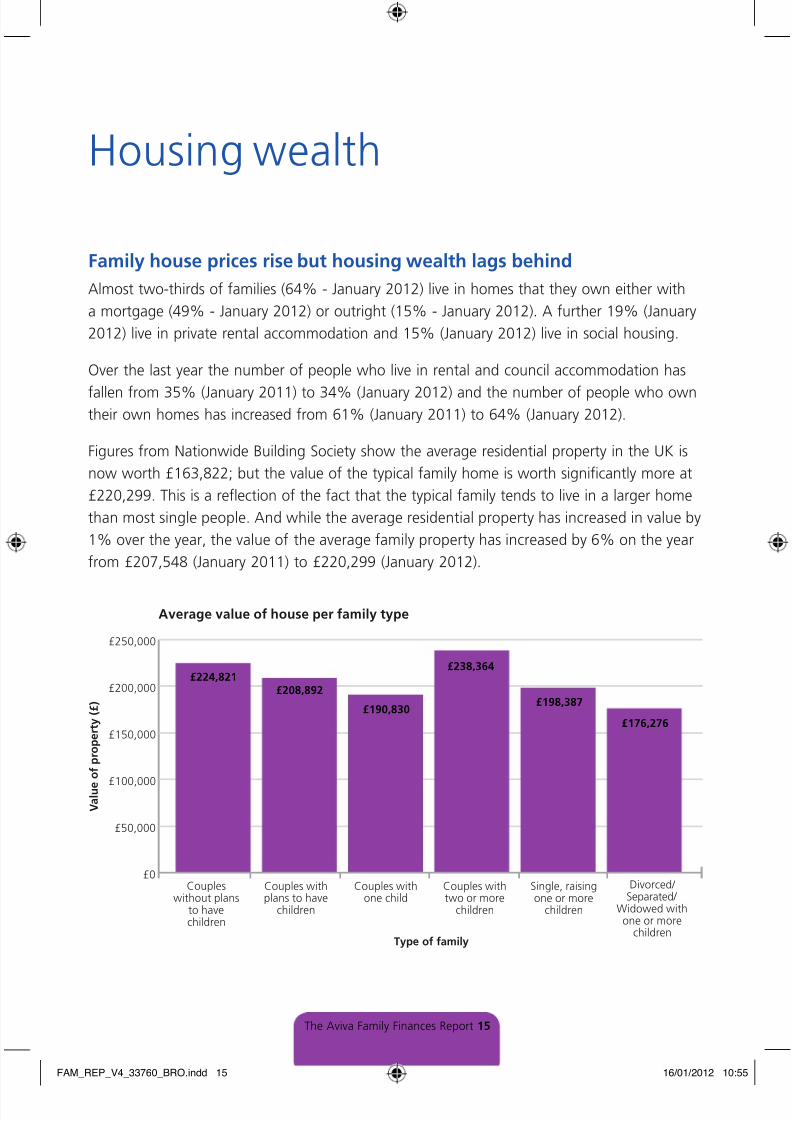
Familyhousepricesrisebuthousingwealthlagsbehind
Almost two-thirds of families (64% - January 2012) live in homes that they own either with
a mortgage (49% - January 2012) or outright (15% - January 2012). A further 19% (January
2012) live in private rental accommodation and 15% (January 2012) live in social housing.
Over the last year the number of people who live in rental and council accommodation has
fallen from 35% (January 2011) to 34% (January 2012) and the number of people who owntheir own homes has increased from 61% (January 2011) to 64% (January 2012).
Figures from Nationwide Building Society show the average residential property in the UK is
now worth £163,822; but the value of the typical family home is worth significantly more at
£220,299. This is a reflection of the fact that the typical family tends to live in a larger home
than most single people. And while the average residential property has increased in value by
1% over the year, the value of the average family property has increased by 6% on the year
from £207,548 (January 2011) to £220,299 (January 2012).
The Aviva Family Finances Report 15
£0
£50,000
£100,000
£150,000
£200,000
£250,000
Average value of house per family type
V a l u e
o f p r o p e r t y
( £ )
Type of family
Coupleswithout plans
to havechildren
Couples withplans to have
children
Couples withone child
Couples withtwo or more
children
Single, raisingone or more
children
Divorced/ Separated/
Widowed withone or more
children
£224,821£208,892
£190,830
£238,364
£198,387
£176,276
FAM_REP_V4_33760_BRO.indd 15 16/01/2012 10:55

8/3/2019 Aviva UK: The Aviva Family Finances Report 5 - January 2012
http://slidepdf.com/reader/full/aviva-uk-the-aviva-family-finances-report-5-january-2012 16/32
The average amount of equity families have in their homes has not risen at the same
pace however, increasing just 2% in the last 12 months from £139,218 (January 2011) to
£141,889 (January 2012). And the average family mortgage has increased from £89,018
(January 2011) to £101,538 (January 2012).
This tallies with data from the Council of Mortgage Lenders which has predicted that the
number of borrowers who could lose their homes because they cannot afford to pay theirmortgage will rise from 37,000 in 2011 to 45,000 in 2012. And tenants are not immune from
financial pressures either as they have seen rents rise significantly in 2011 to stand at a UK
average of £717 a month in December 2011.
Separate research from housing charity Shelter claimed in January 2012 that almost one
million people have resorted to payday loans (short-term loans with high rates of interest) to
cover their mortgage or rent in the last year.
Single people raising one or more children alone are the most likely to be living in social
housing (46% - January 2012) compared to single couples who plan to have children
(6% - January 2012).
The Aviva Family Finances Report 16
“Families tend to live in properties worth signicantly
more than the national average. However with nancestight for many it is a concern to see industry bodies
predicting more families will nd it difcult to maintain
repayments in 2012. Planning for contingencies affords
families the peace of mind that should the unexpected
happen, they will be able to cover their mortgage or rent,
and can have the stability of staying in their home.”
Louise Colley, head of protection sales and marketing, Aviva
FAM_REP_V4_33760_BRO.indd 16 16/01/2012 10:55
8/3/2019 Aviva UK: The Aviva Family Finances Report 5 - January 2012
http://slidepdf.com/reader/full/aviva-uk-the-aviva-family-finances-report-5-january-2012 17/32
Those families who are married/in a committed relationship with two or more children are the mostlikely to own their own home with a mortgage (56% - January 2012) and those who don’t plan to
have children are the most likely to live in a home they own outright (25% - January 2012).
The number of families who own a second property has increased from 13% to 16%
since January 2011 with those couples not planning children being the most likely to
do so (19% - January 2012).
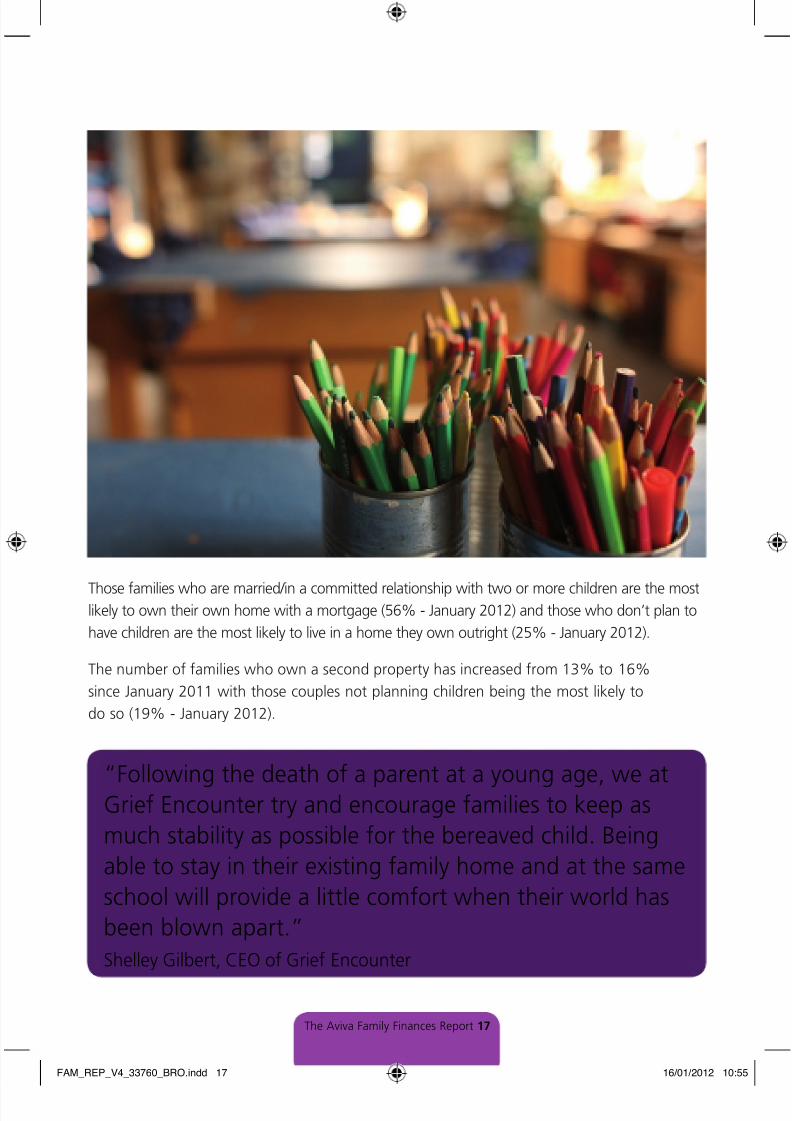
“Following the death of a parent at a young age, we atGrief Encounter try and encourage families to keep as
much stability as possible for the bereaved child. Being
able to stay in their existing family home and at the same
school will provide a little comfort when their world has
been blown apart.”
Shelley Gilbert, CEO of Grief Encounter
The Aviva Family Finances Report 17
FAM_REP_V4_33760_BRO.indd 17 16/01/2012 10:55
8/3/2019 Aviva UK: The Aviva Family Finances Report 5 - January 2012
http://slidepdf.com/reader/full/aviva-uk-the-aviva-family-finances-report-5-january-2012 18/32
Family borrowing
Levelofunsecureddebtssoarsinayear
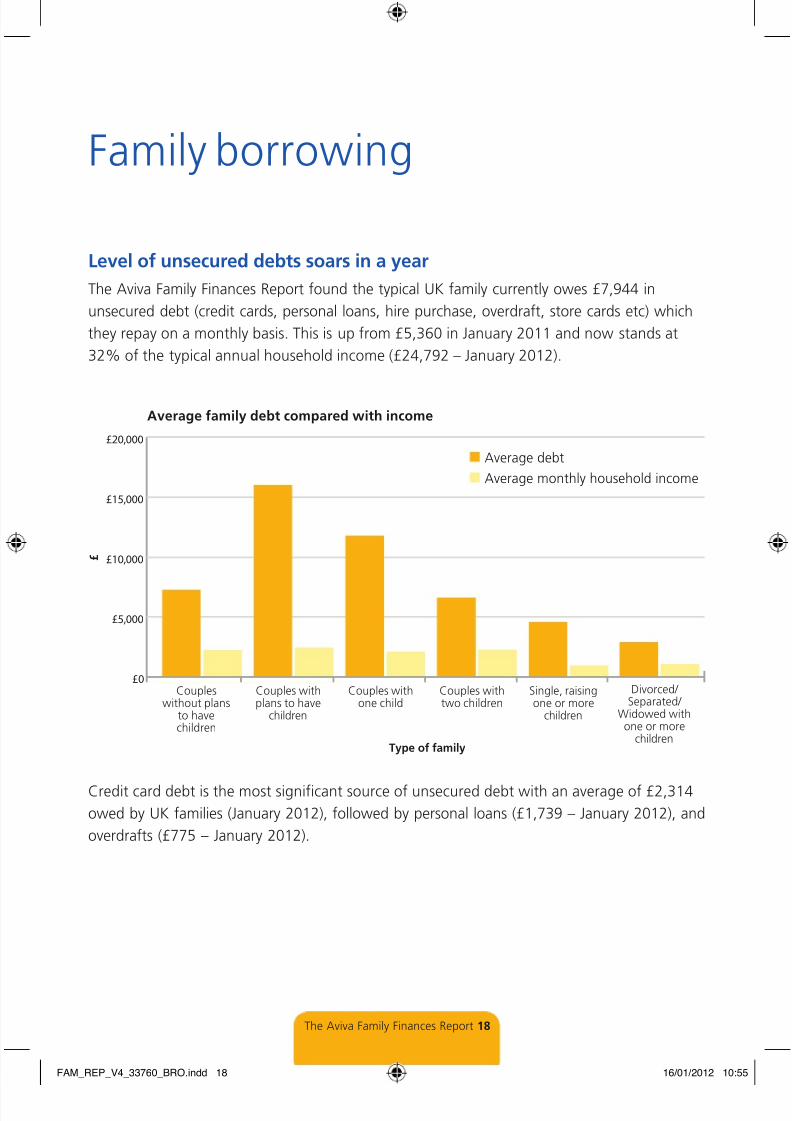
The Aviva Family Finances Report found the typical UK family currently owes £7,944 in
unsecured debt (credit cards, personal loans, hire purchase, overdraft, store cards etc) which
they repay on a monthly basis. This is up from £5,360 in January 2011 and now stands at
32% of the typical annual household income (£24,792 – January 2012).
Credit card debt is the most significant source of unsecured debt with an average of £2,314
owed by UK families (January 2012), followed by personal loans (£1,739 – January 2012), and
overdrafts (£775 – January 2012).
£0
£5,000
£10,000
£15,000
£20,000
Average family debt compared with income
£
Type of family
Coupleswithout plans
to havechildren
Couples withplans to have
children
Couples withone child
Couples withtwo children
Single, raisingone or more
children
Divorced/ Separated/
Widowed withone or more
children
Average debt
Average monthly household income
The Aviva Family Finances Report 18
FAM_REP_V4_33760_BRO.indd 18 16/01/2012 10:55
8/3/2019 Aviva UK: The Aviva Family Finances Report 5 - January 2012
http://slidepdf.com/reader/full/aviva-uk-the-aviva-family-finances-report-5-january-2012 19/32
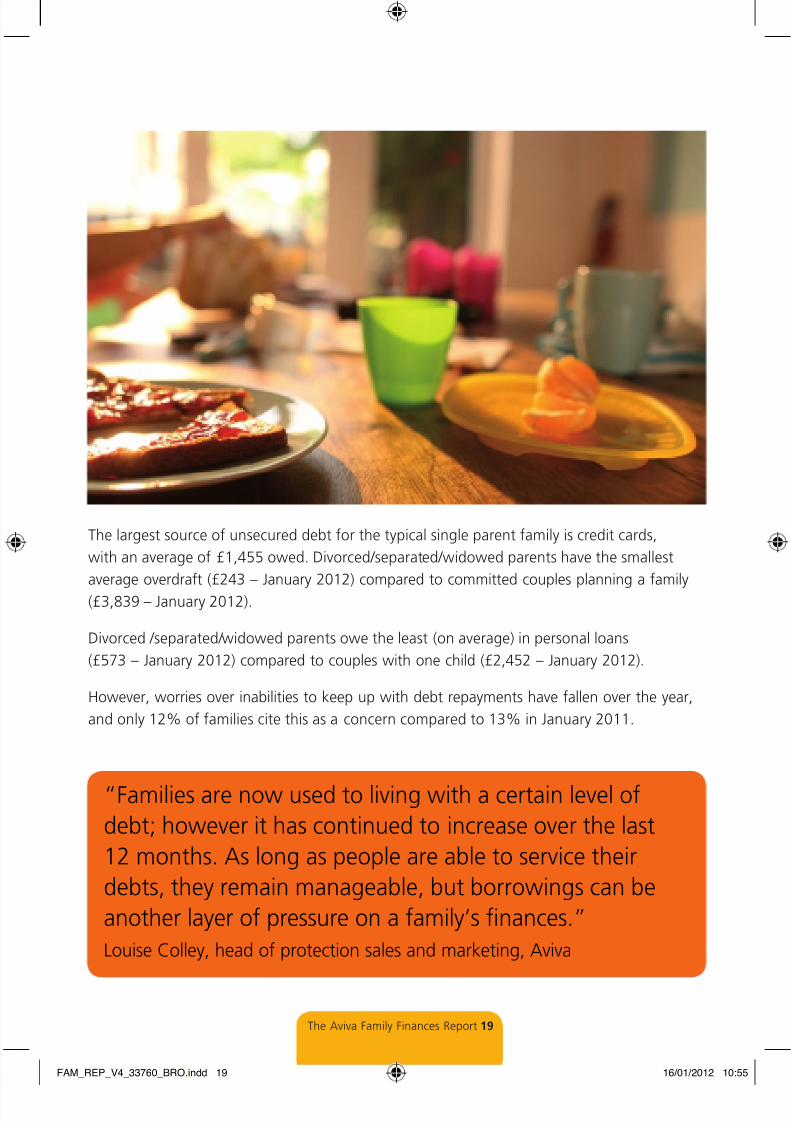
The largest source of unsecured debt for the typical single parent family is credit cards,
with an average of £1,455 owed. Divorced/separated/widowed parents have the smallest
average overdraft (£243 – January 2012) compared to committed couples planning a family
(£3,839 – January 2012).
Divorced /separated/widowed parents owe the least (on average) in personal loans
(£573 – January 2012) compared to couples with one child (£2,452 – January 2012).
However, worries over inabilities to keep up with debt repayments have fallen over the year,
and only 12% of families cite this as a concern compared to 13% in January 2011.
“Families are now used to living with a certain level of
debt; however it has continued to increase over the last
12 months. As long as people are able to service their
debts, they remain manageable, but borrowings can be
another layer of pressure on a family’s nances.”
Louise Colley, head of protection sales and marketing, Aviva
The Aviva Family Finances Report 19
FAM_REP_V4_33760_BRO.indd 19 16/01/2012 10:55
8/3/2019 Aviva UK: The Aviva Family Finances Report 5 - January 2012
http://slidepdf.com/reader/full/aviva-uk-the-aviva-family-finances-report-5-january-2012 20/32
Look to the future
Inflationfearstoplistoffamilyconcernsfor2012
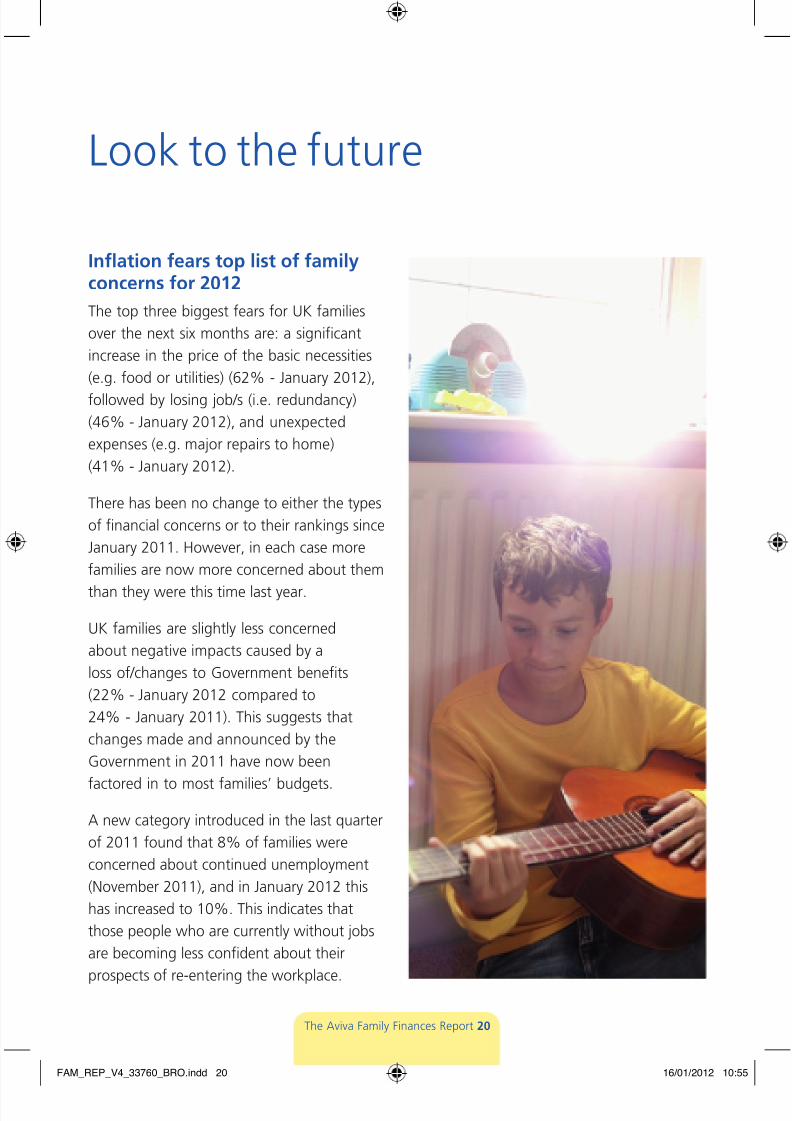
The top three biggest fears for UK families
over the next six months are: a significant
increase in the price of the basic necessities
(e.g. food or utilities) (62% - January 2012),
followed by losing job/s (i.e. redundancy)
(46% - January 2012), and unexpected
expenses (e.g. major repairs to home)
(41% - January 2012).
There has been no change to either the types
of financial concerns or to their rankings since
January 2011. However, in each case more
families are now more concerned about them
than they were this time last year.
UK families are slightly less concerned
about negative impacts caused by a
loss of/changes to Government benefits
(22% - January 2012 compared to
24% - January 2011). This suggests that
changes made and announced by the
Government in 2011 have now been
factored in to most families’ budgets.
A new category introduced in the last quarter
of 2011 found that 8% of families were
concerned about continued unemployment
(November 2011), and in January 2012 this
has increased to 10%. This indicates that
those people who are currently without jobs
are becoming less confident about their
prospects of re-entering the workplace.
The Aviva Family Finances Report 20
FAM_REP_V4_33760_BRO.indd 20 16/01/2012 10:55
8/3/2019 Aviva UK: The Aviva Family Finances Report 5 - January 2012
http://slidepdf.com/reader/full/aviva-uk-the-aviva-family-finances-report-5-january-2012 21/32

8/3/2019 Aviva UK: The Aviva Family Finances Report 5 - January 2012
http://slidepdf.com/reader/full/aviva-uk-the-aviva-family-finances-report-5-january-2012 22/32
Spotlight – Financial taboos and
the potential impact on the familyIn this report Aviva looks specifically at the implications forfamilies who avoid facing up to their finances or are reluctantto plan for how they would protect their family in a worstcase scenario.
“It’s understandable that discussing awkward ‘taboo’ topics
can make many people feel uncomfortable. As a rule,
people don’t like to talk about the state of their nances
and it’s even less palatable to discuss how their families
would cope without them should they suffer a serious
accident or illness, or even a fatality. But by choosing to
bury their heads in the sand and ignore these subjects,
people potentially risk making a bad situation worse.”
Louise Colley, head of protection sales and marketing, Aviva
The Aviva Family Finances Report 22
FAM_REP_V4_33760_BRO.indd 22 16/01/2012 10:55

8/3/2019 Aviva UK: The Aviva Family Finances Report 5 - January 2012
http://slidepdf.com/reader/full/aviva-uk-the-aviva-family-finances-report-5-january-2012 23/32
Tabootopics
The Family Finances Report found 27% of families say they would be uncomfortable discussing
their debts with relatives, and 24% don’t like to discuss even general finances with them. There
are also major taboos around people’s own mortality – and with this what would happen if
they were no longer able to provide for their family.
Sixteen percent said they would avoid discussions about their funeral arrangements and
14% said they wouldn’t be prepared to talk about a will. Meanwhile one in 10 parents
(9%) are unwilling to discuss who might look after their children if they weren’t around, a
crucial consideration, particularly given the growing number of families who don’t conform
to the traditional ‘nuclear’ model. Significantly, the only topic seen as more taboo for family
discussions was ‘sex’ – a no-go area for 56% of respondents.
As many families feel uncomfortable discussing these topics, it is understandable that there
is a lack of understanding over what would happen and who would provide support to their
family, should the unexpected happen. As such, 9% of families reported that they did not
think they needed life insurance. Similarly nearly a third (30%) said they didn’t need income
protection and more than a quarter (26%) thought they didn’t need critical illness cover.
Monthlyoutgoings
As a result of this mindset, there are currently more families (50% - January 2012) who report
paying for a monthly satellite TV package than those who have life insurance
(40% - January 2012) which provides a cash lump sum in the event of the death of the insured.
This highlights that UK families seem more willing to prioritise spending on immediatepurchases and luxuries, than facing up to the need to protect their families financially.
The Aviva Family Finances Report 23
FAM_REP_V4_33760_BRO.indd 23 16/01/2012 10:55

8/3/2019 Aviva UK: The Aviva Family Finances Report 5 - January 2012
http://slidepdf.com/reader/full/aviva-uk-the-aviva-family-finances-report-5-january-2012 24/32
Protectionpriorities
The report also found that families are likely to attach more importance to vet’s bills and
protecting electrical goods and gadgets than their own health and the financial wellbeing of
their family.
More UK families have taken out insurance policies for their pets (17% – January 2012) and
mobile phones (14% – January 2012), than have taken out insurance to protect themselvesand their family in the event they suffer a critical illness (13% – January 2012). And more
people have taken out an extended warranty on electrical items (13% – January 2012) than
have income protection insurance (10% – January 2012) which would potentially pay them an
income for life should they be unable to work due to accident or sickness.
The Aviva Family Finances Report 24
0%
20%
40%
60%
80%
100%
% of families in possession of certain products/services
% w
h o o w n
Products/Service
I n c o
m e p r o t e c t i o
n i n s
u r a n
c e
E x t e
n d e d
w a r r a n t y o
n c a r
C r i t i
c a l i l l n e
s s i n
s u r a n c e
E x t e
n d e d
w a r r a n t y
o n e l e c t r i
c a l i t
e m s
P e t i
n s u r a n
c e
M o b i l e
p h o
n e i n s u r a n c
e
L i f e i n s u r a n
c e A w i l l
S a t e l l i t
e T V
p a c k a g
e
H o m e c
o m p u t e
r
H o m e i n t
e r n e t a
c c e s s
86% 86%
50%
40%
32%
17%14% 13% 13%
10%5%
FAM_REP_V4_33760_BRO.indd 24 16/01/2012 10:55
8/3/2019 Aviva UK: The Aviva Family Finances Report 5 - January 2012
http://slidepdf.com/reader/full/aviva-uk-the-aviva-family-finances-report-5-january-2012 25/32
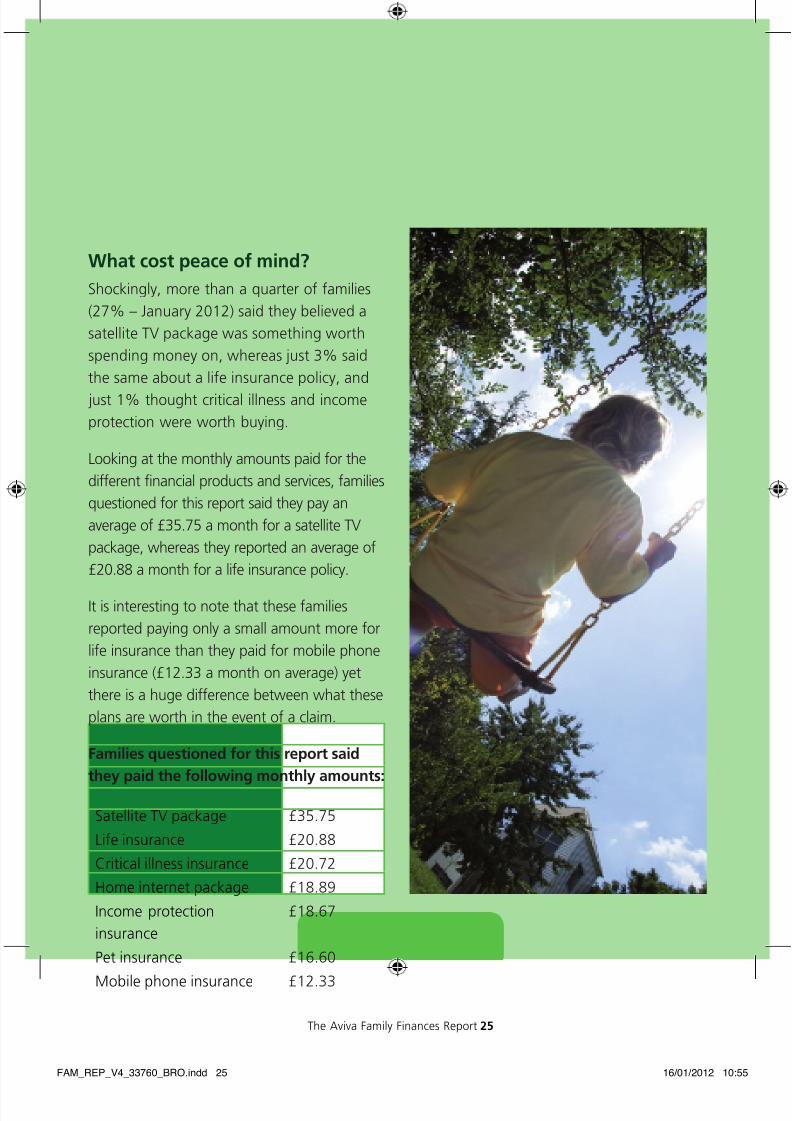
Whatcostpeaceofmind?
Shockingly, more than a quarter of families
(27% – January 2012) said they believed a
satellite TV package was something worth
spending money on, whereas just 3% said
the same about a life insurance policy, and
just 1% thought critical illness and income
protection were worth buying.
Looking at the monthly amounts paid for the
different financial products and services, families
questioned for this report said they pay an
average of £35.75 a month for a satellite TV
package, whereas they reported an average of
£20.88 a month for a life insurance policy.
It is interesting to note that these families
reported paying only a small amount more for
life insurance than they paid for mobile phone
insurance (£12.33 a month on average) yet
there is a huge difference between what these
plans are worth in the event of a claim.
Familiesquestionedforthisreportsaid
theypaidthefollowingmonthlyamounts:
Satellite TV package £35.75
Life insurance £20.88
Critical illness insurance £20.72
Home internet package £18.89
Income protection
insurance
£18.67
Pet insurance £16.60
Mobile phone insurance £12.33
The Aviva Family Finances Report 25
FAM_REP_V4_33760_BRO.indd 25 16/01/2012 10:55

8/3/2019 Aviva UK: The Aviva Family Finances Report 5 - January 2012
http://slidepdf.com/reader/full/aviva-uk-the-aviva-family-finances-report-5-january-2012 26/32
With the rising cost of goods and services causing UK families to look at their outgoings
and re-examine their financial priorities in 2012, the two most important financial steps
UK families believe they will take this year are cutting back on their spending
(39% – January 2012) and paying off their debts (35% – January 2012).
However, despite this, it seems other financial ‘safety checks’ are way down the priorities
list. More families are focusing on booking their annual holiday (21% – January 2012) thanbuying life insurance (3%) or making a will (13%) in 2012.
The Aviva Family Finances Report 26
FAM_REP_V4_33760_BRO.indd 26 16/01/2012 10:55

8/3/2019 Aviva UK: The Aviva Family Finances Report 5 - January 2012
http://slidepdf.com/reader/full/aviva-uk-the-aviva-family-finances-report-5-january-2012 27/32
The Aviva Family Finances Report 27
“While families know life insurance is something they
‘should’ think about, it’s more pleasurable to think about
things like planning holidays – so it’s no surprise to see
people putting it off. However our research also shows
that a third of people feel ‘frustrated’ with things ontheir to do list and a fth feel stressed by them. On the
ip side we know that customers report feeling reassured
when they have taken out life insurance, knowing their
affairs are in order. With this in mind it’s important to
look at ways providers and advisers can help customers
to understand the benets of protection insurance andthe peace of mind it can afford.”
Louise Colley, head of protection sales and marketing, Aviva
“We cannot begin to explain the devastation to a family
when a Mum or Dad dies young. At Grief Encounter we
see the impact on families when a nancial safety nethas not been put in place. Taking a short time to secure
life insurance now means that your family may have a
little comfort in their darkest times.”
Shelley Gilbert, CEO of child bereavement charity Grief Encounter
FAM_REP_V4_33760_BRO.indd 27 16/01/2012 10:55
8/3/2019 Aviva UK: The Aviva Family Finances Report 5 - January 2012
http://slidepdf.com/reader/full/aviva-uk-the-aviva-family-finances-report-5-january-2012 28/32
Region
% of people in the
region who are
living in a committed
relationship and
want children
% of people living
in the region living
in a committed
relationship with
one child
Monthly
incomeDebt
House
prices
1 East 8% 24% £1,923 £12,295 £235,875
2 London 14% 20% £2,845 £16,680 £340,023
3 East Midlands 6% 21% £2,055 £6,392 £195,546
4 West Midlands 7% 23% £2,027 £6,325 £191,927
5 North East 7% 25% £1,232 £3,640 £152,412
6 North West 7% 17% £1,981 £6,323 £174,831
7 Scotland 11% 15% £2,074 £4,459 £182,558
8 South East 9% 22% £2,314 £5,712 £263,242
9 South West 8% 17% £1,949 £9,263 £233,289
10 Wales 7% 19% £1,892 £6,333 £190,691
11 Yorkshire 8% 18% £1,964 £4,806 £169,875
UK 8% 20% £2,066 £7,944 £220,299
The Aviva Family Finances Report 28
The view across the UK
Families in London continue to have the highest average incomes of anywhere in the country.
The typical family in the capital has an average monthly income of £2,845 (compared with
£2,625 – January 2011), followed by those in the South East (£2,314).
The lowest monthly income can be found in the North East, where the typical family takes
home £1,232 each month. Family houses in this region are also valued at significantly less
than the average (£154,412 compared with £220,299). Families in London once again findthemselves at the top end of the scale, with the average house valued at £340,023.
They are also most likely to have built up their savings, with the typical family having stored
£3,124 away, followed by families in the East (£1,544) and South East (£1,199). In contrast,
families in the North East have the smallest savings pots of any region, with just £161 stashed
away. This is perhaps to be expected, with half (50%) of the region saving nothing each
month. Families in Yorkshire (52%) and Wales (52%) are the most likely to save nothing each
month, whereas this falls to just 34% of families in London.
FAM_REP_V4_33760_BRO.indd 28 16/01/2012 10:55

8/3/2019 Aviva UK: The Aviva Family Finances Report 5 - January 2012
http://slidepdf.com/reader/full/aviva-uk-the-aviva-family-finances-report-5-january-2012 29/32
The Aviva Family Finances Report 29
However, while
families in the capital
have higher incomes,
more valuable homes,
and more saved than
elsewhere in the country,
they have also incurred moredebt than anyone else.
The typical family in
this region owes
£16,680, whereas
this figure stands
at just £3,640 in
the North East (UK
average - £7,944).
Families in London are also least likely to be
financially protected. Thirty-six per cent of
families in the capital have life insurance
– yet almost half (48%) have a satellite
television package. In contrast, families in
the East (49%) and Scotland (49%)
are most likely to have taken out
life insurance. Meanwhile, less than
one in ten (9%) families in the West
Midlands has taken out insurance to protect
them in the event of a critical illness.
FAM_REP_V4_33760_BRO.indd 29 16/01/2012 10:55
8/3/2019 Aviva UK: The Aviva Family Finances Report 5 - January 2012
http://slidepdf.com/reader/full/aviva-uk-the-aviva-family-finances-report-5-january-2012 30/32
“
The Aviva Family Finances Report 30
So what does this tell us?
In this edition of the Family Finances Report, Aviva discovered just how
many families in the UK are unwilling to broach certain topics that deal
with their nancial and general health.
It can be uncomfortable for families to discuss how they would cope
nancially with a distressing event that leaves someone unable towork or worse, but not talking about it could be much more serious.
Unfortunately, statistics show one in four women and one in ve men
will suffer a serious illness before retirement age. This could leave them
permanently disabled and unable to work or worse, and if families have
not planned for this scenario then they are likely to end up suffering
nancially on top of the emotional distress.
I believe families need to take time out to consciously consider thepotential risks they are exposing their families to. As soon as I became a
mum the ‘what ifs’ were always at the back of my mind, and knowing I
have a responsibility to my children made me respond and take action.
For any families who aren’t protected, the ‘what if?’ conversation should
be top of their to do lists. By having the discussion, families can have
an appreciation of the nancial consequences they face and as a result
actually take the steps to make a difference.
The average costs of protecting a family are usually less than people think
– and often less than monthly charges that families pay out for other
goods and services. Plus, the younger a person is when they take out life
insurance, the less they tend to pay on a monthly basis.
FAM_REP_V4_33760_BRO.indd 30 16/01/2012 10:55

8/3/2019 Aviva UK: The Aviva Family Finances Report 5 - January 2012
http://slidepdf.com/reader/full/aviva-uk-the-aviva-family-finances-report-5-january-2012 31/32
“
The Aviva Family Finances Report 31
Buying a house and having children are just two major life events that
should act as a stimulus to encourage families to talk about how they
would protect themselves should the unexpected happen.
We know that around a quarter of families feel awkward talking about
money matters but this shouldn’t stop them having the discussions.And on a positive note, this also means that the remaining three
quarters feel comfortable raising the subject – so there’s no excuse not
to have the conversations!
Families owe it to themselves to discuss all eventualities, good and bad.
While we all hope for the best, we need to plan for the worst.
Louise Colley, head of protection sales and marketing, Aviva
LouiseColley,headofprotectionsalesandmarketingforAviva
andmumtoAmeliaandAlexander
FAM_REP_V4_33760_BRO.indd 31 16/01/2012 10:55
8/3/2019 Aviva UK: The Aviva Family Finances Report 5 - January 2012
http://slidepdf.com/reader/full/aviva-uk-the-aviva-family-finances-report-5-january-2012 32/32
SupportingBritish athletes
Methodology
The Aviva Family Finances Report was designed and produced by Wriglesworth Research.
As part of this 10,098* UK consumers – aged between 18 and 55 – who live as part of one
of six family groups were interviewed by Opinion Matters between December 2010 and
December 2011. This data was combined with additional information from the sources listed
below and used to form the basis of the Aviva Family Finances Report.
Additional data sources include:
l Unemployment Figures – Office of National Statistics – December 2011
l Nationwide – December House Price Figures
Technicalnotes
l A median is described as the numeric value separating the upper half of a sample, a
population, or a probability distribution, from the lower half. Thus for this report, the
median is the person who is the utter middle of a sample.
l An average or mean is a single value that is meant to typify a list of values. This is derived
by adding all the values on a list together and then dividing by the number of items on
said list. This can be skewed by particularly high or low values.
For further information on the report or for a comment, please contact Sarah Poulter at the
Aviva Press Office on 01904 452828 or [email protected]
* = Minimum of 2,000 per quarter