aviation industry - sector review - myirisbreport.myiris.com/geplcap1/jetairpr_20120319.pdf · the...
TRANSCRIPT

Equity | India | Aviation
Aviation Industry
Yields fail to rise despite traffic growth and ATF spike
March 19, 2012
Analyst Sunil Sewhani
+91-22- 6618 2690 [email protected] GEPL Capital Research 1
Sector Review
Domestic Aviation Industry
12.719.4
99.3
45.3
0
20
40
60
80
100
120
FY00
FY05
FY10
FY15
E
mn
visi
ts
0
5
10
15
20
%
Domestic traffic CAGR growth
International Aviation Industry
23.7
5.33.7
11.6
0
5
10
15
20
25
FY00
FY05
FY10
FY15
E
mn
visi
ts
0
5
10
15
20
%
International traffic CAGR growth
ATF Prices
40.7
48.8
54.9
60.6
66.1
62.7
44.6
58.656.2
64.665.0
40.0
45.0
50.0
55.0
60.0
65.0
70.0
Oct
-10
Feb-
11
Jun-
11
Oct
-11
Feb-
12
Rs/
litr
e
FY11 Market share
Jet Airways
(incl JetLite),
26.2
Kingfisher
(incl Air
Deccan)
16.5
NACIL, 19.9
SpiceJet, 13.5
Indigo, 17.5
GoAir, 6.3
Passenger traffic to double in the next four years
The passenger traffic in India has grown by 18% in FY11 and 15% in FY10. We expect India’s passenger traffic to nearly double in the next five years from 67 mn passengers in FY11 to 123 mn passengers (domestic - 99 mn and international – 23.7 mn) in FY15E, led by:
a) Higher GDP growth expectations and plenty of room for growth: Total passenger traffic in India has shown a GDP multiplier effect of 2.2x, over the last ten years. Despite this, there is still plenty of room for growth with number of trips per person in India (0.3) being much lower than other nations (0.15 in China 0.25 and 2.0 in USA).
b) Growth beyond metros led by better infrastructure facilities and connectivity: Passenger traffic in non-metros has seen 21% CAGR in the last five years with Tier –I cities witnessing a CAGR of 18%; Mumbai-Delhi witnessing a CAGR of 15% in the same period. This has been possible due to better infrastructure facilities and better connectivity.
c) Rising air travel affordability with the emergence of LCCs: The emergence of Low Cost Carriers (LCC) has led to affordable ticket pricing. With a growth in disposable income and stagnant ticket prices, a decline in average ticket price as a percentage of per-capita income has led to an increase in the air travel affordability. Consequently, we expect the share of LCC’s in the domestic traffic to rise to 56% by FY13E from 45% in FY11.
Demand-supply mismatch a blessing in disguise
The aviation industry has witnessed a relatively slow capacity addition due to stretched balance sheets and tight supply of aircrafts. Only LCCs have placed fresh orders for aircrafts and we do not expect fleet addition of over 15 aircraft per year for the next three years. Consequently, the passenger load factors are expected to remain above 70%.
Higher ATF prices a major cause of worry ATF prices have risen 62% since Oct’10 and 32% in CY11. Increased crude price is one of the biggest risks for profitability with a 1% rise in crude prices impacting EBITDAR by 3-5%. However, a 1% rise in load factor can negate the impact of a US$3-4/bbl rise in crude prices.
Yields under pressure with high competition despite demand supply mismatch Despite a sharp rise in ATF prices, the yields (Revenue/RPKM) have not been able to improve. While SpiceJet has seen a 6.7% rise in yields in Q2FY12, Jet’s domestic segment saw mere 1% rise in yields and Kingfisher’s yields declined by 10% in the same period. This has been due to an environment of intense competition leading to irrational pricing consequently resulting in deeper losses for most airline operators.
Lowering debt, improving cash flows a key for survival The rise in ATF prices and a decline in yields have resulted in a cash drain for most operators. To add to this the higher leverage by most operators results in a huge interest outflow even if a company is able to break even on the BITDAR front. Hence, the sector has not been in the best of health and needs to improve its debt position if it wishes to survive, compete and capture the growing pie of the Indian passenger traffic.
Valuation and views
We initiate coverage on the in the Indian aviation sector with a BUY rating on Jet Airways with a target price of `397 per share, BUY rating on SpiceJet with a target price of `28.3 per share, and a SELL rating on Kingfisher Airlines with a target price of `16 per share.

Equity | India | Aviation
Aviation Industry March 19, 2012
GEPL Capital Research | Sector Review 2
Passenger traffic to double in the next five years
Our analysis indicates that the performance of aviation stocks’ is correlated to traffic growth and earnings momentum. The domestic passenger traffic has witnessed a 14.7% CAGR in FY01-11 to 54 mn and the international traffic has grown at a 13.4% CAGR to 13.4 mn passengers in the same period. The growth rate is higher in the last five years led by government initiatives, better infrastructure and the emergence of LCC’s all of which have helped domestic passenger traffic grow at 16.5% CAGR in FY06-11 while international passenger traffic has seen a 15.5% CAGR in the same period.
The passenger traffic (PAX) in India has grown by 18% in FY11 and 15% in FY10. We expect India’s passenger traffic to nearly double in the next five years from 67 mn passengers in FY11 to 123 mn passengers (domestic - 99 mn and international - 19.3 mn) in FY15E assuming a 16.5% CAGR in domestic traffic and 15.5% CAGR in international traffic.
Domestic passenger traffic
12.7 13.7 14.0 15.7 19.425.2
35.844.4
39.5
62.973.2
85.3
99.3
12.9
45.3
54.0
0.0
20.0
40.0
60.0
80.0
100.0
120.0
FY00
FY01
FY02
FY03
FY04
FY05
FY06
FY07
FY08
FY09
FY10
FY11
FY12
E
FY13
E
FY14
E
FY15
E
mn
visi
ts
(20)
(10)
0
10
20
30
40
50
%
Domestic traffic Y-o-Y growth
Source: DGCA, GEPL Capital Research
International passenger traffic
4.2 4.5 5.36.5
7.69.1
17.8
20.6
23.7
15.4
10.0
3.83.7
13.4
11.6
3.7
0.0
5.0
10.0
15.0
20.0
25.0
FY00
FY01
FY02
FY03
FY04
FY05
FY06
FY07
FY08
FY09
FY10
FY11
FY12
E
FY13
E
FY14
E
FY15
E
mn
visi
ts
(5)
0
5
10
15
20
25
%
International traffic Y-o-Y growth
Source: DGCA, GEPL Capital Research

Equity | India | Aviation
Aviation Industry March 19, 2012
GEPL Capital Research | Sector Review 3
The growth in the passenger traffic industry is expected to be driven by three main factors
1. Strong GDP growth with 2.2 x multiplier effect Total passenger traffic in India has shown a GDP multiplier effect of 2.2x, (domestic 2.3x and international 1.9x) over the last eight years (FY04-FY11). Passenger traffic has grown at an average of 18.4% in the same period (from 20.2 mn to 67.3 mn) compared to real average GDP growth of 8.5% in the same period. The growth in passenger traffic has been driven by a 16.5% CAGR in FY06-FY11 in domestic passenger traffic to 54 mn and a 15.5% CAGR in international passenger traffic at 13.4 mn.
Pax growth 2.2x of Real GDP growth
8.58.06.99.29.79.5
7.58.5
11.0
22.3
28.3
36.8
23.418.3
15.0
(7.4)(10.0)
(5.0)
0.0
5.0
10.0
15.0
20.0
25.0
30.0
35.0
40.0
FY04 FY05 FY06 FY07 FY08 FY09 FY10 FY11
%
Real GDP growth PAX growth Source: CMIE, DGCA, GEPL Capital Research
With an estimated 8% growth in GDP over the next 5 years and therefore we expect passenger traffic to double in the next four years and reach 123 mn trips by FY15E with domestic passengers accounting for over 80% of the total travels (99 mn) and the remaining being contributed by international passenger (23 mn).
Small base in global scenario offers plenty of room for growth
India is currently the world’s ninth largest civil aviation market in terms of passenger traffic and fourth largest market in terms of domestic passenger traffic. However, there is still plenty of room for growth as the number of trips per person is negligible at 0.05 compared to 0.15 in China 0.25 in Brazil and 2 per person in USA and other developed nations. With an increase in disposable income and strong GDP growth, we expect Indians to fly more and lead to a growth in traffic. . Moreover, the fact that India offers a mere 1/10th number of seats as compared to USA, the case for capacity addition and absorption remains highly lucrative.
Average trips per person across Nations
2.4
2.1
0.5
0.30.2
0.1
0.0
0.5
1.0
1.5
2.0
2.5
Australia USA Malaysia Brazil China India
Tri
ps p
er P
erso
n
Source: DGCA, GEPL Capital Research

Equity | India | Aviation
Aviation Industry March 19, 2012
GEPL Capital Research | Sector Review 4
2. Infrastructure- Improvement visible but long way to go
The government’s infrastructure facilities in support of aviation are clearly visible with the opening of the new terminal in New Delhi. Moreover, the other measures include the Green field airports in Hyderabad, Bengaluru and New Delhi and the on-going upgradation of terminals in Mumbai. The improved infrastructure facilities and modernization of technology have enabled faster turnaround of aircrafts and improved the flying experience for passengers.
The no of airports have increased 6% in FY06-10 to 116 (domestic 1% and international 21%) while the flights per day have risen by 90% (domestic 101% and international 51%). The operational efficiency has enabled PAX handled per day witness a 115% growth in the same period (domestic 142% and international 54%) highlighting the improvement in turnaround of aircrafts, higher take-offs and better load factors
Flights per day Passenger per day
1,8142,391
2,931 2,9183,638
509
586
674 840
768
0
1,000
2,000
3,000
4,000
5,000
CY06 CY07 CY08 CY09 CY10
Flig
hts
per
day
Domestic International
140194
238 212
33861
7081 94
94
0
100
200
300
400
500
CY06 CY07 CY08 CY09 CY10
Pass
enge
r pe
r da
y
Domestic International Source: DGCA, GEPL Capital Source: DGCA, GEPL Capital
Strong growth in Tier- II and tier – III cities
The improved connectivity has enabled strong growth in passenger traffic from tier-II and tier- III cities, with daily passenger traffic (DPT) in these airports growing at 21% CAGR, against 18% CAGR in tier-I cities and 15% CAGR in the top two cities, Delhi and Mumbai, in FY06-11. Consequently, the contribution of tier-II and tier-III airports to DPT has increased from 26% in FY06 to 31% in FY11.
With a rise in disposable income, faster and economical mode due to emergence of LCC’s and better connectivity to non-metros, the tier-II and III routes have changed course, to become profitable routes as compared to a government obligation a few years back.
City-wise growth in passenger traffic City-wise traffic contribution
(14)
(12)
27
20
30
16
2334 45
10
(7)
21
28
45
22
(20)
(10)
0
10
20
30
40
50
CY06 CY07 CY08 CY09 CY10
%
Top 2 Top 3-6 Tier II & III
43.4 40.6 39.6 39.3 39.5
30.6 32.1 31.9 31.0 29.5
26.0 27.3 28.4 29.7 31.0
0.0
20.0
40.0
60.0
80.0
100.0
CY06 CY07 CY08 CY09 CY10
%
Top 2 Top 3-6 Tier II & III
Source: DGCA, GEPL Capital Source: DGCA, GEPL Capital

Equity | India | Aviation
Aviation Industry March 19, 2012
GEPL Capital Research | Sector Review 5
3. Emergence of LCC’s – additional wings for the aviation sector
FY04 saw the emergence of the first Indian low-cost carrier (LCC), Air Deccan, followed by three more LCC’s: SpiceJet, Indigo and Go Air till FY07. With affordable pricing the LCC’s have been able to capture a bigger pie of the Indian domestic aviation market. LCC’s accounted for nearly 45% of the total domestic traffic in FY11 as compared to a mere 16% in FY06.
The share is much higher, at 60%, if we consider Kingfisher airlines (flies 75% of its passengers through Kingfisher Red). The rise in LCC’s has led to better operational efficiencies due to competition and led to a rise in affordability, hence we expect this share to rise to 56% by FY15E.
Share of LCC in domestic passenger traffic
22
29
34
40
45
0 10 20 30 40 50
FY07
FY08
FY09
FY10
FY11
%
Source: DGCA, GEPL Capital Research
Rising affordability
Air fares have remained more or less stagnant over the last 5 years (Jet airways: Mumbai-Delhi airfare). This has been mainly due to the entry of LCC’s and their quest to capture a higher market share. In the same period, per capita income has increased by 85% to `66487 from `35844 in FY06-11. This has made air travel more affordable, with the average ticket price as a percentage of per capita income declining to 7 2% in FY11 from 13.5% in FY06.
Average ticket price as percentage of per capita income
17.8
16.9
13.5
11.9
10.9
11.8
7.7
7.2
0.0 5.0 10.0 15.0 20.0
FY04
FY05
FY06
FY07
FY08
FY09
FY10
FY11
%
Source: CMIE, DGCA, GEPL Capital Research

Equity | India | Aviation
Aviation Industry March 19, 2012
GEPL Capital Research | Sector Review 6
Demand supply mismatch a blessing in disguise
The mismatch in the Available seat kms (ASKM) or capacity and passenger traffic growth has been a blessing in disguise for the Indian aviation industry. While the ASKM saw a 10.6% CAGR (Domestic: 11.8% and International: 9.6%) in FY06-FY11, the Revenue passenger km (RPKM) witnessed an 11.7% CAGR (Domestic: 13.2% and International: 10.3%) in the same period. This helped the PLF rise from 68.3% in FY06 to 71.5% (Domestic: 71.9% and International: 71.1%) in FY11.
RPKM growth to outpace ASKM growth It is due to the stretched balance-sheets and tight supply (delivery slots from Boeing for new orders available only from FY13E) that we expect the capacity addition to increase at a relatively slow pace of 10.4% CAGR in ASKM as against 10.9% CAGR in RPKM.
Domestic ASKM, RPKM and PLF
71.5
68.968.0
66.3
70.7 71.1
72.9 72.4 72.3 72.8
65.5
0
10
20
30
40
50
60
70
80
90
100FY
05
FY06
FY07
FY08
FY09
FY10
FY11
FY12
E
FY13
E
FY14
E
FY15
E
bn
60.0
62.0
64.0
66.0
68.0
70.0
72.0
74.0
%
ASKM RPKM PLF
Source: DGCA, GEPL Capital Research
While the domestic passenger traffic is expected to witness a 16.5% CAGR in FY11-FY15E, the ASKM is expected to witness a mere 10.4% CAGR in the same period. The total ASKM is expected to rise from 125 bn in FY11 to 186 bn (Domestic: 94 bn and International: 92 bn) in FY15E. While the total RPKM is expected to rise from 89 bn in FY11 to 136 bn (Domestic: 69 bn and International: 67 bn) in FY15E. Consequently, we expect the Passenger Load Factor (PLF) to improve to 72.8% in FY15E from 71.5% in FY11.
International ASKM, RPKM and PLF
64.9
67.768.9 68.8
71.9 71.9
73.8 74.3 73.8
63.6
72.9
0
10
20
30
40
50
60
70
80
90
100
FY05
FY06
FY07
FY08
FY09
FY10
FY11
FY12
E
FY13
E
FY14
E
FY15
E
bn
58.0
60.0
62.0
64.0
66.0
68.0
70.0
72.0
74.0
76.0
%
ASKM RPKM PLF Source: DGCA, GEPL Capital Research

Equity | India | Aviation
Aviation Industry March 19, 2012
GEPL Capital Research | Sector Review 7
High debt to restrict new fleet addition
The Indian aviation industry is much more mature now than it was during FY05-08 and we believe that risk of sharp increase in capacity is lower in this cycle given the stretched balance sheets of the big carriers (mainly Indian Airlines, Jet Airways and Kingfisher Airlines).
Since companies such as Air India and Kingfisher have been making huge losses over the last couple of years, and are highly leveraged, not many aircraft leasing companies are interested in leasing out planes to them, since there is a risk of default on regular lease payments (which is the case for Paramount Airlines).
While Kingfisher and Air India will find it difficult to add further aircraft to its existing fleet due to a stretched balance sheet, Jet Airways is looking to add 17 Boeing 737s over the next one and a half year. This however should restrict JetLite to add aircraft especially given the intent of the management to merge the LCC business of JetLite and Jet Konnect.
SpiceJet also plans to add 30 Bombardiers to its fleet over the course of the next two years, however, the capacity addition would remain low seat configuration (78 seats) of the aircraft and Indigo though has placed an order for 180 Airbus, they would be deliverable over the course of the next 10 years. Hence, we expect and average addition of 10-12 aircraft per year in the entire industry.
To add to this a decision to stop operating flights from Mumbai and Delhi airports from strong players like American Airlines and Air Asia should keep the ASKM growth for the international segment under check. This should allow Indian carriers to benefit and help maintain the PLF above 70% over the next three years.
Less chances of organic ASKM growth due to high block hours and load factors Moreover, the possibility of capacity addition by increasing the use of aircraft also seems to be low as most airlines are already operating aircraft with block-hours of 10-12 hours per day. Consequently, we expect the load factors across the industry to remain above 70%.
Block hours per aircraft
10.611.2
11.8
8.99.5
10.2
12.1 11.9
11.1
6
7
8
9
10
11
12
13
FY10 FY11 H1FY12
Hou
rs
Jet Airways Kingfisher Airlines SpiceJet
Source: Various companies, GEPL Capital Research

Equity | India | Aviation
Aviation Industry March 19, 2012
GEPL Capital Research | Sector Review 8
Higher ATF prices a major cause of concern
Crude prices have been on the rise since Oct’10 due to various factors like the Middle-East crisis, uncertainty of the economy, and lower stock piles. This has resulted in Brent crude prices remaining above US$110/bbl for most part of CY11 forcing Oil Marketing Companies (OMC’s) to raise ATF prices. ATF prices hence rose 62% since Oct’10 and 32% in CY11 itself to `66/litre currently.
Moreover, to add to the existing woes, Western trade sanctions against Iran have begun to strangle its oil exports. This is on account of Iran being locked in a diplomatic row with major Western powers over its nuclear programme, which as per USA is aimed at building an atomic bomb. Meanwhile, traders noted positive economic data from the United States signaling a rising demand to the World's largest oil consumers. With oil inventories and spare OPEC production capacity running low, consumers don't have much buffer against additional disruptions in supply. This has led to Brent crude rising to a two year high of US$127/bbl resulting in a 13% rise in ATF prices in CY12 so far.
ATF Prices
40.7
48.8
54.9
60.6
66.1
62.7
44.6
58.6
56.2
64.665.0
40.0
45.0
50.0
55.0
60.0
65.0
70.0
Oct
-10
Nov
-10
Dec
-10
Jan-
11
Feb-
11
Mar
-11
Apr
-11
May
-11
Jun-
11
Jul-
11
Aug
-11
Sep-
11
Oct
-11
Nov
-11
Dec
-11
Jan-
12
Feb-
12
Mar
-12
Rs/
litr
e
Source: HPCL,BPCL, GEPL Capital Research
Despite the sharp rise in ATF prices, airline operators have been unable to pass on the rise to the end customers. Given the fact that a) fuel costs account for ~35-40% of the total sales of the company (35% for FSCs like Jet Airways, Kingfisher and over 40% for SpiceJet and JetLite) and b) airlines operate on low margins; a stark rise in ATF prices has severely impacted the profitability of companies. Consequently, Jet Airways (standalone) and SpiceJet have reported net losses for the third consecutive quarter while the losses for Kingfisher have widened.
Increased crude price is one of the biggest risks to profitability with a 10% rise in crude prices impacting EBITDAR by 15%. However, a 1% rise in load factor can negate the impact of a 2.5% rise in crude prices.

Equity | India | Aviation
Aviation Industry March 19, 2012
GEPL Capital Research | Sector Review 9
Do not see any near term positives from ATF imports The failure to hike prices and improve yields coupled with the rise in ATF cost has resulted in the Q3FY12 net losses for the three listed players mounting to `6.06 bn as compared to `153 mn in Q3FY11. Considering the high debt, low margins and rise in crude prices; airlines have seen constant erosion to their net worth over the last four quarters. Hence, Jet Airways and SpiceJet both have reported a net loss for the fourth consecutive quarter which has led to a sharp wipeout in its consolidated net worth. Kingfisher on the other hand has failed to record a profitable quarter yet again making survival even more difficult for itself.
The airline operators have therefore asked the government to allow import of ATF as currently taxes on ATF range from 4-35% (all inclusive) which severely dents their margins; considering fuel costs account for 40-45% of the total cost of airlines. Acceding to the demands of cash-strapped domestic aviation firms, a government panel on 8th Feb’12 allowed individual airlines to import ATF. Though the Cabinet will take a final call on the issue later, we believe the move will not be of much help to the airline operators.
No real savings from ATF imports
Airline operators believe that while OMCs will still levy marketing, handling and distribution charges for handling the fuel directly imported India, but the base price of oil (on which these additional charges will be levied) will be lower than what these companies set otherwise.
Though direct imports theoretically should result in savings of 20%- 25% on fuel cost, there is no clarity yet on the contours of ATF import making the savings calculation nearly impossible. However, in the real world, airlines would save only on sales tax which varies from 15-28% across the country, which would be offset by various facets such as
1. Airlines will have to import ATF in huge a quantity which is not viable If airlines do end up importing ATF, they would need to do so in large quantities with a parcel size of minimum 10,000-15,000 tonnes which is equivalent to 3-6 months of supplies. Doing so, would result in a large inventory for a long time, as compared to fuel derived from OMCs on just in time basis.
2. Lower credit period Airlines will avail only a 30 day credit facility due to the import of ATFs. Currently, airlines enjoy a 60-90 day credit from OMCs. Given the current cash crunch scenario across the industry this would lead to a stress on working capital of these companies hence making the move less lucrative.
3. Terminalling expenses Even if airlines are able to import from ports like Mumbai and Kandla in the west coast, and Kochi, Chennai and Haldia in the east coast, they would need to make arrangement for terminalling and pay for terminalling charge.
4. Storage and transportation cost
Even if somebody offers them terminalling facility, tanker and storage facility, they will have to transport it either through pipeline or transport system. This would once again make them dependable on OMCs for the infrastructure support.
Hence it would be more viable for airline operators if the various states adopted the Andhra Pradesh model of charging 4% tax of fuel. This suggestion was however not responded to favorably by most states. To add to this, even in the best case scenario, only a portion of the total ATF consumption would be imported and hence dependence on OMCs would remain.

Equity | India | Aviation
Aviation Industry March 19, 2012
GEPL Capital Research | Sector Review 10
Yields under pressure despite demand-supply mismatch and sharp rise in ATF prices
Despite a strong growth in the total passenger traffic in India, the yields (Revenue/RPKM) have failed to see a rise. Jet Airways has witnessed a 2% CAGR de-growth in yields in FY07-FY11 in its domestic business. Similarly SpiceJet has seen its yields stagnate over the last three years despite a 9% CAGR growth in FY07-FY11 due to a low base at the start of its operations. Kingfisher too has not been an exception to the rule and witnessed a 2% CAGR de-growth in its overall yields from FY09-FY11. This has been due to an environment of intense competition leading to irrational pricing consequently resulting in deeper losses for most airline operators.
Yields continue to remain under pressure
3.9 3.63.8
3.6
4.14.0
3.33.4 3.3
4.2
4.6
4.9
4.5
5.1
4.7
3.53.2 3.7
3.5
4.1
3.0
3.5
4.0
4.5
5.0
5.5
Q3FY11 Q4FY11 Q1FY12 Q2FY12 Q3FY12
Rs
Jet Airways JetLite Kingfisher SpiceJet Source: Various companies, GEPL Capital Research
The yields on a quarterly basis also have failed to show an improvement. Yields for the listed universe in Q2FY11 stood at a stagnant `4.2 as compared to `4.18 in Q2FY11 and declined by 6% Q-o-Q due to the seasonality impact on prices. While yields for Jet Airways grew by 2% Y-o-Y to `4.4, it fell 10% Y-o-Y for JetLite to `3.3 in Q2FY12. Similarly the yields for SpiceJet grew by 7% Y-o-Y and declined by 2% Y-o-Y for Kingfisher to `3.5 and `4.6 respectively in Q2FY12.
The stagnant yield is a major cause of concern for the industry given
A. The sharp rise in ATF prices over the last one year
B. Demand supply mismatch due to a stretched balance sheet

Equity | India | Aviation
Aviation Industry March 19, 2012
GEPL Capital Research | Sector Review 11
Lowering debt, improving cash flow: a key for survival
The aviation industry has witnessed turbulent times over the last one year with a sharp rise in fuel prices. This has led to losses for players across the board mounting over the last six quarters. Consequently, the companies have been burdened by higher debt and interest liabilities and seen their profits nose-dive.
We expect debt of the three listed players to witness a 2.3% CAGR in FY11-14E to `223.2 bn from `208.2 bn due to a 12.3% CAGR rise in debt for Kingfisher to `100.1 bn. Jet Airways’ net debt is expected to decline by 5.1% CAGR in FY11-FY14E to `116.8 bn led by a debt repayment of `16 bn of its aircraft related long-term debt. The purchase of Bombardier aircraft by SpiceJet should result in its debt rising to `6.4 bn in FY14E as compared to ~`4.4 bn in FY12E.
Due to the rise in debt we expect the interest outflow to witness a 2.8% CAGR in FY11-FY14E for the listed players to `26.2 bn despite a 14.7% CAGR in cash flow from operations which should partially aid debt repayment for SpiceJet and Jet Airways. Consequently, with the improvement in EBIT of all three companies we expect the interest coverage ratio to improve from 0.37 in FY11 to 0.54 in FY14E.
Debt of airline industry Cash of airline industry
142.8136.8 132.8
126.8116.8
79.270.6
80.689.6
100.1
4.4 0.9 4.4 7.9 6.4
0.0
20.0
40.0
60.0
80.0
100.0
120.0
140.0
160.0
FY10 FY11 FY12E FY13E FY14E
Rs
bn
Jet Airways Kingfisher Airlines SpiceJet
13.6 14.3
18.7
7.5
18.4
(10.4)
8.9
6.38.7 9.7
3.1
(2.3)(3.0)
0.03.2
(15.0)
(10.0)
(5.0)
0.0
5.0
10.0
15.0
20.0
25.0
FY10 FY11 FY12E FY13E FY14E
Rs
bn
Jet Airways Kingfisher Airlines SpiceJet
Source: Various companies, GEPL Capital Research Source: Various companies, GEPL Capital Research
Net interest outflow Interest coverage ratio
10.510.9
10.0 9.5 8.8
11.0
13.113.7
15.217.0
0.10.1
0.4 0.5 0.4
0.0
2.0
4.0
6.0
8.0
10.0
12.0
14.0
16.0
18.0
FY10 FY11 FY12E FY13E FY14E
Rs
bn
Jet Airways Kingfisher Airlines SpiceJet
0.4 0.8 0.4 1.1
(0.8)
0.2
6.5
12.0
(10.4)
(2.1)
4.6
(0.7)
(0.0)
(0.1)(0.5)
(15.0)
(10.0)
(5.0)
0.0
5.0
10.0
15.0
FY10 FY11 FY12E FY13E FY14E
Rs
bn
Jet Airways Kingfisher Airlines SpiceJet Source: Various companies, GEPL Capital Research Source: Various companies, GEPL Capital Research

Equity | India | Aviation
Aviation Industry March 19, 2012
GEPL Capital Research | Sector Review 12
Global Valuations
The Indian aviation industry is trading at 7.5x its one-year forward EV/EBITDAR which is a significant premium to players across the globe. However the figures remain skewed due to the presence of Kingfisher Airlines which despite its recent losses continues to command a strong premium. Jet Airways and SpiceJet together trade at an average of 5.5x its one-year forward EV/EBITDAR. We believe this premium is justified considering the strong growth in the passenger traffic in India over the next few years and the scope for growth.
Yields continue to remain under pressure
Name Country Price Mkt Cap (`mn) Revenue Growth EV/EBITDAR
Global Average 2.11
Jet Airways Ltd India 319.1 27,545 20.7 5.97
Kingfisher Airlines Ltd India 20.9 12,073 23.0 26.93
SpiceJet Ltd India 23.4 10,330 32.0 3.14
India Average 7.51
Allegiant Travel Co USA 50.7 48,521 17.4 4.63
Skywest Inc USA 11.1 28,379 32.2 2.37
Hawain Holdings Inc USA 5.1 12,976 26.0 1.25
Republican Airways Holding USA 4.7 11,417 7.9 3.40
AMR Corp USA 0.5 8,256 8.2 2.34
Air Canada Canada 0.9 12,957 7.7 2.10
Chorus Aviation Inc Canada 3.6 22,574 12.0 2.47
USA and Canada Average 2.44
Air New Zealand New Zealand 0.9 39,890 6.4 2.18
Rehional Express Holdings Australia 1.1 7,343 2.0 2.45
Australia and New Zealand Average 2.20
AER Lingus Ireland 0.9 32,336 6.0 2.06
Norwegian Air Shuttle Norway 98.3 29,730 25.3 3.54
SAS Ab Sweden 9.2 22,389 1.7 2.77
Finnair Finland 2.4 19,898 11.6 3.52
Dart Group UK 71.0 8,041 24.9 0.09
Flybe Group UK 63.0 3,763 4.4 0.45
Europe Average 2.52
Cebu Air Inc Phillipines 67.2 47,545 16.7 5.10
Skymark Airlines Japan 649.0 35,584 40.0 1.08
Tiger Airways Holdings Ltd Singapore 0.8 25,670 28.0 8.76
Asia Average 3.55 Source: Bloomberg, GEPL Capital Research

Equity | India | Aviation
Aviation Industry March 19, 2012
GEPL Capital Research | Sector Review 13
FDI in aviation: a step in the right direction
The Group of Ministers in a meeting reviewed the civil aviation ministry’s proposal to allow foreign airlines to pick up 49% in local airlines. The decision would require the Union Cabinet’s concurrence and will be moved to the Cabinet soon as per the Aviation Minister, Mr Ajit Singh.
We believe this is a step in the right direction and approval for the same could be a potential positive catalyst for the stock as this decision will allow a foreign partner to provide Indian airline operators the much needed lifeline of equity infusion.
We believe that the India aviation industry remains highly attractive with air travel penetration being one of the lowest among developing nations and almost 70% less than China’s. Further, we believe the strong macro economic factors like a) burgeoning middle-class, b) strong corporate travel, c) high youth working population, d) better connectivity and e) better affordability all offer ample growth opportunities.
Kingfisher Airline’s large net debt makes it less attractive as compared to the other listed players. The series of issues currently surrounding the company which include non-payment of taxes, salaries to employees and leasing disputes make its case further weak. While Jet Airways has a strong presence in the domestic (both FSC and LCC) and international travel, Mr Naresh Goyal’s (promoter of Jet Airways) 80% stake in Jet is considered as a foreign holding. This is also a key reason why the Foreign Investment Promotion Board (FIPB) had denied approval to Jet for an additional qualified institutional placement (QIP) unless foreign holding was brought down to 49%.
Hence we believe, SpiceJet which is largely a domestic player with the second highest market share in the LCC space would be the biggest beneficiary of an FDI approval. Given the low debt on books and capacity expansion of SpiceJet it seems more likely for investors to be interested in SpiceJet than any other listed airline operator
India: FDI policy on air transport and allied services
FDI ceiling on air transport services
• Scheduled air transport services: This includes scheduled operations by passenger airlines. FDI up to 49% and investment by non-resident Indians (NRIs) up to 100% is allowed through the automatic route.
• Foreign airlines cannot invest directly or indirectly in scheduled air transport services in India.
• Non-scheduled air transport services: It includes operations by non-scheduled airlines, chartered carriers and cargo airlines. FDI up to 74% and investment by NRI up to 100% is allowed through the automatic route.
• Foreign airlines cannot invest directly or indirectly in non-scheduled and chartered airlines, but they can invest up to 74% in cargo airlines in India.
• Helicopter services: FDI, including that from foreign companies, is allowed up to 100% through the automatic route.
FDI ceiling in other services under civil aviation sector
• Ground handling services: FDI up to 74% and investment by NRIs up to 100% is allowed through the automatic route, subject to sectoral regulations and security clearance.
• Maintenance, repair organisations, flying training institutes, technical training institutes. FDI up to 100% is allowed through the automatic route.
Equity | India | Aviation
Aviation Industry March 19, 2012
GEPL Capital Research | Sector Review 14
Evolution of domestic aviation industry
Duopoly (FY03-05): The industry was dominated by two major players, NACIL and Jet Airways with more than 90% market share. It also saw the entry of the first Indian low-cost carrier (LCC), Air Deccan, launched in FY04.
Entry of new players (FY05-07): Three more LCCs (SpiceJet, Indigo and Go Air) and two more FSCs (Kingfisher Airlines and Paramount Airways), entered the industry. Consequently, the number of players increased from three in FY03 to nine in FY07.
Intense competition (FY07-08): This period was marked by the beginning of intense competition in a bid to capture market share, with rapid fleet expansions by both new and incumbent players. This resulted in a sharp drop in profitability and the deterioration of balance-sheets. By the end of FY08 the top-three players’ market share dropped to 69% and the share of LCC’s increased to 31%.
Consolidation phase (FY08-11): The subsequent significant erosion in net worth resulted in merger/acquisition of the financially weak companies with the stronger ones and the halting of fleet additions. Jet Airways acquired Air Sahara (now Jet-Lite), Kingfisher acquired Air Deccan, and Indian Airlines merged with Air India to form NACIL. However, the market share of LCC’s increased to 45%, by FY11.
In the next five years, we expect LCC’s to gain control of more than half of the domestic aviation market because of LCCs’ relatively faster fleet addition; compared to FSCs. FSCs’ are increasing focus on serving tier-II and tier-III cities through their LCC arms. The relatively fast growth in leisure travel (compared with business travel), is more advantageous for LCC’s due to the cost consciousness of the Indian consumer.

Equity | India | Aviation
Aviation Industry March 19, 2012
GEPL Capital Research | Sector Review 15
Player-wise market share in FY03 Player-wise market share in FY07
Jet Lite,
10
NACIL, 42
Jet
Airways,
48
Jet Airways,
28.4
NACIL, 20.3
Paramount,
1Go Air, 3.6
SpiceJet,
7.4
Indigo, 2.6
JetLite, 8.4
Kingfisher,
9.3Air Deccan,
19
Source: DGCA, GEPL Capital Research Source: DGCA, GEPL Capital Research
Player-wise market share in FY08 Player-wise market share in FY11
Jet Airways
(incl JetLite),
29.4
Kingfisher
(incl Air
Deccan)
29
NACIL, 17.8
SpiceJet, 9.3
Indigo, 8.8
GoAir, 4.1
Paramount,
1.3
Jet Airways
(incl JetLite),
26.2
Kingfisher
(incl Air
Deccan)
16.5
NACIL, 19.9
SpiceJet, 13.5
Indigo, 17.5
GoAir, 6.3
Source: DGCA, GEPL Capital Research Source: DGCA, GEPL Capital Research

Equity | India | Aviation
Jet Airways (India) Ltd.
International business to aid growth March 19, 2012
BUY
Analyst Sunil Sewhani
+91-22- 6614 2690 [email protected] GEPL Capital Research 16
Initiating Coverage
CMP (`) Target (`)
318.9 397
Potential Upside Absolute Rating
24% BUY
Market Info (as on 16th March, 2012)
BSE Sensex 17466
Nifty S&P 5317
Stock Detail
BSE Group A
BSE Code 532617
NSE Code JETAIRWAYS
Bloomberg Code JETIN IN
Market Cap (`bn) 27.53
Free Float (%) 20%
52wk Hi/Lo 517 / 167
Avg. Daily Volume (NSE) 2347833
Face Value / Div. per share (`) 10.00 / 0.00
Shares Outstanding (mn) 86.3
Shareholding Pattern (in %) Promoters FIIs DII Others
80.00 5.42 6.28 8.30
Financial Snapshot (`mn)
Y/E Mar FY10 FY11 FY12E FY13E
Net Sales 145,226 167,787 206,240 224,488
EBITDA 15,692 982 11,348 16,870
PAT (858) (10,688) (3,560) 333
EPS (10) (124) (41) 4
ROE (%) (3) (32) (20) 18
ROCE (%) 9 (3) 2 5
P/E (45) (1) (4) 48
EV/EBITDA 11 148 12 7
Share Price Performance
20
30
40
50
60
70
80
90
100
110
120
Mar
-11
Apr
-11
May
-11
Jun-
11
Jul-
11
Aug
-11
Sep-
11
Oct
-11
Nov
-11
Dec
-11
Jan-
12
Feb-
12
Mar
-12
Jet Airways BSE SENSEX
Rel. Perf. 1Mth 3 Mths 6Mths 1Yr
Jet Air (%) (7.5) 55.9 17.1 (31.8)
SENSEX (%) (3.8) 12.7 3.1 (4.9)
Source: Company data, GEPL Capital Research
Investment Rationale
Unique business model with presence across segments We believe Jet Airways India Ltd (Jet) is best placed to capture the 16.5% CAGR in domestic passenger traffic and 15.5% CAGR in international passenger traffic in FY11-FY15E. Jet offers a host of benefits due to flexible business model such as a) dominant market share in both the domestic (~26%) and international market (~36%) allowing it to reshuffle part of its fleet depending on the seasonality in demand, b) presence in the FSC (Jet Airways) and LCC segments (JetLite and Jet Konnect) which enables to successfully divert part of its fleet based on the demand supply scenario, and hence maintain the yields and load factors, and c) varied fleet type (Boeing and ATR), size (capacity of 777s is 312 while that of ATR is 65) and ownership making pilot poaching difficult, accommodating demand across sectors easier and leasing out owned fleet to capitalise on the demand-supply mismatch.
Focus on International segment- key driver for profitability The international business of Jet Airways has seen a sharp turnaround in operations; from being a loss making until FY08 (EBITDA level) to contributing 74% to the consolidated EBITDA in FY11. The international division has not only led to higher margins and profitability for the company but also aids growth by providing synergies like a) ready customer base to its domestic segment, and b) creates diversified passenger traffic leading to demand throughout the year.
Improving domestic business Due to the strong brand image, operational synergies and flexible business model, the domestic business of Jet Airways has witnessed a sharp improvement in operations. The company plans to add 17 Boeing 737-800 to its existing fleet over the next one and a half year, to increase its domestic capacity and capture a greater share of the demand supply mismatch present in the domestic aviation industry in India.
Merger of JetLite and Jet Konnect to boost LCC segment growth
The company has also successfully managed to improve JetLite’s operational efficiency over the years with a rise in block hours despite the reduction in ASKM which has helped improve efficiencies and reduce costs. Jet plans to merge its two LCCs JetLite and Jet Konnect and operate under the brand name of the latter. The higher brand perception for Jet Konnect as compared to JetLite, higher operating efficiencies by the former, tie-up synergies and improved connectivity are some of the benefits that the company would witness with the re-branding and merger of JetLite.
Balance sheet concerns overdone The company has successfully reduced its debt position to `1.36 bn in FY11 as compared to `1.42 bn in FY10. With `9 bn of this debt being aircraft-related dollar denominated debt and 4.5% rate of interest, the debt situation is much better for Jet when compared to its peers. Moreover, the company has converted part of its rupee debt which has helped reduce interest outgo. With a series of steps like a) refinancing high-cost debt, b) the sale and leaseback of aircraft, and c) the sale of non-core assets, we expect Jet’s interest burden to decline by 18% over the next two years.
Valuation
Jet Airways is currently trading at 10.0x FY13E EV/EBITDAR and 7.9x FY14E EV/EBITDAR. We initiate coverage on Jet Airways with a BUY rating and a target price of `397 per share. The target price is based on 8.1x FY14E EV/EBITDAR multiple, at a 12% premium to SpiceJet due to strong growth visibility in the Indian aviation market, strong presence across the spectrum (FSC, LCC, International, and domestic) but at a discount to Chinese airlines due to higher debt levels.

Equity | India | Aviation
Jet Airways (India) Ltd. March 19, 2012
GEPL Capital Research| Initiating Coverage 17
Investment Rationale Unique business model with presence across segments
We believe Jet Airways India Ltd (Jet) is best placed to capture the 16.5% CAGR in domestic passenger traffic and 15.5% CAGR in international passenger traffic in FY11-FY15E due to its unique business model and the benefits attached to the same.
A. Presence in domestic as well as international market The domestic passenger traffic has witnessed a 16.5% CAGR in FY06-FY11 to 54 mn trips. We assume similar growth trend in the future considering a) rising GDP over the next five years with a 2.2x multiplier effect, b) improving infrastructure with new airports and expansion of existing airports, and c) rising per capita income in India and comparatively lower rise in ticket prices hence improving the affordability of Indian travelers. With a 16.5% CAGR in FY11-FY15E we expect the domestic passenger traffic to grow to 99 mn trips.
Domestic market share International market share
35.9
29.1 28.125.7 26.2
0
5
10
15
20
25
30
35
40
FY07 FY08 FY09 FY10 FY11
%14.3
19.9
32.9 3435.9
0
5
10
15
20
25
30
35
40
FY07 FY08 FY09 FY10 FY11
%
Source: DGCA, GEPL Capital Research Source: DGCA, GEPL Capital Research
Ability to reshuffle part of its fleet across geographies Jet Airways currently has 54 aircraft allocated in the domestic skies, 5 sub leased aircrafts, and the reaming 41 aircraft routed to fly international. Its presence in the international and domestic markets has enabled the company to re-shuffle its fleet to international skies based on the seasonal demand and vice versa. During the Oct-Jan period international tourist arrivals are at its peak while Apr-June period is the peak season for Indian domestic travelers. The presence across geographies helps reduce its dependence on a particular market and helps improve fleet efficiency.
The presence in the international segment has helped improve the block hours for the company as well improve revenues with a higher revenue per RPKM (yield) seen from the international business.

Equity | India | Aviation
Jet Airways (India) Ltd. March 19, 2012
GEPL Capital Research| Initiating Coverage 18
B. Presence in the FSC and LCC segment
The company is the best bet in the Indian aviation space, to capture the robust growth in the domestic passenger traffic due to its presence in both the LCC and FSC segment. The company caters to the lower end of the spectrum with its brands, Jet Konnect and JetLite, and to the premium end with its own brand-name, Jet Airways. This enables the company to provide a range of ticket prices and is able to cater to premium and economy travelers. The presence in the LCC segment allows it to capture the relatively strong growth in the domestic skies and also leads to improvement in blended load factors. On the other hand the FSC segment has helped Jet maintain its yields.
Passenger load factors (PLF) Yields
69.5 69.5 67.7
77.1 78.7
68.8 68.863.7
72.177.4
68.0 66.3 65.5 70.7 73.0
0.0
10.0
20.0
30.0
40.0
50.0
60.0
70.0
80.0
90.0
FY07 FY08 FY09 FY10 FY11
%
Jet (consolidated) Domestic Industry
International Industry
5.7 5.8
6.8
5.3 5.2
2.9 3.03.3
2.8 2.94.63.4 3.4 3.6 3.7
0.0
1.0
2.0
3.0
4.0
5.0
6.0
7.0
8.0
FY07 FY08 FY09 FY10 FY11
Rs
Jet Domestic Jet International JetLite
Source: Company data, GEPL Capital Research Source: Company data, GEPL Capital Research
Diverting part of its fleet under the FSC/LCC model Due to the advantage of having a presence in both the LCC and FSC model, the company has been able to successfully divert part of its fleet based on the demand supply scenario, and hence maintain the yields and load factors.
It has a vast fleet of 119 aircrafts (19 Jet Lite and 100 Jet Airways ) and has a competitive advantage due to operations under FSC and LCC models which enables it to divert part of its fleet under the LCC/ FSC model depending on the economic scenario.
For example, in the downturn of FY09, Jet reconfigured two-thirds of its domestic fleet by converting premium seats to economy seats which helped maintain demand and load factors despite the lower yields. Similarly, when the demand for premium travel had revived in FY10, it started reconfiguring its seats by adding premium seats again. This has given a significant boost to their yields considering that passenger yield for business class is 2.5x that of economy class.
Moreover, the company is able to evaluate the possibility of deploying the higher capacity (Airbus A330 aircraft with 220 seats) in place of the current Boeing 737s (with 175 seats) on the Mumbai-Delhi route, due to strong demand and limited slots available at Mumbai airport.
Such flexibility places Jet in a better scenario than its competitors and hence the company is able to capture a greater share of wallet spend during good time as well as maintain its PLF during lean seasons.

Equity | India | Aviation
Jet Airways (India) Ltd. March 19, 2012
GEPL Capital Research| Initiating Coverage 19
C. Varied fleet size and type
Jet Airways (standalone) currently has a fleet of 100 aircraft (12 Boeing 777 series, 12 Airbus A330-200, 56 Boeing 737 series and 20 ATR 72-500 turboprops). Its fleet also comprises of 19 aircraft (10 Boeing 737-700 series and 9 Boeing 737-80- series) under its fully owned subsidiary Jet Lite (previously Air-Sahara). Due to the difference in fleet (Boeing for Jet and Airbus for Kingfisher and Indigo) poaching of pilots becomes difficult and hence the attrition rate is maintained.
Moreover, a varied fleet size (capacity of Boeing 777s is 312 seats while that of ATR is 65 seats) helps to accommodate demand across sectors. This has led to the company being able to constantly maintain and improve its load factors. The move has also led to better utilisation of its fleet as per the needs of the sector and the cyclical and seasonal demand.
Jet Airways Fleet type
Type Size Capacity
Boeing 737-700 11 118
Boeing 737-800 43 160
Boeing 737-900 2 138
ATR 72-500 20 65
Airbus 330-200 12 235
Boeing 777-300 12 312
Source: Company data, GEPL Capital Research
Jet-Lite Fleet type
Type Size Capacity
Boeing 737-700 10 145
Boeing 737-800 5 186
Boeing 737-800W 4 186
Source: Company data, GEPL Capital Research
Leasing out owned fleet to capitalise on the demand-supply mismatch
With a fleet mix of owned (42) and leased (58) aircraft Jet is able to capitalise on the demand-supply mismatch and earn additional revenues. Such flexibility gives Jet a strong competitive advantage in terms of its ability to withstand a downturn in the economy and also makes it best placed to capture a growth opportunity during times of revival or during festive seasons. Moreover, since 42 of the total 100 aircraft are owned while the remaining 58 are leased, Jet is able to generate the highest EBITDA margins in the industry as lease rentals are low.
The company sub- leased 4 aircraft (Boeing 777’s) to Turkish Airlines for a period of 25 months in CY09 and subleased 3 aircraft to Thai Airways for a period of 36 months in CY10. This has been an additional source of revenue for the company over the last three years with the company earning `1.8 bn in FY09, `7.2 bn in FY10 and `5.2 bn in FY11. Hence due to presence of owned fleet the company was able to reduce the downturn effect with revenues straight away positively impacting the EBITDA. We expect this feature of Jet Airways to be one of its strongest edges over competitors and make it best poised in times of industry slowdown.

Equity | India | Aviation
Jet Airways (India) Ltd. March 19, 2012
GEPL Capital Research| Initiating Coverage 20
Focus on international segment – key driver for profitability
Jet started its international operations in FY05 and since then has seen a stark improvement in its financials and operations. The International division has seen a successful turnaround from being loss making until FY08 (EBITDA level). It turned EBITDA positive in FY09, EBIT positive in FY10 and PBT positive in FY11. With a 3.5 times increase in market share in last five years (10% in FY06 to 36% in FY11).
Jet Airways is currently the second largest international operator in India. The company’s international business accounts for 46% of its consolidated passenger revenues in FY11 and 57% of its consolidated ASKM. With a strong presence in the international business the company has been able to aid growth of the domestic traffic as well due to synergies like a) the international passengers acting as a ready customer base to its domestic segment, b) creating a diversified passenger traffic leading to demand throughout the year, and c) stability of its business model.
Passenger revenue mix in FY11 ASKM mix in FY11 International,
46
Domestic, 40
JetLite, 14
International,
57
Domestic, 29
JetLite, 14
Source: Company data, GEPL Capital Research Source: Company data, GEPL Capital Research
Synergies of International travel
The average ticket costs on international routes are nearly 20% higher than on domestic routes, for the same distance travelled, due to the lack of severe competition, leading to pricing power for international route operators. Moreover, Fuel cost, which accounts for 40-45% of revenue, is 25-30% cheaper on international soil (due to low government taxes) which leads to higher margins. To add to this, the international business reduces the cyclicality in demand as the lean season in India of July-Oct ends up being a strong season for the international markets and a lean season for the international market of Apr-July is a strong demand season for domestic travel.
Such synergies have ensured that the profitability of international operations remains significantly higher than domestic business. The EBITDAR margins too for the international business in FY11 were 24% as compared to 15% in the domestic business.
We expect the international business passenger revenue and EBITDAR to record 17.3% and 11.2% CAGR respectively in FY11-14E led by 12% CAGR in RPKM, 7.3% CAGR in passenger yields and 21.7% CAGR in fuel cost over the next three years.

Equity | India | Aviation
Jet Airways (India) Ltd. March 19, 2012
GEPL Capital Research| Initiating Coverage 21
International ASKM, RPKM and PLF International passenger revenues and revenue per RPKM
80.080.0
80.380.4
80.4
0.0
5.0
10.0
15.0
20.0
25.0
30.0
35.0
FY10
FY11
FY12
E
FY13
E
FY14
E
bn
79.7
79.8
79.9
80.0
80.1
80.2
80.3
80.4
80.5
%
ASKM RPKM PLF
2.8
2.9
3.1
3.3
3.6
0.0
20.0
40.0
60.0
80.0
100.0
FY10
FY11
FY12
E
FY13
E
FY14
E
Rs
bn
2.5
2.7
2.9
3.1
3.3
3.5
3.7
Rs
Revenues Revenue per RPKM
Source: Company data, GEPL Capital Research Source: Company data, GEPL Capital Research
International cost per ASKM (with and without fuel) International EBITDAR and EBITDAR margin
2.582.72
2.98 2.92 3.01
1.51 1.57 1.46 1.45 1.54
1.00
1.50
2.00
2.50
3.00
3.50
FY10
FY11
FY12
E
FY13
E
FY14
E
Rs
Cost per ASKM (with fuel)
Cost per ASKM (without fuel)
27.1
24.0
12.8
17.6
19.3
10
12
14
16
18
20
22
24
FY10
FY11
FY12
E
FY13
E
FY14
E
Rs
bn
12.0
14.0
16.0
18.0
20.0
22.0
24.0
26.0
28.0
%
EBITDAR EBITDAR margin Source: Company data, GEPL Capital Research Source: Company data, GEPL Capital Research

Equity | India | Aviation
Jet Airways (India) Ltd. March 19, 2012
GEPL Capital Research| Initiating Coverage 22
Improving domestic business and merger of Jetlite and Jet Konnect
Due to the strong brand image of Jet Airways, operational synergies, a flexible and unique business model, and a strong growth in passenger traffic, the domestic business of Jet Airways has witnessed a sharp improvement in operations.
The improvement in operations is clearly highlighted by the rise in PLF to 75.1% in FY11 as compared to 71.6% in FY10 even as the ASKM rose by 17.5% in FY11. Even in Q2FY12 the domestic business has seen load factors rise to 72.1% from 71.4% in Q2FY11 as the ASKM grew by 7% Y-o-Y. In fact the yields have also seen a rise in the current fiscal with revenue/RPKM rising by 10% in Q1FY12 and 1% Q2FY12. The operational efficiencies have resulted in a better financial standing with the EBITDAR margins having improved from 15% in FY10 to 18% in FY11 and an EBITDA margins rising to of 7.8% in FY11 as compared to EBITDA margin of 3% in FY10 and an EBITDA loss in FY09.
Quarterly domestic PLF Quarterly domestic yields
73
77.5
64.5 67
.3 69.7
75.4
72.174
.6 76.9
71.4
79.1
72.9
60
65
70
75
80
85
Jan-
Mar
Apr
-Jun
July
-Spe
t
Oct
-Dec
%
CY11 CY10 CY09
5.3
5.96.
2
5.7
4.5
5.45.
6
4.9
5.5
5.1
4.8
5.7
3.5
4.0
4.5
5.0
5.5
6.0
6.5
Jan-
Mar
Apr
-Jun
July
-Spe
t
Oct
-Dec
Rs
CY11 CY10 CY09
Source: Company data, GEPL Capital Research Source: Company data, GEPL Capital Research
The company also plans to add 17 Boeing 737-800 to its existing fleet over the next one and a half year, a move that should help to increase its domestic capacity and capture a greater share of the demand supply mismatch present in the domestic aviation industry in India.
Given the company’s track record of bucking the trend, withstanding downtrends and turning around faster than the industry pace, we expect the domestic business passenger revenue and EBITDAR to record 15.9% and -7.9% CAGR respectively in FY11-14E led by 10.7% CAGR in RPKM, 4.8% CAGR in passenger yields and 24.2% CAGR in fuel cost over the next three years.

Equity | India | Aviation
Jet Airways (India) Ltd. March 19, 2012
GEPL Capital Research| Initiating Coverage 23
Domestic ASKM, RPKM and PLF Domestic passenger revenues and revenue per RPKM
71.6
75.1
74.2
75.0 75.0
0.0
2.0
4.0
6.0
8.0
10.0
12.0
14.0
16.0
18.0
FY10
FY11
FY12
E
FY13
E
FY14
E
bn
69.0
70.0
71.0
72.0
73.0
74.0
75.0
76.0
%
ASKM RPKM PLF
5.3 5.2
5.4
5.7
6.0
10
20
30
40
50
60
70
80
90
FY10
FY11
FY12
E
FY13
E
FY14
E
Rs
bn
4.8
5.0
5.2
5.4
5.6
5.8
6.0
6.2
Rs
Revenues Revenue per RPKM Source: Company data, GEPL Capital Research Source: Company data, GEPL Capital Research
Domestic cost per ASKM (with and without fuel) Domestic EBITDAR and EBITDAR margin
4.26 4.294.56 4.66 4.77
2.972.78
2.55 2.53 2.64
2.00
2.50
3.00
3.50
4.00
4.50
5.00
FY10
FY11
FY12
E
FY13
E
FY14
E
Rs
Cost per ASKM (with fuel)
Cost per ASKM (without fuel)
13.1
15.4
3.35.5
8.0
0
1
2
3
4
5
6
7
8
9
FY10
FY11
FY12
E
FY13
E
FY14
E
Rs
bn
0.0
2.0
4.0
6.0
8.0
10.0
12.0
14.0
16.0
18.0
%
EBITDAR EBITDAR margin Source: Company data, GEPL Capital Research Source: Company data, GEPL Capital Research

Equity | India | Aviation
Jet Airways (India) Ltd. March 19, 2012
GEPL Capital Research| Initiating Coverage 24
Merger of JetLite and Jet Konnect to boost LCC segment growth
JetLite was formed with the acquisition of Air Sahara by Jet Airways for a sum of US$340 mn in FY08, with a fleet of 26 aircraft. Jet positioned this new subsidiary as a LCC and has been working on various integrated measures to improve its efficiency. The company has been closely working towards operational efficiency and has reduced the fleet size to 19 which has resulted in a mere 1% CAGR reduction in ASKM since its acquisition.
The company has successfully managed to improve its operational efficiency over the years with a rise in block hours per aircraft and in passengers carried despite the reduction in ASKM. This has helped improve efficiencies and reduce costs. With refurbished seats and better food, the preference for the airline has increased and the 9W code has been put on all Jet Lite aircraft to enable it to sell its seats through the GDS system, helping it to achieve ~25% of its traffic from the company’s international network. Consequently, JetLite has witnessed revenue CAGR of 4.6% in FY09-FY11 with EBITDAR profit of `2.2 bn each in FY10 and FY11. The EBITDA loss has also reduced to `762 mn in FY11 as compared to an EBITDA loss of `1.01 bn in FY10 as a result of the cost per ASKM falling to `1.65 in FY11 from `1.67 in FY10.
Quarterly block hours per aircraft per day Quarterly revenue passengers
10.8 11
.6
9.0
8.9
11.7
10.6
11.8
11.6
11.0
8.8
8.6
10.6
6.0
7.0
8.0
9.0
10.0
11.0
12.0
13.0
Jan-
Mar
Apr
-Jun
July
-Spe
t
Oct
-Dec
%
CY11 CY10 CY09
1.15 1.
2
0.8 0.
9
0.9
1.0
1.2
1.19
0.89
1.11
0.95
1.12
0.6
0.7
0.8
0.9
1.0
1.1
1.2
1.3
Jan-
Mar
Apr
-Jun
July
-Spe
t
Oct
-Dec
Rs
CY11 CY10 CY09
Source: Company data, GEPL Capital Research Source: Company data, GEPL Capital Research
The company plans to merge its two LCC JetLite and Jet Konnect and operate under the brand name of the latter. The move to arrest losses and compete with other low-cost airlines had been in the management's mind for some time, but the decision has been taken now. Though no formal date has been announced regarding the re-branding exercise we expect the move to be positive for the company. The higher brand perception for Jet Konnect as compared to JetLite, higher operating efficiencies by the former, tie-up synergies and improved connectivity are some of the benefits that the company would witness with the re-branding and merger of JetLite.
We expect the revenues to witness 10.0% CAGR in FY11-13E driven by 4.2% CAGR in RPKM and a 5.8% CAGR In passenger yields in the same period. However, with a rise in fuel cost of 15.4% CAGR in the same period we expect the profitability of this division to remain under pressure and we expect the EBITDAR to witness 0.9% CAGR decline in FY11-FY14E.

Equity | India | Aviation
Jet Airways (India) Ltd. March 19, 2012
GEPL Capital Research| Initiating Coverage 25
JetLite ASKM, RPKM and PLF JetLite passenger revenues and revenue per RPKM
75.0
79.2
77.6 78.077.0
0.0
1.0
2.0
3.0
4.0
5.0
6.0
7.0
FY10
FY11
FY12
E
FY13
E
FY14
E
bn
72.0
73.0
74.0
75.0
76.0
77.0
78.0
79.0
80.0
%
ASKM RPKM PLF
3.63.7
4.1 4.3 4.4
10
12
14
16
18
20
22
24
FY10
FY11
FY12
E
FY13
E
FY14
E
Rs
bn
2.0
2.5
3.0
3.5
4.0
4.5
5.0
Rs
Revenues Revenue per RPKM
Source: Company data, GEPL Capital Research Source: Company data, GEPL Capital Research
JetLite cost per ASKM (with and without fuel) JetLite EBITDAR and EBITDAR margin
2.93.1
3.7 3.8 3.8
1.7 1.6 1.8 1.9 1.9
1.0
1.5
2.0
2.5
3.0
3.5
4.0
FY10
FY11
FY12
E
FY13
E
FY14
E
Rs
Cost per ASKM (with fuel)
Cost per ASKM (without fuel)
14.912.8
8.79.4
1.6
0.0
0.5
1.0
1.5
2.0
2.5
FY10
FY11
FY12
E
FY13
E
FY14
E
Rs
bn
0.0
2.0
4.0
6.0
8.0
10.0
12.0
14.0
16.0
%
EBITDAR margin EBITDA margin
Source: Company data, GEPL Capital Research Source: Company data, GEPL Capital Research

Equity | India | Aviation
Jet Airways (India) Ltd. March 19, 2012
GEPL Capital Research| Initiating Coverage 26
Balance sheet concerns overdone
India's airlines are reeling under a US$20 bn debt load and struggling to make profits. The debt picture of Kingfisher is already making waves with a current debt of ~`89 bn. Investors are thus concerned with the high debt of Jet which stands at ~`133 bn. However, Jet’s debt consists of ~`76 bn of long-term debt related to aircraft acquisition which accounts for 57% of the total debt. Moreover, the company has managed to lower its debt even in the past.
Jet’s debt surged to `166 bn in FY09 after witnessing a severe cash-flow crunch during the downturn FY08-09. However the company was able to reduce the debt by `30 bn over the next two years due to a series of initiatives which included
a) Sale and leaseback of aircraft: Jet recognized `4.9 bn on sale and lease back of aircraft in FY08-09 which reduced its cash crunch burden.
b) Refinancing of high-cost debt: Jet refinanced its long-term debt related to aircraft acquisition of `90 bn (66% of total). The company also refinanced `25 bn of its remaining ~`47 bn loan in to dollar terms at a significantly lower interest rate of 6.5% (compared to 12 5% in the case of rupee loans). This resulted in savings of interest outflow.
c) Monetising Bandra-Kurla Complex (BKC) land: Jet signed a preliminary agreement with Godrej properties to jointly develop its BKC land. The deal entailed a) an upfront payment of `5 bn (`3.6 bn for debt repayment and `1.4 bn for cost already incurred), b) development of 1.6 mn sq ft (msf) of office space, with complete ownership of 0.25 msf given to the company, and c) a 50:50 share of the profits from the land developed.
Such steps helped reduce the debt position of Jet. Over the next three years we expect the following debt reduction measures from the company
a) Sale and leaseback of aircraft: The Company can earn `8-10 mn per aircraft through this route as the rate of depreciation charged is 5% which the diminishing value is ~2.5%. With an owned fleet of 40 aircraft the company can earn good profits from such transactions and is looking at this route to reduce its debt position over the next two years
b) Repayment of high-cost debt: The average rate of interest on long-term debt is ~4% and has a repayment obligation of `10 bn per annum. Moreover, any further conversion of the rupee denominated debt to dollar terms can be beneficial can be beneficial to the company as the latter a lower rate of interest.
c) Monetising Bandra-Kurla Complex (BKC) land: The jointly develop BKC land should result in a 50:50 share of the profits from the development of the land. However we have not factored this deal into our estimates and any positive news could result in further potential upside.
d) Equity dilution: The Company has received clearance from the Cabinet Committee on Economic Affairs (CCEA) to raise US$400 mn (`18.5 bn) from foreign investors through Qualified Institutional Placement (QIP). However, given the current market conditions we do not expect the company to dilute equity
Given the various debt reduction measures and the annual repayment schedule for the aircraft related debt, we expect the total debt to decline by `20 bn till FY14E to `116.8 bn. This should help improve the interest coverage ratio from 1.4x in FY11 to 0.7x in FY14E
With a 5.1% CAGR decline in total debt in FY11-14E, we expect the interest outflow to witness a 12.4% CAGR decline and reduce to `8.8 bn in FY14E from `10.9 bn in FY11. This should help improve the EBITDA to interest ratio to 1.9x in FY14E from 1.45x in FY11.

Equity | India | Aviation
Jet Airways (India) Ltd. March 19, 2012
GEPL Capital Research| Initiating Coverage 27
Gross and Net Debt Cash flow from operations
142.8 136.8 132.8126.8
116.8
134.5 130.0 129.2 119.6 108.4
0.0
20.0
40.0
60.0
80.0
100.0
120.0
140.0
160.0FY
10
FY11
FY12
E
FY13
E
FY14
E
Rs
bn
Debt Net debt
5.3
143.9
1.8
(326.9)
(47.3)
0.0
40.0
80.0
120.0
160.0
200.0
FY10
FY11
FY12
E
FY13
E
FY14
E
Rs
bn
(400.0)
(300.0)
(200.0)
(100.0)
0.0
100.0
200.0
%
Cash flow from operations Y-o-Y growth
Source: Company data, GEPL Capital Research Source: Company data, GEPL Capital Research
Interest outflow EBITDA/Interest ratio
30.6
3.7
(4.5)(7.9)
(8.3)
0.0
2.0
4.0
6.0
8.0
10.0
12.0
FY10
FY11
FY12
E
FY13
E
FY14
E
Rs
bn
(20.0)
(10.0)
0.0
10.0
20.0
30.0
40.0
%
Interest outflow Y-o-Y growth
1.16
1.45
0.10
1.19
1.93
0.00
0.50
1.00
1.50
2.00
2.50
FY10 FY11 FY12E FY13E FY14E
Source: Company data, GEPL Capital Research Source: Company data, GEPL Capital Research

Equity | India | Aviation
Jet Airways (India) Ltd. March 19, 2012
GEPL Capital Research| Initiating Coverage 28
Financial overview
Revenues to witness a 15.6% CAGR in FY11-FY14E
We expect 15.6% CAGR in revenue in FY11-FY14E to `224.5 bn, driven by 10.6% CAGR in RPKM from 31.3 bn in FY11 to 42.4 bn in FY14E and 3.6% CAGR in passenger yield (revenue/RPKM), from `3.9 in FY11 to `4.3 in FY14E.
We expect the ASKM to witness a 10.9% CAGR in FY11-FY14E driven by 8.4% CAGR in seat capacity as the number of aircraft is expected to rise from 119 in FY11 to 130 in FY14E with the addition of Boeing 737s. We expect a marginal 50bps decline in the Passenger Load Factors (PLF), with lower than industry seat addition. However, given the strong demand for its LCC and international business, we expect the blended PLF to remain above 75% over the next two years.
We expect the company to maintain its focus on the international business with the addition of fresh fleet (8-10 in the next two years) which should lead to a 12.2% CAGR in ASKM from FY11-14E to 32.1 bn and load factors above 80%. This led by a 7.3% CAGR in passenger yields should result in international revenues witnessing 17.3% CAGR in FY11-14E to `119.4 bn. Consequently the share of international revenues is expected to rise from 51% in FY11 to 54% in FY14E.
ASKM, RPKM and PLF Revenue and Revenue per RPKM
78.7
78.178.3
77.1
78.2
0.0
10.0
20.0
30.0
40.0
50.0
60.0
FY10
FY11
FY12
E
FY13
E
FY14
E
bn
76.0
76.5
77.0
77.5
78.0
78.5
79.0
%
ASKM RPKM PLF
3.93.8
4.1
3.8
4.3
0.0
50.0
100.0
150.0
200.0
250.0
FY10
FY11
FY12
E
FY13
E
FY14
E
Rs
bn
3.4
3.6
3.8
4.0
4.2
4.4
Rs
Revenues Revenue per RPKM Source: Company data, GEPL Capital Research Source: Company data, GEPL Capital Research
Higher ATF prices to impact cost structure
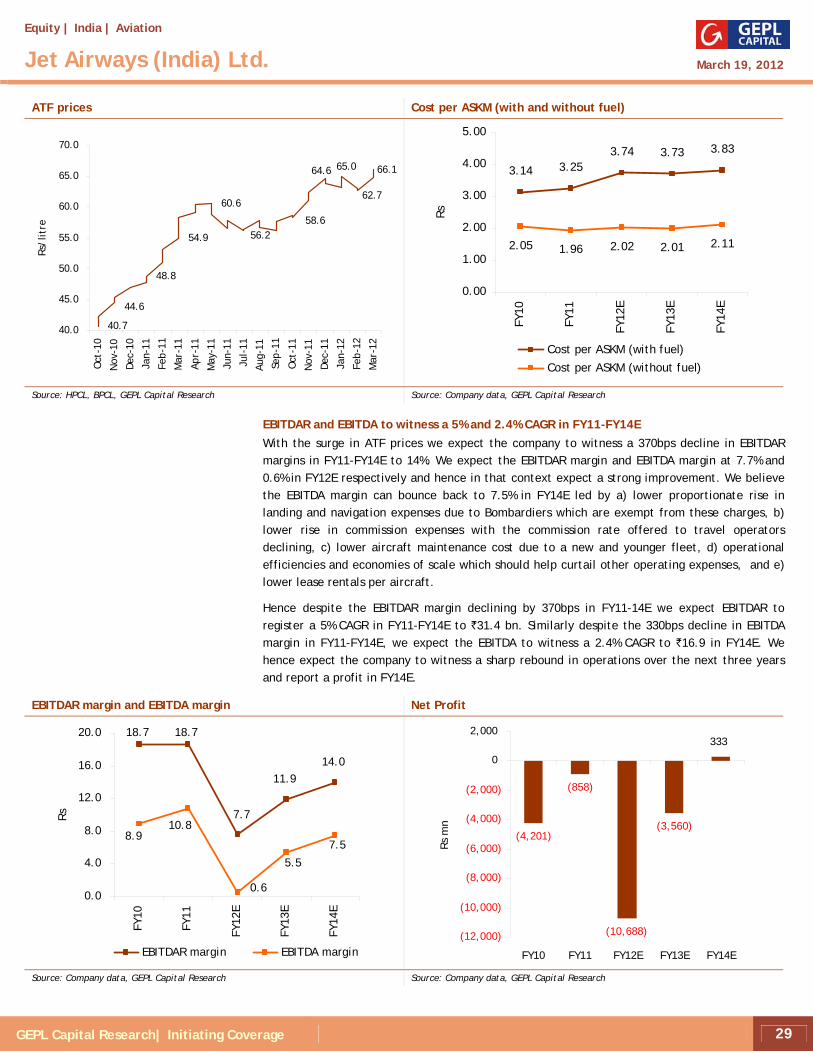
ATF prices have seen a sharp surge over the last one year. Led by the Middle East crisis ATF prices have surged by 62% since Oct’10. Post an improvement in the scenario as well, ATF prices have refused to decline and with the falling rupee and stubborn Brent crude prices, ATF prices have risen by 332% in CY11 and 13% in CY12.
The cost structure of airlines, which operate on thin margins have hence gone for a toss given the fact that fuel costs account for over 50% of the total costs. With the surge, airlines across India are finding it difficult to break-even on an operational basis. This is visible in the cost structure where by the ASKM with fuel has risen from `2.85 in Q1FY11 to `3.63 in Q3FY12
Equity | India | Aviation
Jet Airways (India) Ltd. March 19, 2012
GEPL Capital Research| Initiating Coverage 29
ATF prices Cost per ASKM (with and without fuel)
40.7
48.8
54.9
60.6
66.165.064.6
56.258.6
44.6
62.7
40.0
45.0
50.0
55.0
60.0
65.0
70.0
Oct
-10
Nov
-10
Dec-
10
Jan-
11
Feb-
11
Mar
-11
Apr-
11
May
-11
Jun-
11
Jul-
11
Aug-
11
Sep-
11
Oct
-11
Nov
-11
Dec-
11
Jan-
12
Feb-
12
Mar
-12
Rs/l
itre
3.14 3.253.74 3.73 3.83
2.05 1.96 2.02 2.01 2.11
0.00
1.00
2.00
3.00
4.00
5.00
FY10
FY11
FY12
E
FY13
E
FY14
E
Rs
Cost per ASKM (with fuel)
Cost per ASKM (without fuel) Source: HPCL, BPCL, GEPL Capital Research Source: Company data, GEPL Capital Research
EBITDAR and EBITDA to witness a 5% and 2.4% CAGR in FY11-FY14E With the surge in ATF prices we expect the company to witness a 370bps decline in EBITDAR margins in FY11-FY14E to 14%. We expect the EBITDAR margin and EBITDA margin at 7.7% and 0.6% in FY12E respectively and hence in that context expect a strong improvement. We believe the EBITDA margin can bounce back to 7.5% in FY14E led by a) lower proportionate rise in landing and navigation expenses due to Bombardiers which are exempt from these charges, b) lower rise in commission expenses with the commission rate offered to travel operators declining, c) lower aircraft maintenance cost due to a new and younger fleet, d) operational efficiencies and economies of scale which should help curtail other operating expenses, and e) lower lease rentals per aircraft.
Hence despite the EBITDAR margin declining by 370bps in FY11-14E we expect EBITDAR to register a 5% CAGR in FY11-FY14E to `31.4 bn. Similarly despite the 330bps decline in EBITDA margin in FY11-FY14E, we expect the EBITDA to witness a 2.4% CAGR to `16.9 in FY14E. We hence expect the company to witness a sharp rebound in operations over the next three years and report a profit in FY14E.
EBITDAR margin and EBITDA margin Net Profit
18.7 18.7
11.914.0
7.7
8.9
0.6
5.5
7.5
10.8
0.0
4.0
8.0
12.0
16.0
20.0
FY10
FY11
FY12
E
FY13
E
FY14
E
Rs
EBITDAR margin EBITDA margin
(4,201)
(858)
(10,688)
(3,560)
333
(12,000)
(10,000)
(8,000)
(6,000)
(4,000)
(2,000)
0
2,000
FY10 FY11 FY12E FY13E FY14E
Rs
mn
Source: Company data, GEPL Capital Research Source: Company data, GEPL Capital Research

Equity | India | Aviation
Jet Airways (India) Ltd. March 19, 2012
GEPL Capital Research| Initiating Coverage 30
Key Risks
• Fuel costs beyond airlines’ control Aviation turbine fuel (ATF) prices account for 40-45% of an airline’s total revenues. A sharp increase in the ATF prices have dented margins and led to losses across the industry. Any further price rise could result in a significant net loss and hence erosion of net worth for the company.
• Change in landing and navigation charge regulations
Currently, aircraft with less than 80 seat capacity are exempt from airport landing and navigation charges. Jet Airways has 20 ATR aircraft, with a seat configuration below 80. As these aircraft qualify for exemptions, any change in these policies could lead to higher taxes and so affect future earnings.
• Yields stagnating
Any sharp increase in competitive intensity (in times of low passenger traffic or excess expansion by airlines) could adversely affect the load factors and passenger yields, reducing margins
• Rates and currency fluctuations A stronger dollar may affect Jet’s profitability, as a large part of the company’s costs are dollar denominated, like lease rentals, ATF cost and maintenance costs. In addition, a major portion of their debt is dollar denominated; hence, a stronger dollar could hit earnings.
• Highly fixed-cost intensive The airline industry is highly fixed-cost intensive with lease rentals, maintenance and employee costs remaining fixed. Any reduction in passenger traffic can adversely affect the profitability.
• Downturn in the economy Any downturn in the economy could lead to relatively low passenger traffic growth, which could have a negative impact on load factors, and could eventually have a negative impact on profitability.
• External factors There are many external factors which can affect profitability, which include bad weather conditions, terrorist activities, country and state policies and others.
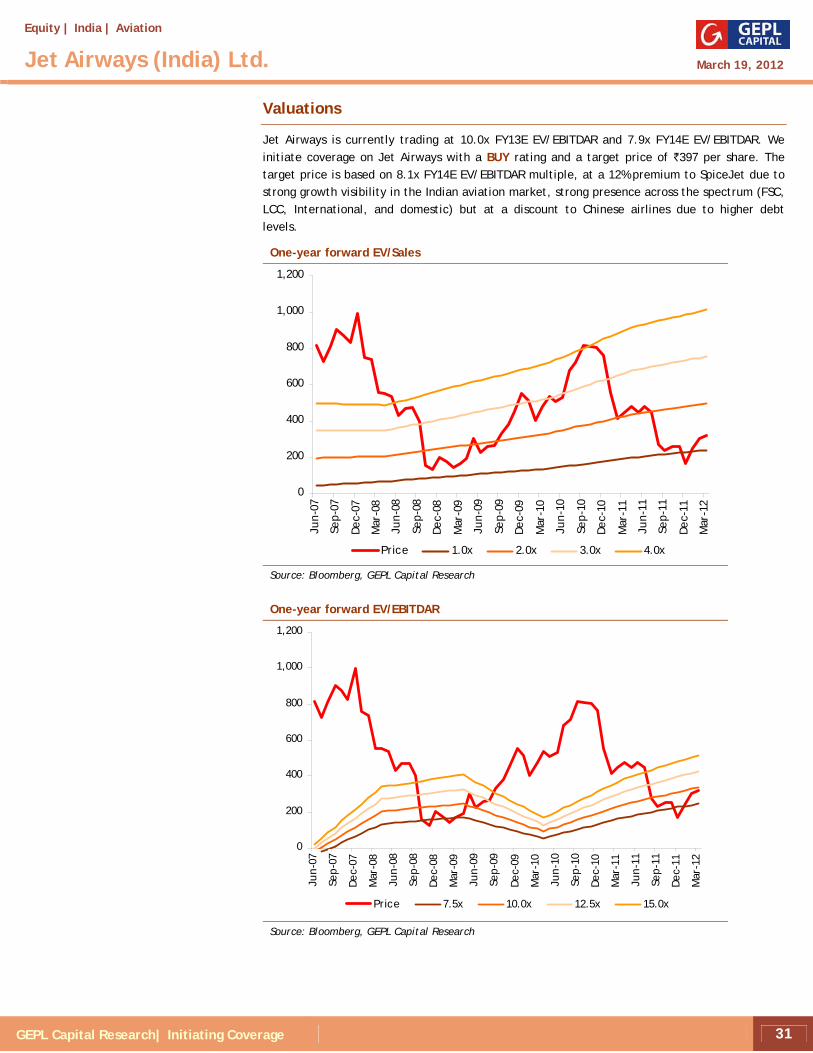
Equity | India | Aviation
Jet Airways (India) Ltd. March 19, 2012
GEPL Capital Research| Initiating Coverage 31
Valuations
Jet Airways is currently trading at 10.0x FY13E EV/EBITDAR and 7.9x FY14E EV/EBITDAR. We initiate coverage on Jet Airways with a BUY rating and a target price of `397 per share. The target price is based on 8.1x FY14E EV/EBITDAR multiple, at a 12% premium to SpiceJet due to strong growth visibility in the Indian aviation market, strong presence across the spectrum (FSC, LCC, International, and domestic) but at a discount to Chinese airlines due to higher debt levels.
One-year forward EV/Sales
0
200
400
600
800
1,000
1,200
Jun-
07
Sep-
07
Dec-
07
Mar
-08
Jun-
08
Sep-
08
Dec-
08
Mar
-09
Jun-
09
Sep-
09
Dec-
09
Mar
-10
Jun-
10
Sep-
10
Dec-
10
Mar
-11
Jun-
11
Sep-
11
Dec-
11
Mar
-12
Price 1.0x 2.0x 3.0x 4.0x
Source: Bloomberg, GEPL Capital Research
One-year forward EV/EBITDAR
0
200
400
600
800
1,000
1,200
Jun-
07
Sep-
07
Dec-
07
Mar
-08
Jun-
08
Sep-
08
Dec-
08
Mar
-09
Jun-
09
Sep-
09
Dec-
09
Mar
-10
Jun-
10
Sep-
10
Dec-
10
Mar
-11
Jun-
11
Sep-
11
Dec-
11
Mar
-12
Price 7.5x 10.0x 12.5x 15.0x
Source: Bloomberg, GEPL Capital Research

Equity | India | Aviation
Jet Airways (India) Ltd. March 19, 2012
GEPL Capital Research| Initiating Coverage 32
Sensitivity Analysis
1% PLF rise enough to negate US$2.1/bbl hike in Brent crude
Contrary to the common notion, we believe a company’s profitability is more linked to the PLF and the yields than the ATF prices. As per our analysis a 1% rise in PLF should result in the EBITDAR of Jet for FY13E rising by 5.6% much higher than the impact of a US$1/bbl rise in prices which will impact EBITDAR by -2.7%. Hence we conclude that a 1% rise PLF is enough to negate a US$2.1/bbl rise in Brent crude prices.
`0.29 hike in yields sufficient to negate `1 depreciation
Similarly we analyze that `0.1 rise in yields can positively impact the EBITDAR of Jet by 2.6% while a `1 depreciation in the rupee will result in an EBITDAR de-growth of 7.5% for Jet in FY13E. Hence `0.29 rise in yields is more than sufficient to combat `1 depreciation in the rupee.
FY13E EBITDAR impact of crude and dollar
Brent crude (US$/bbl) Rupee dollar rate
110 115 120 125
46 29,631 26,344 23,057 19,770
48 26,120 22,690 19,260 15,830
50 22,609 19,036 15,463 11,891
52 19,098 15,382 11,666 7,951 Source: Company data, GEPL Capital Research
FY13E EBITDAR impact of yield and PLF
PLF Yield
77 78 79 80
3.9 17,790 19,092 20,394 21,697
4 19,864 21,193 22,522 23,851
4.1 22,823 24,191 25,558 26,926
4.2 25,782 27,188 28,594 30,001 Source: Company data, GEPL Capital Research

Equity | India | Aviation
Jet Airways (India) Ltd. March 19, 2012
GEPL Capital Research| Initiating Coverage 33
Income Statement Y/E Mar (`mn) FY10(A) FY11(A) FY12(E) FY13(E) FY14(E)
Total net revenues 120,280 145,226 167,787 206,240 224,488
Fuel Cost 37,584 51,673 76,568 89,818 93,067
Gross Profit 82,696 93,552 91,219 116,422 131,421
Employee Cost 13,770 15,105 17,853 20,373 22,153
Other Expenditure 45,196 51,303 60,489 71,532 77,875
EBITDAR 23,730 27,144 12,878 24,517 31,393
EBITDAR Margin (%) 19.7 18.7 7.7 11.9 14.0
Lease Rental 11,591 11,452 11,896 13,169 14,523
EBITDA 12,140 15,692 982 11,348 16,870
EBITDA Margin (%) 10.1 10.8 0.6 5.5 7.5
Depreciation 9,691 9,186 8,977 8,927 8,890
Other Income 2,101 2,044 1,253 1,277 1,277
Interest (Net) 10,474 10,858 9,960 9,510 8,760
PBT (5,924) (2,308) (16,702) (5,813) 497
PBT Margin (%) (7.2) (2.5) (18.3) (5.0) 0.4
Tax 103 374 (5,264) (1,753) 164
Minority Interest 0 0 0 0 0
Adjusted PAT (6,026) (2,682) (11,438) (4,060) 333
Extraordinary /exc. 1,826 1,824 750 500 0
Reported PAT (4,201) (858) (10,688) (3,560) 333
Balance Sheet Y/E Mar (`mn) FY10(A) FY11(A) FY12(E) FY13(E) FY14(E) Equity capital 863 863 863 863 863 Reserves & Surplus 16,432 15,100 4,412 853 1,186 Preference Capital Net worth 17,296 15,964 5,276 1,716 2,049 Minority interest 1,375 0 0 0 0 Deffed tax liability 0 0 0 0 0 Total debt 142,804 136,804 132,804 126,804 116,804 Total Liabilities & Equity 161,475 152,767 138,079 128,520 118,853 Net block 144,552 136,372 126,395 116,467 107,078 Capital WIP 3,335 3,828 2,828 4,328 4,828 Total fixed assets 166,611 158,924 147,946 139,519 130,629 Investments 1,000 801 801 801 801 Goodwill 18,724 18,724 18,724 18,724 18,724 Current Assets 39,063 44,223 43,357 56,096 61,621 Inventories 6,975 8,252 8,734 10,736 11,686 Debtors 8,765 10,254 11,033 13,561 14,761 Cash & bank 8,264 6,772 3,593 7,219 8,421 Loans & advances 15,059 18,944 19,997 24,579 26,754 Other Current Assets 0 0 0 0 0 Current Liab. & Prov. 45,199 50,843 53,688 67,559 73,862 Creditors 21,807 21,580 27,420 32,037 34,129 Other liabilities 21,526 27,057 31,532 37,275 39,569 Provisions 1,866 2,206 (5,264) (1,753) 164 Net Working capital 0 0 0 0 0 Miscellaneous Exp 0 0 0 0 0 Total Assets 161,475 153,104 138,416 128,856 119,189
Key Ratio Y/E Mar (`mn) FY10(A) FY11(A) FY12(E) FY13(E) FY14(E) Per Share Ratios Fully diluted E P S (48.7) (9.9) (123.8) (41.2) 3.9 Book Value 200.3 184.9 61.1 19.9 23.7 Dividend per share 0.0 0.0 0.0 0.0 0.0 per share FCFF 63.6 96.5 (19.8) 62.2 106.8 Valuation Ratio P/E (9.7) (45.2) (1.5) (4.5) 48.0 P/BV 2.4 2.4 3.0 9.3 7.8 EV/EBITDA 14.4 10.8 147.8 11.9 7.4 EV/Sales 1.5 1.2 0.9 0.7 0.6 Price/ FCFE per share 6.2 11.3 5.5 3.0 1.7 Growth Ratios Sales Growth (8.0) 20.7 15.5 22.9 8.8 EBITDA Growth NM 29.3 (93.7) 1,055.0 48.7 Net Profit Growth NM NM NM NM NM EPS Growth NM NM NM NM NM Common size Ratios Gross Margin 68.8 64.4 54.4 56.4 58.5 EBITDA Margin 10.1 10.8 0.6 5.5 7.5 PAT Margin (3.5) (0.6) (6.4) (1.7) 0.1 Employee Cost 11.4 10.4 10.6 9.9 9.9 Ad spend 37.6 35.3 36.1 34.7 34.7 Return ratios RoAE (12.4) (2.6) (32.2) (20.4) 17.7 RoACE 2.4 8.7 (2.7) 1.9 5.0 Turnover ratios (days) Debtors ( Days) 25.6 23.9 23.2 21.8 23.0 Creditors ( Days) 66.7 61.1 53.6 55.7 129.7 Inventory (Days) 21.1 19.1 18.5 17.2 18.2 Net working capital (6.6) (16.0) (18.4) (19.3) (19.3) Solvency Ratios Total Debt/Equity 8.3 8.6 25.2 73.9 57.0 Interest coverage 0.4 1.4 (0.5) 0.3 0.7
Source: Company data, GEPL Capital Research
Cash Flow Y/E Mar (`mn) FY10(A) FY11(A) FY12(E) FY13(E) FY14(E) PBT (5,924) (2,308) (16,702) (5,813) 497
Add: Depreciation 9,691 9,186 8,977 8,927 8,890
Add: Interest expense 10,474 10,858 9,960 9,510 8,760
Less: Other Income (2,101) (2,044) (1,253) (1,277) (1,277)
Other Adjustments 1,826 1,824 750 500 0
Change in working capital 181 (2,383) 532 4,758 1,979
Taxes paid 103 374 (5,264) (1,753) 164
CF from operations 14,249 15,507 (3,000) 14,853 19,013
Change in fixed assets 11,942 (1,499) 2,000 (500) (0)
Changes in Intangible Asset 0 199 0 0 0
Change in investments 0 199 0 0 0
Other income 2,101 2,044 1,253 1,277 1,277
CF from investing acti. 14,043 943 3,253 777 1,277
Change in debt (23,536) (6,000) (4,000) (6,000) (10,000)
Change in Equity capital 0 0 0 0 0
Changes in Pref. capital 0 0 0 0 0
Dividend & dividend tax 0 0 0 0 0
Interest paid (10,474) (10,858) (9,960) (9,510) (8,760)
Other Adjustments 0 336 0 0 0
CF from financing acti. (34,010) (16,522) (13,960) (15,510) (18,760)
Change in cash (6,398) (1,492) (3,179) 3,626 1,201
Opening cash 14,662 8,264 6,772 3,593 7,219
Closing cash 8,264 6,772 3,593 7,219 8,421
Du-Pont Analysis (%) FY10(A) FY11(A) FY12(E) FY13(E) FY14(E) Net Profit Margin (3.5) (0.6) (6.4) (1.7) 0.1 Asset Turnover 0.7 0.9 1.2 1.6 1.9 Leverage 9.3 9.6 26.2 75.1 58.2 ROE (12.4) (2.6) (32.2) (20.4) 17.7

Equity | India | Aviation
SpiceJet Ltd.
Best bet in the growing Indian aviation industry March 19, 2012
BUY
Analyst Sunil Sewhani
+91-22- 6614 2690 [email protected] GEPL Capital Research 34
Initiating Coverage
CMP (`) Target (`)
23.4 28.3
Potential Upside Absolute Rating
21% BUY
Market Info (as on 16th March, 2012)
BSE Sensex 17466
Nifty S&P 5317
Stock Detail
BSE Group B
BSE Code 500285
NSE Code --
Bloomberg Code SJET IN
Market Cap (`bn) 10.32
Free Float (%) 60%
52wk Hi/Lo 47.20 / 15.35
Avg. Daily Volume (BSE) 5702338
Face Value / Div. per share (`) 10.00 / 0.00
Shares Outstanding (mn) 441.4
Shareholding Pattern (in %) Promoters FIIs DII Others
43.59 3.81 12.35 40.25
Financial Snapshot (`mn)
Y/E Mar FY11 FY12E FY13E FY14E
Net Sales 28,795 39,806 49,542 60,366
EBITDA 627 (4,424) (872) 2,039
PAT 1,012 (4,952) (1,193) 1,128
EPS 2 (12) (3) 3
ROE (%) 13 (47) (11) 11
ROCE (%) 11 (35) (5) 8
P/E 15 (2) (8) 7
EV/EBITDA 23 (3) (18) 6
Share Price Performance
20
40
60
80
100
120
140
Mar
-11
Apr
-11
May
-11
Jun-
11
Jul-
11
Aug
-11
Sep-
11
Oct
-11
Nov
-11
Dec
-11
Jan-
12
Feb-
12
Mar
-12
SpiceJet Ltd BSE SENSEX
Rel. Perf. 1Mth 3 Mths 6Mths 1Yr
SpiceJet (%) (8.4) 37.2 (2.3) (41.1)
SENSEX (%) (3.8) 12.7 3.1 (4.9)
Source: Company data, GEPL Capital Research
Investment Rationale
Macro factors in favour of SpiceJet We believe the current industry dynamics are in favour of SpiceJet given a) projected 16.5% CAGR over FY11-FY15E in the domestic passenger traffic, b) the rising market share of LCCs; a transition that has helped SpiceJet gain market share over the last few years, and c) exit of Kingfisher Red from the LCC segment making it less competitive for the existing players.
Strong operating matrices SpiceJet operations are one of the finest in the industry with a) higher block-hours per aircraft of 11.9 hours in FY11 as compared to its listed peers (9.5-10.5 hours) due to faster turnaround time per flight (25 minutes for LCCs, against 35 minutes for FSCs), b) higher load factors of 82.5% in FY11 vs industry average of 80% despite a 19% Y-o-Y rise in ASKM (listed players average of 14.5%), c) better utilization of seats, d) lower sales and distribution costs than FSCs, from using a relatively cheap reservation system, and e) a single (Boeing 737s) and younger fleet with a single seat configuration resulting in lower maintenance and training expenses. Consequently, SpiceJet had the lowest break-even seat load factor (68.4%) amongst listed players.
Addition of Bombardier into existing fleet to improve operating structure further The company is planning an aggressive fleet addition of 20 Bombardiers by FY14E taking its total fleet size to 62 aircraft by FY14E. Consequently, we expect the Bombardier to add the following benefits: a) SpiceJet would enhance its presence in the non-metros (tier-II and tier-III) cities, b) would enable them to run their fleet on full throttle and expect block hours of 11.5 from them, c) lower sales tax on ATF (4% as compared to 34%), d) exemption from airport landing and navigation charges, and e) lower lease rentals as the Bombardiers would be purchased, reducing the lease rental per aircraft.
Healthy balance sheet
SpiceJet has one of the cleanest balance sheets in the industry with a net debt of just over `4.4 bn following its FCCB conversion for fleet expansion. The healthy balance sheet gives it an edge over other players in terms of a) lower interest charges and hence higher profitability, b) more leverage to fund its expansion plans and working capital with a Debt-equity ratio of 0.3x, and c) stronger ability to withstand economic slowdowns.
Teething issues visible but operations expected to improve The company saw Mr Maran enter as the promoter of the business in June’10. Post this the company witnessed a reshuffle of management and has seen a few teething issues with the new management. Despite the fact that operational efficiencies have declined over the last one year we believe these are just teething issues and should get resolved quickly.
Valuation
SpiceJet with a market share of 15% has a market cap of `10.3 bn valuing the Indian Domestic Aviation industry at a mere ~`68.7 bn. We believe with the strong growth in passenger traffic and a greater pie for LCCs, the company should attract a greater value in the future.
SpiceJet is currently trading at 10.9x FY13E EV/EBITDAR and 7.1x FY14E EV/EBITDAR. We initiate coverage on SpiceJet with a BUY rating and target price of `28.3/share. The target price is based on 7.3x FY14E EV/EBITDAR multiple, at a premium to Asian LCCs and but a discount to Jet Airways due to its operations surrounding only the LCC model.

Equity | India | Aviation
SpiceJet Ltd. March 19, 2012
GEPL Capital Research| Initiating Coverage 35
Investment Rationale Macro factors in favour of SpiceJet
We believe the current trends emerging in the Indian Aviation industry are in favour of LCC’s. With the comparatively low leverage and fleet expansion plans we expect the company to capitalize on the growth opportunities in the industry in the coming years. The company has constantly increased its fleet and hence seen a multi-fold increase in market share from FY05 (4.4%) to FY11 (13.5%) and 15% till date. Consequently, we believe SpiceJet is one of the best bets in the industry and offers a very favourable risk-reward ratio.
Market share improvement Fleet details
7.3
9.210.4
12.613.5
0
2
4
6
8
10
12
14
16
FY07 FY08 FY09 FY10 FY11
%
Fleet Type FY06 FY07 FY08 FY09 FY10 FY11
Boeing 737-900ER 0 0 2 5 5 5
Boeing 737-800 5 11 17 14 15 23
Total 5 11 19 19 20 28
Source: Company data, GEPL Capital Research
Source: Company data, GEPL Capital Research
A. Domestic Passenger traffic to witness 16.5% CAGR in FY11-FY15E The domestic passenger traffic has witnessed a 16.5% CAGR over FY06-FY11 to 54 mn trips. We assume similar growth trend in the future considering a) rising GDP over the next 5 years with a 2.2x multiplier effect, b) improving infrastructure with new airports and expansion of existing airports, and c) rising per capita income in India and comparatively lower rise in ticket prices hence improving the affordability of Indian travelers. With a 16.5% CAGR in FY11-FY15E, we expect the domestic passenger traffic to grow to 99 mn visits.
Domestic passenger traffic in India
62.973.2
85.3
99.3
19.4 25.235.8
44.4 39.5 45.3
54.0
0
20
40
60
80
100
120
FY05
FY06
FY07
FY08
FY09
FY10
FY11
FY12
E
FY13
E
FY14
E
FY15
E
mn
trip
s
-20.0
-10.0
0.0
10.0
20.0
30.0
40.0
50.0
%
Domestic Passenger traffic YoY growth Source: Company data, GEPL Capital Research

Equity | India | Aviation
SpiceJet Ltd. March 19, 2012
GEPL Capital Research| Initiating Coverage 36
B. The rising share of LCCs in the domestic aviation industry
FY04 saw the emergence of the first Indian low-cost carrier (LCC), Air Deccan, followed by three more LCC’s: SpiceJet, Indigo and Go Air by FY07. With affordable pricing, the LCC’s have been able to capture a bigger pie of the Indian domestic aviation market. LCC’s accounted for nearly 45% of the total domestic traffic in FY11 as compared to a mere 16% in FY06. With the rising affordability of air travel and the price sensitivity of Indian travelers we expect the LCCs to command a 56% market share in the domestic aviation industry by FY15E.
LCC share in domestic industry
2.6
4.1
7.7
12.9
13.3
18.1
24.3
30.2
37.4
45.9
56.0
0.0 10.0 20.0 30.0 40.0 50.0 60.0
FY05
FY06
FY07
FY08
FY09
FY10
FY11
FY12E
FY13E
FY14E
FY15E
%
Source: Company data, GEPL Capital Research
C. Exit of Kingfisher Red to benefit competitors like SpiceJet With the rising ATF prices and the lower yields due to competitive pressures, the aviation industry has been making losses. With a mounting debt of `7 bn, kingfisher Airlines decided to shut its LCC business (Kingfisher Red) as per the press conference held by the company on November 22, 2011. ‘Kingfisher Red’ accounted for 75% of the company’s total ASKM and commanded a market share of 19.8% until Sep’11. With the exit from the LCC business, we expect part of the capacity and market share to get distributed amongst the other LCC operators like Indigo, SpiceJet and GoAir with the first two being the biggest beneficiaries.
Consequently we believe SpiceJet should see a stark improvement in its market share. This is clearly visible from the monthly market share data which shows the rising market share of SpiceJet from 13.6% in Aug’11 to 16.3% in Jan’12.
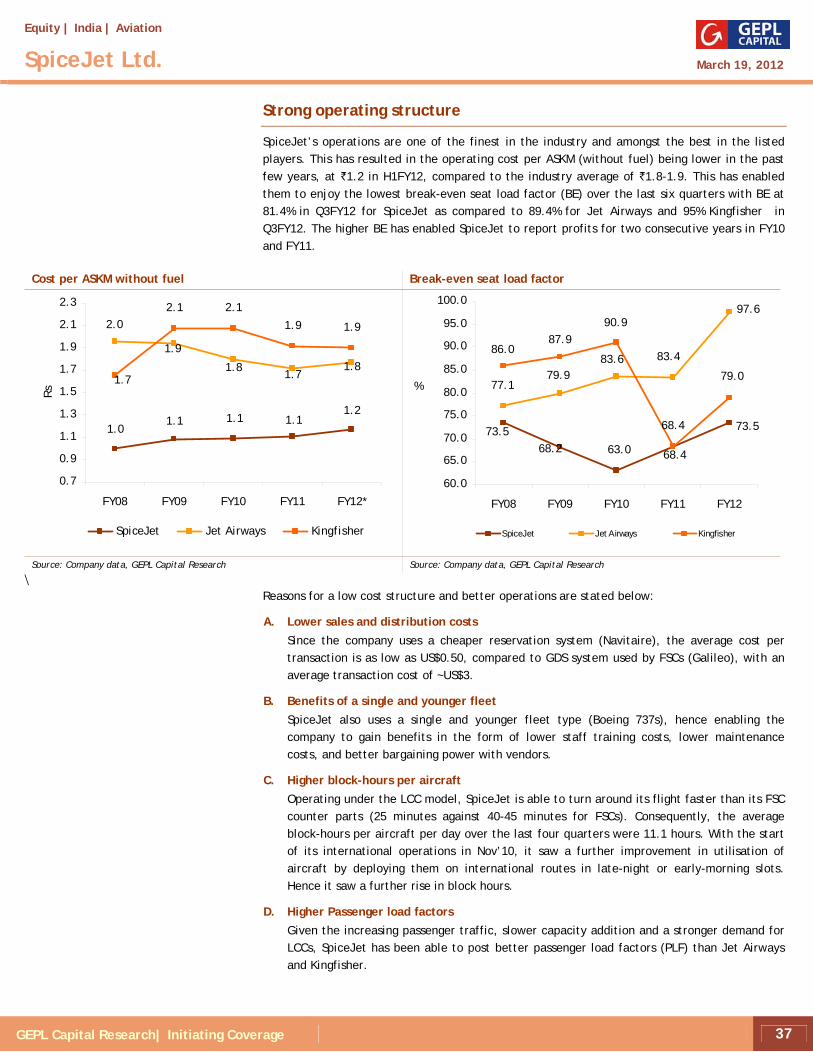
Equity | India | Aviation
SpiceJet Ltd. March 19, 2012
GEPL Capital Research| Initiating Coverage 37
Strong operating structure
SpiceJet’s operations are one of the finest in the industry and amongst the best in the listed players. This has resulted in the operating cost per ASKM (without fuel) being lower in the past few years, at `1.2 in H1FY12, compared to the industry average of `1.8-1.9. This has enabled them to enjoy the lowest break-even seat load factor (BE) over the last six quarters with BE at 81.4% in Q3FY12 for SpiceJet as compared to 89.4% for Jet Airways and 95% Kingfisher in Q3FY12. The higher BE has enabled SpiceJet to report profits for two consecutive years in FY10 and FY11.
Cost per ASKM without fuel Break-even seat load factor
2.1 2.1
1.9 1.9
1.01.1 1.1 1.1
1.2
2.0
1.9
1.81.7
1.81.7
0.7
0.9
1.1
1.3
1.5
1.7
1.9
2.1
2.3
FY08 FY09 FY10 FY11 FY12*
Rs
SpiceJet Jet Airways Kingfisher
68.473.568.2 63.0 68.4
73.5
77.179.9
83.6 83.4
97.6
86.087.9
90.9
79.0
60.0
65.0
70.0
75.0
80.0
85.0
90.0
95.0
100.0
FY08 FY09 FY10 FY11 FY12
%
SpiceJet Jet Airways Kingfisher
Source: Company data, GEPL Capital Research Source: Company data, GEPL Capital Research
\
Reasons for a low cost structure and better operations are stated below:
A. Lower sales and distribution costs
Since the company uses a cheaper reservation system (Navitaire), the average cost per transaction is as low as US$0.50, compared to GDS system used by FSCs (Galileo), with an average transaction cost of ~US$3.
B. Benefits of a single and younger fleet SpiceJet also uses a single and younger fleet type (Boeing 737s), hence enabling the company to gain benefits in the form of lower staff training costs, lower maintenance costs, and better bargaining power with vendors.
C. Higher block-hours per aircraft Operating under the LCC model, SpiceJet is able to turn around its flight faster than its FSC counter parts (25 minutes against 40-45 minutes for FSCs). Consequently, the average block-hours per aircraft per day over the last four quarters were 11.1 hours. With the start of its international operations in Nov’10, it saw a further improvement in utilisation of aircraft by deploying them on international routes in late-night or early-morning slots. Hence it saw a further rise in block hours.
D. Higher Passenger load factors Given the increasing passenger traffic, slower capacity addition and a stronger demand for LCCs, SpiceJet has been able to post better passenger load factors (PLF) than Jet Airways and Kingfisher.

Equity | India | Aviation
SpiceJet Ltd. March 19, 2012
GEPL Capital Research| Initiating Coverage 38
Block hours per aircraft Passenger load factors (PLF)
11.912.1
11.0
11.9
11.110.7
10.09.7
11.1 11.1
9.5
8.99.09.0
10.2
6.0
7.0
8.0
9.0
10.0
11.0
12.0
13.0
FY08 FY09 FY10 FY11 FY12E
Hou
rs
SpiceJet Jet Airways Kingfisher
73.2
66.7
77.6
82.5
77.7
69.5
67.7
77.178.7 78.1
65.0
62.0
71.8
81.0
77.2
60.0
65.0
70.0
75.0
80.0
85.0
FY08 FY09 FY10 FY11 FY12E
%
SpiceJet Jet Airways Kingfisher
Source: Company data, GEPL Capital Research Source: Company data, GEPL Capital Research
E. Better utilization of seats The company adopts a policy of higher seats per aircraft. With 189 seats per aircraft, compared to 180 seats in its competitors’ aircraft (for 737-800), its airplane configuration remains healthier than peers. This has helped SpiceJet enjoy a better capacity utilisation per aircraft.
F. Higher market share per aircraft Due to more block-hours and capacity per aircraft, the company has enjoyed the highest market share per aircraft for the last four years. Its market share per aircraft in FY11 stood at 0.4%, much higher than the industry average of 0.3%.
Capacity per aircraft Market share per aircraft
58.9
78.686.9 85.5
95.993.3
115.1121.3
112.8
138.1
50.060.0
70.080.0
90.0100.0110.0
120.0130.0
140.0150.0
FY07 FY08 FY09 FY10 FY11
capa
city
per
air
craf
t
SpiceJet Industry
0.4
0.40.4
0.5
0.5
0.30.3
0.40.3 0.3
0.0
0.1
0.2
0.3
0.4
0.5
0.6
FY07 FY08 FY09 FY10 FY11
%
SpiceJet Industry
Source: Company data, GEPL Capital Research Source: Company data, GEPL Capital Research
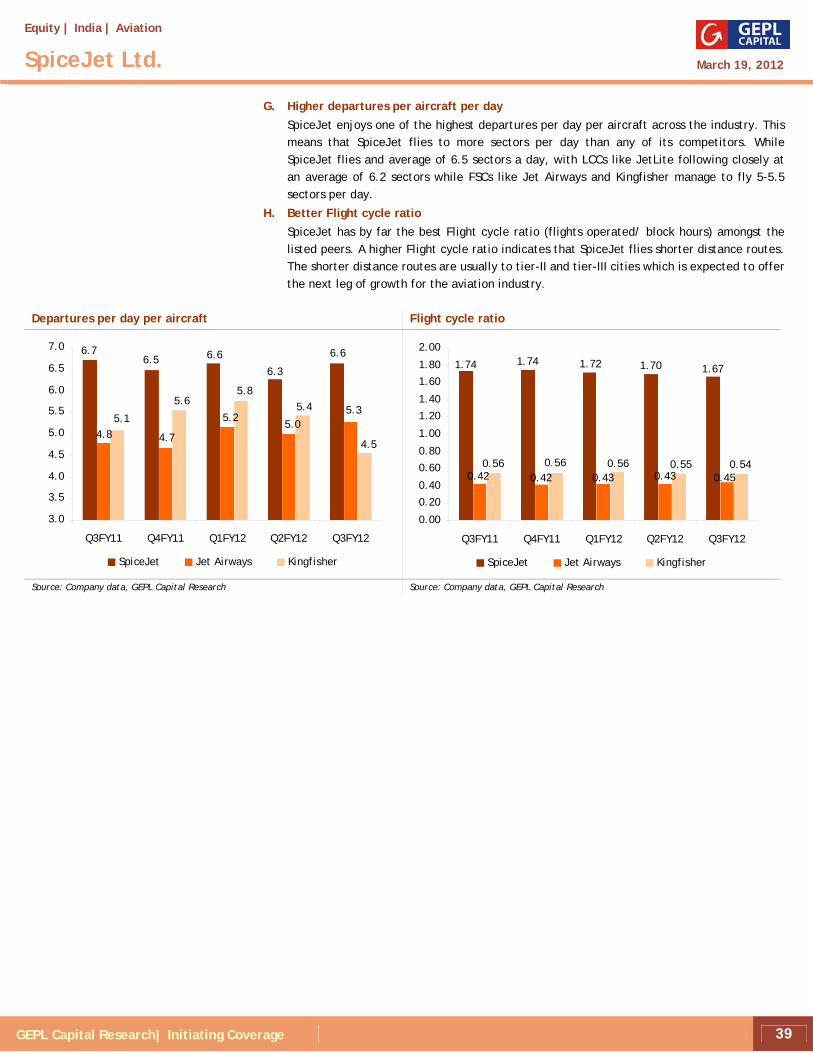
Equity | India | Aviation
SpiceJet Ltd. March 19, 2012
GEPL Capital Research| Initiating Coverage 39
G. Higher departures per aircraft per day
SpiceJet enjoys one of the highest departures per day per aircraft across the industry. This means that SpiceJet flies to more sectors per day than any of its competitors. While SpiceJet flies and average of 6.5 sectors a day, with LCCs like JetLite following closely at an average of 6.2 sectors while FSCs like Jet Airways and Kingfisher manage to fly 5-5.5 sectors per day.
H. Better Flight cycle ratio SpiceJet has by far the best Flight cycle ratio (flights operated/ block hours) amongst the listed peers. A higher Flight cycle ratio indicates that SpiceJet flies shorter distance routes. The shorter distance routes are usually to tier-II and tier-III cities which is expected to offer the next leg of growth for the aviation industry.
Departures per day per aircraft Flight cycle ratio
6.76.5 6.6
6.3
6.6
4.74.8
5.25.0
5.35.1
5.65.8
5.4
4.5
3.0
3.5
4.0
4.5
5.0
5.5
6.0
6.5
7.0
Q3FY11 Q4FY11 Q1FY12 Q2FY12 Q3FY12
SpiceJet Jet Airways Kingfisher
1.74 1.74 1.72 1.70 1.67
0.42 0.43 0.43 0.450.420.56 0.56 0.56 0.55 0.54
0.00
0.20
0.40
0.60
0.80
1.00
1.20
1.40
1.60
1.80
2.00
Q3FY11 Q4FY11 Q1FY12 Q2FY12 Q3FY12
SpiceJet Jet Airways Kingfisher
Source: Company data, GEPL Capital Research Source: Company data, GEPL Capital Research

Equity | India | Aviation
SpiceJet Ltd. March 19, 2012
GEPL Capital Research| Initiating Coverage 40
Benefits of Bombardier into existing fleet
The company currently has an average fleet of 36.7 aircraft as of Q3FY12 and plans to add more than ~25 aircraft (15 Bombardiers and 10 Boeing 737-800s) over the next three years. The Bombardiers which are deliverable till June CY13 would be owned by the company. This would result in a higher gross block and depreciation for the company. Moreover, since the aircraft are debt funded with a 5% interest rate from Export Credit of Canada, the new arrangement would result in an increase in interest outflow. However, there are various benefits attached with the entry of Bombardiers into SpiceJet’s fleet such as:
A. Rising presence in the growing tier-II and tier-III cities
The smaller capacity 78 Bombardier aircraft would be deployed on domestic routes and should help improve its presence in the tier-II and tier-III cities. We expect this to be beneficial for the company as tier-II and tier-III cities have witnessed a 21% CAGR in passenger traffic while the metros registered an 18% CAGR and the Mumbai-Delhi routes registered a 15% CAGR Over CY05-CY10.
B. Higher Block hours
We expect a faster turnaround time due to Bombardier aircraft with an average turnaround time of 15 minutes as compared to 25 minutes for Boeing 737s and an average of 40 minutes for FSCs. Hence, we expect the fleet to run at full throttle and expect block hours of over 11.5 hour’s time frame. With a rising share of Bombardiers in the total ASKM, we expect the overall blocks hours to improve and boost operations.
C. Lower ATF taxes
The biggest benefit of the Bombardier would be the savings on ATF taxations. Currently, a sales tax on ATF varies from 4-33% and varies from state to state. However, aircrafts with 80 seats or less are exempt from such high sales tax rates and pay a flat 4% sales tax. Bombardiers, with a 78 seat capacity would hence be liable to pay a lower sales tax on ATF. With a 25% contribution to ASKMs From the Bombardier fleet by FY14E, we expect the blended sales tax rate to drop hence providing significant benefits to the company’s financials.
D. Lower landing and navigation charges
Aircraft with less than 80 seats are exempt from airport landing and navigation charges. Since SpiceJet would operate 30 Bombardier aircraft, with a 78-seat configuration, it would qualify for these exemptions and reduce its overall landing and navigation charges.
E. Lower lease rentals per aircraft
Lease rentals per aircraft have been on a constant decline from `52.7 mn in Q1FY10 to `44.9 mn in Q2FY12. With the purchase of the Bombardier aircraft we expect the lease rentals per aircraft to reduce significantly and partially negate the higher interest and depreciation expenses. The management believes this model is more economical than the leasing model.
Consequently, the management is confident to achieve breakeven on these routes in a shorter period of time as compared to other routes, as it foresees pricing power on these routes in the near future.

Equity | India | Aviation
SpiceJet Ltd. March 19, 2012
GEPL Capital Research| Initiating Coverage 41
Healthy balance sheet
SpiceJet has one of the cleanest balance sheets in the industry with a debt of ~`4.4 bn following its FCCB conversion for fleet expansion. The healthy balance sheet gives it an edge over other players in terms of a) lower interest charges, b) expandable leverage to fund further expansion plans, and c) stronger ability to withstand economic slowdowns. Hence, we expect SpiceJet to outperform its peers with a healthy balance sheet and good growth momentum.
Net debt position Cash flows from operations
(0.1)(1.1)
3.5
6.7
4.6
(2.0)
(1.0)
0.0
1.0
2.0
3.0
4.0
5.0
6.0
7.0
8.0
FY10 FY11 FY12E FY13E FY14E
Rs
bn
3.1
(2.3)(3.0)
0.0
3.2
(4.0)
(3.0)
(2.0)
(1.0)
0.0
1.0
2.0
3.0
4.0
FY10 FY11 FY12E FY13E FY14E
Rs
bn
Source: Company data, GEPL Capital Research Source: Company data, GEPL Capital Research
Interest outflows Interest coverage ratio
113.8 112.0
435.0471.5
381.5
0.0
50.0
100.0
150.0
200.0
250.0
300.0
350.0
400.0
450.0
500.0
FY10 FY11 FY12E FY13E FY14E
Rs
mn
5.9
9.7
(10.4)
(1.7)
3.8
(15.0)
(10.0)
(5.0)
0.0
5.0
10.0
15.0
FY10 FY11 FY12E FY13E FY14E
Source: Company data, GEPL Capital Research Source: Company data, GEPL Capital Research

Equity | India | Aviation
SpiceJet Ltd. March 19, 2012
GEPL Capital Research| Initiating Coverage 42
Teething issues visible but operations expected to improve
The company saw Mr Maran entered as the promoter of the business in June’10. Post the entry of Mr Maran the entire top management has seen a re-shuffle with a slew of exits like the AVP and CCO of the company. The rejig in its management has had its share of impact on the operations of the company with SpiceJet witnessing a decline in its block hours per aircraft and PLF in H1FY12 as compared to the previous few H1. Due to the lower operations the company witnessed a high non-fuel cost per ASKM in H1FY12 and a higher break-even seat load factor.
Despite the fact that operational efficiencies had declined in H1FY12, the operations have seen a strong bounce back in Q3FY12. We believe the decline in H1FY12 was just teething issues and the company should emerge as a stronger player over the next few quarters with the entry of Bombardier into its fleet.
Block hours per aircraft Passenger load factors (%)
12.012.2
11.1 11.1
10.410.610.811.011.2
11.411.611.812.012.212.4
H1F
Y09
H1F
Y10
H1F
Y11
H1F
Y12
Hou
rs
75.480.8
63.0
73.2
30.0
40.0
50.0
60.0
70.0
80.0
90.0
H1F
Y09
H1F
Y10
H1F
Y11
H1F
Y12
%
Source: Company data, GEPL Capital Research Source: Company data, GEPL Capital Research
Non-fuel cost per ASKM Break even seat load factor (%)
1.2
1.3
1.2
1.1
1.0
1.0
1.1
1.1
1.2
1.2
1.3
1.3
1.4
H1F
Y09
H1F
Y10
H1F
Y11
H1F
Y12
Rs
/ A
SKM
83.0
78.0
92.0
86.0
70.0
75.0
80.0
85.0
90.0
95.0
H1F
Y09
H1F
Y10
H1F
Y11
H1F
Y12
%
Source: Company data, GEPL Capital Research Source: Company data, GEPL Capital Research

Equity | India | Aviation
SpiceJet Ltd. March 19, 2012
GEPL Capital Research| Initiating Coverage 43
Financial overview
Revenues to witness a 28% CAGR in FY11-FY14E
We expect 28% CAGR in revenue in FY11-FY14E to `60.4 bn, driven by 19.5% CAGR in RPKM from 8.64 bn in FY11 to 14.7 bn in FY14E and 7% CAGR in passenger yield (revenue/RPKM), from `3.3 in FY11 to `4.1 in FY14E.
We expect the ASKM to witness a 23% CAGR in FY11-FY14E driven by 21% CAGR in seat capacity as the number of aircraft rise from 28 in FY11 to 62 in FY14E with the addition of ~20 Bombardiers and 14 Boeing 737s. We expect a marginal decline in the Passenger Load Factors (PLF), with a marginally higher seat addition than the industry demand (+16.5%). However, given the strong demand for LCCs we expect the PLF to remain above 75% over the next two years.
ASKM, RPKM and PLF Revenue per RPKM and Revenue per ASKM
77.6
82.5
76.077.0
76.0
0.0
5.0
10.0
15.0
20.0
25.0
FY10
FY11
FY12
E
FY13
E
FY14
E
bn
55.0
60.0
65.0
70.0
75.0
80.0
85.0
%
ASKM RPKM PLF
3.5
3.2
3.3
3.7
3.9
4.0
3.2
3.3
3.8
3.8
3.0
3.2
3.4
3.6
3.8
4.0
4.2
FY10 FY11 FY12E FY13E FY14E
Rs
Revenue per RPKM Revenue per ASKM Source: Company data, GEPL Capital Research Source: Company data, GEPL Capital Research
Higher ATF prices to impact cost structure ATF prices have seen a sharp surge over the last one year. Led by the Middle East crisis ATF prices have surged by 62% since Oct’10. Post an improvement in the scenario as well, ATF prices have refused to decline and with the falling rupee and stubborn Brent crude prices, ATF prices have risen by 332% in CY11 and 13% in CY12.
The cost structure of airlines, which operate on thin margins have hence gone for a toss given the fact that fuel costs account for over 50% of the total costs. With the surge, airlines across India are finding it difficult to break-even on an operational basis. This is visible in the cost structure where by the ASKM (ex-fuel) has risen from `1.1 in Q1FY11 to `1.6 in Q3FY12. We expect a 32% CAGR in fuel costs over FY11-FY14E for SpiceJet despite the entry of Bombardiers which should help it benefit from lower sales tax on ATFs.

Equity | India | Aviation
SpiceJet Ltd. March 19, 2012
GEPL Capital Research| Initiating Coverage 44
ATF prices Cost per ASKM (with and without fuel)
40.7
48.8
54.9
60.6
66.165.064.6
56.258.6
44.6
62.7
40.0
45.0
50.0
55.0
60.0
65.0
70.0
Oct
-10
Nov
-10
Dec-
10
Jan-
11
Feb-
11
Mar
-11
Apr-
11
May
-11
Jun-
11
Jul-
11
Aug-
11
Sep-
11
Oct
-11
Nov
-11
Dec-
11
Jan-
12
Feb-
12
Mar
-12
Rs/l
itre
2.02.3
2.8 2.7 2.6
1.1 1.1 1.2 1.2 1.2
0.5
1.0
1.5
2.0
2.5
3.0
FY10 FY11 FY12E FY13E FY14E
Rs
Cost per ASKM (with fuel)
Cost per ASKM (without fuel) Source: HPCL<BPCL, GEPL Capital Research Source: Company data, GEPL Capital Research
EBITDAR and EBITDA to witness a 26% and 48% CAGR over FY11-FY14E
With the surge in ATF prices we expect the company to witness a 100bps decline in EBITDAR but the overall EBITDA margin is expected to improve by 120bps over FY11-14E led by a) lower proportionate rise in landing and navigation expenses due to Bombardiers which are exempt from these charges, b) lower rise in commission expenses with the commission rate offered to travel operators declining, c) operational efficiencies and economies of scale which should help curtail other operating expenses, and d) lower lease rentals per aircraft as Bombardiers would be owned by SpiceJet.
Hence, despite the EBITDAR margin declining by 40bps over FY11-14E and the EBITDAR registering a 26% CAGR, we expect the EBITDA to witness a higher CAGR of 48% for the same period. We hence expect the company to witness a sharp rebound in operations over the next three years and report a profit in FY14E. However, the FCCB loans for funding of Bombardier fleet purchase should result in higher interest outflows and a higher gross block resulting in higher depreciation. We thus expect the company to report a marginally lower CAGR in profits of 4% over FY11-14E to `1.13 bn.
EBITDAR margin and EBITDA margin Net Profit
3.3
18.817.1
11.8
16.1
(11.1)
0.9 2.2
(1.8)
3.4
(15.0)
(10.0)
(5.0)
0.0
5.0
10.0
15.0
20.0
25.0
FY10 FY11 FY12E FY13E FY14E
%
EBITDAR margin EBITDA margin
6141,012
(854)
1,128
(3,526) (3,650)(4,000)
(3,000)
(2,000)
(1,000)
0
1,000
2,000
FY09
FY10
FY11
FY12
E
FY13
E
FY14
E
Rs
mn
Source: Company data, GEPL Capital Research Source: Company data, GEPL Capital Research

Equity | India | Aviation
SpiceJet Ltd. March 19, 2012
GEPL Capital Research| Initiating Coverage 45
Key Risks
• Fuel costs beyond airlines’ control Aviation turbine fuel (ATF) prices account for 40-45% of an airline’s total revenue. A sharp increase in the ATF prices have dented margins and led to losses across the industry. Any further price rise could result in a significant net loss and hence erosion of net worth for the company.
• Change in landing and navigation charge regulations
Currently, aircraft with less than 80 seat capacity are exempt from airport landing and navigation charges. SpiceJet is adding further Bombardier aircraft, with a 78-seat configuration, to its fleet, which qualify for these exemptions. Any change in these policies could lead to higher taxes and so affect future earnings.
• Yields stagnating
Any sharp increase in competitive intensity (in times of low passenger traffic or excess expansion by airlines) could adversely affect the load factors and passenger yields, reducing margins
• Rates and currency fluctuations A stronger dollar may affect SpiceJet’s profitability, as a large part of the company’s costs are dollar denominated, like lease rentals, ATF cost and maintenance costs. In addition, the debt for new aircraft is also in dollars; hence, a stronger dollar could hit earnings.
• Highly fixed-cost intensive The airline industry is highly fixed-cost intensive with lease rentals, maintenance and employee costs remaining fixed. Any reduction in passenger traffic can adversely affect the profitability.
• Downturn in the economy
Any downturn in the economy could lead to relatively low passenger traffic growth, which could have a negative impact on load factors, and could eventually have a negative impact on profitability.
• External factors There are many external factors which can affect profitability, which include bad weather conditions, terrorist activities, country and state policies and others.

Equity | India | Aviation
SpiceJet Ltd. March 19, 2012
GEPL Capital Research| Initiating Coverage 46
Valuations
SpiceJet with a market share of 15% has a market cap of `10.3 bn valuing the Indian Domestic Aviation industry at a mere ~`68.7 bn. We believe with the strong growth in passenger traffic and a greater pie for LCCs, the company should attract a greater value in the future.
SpiceJet is currently trading at 10.9x FY13E EV/EBITDAR and 7.1x FY14E EV/EBITDAR. We initiate coverage on SpiceJet with a BUY rating and target price of `28.3/share. The target price is based on 7.3x FY14E EV/EBITDAR multiple, at a premium to Asian LCCs and but a discount to Jet Airways due to its operations surrounding only the LCC model.
One-year forward EV/Sales
0
20
40
60
80
100
120Ju
n-07
Sep-
07
Dec-
07
Mar
-08
Jun-
08
Sep-
08
Dec-
08
Mar
-09
Jun-
09
Sep-
09
Dec-
09
Mar
-10
Jun-
10
Sep-
10
Dec-
10
Mar
-11
Jun-
11
Sep-
11
Dec-
11
Mar
-12
Price 1.0x 3.0x 5.0x 7.0x Source: Bloomberg, GEPL Capital Research
One-year forward EV/EBITDAR
0
10
20
30
40
50
60
70
80
90
100
Jun-
07
Sep-
07
Dec-
07
Mar
-08
Jun-
08
Sep-
08
Dec-
08
Mar
-09
Jun-
09
Sep-
09
Dec-
09
Mar
-10
Jun-
10
Sep-
10
Dec-
10
Mar
-11
Jun-
11
Sep-
11
Dec-
11
Mar
-12
Price 5.0x 15.0x 25.0x 35.0x
Source: Bloomberg, GEPL Capital Research

Equity | India | Aviation
SpiceJet Ltd. March 19, 2012
GEPL Capital Research| Initiating Coverage 47
Sensitivity Analysis
1% PLF rise enough to negate US$3/bbl hike in Brent crude
Contrary to the common notion, we believe a company’s profitability is more linked to the PLF and the yields than the ATF prices. As per our analysis a 1% rise in PLF should result in the EBITDAR of SpiceJet for FY13E rising by 9.1% much higher than the impact of a US$1/bbl rise in prices which will impact EBITDAR by -3%. Hence we conclude that a 1% rise PLF is enough to negate a US$3/bbl rise in Brent crude prices.
`0.3 hike in yields is sufficient to negate `1 depreciation
Similarly we analyze that `0.1 rise in yields can positively impact the EBITDAR of SpiceJet by 2.6% while a `1 appreciation in the rupee will result in an EBITDAR growth of 8.5% for SpiceJet in FY13E. Hence `0.33 rise in yields is more than sufficient to combat `1 depreciation in the rupee.
FY13E EBITDAR impact of crude and dollar
Brent crude (US$/bbl) Rupee dollar rate
110 115 120 125
46 7,242 6,355 5,468 4,581
48 6,249 5,324 4,398 3,473
50 5,256 4,292 3,328 2,364
52 4,264 3,261 2,258 1,256 Source: Company data, GEPL Capital Research
FY13E EBITDAR impact of yield and PLF
PLF Yield
77 78 79 80
3.8 3,889 4,403 4,907 5,411
3.9 4,869 5,386 5,902 6,419
4.0 5,839 6,368 6,898 7,427
4.1 6,869 7,351 7,893 8,435 Source: Company data, GEPL Capital Research

Equity | India | Aviation
SpiceJet Ltd. March 19, 2012
GEPL Capital Research| Initiating Coverage 48
Income Statement Y/E Mar (`mn) FY10(A) FY11(A) FY12(E) FY13(E) FY14(E)
Total net revenues 21,811 28,795 39,806 49,542 60,366
Fuel Cost 8,142 12,262 21,946 24,235 28,312
Gross Profit 13,669 16,533 17,860 25,307 32,055
Employee Cost 1,814 2,406 3,737 4,859 5,830
Other Expenditure 7,754 9,215 12,802 14,609 16,487
EBITDAR 4,100 4,912 1,320 5,839 9,738
EBITDAR Margin (%) 19 17 3 12 16
Lease Rental 3,898 4,285 5,744 6,712 7,699
EBITDA 202 627 (4,424) (872) 2,039
EBITDA Margin (%) 1 2 (11) (2) 3
Depreciation 76 89 306 352 522
Other Income 610 811 212 240 240
Interest (Net) 114 112 435 471 381
PBT 622 1,237 (4,952) (1,455) 1,376
PBT Margin (%) 5 7 (28) (6) 4
Tax 64 247 0 (262) 248
Minority Interest 0 0 0 0 0
Adjusted PAT 558 989 (4,952) (1,193) 1,128
Extraordinary /exc. 56 23 0 0 0
Reported PAT 614 1,012 (4,952) (1,193) 1,128
Balance Sheet Y/E Mar (`mn) FY10(A) FY11(A) FY12(E) FY13(E) FY14(E)
Equity capital 2,419 4,054 4,283 4,283 4,283
Reserves & Surplus (5,901) (895) (5,848) (7,041) (5,911)
Preference Capital 61 0 0 0 0
Net worth (3,422) 3,158 (1,564) (2,758) (1,628)
Minority interest 0 0 0 0 0
Deffed tax liability 0 0 0 0 0
Total debt 4,383 858 4,358 7,858 6,358
Total Liabilities & Equity 961 4,016 2,793 5,100 4,730
Net block 670 853 2,048 4,696 5,174
Capital WIP 3,249 6,114 6,114 6,114 6,114
Total fixed assets 3,919 6,968 8,162 10,810 11,288
Investments 4 0 0 0 0
Goodwill 0 0 0 0 0
Current Assets 5,971 4,094 3,552 4,349 5,605
Inventories 147 204 229 339 413
Debtors 190 172 240 312 380
Cash & bank 4,507 1,922 902 1,186 1,752
Loans & advances 1,128 1,797 2,181 2,511 3,060
Other Current Assets 0 0 0 0 0
Current Liab. & Prov. 8,929 7,052 8,921 10,060 12,163
Creditors 1,548 2,536 3,454 3,936 4,554
Other liabilities 5,873 4,433 5,467 6,385 7,361
Provisions 1,507 83 0 (262) 248
Net Working capital 0 0 0 0 0
Miscellaneous Exp (4) (8) 0 0 0
Total Assets 961 4,016 2,793 5,100 4,730
Key Ratio Y/E Mar (`mn) FY10(A) FY11(A) FY12(E) FY13(E) FY14(E) Per Share Ratios Fully diluted E P S 2.5 2.5 (11.6) (2.8) 2.9 Book Value (14.1) 7.8 (3.7) (6.4) (4.2) Dividend per share 0.0 0.0 0.0 0.0 0.0 per share FCFF 2.9 2.7 (10.8) (2.0) 4.2 Valuation Ratio P/E 22.4 15.3 (1.9) (7.8) 7.5 P/BV (4.0) 4.9 (5.9) (3.4) (5.2) EV/EBITDA 67.3 23.1 (2.9) (18.3) 6.4 EV/Sales 0.6 0.5 0.3 0.3 0.2 Price/ FCFE per share 19.9 14.1 (2.0) (11.0) 5.1 Growth Ratios Sales Growth 29.1 32.0 38.2 24.5 21.8 EBITDA Growth NM 210.3 NM NM NM Net Profit Growth NM 64.8 NM NM NM EPS Growth NM (4.8) NM NM NM Common size Ratios Gross Margin 62.7 57.4 44.9 51.1 53.1 EBITDA Margin 0.9 2.2 (11.1) (1.8) 3.4 PAT Margin 2.8 3.5 (12.4) (2.4) 1.9 Employee Cost 8.3 8.4 9.4 9.8 9.7 Ad spend 35.6 32.0 32.2 29.5 27.3 Return ratios RoAE 13.1 13.3 (47.2) (11.3) 10.6 RoACE 7.2 10.6 (34.5) (4.8) 8.1 Turnover ratios (days) Debtors ( Days) 2.6 2.3 1.9 2.0 2.1 Creditors ( Days) 26.3 26.5 24.7 26.8 26.6 Inventory (Days) 2.3 2.2 2.0 2.1 2.3 Net working capital (40.9) (37.5) (38.2) (40.8) (37.1) Solvency Ratios Total Debt/Equity (1.3) 0.3 (2.8) (2.8) (3.9) Interest coverage 5.9 9.7 (10.4) (1.7) 3.8
Source: Company data, GEPL Capital Research
Cash Flow Y/E Mar (`mn) FY10(A) FY11(A) FY12(E) FY13(E) FY14(E) PBT 622 1,237 (4,952) (1,455) 1,376
Add: Depreciation 76 89 306 352 522
Add: Interest expense 114 112 435 471 381
Less: Other Income (610) (811) (212) (240) (240)
Other Adjustments 56 23 0 0 0
Change in working capital 2,450 (2,584) 1,390 626 1,414
Taxes paid 64 247 0 (262) 248
CF from operations 2,772 (1,687) (3,034) (508) 3,701
Change in fixed assets (1,467) (3,152) (1,486) (3,000) (1,000)
Changes in Intangible Asset 0 0 0 0 0
Change in investments 0 4 0 0 0
Other income 610 811 212 240 240
CF from investing acti. (857) (2,337) (1,274) (2,760) (760)
Change in debt (505) (3,525) 3,500 3,500 (1,500)
Change in Equity capital (176) 5,751 230 0 0
Changes in Pref. capital 0 0 0 0 0
Dividend & dividend tax 0 0 0 0 0
Interest paid (114) (112) (435) (471) (381)
Other Adjustments 0 0 0 0 0
CF from financing acti. (795) 2,114 3,295 3,029 (1,881)
Change in cash 1,427 (2,584) (1,021) 285 564
Opening cash 3,080 4,507 1,922 902 1,186
Closing cash 4,507 1,922 902 1,186 1,752
Du-Pont Analysis (%) FY10(A) FY11(A) FY12(E) FY13(E) FY14(E) Net Profit Margin 2.8 3.5 (12.4) (2.4) 1.9 Asset Turnover 22.7 7.2 14.3 9.7 12.8 Leverage (0.3) 1.3 (1.8) (1.8) (2.9) ROE 13.1 13.3 (47.2) (11.3) 10.6

Equity | India | Aviation
Kingfisher Airlines Ltd.
Kingdom under threat March 19, 2012
SELL
Analyst Sunil Sewhani
+91-22- 6614 2690 [email protected] GEPL Capital Research 49
Initiating Coverage
CMP (`) Target (`)
20.75 16.0
Potential Upside Absolute Rating
-30% SELL
Market Info (as on 16th March, 2012)
BSE Sensex 17466
Nifty S&P 5317
Stock Detail
BSE Group B
BSE Code 532747
NSE Code KFA
Bloomberg Code KAIR IN
Market Cap (`bn) 11.98
Free Float (%) 50%
52wk Hi/Lo 49.25 / 17.55
Avg. Daily Volume (NSE) 7410392
Face Value / Div. per share (`) 10.00 / 0.00
Shares Outstanding (mn) 577.6
Shareholding Pattern (in %) Promoters FIIs DII Others
50.51 0.34 20.34 28.31
Financial Snapshot (`mn)
Y/E Mar FY10 FY11 FY12E FY13E
Net Sales 62,334 66,947 68,891 72,312
EBITDA (1,219) (6,294) 304 3,867
PAT (10,273) (14,151) (10,705) (9,510)
EPS (21) (28) (22) (19)
ROE (%) (73) (59) (45) (40)
ROCE (%) (1) (5) (0) 2
P/E (2) (1) (1) (1)
EV/EBITDA (74) (14) 322 28
Share Price Performance
20
40
60
80
100
120
140
Mar
-11
Apr
-11
May
-11
Jun-
11
Jul-
11
Aug
-11
Sep-
11
Oct
-11
Nov
-11
Dec
-11
Jan-
12
Feb-
12
Mar
-12
Kingfisher Airlines BSE SENSEX
Rel. Perf. 1Mth 3 Mths 6Mths 1Yr
KFA (%) (23.0) (4.8) (19.6) (49.1)
SENSEX (%) (3.8) 12.7 3.1 (4.9)
Source: Company data, GEPL Capital Research
Investment Rationale
Exit from LCC segment to harm operations Kingfisher Airlines (KFA) which has been saddling with losses announced its exit from the LCC model in Sept’11. With the scrapping of its no-frill segment- ‘Kingfisher Red’, all of Kingfisher’s Airbus aircraft are expected have a first class with incremental seats in economy segment. We expect this move to have the following impact: a) marginal reduction in ASKM due to first class seating, b) rise in yields with only full service seats and first class seats, and c) lower Passenger Load Factor (PLF) due to the rise in fares and cost consciousness of Indian consumers.
Lower operational efficiencies visible
KFA had a PLF of 81% in FY11 (listed player’s = 80%). Similarly, its yields at `4.85 in FY11 were the highest (Jet= `3.9 and SpiceJet= `3.3). However, over the last few quarters the operational matrices for KFA have shown a steady decline with PLF at 79.3% in H1FY12 and the yields remaining flat at `4.86. The company also has one of the lowest block hours per aircraft at 10.2 in H1FY12 and 9.54 in FY11 (listed players= 11.2 and 10.7 respectively). The lower operations and rise in fuel costs have resulted in the breakeven seat load factor rising to 89% in H1FY12 (Jet airways= 76% and SpiceJet = 88%) as compared to 78.6% in FY11.
Debt reduction a must for survival but uncertainty over quantum and time remains The acquisition of Air Deccan in FY08, economic slowdown in FY09, fuel surge due to the middle East crisis in FY11, and recurring net losses, have led to a mounting debt of `70.5 bn in FY11 from `9.3 bn in FY08. The high debt resulted in an interest outflow of `11 bn and `13 bn in FY10 and FY11 respectively. Considering the huge interest outflow and surge in debt, KFA has decided to restructure its debt by selling a 25% stake sale to banks.
However, the debt portion remains high as the company is looking to a) convert part of its loans into equity, b) propose a preferential issue to investors, c) change the lease agreement terms, and d) selling property; in order to slash its debt by more than half.
High debt leading to arrays of problems
Given the net losses and mounting debts KFA has been fighting for survival over the last six months now with the following issues cropping up: a) fleet reduction to 62 aircraft vs 66 in FY11 which should result in lower ASKMs, b) lower flight schedules due to non-payment of salaries to employees and OMCs, c) freezing of accounts by IT department due to unpaid TDS, and d) inclusion with One-World put on hold along with the exclusion from IATA and the tie-up with British Airways coming to a stop. All these factors should significantly impact revenues and profitability going forward if the company manages to sustain. With the lease of the older aircrafts expiring we expect the ASKM to decline further.
Approval of ATF imports no major reason for cheer
KFA has asked the ministry to allow ATF imports and also pushed for FDI in aviation. However we believe that the ATF imports is hardly any benefit for the bleeding airline operator and even if FDI was approved it would be difficult for KFA to find a suitable buyer.
Valuation
KFA is currently trading at 17.1x its FY13E EV/EBITDAR and 13.3x its FY14E EV/EBITDAR. This is a significant premium to the other listed players in the Indian aviation industry like SpiceJet (trading at 10.9x its FY13E EV/EBITDAR) and Jet Airways (trading at 10.0x its FY13E EV/EBITDAR). Given a) the huge debt on books, b) fleet reduction and ASKM reduction, and c) deteriorating operations, we believe the premium is highly unjustified. Consequently, we initiate coverage on Kingfisher Airlines with SELL rating and target price of `16 per share.

Equity | India | Aviation
Kingfisher Airlines Ltd. March 19, 2012
GEPL Capital Research| Initiating Coverage 50
Investment Rationale Exit from LCC segment to harm operations
KFA has been saddled with losses since inception led by a) the long break-even period in the industry, b) acquisition of Air Deccan which led to a slower turnaround, c) global slowdown in economy which impacted air traffic, and d) Middle-East crisis leading to a surge in crude prices. All these factors have led to the accumulated losses of KFA exceeding `60 bn since its inception. To add to the woes, the high debt and interest outflow has been a major burden on the cash flows and led to erosion of net worth.
Consequently, in a move to restructure the airlines and cut losses and debts and reduce the working capital requirements, the company announced its plans to exit from its no-frills model of operations branded as ‘Kingfisher Red’.
Impact of exit from LCC business
With the exit of KFA from the LCC model, we expect the company to face the following impacts on its operations and financials
A. Yields to rise significantly in FY13E
We expect the yields to rise significantly driven by the fact that FSCs command a higher yield than LCCs in general. Considering the premium brand value and perception of KFA being a five-star airline, we expect KFA to be no exception to the rule. KFA already enjoys the highest yield in the industry and we believe the move to let go of the LCC segment would result in higher yields in the future. Moreover, the fact that business class and first class seating commands a 2-4x higher yield than economy class seating we expect the yields to rise by at least 7.5% in FY13E.
B. Break-even seat load factor to improve
We agree with the management that the cost differential between the LCC and FSC model in India is not high as is explained by the cost/ASKM (ex-fuel) for Jet Airways and JetLite. This is also reflected by the fact that unlike other countries, we use the same airports and infrastructure facilities for LCCs and FSCs.
Considering the marginal cost differential and the high ATF taxes it is more difficult for players to sustain margins and we believe FSCs are better placed in an event of a downturn due to the higher yields. We hence believe, the higher yields should result in reduction in the break-even seat load factor for the airline.
KFA enjoys the best yields in the industry Cost/ASKM (ex-fuel) for Jet and JetLite
4.55.1
4.6 4.7
3.6 3.8 3.64.1
3.2 3.7 3.54.1
0.0
1.0
2.0
3.0
4.0
5.0
6.0
Q4FY11 Q1FY12 Q2FY12 Q3FY12
Rs
Kingfisher Jet Airways SpiceJet
1.71.6
1.71.9
1.61.4 1.4
1.3
0.5
0.7
0.9
1.1
1.3
1.5
1.7
1.9
2.1
Q4FY11 Q1FY12 Q2FY12 Q3FY12
Rs
Jet (standalone) JetLite
Source: Company data, GEPL Capital Research Source: Company data, GEPL Capital Research

Equity | India | Aviation
Kingfisher Airlines Ltd. March 19, 2012
GEPL Capital Research| Initiating Coverage 51
These are some of the benefits associated with the exit of the LCC segment. However, the downsides to this move seems to far more outweigh the positives and include:
A. ASKM to reduce significantly with seat configuration Kingfisher Red accounted for 75% of the company’s total ASKM in FY11. With the exit of KFA from its LCC model, we expect the company to re-configure seats in the economy class. The move to exit will also result in KFA adding ‘first class’ seats to its Airbus aircraft. Since the company operates 35 airbus (total fleet 62), the average seat capacity should reduce thereby leading to lower ASKMs for the company.
ASKM to reduce due to 75% contribution from Kingfisher Red
Kingfisher
First
2% Kingfisher
Class
23%
Kingfisher
Red
75%
Source: Company data, GEPL Capital Research
B. PLF and block hours to decline Despite the high brand image of the company, we expect the PLF to decline due to the higher pricing of FSCs and the pricing consciousness of Indian travelers. This is in-line with the historical trend seen where FSCs command a lower PLF than LCCs.
Similarly, we expect the block hours per day per aircraft for KFA to decline due to the historically faster turnaround of LCCs as compared to FSCs. The average turnaround time for an LCC carrier is 25 minutes compared to 35 minutes for FSCs.
PLF lower for FSCs than LCCs
73.0 74.6 72.1 75.277.1 80.1 74.7 78.6
20.5
40.5
60.5
80.5
100.5
Q4FY11 Q1FY12 Q2FY12 Q3FY12
%
Jet (domestic) Jet Lite
Source: Company data, GEPL Capital Research

Equity | India | Aviation
Kingfisher Airlines Ltd. March 19, 2012
GEPL Capital Research| Initiating Coverage 52
C. KFA would lose out on the growing LCC share in the domestic aviation industry LCC’s accounted for nearly 45% of the total domestic traffic in FY11 as compared to a mere 16% in FY06. With the rising affordability of air travel and the price sensitivity of Indian travelers we expect the LCCs to overtake FSCs and command a 56% market share in the domestic aviation industry by FY15E.
LCCs capturing a greater share of the domestic aviation industry
2.64.1
7.712.913.3
18.124.3
30.2
37.445.9
56.0
0 10 20 30 40 50 60
FY05FY06FY07FY08FY09
FY10FY11
FY12EFY13EFY14EFY15E
%
Source: DGCA, GEPL Capital Research
D. Market share to decline Given the fact that the growth in LCCs is much better than FSCs we believe KFA would miss out on the growing pie and this would result in a loss of market share in the long term though yields should see an improvement.
Market share set to decline
21.8
20.2 20.019.3 19.2
18.417.2
14.0
12.111.3
9.0
11.0
13.0
15.0
17.0
19.0
21.0
23.0
Apr
-11
May
-11
Jun-
11
Jul-
11
Aug
-11
Sep-
11
Oct
-11
Nov
-11
Dec
-11
Jan-
12
%
Source: Company data, GEPL Capital Research

Equity | India | Aviation
Kingfisher Airlines Ltd. March 19, 2012
GEPL Capital Research| Initiating Coverage 53
\
Lower operating efficiencies visible
KFA had a PLF of 81% in FY11 as compared to the listed player’s average of 80%. Similarly, its yields at `4.85 in FY11 were the highest (Jet= `3.9 and SpiceJet= `3.3) amongst listed players. However, over the last few quarters the operational matrices for KFA have shown a steady decline with PLF at 79.3% in H1FY12 and 75.3% in Q3FY12. The yields too declined to `3.8 in Q3FY12 from `4.4 in Q1FY12. The company also has one of the lowest block hours per aircraft at 10.2 in H1FY12 (listed players= 11.2) and 9.54 in FY11 (listed players= 10.7). The lower operations and rise in fuel costs have resulted in the break even seat load factor rising to 89% in H1FY12 (Jet airways= 76% and SpiceJet = 88%) as compared to 78.6% (Jet airways= 83.4% and SpiceJet= 68.45) in FY11.
Break-even seat load factor
94.0 95.0
74.0
87.7 86.291.2 89.4
79.8
92.3
84.0
75.7
88.7
84.587.8
81.4
50.0
55.0
60.0
65.0
70.0
75.0
80.0
85.0
90.0
95.0
100.0
Q3FY11 Q4FY11 Q1FY12 Q2FY12 Q3FY12
%
Kingfisher Jet Airways (std) SpiceJet
Source: Company data, GEPL Capital Research
A. ASKM has improved but PLF declined The fact that the company managed to increase capacity (ASKM) by 9% in FY11 despite 15 of its fleet being grounded is a commendable fact. With the return of the grounded fleet we have seen ASKMs rise by 6% Y-o-Y in 1QFY12 and 17.5% Y-o-Y in Q2FY12.
However, sequentially the ASKMs have stagnated and with the return of fleet, dropped by 4.7% Y-o-Y in Q3FY12. Given the constant fleet reduction and lack of sources to funds expansion, the company would find it difficult to increase its capacity in the near future. This would make it difficult to capture the incremental growth in Indian domestic passenger traffic.
The worrisome sign is that though the ASKM has improved the PLF has declined significantly in Q2FY12 and Q3FY12 which has also been a trend across the industry. This reflects the fact that PLF at above 80% levels are difficult to sustain.
The PLF is expected to decline further with Kingfisher ceasing to operate under the LCC model to restructure cost. The decline is expected to be in-line with the industry standards where one has historically observed higher PLF for FSCs as compared to LCCs.

Equity | India | Aviation
Kingfisher Airlines Ltd. March 19, 2012
GEPL Capital Research| Initiating Coverage 54
ASKM has managed to rise with grounded fleet returning PLF has declined despite strong traffic growth
4.4 4.4
3.9
3.6 3.6
3.7
4.2
3.8
4.0
4.2
3.8
3.4
3.6
3.8
4.0
4.2
4.4
4.6
Q1 Q2 Q3 Q4
bn
FY10 FY11 FY12
82.9
67.9
71.2
74.673.7
79.879.0
83.681.7
75.375.6
60.0
65.0
70.0
75.0
80.0
85.0
Q1 Q2 Q3 Q4
%
FY10 FY11 FY12
Source: Company data, GEPL Capital Research Source: Company data, GEPL Capital Research
B. Yields rose but Cost/ASKM (with fuel) rose sharply
The average yields for KFA in H1FY12 stood at `4.86 as compared to `4.79 in Q2FY11 showing a marginal improvement of 1.5% Y-o-Y. The yields rose by 13.8% Q-o-Q in Q1FY12 as compared to a decline in Q1FY11 reflecting a strong growth. However the operations deteriorating are clearly visible with the yields declining 10.9% Q-o-Q in Q2FY12 to `4.58.
Though the lower yields can be attributed to Q2 historically being a lean season, even on a Y-o-Y basis the yields fell by 1.7%. To add to this, the yields are witnessing a decline even in a scenario of a sharp decline in PLF from 79% in Q2FY11 to 75.6% in Q2FY12.
The scenario looks even more bleak if we consider the fact that despite yields growing by a mere 1.5% Y-o-Y in H1FY12 the ATF prices have shot up drastically and other costs have also risen resulting in the Cost/ASKM (with fuel) rising to `4.31 in H1FY12 as compared to `3.81 in H1FY11 suggesting a rise of 13.1% Y-o-Y. Hence, the yield rise seems too miniscule and insufficient to meet the cost structure. We expect the yields to rise given KFAs decision to exit the LCC business and also add first class seats; the move however, should impact their PLF.
Sequential yields rose marginally Cost/ASKM has surged due to ATF prices
5.1
4.7
4.8
4.5
4.94.94.9
4.7
4.9
4.54.6
4.0
4.2
4.4
4.6
4.8
5.0
5.2
Q1 Q2 Q3 Q4
Rs
FY10 FY11 FY12
4.4
3.8
4.14.0
4.3
3.7
3.9 3.9
4.2
4.3 4.3
3.2
3.4
3.6
3.8
4.0
4.2
4.4
4.6
Q1 Q2 Q3 Q4
Rs
FY10 FY11 FY12
Source: Company data, GEPL Capital Research Source: Company data, GEPL Capital Research

Equity | India | Aviation
Kingfisher Airlines Ltd. March 19, 2012
GEPL Capital Research| Initiating Coverage 55
C. Block hours saw marginal improvement but Cost/ASKM (without fuel) rose too
Another commendable improvement in the operations is the fact that the block hours per aircraft have improved significantly over the last few quarters. The block hours per aircraft were at their highest level for the airline ever at 10.3 and 9.9 in Q1FY12 and Q2FY12 respectively.
However, the blocks hours continue to remain significantly lower than the industry average with SpiceJet reporting block hours per aircraft of 11.4 and 10.8 in Q1FY12 and Q2FY12 respectively, Jet Airways reporting block hours per aircraft of 12.0 and 11.6 in Q1FY12 and Q2FY12 respectively and JetLite reporting block hours per aircraft of 11.8 and 11.6 in Q1FY12 and Q2FY12 respectively.
Block hours per aircraft improving Block hours per aircraft lowest in the listed universe
8.4
8.9
8.1
8.89.2
10.0
9.0 9.1
10.0
10.39.9
7.0
7.5
8.0
8.5
9.0
9.5
10.0
10.5
Q1 Q2 Q3 Q4
Hou
rs
FY10 FY11 FY12
11.3
12.011.611.7
11.3 11.4
10.7
10.010.3
11.1
9.9
9.1
8.5
9.0
9.5
10.0
10.5
11.0
11.5
12.0
12.5
Q3FY11 Q4FY11 Q1FY12 Q2FY12
Hou
rs
Jet Airways SpiceJet Kingfisher
Source: Company data, GEPL Capital Research Source: Company data, GEPL Capital Research

Equity | India | Aviation
Kingfisher Airlines Ltd. March 19, 2012
GEPL Capital Research| Initiating Coverage 56
Debt restructuring a must for survival but uncertainty over quantum and time remains
The acquisition of Air Deccan in FY08, global and economic slowdown in FY09, high crude prices and middle East crisis in FY11 have resulted in the debt mounting to `70.5 bn in FY11 from `9 bn in FY08. The high debt resulted in an interest outflow of `11 bn and `13 bn in FY10 and FY11 respectively during which period the company reported an EBITDAR of `1.95 bn and `8.6 bn respectively. The low EBITDAR resulted in an EBITDA loss of `9.0 bn in FY10 and EBITDA loss of `1.2 bn in FY11. Given the EBITDA losses that the company has been operating at, the huge interest outflow is the biggest negative for the company.
With a debt of over `70 bn and a market cap of a mere `10.4 bn the situation seems to be extremely tricky for KFA. Given the mounting losses and high debt, the airline is burning cash at a rapid rate in a business that requires a huge cash flow and capital expenditure. This has also led to the equity and net worth of the company getting totally wiped-out.
Hence, debt restructuring is critical for sustainability of KFA’s operations. If it is unable to restructure its debt, it is likely to have an adverse impact on the ongoing operations. The company is looking to a) convert part of its loans into equity, b) propose a preferential issue to investors, c) change the lease agreement terms, and d) sell property; in order to slash its debt by more than half.
However, given the current situation of the company we do not expect the debt to reduce any time soon. The passing of the FDI policy would be sentimentally beneficial for the company. However it seems very unlikely that a company would buy stake in KFA given its huge debt burden and operational issues. Consequently we expect the debt of KFA to rise to `100.1 bn in FY14E from `70.6 bn in FY11. We expect the cash crunch for the company to remain and hence the net debt to witness a 12.5% CAGR over FY11-FY14E top `96.9 bn. We also expect the interest outflow to witness a 7.7% CAGR over FY11-FY14E to `17.0 bn.

Equity | India | Aviation
Kingfisher Airlines Ltd. March 19, 2012
GEPL Capital Research| Initiating Coverage 57
Net debt position Cash flows from operations
79.270.6
80.689.6
100.1
0.0
20.0
40.0
60.0
80.0
100.0
120.0FY
10
FY11
FY12
E
FY13
E
FY14
E
Rs
bn
7.8
(10.4)
8.96.3
8.7 9.7
(15.0)
(10.0)
(5.0)
0.0
5.0
10.0
15.0
FY09
FY10
FY11
FY12
E
FY13
E
FY14
E
Rs
bn
Source: Company data, GEPL Capital Research Source: Company data, GEPL Capital Research
Interest outflows Interest coverage ratio
7.8
11.0
13.1 13.715.2
17.0
0.0
2.0
4.0
6.0
8.0
10.0
12.0
14.0
16.0
18.0
FY09
FY10
FY11
FY12
E
FY13
E
FY14
E
Rs
bn
(0.8)
(0.1)
(0.5)
0.00.2
(2.3)(2.5)
(2.0)
(1.5)
(1.0)
(0.5)
0.0
0.5
FY09
FY10
FY11
FY12
E
FY13
E
FY14
E
Source: Company data, GEPL Capital Research Source: Company data, GEPL Capital Research

Equity | India | Aviation
Kingfisher Airlines Ltd. March 19, 2012
GEPL Capital Research| Initiating Coverage 58
High debt leading to arrays of problems
Given the net losses and mounting debts KFA has been fighting for survival over the last six months now with the following issues cropping up: a) fleet reduction to 62 aircraft vs 66 in FY11 which should result in lower ASKMs, b) lower flight schedules due to non-payment of salaries to employees, c) cash and carry basis for fuel by OMCs to pressurise cash flows, d) freezing of accounts by IT department due to unpaid TDS, e) inclusion with One-World put on hold, and f) the exclusion from IATA and the tie-up with British Airways coming to a stop. All these factors should significantly impact revenues and profitability going forward if the company manages to sustain. With the lease of the older aircrafts expiring we expect the ASKM to decline further.
A. Fleet reduction to lead to lower capacity and hence lower revenues
Given the severe cash crunch of the company and its inability to pay its leasing company, KFA has returned three of its wide-body Airbus 320s and 1 Airbus 330 aircraft. KFA has hence been forced to curtail its international operations to some destinations in Europe and Asia. In a move to curtail further losses, the beleaguered KFA would review all routes, especially the long-haul ones, and the non-profitable ones would be shut down as per media reports. There are also reports suggesting that the airline had shut down flights to and from many stations and many flights from Kolkata had been suspended and taken off ticketing sites.
By curtailing operations, KFA will indeed burn less money but will yet not be able to make money given the high debt of the company. The fleet reduction should result in lower ASKM for KFA going forward. Moreover, the cost of leasing aircraft will rise due to the default risk involved. Hence the expansion plans are definitely going to be out on a hold.
B. Lower flight schedules due to staff strikes owing to non-payment of salaries to employees
With the situation deteriorating over the last few months, plenty of ground staff have been laid off and pilots have been leaving to join competitors at their free will. In a move to restrict the exit of pilots the company has asked the pilots to compensate for six months of their salary. KFA also faced fresh trouble after its ground staff and technicians went on a strike at the Delhi airport on March 14, 2012. The strike by the airline employees was against the non-payment of salaries for the last three months who have not been paid their salaries since Dec’11 owing to the freezing of bank account of the cash-stripped airlines.
The airline said despite the shortage of crew, it was operating around 100 flights a day, from the earlier peak of 350 a day. At one time with 66 aircraft, it is now operating a little over 20 and has been curtailing connectivity within India.
C. Cash and carry basis by OMCs to drain cash flows
The airline also owes more than `2 bn to three oil companies - HPCL, IOC and BPCL - in dues. The oil companies have stopped granting credit to Kingfisher for lifting jet fuel and put it on a cash-and-carry payment mode. The carrier has been stopped fuel supply twice earlier due to non-payment and delay in payments. The cash-strapped carrier also has unpaid dues to the operators of airports and other agencies, which have been putting pressure on it.
KFA is also unable to pay the daily cash-and-carry amount to the Airports Authority of India (AAI) and has accumulated dues of `50 mn in the past week, as per government officials. But, with the civil aviation ministry making clear that it won't pull the plug on Kingfisher, AAI cannot take any action against the airline.

Equity | India | Aviation
Kingfisher Airlines Ltd. March 19, 2012
GEPL Capital Research| Initiating Coverage 59
D. Freezing of accounts by IT department due to non-payment of TDS
With little cash left and over half its fleet grounded, Kingfisher Airlines has run into yet another crisis that includes reduction of flights and attachment of its bank accounts by the income tax authorities.
The crisis at KFA escalated with the service tax department freezing as many as 40 bank accounts of the airline for non-payment of dues worth `400 mn. The tax commissioner informed of 40 bank accounts being frozen as KFA failed to meet the February 29, 2012 deadline to make the payments. The company is working with its bankers to realise the urgent interim working capital as approved in the Bankers Consortium meeting held on February 17, 2012.
E. Tie up with British Airways and inclusion with One-World put on hold
With the growing concerns over KFA’s sustainability, its code-share agreement with British Airways has been suspended. The two airlines had signed a code-share agreement for each other's flights across India, Sri Lanka, the UK and continental Europe in Sept’10. The agreement allowed passengers to book their journeys on each other's Web sites, earn frequent flyer points on the code-share routes and gain access to each other's airport lounges. With this suspension, Kingfisher loses an important sales channel for their domestic network. Lenders have declared Kingfisher Airlines a substandard account and its entry into a global airline alliance — ‘Oneworld’ — has been stalled for now because of its financial troubles.
F. The exclusion from IATA and the tie-up with British Airways coming to a stop
To add to the existing woes, The International Air Transport Association (IATA) has suspended KFA from its account settlement system due to non-payment of fees. The industry group's clearing house (ICH), settles accounts between the world's airlines, airline-associated companies and travel agencies. As per IATA, KFA participation in the ICH would be reinstated only after it fulfils ICH requirements. Kingfisher said it could not settle the dues as its bank accounts have been deactivated by tax authorities, the same reason the company gave when it had to cancel most of its flights last month.

Equity | India | Aviation
Kingfisher Airlines Ltd. March 19, 2012
GEPL Capital Research| Initiating Coverage 60
Approval of ATF imports no major reason for cheer
Considering the high debt, low margins and rise in crude prices; airlines have seen constant erosion in their net worth over the last four quarters. KFA has asked the ministry to allow ATF imports and also pushed for FDI in aviation. Acceding to the demands of cash-strapped domestic aviation firms, a government panel on 8th Feb’12 allowed individual airlines to import ATF. Though the Cabinet will take a final call on the issue later, we believe the move will not be of much help to the airline operators.
As highlighted below fuel cost accounted for 55% (`7.4 bn) of the total sales even in the historically best quarter (Q3) for the industry. In the same period the net loss for the company stood at `4.4 bn. ATF taxes vary from state-to-state from 4-35% (all inclusive). If ATF imports are allowed by the government, airlines will have to import ATF in huge quantities leading to huge inventories. They would also avail a lower credit period as compare to the 60-90 days credit period enjoyed currently. Airlines would hence also have to shell out for terminalling expenses and storage and transportation cost and hence we believe the net benefit should not exceed 20-25%.
Even if we assume that OMCs are generous enough and the entire benefit is passed on to KFA (a remote possibility) the savings in Q3FY12 would have not been enough to negate the losses. The operating loss would have improved by `1.7 bn with the reported operating loss of `3.5 bn and 30% ATF import benefit resulting in an operating loss of `1.8 bn. Considering a net benefit of 20% from ATF imports the savings would be much lower at `1.2 bn in Q3FY12. Hence despite the ATF import policy KFA would still have incurred a net loss of R2.7-3.2 bn in Q3FY12 alone. This makes us believe that it is not the ATF imports which are leading to losses but the failure to increase prices due to a rising capacity and constant undercutting of prices. Hence we do not see anything more than a marginal respite for KFA with the government allowing ATF imports. Consequently, we believe that KFA would continue to make losses even on the EBITDA level unless prices are raised significantly. Given the mounting debt of the company, the net losses are expected to widen with each passing quarter and hence we believe the optimism around ATF imports is highly overdone.
Impact of ATF imports
Reported 30% lower ATF 20% lower ATF
(Figures in `mn) Q3FY12 Q3FY12 Q3FY12
Net sales 13,423 13,423 13,423
Aircraft fuel 7,388 5,683 6,157
Other operating costs 5,078 5,078 5,078
Staff cost 1,757 1,757 1,757
Total expenditure (excl rent) 14,222 12,517 12,991
EBIDTAR 994 906 432
EBIDTARM (%) 7.4 6.8 3.2
Lease rentals 2,722 2,722 2,722
Total expenditure 16,945 15,240 15,714
EBIDTA (3,521) (1,816) (2,290)
EBIDTAM (%) (26.2) (13.5) (17.1)

Equity | India | Aviation
Kingfisher Airlines Ltd. March 19, 2012
GEPL Capital Research| Initiating Coverage 61
Financial overview
Revenues to witness a 5.1% CAGR in FY11-FY14E We expect a 5.1% CAGR in revenue in FY11-FY14E, driven by 0.9% CAGR decline in RPKM from to 12.2 bn in FY14E and a 4.1% CAGR in passenger yield (revenue/RPKM), from `4.85 in FY11 to `5.5 in FY14E.
We expect the ASKM to witness a 0.9% CAGR decline in FY11-FY14E despite considering an improvement in block hours per aircraft even as the fleet size is expected to reduce. We expect a decline in the PLF to 77.7% in FY14E as compared to 81% in FY11 due to the exit of KFA from the LCC model.
ASKM, RPKM and PLF Revenue per RPKM and Revenue per ASKM
62.0
71.8
81.077.5 77.0 77.7
0.0
2.0
4.0
6.0
8.0
10.0
12.0
14.0
16.0
18.0
FY09
FY10
FY11
FY12
E
FY13
E
FY14
E
bn
0.0
10.0
20.0
30.0
40.0
50.0
60.0
70.0
80.0
90.0
%
ASKM RPKM PLF
5.1
4.4
4.9 4.9
5.25.5
3.2 3.2
3.93.8
4.04.3
3.0
3.5
4.0
4.5
5.0
5.5
6.0
FY09 FY10 FY11 FY12E FY13E FY14E
Rs
Revenue per RPKM Revenue per ASKM
Source: Company data, GEPL Capital Research Source: Company data, GEPL Capital Research
Higher ATF prices to impact cost structure ATF prices have seen a sharp surge over the last one year. Led by the Middle East crisis ATF prices have surged by 62% since Oct’10. Post an improvement in the scenario as well, ATF prices have refused to decline and with the falling rupee and stubborn Brent crude prices, ATF prices have risen by 332% in CY11 and 13% in CY12.
The cost structure of airlines, which operate on thin margins have hence gone for a toss given the fact that fuel costs account for over 50% of the total costs. With the surge, airlines across India are finding it difficult to break-even on an operational basis. This is visible in the cost structure where by the cost/ASKM (with fuel) has risen from `3.94 in Q3FY11 to `4.42 in Q3FY12. We expect a 6.1% CAGR in fuel costs in FY11-FY14E for Kingfisher despite a reduction in fleet.

Equity | India | Aviation
Kingfisher Airlines Ltd. March 19, 2012
GEPL Capital Research| Initiating Coverage 62
ATF prices Cost per ASKM
40.7
48.8
54.9
60.6
66.165.064.6
56.258.6
44.6
62.7
40.0
45.0
50.0
55.0
60.0
65.0
70.0
Oct
-10
Nov
-10
Dec-
10
Jan-
11
Feb-
11
Mar
-11
Apr-
11
May
-11
Jun-
11
Jul-
11
Aug-
11
Sep-
11
Oct
-11
Nov
-11
Dec-
11
Jan-
12
Feb-
12
Mar
-12
Rs/l
itre
4.54.0
3.33.9 3.8 3.8
2.1 2.1 1.9 1.9 2.0 2.1
0.0
1.0
2.0
3.0
4.0
5.0
FY09
FY10
FY11
FY12
E
FY13
E
FY14
E
Rs
Cost per ASKM (with fuel)Cost per ASKM (without fuel)
Source: HPCL,BPCL, GEPL Capital Research Source: Company data, GEPL Capital Research
EBITDAR to witness a a mere 3.5% CAGR in FY11-FY14E With the surge in ATF prices, we expect the company to witness a 20bps decline in EBITDAR margins in FY11-FY14E to 17.1%. We expect the EBITDAR margin and EBITDA margin at 5.6% and -9.4% in FY12E respectively and hence in that context expect a strong improvement. We expect the EBITDA margin to bounce back to 5.3% in FY14E led by a) lower proportionate rise in employee expenses, b) lower commission expenses with rates offered to travel operators declining, c) cost curtailment on other operating expenses, and d) lower lease rentals with the return of fleet and negotiation of rental terms.
Hence, despite the EBITDAR margin declining over FY11-14E we expect EBITDAR to register a 12.7% CAGR in FY11-FY14E to `12.3 bn. Similarly, due to the lower lease rentals we expect the company to report a positive EBITDA by FY14E of `3.9 bn. With an improvement in EBITDA, we expect net loss of the company to reduce to `9.5 bn in FY14E from `10.3 bn in FY11.
EBITDAR margin and EBITDA margin Net Loss
(11.9)
3.8
17.3
5.6
(17.7)
(2.0)
(9.4)
5.3
17.113.7
0.4
(20.0)
(15.0)
(10.0)
(5.0)
0.0
5.0
10.0
15.0
20.0
FY09
FY10
FY11
FY12
E
FY13
E
FY14
E
%
EBITDAR margin EBITDA margin
(16.1)(16.5)
(10.3)
(14.2)
(10.7)
(9.5)
(18.0)(17.0)
(16.0)(15.0)(14.0)(13.0)
(12.0)(11.0)(10.0)
(9.0)(8.0)
FY09
FY10
FY11
FY12
E
FY13
E
FY14
E
Rs
bn
Source: Company data, GEPL Capital Research Source: Company data, GEPL Capital Research
Equity | India | Aviation
Kingfisher Airlines Ltd. March 19, 2012
GEPL Capital Research| Initiating Coverage 63
Key Risks
• Huge debt on books
The company has a debt of ~`8 bn as of FY12E. This has resulted in a high interest outflow there by resulting in mounting losses and negative net worth for the company. Despite the company restructuring its debt and selling equity to banks, the debt remains high which severely hinders its growth prospects. The high debt is also a strain on cash flows of the company and a lingering cause of concern. Any further rise in debt as expected by us can further negatively impact the balance sheet of the company.
• Fuel costs beyond airlines’ control ATF prices account for 40-50% of an airline’s total revenue. A sharp increase in the ATF prices have dented margins and led to losses across the industry. Any further price rise could result in a significant net loss and hence erosion of net worth for the company.
• Change in landing and navigation charge regulations Currently, aircraft with less than 80 seat capacity are exempt from airport landing and navigation charges. Kingfisher has ~25 ATRs with a 78-seat configuration, to its fleet, which qualify for these exemptions. Any change in these policies could lead to higher taxes and so affect future earnings.
• Yields stagnating
Any sharp increase in competitive intensity (in times of low passenger traffic or excess expansion by airlines) could adversely affect the load factors and passenger yields, reducing margins
• Rates and currency fluctuations A stronger dollar may affect Kingfisher’s profitability, as a large part of the company’s costs are dollar denominated, like lease rentals, ATF cost and maintenance costs while the revenue stream from the international business is close to 25%.
• Highly fixed-cost intensive The airline industry is highly fixed-cost intensive with lease rentals, maintenance and employee costs remaining fixed. Any reduction in passenger traffic can adversely affect the profitability.
• Downturn in the economy
Any downturn in the economy could lead to relatively low passenger traffic growth, which could have a negative impact on load factors, and could eventually have a negative impact on profitability.
• External factors There are many external factors which can affect profitability, which include bad weather conditions, terrorist activities, country and state policies and others.

Equity | India | Aviation
Kingfisher Airlines Ltd. March 19, 2012
GEPL Capital Research| Initiating Coverage 64
Valuations
KFA is currently trading at 17.1x its FY13E EV/EBITDAR and 13.3x its FY14E EV/EBITDAR. This is a significant premium to the other listed players in the Indian aviation industry like SpiceJet (trading at 10.9x its FY13E EV/EBITDAR) and Jet Airways (trading at 10.0x its FY13E EV/EBITDAR). Given a) the huge debt on books, b) fleet reduction and ASKM reduction, and c) deteriorating operations, we believe the premium is highly unjustified. Consequently, we initiate coverage on Kingfisher Airlines with SELL rating and target price of `16 per share.
Given the accumulated losses of the company, the net worth has eroded significantly. Its market share has declined due to lower operations and the company is currently in a severe cash crunch situation highlighted by the non-payment of salaries to employees and OMCs. We also value the company at 2.1x its on-year forward EV/Sales to arrive at our target price of `16 per share. Even at 2.1x the stock would trade at a significant premium to the other listed players. However the only upside to our rating can be the successful turnaround of the airline with entry of an investor and significant debt reduction.
One-year forward EV/Sales
0
50
100
150
200
250
300
Jun-
07
Sep-
07
Dec-
07
Mar
-08
Jun-
08
Sep-
08
Dec-
08
Mar
-09
Jun-
09
Sep-
09
Dec-
09
Mar
-10
Jun-
10
Sep-
10
Dec-
10
Mar
-11
Jun-
11
Sep-
11
Dec-
11
Mar
-12
Price 1.5x 3.0x 4.5x 6.0x
Source: Bloomberg, GEPL Capital Research
One-year forward EV/EBITDAR
0
50
100
150
200
250
300
Jun-
07Se
p-07
Dec-
07M
ar-0
8Ju
n-08
Sep-
08De
c-08
Mar
-09
Jun-
09Se
p-09
Dec-
09M
ar-1
0
Jun-
10Se
p-10
Dec-
10
Mar
-11
Jun-
11Se
p-11
Dec-
11M
ar-1
2
Price 10.0x 25.0x 40.0x 55.0x Source: Bloomberg, GEPL Capital Research

Equity | India | Aviation
Kingfisher Airlines Ltd. March 19, 2012
GEPL Capital Research| Initiating Coverage 65
Sensitivity Analysis
1% PLF rise enough to negate US$4/bbl hike in Brent crude
Contrary to the common notion, we believe a company’s profitability is more linked to the PLF and the yields than the ATF prices. As per our analysis a 1% rise in PLF should result in the EBITDAR of KFA for FY13E rising by 8.7% much higher than the impact of a US$1/bbl rise in prices which will impact EBITDAR by -2.2%. Hence we conclude that a 1% rise PLF is enough to negate a US$4/bbl rise in Brent crude prices.
`0.1 hike in yields sufficient to negate `1.5 depreciation
Similarly, we analyze that `0.1 rise in yields can positively impact the EBITDAR of KFA by 9.4% while a `1 depreciation in the rupee will result in an EBITDAR de-growth of 6.2% for KFA in FY13E. Hence `0.1 rise in yields is more than sufficient to combat `1.5 depreciation in the rupee.
FY13E EBITDAR impact of crude and dollar
Brent crude (US$/bbl) Rupee dollar rate
110 115 120 125
46 11,018 10,014 9,010 8,006
48 9,894 8,846 7,798 6,751
50 8,770 7,679 6,587 5,496
52 7,646 6,511 5,376 4,241 Source: Company data, GEPL Capital Research
FY13E EBITDAR impact of yield and PLF
PLF Yield
76 77 78 79
5.1 7,151 7,954 8,756 9,559
5.2 8,608 9,430 10,252 11,074
5.3 9,482 10,316 11,149 11,983
5.4 10,706 11,556 12,405 13,255 Source: Company data, GEPL Capital Research

Equity | India | Aviation
Kingfisher Airlines Ltd. March 19, 2012
GEPL Capital Research| Initiating Coverage 66
Income Statement Y/E Mar (`mn) FY10(A) FY11(A) FY12(A) FY13(E) FY14(E)
Total net revenues 50,679 62,334 66,947 68,891 72,312
Fuel Cost 18,030 22,740 31,697 27,434 27,147
Gross Profit 32,649 39,594 35,250 41,456 45,166
Employee Cost 6,888 6,760 7,101 7,233 7,551
Other Expenditure 23,817 24,213 24,386 24,793 25,270
EBITDAR 1,945 8,621 3,764 9,430 12,345
EBITDAR Margin (%) 3.8 13.8 5.6 13.7 17.1
Lease Rental 10,938 9,840 10,057 9,126 8,478
EBITDA (8,993) (1,219) (6,294) 304 3,867
EBITDA Margin (%) (18) (2) (9) 0 5
Depreciation 2,173 2,410 2,179 2,179 2,201
Other Income 2,031 2,622 1,360 1,360 1,360
Interest (Net) 10,965 13,129 13,697 15,227 17,012
PBT (20,100) (14,137) (20,810) (15,742) (13,986)
PBT Margin (%) (62) (36) (59) (38) (31)
Tax (7,707) (4,935) (6,659) (5,037) (4,476)
Minority Interest 0 0 0 0 0
Adjusted PAT (12,393) (9,203) (14,151) (10,705) (9,510)
Extraordinary /exc. (4,079) (1,071) 0 0 0
Reported PAT (16,472) (10,273) (14,151) (10,705) (9,510)
Balance Sheet Y/E Mar (`mn) FY10(A) FY11(A) FY12(A) FY13(E) FY14(E) Equity capital 2,659 4,978 4,978 4,978 4,978 Reserves & Surplus (42,614) (40,021) (54,201) (64,905) (74,416) Preference Capital 970 5,531 5,531 5,531 5,531 Net worth (38,984) (29,512) (43,692) (54,397) (63,907) Minority interest 0 0 0 0 0 Deffed tax liability 0 0 0 0 0 Total debt 79,226 70,571 80,571 89,571 100,071 Total Liabilities & Equity 40,242 41,059 36,879 35,174 36,164 Net block 15,545 15,719 13,690 11,661 10,110 Capital WIP 9,806 6,733 4,733 3,233 1,733 Total fixed assets 26,808 23,711 19,532 15,853 12,652 Investments 1 1 1 1 1 Goodwill 0 0 0 0 0 Current Assets 24,571 29,738 32,582 30,969 31,454 Inventories 1,649 1,876 1,926 1,982 2,080 Debtors 3,225 4,405 4,035 4,152 4,359 Cash & bank 2,065 2,524 1,804 2,110 3,143 Loans & advances 17,633 20,933 24,816 22,724 21,872 Other Current Assets 0 0 0 0 0 Current Liab. & Prov. 35,481 41,670 51,172 52,622 53,393 Creditors 26,027 28,632 36,119 36,642 36,566 Other liabilities 4,926 5,828 5,869 5,851 5,943 Provisions 468 622 2,214 2,957 2,958 Net Working capital 24,344 29,278 35,937 40,974 45,450 Miscellaneous Exp 0 0 0 0 0 Total Assets 40,242 41,059 36,879 35,174 36,164
Key Ratio Y/E Mar (`mn) FY10(A) FY11(A) FY12(A) FY13(E) FY14(E) Per Share Ratios Fully diluted E P S (61.9) (20.6) (28.4) (21.5) (19.1) Book Value (146.6) (59.3) (87.8) (109.3) (128.4) Dividend per share 0.0 0.0 0.0 0.0 0.0 per share FCFO (55.8) (16.6) (24.4) (17.4) (15.0) Valuation Ratio P/E (1.2) (2.2) (0.7) (1.0) (1.1) P/BV (0.5) (0.8) (0.2) (0.2) (0.2) EV/EBITDA (10.8) (74.2) (14.2) 322.3 27.8 EV/Sales 1.9 1.5 1.3 1.4 1.5 Price/ FCFO per share (1.3) (2.7) (0.9) (1.2) (1.4) Growth Ratios Sales Growth (3.3) 23.0 7.4 2.9 5.0 EBITDA Growth NM NM NM NM 1172.9 Net Profit Growth NM NM NM NM NM EPS Growth NM NM NM NM NM Common size Ratios Gross Margin 64.4 63.5 52.7 60.2 62.5 EBITDA Margin (17.7) (2.0) (9.4) 0.4 5.3 PAT Margin (0.3) (0.2) (0.2) (0.2) (0.1) Employee Cost 13.6 10.8 10.6 10.5 10.4 S&G Expenses 47.0 38.8 36.4 36.0 34.9 Return ratios RoAE (377.0) (72.9) (59.1) (44.7) (39.7) RoACE (8.6) (0.8) (4.9) (0.3) 1.7 Turnover ratios (days) Debtors ( Days) 21.5 22.3 23.0 21.7 21.5 Creditors ( Days) 166.3 157.0 161.3 193.6 195.2 Inventory (Days) 11.2 10.3 10.4 10.4 10.3 Net working capital (93.6) (66.9) (83.2) (106.6) (110.0) Solvency Ratios Total Debt/Equity (2.0) (2.4) (1.8) (1.6) (1.6) Interest coverage (0.6) (0.1) (0.4) (0.0) 0.1
Source: Company data, GEPL Capital Research
Cash Flow Y/E Mar (`mn) FY10(A) FY11(A) FY12(A) FY13(E) FY14(E) PBT (20,100) (14,137) (20,810) (15,742) (13,986)
Add: Depreciation 2,173 2,410 2,179 2,179 2,201
Add: Interest expense 10,965 13,129 13,697 15,227 17,012
Less: Other Income (2,031) (2,622) (1,360) (1,360) (1,360)
Other Adjustments (4,079) (1,071) 0 0 0
Change in working capital (3,814) 1,480 5,940 3,369 1,318
Taxes paid (7,707) (4,935) (6,659) (5,037) (4,476)
CF from operations (24,593) (5,744) (7,013) (1,365) 710
Change in fixed assets 4,749 687 2,000 1,500 1,000
Changes in Intangible Asset 0 0 0 0 0
Change in investments 0 0 0 0 0
Other income 2,031 2,622 1,360 1,360 1,360
CF from investing acti. 6,780 3,308 3,360 2,860 2,360
Change in debt 22,570 (8,655) 10,000 9,000 10,500
Change in Equity capital 0 14,951 0 0 0
Changes in Pref. capital 0 0 0 0 0
Dividend & dividend tax 0 0 0 0 0
Interest paid (10,965) (13,129) (13,697) (15,227) (17,012)
Other Adjustments (7,646) (4,934) (6,659) (5,037) (4,476)
CF from financing acti. 3,959 (11,768) (10,356) (11,264) (10,988)
Change in cash 346 459 (719) 306 1,033
Opening cash 1,719 2,065 2,524 1,804 2,110
Closing cash 2,065 2,524 1,804 2,110 3,143
Du-Pont Analysis (%) FY10(A) FY11(A) FY12(A) FY13(E) FY14(E) Net Profit Margin (32.5) (16.5) (21.1) (15.5) (13.2) Asset Turnover 1.3 1.5 1.8 2.0 2.0 Leverage (1.0) (1.4) (0.8) (0.6) (0.6) ROE (377.0) (72.9) (59.1) (44.7) (39.7)

Equity | India | Aviation
Kingfisher Airlines Ltd. March 19, 2012
GEPL Capital Research| Initiating Coverage 67
NOTES
Recommendation Rationale
Recommendation Expected Absolute Return (%) over 12 months
BUY >20%
ACCUMULATE <20% and >10%
NEUTRAL <-10% and <10%
REDUCE >-10% and <-20%
SELL >-20%
Expected absolute returns are based on share price at market close unless otherwise stated. Stock recommendations are based on absolute upside (downside) and have a 12-month horizon. Our target price represents the fair value of the stock based upon the analyst’s discretion. We note that future price fluctuations could lead to a temporary mismatch between upside/downside for stock and our recommendation.
GEPL CAPITAL Pvt Ltd (formerly known as Gupta Equities Pvt. Ltd.)
Head Office: D-21/22 Dhanraj mahal, CSM Marg, Colaba, Mumbai 400001
Reg. Office : 922-C, P.J. Towers, Dalal Street, Fort, Mumbai 400001 Analyst Certification The following analysts hereby certify that their views about the companies and their securities discussed in this report are accurately expressed and that they have not received and will not receive direct or indirect compensation in exchange for expressing specific recommendations or views in this report: Name : Sunil Sewhani Sector : Aviation Disclaimer: This report has been prepared by GEPL Capital Private Limited ("GEPL Capital "). GEPL Capital is regulated by the Securities and Exchange Board of India. This report does not constitute a prospectus, offering circular or offering memorandum and is not an offer or invitation to buy or sell any securities, nor shall part, or all, of this presentation form the basis of, or be relied on in connection with, any contract or investment decision in relation to any securities. This report is for distribution only under such circumstances as may be permitted by applicable law. Nothing in this report constitutes a representation that any investment strategy, recommendation or any other content contained herein is suitable or appropriate to a recipient’s individual circumstances or otherwise constitutes a personal recommendation. All investments involve risks and investors should exercise prudence in making their investment decisions. The report should not be regarded by the recipients as a substitute for the exercise of their own judgment. Any opinions expressed in this report are subject to change without notice and may differ or be contrary to opinions expressed by other business areas or groups of GEPL Capital as a result of using different assumptions and criteria. GEPL Capital is under no obligation to update or keep current the information contained herein. The securities described herein may not be eligible for sale in all jurisdictions or to certain categories of investors. Options, derivative products and futures are not suitable for all investors, and trading in these instruments is considered risky. Past performance is not necessarily indicative of future results. Foreign currency rates of exchange may adversely affect the value, price or income of any security or related instrument mentioned in this report. Any prices stated in this report are for information purposes only and do not represent valuations for individual securities or other instruments. There is no representation that any transaction can or could have been effected at those prices and any prices do not necessarily reflect GEPL Capital’s internal books and records or theoretical model-based valuations and may be based on certain assumptions. Different assumptions, by GEPL Capital or any other source may yield substantially different results. GEPL Capital makes no representation or warranty, express or implied, as to, and does not accept any responsibility or liability with respect to, the fairness, accuracy, completeness or correctness of any information or opinions contained herein. Further, GEPL Capital assumes no responsibility to publicly amend, modify or revise any forward-looking statements, on the basis of any subsequent development, information or events, or otherwise. Neither GEPL Capital nor any of its affiliates, directors, employees or agents accepts any liability for any loss or damage arising out of the use of all or any part of this report. In no event shall GEPL capital be liable for any direct, special indirect or consequential damages, or any other damages of any kind, including but not limited to loss of use, loss of profits, or loss of data, whether in an action in contract, tort (including but not limited to negligence), or otherwise, arising out of or in any way connected with the use of this report or the materials contained in, or accessed through, this report. GEPL Capital and its affiliates and/or their officers, directors and employees may have similar or an opposite positions in any securities mentioned in this document (or in any related investment) and may from time to time add to or dispose of any such securities (or investment). The disclosures contained in the reports produced by GEPL Capital shall be strictly governed by and construed in accordance with Indian law. GEPL Capital specifically prohibits the redistribution of this material in whole or in part without the written permission of GEPL Capital and GEPL Capital accepts no liability whatsoever for the actions of third parties in this regard.