autosomal dominant polycystic kidney disease: new ... · autosomal dominant polycystic kidney...
TRANSCRIPT

Fax +41 61 306 12 34E-Mail [email protected]
Review
Kidney Blood Press Res 2009;32:380–387 DOI: 10.1159/000254338
Autosomal Dominant PolycysticKidney Disease: New TreatmentOptions and How to Test Their Efficacy
Rudolf P. Wüthrich Andreas L. Serra Andreas D. Kistler
Division of Nephrology, University Hospital, Zürich , Switzerland
Autosomal Dominant Polycystic Kidney Disease –
The Most Frequent Hereditary Renal Disease
Autosomal dominant polycystic kidney disease(ADPKD) is a well-known chronically progressing cystic renal disease. Approximately 1: 800 to 1: 1,000 people are affected by the disease, although there are areas where the incidence of this condition is more or less frequent. The disease is inherited in an autosomal dominant fash-ion, progresses slowly over decades, and manifests clini-cally with hypertension, flank pain, hematuria and renal cyst infections in adults. Extrarenal manifestations are common but rarely prominent in early disease. The pathogenesis of ADPKD is characterized by cyst develop-ment and growth in both kidneys [1, 2] . Typically, the size of the kidneys increases from a normal size (150–200 cm 3 ) [3] in adolescence to 1 1,500 cm 3 /kidney. The grow-ing cysts gradually replace the functional renal paren-chyma and distort the normal architecture of the kidney. Despite the presence of innumerable cysts in both kid-neys, glomerular filtration rate (GFR) is well preserved in most patients up to the age of 30–40 years. Between the ages of 40 and 70 years, however, renal function usually declines in an accelerated fashion. End-stage renal dis-ease (ESRD) with the need for dialysis or transplantation affects approximately 50% of the patients with ADPKD by the age of 70 years [4] .
Key Words
Autosomal dominant polycystic kidney disease � End-stage kidney disease � Cyst growth
Abstract
Autosomal dominant polycystic kidney disease (ADPKD) represents a slowly progressing cystic kidney disorder which evolves into end-stage renal disease in the majority of pa-tients. Currently, there are no established treatments to re-tard the progression of the disease, but several promising therapeutic options are being tested in ongoing clinical tri-als. An inherent dilemma for the investigation of therapies in ADPKD is the dissociation of the early onset and constant rate of cyst growth from the delayed but accelerated loss of renal function. In order to prevent the latter, one needs to act on the former, i.e. current belief by experts in the field is that (1) retardation of cyst growth will ultimately improve the loss of glomerular filtration rate, and (2) cyst volume is an ideal surrogate parameter for outcome in early ADPKD. The present review will discuss the utility and the techniques for kidney and cyst volume measurements to assess disease progression in ADPKD, and summarizes ongoing clinical tri-als testing novel therapeutic options.
Copyright © 2009 S. Karger AG, Basel
Published online: November 3, 2009
Prof. Rudolf P. Wüthrich Division of Nephrology, University HospitalRämistrasse 100 CH–8091 Zürich (Switzerland) Tel. +41 44 255 33 84, Fax +41 44 255 45 93, E-Mail rudolf.wuethrich @ usz.ch
© 2009 S. Karger AG, Basel1420–4096/09/0325–0380$26.00/0
Accessible online at:www.karger.com/kbr
Dow
nloa
ded
by:
5.15
.45.
63 -
4/6
/201
5 4:
43:0
0 P
M

Autosomal Dominant Polycystic Kidney Disease
Kidney Blood Press Res 2009;32:380–387 381
In 85% of the cases, ADPKD is caused by mutations in the PKD1 gene which encodes the ciliary protein polycys-tin-1. In 15%, the PKD2 gene which encodes polycystin-2 is mutated. Mutations in other genes may account for some cases but have not yet been characterized. Cases with PKD1 gene mutations have a more severe course, with ESRD occurring at an average age of 54 years which is roughly 10 years earlier than in patients with mutations in the PKD2 gene. Thus, fewer patients with PKD2 muta-tions reach ESRD during their lifetime [5] .
How to Follow Disease Progression:
GFR versus Cyst or Kidney Volume
Currently, changes in GFR are considered the gold standard for quantifying the progression rate in most chronic renal diseases. However, owing to the remarkable capability of intact nephrons to compensate for the loss of functional parenchyma, GFR measurement may fail to disclose ominous changes at early stages of kidney dis-eases. In his classical paper, Dalgaard [6] reported on 346 individuals from Denmark with polycystic kidneys and found that palpable kidneys appeared in relatively young patients long before the onset of uremia. He concluded that cyst growth preceded and ultimately caused the onset of uremia. Indeed, data from several longitudinal ADPKD cohort studies have now demonstrated that cyst volume growth represents a continuous process which begins in childhood or adolescence [7–10] and precedes GFR decline by years [11] , as shown in figure 1 .
Considering the grossly distorted kidney architecture at the time when GFR starts to decline, early intervention before cysts have replaced the bulk of intact renal paren-chyma is probably warranted but a treatment effect on GFR would be evident only after several years. GFR is therefore not suitable as a primary end point for clinical studies testing early intervention. There is not much doubt that cyst growth is ultimately responsible for sub-sequent loss of glomerular filtration through direct (com-pression) and indirect (e.g. fibrosis) effects. Given the continuous rate of cyst growth during early ADPKD, kid-ney or cyst volume enlargement is an obvious surrogate endpoint for clinical trials at that stage, and attempts have been made to correlate kidney volume progression with GFR decline in several longitudinal studies by serial im-aging.
Ultrasound is inaccurate for determining small chang-es in renal volume and is not suitable for very large kid-neys. Using a long observation period with an average of
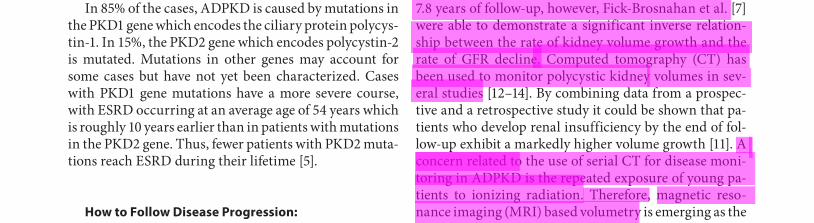
7.8 years of follow-up, however, Fick-Brosnahan et al. [7] were able to demonstrate a significant inverse relation-ship between the rate of kidney volume growth and the rate of GFR decline. Computed tomography (CT) has been used to monitor polycystic kidney volumes in sev-eral studies [12–14] . By combining data from a prospec-tive and a retrospective study it could be shown that pa-tients who develop renal insufficiency by the end of fol-low-up exhibit a markedly higher volume growth [11] . A concern related to the use of serial CT for disease moni-toring in ADPKD is the repeated exposure of young pa-tients to ionizing radiation. Therefore, magnetic reso-nance imaging (MRI) based volumetry is emerging as the method of choice to follow kidney volumes.
The Consortium for Radiologic Imaging Studies of Polycystic Kidney Disease (CRISP) has recently pub-lished the results of yearly assessments of kidney and cyst volume measurements by MRI, and GFR by iothalamate clearance in 232 ADPKD patients who were followed over 3 years [9] . In that study, gadolinium-enhanced coronal T1-weighted images were obtained and the volumes of individual kidneys were measured using a stereologic method counting the intersections of the kidney outlines on a superimposed grid and summing the products ofthe area measurements and slice thickness from the setof contiguous images. A region-based threshold method was used to calculate cyst volumes from T2-weighted cor-onal images. Although these patients had preserved renal function and no case of nephrogenic systemic fibrosis was reported in any of these patients, the CRISP investi-gators moved to the use of image sequences obtained without gadolinium enhancement for further follow-up (CRISP II), and did not notice a change in accuracy of the volume measurements [15] .
In the CRISP study it was found that total kidney vol-ume and total cyst volume increased exponentially with a mean ( 8 SD) annual growth rate of 5.3 8 3.9%. The baseline total kidney volume predicted the subsequent rate of increase in volume, independent of age. Further-more, higher rates of kidney enlargement were found to be associated with a more rapid decrease in renal func-tion. A baseline total kidney volume of 1 1,500 cm 3 in 51 patients was associated with a decline in GFR by 4.3 8 8.1 ml/min/year (p ! 0.001) [9] .
We have recently validated and extended some of the results of the CRISP study in a Swiss cohort of young ADPKD patients (age 18–42 years) with preserved GFR [10] . Thus we were able to show that kidney volume changes could be reliably assessed with MRI within a time period as short as 6 months. Using a T1-weighted
Dow
nloa
ded
by:
5.15
.45.
63 -
4/6
/201
5 4:
43:0
0 P
M

Autosomal Dominant Polycystic Kidney Disease
Kidney Blood Press Res 2009;32:380–387 381
In 85% of the cases, ADPKD is caused by mutations in the PKD1 gene which encodes the ciliary protein polycys-tin-1. In 15%, the PKD2 gene which encodes polycystin-2 is mutated. Mutations in other genes may account for some cases but have not yet been characterized. Cases with PKD1 gene mutations have a more severe course, with ESRD occurring at an average age of 54 years which is roughly 10 years earlier than in patients with mutations in the PKD2 gene. Thus, fewer patients with PKD2 muta-tions reach ESRD during their lifetime [5] .
How to Follow Disease Progression:
GFR versus Cyst or Kidney Volume
Currently, changes in GFR are considered the gold standard for quantifying the progression rate in most chronic renal diseases. However, owing to the remarkable capability of intact nephrons to compensate for the loss of functional parenchyma, GFR measurement may fail to disclose ominous changes at early stages of kidney dis-eases. In his classical paper, Dalgaard [6] reported on 346 individuals from Denmark with polycystic kidneys and found that palpable kidneys appeared in relatively young patients long before the onset of uremia. He concluded that cyst growth preceded and ultimately caused the onset of uremia. Indeed, data from several longitudinal ADPKD cohort studies have now demonstrated that cyst volume growth represents a continuous process which begins in childhood or adolescence [7–10] and precedes GFR decline by years [11] , as shown in figure 1 .
Considering the grossly distorted kidney architecture at the time when GFR starts to decline, early intervention before cysts have replaced the bulk of intact renal paren-chyma is probably warranted but a treatment effect on GFR would be evident only after several years. GFR is therefore not suitable as a primary end point for clinical studies testing early intervention. There is not much doubt that cyst growth is ultimately responsible for sub-sequent loss of glomerular filtration through direct (com-pression) and indirect (e.g. fibrosis) effects. Given the continuous rate of cyst growth during early ADPKD, kid-ney or cyst volume enlargement is an obvious surrogate endpoint for clinical trials at that stage, and attempts have been made to correlate kidney volume progression with GFR decline in several longitudinal studies by serial im-aging.
Ultrasound is inaccurate for determining small chang-es in renal volume and is not suitable for very large kid-neys. Using a long observation period with an average of
7.8 years of follow-up, however, Fick-Brosnahan et al. [7] were able to demonstrate a significant inverse relation-ship between the rate of kidney volume growth and the rate of GFR decline. Computed tomography (CT) has been used to monitor polycystic kidney volumes in sev-eral studies [12–14] . By combining data from a prospec-tive and a retrospective study it could be shown that pa-tients who develop renal insufficiency by the end of fol-low-up exhibit a markedly higher volume growth [11] . A concern related to the use of serial CT for disease moni-toring in ADPKD is the repeated exposure of young pa-tients to ionizing radiation. Therefore, magnetic reso-nance imaging (MRI) based volumetry is emerging as the method of choice to follow kidney volumes.
The Consortium for Radiologic Imaging Studies of Polycystic Kidney Disease (CRISP) has recently pub-lished the results of yearly assessments of kidney and cyst volume measurements by MRI, and GFR by iothalamate clearance in 232 ADPKD patients who were followed over 3 years [9] . In that study, gadolinium-enhanced coronal T1-weighted images were obtained and the volumes of individual kidneys were measured using a stereologic method counting the intersections of the kidney outlines on a superimposed grid and summing the products ofthe area measurements and slice thickness from the setof contiguous images. A region-based threshold method was used to calculate cyst volumes from T2-weighted cor-onal images. Although these patients had preserved renal function and no case of nephrogenic systemic fibrosis was reported in any of these patients, the CRISP investi-gators moved to the use of image sequences obtained without gadolinium enhancement for further follow-up (CRISP II), and did not notice a change in accuracy of the volume measurements [15] .
In the CRISP study it was found that total kidney vol-ume and total cyst volume increased exponentially with a mean ( 8 SD) annual growth rate of 5.3 8 3.9%. The baseline total kidney volume predicted the subsequent rate of increase in volume, independent of age. Further-more, higher rates of kidney enlargement were found to be associated with a more rapid decrease in renal func-tion. A baseline total kidney volume of 1 1,500 cm 3 in 51 patients was associated with a decline in GFR by 4.3 8 8.1 ml/min/year (p ! 0.001) [9] .
We have recently validated and extended some of the results of the CRISP study in a Swiss cohort of young ADPKD patients (age 18–42 years) with preserved GFR [10] . Thus we were able to show that kidney volume changes could be reliably assessed with MRI within a time period as short as 6 months. Using a T1-weighted
Dow
nloa
ded
by:
5.15
.45.
63 -
4/6
/201
5 4:
43:0
0 P
M

Wüthrich/Serra/Kistler Kidney Blood Press Res 2009;32:380–387386
Conclusions
ADPKD progression can be reliably assessed by MR and CT imaging techniques and kidney volumetry. These procedures can be used to test the effect of new investi-gational drugs in early stages of the disease, when GFR is still preserved. In later stages of the disease, progression could be monitored by following the decline of GFR, but at that time therapeutic intervention might be too late to significantly affect outcome.
There is reasonable hope that disease progression in patients with ADPKD can be delayed with newer thera-
peutic approaches which are currently being tested. At present, four treatment approaches which have been based on novel pathophysiological insights and animal data have been transferred to randomized clinical trials. Results from these ongoing studies will become available in 2010. Until then patients with ADPKD need to be ad-vised to follow the current management recommenda-tions, which at this time include optimal blood pressure control, sufficient fluid intake and avoidance of smoking and excessive caffeine intake.
References
1 Torres VE, Harris PC, Pirson Y: Autosomal dominant polycystic kidney disease. Lancet 2007; 369: 1287–1301.
2 Grantham JJ: Clinical practice: autosomal dominant polycystic kidney disease. N Engl J Med. 2008; 359: 1477–1485.
3 Cheong B, Muthupillai R, Rubin MF, Flamm SD: Normal values for renal length and vol-ume as measured by magnetic resonance imaging. Clin J Am Soc Nephrol 2007; 2: 38–45.
4 Churchill DN, Bear JC, Morgan J, Payne RH, McManamon PJ, Gault MH: Prognosis of adult onset polycystic kidney disease re-evaluated. Kidney Int 1984; 26: 190–193.
5 Hateboer N, v Dijk MA, Bogdanova N, Coto E, Saggar-Malik AK, San Millan JL, Torra R, Breuning M, Ravine D: Comparison of phe-notypes of polycystic kidney disease types 1 and 2. European PKD1-PKD2 Study Group. Lancet 1999; 353: 103–107.
6 Dalgaard OZ: Bilateral polycystic disease of the kidneys; a follow-up of two hundred and eighty-four patients and their families. Acta Med Scand Suppl 1957; 328: 1–255.
7 Fick-Brosnahan GM, Belz MM, McFann KK, Johnson AM, Schrier RW: Relationship be-tween renal volume growth and renal func-tion in autosomal dominant polycystic kid-ney disease: a longitudinal study. Am J Kidney Dis 2002; 39: 1127–1134.
8 Fick-Brosnahan GM, Tran ZV, Johnson AM, Strain JD, Gabow PA: Progression of autoso-mal-dominant polycystic kidney disease in children. Kidney Int 2001; 59: 1654–1662.
9 Grantham JJ, Torres VE, Chapman AB, Guay-Woodford LM, Bae KT, King BF Jr, Wetzel LH, Baumgarten DA, Kenney PJ, Harris PC, Klahr S, Bennett WM, Hirschman GN, Meyers CM, Zhang X, Zhu F, Miller JP; CRISP Investigators: Volume progression in polycystic kidney disease. N Engl J Med 2006; 354: 2122–2130.
10 Kistler AD, Poster D, Krauer F, Weishaupt D, Raina S, Senn O, Binet I, Spanaus K, Wüt-hrich RP, Serra AL: Increases in kidney vol-ume in autosomal dominant polycystic kid-ney disease can be detected within 6 months. Kidney Int 2009; 75: 235–241.
11 Grantham JJ, Chapman AB, Torres VE: Vol-ume progression in autosomal dominant polycystic kidney disease: the major factor determining clinical outcomes. Clin J Am Soc Nephrol 2006; 1: 148–157.
12 King BF, Reed JE, Bergstralh EJ, Sheedy PF 2nd, Torres VE: Quantification and longitu-dinal trends of kidney, renal cyst, and renal parenchyma volumes in autosomal domi-nant polycystic kidney disease. J Am Soc Nephrol 2000; 11: 1505–1511.
13 Sise C, Kusaka M, Wetzel LH, Winklhofer F, Cowley BD, Cook LT, Gordon M, Grantham JJ: Volumetric determination of progression in autosomal dominant polycystic kidney disease by computed tomography. Kidney Int 2000; 58: 2492–2501.
14 Antiga L, Piccinelli M, Fasolini G, Ene-Ior-dache B, Ondei P, Bruno S, Remuzzi G, Re-muzzi A: Computed tomography evaluation of autosomal dominant polycystic kidney disease progression: a progress report. Clin J Am Soc Nephrol 2006; 1: 754–760.
15 Bae KT, Tao C, Zhu F, Bost JE, Chapman AB, Grantham JJ, Torres VE, Guay-Woodford LM, Meyers CM, Bennett WM; Consortium for Radiologic Imaging Studies Polycystic Kidney Disease: MRI-based kidney volume measurements in ADPKD: reliability and ef-fect of gadolinium enhancement. Clin J Am Soc Nephrol 2009; 4: 719–725.
16 Torres VE, Harris PC: Mechanisms of dis-ease: autosomal dominant and recessive polycystic kidney diseases. Nat Clin Pract Nephrol 2006; 2: 40–55.
17 Torres VE, Harris PC: Polycystic kidney dis-ease: genes, proteins, animal models, disease mechanisms and therapeutic opportunities. J Intern Med 2007; 261: 17–31.
18 Torres VE, Harris PC: Autosomal dominant polycystic kidney disease: the last 3 years. Kidney Int 2009; 76: 149–168.
19 Tao Y, Kim J, Schrier RW, Edelstein CL: Ra-pamycin markedly slows disease progression in a rat model of polycystic kidney disease. J Am Soc Nephrol 2005; 16: 46–51.
20 Wahl PR, Serra AL, Le Hir M, Molle KD, Hall MN, Wüthrich RP: Inhibition of mTOR with sirolimus slows disease progression in Han:SPRD rats with autosomal dominant polycystic kidney disease (ADPKD). Nephrol Dial Transplant 2006; 21: 598–604.
21 Shillingford JM, Murcia NS, Larson CH, Low SH, Hedgepeth R, Brown N, Flask CA, Novick AC, Goldfarb DA, Kramer-Zucker A, Walz G, Piontek KB, Germino GG, Weimbs T: The mTOR pathway is regulated by poly-cystin-1, and its inhibition reverses renal cystogenesis in polycystic kidney disease. Proc Natl Acad Sci USA 2006; 103: 5466–5471.
22 Wu M, Wahl PR, Le Hir M, Wackerle-Men Y, Wüthrich RP, Serra AL: Everolimus retards cyst growth and preserves kidney function in a rodent model for polycystic kidney disease. Kidney Blood Press Res 2007; 30: 253–259.
23 Mostov KE: mTOR is out of control in poly-cystic kidney disease. Proc Natl Acad Sci USA 2006; 103: 5247–5248.
24 Serra AL, Kistler AD, Poster D, Struker M, Wüthrich RP, Weishaupt D, Tschirch F: Clinical proof-of-concept trial to assess the therapeutic effect of sirolimus in patients with autosomal dominant polycystic kidney disease: SUISSE ADPKD study. BMC Nephrol 2007; 8: 13.
25 Torres VE, Wang X, Qian Q, Somlo S, Harris PC, Gattone VH 2nd: Effective treatment of an orthologous model of autosomal domi-nant polycystic kidney disease. Nat Med 2004; 10: 363–364.
26 Torres VE: Vasopressin antagonists in poly-cystic kidney disease. Semin Nephrol 2008; 28: 306–317.
Dow
nloa
ded
by:
5.15
.45.
63 -
4/6
/201
5 4:
43:0
0 P
M

Research article
TheJournalofClinicalInvestigation http://www.jci.org Volume 120 Number 11 November 2010 4065
Lipocalin 2 is essential for chronic kidney disease progression in mice and humansAmandine Viau,1 Khalil El Karoui,1 Denise Laouari,1 Martine Burtin,1 Clément Nguyen,1
Kiyoshi Mori,2 Evangéline Pillebout,1 Thorsten Berger,3 Tak Wah Mak,3 Bertrand Knebelmann,1 Gérard Friedlander,1 Jonathan Barasch,2 and Fabiola Terzi1
1INSERM U845, Centre de Recherche “Croissance et Signalisation,” Université Paris Descartes, Hôpital Necker Enfants Malades, Paris, France. 2Department of Medicine, Columbia University, New York, New York, USA.
3The Campbell Family Institute for Cancer Research, University Health Network, Toronto, Ontario, Canada.
Mechanismsofprogressionofchronickidneydisease(CKD),amajorhealthcareburden,arepoorlyunder-stood.EGFRstimulatesCKDprogression,butthemolecularnetworksthatmediateitsbiologicaleffectsremainunknown.WerecentlyshowedthattheseverityofrenallesionsafternephronreductionvariedsubstantiallyamongmousestrainsandrequiredactivationofEGFR.Here,weutilizedtwomousestrainsthatreactdiffer-entlytonephronreduction—FVB/Nmice,whichdevelopsevererenallesions,andB6D2F1mice,whichareresistanttoearlydeterioration—coupledwithgenome-wideexpressiontoelucidatethemolecularnatureofCKDprogression.Ourresultsshowedthatlipocalin2(Lcn2,alsoknownasneutrophilgelatinase–associatedlipocalin[NGAL]),themosthighlyupregulatedgeneintheFVB/Nstrain,wasnotsimplyamarkerofrenallesions,butanactiveplayerindiseaseprogression.Infact,theseverityofrenallesionswasdramaticallyreducedinLcn2–/–mice.WediscoveredthatLcn2expressionincreaseduponEGFRactivationandthatLcn2mediateditsmitogeniceffectduringrenaldeterioration.EGFRinhibitionpreventedLcn2upregulationandlesiondevelop-mentinmiceexpressingadominantnegativeEGFRisoform,andhypoxia-induciblefactor1α(Hif-1α)wascru-ciallyrequiredforEGFR-inducedLcn2overexpression.Consistentwiththis,cellproliferationwasdramaticallyreducedinLcn2–/–mice.ThesedataarerelevanttohumanCKD,aswefoundthatLCN2wasincreasedparticu-larlyinpatientswhorapidlyprogressedtoend-stagerenalfailure.TogetherourresultsuncoverwhatwebelievetobeanovelfunctionforLcn2andacriticalpathwayleadingtoprogressiverenalfailureandcystogenesis.
IntroductionRegardless of the initial insult, human chronic kidney disease (CKD) is characterized by progressive destruction of the renal parenchyma and the loss of functional nephrons, which ultimately lead to end-stage renal failure (ESRF). CKD represents a worldwide concern: in the United States, 102,567 patients began dialysis in 2003 (341 patients/million per year) (1), and similar rates were found in devel-oping countries and in particular ethnic groups (2). However, these numbers are a small fraction of the millions of patients who are thought to have some degree of renal impairment. In the United States, the prevalence of chronically reduced kidney function is 11% of adults (3). Understanding the pathophysiology of CKD progres-sion is, therefore, a key challenge for medical planning.
The mechanisms of CKD progression are poorly understood. It has been shown that reduction of the number of functional neph-rons triggers molecular and cellular events promoting compensatory growth of the remaining ones (4). In some cases, this compensatory process becomes pathological, with the development of renal lesions and ESRF. Although the pathophysiology of compensation and pro-gression is complex, unregulated proliferation of glomerular, tubu-lar, and interstitial cells may promote the development of glomerulo-sclerosis, tubular cysts, and interstitial fibrosis (5–7). The molecular programs that control this cascade of events are largely unknown.
Attempts to dissect the molecular basis of CKD have been facili-tated by the development of several experimental models of renal deterioration. Among these, the remnant kidney model is a main-
stay, since nephron reduction characterizes the evolution of most human CKD. Consequently, this model recapitulates many features of human CKD, including hypertension, proteinuria, and glomerular and tubulointerstitial lesions. Over the last 50 years, this model has led to the discovery of critical pathways and, more importantly, to the design of therapeutic strategies to slow the progression of CKD, such as the widely clinically used renin-angiotensin inhibitors (8).
More recently, studies in various mouse strains have highlight-ed the importance of genetic factors in the evolution of experi-mental nephron reduction (9–11). We previously showed that the course and extent of renal lesions following nephron reduction vary significantly between two mouse strains: whereas FVB/N mice develop severe lesions, (C57BL/6 × DBA2)F1 (hereafter referred to as B6D2F1) mice undergo compensation alone (12). Moreover, we observed that the development of renal lesions paralleled the extent of cell proliferation (12). In fact, once the compensatory growth is achieved, a second wave of cell proliferation occurs only in the FVB/N strain. Hence, this model offers a powerful tool to unravel the transcriptional programs and the critical mediators that are selectively activated long after nephron reduction to drive deterioration of the remaining nephrons.
In the present study, we performed an unbiased profiling of gene expression in the kidneys of the FVB/N and B6D2F1 mouse strains, 2 months after nephron reduction, when renal lesions develop and the second wave of cell proliferation is ongoing. We identified a critical mediator of progressive renal failure, namely the carrier protein lipo-calin 2 (Lcn2, or neutrophil gelatinase-associated lipocalin [NGAL], siderocalin, 24p3, uterocalin), and uncovered what we believe to be a novel function of Lcn2. Moreover, we elucidated a unique molecular
Conflictofinterest: The authors have declared that no conflict of interest exists.
Citationforthisarticle: J Clin Invest. 2010;120(11):4065–4076. doi:10.1172/JCI42004.
Downloaded from http://www.jci.org on March 3, 2015. http://dx.doi.org/10.1172/JCI42004
research article
TheJournalofClinicalInvestigation http://www.jci.org Volume 120 Number 11 November 2010 4071
sion of Lcn2 significantly correlated with hyperproliferation and CKD progression in both mice and humans. We have further iden-tified Hif-1α as a crucial intermediate between EGFR and Lcn2 upregulation. Collectively, these results elucidate what we believe to be a novel molecular pathway of CKD progression and show that Lcn2 acts as a growth-promoting factor whose overexpression identifies patients with rapid CKD progression.
Lcn2, like all members of the lipocalin superfamily, binds hydro-phobic ligands; the ligand is thought to define the function of the protein. Lcn2 binds enterochelin (20), parabactin (20), and carboxy-mycobactin (30), which are siderophores produced by bacteria for the purpose of binding iron. The siderophore-chelating property of Lcn2 renders it a bacteriostatic agent (20). Consistent with this finding, Lcn2 mutant mice have a profound defect in the defense against E. coli (19, 31) and Mycobacterium tuberculosis (32). Nonethe-less, Lcn2 expression dramatically increases in several aseptic patho-logical conditions such as cancers (33), inflammatory diseases (34), and acute kidney injury (24), suggesting that Lcn2 may have other functions. To date, study of its noninfectious activities has focused on its effects on cell proliferation and/or apoptosis (24), but proof of these in a physiological setting in vivo has been lacking. Even in the case of acute kidney injury, a disease that is related to CKD, it remains unclear whether Lcn2 is a critical mediator of tubular changes (19). Hence, our work is the first clear demonstration to our knowledge that in vivo Lcn2 has a critical function in a patho-logical condition other than infection, namely serving as a growth regulator that mediates CKD progression. Our findings in mice and
humans may be generally applicable to many forms of CKD, because Lcn2 is also expressed in obstruc-tive uropathy (16), diabetic nephropathy (16), and in damaged kidneys of patients with IgA nephropathy (17) or HIV-associated nephropathy (18).
Our study shows that Lcn2, which is induced by EGFR, controls aberrant growth of renal tubules and cysts. Notably, we demonstrated that Lcn2 gene inactivation inhibited proliferation of tubular cells, which led to a marked decrease in cyst formation in mice. Consistently, we identified cystic tubular epi-thelia as the major source of Lcn2 production. These data suggest that Lcn2 might act as a tubulogenic factor that controls cell growth. This is supported by additional evidence: first, Lcn2 induced tubular development in in vitro assays in the rat (35); second, Lcn2 infusion favored tubular regeneration after ischemic injury in mice (36); third, high LCN2 levels were associated with a higher rate of cystic growth in humans (37). This property was not limited to mammalian cells: Lpr-1, a newly identified lipocalin family member, controlled unicellular tube develop-ment in the excretory system of Caenorhabditis elegans (38). Our data also suggest that Lcn2 may modulate tubular shape by controlling both cell proliferation and apoptosis. In fact, the beneficial effect of Lcn2 gene inactivation in mutant mice was accompanied by a decrease in tubular apoptosis, consistent with a previous observation in proximal tubule lacking Pkd1, a cystic disease–associated gene (39). However, this effect may be indirect, since Lcn2 silencing in vitro did not affect the number of apoptotic tubu-lar cells. Whether the growth-promoting effect of
Lcn2 is mediated by the binding of Lcn2 to a unique receptor, thus inducing a signaling cascade, or alternatively by iron mobilization, as suggested by the DFO experiments, remains to be elucidated.
In the present study we observed that Lcn2 gene inactivation pro-tected from glomerulosclerosis and interstitial fibrosis after nephron reduction, despite the fact that Lcn2 was expressed only by tubules. The mechanism for this observation remains unknown. It may result from the perfusion and filtration of serum Lcn2 that we found by immunostaining in the tubules. Alternatively, since injuries to tubu-lar cells, i.e., proteinuria, result in the expression of tubular cytokines and growth factors that ultimately lead to mesangial cell proliferation and matrix synthesis (40), it is tempting to hypothesize a crosstalk between tubular and surrounding renal cells. Studies in transgenic mice strongly support this idea. For example, it has been observed that mice that overexpressed VEGF selectively in tubules developed interstitial fibrosis and glomerular disease (41). And we have previ-ously shown that the overexpression of a dominant negative isoform of EGFR in proximal tubules prevented the development of glomeru-lar and interstitial lesions after nephron reduction (26). On the other hand, it has been shown that interstitial scarring resulted in the loss of microvessels, which, in turn, impacted the adjacent unaffected glomeruli (42). It is worthy of note that the synthesis of paracrine mediators may increase in proliferating tubular cells (43). Hence, we speculate that by inhibiting tubular cell proliferation, Lcn2 might protect glomeruli and interstitium from lesions development.
Activation of EGFR has been implicated in the evolution of CKD. Overexpression of an active EGFR form, the c-erb-B2 receptor, induc-
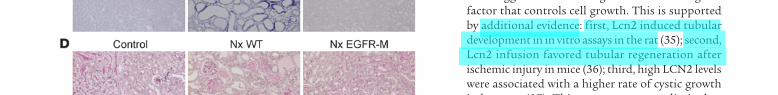
Figure 6Lcn2 is a transcriptional target of EGFR. Lcn2 protein (A) and mRNA (B) expression in mIMCD-3 cells, 24 hours after EGF treatment. (C and D) Overexpression of a dominant negative EGFR isoform abolishes renal Lcn2 synthesis and prevents lesion development after nephron reduction. (C) Lcn2 mRNA expression visualized by in situ hybridization (original magnification, ×100) and (D) renal morphology (PAS, ×200) of kidneys from control and 75% Nx wild-type and EGFR-M mice, 2 months after sur-gery. Data are mean ± SEM; n = 2–3 and 6–10 for in vitro and in vivo experiments, respectively. Wilcoxon test: *P < 0.05, vehicle- versus EGF-treated cells.
Downloaded from http://www.jci.org on March 3, 2015. http://dx.doi.org/10.1172/JCI42004

Early Renal Abnormalities in Autosomal DominantPolycystic Kidney Disease
Esther Meijer,* Mieneke Rook,† Hilde Tent,* Gerjan Navis,* Eric J. van der Jagt,†
Paul E. de Jong,* and Ron T. Gansevoort**Division of Nephrology, Department of Internal Medicine and †Department of Radiology, University Medical CenterGroningen, University of Groningen, Groningen, The Netherlands
Background and objectives: Potential therapeutic interventions are being developed for autosomal dominant polycystickidney disease (ADPKD). A pivotal question will be when to initiate such treatment, and monitoring disease progression willthus become more important. Therefore, the prevalence of renal abnormalities in ADPKD at different ages was evaluated.
Design, setting, participants, & measurements: Included were 103 prevalent ADPKD patients (Ravine criteria). Measuredwere mean arterial pressure (MAP), total renal volume (TRV), GFR, effective renal plasma flow (ERPF), renal vascularresistance (RVR), and filtration fraction (FF). Twenty-four-hour urine was collected. ADPKD patients were compared withage- and gender-matched healthy controls.
Results: Patients and controls were subdivided into quartiles of age (median ages 28, 37, 42, and 52 years). Patients in thefirst quartile of age had almost the same GFR when compared with controls, but already a markedly decreased ERPF and anincreased FF (GFR 117 � 32 versus 129 � 17 ml/min, ERPF 374 � 119 versus 527 � 83 ml/min, FF 32% � 4% versus 25% � 2%,and RVR 12 (10 to 16) versus 8 (7 to 8) dynes/cm2, respectively). Young adult ADPKD patients also had higher 24-hour urinaryvolumes, lower 24-hour urinary osmolarity, and higher urinary albumin excretion (UAE) than healthy controls, although TRVin these young adult patients was modestly enlarged (median 1.0 L).
Conclusions: Already at young adult age, ADPKD patients have marked renal abnormalities, including a decreased ERPFand increased FF and UAE, despite modestly enlarged TRV and near-normal GFR. ERPF, FF, and UAE may thus be bettermarkers for disease severity than GFR.
Clin J Am Soc Nephrol 5: 1091–1098, 2010. doi: 10.2215/CJN.00360110
A utosomal dominant polycystic kidney disease (ADPKD) isthe most prevalent inherited renal disease with anestimated prevalence between 1:400 and 1:1000 (1).
The disease is characterized by pain, hematuria, and mostimportantly by progressive cyst formation in both kidneys,often leading to ESRD. Annually, 7.8 male and 6.0 femaleindividuals per million of the population start renal replace-ment therapy in Europe because of polycystic kidneys, whichis 6% of the new ESRD patients (2).
Current treatment cannot prevent renal failure.(3,4) How-ever, a better understanding of the pathophysiology of thedisease and the availability of animal models identified prom-ising candidate drugs for renal preservation (5). Clinical trialshave been initiated for vasopressin-2 receptor antagonists,long-acting somatostatin analogues, and mammalian target ofrapamycin inhibitors (6).
When efficacy of these agents has been established, a pivotalquestion will be when to initiate such treatment. Given that
ADPKD is a progressive condition, it seems most appropriateto initiate intervention as early in life as possible to delay orprevent long-term consequences, including renal failure andcardiac complications. On the other hand, ESRD occurs inapproximately 50% of affected subjects (7,8), and it is not ap-propriate to expose those subjects that will not reach ESRD toexcessive medical treatment to such an extent as to cause ad-verse events, especially because all candidate drugs have con-siderable side effects. Because of these reasons, it will be im-portant to discover markers that identify ADPKD patients whowill develop rapid disease progression. In such patients, ther-apy could be instituted in an early phase.
It will therefore become important to define disease severityin ADPKD. Criteria to make this distinction are not crystalclear. GFR is believed to be stable for a long period, despiteprogression of renal anatomical abnormalities, because of com-pensatory hyperfiltration. GFR is therefore assumed not to berepresentative of disease severity (9,10). Total renal volume(TRV) has been proposed as a surrogate marker for diseaseprogression (10). However, despite a significant overall associ-ation, there are subjects with a high TRV but normal renalfunction (11). Another parameter that is decreased early in thedisease is urine concentrating capacity (12). Other candidatemarkers to define disease severity are albuminuria (13,14) andrenal blood flow (RBF) (15,16). Despite evidence for the impor-
Received January 14, 2010. Accepted March 10, 2010.
Published online ahead of print. Publication date available at www.cjasn.org.
Correspondence: Dr. Ron T. Gansevoort, Division of Nephrology, Department ofMedicine, University Medical Center Groningen, PO Box 30.001, 9700 RB Gro-ningen, The Netherlands. Phone: 0031-50-3616161; Fax: 0031-50-3619310; E-mail:[email protected]
Copyright © 2010 by the American Society of Nephrology ISSN: 1555-9041/506–1091
tance of finding early renal abnormalities in ADPKD, system-atic evaluation of hemodynamic parameters, especially withrespect to RBF, renal vascular resistance (RVR), and filtrationfraction (FF), has received little attention. Therefore, we inves-tigated renal parameters in ADPKD at different ages in com-parison to healthy subjects.
Materials and MethodsPatients
One hundred and eighteen consecutive patients with ADPKD visit-ing our outpatient clinic, meeting our inclusion and exclusion criteriawere asked to participate. Diagnosis of ADPKD was made based onRavine criteria (17). Subjects were ineligible to participate if they wereon renal replacement therapy; had undergone renal surgery; wereunable to undergo magnetic resonance imaging (MRI) (as having dis-torting foreign bodies or aneurysmal clips); had other systemic diseasespotentially affecting renal function (as diabetes mellitus and malignan-cies); or had other medical conditions that included pregnancy, lacta-tion, or who were �6 months postpartum. After screening, subjectsunderwent an extensive medical history. Thirteen patients refused toparticipate and two patients were not eligible to participate, leaving 103patients for analyses. Subjects were scheduled for a 1-day outpatientclinic evaluation.
Values of these patients were compared with healthy controls. Thesewere drawn from a pool of subjects who were screened for live kidneydonation and underwent the same evaluation, but without MRI (n �
103). Values for healthy controls depicted in tables or figures arederived from these live kidney donors. Twenty-four-hour urine collec-tion was not available for all donor screenees. Values considering24-hour urinary volume (osmolarity and albumin excretion) weretherefore drawn from subjects participating in the Prevention of Renaland Vascular Endstage Disease (PREVEND) study (n � 103) (18,19).Controls were matched for age and gender with ADPKD patients andwere considered healthy in case they had a history without cardiovas-cular and/or renal disease and used no medication [other than antihy-pertensive medication, but no angiotensin converting enzyme inhibi-tors (ACEIs)/angiotensin receptor blockers (ARBs)]. All patients andcontrols were of Caucasian ethnicity. There was no difference in age(P � 0.7), gender (P � 0.9), mean arterial pressure (MAP; P � 0.4), bodysurface area (P � 0.5), or body mass index (BMI; P � 0.7) between thetwo control groups (live kidney donors and the subjects from thePREVEND study). Study site and laboratory methods were the samefor patients and the control groups (all subjects were seen in oneinstitution).
This study was performed in adherence to the Declaration of Hel-sinki. All subjects gave written informed consent.
Measurements and DefinitionsBlood pressure (BP) was assessed with an automatic device (Di-
namap) for 15 minutes during the renal function measurement. Systolicand diastolic BP values were used to calculate MAP using the standardformula MAP � 2/3 � diastolic BP � 1/3 � systolic BP. Patientscollected a 24-hour urine sample before the outpatient visit. Weight andheight were determined. BMI was calculated as weight in kilograms/height2 (measured to the nearest 0.5 kg and 0.5 cm, respectively).
Urinary albumin concentration was determined by nephelometry(BNII, Dade Behring Diagnostics, Marburg, Germany). Blood sampleswere drawn before renal function measurement for determination ofserum electrolyte, hemoglobin (Hb), creatinine, and urea. Concentra-tions of Hb, sodium, potassium, cholesterol, and glucose were mea-sured in serum or urine using standard methods. Creatinine was mea-
sured with the Roche enzymatic creatinine assay. Creatinine valueswere used to calculate an estimated GFR (eGFR) using the abbreviatedModification of Diet in Renal Disease formula (20). Microalbuminuriawas defined as a urinary albumin excretion (UAE) of �30 mg/24 h.Urinary osmolarity was calculated as urinary osmolarity � 2(urinarysodium concentration � urinary potassium concentration) � urinary ureaconcentration (21). This calculated osmolarity was not different frommeasured values (independent sample t test P � 0.94 in 100 samples,measured in our own laboratory).
Renal function measurements were performed using the constantinfusion method with 125I-iothalamate and 131I-hippuran (22,23). Pa-tients came nonfasting and were able to drink ad libitum except for nocaffeinated drinks. Antihypertensive medications were not withheld.Smoking was not allowed during the measurement. After drawing atimepoint-0 blood sample, a priming solution containing 20 ml ofinfusion solution (0.04 MBq of 125I-iothalamate and 0.03 MBq of 131I-hippuran) was given at 08.00 hours, followed by a constant infusion at6 to 12 ml/h, with the lowest infusion rates in subjects with impairedrenal function on the basis of previously known serum creatinine.Plasma concentrations of both tracers were allowed to stabilize during1.5 hours of equilibration, which was followed by two 2-hour periodsfor simultaneous clearances of 125I-iothalamate and 131I-hippuran.Clearances are calculated as U � V/Piot and (I � V)/Phipp, respectively.Because urinary clearance of 131I-hippuran equals plasma clearance, incase of perfect urine collection, we routinely use the ratio of plasma-to-urinary clearance of 131I-hippuran to correct urinary clearance of125I-iothalamate for voiding errors (24). This method to correct forurinary collection errors is extensively described and validated (22–24).Coefficient of variation for GFR is 2.5% and for effective renal plasmaflow (ERPF) is 5% (22). RBF was calculated as ERPF/(1 � hematocrit).RVR was calculated as MAP/RBF � 80,000 (16,25).
Patients underwent a standardized abdominal MRI protocol withoutthe use of intravenous contrast. Scanning was performed on a 1.5-TeslaMRI Magnetom Avento (Siemens, Erlangen, Germany) with the use ofbody matrix and spine matrix coils. T2 weighted fast imaging (trueFISP) series were scanned during breath-hold. T2 weighted turbo spinecho (HASTE) series were scanned during free breathing with breathtriggering on the diaphragm (prospective acquisition correction—PACE). Transversal images were obtained with a fixed slice thicknessof 5.0 mm. Coronal images were obtained with a fixed slice thickness of4.0 mm. Renal volume was measured on T2 weighted coronal images.Analyze Direct 8.0 (AnalyzeDirect, Inc., Overland Park, KS) softwarewas used to analyze the volumes. Foxel size was forced to cubic toallow for three-dimensional viewing. Manual selection of the renalcontours on every fifth slice with semiautomated propagation was usedto obtain full selection of the kidneys, excluding the pyelum. All con-tours were checked manually before assessing TRV.
Statistical AnalysesAnalyses were performed with SPSS version 16.0 (SPSS, Inc., Chi-
cago, IL). Parametric variables are expressed as mean � SD, whereasnonparametric variables are given as median (interquartile range). Atwo-sided P � 0.05 was considered to indicate statistical significance.Differences between ADPKD patients and healthy controls were testedusing an independent sample t test when normally distributed or aMann–Whitney test when not normally distributed. Analyses wereperformed for ADPKD patients and healthy controls and divided intoquartiles of age, illustrating the differences between patients and con-trols in the different stages of disease. P values for differences betweenthe age quartiles were obtained using an ANOVA or a Kruskal–Wallistest. To investigate whether TRV was associated with GFR, ERPF, FF,and RVR, multiple regression analysis was performed. Logarithmic
1092 Clinical Journal of the American Society of Nephrology Clin J Am Soc Nephrol 5: 1091–1098, 2010

http://cursoenarm.net/UPTODATE/contents/mobipreview.htm?31/62/32736?source=related_link
Diagnosis of and screening for autosomal dominant polycystic kidney disease
Authors
Vicente E Torres
William M Bennett
Section Editor
Ronald D Perrone
Deputy Editor
John P Forman
Last literature review version 19.3: Fri Sep 30 00:00:00 GMT 2011 | This topic last
updated: Wed Mar 30 00:00:00 GMT 2011
INTRODUCTION — Autosomal dominant polycystic kidney disease (ADPKD) is a common
disorder, occurring in approximately 1 in every 400 to 1000 live births [1-3]. It is estimated
that less than one-half of these cases will be diagnosed during the patient's lifetime, as the
disease is often clinically silent [1].
Approximately 85 percent of families with ADPKD have an abnormality on chromosome 16
(PKD1 locus) that is tightly linked to the alpha-globin gene locus [4]. The remaining patients
have a different defect that involves a gene on chromosome 4 (the PKD2 locus).
(See "Genetics of autosomal dominant polycystic kidney disease and mechanisms of cyst
growth".)
Patients with PKD2 have a less severe phenotype than those with PKD1, but neither disorder
is benign [5]. Cysts occur later in PKD2 disease, as does end-stage renal disease (mean age
74.0 versus 54.3 years in PKD1) [6]. As a result, false negative results are more likely when
screening young subjects with PKD2 disease. (See "Course and treatment of autosomal
dominant polycystic kidney disease".)
The diagnosis of and screening for ADPKD will be reviewed here. The course and treatment
of this disorder are discussed separately. (See"Course and treatment of autosomal dominant
polycystic kidney disease".)
OVERVIEW — The diagnosis of ADPKD relies principally upon imaging of the kidney [7].
Typical findings include large kidneys and extensive cysts scattered throughout both
kidneys. Because of cost and safety, ultrasonography is most commonly used as the imaging
modality. In certain settings, genetic testing is required for a definitive diagnosis.
Important issues related to the diagnosis of ADPKD include the presence or absence of a
family history of the disease, the number and types of renal cysts, and the age of the
patient.
POSITIVE FAMILY HISTORY
Screening and diagnosis of asymptomatic individuals — Screening for the diagnosis of
ADPKD in an asymptomatic individual at risk because of a positive family history usually

These criteria were derived from an ultrasonographic study of 128 individuals at risk for
PKD1 that compared imaging findings with genotype [10]. The specificity of these criteria
was found to be 100 percent for all patients at risk for type 1 ADPKD [9,11]. By comparison,
the sensitivity of these findings varies by patient age [9,11]. Among patients between 15
and 30 years of age at risk for type 1 disease, the sensitivity of these criteria is 95 percent.
The sensitivity increases to 97 to 100 percent for those older than 30 years of age. Thus, a
negative ultrasound can definitely exclude type 1 disease when the patient is older than 30
years, although the false negative rate at age 20 is only about 4 percent [10,11].
At risk for type 2 ADPKD — Some asymptomatic patients at risk for ADPKD are from
families with known and well-characterized pathogenic mutations in the PKD2 locus. In this
setting, testing for the known mutation is more definitive and may be more cost-effective
than ultrasonography.
If genetic testing is not available or less desirable, established ultrasonographic criteria are
less sensitive for patients who are known to be at risk for type 2 ADPKD. In this setting,
some clinicians would use the ultrasonographic criteria created for those at risk for ADPKD
but of unknown familial genotype, as noted above.
Other imaging modalities — Because CT and magnetic resonance imaging (MRI) are more
sensitive than ultrasonography, the sonographic criteria listed above are not applicable to
these modalities. Contrast enhanced CT scanning or MRI or heavy-weighted unenhanced T2
MR images can reliably detect small cysts of 2 to 3 mm diameter [12].
Although not formally evaluated and only studied in small case series and reports, we
believe that a negative test (no cysts in either the kidneys or the liver) found with these
techniques by 20 years of age virtually excludes the presence of PKD, at least for type 1
disease.
Conversely, among patients with equivocal ultrasonographic studies, these techniques may
demonstrate numerous small cysts, thereby possibly precluding the need for genetic testing.
Approach after equivocal ultrasound results — No formal studies have compared CT or
MRI techniques, or genetic testing among at risk adult patients with equivocal
ultrasonographic results. In the setting of an equivocal ultrasound, some clinicians prefer
genetic testing, while others choose either a CT scan or MR study with genetic testing
performed if the diagnosis remains uncertain after additional radiologic evaluation.
(See 'Genetic testing' below.)
Infant/child — In an infant/child at 50 percent risk for ADPKD, ultrasonography of the
kidney is less useful than in adults, with inconclusive results being noted in one-half of those
at risk (particularly children less than five years of age) [13]. As previously mentioned, we
recommend NOT screening in children. However, if desired, we use renal ultrasonography
for initial evaluation because it is safe and inexpensive.
The finding of large echogenic kidneys without distinct macroscopic cysts in infants is highly
suggestive of the disease. The presence of one cyst is adequate for the diagnosis in an at-
risk child (0 to 15 years of age) [13].

Fax +41 61 306 12 34E-Mail [email protected]
Original Report: Laboratory Investigation
Am J Nephrol 2007;27:373–378 DOI: 10.1159/000103912
Neutrophil Gelatinase-Associated Lipocalinin Patients with Autosomal-DominantPolycystic Kidney Disease
Davide Bolignano
a Giuseppe Coppolino
a Susanna Campo
a Carmela Aloisi
a
Giacomo Nicocia
b Nicola Frisina
a Michele Buemi
a
a Chair of Nephrology, Department of Internal Medicine, and b
Department of Pathology andExperimental Microbiology, University of Messina, Messina , Italy
sNGAL and uNGAL levels with respect to others (sNGAL: 242 8 89 vs. 88 8 34 ng/ml, p ! 0.05; uNGAL: 158 8 45 vs. 73 8 27 ng/ml, p ! 0.05). The strict correlation between NGAL levels and residual renal function is perfectly in accord with recent studies on patients with other ESRD-associated dis-eases. We can hypothesize that tubular cells produce big quantities of NGAL as a consequence of increased apoptosis following chronic damage or as a compensatory response, similar to that observed in acute stress conditions (ischemia, toxicity ...). Finally, our last finding that patients with HCG showed higher levels of NGAL suggests that this protein could be also involved in the cyst growth process, as previ-ously reported about epithelial and tumoral expansion.
Copyright © 2007 S. Karger AG, Basel
Introduction
Autosomal-dominant polycystic kidney disease (AD-PKD) is a genetic disorder characterized by renal tubular cell proliferation and multiple cyst formation. For many reasons which are still unknown only in a variable per-centage of patients affected these cysts undergo progres-sive enlargement, causing symptoms including hematu-ria and hypertension, leading to end-stage renal failure.
Key Words Neutrophil gelatinase-associated lipocalin � Autosomal-dominant polycystic kidney disease � Chronic renal failure � Cyst growth
Abstract It is known that many tubular proteins are involved in the pathogenesis of autosomal-dominant polycystic kidney dis-ease (ADPKD), which causes 8–10% of the cases of end-stage renal disease (ESRD) worldwide. Neutrophil gelatinase-asso-ciated lipocalin (NGAL) is a protein expressed on tubular cells of which the production is markedly increased in response to harmful stimuli such as ischemia or toxicity. In the present study, serum and urinary NGAL levels were evaluated in 26 ADPKD subjects. Both levels were significantly higher in pa-tients than in controls (sNGAL 174 8 52 vs. 50 8 27 ng/ml,p ! 0.05; uNGAL 119 8 42 vs. 7 8 6 ng/ml, p ! 0.005) anda close correlation was also found between these parame-ters and the residual renal function (sNGAL/GFR: r = –0.8,p = 0.006; sNGAL/Creatinine: r = 0.9, p = 0.007; uNGAL/GFR: r = –0.49, p ! 0.05; uNGAL/Creatinine: r = 0.84, p ! 0.001). Patients were further divided into two groups according to the cystic development assessed with echotomography; subjects with higher cystic growth (HCG) presented higher
Received: March 14, 2007 Accepted: May 15, 2007 Published online: June 13, 2007
NephrologyAmerican Journal of
Prof. Michele Buemi Via Salita Villa Contino, 30 IT–98100 Messina (Italy) Tel. +39 090 221 2265, Fax +39 090 293 5162E-Mail [email protected]
© 2007 S. Karger AG, Basel0250–8095/07/0274–0373$23.50/0
Accessible online at:www.karger.com/ajn

Bolignano /Coppolino /Campo /Aloisi /Nicocia /Frisina /Buemi
Am J Nephrol 2007;27:373–378374
The mechanism underlying the above disorder is not yet fully understood, although it seems clear that PKD1, PKD2 and PKD3 gene mutation, causing abnormal poly-cystins function, merely signals the onset of a process which subsequently involves several further components, including other tubular proteins, cytokines and growth factors. Findings of previous studies conducted on mice models of PKD have underlined that cyst development is also linked to tubulointerstitial abnormalities whereas cultured parietal epithelial cells express increased levels of tubular stress proteins, such as MCP-1 and osteopon-tin, suggesting they might play a role in cystogenesis [2, 3] .
Neutrophil gelatinase-associated lipocalin (NGAL) is a protein produced by neutrophils and various epithelial cells, including renal tubular cells [4] in reply to numer-ous pathological conditions including ischemic, toxic or infective renal damage [5–7] . The aim of the present study was therefore to assess the potential role of this protein by analyzing its urinary and serum levels in a group of patients with ADPKD.
Materials and Methods
Patient Profile The study was conducted on 26 ambulatory ADPKD patients
(14 M, 12 F; mean age 43 8 12 years) who had not undergone he-modialysis or renal transplantation. The mean serum creatinine level of patients was 2.2 8 1.5 mg/dl, and the GFR (creatinine clearance assessed using the Cockcroft-Gault formula) was 59 8 38 ml/min. The diagnosis of ADPKD, made on the basis of typical ultrasound or CT findings, was confirmed by the identification of hepatic cysts or a positive familiar history. Any patients under-went treatment with steroids, immunosuppressors, ACE inhibi-tors or angiotensin receptor blockers throughout the study. None of the patients were affected by any neoplastic disease, concomi-tant infections and leukocyte formula alterations, and gave their fully informed consent to take part in the study, which was ap-proved by the local ethics committee. Table 1 provides details of the characteristics of the patients. According to other authors [8] , the patients were divided into two groups on the basis of the cyst
development, evaluated echotomographically. Patients with n ! 10 cysts and renal length ! 16 cm (n = 15) were assigned to the low cyst growth (LCG) group, while patients with n 1 10 cysts and renal length 1 16 cm (n = 11) were assigned to the high cyst growth (HCG) group.
Control Group The control group consisted of 26 healthy volunteers (13 M, 13
F; mean age 37 8 8 years) with mean serum creatinine levels of 0.9 8 0.3 mg/dl and a mean GFR (creatinine clearance assessed using the Cockcroft-Gault formula) of 115 8 32 ml/min. All con-trol subjects gave their fully informed approval to take part in the study.
Collection of Blood and Urine Blood samples were taken in the morning without any food
intake, also collecting the second urine miction of the day. The blood samples were placed immediately into chilled vacutainer tubes containing potassium ethylenediaminetetraacetate and the plasma was promptly separated in a refrigerated centrifuge. The samples were then stored at –80 ° C until assayed.
Ten milliliters of fresh urine was mixted with 1 ml of 10 m M tris buffer, pH 8.6 with 0.05% Tween 20 and 0.01% of NaN 3 con-taining protease inhibitors (10 m M benzamidine, 10 m M amino-caproic acid, 20 m M ethylenediaminetetracetate and aprotinin). This mixture was centrifuged at 3,000 rpm for 8 min and stored at –80 ° C until assayed. All the urine and blood specimens were used for the study within 1 month after collection.
NGAL ELISA Assay NGAL was measured in the blood and urine using ELISA
commercial available kit (Antibody Shop, Gentofte, Denmark) according to the manufacturer’s instructions. All specimens were often diluted to obtain concentration for the optimal density reading described in the ELISA kit instruction. The enzymatic reactions were quantified in an automatic microplate photometer. All measurements were made in a triplicate and in a blinded man-ner. NGAL levels were expressed as ng/ml.
Statistical Analyses A statistical analysis of data was made using Microsoft Excel
(version 5.0) software and the GraphPad Prism (version 4.0) pack-age. An unpaired two-tailed t test was used for comparing the two groups, and Pearson’s correlation coefficient was employed to test correlations between variables. p ! 0.05 was considered statisti-cally significant. All data were expressed as mean 8 SD.
Table 1. Patients’ profile and comparison of serum and urinary levels of NGAL between healthy subjects and ADPKD patients
Group n Age GenderM/F
sCrmg/dl
GFRml/min
Raff Ydis sNGALng/ml
uNGALng/ml
ADPKD patients 26 43812 14/12 2.281.5 59838 382 1084 174852a 119842b
Control subjects 26 3788 13/13 0.980.3 115832 – – 50827 786
sCr = Serum creatinine; GFR = glomerular filtration rate (Cockcroft-Gault); Raff = relatives affected; Ydis = years of disease;sNGAL = serum NGAL; uNGAL = urinary NGAL. a p < 0.05 vs. controls; b p < 0.005 vs. controls.

NGAL and Polycystic Kidney Disease Am J Nephrol 2007;27:373–378 375
Results
Serum and Urinary NGAL Levels in ADPKD Patients and Control Subjects In healthy subjects, serum NGAL levels (sNGAL) were
50 8 27 ng/ml, while urinary NGAL levels (uNGAL) were 7 8 6 ng/ml, values falling within the normal range. On the contrary, in ADPKD patients sNGAL levels were 174 8 52 ng/ml and uNGAL levels were 119 8 42 ng/ml with a statistical significance with respect to controls (sNGAL, p ! 0.05; uNGAL p ! 0.005; fig. 1 , 2 , respec-tively). Data from the comparisons made between the variables are reported in table 1 .
NGAL Levels and Renal Function in ADPKD Patients In ADPKD subjects, sNGAL levels were inversely cor-
related with the residual GFR (r = –0.8, p = 0.006) and directly correlated with serum creatinine (r = 0.9, p = 0.007). Likewise, uNGAL levels were inversely correlated with the residual GFR (r = –0.49, p ! 0.05) and directly related to creatininemia (r = 0.84, p ! 0.001). The com-plete data on these correlations are shown in table 2 .
NGAL Levels and Cyst Development ADPKD patients were further divided into two groups
on the basis of number of cysts and renal dimensions evaluated with echotomography. Patients with n ! 10 cysts and a renal length ! 16 cm (n = 15) were assigned to the LCG group, and patients with n 1 10 cysts and a renal length 1 16 cm (n = 11) were assigned to the HCG group. No statistically significant differences were found be-tween the two groups for the residual GFR. On the con-trary, HCG patients showed significantly higher serum- and urinary-NGAL levels than LCG patients (sNGAL: 242 8 89 vs. 88 8 34 ng/ml, p ! 0.05; uNGAL: 158 8 45
vs. 73 8 27 ng/ml, p ! 0.05; fig. 3 , 4 ). Full data about the two groups are reported in table 3 .
Discussion
ADPKD, the most common hereditary monogenic dis-order worldwide, has a prevalence of 1/750 among new-borns and causes 8–10% of cases of end-stage renal disease (ESRD). Its progression rate varies greatly between pa-tients and about 50% of subjects with ADPKD eventually reach ESRD [9] . The reason for this individual variability is not yet fully understood and can only be partly ex-plained on the basis of various genetic-environmental patterns. Currently, the pathogenesis of the disease itself is widely debated. Although PKD1, PKD2 or PKD3 gene mutations, which lead to the synthesis of functionally ab-normal polycystins is the main factor underlying the dys-regulation of tubular cells, which triggers cystogenesis, it is now evident that numerous other proteins participate in the development and progression of the disease.
0
50
100
150
200
250
sNG
AL
(ng
/ml)
ADPKD
*
Controls0
50
75
100
125
175
uN
GA
L(n
g/m
l)
ADPKD
**
Controls
150
25
Table 2. Correlation (r) between serum and urinary levels of NGAL, serum creati-nine and GFR (Cockcroft-Gault) inADPKD patients
GFR sCr
sNGAL –0.8a 0.90b
uNGAL –0.49c 0.84d
a p = 0.006; b p = 0.007; c p < 0.05; d p < 0.001.
Fig. 1. Differences in serum NGAL con-centrations between ADPKD patients and control subjects. * p ! 0.05. Fig. 2. Differences in urinary NGAL con-centrations between ADPKD patients and control subjects. * * p ! 0.005.
1 2
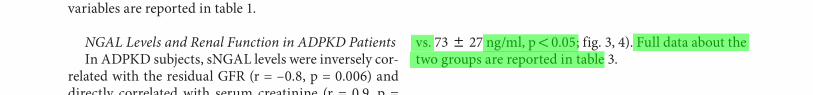

Bolignano /Coppolino /Campo /Aloisi /Nicocia /Frisina /Buemi
Am J Nephrol 2007;27:373–378376
Kuehn et al. [10] have shown that the expression of the kidney-injury molecule-1 (KIM-1), a protein of tubular origin for which urinary and tissue expression have been seen to increase in experimental models of renal ischemia or cisplatin administration [11, 12] , is particularly high and upregulated in the tubular epithelium of polycystic kidney tissue of the mouse, suggesting that it may play a role in the de-differentiation of these cells and in the de-velopment of interstitial fibrosis associated with this con-dition. A similar role might thus be played by another chemokine, monocyte chemoattractant protein-1 (MCP-1) which, in nephritis with a tubular proteic overload, has a capacity to trigger chemotaxis of the inflammatory cells with consequent interstitial tubular damage and progres-sion to chronic renal failure [13] . Zheng et al. [14] ob-served an increased urinary excretion of this protein in ADPKD patients, and in vitro research findings have shown that the epithelial cystic cells are the main source of its production, thus suggesting that it may be involved in the pathogenesis and progression of the disease. Iso-form-B of beta-N-acetylhexosaminidase (Hex B) was correlated with an ultrasonography score (kidney size + number of cysts) of disease severity in 92 ADPKD pa-tients without end-stage renal failure; this again confirms
the hypothesis that tubular damage plays a role in the progression of polycystic disease [8] .
The aim of the present study, on the other hand, was to consider for the first time in literature another protein of tubular origin, NGAL. This protein appears to play dif-ferent roles in kidney, only some of which have been well defined. For example, it is known that it acts as an iron transporter, and thus appears to be involved in the em-bryonic and adult development of the renal epithelium through the induction of iron-dependent cellular signals with a consequent inhibition of the apoptotic processes [4] . This inhibition probably underlies the protective ef-fect of NGAL against ischemic damage: increased serum and urinary levels of this protein have been observed in response to experimentally induced renal failure, and preventive administration of NGAL enhances the ability of the organ to sustain this type of stress [6, 15, 16] . An acute increase in NGAL levels has also been observed in other experimental models of tubular injury, including damage from cisplatin and viral infections [5, 7] and, in humans, after coronary angiography and cardiopulmo-nary bypass surgery [17, 18] . The findings made in the present study clearly demonstrate that in ADPKD pa-tients, serum and urinary NGAL values are significantly
Table 3. Comparison of serum and urinary levels of NGAL between the low- and the high-cyst growth groups (see text)
Group n Ydis nCyst rLencm
sCrmg/dl
GFRml/min
sNGALng/ml
uNGALng/ml
HCG 11 782 >10 17.882.1 2.581.1 49813a 242889b 158845b
LCG 15 481 <10 12.381.9 1.980.8 58819 88834 73827
Ydis = Years of disease; nCyst = number of cysts; rLen = renal length. a p not significant vs. LCG group; b p < 0.05 vs. LCG group.
0
50
100
150
200
350
sNG
AL
(ng
/ml)
HCG
*
LCG
250
300
0
50
100
150
200
225
uN
GA
L(n
g/m
l)
HCG
*
LCG
175
125
75
25
Fig. 3. Differences in serum NGAL con-centrations between high- and low-cyst growth groups. * p ! 0.05. Fig. 4. Differences in urinary NGAL con-centrations between high- and low-cyst growth groups. * p ! 0.05.
3 4
NGAL and Polycystic Kidney Disease Am J Nephrol 2007;27:373–378 377
higher than in control subjects and also correlate with both residual glomerular filtration rate and creatinin-emia, suggesting that the levels of this protein may in some way be influenced by the degree of the underlying altered renal function.
Our data are thus in agreement with those reported in recent studies demonstrating the same correlations in other diseases leading to chronic renal failure (CRF), vas-culitic processes [19] and pediatric nephritis [20, 21] par-ticularly. In the latter case, Devarajan et al. [6, 7, 15, 16] have suggested that serum NGAL might be used as a new marker of renal function, based on the evidence that this protein correlated with GFR better than creatinine and cystatin C. The biological mechanisms underlying this correlation have not yet been fully defined. As this is a protein produced principally by tubular cells, it might at first appear possible to exclude the hypothesis that a re-duced renal clearance capacity is the principal causative factor. On the contrary, the diffuse state of organic dys-function associated with CRF, which also involves the inflammatory system, could stimulate serum NGAL hy-per-production by different tissues (blood, epithelia and endothelium) in response to chronic insult from uremic toxins. The close correlation between sNGAL, uNGAL and residual renal function (GFR and creatininemia), however, suggests that the increase in the levels of this protein is largely attributable to tubular renal cells. This may depend on an increased apoptosis of these cells or, more probably, on a compensatory mechanism with a protective significance, as observed in conditions of acute stress following ischemia, infection or the administration of cisplatin. The latter hypothesis is definitely the more intriguing in the definition of a possible role played by NGAL in the pathophysiology of chronic renal failure.
A further end-point in the present study was to test the hypothesis that increased NGAL levels in ADPKD pa-tients might be not only the consequence of an aspecific reduction in renal function, but also be somehow influ-
enced by the process of cystogenesis, which is in itself typical of ADPKD. Therefore, according to other authors [8] , we divided our patients into two groups on the basis of cyst development and kidney dimensions (LCG and HCG). Notwithstanding the lower development of cysts, the renal function (GFR) of the LCG group subjects was not significantly better than that of HCG group subjects. In the literature, it has been reported that in ADPKD the phenotypic severity does not always exactly correspond to the severity of renal impairment [22] . In patients with a greater cyst development, sNGAL and uNGAL levels were significantly higher than in others, thus suggesting that this protein may also be involved to a certain extent in cystogenesis.
It is important to bear in mind that NGAL also plays an important role in the embryonic and adult develop-ment of the renal epithelium, through a mechanism based on the induction of iron-dependent cellular signals with a consequent inhibition of the apoptotic processes [4] .
Different studies have previously demonstrated that NGAL is also involved in other epithelial proliferative processes, including those concerning keratinocytes [23] and some tumoral cells, including those in breast carci-noma. In the latter case it has been seen how NGAL can protect the metalloproteinase-9 matrix from degradation forming a complex with it and thus contributing to tumor growth [24, 25] ; as the same metalloproteinases play a key role in the development and progression of polycystic dis-ease as already described in literature [26] , thus NGAL could represent a fundamental protagonist in determin-ing this condition.
In conclusion, it is evident that the present study is only preliminary. Although we have highlighted a close link between NGAL and ADPKD, the findings reported cannot clarify the basic pathophysiological significance of this relationship. The hypothesis formulated should therefore be confirmed by further in-depth studies.
References
1 Igarashi P, Somlo S: Genetics and pathogen-esis of polycystic kidney disease. J Am Soc Nephrol. 2002; 13: 2384–2398.
2 Schafer K, Bader M, Gretz N, Oberbaumer I, Bachmann S: Focal overexpression of colla-gen IV characterizes the initiation of epithe-lial changes in polycystic kidney disease. Exp Nephrol 1994; 2: 190–195.
3 Cowley BD Jr, Ricardo SD, Nagao S, Dia-mond JR: Increased renal expression of monocyte chemoattractant protein-1 and osteopontin in ADPKD in rats. Kidney Int 2001; 60: 2087–2096.
4 Yang J, Mori K, Li JY, Barasch J: Iron, lipo-calin, and kidney epithelia. Am J Physiol 2003; 285:F9–F18
5 Hraba-Renevey S, Turler H, Kress M, Salo-mon C, Weil R: SV40-induced expression of mouse gene 24p3 involves a post-transcrip-tional mechanism. Oncogene 1989; 4: 601–608.
6 Mishra J, Ma Q, Prada A, Mitsnefes M, Za-hedi K, Yang J, Barasch J, Devarajan P: Iden-tification of neutrophil gelatinase-associat-ed lipocalin as a novel early urinary biomarker for ischemic renal injury. J Am Soc Nephrol 2003; 14: 2534–2543.