autophagy and apoptosis in the skeletal muscle
TRANSCRIPT

cancers
Article
Human Cachexia Induces Changes in Mitochondria,Autophagy and Apoptosis in the Skeletal Muscle
Gabriela S. de Castro 1,* , Estefania Simoes 1, Joanna D.C.C. Lima 1, Milene Ortiz-Silva 2,William T. Festuccia 2 , Flávio Tokeshi 3, Paulo S. Alcântara 3, José P. Otoch 3, Dario Coletti 4 andMarilia Seelaender 1,3
1 Cancer Metabolism Research Group, Department of Cell and Tissue Biology, Institute of Biomedical Sciences,University of São Paulo, 05508-900 São Paulo, Brazil
2 Department of Physiology & Biophysics, Institute of Biomedical Sciences, University of São Paulo,05508-900 São Paulo, Brazil
3 Department of Clinical Surgery, Faculty of Medicine, University of São Paulo, 01246-903 São Paulo, Brazil4 Department of Biological Adaptation and Aging, B2A (CNRS UMR 8256-INSERM ERL U1164-UPMC P6),
Sorbonne University, 75005 Paris, France* Correspondence: [email protected] or [email protected]; Tel.: +55-113-091-7225
Received: 22 February 2019; Accepted: 4 April 2019; Published: 28 August 2019�����������������
Abstract: Cachexia is a wasting syndrome characterized by the continuous loss of skeletal musclemass due to imbalance between protein synthesis and degradation, which is related with poorprognosis and compromised quality of life. Dysfunctional mitochondria are associated with lowermuscle strength and muscle atrophy in cancer patients, yet poorly described in human cachexia.We herein investigated mitochondrial morphology, autophagy and apoptosis in the skeletal muscleof patients with gastrointestinal cancer-associated cachexia (CC), as compared with a weight-stablecancer group (WSC). CC showed prominent weight loss and increased circulating levels of serumC-reactive protein, lower body mass index and decreased circulating hemoglobin, when compared toWSC. Electron microscopy analysis revealed an increase in intermyofibrillar mitochondrial area inCC, as compared to WSC. Relative gene expression of Fission 1, a protein related to mitochondrialfission, was increased in CC, as compared to WSC. LC3 II, autophagy-related (ATG) 5 and 7 essentialproteins for autophagosome formation, presented higher content in the cachectic group. Proteinlevels of phosphorylated p53 (Ser46), activated caspase 8 (Asp384) and 9 (Asp315) were also increasedin the skeletal muscle of CC. Overall, our results demonstrate that human cancer-associated cachexialeads to exacerbated muscle-stress response that may culminate in muscle loss, which is in partdue to disruption of mitochondrial morphology, dysfunctional autophagy and increased apoptosis.To the best of our knowledge, this is the first report showing quantitative morphological alterationsin skeletal muscle mitochondria in cachectic patients.
Keywords: cancer cachexia; skeletal muscle; mitochondria; autophagy; apoptosis
1. Introduction
Cachexia is a wasting syndrome defined as the continuous loss of skeletal muscle mass due toan imbalance between protein synthesis and degradation, with or without body fat loss that can bepartially, but not totally reversed by nutritional support [1,2]. Weight loss is the most prominentcharacteristic of cachexia and is strongly associated with mortality [1]. Cachexia is highly prevalent incancer subjects reaching up to 80% of those with advanced disease [3] and is the direct cause of deathin at least 20% of all cancer patients [3].
Numerous inflammatory cytokines are involved in the etiology of cachexia, including tumornecrosis factor alpha, interleukin (IL)-6, IL-1 and interferon gamma [3,4] indicating that systemic
Cancers 2019, 11, 1264; doi:10.3390/cancers11091264 www.mdpi.com/journal/cancers

Cancers 2019, 11, 1264 2 of 17
inflammation plays a central role in cancer-associated cachexia. Noteworthy, the adipose tissueundergoes important tissue remodeling and displays increased lipolysis and exacerbated secretionof inflammatory cytokines, majorly contributing to the systemic inflammation described in cachecticpatients [5–8].
Systemic inflammation is one of the major underlying mechanisms driving the reduction inskeletal muscle mass, which responds for approximately 30% of changes in body weight loss inpatients with cachexia [9,10]. In rodents, impairment of mitochondria quality control and functionhas been reported [10–14] to be precocious, and to trigger events occurring before muscle atrophy incachexia-related muscle atrophy [15]. Indeed, disruption of skeletal muscle mitochondrial oxidativecapacity [16], diminished cytochrome C oxidase and ATP synthase protein content, decreasedmitochondrial biogenesis capability and impaired mitochondrial protein quality control were describedin rodents with cancer-associated cachexia [12]. Mitochondrial membrane may undergo phospholipidremodeling [13], which could result in changes in mitochondrial fluidity, thus leading to highersusceptibility to apoptosis in the skeletal muscle fiber in patients with cancer-associated cachexia [17].Furthermore, mitochondrion morphological alterations, such as electron–lucent areas and swelling,have also been reported in models of cancer cachexia [10,14].
Loss of skeletal muscle is an independent predictor of immobility and mortality of cancerpatients [18,19]. Muscle depletion is the consequence of an imbalanced protein synthesis anddegradation and these processes seem to be dysregulated in patients with cancer cachexia [20].In animal models of cachexia, the enhanced activity of the ubiquitin-proteasome pathway may drivemuscle wasting [3,10,21]. In humans, activation of this system is not a consistent finding, suggestingthe activation of other pathways, such as macroautophagy (from now on referred to as autophagy) [22]and apoptosis [17]. Autophagy is a physiological process in which disrupted or malfunctioningorganelles, proteins and portions of the cytoplasm are engulfed by an autophagosome vesicle thateventually fuses with the lysosomes for content degradation. Excessive or insufficient autophagymay be both detrimental to muscle fiber function, and a fine balance is necessary in order to preservemuscle mass [23]. Deregulated autophagic flux [22] and excessive autophagy [24] were reportedin patients with cancer-associated cachexia. Moreover, apoptosis in the skeletal muscle leads tomuscle fiber atrophy and plays an important role in tissue remodeling in muscular dystrophy [25],denervation [26], and as well has been described in cancer-associated muscle wasting in patients and inanimal models [17,27,28]. Based on these premises, we investigated the morphology of intermyofibrillarmitochondria and aimed at evaluating the possible activation of autophagy and apoptosis in the skeletalmuscle of patients with gastrointestinal cancer-associated cachexia, as compared with patients withweight-stable gastrointestinal tumors. We found that skeletal muscle mitochondria show increasedvolume in cachectic patients without a decrease in mitochondrial DNA content. Moreover, skeletalmuscle autophagy and apoptosis were activated in human cancer-associated cachexia.
2. Results
2.1. General Parameters
Patients from WSC and CC groups presented similar age, height and body weight at diagnosis, asshown in Table 1. CC presented a median of 15% body weight loss in the last 6 months (p < 0.0001) andlower body mass index (BMI) at diagnosis, compared to WSC (p = 0.003). Furthermore, CC showedhigher serum C-reactive protein (p = 0.01) and lower hemoglobin content (p < 0.0001), compared toWSC. Although serum albumin was not different between the groups (p = 0.28), CRP/albumin ratiowas higher in CC patients (p = 0.009). Therefore, we chose to adopt this ratio as a more reliable tool fordiagnostic purpose [29]. No differences were observed for serum glucose (p = 0.67), triacylglycerol(p = 0.60), total cholesterol (p = 0.055), LDL (p = 0.11) and HDL cholesterol (p = 0.26).

Cancers 2019, 11, 1264 3 of 17
Table 1. Characteristics and circulating biochemical parameters of WSC and CC patients.
Parameter WSC n CC n p Value
Subjects 20 24Gender (M/F) 8/12 16/8
Tumor location (stomach/colorectal) 6/14 8/16Tumor stage
I–II 9 4III–IV 8 13
Age (years) 61.00 ± 2.35 20 61.42 ± 2.68 24 0.90Previous weight 67.50 ± 2.47 20 73.55 ± 3.40 24 0.17
Weight (kg) 65.90 ± 2.79 20 60.20 ± 2.43 24 0.13Height (m) 1.64 [1.56; 1.70] 20 1.70 [1.64; 1.72] 24 0.14
BMI (kg/m2) 24.69 ± 0.77 20 21.55 ± 0.66 24 0.003Weight loss (%) 0.0 [0.0; 0.0] 20 15.12 [8.84; 23.01] 24 <0.0001
Hemoglobin (g/dL) 13.10 [12.20; 14.30] 14 11.30 [9.80; 12.00] 23 0.0001Serum C reactive protein (CRP) (mg/L) 5.07 ± 1.29 17 9.12 ± 0.91 22 0.01
Serum albumin (mg/dL) 3.56 ± 0.20 17 3.25 ± 0.19 23 0.28CRP/albumin ratio 0.18 [0.03; 0.32] 17 0.33 [0.15; 0.42] 22 0.009
Serum glucose (mmol/L) 5.23 [4.59; 6.20] 17 5.59 [4.75; 6.03] 22 0.67Serum triacylglycerol (mmol/L) 1.22 [0.85; 1.75] 17 0.97 [0.81; 1.79] 22 0.60
Serum total cholesterol (mmol/L) 4.42 [3.54; 5.27] 16 3.41 [2.78; 4.61] 22 0.055Serum LDL cholesterol (mmol/L) 2.96 [1.55; 3.41] 17 1.72 [1.29; 2.24] 21 0.11Serum HDL cholesterol (mmol/L) 1.04 [0.68; 1.20] 17 0.85 [0.73; 0.98] 22 0.26
Data are expressed as mean ± standard error or as median (first quartile; third quartile). Student’s t test was usedto compare means and Mann–Whitney test was used to compare median values between WSC and CC patients.WSC—weight-stable cancer patients; CC—cachectic cancer patients. Bold: p value lower than 0.05.
2.2. Mitochondrial Alterations
Images from the transmission electron microscopy showed modifications in the skeletal muscleof CC, characterized by altered mitochondria morphology and disrupted triads—two sarcoplasmicreticulum cisternae associated with T tubules—as illustrated in Figure 1 and Figure S1.
The intermyofibrillar mitochondrial area was larger (p = 0.01, Figure 1), and the expression of Fis1(p = 0.03, Table 2) was higher in CC, when compared to WSC. No changes were observed in the geneexpression of MFN2 (p = 0.20), TFAM (p = 0.38) and PGC-1α (p = 0.34).
Skeletal muscle mitochondrial DNA (mtDNA) copy number did not differ between the groups(p = 0.21), as shown in Figure 2.
Table 2. Skeletal muscle gene expression of mitochondrial regulation genes in WSC and CC.
Gene WSC CC p Value
Fis1 1.06 ± 0.10 1.50 ± 0.15 0.03MFN2 0.93 [0.71; 1.31] 1.17 [0.84; 1.86] 0.20TFAM 1.06 [0.78; 1.66] 1.28 [0.93; 1.71] 0.38
PGC-1α 0.97 [0.72; 1.12] 0.87 [0.57; 1.14] 0.34
Data are expressed as mean ± standard error or as median [first quartile; third quartile]. RT-PCR was used toassess mRNA expression levels (WSC, n = 12; CC, n = 16). Student’s t test was adopted to compare means andMann–Whitney test was used to compare median values between WSC and CC patients. WSC—weight-stablecancer patients; CC—cachectic cancer patients. Bold: p value lower than 0.05.

Cancers 2019, 11, 1264 4 of 17
Cancers 2019, 11, x FOR PEER REVIEW 4 of 17
Figure 1. Skeletal muscle photomicrograph and intermyofibrillar mitochondrial area of WSC and CC. Image J software was used to assess mitochondrial area (WSC, n = 3; CC, n = 4). Mitochondrial area was compared using Student’s t test and data are expressed as mean and standard error. WSC—weight-stable cancer patients; CC—cachectic cancer patients.
Table 2. Skeletal muscle gene expression of mitochondrial regulation genes in WSC and CC.
Gene WSC CC p Value Fis1 1.06 ± 0.10 1.50 ± 0.15 0.03
MFN2 0.93 [0.71; 1.31] 1.17 [0.84; 1.86] 0.20 TFAM 1.06 [0.78; 1.66] 1.28 [0.93; 1.71] 0.38
PGC-1α 0.97 [0.72; 1.12] 0.87 [0.57; 1.14] 0.34 Data are expressed as mean ± standard error or as median [first quartile; third quartile]. RT-PCR was used to assess mRNA expression levels (WSC, n = 12; CC, n = 16). Student’s t test was adopted to compare means and Mann–Whitney test was used to compare median values between WSC and CC patients. WSC—weight-stable cancer patients; CC—cachectic cancer patients. Bold: p value lower than 0.05.
Figure 1. Skeletal muscle photomicrograph and intermyofibrillar mitochondrial area of WSC and CC.Image J software was used to assess mitochondrial area (WSC, n = 3; CC, n = 4). Mitochondrial area wascompared using Student’s t test and data are expressed as mean and standard error. WSC—weight-stablecancer patients; CC—cachectic cancer patients.
Cancers 2019, 11, x FOR PEER REVIEW 5 of 17
Figure 2. Mitochondrial DNA copy number of WSC and CC subjects. Total DNA was amplified using RT-PCR to assess nuclear DNA and mtDNA copy number (WSC, n = 12; CC, n = 13). Data are expressed as mean and standard error and Student’s t test was used to compare WSC and CC groups. WSC—weight-stable cancer patients; CC—cachectic cancer patients.
2.3. Autophagy and Apoptosis
Since dysfunctional mitochondria and other organelles are removed by autophagy, the expression of proteins involved in the process was evaluated. LC3B is a protein crucial for autophagosome formation. LC3B presents two isoforms: LC3BI which is located in the cytosol, can be lipidated to form the second isoform, and LC3B II, which is conjugated with phosphatidylethanolamine and associated to the membrane of the autophagosome. LC3B II protein content was higher in CC compared to WSC (p = 0.02), while no significant difference was observed for LC3B I (p = 0.08), as illustrated in Figure 3. Another important protein involved in autophagy is p62, which is related to the autophagic flux, given that it binds to ubiquitinated proteins and to LC3B, at the same time, tagging proteins aggregates to be encompassed by autophagosomes. No changes were observed for p62 (p = 0.33). ATG5 and ATG7 were upregulated in the skeletal muscle of CC, in relation to WSC (p = 0.042 and p = 0.03, respectively).
Figure 3. Autophagy-related proteins in skeletal muscle of WSC and CC patients. Western blot analysis of (a) LCB3 I (WSC, n = 8; CC, n = 10); (b) LC3B II (WSC, n = 8; CC, n = 10); (c) p62 (WSC, n = 8; CC, n = 10); (d) ATG5 (WSC, n = 6; CC, n = 8) and (e) ATG7 (WSC, n = 6; CC, n = 8). Data are expressed
Figure 2. Mitochondrial DNA copy number of WSC and CC subjects. Total DNA was amplifiedusing RT-PCR to assess nuclear DNA and mtDNA copy number (WSC, n = 12; CC, n = 13). Data areexpressed as mean and standard error and Student’s t test was used to compare WSC and CC groups.WSC—weight-stable cancer patients; CC—cachectic cancer patients.

Cancers 2019, 11, 1264 5 of 17
2.3. Autophagy and Apoptosis
Since dysfunctional mitochondria and other organelles are removed by autophagy, the expressionof proteins involved in the process was evaluated. LC3B is a protein crucial for autophagosomeformation. LC3B presents two isoforms: LC3BI which is located in the cytosol, can be lipidated to formthe second isoform, and LC3B II, which is conjugated with phosphatidylethanolamine and associatedto the membrane of the autophagosome. LC3B II protein content was higher in CC compared to WSC(p = 0.02), while no significant difference was observed for LC3B I (p = 0.08), as illustrated in Figure 3.Another important protein involved in autophagy is p62, which is related to the autophagic flux, giventhat it binds to ubiquitinated proteins and to LC3B, at the same time, tagging proteins aggregates to beencompassed by autophagosomes. No changes were observed for p62 (p = 0.33). ATG5 and ATG7were upregulated in the skeletal muscle of CC, in relation to WSC (p = 0.042 and p = 0.03, respectively).
Cancers 2019, 11, x FOR PEER REVIEW 5 of 17
Figure 2. Mitochondrial DNA copy number of WSC and CC subjects. Total DNA was amplified using RT-PCR to assess nuclear DNA and mtDNA copy number (WSC, n = 12; CC, n = 13). Data are expressed as mean and standard error and Student’s t test was used to compare WSC and CC groups. WSC—weight-stable cancer patients; CC—cachectic cancer patients.
2.3. Autophagy and Apoptosis
Since dysfunctional mitochondria and other organelles are removed by autophagy, the expression of proteins involved in the process was evaluated. LC3B is a protein crucial for autophagosome formation. LC3B presents two isoforms: LC3BI which is located in the cytosol, can be lipidated to form the second isoform, and LC3B II, which is conjugated with phosphatidylethanolamine and associated to the membrane of the autophagosome. LC3B II protein content was higher in CC compared to WSC (p = 0.02), while no significant difference was observed for LC3B I (p = 0.08), as illustrated in Figure 3. Another important protein involved in autophagy is p62, which is related to the autophagic flux, given that it binds to ubiquitinated proteins and to LC3B, at the same time, tagging proteins aggregates to be encompassed by autophagosomes. No changes were observed for p62 (p = 0.33). ATG5 and ATG7 were upregulated in the skeletal muscle of CC, in relation to WSC (p = 0.042 and p = 0.03, respectively).
Figure 3. Autophagy-related proteins in skeletal muscle of WSC and CC patients. Western blot analysis of (a) LCB3 I (WSC, n = 8; CC, n = 10); (b) LC3B II (WSC, n = 8; CC, n = 10); (c) p62 (WSC, n = 8; CC, n = 10); (d) ATG5 (WSC, n = 6; CC, n = 8) and (e) ATG7 (WSC, n = 6; CC, n = 8). Data are expressed
Figure 3. Autophagy-related proteins in skeletal muscle of WSC and CC patients. Western blot analysisof (a) LCB3 I (WSC, n = 8; CC, n = 10); (b) LC3B II (WSC, n = 8; CC, n = 10); (c) p62 (WSC, n = 8; CC,n = 10); (d) ATG5 (WSC, n = 6; CC, n = 8) and (e) ATG7 (WSC, n = 6; CC, n = 8). Data are expressedas mean and standard error and were compared using Student’s t test or were represented in boxplots and compared using Mann–Whitney test. WSC—weight-stable cancer patients; CC—cachecticcancer patients.
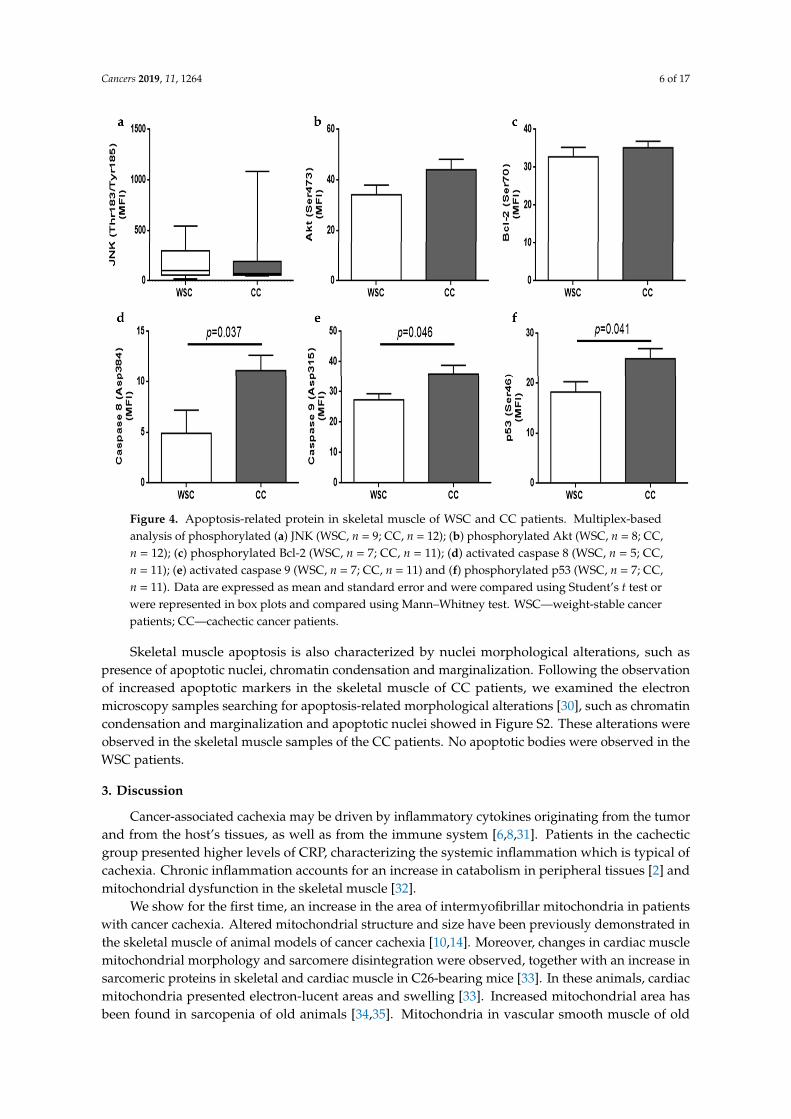
Multiplex-based technology was employed to compare apoptosis-related proteins in the skeletalmuscle of WSC and CC patients. BAD protein was not detectable and no differences were observedfor phosphorylated Akt (p = 0.12), phosphorylated Bcl-2 (p = 0.52) and phosphorylated JNK (p = 0.9).Phosphorylated p53 (Ser46) was increased in CC, as compared to WSC (p = 0.041), as well as activecaspases 8 (Asp384) (p = 0.037) and 9 (Asp315) (p = 0.046). Apoptosis-related protein content is shownin Figure 4.
Cancers 2019, 11, 1264 6 of 17
Cancers 2019, 11, x FOR PEER REVIEW 6 of 17
as mean and standard error and were compared using Student’s t test or were represented in box plots and compared using Mann–Whitney test. WSC—weight-stable cancer patients; CC—cachectic cancer patients.
Multiplex-based technology was employed to compare apoptosis-related proteins in the skeletal muscle of WSC and CC patients. BAD protein was not detectable and no differences were observed for phosphorylated Akt (p = 0.12), phosphorylated Bcl-2 (p = 0.52) and phosphorylated JNK (p = 0.9). Phosphorylated p53 (Ser46) was increased in CC, as compared to WSC (p = 0.041), as well as active caspases 8 (Asp384) (p = 0.037) and 9 (Asp315) (p = 0.046). Apoptosis-related protein content is shown in Figure 4.
Figure 4. Apoptosis-related protein in skeletal muscle of WSC and CC patients. Multiplex-based analysis of phosphorylated (a) JNK (WSC, n = 9; CC, n = 12); (b) phosphorylated Akt (WSC, n = 8; CC, n = 12); (c) phosphorylated Bcl-2 (WSC, n = 7; CC, n = 11); (d) activated caspase 8 (WSC, n = 5; CC, n = 11); (e) activated caspase 9 (WSC, n = 7; CC, n = 11) and (f) phosphorylated p53 (WSC, n = 7; CC, n = 11). Data are expressed as mean and standard error and were compared using Student’s t test or were represented in box plots and compared using Mann–Whitney test. WSC—weight-stable cancer patients; CC—cachectic cancer patients.
Skeletal muscle apoptosis is also characterized by nuclei morphological alterations, such as presence of apoptotic nuclei, chromatin condensation and marginalization. Following the observation of increased apoptotic markers in the skeletal muscle of CC patients, we examined the electron microscopy samples searching for apoptosis-related morphological alterations [30], such as chromatin condensation and marginalization and apoptotic nuclei showed in supplemental Figure 2 (Figure S2). These alterations were observed in the skeletal muscle samples of the CC patients. No apoptotic bodies were observed in the WSC patients.
3. Discussion
Cancer-associated cachexia may be driven by inflammatory cytokines originating from the tumor and from the host’s tissues, as well as from the immune system [6,8,31]. Patients in the
Figure 4. Apoptosis-related protein in skeletal muscle of WSC and CC patients. Multiplex-basedanalysis of phosphorylated (a) JNK (WSC, n = 9; CC, n = 12); (b) phosphorylated Akt (WSC, n = 8; CC,n = 12); (c) phosphorylated Bcl-2 (WSC, n = 7; CC, n = 11); (d) activated caspase 8 (WSC, n = 5; CC,n = 11); (e) activated caspase 9 (WSC, n = 7; CC, n = 11) and (f) phosphorylated p53 (WSC, n = 7; CC,n = 11). Data are expressed as mean and standard error and were compared using Student’s t test orwere represented in box plots and compared using Mann–Whitney test. WSC—weight-stable cancerpatients; CC—cachectic cancer patients.
Skeletal muscle apoptosis is also characterized by nuclei morphological alterations, such aspresence of apoptotic nuclei, chromatin condensation and marginalization. Following the observationof increased apoptotic markers in the skeletal muscle of CC patients, we examined the electronmicroscopy samples searching for apoptosis-related morphological alterations [30], such as chromatincondensation and marginalization and apoptotic nuclei showed in Figure S2. These alterations wereobserved in the skeletal muscle samples of the CC patients. No apoptotic bodies were observed in theWSC patients.
3. Discussion
Cancer-associated cachexia may be driven by inflammatory cytokines originating from the tumorand from the host’s tissues, as well as from the immune system [6,8,31]. Patients in the cachecticgroup presented higher levels of CRP, characterizing the systemic inflammation which is typical ofcachexia. Chronic inflammation accounts for an increase in catabolism in peripheral tissues [2] andmitochondrial dysfunction in the skeletal muscle [32].
We show for the first time, an increase in the area of intermyofibrillar mitochondria in patientswith cancer cachexia. Altered mitochondrial structure and size have been previously demonstrated inthe skeletal muscle of animal models of cancer cachexia [10,14]. Moreover, changes in cardiac musclemitochondrial morphology and sarcomere disintegration were observed, together with an increase insarcomeric proteins in skeletal and cardiac muscle in C26-bearing mice [33]. In these animals, cardiacmitochondria presented electron-lucent areas and swelling [33]. Increased mitochondrial area hasbeen found in sarcopenia of old animals [34,35]. Mitochondria in vascular smooth muscle of old

Cancers 2019, 11, 1264 7 of 17
Sprague–Dawley rats presented increased size and lower movement extent [34]. Larger sarcomericmitochondria and longer and more branched intermyofibrillar mitochondria were observed in thegastrocnemius of old mice [35]. These aberrant mitochondria may be related to decreased physicalfunction as observed in aging-related sarcopenia [36]. Furthermore, mitochondrial swelling, measuredby mitochondrion permeability transition pore (MPTP) kinetics, has been observed in the skeletalmuscle of patients with chronic obstructive pulmonary disease, and abnormalities in the activity ofthe MPTP may be involved in the increased susceptibly of muscle injury, increased reactive oxygenspecies production and enhanced cytochrome C release observed in these patients [37]. Disruption ofmitochondrial morphology is an indicative of increased MPTP kinetics, while prevention of MPTPopening protects cardiomyocytes viability after lethal hypoxia [38]. Therefore, targeting intervention toprevent MPTP opening and mitochondrial swelling may represent a therapeutic approach to preservemuscle mass in cancer cachexia.
Fis1 gene expression was increased in CC and no changes were observed for MFN2, PGC-1αor TFAM. MFN1, MFN2 and optical protein 1 are enrolled in mitochondrial fusion. MFN2 regulatesthe development of the fusion complex [32,39]. It has been reported that MFN1 gene expression wasdecreased in animals with cancer cachexia, although no consensus has been established for MFN2 inthe same context [40]. The mitochondrial fission process is coordinated by dynamin-related protein1 (Drp1) and Fis1 protein. Fis1 is an outer mitochondrial membrane integral protein with a singletransmembrane domain and a tetratricopeptide repeat domain facing the cytosol [41]. Fis1 seemsresponsible for recruiting Drp1 to the outer mitochondrial membrane, which develops active fissionsites [32,39]. Drp1 is a GTPase cytosolic protein that translocates to the outer mitochondrial membraneand forms a ring that drives the fission process [42]. Mitochondrial fission segregates dysfunctionalmitochondria to be depleted by mitophagy. Increased Fis1 protein expression was reported in animalmodels of cancer cachexia together with mitophagy [43]. Furthermore, overexpression of functionalFis1 in cell lines drove an increase in autophagosomes while a mutant Fis1 (Fis1k148R), which wasable to increase mitochondrion fission but not cause dysfunction, did not provoke the same increasein autophagy, indicating that dysfunctional rather than fragmented mitochondria is designated tomitophagy [41].
During the progression of Lewis Lung carcinoma, mitochondrial alterations preceded muscle lossin mice [15]. One week after tumor implantation, there was an increase in mitochondrial oxidativestress in the skeletal muscle; degeneration of mitochondrial network was evident in the second week,and loss of mitochondrial function in the third week [15]. Decrease in skeletal muscle mass was onlyevident in the fourth week, concomitant to increased Fis1 gene expression and protein content. Highermitochondrial oxidative stress generation occurred from the first to the third week [15]. In accordanceto this, ApcMin/+ mice, which develop spontaneous intestinal and colon adenomas, showed diminishedMFN1, MFN2 and PGC-1α protein expression in advance to the decrease of muscle mitochondrialcontent [44]. Reduction in muscle mitochondrial content was concomitant with an increase in apoptosisand autophagy-related protein expression. Furthermore, IL-6 inhibition, through administration ofIL-6 receptor antibody, and moderate exercise training were able to prevent mitochondrial dysfunctionsin ApcMin/+ mice, thus providing evidence that increase in mitochondrial biogenesis at the earlyphase of cachexia might consist of a therapeutic strategy to attenuate catabolic stimulus in the skeletalmuscle [44].
Increase in skeletal muscle autophagy has been formerly described in animal models ofcachexia [45,46] and in the skeletal muscle [22] and serum [47] obtained from patients withgastrointestinal cancer with cachexia. In the present study, LC3B II protein expression was found to beincreased in the skeletal fiber of patients with cancer cachexia, while no differences were observedfor p62, showing that autophagy may be one of the driving factors in muscle loss. In a study fromAversa et al. [22] patients with gastrointestinal cancer and cachexia were compared with patients withweight-stable cancer and with healthy volunteers. There was an increase in the skeletal muscle proteincontent of LC3B II, p62 and beclin 1, a protein that is also able to initiate autophagy when dissociated of
Cancers 2019, 11, 1264 8 of 17
Bcl-2. Higher p62 levels were observed in the two cancer-affected groups, when compared to healthyindividuals. The authors suggested that accumulation of p62 may reflect an incomplete autophagyflux, due to lysosomal dysfunctions impairing autophagosome clearance [22]. This hypothesis wasalso supported by studies with animal models of cancer cachexia in which there was an accumulationof p62 in the skeletal muscle fiber [48,49]. Deletion of ATG7 in mice caused intense muscle atrophy,evidencing that a decrease in autophagy flux is detrimental to muscle mass [50]. Aerobic physicalexercise was able to ameliorate muscle mass and restore autophagy flux in the C26 colon carcinomamice [48]. Considering that autophagocytosis normally degrades p62 and that no changes in p62 wereobserved in the present study, our results corroborate the role of disrupted autophagy as one of thedriving factors of muscle wasting in cancer cachexia.
Pettersen et al. [47] evaluated the autophagy flux in the sera of patients in three different cohortsand described that gastrointestinal cancer patients showed a significant positive association to weightloss and serum autophagy markers, while the same was not observed for lung cancer patientswith cachexia (although patients with increased autophagy flux were more likely to present weightloss); and no association was found for hematological and breast cancer patients, in whom cachexiais less prevalent [47]. Furthermore, gastrointestinal cancer patients with cachexia presented thispositive association in both genders, whereas weight loss and autophagy flux positive correlationwere only reported for male patients with lung cancer-associated cachexia [47]. Moreover, patientswith esophageal cancer showed an increase in autophagy-related proteins in the vastus lateralismuscle [24]. This pathway was the main activated proteolytic pathway, as ubiquitin-proteasome,caspase and calpain pathways did not change [24]. Lung cancer-associated cachexia was similarlylinked to activation of autophagy lysosomal pathway in the skeletal muscle, as an increase in LC3B IIin the quadriceps muscle was found, when compared to pre-cachectic lung cancer patients and healthycontrol subjects [51].
Additionally, mitochondrial permeability transition (MPT) seems to be involved in autophagyand apoptosis, as MPT pores opening leads to mitochondrial depolarization and swelling [52,53].Depolarized mitochondria are encompassed by autophagosomes and autolysosomes [54].Mitochondrial swelling causes mitochondrial outer membrane rupture and release of innermitochondrial proteins, such as cytochrome C, which, when in the cytosol, triggers apoptosis throughcaspase 9 activation [55,56]. In the present study, cachexia was related with disruption of mitochondrialmorphology and increased autophagy-related protein expression in the skeletal muscle. However, nochanges were observed in the mtDNA copy number, indicating that mitophagy was not significantlyincreased in CC, compared to WSC patients. As suggested by Brown et al. [15], mitochondrialdegeneration occurs before muscle wasting, while a decrease in mitochondrial content may be seen inthe final stages of cancer-associated cachexia [15] when it may be too late to generate a new pool offunctional mitochondria. Mitochondrial fission is mainly responsible for the appearance of depolarizedmitochondria, as fission events likely generate a mitochondrion with high mitochondrial membranepotential and a depolarized mitochondrion, which is prone to undergo mitophagy [57]. Twig et al. [57]demonstrated that autophagocytosed mitochondria show three main features: Reduced mitochondrialmembrane potential, decreased OPA1, and reduced size. These depolarized mitochondria present adecreased fusion capacity and lower odds of being recruited by polarized mitochondrion to fuse [57].
In addition to aberrant mitochondria and increased autophagy induction in the absence ofdecreased mitochondrial content, we found higher activation of apoptosis in the skeletal muscle ofpatients with cancer-associated cachexia. Activated caspase 8 and 9 and phosphorylated p53 (Ser46)protein content were higher in CC, compared to the WSC group, indicating that apoptosis may be alsoinvolved in human cachexia-related skeletal muscle loss. Furthermore, apoptotic bodies were presentonly in the CC group. Caspases are enzymes responsible for cleaving peptide bonds following aspartateresidues. Caspase 8 presents tandem repeats known as ‘death effector domains’, which are activatedfollowing cytokine binding to tumor necrosis factor receptor 1, Fas/APO receptor and associated deathreceptors. Caspase 9 presents a caspase recruitment domain (CARD) [58]. Cytochrome C, together

Cancers 2019, 11, 1264 9 of 17
with dATP, bind to apoptotic protease activating factor-1 and, this last one binds to the CARD domain,activating caspase 9, thereby initiating the proteolytic cascade [28,59]. The extent of mitochondrialdamage can regulate cell fate. Mitochondrial outer membrane permeabilization causes the release ofcytochrome C from the mitochondrial intermembrane space, which contributes to caspase activation.The overexpression of fusion proteins or silencing Fis1 or Drp1 could reduce cell death and the releaseof cytochrome C [56].
Increased content of activated caspases 1, 3, 6, 8 and 9 and cytochrome C into the cytosol ofthe gastrocnemius muscle from cachectic mice bearing the MAC16 tumor has been reported [28].As mentioned before, mitochondrial swelling leads to mitochondrial membrane rupture andconsequently release of cytochrome C followed by caspase 9 activation. In an experiment withcell-free extracts, addition of cytochrome C triggered caspase 9 activation, which was responsible forpropagating the cell death signal through activation of caspases 2, 3, 6, 7, 8 and 10 [60]. Furthermore,cachexia was associated with increased apoptosis in the gastrocnemius of ApcMin,−/+ mice [27] andin rats bearing the Yoshida AH-130 ascites hepatoma [61]. Patients with gastrointestinal cancer andcachexia showed higher DNA fragmentation and increased cleavage of the cellular membrane proteinanti-poly (ADP-ribose) polymerase in the skeletal muscle, when compared with healthy subjects,suggesting augmented apoptotic process [17]. Moreover, animal models of cachexia show enhancedautophagy, concomitant with apoptosis in skeletal muscle [62–64].
There are several interconnected signals between autophagy and apoptosis. Bcl-2 inhibitsautophagy and apoptosis through its interaction with Beclin-1 and pro-apoptotic proteins,respectively [65]. JNK can phosphorylate Bcl-2 at Thr69, Ser70 and Ser87, decreasing its interactionwith Beclin-1 and pro-apoptotic proteins, which could initiate autophagy and apoptosis, respectively.Akt is able to inhibit autophagy and apoptosis by phosphorylating Beclin-1 and BAD [65]. Moreover,mammalian target of rapamycin (mTOR) is induced by Akt and can repress ULK1 complex inhibitingone of the initial steps of autophagy [65]. The localization of p53 influences its action. When in thecytoplasm, p53 inhibits autophagy by blocking ULK1 complex [65,66]. Phosphorylation of p53 drivesits translocation from the cytosol to the nucleus, where it initiates the transcription of several genesrelated to adaptation to stress, arrest of cell cycle, autophagy and/or apoptosis [65]. Under stress,p53 can also translocate to the mitochondrial matrix and stimulate the permeability transition poreopening [65,67].
In opposition to the effects of cachexia in skeletal muscle, physical exercise is able to increasemitochondrial content and improve mitochondrial function [68]. ApcMin/+ mice overexpressing IL-6showed increased muscle wasting with dysfunctional mitochondria [44]. Exercise training preventedthe increase of ATG5, Beclin 1 and LC3b protein expression, as well as BAX mRNA expression in theskeletal muscle of ApcMin/+ mice [44], indicating physical exercise to modulate mitochondrial stability,autophagy and apoptosis in the skeletal muscle, hence preventing the cachexia-induced deleteriousalterations [44]. In another animal model of cancer-associated cachexia, the C26 colon carcinomamice, spontaneous aerobic exercise diminished autophagy and restored the autophagic flux in theskeletal fiber, in addition to preventing skeletal muscle loss [48]. Muscle loss can be worsened duringchemotherapy, in which mitochondrial content is decreased and mitophagy increased, as reported forC26 mice treated with oxaliplatin and 5-fluorouracil (oxfu) [69]. Physical exercise was able to preventmuscle loss and increased mitophagy in the skeletal muscle of tumor-bearing mice treated with oxfu;however, in the last stages of cancer cachexia, treadmill running worsened survival of these animals,indicating that exercise may have an optimal time to be performed within the chemotherapy course [69].The positive effects of physical exercise may prevent mitochondrial disruption and preserve musclemass in humans as well [70,71].
It is important to consider the limitations of the present study. The small sample number maynot represent the entire population of patients with cancer. In addition, measurements were notalways performed with the same sample number, as muscle biopsies generally provided a limitedamount of tissue. Low levels of hemogloblin have been positively associated with low muscle mass in

Cancers 2019, 11, 1264 10 of 17
different cohorts of elderly subjects [72,73]. Although hemoglobin levels of CC patients indicatingmild anemia, hypoxia [38] and iron deficiency [74] have been related to mitochondrial alterations andtherefore, should not be ignored. The increase in autophagy-related proteins does not directly indicatean increase in autophagic flux. Furthermore, sexual dimorphism plays an effect in skeletal muscleaffected by cachexia: Although men have greater muscle mass than women, weight loss and loss ofmuscle mass are greater in male than female cancer patients [75,76]. A shortcoming of this study isthat the number of female patients was lower than that of male patients. Nevertheless, we were ableto show enhanced content of proteins related to apoptosis in the muscle of cachectic patients (bothmale and female), indicating that this pathway is very likely activated in the skeletal muscle, albeit notproviding a proof of concept. To the best of our knowledge this is the first report of these findings inhuman cancer cachexia.
4. Materials and Methods
4.1. Patients Recruitment
Patients with gastric and colorectal cancer were recruited after signature of the fully informedconsent form. All proceedings were performed following the Declaration of Helsinki andapproved by the Ethics Committee on Research Involving Human Subjects of the Instituteof Biomedical Sciences/University of São Paulo and by the Human Ethics Committee of theUniversity Hospital/University of São Paulo (CAAE nº 62640216.2.00005467; 18116213.2.3002.5479;00475118.7.0000.5467). Rectus abdominis muscle biopsies were collected during the surgery for tumorexcision. Patients were further divided into Weight-Stable Cancer (WSC, n = 20) and Cachectic Cancer(CC, n = 24) groups. Supplemental Tables S1 and S2 presents what analyses were performed in eachpatient. Cancer-associated cachexia was diagnosed following the criteria proposed by Evans at al.(2008) [1], in addition to the screening of plasma C-reactive protein (CRP), as in the Glasgow PrognosticScore [77] and with the results from the following questionnaires (to assess the presence of symptomsrelated to cachexia): EORTC QLQ-STO22 [78], CASCO [79] and Anorexia Score (FAACT-ESPEN) [80].Anthropometric data (changes in body weight, current body weight and height) were collected athospital admission. The inclusion criteria were the following: Female and male patients (35–85 yearsold) undergoing gastrointestinal tract surgery for tumor excision were selected in partnership withsurgeons from the University Hospital of the University of São Paulo (HU-USP) or of the Santa Casade Misericordia Hospital. All patients selected for the study were submitted to surgery. The exclusioncriteria encompassed the following: Enrolled patients were not receiving chemotherapy, radiotherapy,opioids, or continuous anti-inflammatory treatment. Patients presenting chronic inflammation fromother etiologies apart from cachexia, as well as those with auto-immune disorders and/or patients withBMI > 29.9 Kg/m2 were not engaged in the study.
4.2. Blood and Serum Analyses
Blood was collected prior to the surgical procedure—on the day of hospitalization or immediatelyprevious to anesthesia during the surgical procedure—by a trained health professional, placed intubes and then centrifuged at 3000 rpm for 15 min at 4 ◦C to obtain serum and plasma, which weretransferred to plastic microtubes and stored at −80 ◦C for posterior analyses. Serum CRP (ultrasensitiveCRP Turbiquest plus, cat. nº 331, Labtest, Lagoa Santa, MG, Brazil), albumin (cat. nº 19, Labtest, LagoaSanta, MG, Brazil), glucose (cat. nº 133, Labtest, Lagoa Santa, MG, Brazil), triacylglycerol (cat. nº 87,Labtest, Lagoa Santa, MG, Brazil), total cholesterol (cat. nº 76, Labtest, Lagoa Santa, MG, Brazil), LDLcholesterol (cat. nº 129, Labtest Lagoa Santa, MG, Brazil) and HDL cholesterol (cat. nº 98, Labtest,Lagoa Santa, MG, Brazil) concentration was assessed with colorimetric commercial kits in an automaticanalyzer with high performance for biochemical and turbidimetric tests (LABMAX 240® equipment,Labtest, Lagoa Santa, MG, Brazil). Hemoglobin values were acquired from the patients’ hospitalrecords, previous to surgery.

Cancers 2019, 11, 1264 11 of 17
4.3. Transmission Electron Microscopy and Mitochondrial Area
For the ultrastructural studies, 2 mm of the muscles were post-fixed with 1% paraformaldehyde,2.5% glutaraldehyde, 2.5 mM CaCl2 solution in 0.1 M Sodium Cacodylate buffer (pH 7.2–7.4), andprepared for electron microscopy analysis. After inclusion in Spurr’s kit (cat#14300, Electron MicroscopySciences, Hatfield, PA, USA), the 250-nm semi-thin sections were obtained with an ultra-microtome(Leica EM UC6, LEICA, St Gallen, Switzerland). Ultra-thin sections (70 nm) were collected ontocopper grids (200-mesh) and contrasted with 2% Uranyl Acetate and Lead Citrate. The samples wereobserved with a FEI TECNAI G20 (FEI Company, Eindhoven, The Netherlands), with a resolution of4000 × 4000 pixel. Intermyofibrillar mitochondria area was calculated, employing the ImageJ Software(open-source, image processing program, Bethesda, Maryland, MD, USA); after 10×magnification serialphotographs acquisition, 8–12 images of each of the samples from each of the 2 groups, were analyzed.
4.4. Gene Expression
Muscle mRNA was extracted using TRIzol® (Trizol reagent—Invitrogen, Life Technologies,Carlsbad, CA, USA) following the manufacturer’s instructions. cDNA was synthetized with acommercial kit (High Capacity cDNA Reverse Transcription Kit, Life Technologies). Fast SYBR greenmaster mix (Fast SYBR® Green Master Mix, Thermo Fisher Scientific, Vilnius, Lithuania) was usedto perform real-time qPCR, in a QuantStudio 12K Flex Rea l-Time PCR System instrument (AppliedBiosystems, Carlsbad, CA, USA) and specific primers for each gene (Invitrogen, Life Technologies,Carlsbad, CA, USA). Relative mRNA expression was standardized to the endogenous housekeepinggene gyceraldehyde-3-phosphate dehydrogenase (GAPDH) and calculated employing the ∆∆CT
method. No differences between groups were observed for the GAPDH gene expression. The sequenceof the sense (forward—F) and antisense (reverse—R) primers used for amplification were: Fissionprotein 1 (Fis1) F—CGGAGCAAGTACAATGATGAC, (Fis1) R—CCAGGTAGAAGACGTAATCCC;Mitofusin 2 (MFN2) F—ATGCATCCCCACTTAAGCAC, (MFN2) R—CCAGAGGGCAGAACTTTGTC;mitochondrial transcription factor (TFAM) F—AAGATTCCAAGAAGCTAAGGGTG, TFAMR—CGAGTTTCGTCCTCTTTAGCA; peroxisome proliferator-activated receptor gamma coactivator1 alpha (PGC-1α) F —TCAAGCCACTACAGACACC, PGC-1α R—TCTCTGCGATATTCTTCCCT;GAPDH F—CCTCTGACTTCAACAGCGAC, GAPDH R—CGTTGTCATACCAGGAAATGAG.
4.5. Skeletal Muscle Protein Quantification and Western Blot Analysis
Total protein extraction was carried out using about 50 mg of frozen skeletal muscle tissue, whichwas homogenized on ice with a Polytron in radioimmunoprecipitation assay (RIPA) buffer (10 mM Trisbase, 0.01 mM EDTA, 0.1 mM Sodium Chloride and 1% Triton X-100), with proteinase and phosphataseinhibitors (Roche®, Mannheim, Germany); and centrifuged at 14,000× g, for 30 min, at 4 ◦C. The upperphase was collected and placed in a new tube and centrifuged at 14,000× g, for 30 min, at 4 ◦C. Totalprotein amount from the upper phase of the second centrifugation was quantified employing Bradfordprotein assay (Bio-rad Laboratories; Hercules, CA, USA), against a bovine serum albumin standardcurve, and 40 µg of proteins containing Laemmli sample buffer were separated using precast gels(Bolt Bis-Tris Plus gels 4–12%, Thermo Fisher Scientific, Carlsbad, CA, USA). Proteins were transferredfrom gels to nitrocellulose membranes (Amersham Protran®, GE Healthcare, Germany) at 80 V for60 min (Trans-Blot Turbo Blotting System, Bio-Rad, Hercules, CA, USA) in transfer buffer (20mMTris, 150mM Glycine, and 20% Methanol). Membranes were blocked in 5% bovine serum albumin inTBS-T (0.1% Tween 20) for 3 h and then incubated overnight at 4 ◦C with primary antibodies againstmicrotubule-associated protein 1 light chain 3B (LC3B) (#2775, rabbit, Cell Signaling, Danvers, MA,USA), p62/SQSTM1 (p62), (#5114, rabbit, Cell Signaling, Danvers, MA, USA), autophagy protein (ATG)5 (#2630, rabbit, Cell Signaling, Danvers, MA, USA), ATG7 (#2631, rabbit Cell Signaling, Danvers, MA,USA) and GAPDH (Santa Cruz Biotechnology, sc-25778, rabbit, Dallas, TX, USA). Next, membraneswere washed for 10 min, 3 times with TBS-T, followed by incubation with anti-rabbit IgG, HRP-linked

Cancers 2019, 11, 1264 12 of 17
antibody (Cell Signaling, #7074S) for 2 h and then, washed again with TBT-T for 10 min, 3 times. Proteinbands were detected with HRP substrate (Luminata Immobilon Forte Western HRP substrate, Merck,Darmstadt, Germany) in a gel documentation system (SyngeneG:boxChemi|Gel Documentation andECL Detection, Syngene, Frederick, MD, USA). The optical density of the antigen-antibody complexwas quantified as pixels employing the Image J Analysis Software (http://rsb.info.nih.gov/ij/). GAPDHwas adopted as control protein standard.
4.6. Apoptosis-Related Proteins Quantification
Apoptosis-related proteins, Akt (pS473), Bcl-2 (Ser70), Bcl-2-associated agonist of cell death (BAD)(Ser112), p53 (Ser46), JUN N-terminal kinase (JNK) (Thr183/Tyr185), caspase 8 (Asp384) and caspase 9(Asp315) were quantified in 25 µg of protein from skeletal muscle homogenate with a commercial kit(Car. nº 48-669MAG, Merck-Millipore, St. Charles, MO, USA), employing Multiplex technology in aMagpix® instrument (Life Technologies, Grand Island, NY, USA).
4.7. Mitochondrial DNA Copy Number
To compare the levels of mitochondrial DNA (mtDNA) to nuclear DNA, 25 mg of skeletalmuscle tissue were disrupted using a digestion buffer (PureLink® Genomic Digestion Buffer, ThermoFisher Scientific) with proteinase K. Total DNA was extracted using phenol-chloroform-isoamylalcohol (25:24:1, Sigma-Aldrich ref.P3803, Steinhein, Germany). DNA quantity and quality wereaccessed with a spectrophotometer (Synergy H1, BioTek, Winooski, VT, USA). A total amountof 3 ng/µL was used to perform real time qPCR as described by Rooney et al. (2015) [81] withFast Sybr Green master mix (Fast SYBR® Green Master Mix, Thermo Fisher Scientific, Vilnius,Lithuania USA). The amplification primers used were the following: Mitochondrial—tRNA-Leu (UUR)F—CACCCAAGAACAGGGTTTGT; R—TGGCCATGGGTATGTTGTTA; nuclear—B2-microglobulinF—TGCTGTCTCCATGTTTGATGTATCT; R—TCTCTGCTCCCCACCTCTAAGT. The average Ctvalues from duplicate reaction of tRNA-Leu (UUR) amplification were subtracted from theB2-microglobulin Ct to obtain ∆Ct. Relative mtDNA content was calculated using the followingequation: mtDNA relative copy number = 2 × 2∆CT.
4.8. Statistical Analysis
All parameters were firstly submitted to a normality test. Preliminary analysis was carried outto ensure that the assumptions of normality or homoscedasticity were not violated. When normaldistribution was observed, Student’s t-test was used to compare means between groups and data areexpressed as means and standard errors. The Mann–Whitney test with multiple comparisons wasemployed for non-parametric data, while they are expressed as median and first quartile and thirdquartile. Statistical significance was set at a p value < 0.05 (two tailed). GraphPad Prisma 6 was usedto perform statistical analysis.
5. Conclusions
This study presents the new finding that intermyofibrillar mitochondria structure is disruptedwith an increased area in the skeletal muscle of patients with cancer-associated cachexia, without adecrease in mitochondrial content. Dysfunctional mitochondria may be in the core of skeletal muscleloss in cancer cachexia. Whether mitochondrial alterations are cause or effect of muscle wasting stillneeds further elucidation. Moreover, we showed that cancer cachectic patients have, concomitantly toincreased systemic inflammation, diminished hemoglobin levels, disrupted autophagy and enhancedapoptosis-related protein content, when compared to weigh-stable cancer patients. These resultsdemonstrate that it is more likely that various pathways contribute to skeletal muscle wasting inhuman cancer cachexia.

Cancers 2019, 11, 1264 13 of 17
Supplementary Materials: The following are available online at http://www.mdpi.com/2072-6694/11/9/1264/s1,Figure S1: Higher magnification of skeletal muscle photomicrograph showing intermyofibrillar mitochondria ofWSC and CC, Figure S2. Skeletal muscle nuclei photomicrograph of WSC (n = 3) and CC (n = 4). Black arrowsindicate apoptotic body; white arrow indicate chromatin condensation in CC patients. WSC—weight-stable cancerpatients; CC—cachectic cancer patients, Table S1: Analyses performed in each patient of the Weight–Stable Cancergroup (WSC), Table S2: Analyses performed in each patient of Cachectic Cancer Group (CC).
Author Contributions: G.S.C. acquired most of the data, performed statistical analysis, data interpretation andarticle writing. E.S. performed mitochondrial area analysis. J.D.L. contribute to data acquisition. M.O.-S. andW.T.F. provided scientific assistance for autophagy-related proteins data acquisition. D.C. collected electronmicroscopy photomicrographs and contributed to data interpretation and article writing. M.S. designed theresearch, contributed to the technical support, data interpretation and article writing. G.S.d.C., E.S., J.D.C.C.L,P.S.A., F.T. and J.P.O. contributed to patient recruitment, interviews, blood and tissue collection. All authors readand approved the final manuscript.
Funding: This work was supported by Fundação de Amparo à Pesquisa do Estado de São Paulo (FAPESP)(2012/50079-0 and 2019/08682-0) conceded to M.S., G.S.C., E.S., J.D.C.C.L. and M.O.S. were supported by Fapesp(Process numbers: 2016/13810-9, 2016/12508-7, 2016/02780-1, 2017/12260-8).
Acknowledgments: We would like to thank Ivanir S.O. Pires for technical support and Ruy Jagger, Roberto C.Modia Jr and Gaspar F. de Lima for the support in the electron microscopy analysis.
Conflicts of Interest: The authors declare no conflict of interest.
References
1. Evans, W.J.; Morley, J.E.; Argilés, J.; Bales, C.; Baracos, V.; Guttridge, D.; Jatoi, A.; Kalantar-Zadeh, K.;Lochs, H.; Mantovani, G.; et al. Cachexia: A new definition. Clin. Nutr. 2008, 27, 793–799. [CrossRef][PubMed]
2. Baracos, V.E.; Martin, L.; Korc, M.; Guttridge, D.C.; Fearon, K.C.H. Cancer-associated cachexia. Nat. Rev. Dis.Prim. 2018, 4, 17105. [CrossRef] [PubMed]
3. Porporato, P.E. Understanding cachexia as a cancer metabolism syndrome. Oncogenesis 2016, 5, e200.[CrossRef]
4. Neves, R.X.; Rosa-Neto, J.C.; Yamashita, A.S.; Matos-Neto, E.M.; Riccardi, D.M.R.; Lira, F.S.; Batista, M.L.;Seelaender, M. White adipose tissue cells and the progression of cachexia: Inflammatory pathways. J. CachexiaSarcopenia Muscle 2016, 7, 193–203. [CrossRef] [PubMed]
5. Silvério, R.; Lira, F.S.; Oyama, L.M.; Oller do Nascimento, C.M.; Otoch, J.P.; Alcântara, P.S.M.; Batista, M.L.;Seelaender, M. Lipases and lipid droplet-associated protein expression in subcutaneous white adipose tissueof cachectic patients with cancer. Lipids Health Dis. 2017, 16, 159. [CrossRef] [PubMed]
6. Batista, M.L.; Henriques, F.S.; Neves, R.X.; Olivan, M.R.; Matos-Neto, E.M.; Alcântara, P.S.M.; Maximiano, L.F.;Otoch, J.P.; Alves, M.J.; Seelaender, M. Cachexia-associated adipose tissue morphological rearrangement ingastrointestinal cancer patients. J. Cachexia Sarcopenia Muscle 2016, 7, 37–47. [CrossRef] [PubMed]
7. Alves, M.J.; Figuerêdo, R.G.; Azevedo, F.F.; Cavallaro, D.A.; Neto, N.I.P.; Lima, J.D.C.; Matos-Neto, E.;Radloff, K.; Riccardi, D.M.; Camargo, R.G.; et al. Adipose tissue fibrosis in human cancer cachexia: The roleof TGFβ pathway. BMC Cancer 2017, 8, 237–282. [CrossRef] [PubMed]
8. De Matos-Neto, E.M.; Lima, J.D.; de Pereira, W.O.; Figuerêdo, R.G.; Riccardi, D.M.; Radloff, K.; das Neves, R.X.;Camargo, R.G.; Maximiano, L.F.; Tokeshi, F.; et al. Systemic inflammation in cachexia-Is tumor cytokineexpression profile the culprit? Front. Immunol. 2015, 6. [CrossRef]
9. Muscaritoli, M.; Bossola, M.; Aversa, Z.; Bellantone, R.; Rossi Fanelli, F. Prevention and treatment of cancercachexia: New insights into an old problem. Eur. J. Cancer 2006, 42, 31–41. [CrossRef]
10. Fontes-Oliveira, C.C.; Busquets, S.; Toledo, M.; Penna, F.; Aylwin, M.P.; Sirisi, S.; Silva, A.P.; Orpí, M.;García, A.; Sette, A.; et al. Mitochondrial and sarcoplasmic reticulum abnormalities in cancer cachexia:Altered energetic efficiency? Biochim. Biophys. Acta Gen. Subj. 2013, 1830, 2770–2778. [CrossRef]
11. Julienne, C.M.; Dumas, J.F.; Goupille, C.; Pinault, M.; Collin, A.; Tesseraud, S.; Couet, C.; Servais, S. Cancercachexia is associated with a decrease in skeletal muscle mitochondrial oxidative capacities without alterationof ATP production efficiency. J. Cachexia Sarcopenia Muscle 2012, 3, 265–275. [CrossRef] [PubMed]
12. Padrão, A.I.; Oliveira, P.; Vitorino, R.; Colaço, B.; Pires, M.J.; Márquez, M.; Castellanos, E.; Neuparth, M.J.;Teixeira, C.; Costa, C.; et al. Bladder cancer-induced skeletal muscle wasting: Disclosing the role ofmitochondria plasticity. Int. J. Biochem. Cell Biol. 2013, 45, 1399–1409. [CrossRef] [PubMed]

Cancers 2019, 11, 1264 14 of 17
13. Antunes, D.; Padrão, A.I.; Maciel, E.; Santinha, D.; Oliveira, P.; Vitorino, R.; Moreira-Gonçalves, D.; Colaço, B.;Pires, M.J.; Nunes, C.; et al. Molecular insights into mitochondrial dysfunction in cancer-related musclewasting. Biochim. Biophys. Acta Mol. Cell Biol. Lipids 2014, 1841, 896–905. [CrossRef] [PubMed]
14. Shum, A.M.Y.; Mahendradatta, T.; Taylor, R.J.; Painter, A.B.; Moore, M.M.; Tsoli, M.; Tan, T.C.; Clarke, S.J.;Robertson, G.R.; Polly, P. Disruption of MEF2C signaling and loss of sarcomeric and mitochondrial integrityin cancer-induced skeletal muscle wasting. Aging 2012, 4, 133–143. [CrossRef] [PubMed]
15. Brown, J.L.; Rosa-Caldwell, M.E.; Lee, D.E.; Blackwell, T.A.; Brown, L.A.; Perry, R.A.; Haynie, W.S.;Hardee, J.P.; Carson, J.A.; Wiggs, M.P.; et al. Mitochondrial degeneration precedes the development ofmuscle atrophy in progression of cancer cachexia in tumour-bearing mice. J. Cachexia Sarcopenia Muscle 2017,8, 926–938. [CrossRef]
16. Carson, J.A.; Hardee, J.P.; VanderVeen, B.N. The emerging role of skeletal muscle oxidative metabolism as abiological target and cellular regulator of cancer-induced muscle wasting. Semin. Cell Dev. Biol. 2016, 54,53–67. [CrossRef] [PubMed]
17. Busquets, S.; Deans, C.; Figueras, M.; Moore-Carrasco, R.; López-Soriano, F.J.; Fearon, K.C.H.; Argilés, J.M.Apoptosis is present in skeletal muscle of cachectic gastro-intestinal cancer patients. Clin. Nutr. 2007, 26,614–618. [CrossRef]
18. Prado, C.M.; Lieffers, J.R.; McCargar, L.J.; Reiman, T.; Sawyer, M.B.; Martin, L.; Baracos, V.E. Prevalence andclinical implications of sarcopenic obesity in patients with solid tumours of the respiratory and gastrointestinaltracts: A population-based study. Lancet Oncol. 2008, 9, 629–635. [CrossRef]
19. Fearon, K.; Strasser, F.; Anker, S.D.; Fainsinger, R.L.; Baracos, V.E.; Md, J.; Loprinzi, C.; Davis, M.; Md, W.;Fearon, K.; et al. Definition and classification of cancer cachexia: An international consensus. Lancet Oncol.2011, 12, 489–495. [CrossRef]
20. Van Dijk, D.P.J.; van de Poll, M.C.G.; Moses, A.G.W.; Preston, T.; Olde Damink, S.W.M.; Rensen, S.S.;Deutz, N.E.P.; Soeters, P.B.; Ross, J.A.; Fearon, K.C.H.; et al. Effects of oral meal feeding on whole bodyprotein breakdown and protein synthesis in cachectic pancreatic cancer patients. J. Cachexia Sarcopenia Muscle2015, 6, 212–221. [CrossRef]
21. Aulino, P.; Berardi, E.; Cardillo, V.M.; Rizzuto, E.; Perniconi, B.; Ramina, C.; Padula, F.; Spugnini, E.P.; Baldi, A.;Faiola, F.; et al. Molecular, cellular and physiological characterization of the cancer cachexia-inducing C26colon carcinoma in mouse. BMC Cancer 2010, 10, 363. [CrossRef] [PubMed]
22. Aversa, Z.; Pin, F.; Lucia, S.; Penna, F.; Verzaro, R.; Fazi, M.; Colasante, G.; Tirone, A.; Fanelli, F.R.;Ramaccini, C.; et al. Autophagy is induced in the skeletal muscle of cachectic cancer patients. Sci. Rep. 2016,6, 30340. [CrossRef] [PubMed]
23. Neel, B.A.; Lin, Y.; Pessin, J.E. Skeletal muscle autophagy: A new metabolic regulator. Trends Endocrinol.Metab. 2013, 24, 635–643. [CrossRef] [PubMed]
24. Tardif, N.; Klaude, M.; Lundell, L.; Thorell, A.; Rooyackers, O. Autophagic-Lysosomal pathway is the mainproteolytic system modified in the skeletal muscle of esophageal cancer patients 1–3. Am. J. Clin. Nutr. 2013,98, 1485–1492. [CrossRef] [PubMed]
25. Tidball, J.G.; Albrecht, D.E.; Lokensgard, B.E.; Spencer, M.J. Apoptosis precedes necrosis ofdystrophin-deficient muscle. J. Cell Sci. 1995, 108 (Pt 6), 2197–2204.
26. Lee, J.C.; Altschul, R. Electron microscopy of the nuclei of denervated skeletal muscle. Z. Zellforsch. Mikrosk.Anat. 1963, 61, 168–182. [CrossRef] [PubMed]
27. Baltgalvis, K.A.; Berger, F.G.; Pena, M.M.O.; Mark Davis, J.; White, J.P.; Carson, J.A. Activity level, apoptosis,and development of cachexia in ApcMin/+ mice. J. Appl. Physiol. 2010, 109, 1155–1161. [CrossRef] [PubMed]
28. Belizário, J.E.; Lorite, M.J.; Tisdale, M.J. Cleavage of caspases-1,-3,-6,-8 and -9 substrates by proteases inskeletal muscles from mice undergoing cancer cachexia. Br. J. Cancer 2001, 84, 1135–1140. [CrossRef]
29. Kinoshita, A.; Onoda, H.; Imai, N.; Iwaku, A.; Oishi, M.; Tanaka, K.; Fushiya, N.; Koike, K.; Nishino, H.;Matsushima, M. The C-Reactive Protein/Albumin Ratio, a Novel Inflammation-Based Prognostic Score,Predicts Outcomes in Patients with Hepatocellular Carcinoma. Ann. Surg. Oncol. 2015, 22, 803–810.[CrossRef] [PubMed]
30. D’Emilio, A.; Biagiotti, L.; Burattini, S.; Battistelli, M.; Canonico, B.; Evangelisti, C.; Ferri, P.; Papa, S.;Martelli, A.M.; Falcieri, E. Morphological and biochemical patterns in skeletal muscle apoptosis. Histol.Histopathol. 2010, 25, 21–32.
31. Tisdale, M.J. Mechanisms of cancer cachexia. Physiol. Rev. 2009, 89, 381–410. [CrossRef] [PubMed]

Cancers 2019, 11, 1264 15 of 17
32. Vanderveen, B.N.; Fix, D.K.; Carson, J.A. Disrupted Skeletal Muscle Mitochondrial Dynamics, Mitophagy,and Biogenesis during Cancer Cachexia: A Role for Inflammation. Oxid. Med. Cell. Longev. 2017, 2017.[CrossRef] [PubMed]
33. Shum, A.M.Y.; Poljak, A.; Bentley, N.L.; Turner, N.; Tan, T.C.; Polly, P. Proteomic profiling of skeletal andcardiac muscle in cancer cachexia: Alterations in sarcomeric and mitochondrial protein expression. Oncotarget2018, 9, 22001–22022. [CrossRef] [PubMed]
34. Chalmers, S.; Saunter, C.D.; Girkin, J.M.; McCarron, J.G. Age decreases mitochondrial motility and increasesmitochondrial size in vascular smooth muscle. J. Physiol. 2016, 594, 4283–4295. [CrossRef] [PubMed]
35. Leduc-Gaudet, J.-P.; Picard, M.; Pelletier, F.S.-J.; Sgarioto, N.; Auger, M.-J.; Vallée, J.; Robitaille, R.;St-Pierre, D.H.; Gouspillou, G. Mitochondrial morphology is altered in atrophied skeletal muscle ofaged mice. Oncotarget 2015, 6, 17923–17937. [CrossRef] [PubMed]
36. Marzetti, E.; Lees, H.A.; Manini, T.M.; Buford, T.W.; Aranda, J.M.; Calvani, R.; Capuani, G.; Marsiske, M.;Lott, D.J.; Vandenborne, K.; et al. Skeletal muscle apoptotic signaling predicts thigh muscle volume and gaitspeed in community-dwelling older persons: An exploratory study. PLoS ONE 2012, 7, e32829. [CrossRef][PubMed]
37. Puente-Maestu, L.; Pérez-Parra, J.; Godoy, R.; Moreno, N.; Tejedor, A.; Torres, A.; Lázaro, A.; Ferreira, A.;Agustí, A. Abnormal transition pore kinetics and cytochrome C release in muscle mitochondria of patientswith chronic obstructive pulmonary disease. Am. J. Respir. Cell Mol. Biol. 2009, 47. [CrossRef] [PubMed]
38. Halestrap, A.P.; Clarke, S.J.; Javadov, S.A. Mitochondrial permeability transition pore opening duringmyocardial reperfusion—A target for cardioprotection. Cardiovasc. Res. 2004, 61, 372–385. [CrossRef]
39. Iqbal, S.; Hood, D.A. The role of mitochondrial fusion and fission in skeletal muscle function and dysfunction.Front. Biosci. 2015, 20, 157–172.
40. Vitorino, R.; Moreira-Gonçalves, D.; Ferreira, R. Mitochondrial plasticity in cancer-related muscle wasting:Potential approaches for its management. Curr. Opin. Clin. Nutr. Metab. Care 2015, 18, 226–233. [CrossRef][PubMed]
41. Gomes, L.C.; Scorrano, L. High levels of Fis1, a pro-fission mitochondrial protein, trigger autophagy. Biochim.Biophys. Acta Bioenerg. 2008, 1777, 860–866. [CrossRef] [PubMed]
42. Ji, W.K.; Hatch, A.L.; Merrill, R.A.; Strack, S.; Higgs, H.N. Actin filaments target the oligomeric maturation ofthe dynamin GTPase Drp1 to mitochondrial fission sites. Elife 2015, 4, e11553. [CrossRef] [PubMed]
43. Van der Ende, M.; Grefte, S.; Plas, R.; Meijerink, J.; Witkamp, R.F.; Keijer, J.; van Norren, K. Mitochondrialdynamics in cancer-induced cachexia. Biochim. Biophys. Acta Rev. Cancer 2018, 1870, 137–150. [CrossRef][PubMed]
44. White, J.P.; Puppa, M.J.; Sato, S.; Gao, S.; Price, R.L.; Baynes, J.W.; Kostek, M.C.; Matesic, L.E.; Carson, J.A.IL-6 regulation on skeletal muscle mitochondrial remodeling during cancer cachexia in the ApcMin/+mouse.Skelet. Muscle 2012, 2. [CrossRef] [PubMed]
45. Khan, M.M.; Strack, S.; Wild, F.; Hanashima, A.; Gasch, A.; Brohm, K.; Reischl, M.; Carnio, S.; Labeit, D.;Sandri, M.; et al. Role of autophagy, SQSTM1, SH3GLB1, and TRIM63 in the turnover of nicotinic acetylcholinereceptors. Autophagy 2014, 10, 123–136. [CrossRef] [PubMed]
46. Talbert, E.E.; Metzger, G.A.; He, W.A.; Guttridge, D.C. Modeling human cancer cachexia in colon 26tumor-bearing adult mice. J. Cachexia. Sarcopenia Muscle 2014, 5, 321–328. [CrossRef] [PubMed]
47. Pettersen, K.; Andersen, S.; Degen, S.; Tadini, V.; Grosjean, J.; Hatakeyama, S.; Tesfahun, A.N.; Moestue, S.;Kim, J.; Nonstad, U.; et al. Cancer cachexia associates with a systemic autophagy-inducing activity mimickedby cancer cell-derived IL-6 trans-signaling. Sci. Rep. 2017, 7, 2046. [CrossRef]
48. Pigna, E.; Berardi, E.; Aulino, P.; Rizzuto, E.; Zampieri, S.; Carraro, U.; Kern, H.; Merigliano, S.; Gruppo, M.;Mericskay, M.; et al. Aerobic Exercise and Pharmacological Treatments Counteract Cachexia by ModulatingAutophagy in Colon Cancer. Sci. Rep. 2016, 6, 26991. [CrossRef]
49. Penna, F.; Costamagna, D.; Pin, F.; Camperi, A.; Fanzani, A.; Chiarpotto, E.M.; Cavallini, G.; Bonelli, G.;Baccino, F.M.; Costelli, P. Autophagic degradation contributes to muscle wasting in cancer cachexia. Am. J.Pathol. 2013, 182, 1367–1378. [CrossRef]
50. Masiero, E.; Agatea, L.; Mammucari, C.; Blaauw, B.; Loro, E.; Komatsu, M.; Metzger, D.; Reggiani, C.;Schiaffino, S.; Sandri, M. Autophagy Is Required to Maintain Muscle Mass. Cell Metab. 2009, 10, 507–515.[CrossRef]

Cancers 2019, 11, 1264 16 of 17
51. Op Den Kamp, C.M.; Langen, R.C.; Snepvangers, F.J.; De Theije, C.C.; Schellekens, J.M.; Laugs, F.;Dingemans, A.M.C.; Schols, A.M. Nuclear transcription factor κB activation and protein turnover adaptationsin skeletal muscle of patients with progressive stages of lung cancer cachexia. Am. J. Clin. Nutr. 2013, 98,738–748. [CrossRef] [PubMed]
52. Kim, I.; Rodriguez-Enriquez, S.; Lemasters, J.J. Selective degradation of mitochondria by mitophagy. Arch.Biochem. Biophys. 2007, 462, 245–253. [CrossRef] [PubMed]
53. Clay Montier, L.L.; Deng, J.J.; Bai, Y. Number matters: Control of mammalian mitochondrial DNA copynumber. J. Genet. Genomics 2009, 36, 125–131. [CrossRef]
54. Rodriguez-Enriquez, S.; Kim, I.; Currin, R.T.; Lemasters, J.J. Tracker dyes to probe mitochondrial autophagy(mitophagy) in rat hepatocytes. Autophagy 2006, 2, 39–46. [CrossRef] [PubMed]
55. Zou, H.; Li, Y.; Liu, X.; Wang, X. An APAf-1 cytochrome C multimeric complex is a functional apoptosomethat activates procaspase-9. J. Biol. Chem. 1999, 274, 11549–11556. [CrossRef] [PubMed]
56. Lee, Y. Roles of the Mammalian Mitochondrial Fission and Fusion Mediators Fis1, Drp1, and Opa1 inApoptosis. Mol. Biol. Cell 2004, 15, 5001–5011. [CrossRef] [PubMed]
57. Twig, G.; Elorza, A.; Molina, A.J.A.; Mohamed, H.; Wikstrom, J.D.; Walzer, G.; Stiles, L.; Haigh, S.E.; Katz, S.;Las, G.; et al. Fission and selective fusion govern mitochondrial segregation and elimination by autophagy.EMBO J. 2008, 27, 433–446. [CrossRef] [PubMed]
58. Mignotte, B.; Vayssiere, J.L. Mitochondrial control of apoptosis. Adv. Cell Aging Gerontol. 2001, 9, 212–219.59. Mignotte, B.; Vayssiere, J.L. Mitochondria and apoptosis. Eur. J. Biochem. 1998, 252, 1–15. [CrossRef]
[PubMed]60. Slee, E.A.; Harte, M.T.; Kluck, R.M.; Wolf, B.B.; Casiano, C.A.; Newmeyer, D.D.; Wang, H.G.; Reed, J.C.;
Nicholson, D.W.; Alnemri, E.S.; et al. Ordering the cytochrome c-initiated caspase cascade: Hierarchicalactivation of caspases-2, -3, -6, -7, -8, and -10 in a caspase-9-dependent manner. J. Cell Biol. 1999, 144, 281–292.[CrossRef] [PubMed]
61. Figueras, M.; Busquets, S.; Carbó, N.; Barreiro, E.; Almendro, V.; Argilés, J.M.; López-Soriano, F.J.Interleukin-15 is able to suppress the increased DNA fragmentation associated with muscle wastingin tumour-bearing rats. FEBS Lett. 2004, 569, 201–206. [CrossRef] [PubMed]
62. Molinari, F.; Pin, F.; Gorini, S.; Chiandotto, S.; Pontecorvo, L.; Penna, F.; Rizzuto, E.; Pisu, S.; Musarò, A.;Costelli, P.; et al. The mitochondrial metabolic reprogramming agent trimetazidine as an ‘exercise mimetic’in cachectic C26-bearing mice. J. Cachexia Sarcopenia Muscle 2017, 8, 954–973. [CrossRef] [PubMed]
63. Salazar-Degracia, A.; Busquets, S.; Argilés, J.M.; Bargalló-Gispert, N.; López-Soriano, F.J.; Barreiro, E. Effectsof the beta2agonist formoterol on atrophy signaling, autophagy, and muscle phenotype in respiratory andlimb muscles of rats with cancer-induced cachexia. Biochimie 2018, 149, 79–91. [CrossRef] [PubMed]
64. Salazar-Degracia, A.; Blanco, D.; Vilà-Ubach, M.; de Biurrun, G.; de Solórzano, C.O.; Montuenga, L.M.;Barreiro, E. Phenotypic and metabolic features of mouse diaphragm and gastrocnemius muscles in chroniclung carcinogenesis: Influence of underlying emphysema. J. Transl. Med. 2016, 14, 244. [CrossRef] [PubMed]
65. Mariño, G.; Niso-Santano, M.; Baehrecke, E.H.; Kroemer, G. Self-consumption: The interplay of autophagyand apoptosis. Nat. Rev. Mol. Cell Biol. 2014, 15, 81–94. [CrossRef] [PubMed]
66. Morselli, E.; Shen, S.; Ruckenstuhl, C.; Bauer, M.A.; Mariño, G.; Galluzzi, L.; Criollo, A.; Michaud, M.;Maiuri, M.C.; Chano, T.; et al. p53 inhibits autophagy by interacting with the human ortholog of yeast Atg17,RB1CC1/FIP200. Cell Cycle 2011, 10, 2763–2769. [CrossRef] [PubMed]
67. Vaseva, A.V.; Marchenko, N.D.; Ji, K.; Tsirka, S.E.; Holzmann, S.; Moll, U.M. P53 opens the mitochondrialpermeability transition pore to trigger necrosis. Cell 2012, 149, 1536–1548. [CrossRef] [PubMed]
68. Lundby, C.; Jacobs, R.A. Adaptations of skeletal muscle mitochondria to exercise training. Exp. Physiol. 2016,101, 17–22. [CrossRef]
69. Ballarò, R.; Beltrà, M.; De Lucia, S.; Pin, F.; Ranjbar, K.; Hulmi, J.J.; Costelli, P.; Penna, F. Moderate exercise inmice improves cancer plus chemotherapy-induced muscle wasting and mitochondrial alterations. FASEB J.2019, 33, 5482–5494. [CrossRef]
70. Lira, F.S.; Neto, J.C.R.; Seelaender, M. Exercise training as treatment in cancer cachexia. Appl. Physiol. Nutr.Metab. Physiol. Appl. Nutr. Métab. 2014, 39, 679–686. [CrossRef]
71. Spence, R.R.; Heesch, K.C.; Brown, W.J. Exercise and cancer rehabilitation: A systematic review. Cancer Treat.Rev. 2010, 36, 185–194. [CrossRef] [PubMed]

Cancers 2019, 11, 1264 17 of 17
72. Moon, J.-H.; Kong, M.-H.; Kim, H.-J. Relationship between low muscle mass and anemia in Korean elderlymen: Using the Korea National Health and Nutrition Examination Survey (KNHANES IV–V). J. Clin.Gerontol. Geriatr. 2015, 6, 115–119. [CrossRef]
73. Cesari, M.; Penninx, B.W.J.H.; Lauretani, F.; Russo, C.R.; Carter, C.; Bandinelli, S.; Atkinson, H.; Onder, G.;Pahor, M.; Ferrucci, L. Hemoglobin levels and skeletal muscle: Results from the InCHIANTI study. J. Gerontol.A Biol. Sci. Med. Sci. 2004, 59, 249–254. [CrossRef] [PubMed]
74. Walter, P.B.; Knutson, M.D.; Paler-Martinez, A.; Lee, S.; Xu, Y.; Viteri, F.E.; Ames, B.N. Iron deficiency andiron excess damage mitochondria and mitochondrial DNA in rats. Proc. Natl. Acad. Sci. USA 2002, 99,2264–2269. [CrossRef] [PubMed]
75. Norman, K.; Stobäus, N.; Reiß, J.; Schulzke, J.; Valentini, L.; Pirlich, M. Effect of sexual dimorphism on musclestrength in cachexia. J. Cachexia Sarcopenia Muscle 2012, 3, 111–116. [CrossRef] [PubMed]
76. Baracos, V.E.; Reiman, T.; Mourtzakis, M.; Gioulbasanis, I.; Antoun, S. Body composition in patients withnon−small cell lung cancer: A contemporary view of cancer cachexia with the use of computed tomographyimage analysis. Am. J. Clin. Nutr. 2010, 91, 1133S–1137S. [CrossRef] [PubMed]
77. McMillan, D.C. Systemic inflammation, nutritional status and survival in patients with cancer. Curr. Opin.Clin. Nutr. Metab. Care 2009, 12, 223–226. [CrossRef] [PubMed]
78. Blazeby, J.M.; Conroy, T.; Bottomley, A.; Vickery, C.; Arraras, J.; Sezer, O.; Moore, J.; Koller, M.; Turhal, N.S.;Stuart, R.; et al. Clinical and psychometric validation of a questionnaire module, the EORTC QLQ-STO 22, toassess quality of life in patients with gastric cancer. Eur. J. Cancer 2004, 40, 2260–2268. [CrossRef] [PubMed]
79. Argilés, J.M.; López-Soriano, F.J.; Toledo, M.; Betancourt, A.; Serpe, R.; Busquets, S. The cachexia score(CASCO): A new tool for staging cachectic cancer patients. J. Cachexia Sarcopenia Muscle 2011, 2, 87–93.[CrossRef]
80. Arezzo di Trifiletti, A.; Misino, P.; Giannantoni, P.; Giannantoni, B.; Cascino, A.; Fazi, L.; Rossi Fanelli, F.;Laviano, A. Comparison of the performance of four different tools in diagnosing disease-associated anorexiaand their relationship with nutritional, functional and clinical outcome measures in hospitalized patients.Clin. Nutr. 2013, 32, 527–532. [CrossRef]
81. Rooney, J.P.; Ryde, I.T.; Sanders, L.H.; Howlett, E.H.; Colton, M.D.; Germ, K.E.; Mayer, G.D.; Greenamyre, J.T.;Meyer, J.N. PCR based determination of mitochondrial DNA copy number in multiple species. In MitochondrialRegulation: Methods and Protocols; Springer: New York, NY, USA, 2014; ISBN 9781493918751.
© 2019 by the authors. Licensee MDPI, Basel, Switzerland. This article is an open accessarticle distributed under the terms and conditions of the Creative Commons Attribution(CC BY) license (http://creativecommons.org/licenses/by/4.0/).